Embed Size (px)
Citation preview

Page 1 of 22
Crisis moderates the expansion of Israeli multinationals
Report dated September 20, 2010
EMBARGO: The contents of this report must not be quoted or summarized in the print, broadcast or electronic media before September 20, 2010, 10:00 a.m. Israel; 7 a.m. GMT and 3:00 a.m. United States EST.
Jerusalem and New York, September 20, 2010
The fourth annual survey of Israeli multinationals is being released today. It was conducted by a joint team composed of the Foreign Trade Division of the Manufacturers Association of Israel; The Recanati School of Business, Tel Aviv University; the School of Business Administration, the Hebrew University of Jerusalem; and the Vale Columbia Center on Sustainable International Investment (VCC), a joint undertaking of the Columbia Law School and The Earth Institute at Columbia University in New York.1 The survey is part of a long-term, multi-country study of the rapid global expansion of multinationals from emerging markets. The results released today cover the year 2009.
Highlights In 2009, Israel's top 21 multinationals – ranked by their foreign assets – had over USD 15 billion in foreign assets (table 1), about USD 30 billion in foreign sales (including exports), and around 72,000 persons in employment abroad (annex table 1). Four firms − Israel Corporation, Elco Holdings, Teva, and Ormat − together accounted for three quarters of the total foreign assets of the top 21.
The top 21 firms had 630 foreign affiliates. Just under half were in Europe, followed by North America and then Asia (annex table 2 and annex figure 2). Their presence in Africa is minimal. Twenty out of 21 firms were listed on one or more stock exchanges, including foreign stock exchanges (annex table 3). A significant number of firms were to be found in knowledge-based industries such as IT services, electronic hardware, pharmaceuticals and satellite networks. Annex figure 1 provides a breakdown of the foreign assets of the top 21 by industry.) All but one of the top 21 firms have their head office in Israel (annex figure 3). The global financial and economic crisis, which had no noticeable effects in 2008, clearly did have an impact in 2009. Foreign assets remained unchanged, while foreign sales and employment declined perceptibly. The previous year’s (2008) growth in sales and employment abroad, however, was large enough to show a significant net gain over the three-year period 2007-2009 (table 2 in the main text).
1 The survey was carried out under the direction of Seev Hirsch of Tel Aviv University and Niron Hashai of Hebrew
University. Research assistance was provided by Guy Ben Shachar of Hebrew University.

Page 2 of 22
Profile of the top 21 An earlier draft of this report included 25 companies, the same number as in our last report, published March 2010, which covered the year 2008. Several firms were excluded in the light of the criteria used for establishing the nationality of the firms. One firm, Osem, was dropped because it is now majority-owned by the Swiss firm Nestlé. Amdocs, Zoran and Alliance, three other firms included in the last report, were excluded because their head office and the individuals or groups that effectively control their strategic decision-making are located outside Israel. One firm, Ormat, which has its head office abroad (in the United States), was retained in the list, as the company's top management is located in Israel and it does not have a controlling voting share held abroad. The composition of the list was further changed to take account of other new developments or new information. Hod-Assaf was excluded because of the low level of its foreign assets; Carmel Olefins was excluded in order to avoid double counting, due to its acquisition by Oil Refineries Ltd., which is in turn a wholly owned subsidiary of the Israel Corporation. Tower, a producer of semiconductors, with substantial international operations since last year, was added. The distribution of companies on the list, by the value of their foreign assets, is highly skewed. The largest, the Israel Corporation, is a conglomerate that owns several major multinational enterprises, including Israel Chemicals, discussed at length in previous reports, and Zim Integrated Shipping Services. With foreign assets of USD 4.5 billion, the Israel Corporation accounts for nearly 30% the total. Teva, Israel's leading pharmaceuticals manufacturer, ranks second and Elco Holdings, another conglomerate, ranks third. The foreign assets of each account for about 17% of the total. The only other multinational with foreign assets exceeding USD 1 billion is Ormat, which designs, constructs and operates ’green’ power generating plants, which use its proprietary technology. The foreign assets of only seven out of the 21 companies exceed USD 500 million and, in thirteen cases, they exceed USD 100 million. At the other end of the scale, there are seven firms whose foreign assets are less than USD 50 million. The smallest multinationals in the list are Orbotech, a producer of electronic optical equipment, and Ness Technologies, a provider of IT services and solutions, both with foreign assets of USD 15 million each.

Page 3 of 22
Table 1. Ranking of the top 21a Israeli multinationals, 2009 (USD million)
Rank Company Main industry Status (% of
state holdings)
Foreign assets
1 Israel Corporation
Conglomerate Listed (0%) 4,500
2 Teva Pharmaceuticals Listed (0%) 2,682
3 Elco Holdings Conglomerate Listed (0%) 2,675
4 Ormat Power stations Listed (0%) 1,577
5 Checkpoint IT services Listed (0%) 758
6 IDB Holdings Conglomerate Listed (0%) 744
7 Nice IT services Listed (0%) 578
8 Strauss Group Food products Listed (0%) 426
9 Frutarom Food products Listed (0%) 420
10 Elbit IT services Listed (0%) 254
11 Avgol Unwoven fabric Listed (0%) 201
12 Tower Electronic hardware - electronic & optical equipment
Listed (0%) 167
13 Delta Galil Wearing apparel Listed (0%) 115
14 Palram Plastic products Listed (0%) 58
15 Retalix IT services Listed (0%) 48
16 Plasson Plastic products Listed (0%) 47
17 Lumenis Electronic hardware - laser technologies
Unlisted (0%)
42
18 Gilat Satellite Networks
Electronic hardware - satellites Listed (0%) 25
19 AudioCodes IT services Listed (0%) 23
20 Orbotech Electronic hardware - electronic & optical equipment
Listed (0%) 15
21 Ness Technologies
IT services Listed (0%) 15
Total 15,370
Source: Israeli-Vale Columbia Center survey of Israeli multinationals.
a Although we speak of the ‘top 21’, an important clarification is in order. All but one of the leading 21 Israeli
multinationals identified in table 1 are publicly listed firms. A number of other (mainly unlisted) multinationals, very likely to belong to this group, could not be included because information on their activities was incomplete. So the top 21 in our list are among the largest Israeli multinationals rather than the largest.
The industrial composition of Israel's top multinationals reflects the country’s resource endowment, which gives it a comparative advantage in knowledge-based industries. Industries with relatively high investments in R&D – e.g., laser technology, power stations, IT services and pharmaceuticals − represent more than half of the top 21 multinationals listed in table 1. Traditional industries such as clothing and food products account for a small share of Israel's multinationals. Only Israel Chemicals, a part of the conglomerate Israel Corporation, manufactures natural-resource-based products. As in previous years, IT service providers and electronic hardware producers continue to dominate the list of Israel's multinationals, in term of numbers. Note, however, that these firms are not among the largest in terms of foreign assets.

Page 4 of 22
Checkpoint, a supplier of security systems, and Nice, which produces CRM solutions, are the only IT firms whose foreign assets exceed USD 500 million. This year's list of multinational enterprises contains two food companies. The Strauss Group is a major producer of milk products, coffee and a large variety of other consumer food products. Frutarom, the second food products firm, is a producer of aromas and food additives.
Box 1. Changes in the valuation of foreign assets
In our last report, published March 31, 2010,
a we reported the foreign assets of the top Israeli
multinationals for 2008 as being just over USD 18 billion. In table 1, on the other hand, we give them as just over USD 15 billion. There are several reasons for the seeming discrepancy. First, as noted earlier, the composition of our list has changed somewhat and the number of firms has been reduced from 25 to 21.Second, and more important, our figures for foreign assets come from company reports (or information otherwise supplied by companies) and several of our companies have changed their accounting methods. Table 2 below, which contains figures pertaining to 2007, 2008 and 2009, compares the same set of companies in the three years and employs the more recent evaluation methods. As a result, our information from companies that changed their accounting methods not only gives us their foreign assets at the end of 2009 on the basis of this new method, it also restates foreign assets at the end of 2007 and 2008. The new method excludes short-term assets, such as bank deposits, accounts receivable and inventories from reported foreign assets. It also excludes goodwill, which may have boosted assets in boom periods, when acquisitions took place at high prices. This more conservative accounting method naturally reduces the reported value of the firms'assets. An example is furnished by Ness Technologies, an IT services and solutions provider whose foreign assets were reported as being USD 224 million in the last report. The exclusion of goodwill and other short-term assets led to Ness Technologies slipping to the bottom of the list, with foreign assets of USD 15 million. In conclusion, there are two points to be made. The first is that, as stated above, our figures in this report come straight from the companies we have ranked and the companies that have adopted the new, more conservative, accounting method have furnished new figures for 2008 as well as 2009. The second point is a caution: readers need to treat all foreign asset figures with caution, since individual firms have considerable leeway in choosing the criteria for reporting on their international activities. This said, we might add that the new method does have the advantage of reflecting more closely the long-range foreign commitment of Israeli multinationals.
a Available at http://www.vcc.columbia.edu/files/vale/documents/Israel-Report-March2010.pdf.
The inclusion of IDB Holdings in this year's report illustrates further the problematic nature of comprehending the multinational activities of conglomerates. IDB Holdings is a majority shareholder of Makhteshim-Agan, a supplier of crop protection solutions with substantial operations in Latin America and elsewhere. Makhteshim-Agan was reported on separately in previous reports. To avoid double counting, it was excluded from the present report. IDB Holdings's other activities are mainly in retail food distribution, telecommunications, insurance, aviation and real estate. The cross-border activities of some of these businesses are relatively marginal. Hence, the inclusion of IDB Holdings with global assets of USD 6,800 million, global sales of

Page 5 of 22
nearly USD 9,000 million, and 28,000 employees, adds relatively little to our knowledge of Israel's multinational sector. None of the firms in table 1 is either state-owned or state-controlled. All but one, Lumenis, are listed on various stock exchanges. Eighteen are listed on the Tel Aviv Stock Exchange (TASE), one on the New York Stock Exchange (NYSE) ten on the American Stock Exchange (NASDAQ), and nine on both NASDAQ and TASE (annex table 3). This pattern is consistent with the observation that while management control of the firms included in this report resides in Israel, ownership may be globally dispersed. Several of the firms raise at least part of their equity capital in the global markets, where the cost of capital is lower than in the small market of Tel Aviv. Moreover, it confirms the view that domestic investment and outward FDI do not necessarily compete for the same pool of capital. The fact that almost all firms included in table 1 are listed on different stock exchanges does not mean that Israel's multinational enterprises necessarily seek to go public. In fact, some of the largest and most dynamic Israeli multinationals are unlisted. Their absence from the report is due to their failure to divulge information about their foreign and domestic operations. Other multinationals, including some discussed in earlier reports (e.g., Alliance), were sold to foreign investors or incorporated into the accounts of conglomerates (e.g., Carmel Olefins). Table 1 cannot therefore be said to offer a comprehensive picture of the scope of the Israeli corporate sector's multinational activity. Examples of leading Israeli multinationals that might have shown up on table 1 had data been available are Keter Plastics, Blades Technologies and Netafim. Keter supplies plastics furniture and storage systems. Blades Technologies is a major producer of precision forged and machined blades and vanes for aerospace and industrial gas turbine industries. Netafim designs, installs, maintains and in some cases manages complex drip irrigation systems. It is jointly owned by a number of communal settlements (kibbutzim). All three enterprises have substantial international operations including R&D, production, distribution and servicing, located in a large number of countries. Changes between 2007 and 2009 Changes in the international operations of the 21 leading multinational enterprises between 2007 and 2009 are summarized in table 2. As noted earlier, the figures pertain to the same firms in 2007, 2008 and 2009. The period covered by these three years coincides with the global economic crisis, which could not fail to affect Israeli firms heavily involved in the United States and Europe, where the crisis was most acute. Certain elements of the effects of the crisis are clearly visible in table 2 below.
The table shows aggregate changes in the assets, sales and employment of the 21 Israeli multinationals, distinguishing between foreign and total operations. The global crisis, although in full force in 2008, was not reflected in the figures for that year. Both foreign and total assests, sales and employment increased between 2007 and 2008. The foreign sector led the increase in each of these elements. The relative increase in total and foreign sales outpaced the increase in employment and assets. Note, moreover, that the number of foreign employees increased by about 11,000, a relative increase of over 16% in a single year.

Page 6 of 22
Table 2. Snapshot of the top 21 multinationals, 2007 -2009 (USD million and numbers of employees)
Year Percentage change over
period
2,007 2,008 2,009 2007-8 2008-9 2007-9
Assets
Foreign 13,670 15,477 15,370 13.22 -0.69 12.45
Total 26,929 29,358 27,469 9.02 -6.43 2.00
% Foreign 50.76 52.72 55.95 1.96 3.23 5.19
Sales
Foreign 26,292 34,184 30,426 30.01 -10.96 15.76
Total 39,016 49,717 47,134 27.43 -5.22 20.78
% Foreign 67.39 68.76 64.55 1.37 -4.17 -2.80
Employment
Foreign 68,415 79,476 72,027 16.17 -9.37 5.28
Total 133,581 145,261 143,590 8.74 -1.15 7.49
% Foreign 51.22 54.71 50.16 3.49 -4.55 -1.06
TNI (weighted) 56.46 58.73 56.75 2.27 -1.98 0.29
Source: Israeli-Vale Columbia Center survey of Israeli multinationals.
The positive trend described above was reversed in the following year, with declines across the board in both the foreign and the total category. The sharpest decline over 2008-2009 was in foreign sales (nearly 11%), followed by foreign employment (somewhat under 10%). In comparison, the declines in total sales and employment were modest to negligible (just over 5% and just over 1%), pointing to near 8% and 9% gains in domestic sales and domestic employment respectively. When it comes to assets, matters were different. Foreign assets fell hardly at all (well under 1%), while total assets fell by well over 6%. In this case, the substantial gain in 2009 in domestic sales and employment was counterbalanced by a substantial (almost 13%) decline in domestic assets. The last column in table 2 provides a view of the overall effects of the crisis over the three-year period. On the whole, the increases in the activities of Israeli multinationals in 2008 were much larger than the declines experienced in 2009. Consequently, comparisons of 2009 with 2007 show a rise in foreign and total assets, sales and employment. The increase in total and foreign sales dominates the increase in the other components. The share of foreign in total assets increased over the 2007-2009 period from 51% in 2007 to 56% in 2009, while the shares of foreign sales and employment in total sales and employment declined perceptibly over the period. One way of summarizing the discussion about the changes in the foreign and total components of the activities pursued by the 21 leading Israeli multinationals during the 2007-2009 period is to examine the trends in their Transnationality Index (TNI). The Index is a useful tool for gauging the relative importance of cross-border operations in the activities of multinationals. It is computed as a simple average of three ratios: foreign to total assets, foreign to total employment and foreign to total sales, and expressed as a percentage. The theoretical value of the index can vary between O (no foreign activities) and 1 (only foreign activities).

Page 7 of 22
The bottom row of table 2 shows what we have called the weighted TNI (‘weighted’ because the large companies weigh more than small ones in it), which is calculated in two steps. First, the foreign and total values of assets, sales and employment of the 21 firms are summmed. Next, the weighted Index is derived by calculating the average ratio of foreign to total assets, sales and employment. Note that the TNI rose from 2007 to 2008 and declined in 2009. Over the three-year period 2007-2009, however, the TNI remained virtually unchanged, rising marginally from 56.46 to 56.75. Considered as a group, the leading Israeli multinationals kept up their international activities even over the crisis period of 2007-2009.
The 2009 Transnationality Index and its components Details of the Transnationality Index of the individual firms and its components are shown in table 3. The firms are ranked by their TNI, which varies between 85 (Orbotec) and 12 (IDB Holdings). The simple average of the Index is 64, perceptibly higher than the weighted average of 58. The difference indicates the tendency of small firms to engage in internationalization more intensively than large firms. The median TNI is 67. Checkpoint is the median company. With a TNI of 12, IDB Holdings ranks lowest, being the only company with a TNI lower than 40. Table 3. The Transnationality Index and its components, 2009
Rank by TNI
Company Percentage of foreign in total
TNI Assets Sales Employment
1 Ormat 98 100 57 85
2 Teva 71 96 82 83
3 Frutarom 80 91 78 83
4 Delta 77 87 81 81
5 Avgol 81 95 62 79
6 Palram 75 91 55 74
7 Nice 86 74 58 73
8 Lumenis 70 80 68 73
9 Retalix 73 89 51 71
10 Orbotec 52 99 62 71
11 Checkpoint 86 56 59 67
12 AudioCodes 52 92 34 59
13 Ness Technologies 40 68 68 59
14 Plasson 44 90 40 58
15 Israel Corporation 72 62 38 57
16 Gilat Satellite Networks
25 84 61 57
17 Tower 35 97 37 56
18 Strauss Group 53 47 59 53
19 Elco Holdings 71 35 36 47
20 Elbit 25 86 16 42
21 IDB Holdings 11 10 14 12
Average, unweighted 61 78 53 64
Average, weighted 56 65 50 58
Median 71 87 58 67
Top firm Ormat Ormat Teva Ormat
Bottom firm IDB Holdings IDB Holdings IDB Holdings IDB Holdings
Median firm Teva & Elco Delta Nice Checkpoint

Page 8 of 22
Source: Israeli-Vale Columbia Center survey of Israeli multinationals.
Foreign assets account on average for 61% of total assets. Ormat is the leader in terms of the share of foreign in total assets (98%). It is followed by Checkpoint and Nice with a foreign asset share of 86%. Teva and Elco are the median companies (71%). The foreign assets of only four firms are less than 40% of total assets. IDB Holdings has the lowest share of foreign assets (11%). The percentage of foreign sales varies between 100 (Ormat) and 10 (IDB Holdings). The average is 78%. With a foreign sales percentage of 87, Delta is the median company. Only seven firms have a foreign sales percentage of less than 80. Since foreign sales include exports from the home country, it is hardly surprising that the percentage of their total sales should be higher on average than the percentages of their foreign employment and foreign assets. These differences suggest that ’market-seeking’ may be the major motivator of internationalization by Israeli multinationals. The percentage of foreign employment is 53 on average; it ranges between 82 (Teva) and 14 (IDB Holdings). With 58% foreign employment, Nice is the median company. Foreign employment in fourteen companies exceeds 50%, though only two, Teva and Delta, have more than 80% of their employees abroad. IDB Holdings consistently occupies the lowest rank in all the different components of the Transnationalization Index. This is hardly surprising in view of the fact that IDB is a conglomerate with very substantial operations in retailing, communication, finance, and real estate. Its international operations, though large by Israeli standards, account for only a small proportion of its overall business operations. Examination of the companies occupying the top ranks shows that Ormat, which ranks 1st in the share of foreign assets and sales, ranks only 12th in employment. Teva, which ranks 1st in foreign employment, ranks 4th in foreign sales and 10th in foreign assets. In fact, the correlations between the components of the index are not high; they range between 0.29 (foreign assets and sales) through 0.42(foreign employment and sales) to 0.55 (foreign assets and employment). It seems that attempts to represent the elusive concept of transnationality by a single measure such as the ratio of foreign to total assets, sales or employment are likely to lead to biased conclusions. Regional distribution The top 21 multinationals reported 630 foreign affiliates in 2009 (annex table 2), which implies an average of 30 affiliates per firm compared with 23 in last year's report. This increase in the number of affiliates by 30% in a single year is explained in part by the change in the composition of the firms included in the report. For example, a number of firms in the last report that had very few affiliates − Alliance, Carmel Olefins, Hod-Assaf − have disappeared from the present report. (Makhteshim Agan has also disappeared but this has made no real difference, as its 75 foreign affiliates now show up among the 80 affiliates of its parent, IDB Holdings, included among the top Israeli multinationals for the first time.) The big change is that the top-ranking firm, Israel Corporation (IC), has increased its number of affiliates by over 80% − from 102 affiliates in 2008 to 184 in 2009! This increase is accounted for mainly by the new initiatives taken by IC in the energy sector. For example, Better Place, a multinational in which IC has a substantial stake, has been engaged in the development of a novel transport system, based on cars powered by electric batteries. Operating the system requires the building of battery switch stations. By the end of 2009, Better Place had built dozens of switch stations,

Page 9 of 22
which it counts as affiliates, in Australia, Canada, Denmark, Japan and the United States, as well as in Israel. The regional distribution of the affiliates was largely unchanged. There was a 3% decline in the percentage of European affiliates and a 1% increase in the percentage of Latin American and African affiliates, the latter from a very small base (annex table 6). Selected mergers, acquisitions and greenfield investments Annex tables 4 and 5 list the largest individual FDI transactions by Israel-based multinationals between 2007 and 2009. Annex table 4 contains figures on the top 10 outward mergers and acquisitions (M&As). The list is headed by the acquisition, in July 2008, of the US-based Barr Pharmaceuticals by Teva, Israel's leading pharmaceutical company. The price paid for Barr, which exceeded USD 8.8 billion, accounted for more than 75% of the total M&A value reported in the table. Teva spent an additional USD 400 million on the acquisition of CoGenseys and USD 335 million on the acquisition of Bentley Pharmaceuticals, two other US-based pharmaceuticals companies. These acquisitions explain why Teva is considered Israel's leading multinational. The acquisition by Nice of the US firm Actimize and by Israel Chemicals of the US firm Supersta are the only other transactions by firms listed in table 1. The remaining acquisitions were made by smaller firms, engaged in real estate, energy and high technology. The effects of the recent economic crisis are clearly demonstrated in annex table 4 which records only a single transaction in 2009.
The top ten greenfield investments between 2007 and 2009 are shown in annex table 5, which exhibits a very different orientation from that of the M&A transactions shown in annex table 4. The transactions are overwhelmingly in real estate operations, in the emerging markets of Eastern Europe. The only transactions in activities other than real estate are the Israel Corporation's automotive OEM investment in China and EIG Renewable's renewable energy investment in Macedonia. Once again, there is only one transaction among the top 10 that took place in 2009. The big picture
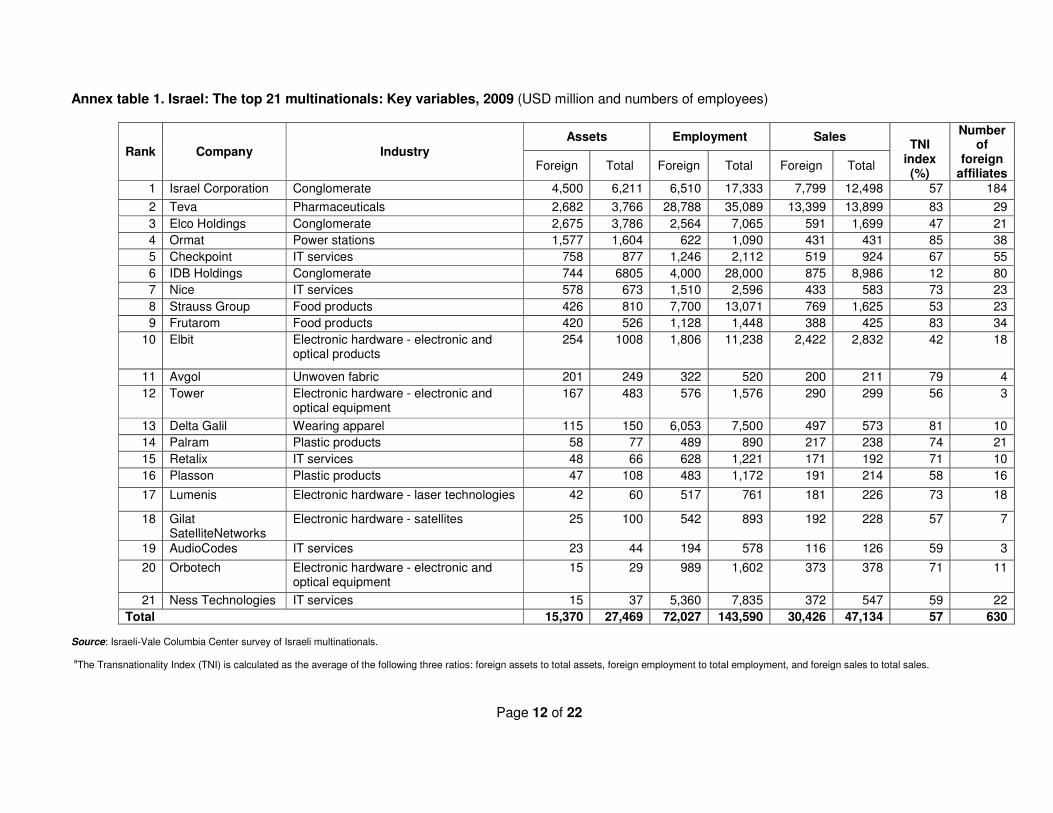
The macro figures for the Israeli economy (table 4 below) exhibit a trend broadly in keeping with that of multinational activity, as shown in table 2. GDP, exports, and FDI inflows rose between 2007 and 2008 and declined in the following year. FDI outflows showed a declining trend over the entire period. FDI outward stock rose by very little in 2009. (See annex figures 4 and 5 for FDI flows and stock over the twenty-year period 1990-2009.) Even unemployment, which declined from 7.3% in 2007 to 6.1% in 2008, rose again to 7.6% in 2009.
Table 4: GDP, exports, FDI and unemployment, 2007-2009 (USD million and percentages)
Year 2007 2008 2009
GDP 167,852 202,158 195,240
Exports 71,630 80,850 67,677

Page 10 of 22
Foreign direct investment
FDI inflows 8,798 10,877 3,892
FDI outflows 8,604 7,210 1,172
FDI inward stock 62,223 64,005 71,258
FDI outward stock 49,833 54,382 56,130
Unemployment rate (%) 7.30 6.10 7.60
Exchange rate: NIS/USD 4.0870 3.5870 3.9230 Source: Israel Central Bureau of Statistics.
During the years 2007 to 2009, the global economy was engulfed by an economic crisis, manifested in declining output, trade and investment, and rising unemployment. The crisis, which is by no means over by September 2010, has had different effects on different economies. Israel, a small country highly integrated into the global economy, has naturally been affected as well. The effect, however, has been both moderate and somewhat delayed. It was barely noticeable in 2008 but became quite pronounced in 2009, as the present report indicates. While the value of Israeli multinationals’ foreign assets remained practically unchanged, both foreign and total sales, as well as employment, declined noticeably (table 2 above).
Analysis of the three-year period since 2007, when the global crisis started, indicates that the decline in employment and sales between 2008 and 2009 was significantly smaller than their rise in the previous year. This fact, combined with the stability of foreign assets, suggests that the effect of the crisis on Israel's multinational sector, though now clearly visible, has been moderate.
Page 11 of 22
For further information please contact: Manufacturers Association of Israel Dan Catarivas Foreign Trade Division [email protected] +972-3-5198814 Tel Aviv University Seev Hirsch Faculty of Management [email protected] +972-3-6408512 Hebrew University Niron Hashai School of Business Administration [email protected] +972-2-5883110 Guy Ben Shachar School of Business Administration [email protected]
Vale Columbia Center on Sustainable International Investment Karl P. Sauvant Executive Director +1-212-854-0689 [email protected] Vishwas P. Govitrikar Global Project Coordinator Emerging Market Global Players Project [email protected] +1-514-507-3948
Emerging Markets Global Players Project This Israeli - Vale Columbia Center ranking of Israeli multinationals was conducted in the framework of the Emerging Markets Global Players Project, a collaborative effort led by the Vale Columbia Center. It brings together researchers on FDI from leading institutions in emerging markets to generate annual reports on the leading multinationals in each participating country. Nine country reports were published in 2009. A number of additional reports will appear in 2010. Visit http://www.vcc.columbia.edu/content/emerging-market-global-players for further information. The Israeli Team The survey of Israel's leading multinational firms is a joint endeavor of the Foreign Trade Division of the Manufacturers Association of Israel, headed by Dan Catarivas (www.industry.org.il), and the two leading business schools in Israel. The Israeli project as a whole is headed by Seev Hirsch from the Recanati School of Business Administration at Tel Aviv University (www.recanati.tau.ac.il), together with Niron Hashai from the Jerusalem School of Business Administration at Hebrew University (bschool.huji.ac.il). Vale Columbia Center on Sustainable International Investment The Vale Columbia Center on Sustainable International Investment, headed by Karl P. Sauvant, is a joint Columbia Law School – Earth Institute venture at Columbia University. It seeks to be a leader on issues related to FDI in the global economy, paying special attention to the sustainability aspect of this investment. The Center focuses on the analysis and teaching of the implications of FDI for public policy and international investment law. Its objectives are to analyze important topical policy-oriented issues related to FDI, develop and disseminate practical approaches and solutions, and provide students with a challenging learning environment. For more information, see http://www.vcc.columbia.edu.
Page 12 of 22
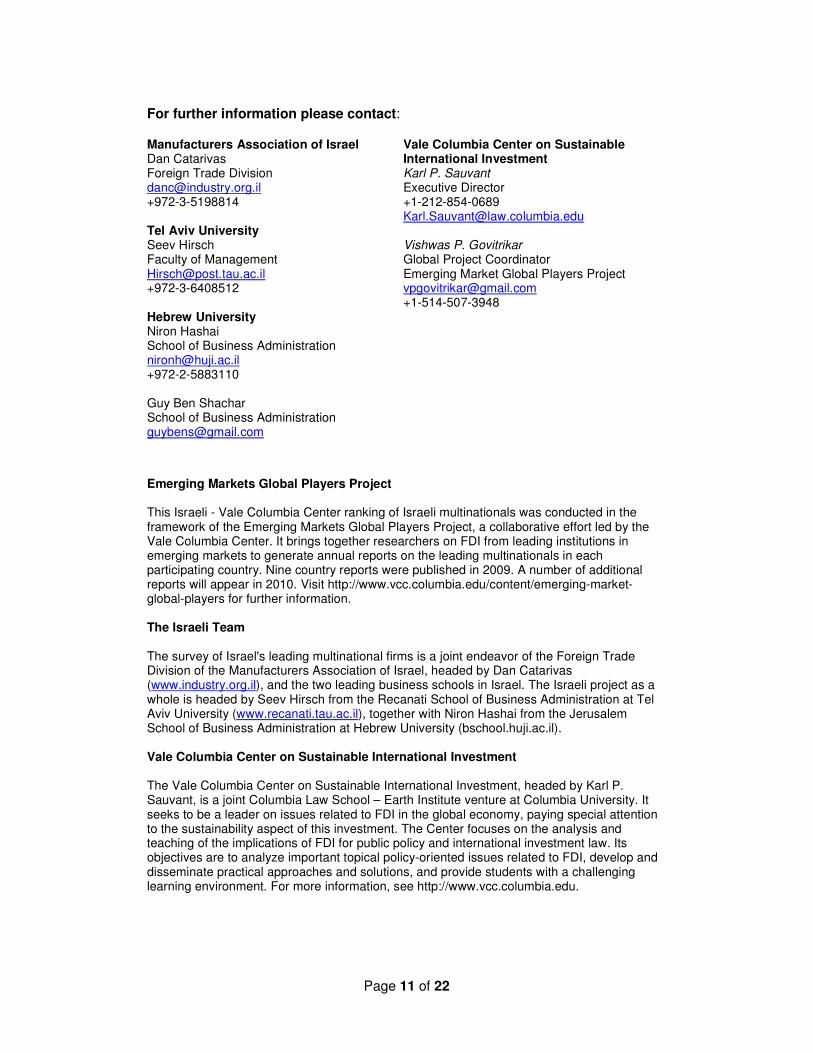
Annex table 1. Israel: The top 21 multinationals: Key variables, 2009 (USD million and numbers of employees)
Number of
foreign affiliates
TNI
index (%)
Sales Employment Assets
Industry Company Rank Total Foreign Total Foreign Total Foreign
184 57 12,498 7,799 17,333 6,510 6,211 4,500 Conglomerate Israel Corporation 1
29 83 13,899 13,399 35,089 28,788 3,766 2,682 Pharmaceuticals Teva 2
21 47 1,699 591 7,065 2,564 3,786 2,675 Conglomerate Elco Holdings 3
38 85 431 431 1,090 622 1,604 1,577 Power stations Ormat 4
55 67 924 519 2,112 1,246 877 758 IT services Checkpoint 5
80 12 8,986 875 28,000 4,000 6805 744 Conglomerate IDB Holdings 6
23 73 583 433 2,596 1,510 673 578 IT services Nice 7
23 53 1,625 769 13,071 7,700 810 426 Food products Strauss Group 8
34 83 425 388 1,448 1,128 526 420 Food products Frutarom 9
18 42 2,832 2,422 11,238 1,806 1008 254 Electronic hardware - electronic and optical products
Elbit 10
4 79 211 200 520 322 249 201 Unwoven fabric Avgol 11
3 56 299 290 1,576 576 483 167 Electronic hardware - electronic and optical equipment
Tower 12
10 81 573 497 7,500 6,053 150 115 Wearing apparel Delta Galil 13
21 74 238 217 890 489 77 58 Plastic products Palram 14
10 71 192 171 1,221 628 66 48 IT services Retalix 15
16 58 214 191 1,172 483 108 47 Plastic products Plasson 16
18 73 226 181 761 517 60 42 Electronic hardware - laser technologies Lumenis 17
7 57 228 192 893 542 100 25 Electronic hardware - satellites Gilat SatelliteNetworks
18
3 59 126 116 578 194 44 23 IT services AudioCodes 19
11 71 378 373 1,602 989 29 15 Electronic hardware - electronic and optical equipment
Orbotech 20
22 59 547 372 7,835 5,360 37 15 IT services Ness Technologies 21
630 57 47,134 30,426 143,590 72,027 27,469 15,370 Total
Source: Israeli-Vale Columbia Center survey of Israeli multinationals. aThe Transnationality Index (TNI) is calculated as the average of the following three ratios: foreign assets to total assets, foreign employment to total employment, and foreign sales to total sales.

Page 13 of 22
Annex table 2. Israel: The top 21 multinationals: Regionality Indexa, 2009 (Percentages, except for last column)
Rank by
foreign assets
Company Africa Asia &
Australia
Latin America
& the Caribbean
North America
Europe
Number of
foreign affiliates
1 Israel Corporation 3.5 25.5 8 12.5 50.5 184
2 Teva 0 0 17.5 13.5 69 29
3 Elco Holdings 0 14.5 0 9.5 76 21
4 Ormat 2.5 11 21 63 2.5 38
5 Checkpoint 0 25.5 5.5 13 56 55
6 IDB Holdings 1.5 7.5 21 20 50 80
7 Nice 0 30.5 4.5 26 39 23
8 Strauss Group 0 0 13 48 39 23
9 Frutarom 3 6 6 17.5 67.5 34
10 Elbit 0 11 5.5 44.5 39 18
11 Avgol 0 25 0 50 25 4
12 Tower 0 0 0 100 0 3
13 Delta Galil 10 20 0 30 40 10
14 Palram 5 19 5 24 47 21
15 Retalix 0 20 0 50 30 10
16 Plasson 0 19 6 12.5 62.5 16
17 Lumenis 0 33.5 11 11 44.5 18
18 Gillat Satellites 0 0 57 29 14 7
19 Audiocodes 0 0 0 66 33 3
20 Orbotech 0 0 36.5 18 45.5 11
21 Ness Technologies 0 4.5 23 13.5 59 22
Total affiliates 12 104 72 138 304 630
Source: Israeli-Vale Columbia Center survey of Israeli multinationals. a The Regionality Index is calculated by dividing the number of a firm’s foreign affiliates in a particular region of the world by its total number of foreign affiliates and multiplying the result by 100.

Page 14 of 22
Annex table 3. Israel: The top 21 multinationals: Stock exchange listings, 2009 Rank by foreign assets
Company Listing
Domestic Foreign
1 Israel Corporation TASE None
2 Teva TASE Nasdaq
3 Elco Holdings TASE None
4 Ormat TASE NYSE
5 Checkpoint None Nasdaq
6 IDB Holdings TASE None
7 Nice TASE Nasdaq
8 Strauss Group TASE None
9 Frutarom TASE None
10 Elbit TASE Nasdaq
11 Avgol TASE None
12 Tower TASE Nasdaq
13 Delta Galil TASE None
14 Palram TASE None
15 Retalix TASE Nasdaq
16 Plasson TASE None
17 Lumenis None None
18 Gillat Satellites TASE Nasdaq
19 Audiocodes TASE Nasdaq
20 Orbotech None Nasdaq
21 Ness Technologies TASE Nasdaq
Source: Israeli-Vale Columbia Center survey of Israeli multinationals.

Page 15 of 22
Annex table 4. Israel: The top 10 outward M&A transactions, 2007-2009 (USD million)
Date Acquiror's name Target name Target industry Target
economy
% of shares acquire
d
Value of transaction
12/23/2008 Teva Pharm Inds Ltd Barr Pharmaceuticals Inc Pharmaceuticals United States 100.00 8,810.21
04/16/2007 Investor Group RBS Group PLC-Marriot
Hotels Hotels and motels United Kingdom 100.00 2,170.63
03/02/2007 Delek Real Estate Ltd RoadChef Motorways Ltd Eating places United Kingdom 100.00 734.14
04/30/2007 Africa Israel Investments
Ltd NY Times Bldg,New
York,NY Operators of non-
residential buildings United States 100.00 525.00
06/14/2007 Gazit Inc Ormat Technologies Inc Cogeneration, alternative
energy sources United States 12.00 407.15
02/21/2008 Teva Pharm Inds Ltd CoGenesys Inc Pharmaceuticals United States 100.00 400.00
07/22/2008 Teva Pharm Inds Ltd Bentley Pharmaceuticals
Inc Pharmaceuticals United States 100.00 352.06
08/14/2007 Israel Chemicals Ltd Supresta LLC Chemicals and chemical
preparations United States 100.00 352.00
11/22/2009 452 Fifth Owners LLC 452 Fifth Avenue, New
York, NY Operators of non-
residential buildings United States 100.00 330.00
08/30/2007 NICE Systems Ltd Actimize Inc Pre-packaged software United States 100.00 279.11
Total 14,360.30
Source: Thomson ONE Banker. Thomson Reuters.

Page 16 of 22
Annex table 5. Israel: The top 10 outward greenfield transactions, 2007-2009 (USD million)
Date Company Destination Industry Value of transaction
Oct-08 Fishman Group Russia Real estate 1,800.00
May-08 Fishman Group Russia Real estate 1,500.00
Sep-08 EngelInvest Vietnam Real estate 1,100.00
Dec-07 Elbit Imaging Romania Real estate 884.34
Jan-08 Israel Corp (IC) China Automotive OEM 803.09
Jul-08 EIG Renewables Macedonia Alternative/renewable
energy 564.11
May-09 Fishman Group Thailand Real estate 530.80
Dec-08 Fishman Group Belarus Real estate 500.00
Jun-08 ELCO Holdings Bulgaria Real estate 473.00
Jul-07 Africa Israel Investments Russia Real estate 465.20
Total 8,620.54
Source: fdi Intelligence, a service from the Financial Times Ltd.

Page 17 of 22
Annex table 6. Israel: Regional distribution of affiliates, 2008 & 2009
Africa Asia &
Australia
Latin America &
the Caribbean
North America
Europe Total
2008
Number 6 93 59 123 291 572
Percentage 1.0 16.3 10.3 21.5 50.9 100.0
Affiliates per firm 22.9
2009
Number 12 104 72 138 304 630
Percentage 1.9 16.5 11.4 21.9 48.3 100.0
Affiliates per firm 30.0
Source: Israeli-Vale Columbia Center survey of Israeli multinationals.

Page 18 of 22
Annex figure 1. Israel: Breakdown of the foreign assets of the top 21 multinationals, by industry, 2009
IT services
10%
Electronic
hardware
3%
Food products
6%
Plastic products
1%
Conglomerate
55%
Other industries
2%
Pharmaceuticals
18%
Power stations
5%
Source: Israeli-Vale Columbia Center survey of Israeli multinationals.
Companies Foreign assets (USD
million) Industry
Checkpoint, NICE, Ness Technologies, Retalix, Audiocodes 1,449
IT services
Teva 2,682 Pharmaceuticals
Ormat 758 Power stations
Elco Holdings, Israel Corporation, IDB Holdings 7,919 Conglomerate
Strauss Group, Frutarom 846 Food products
Plasson, Palram 105 Plastic products
Elbit, Tower, Lumenis, Orbotech, Gilat 503 Electronic hardware
Delta, Avgol 316 Other industries

Page 19 of 22
Annex figure 2. Israel: Foreign affiliates of the top 21 multinationals, by region, 2009 (number of affiliates)
Source: Israeli-Vale Columbia Center survey of Israeli multinationals.
Europe
304
Asia & Australia
104
Africa
12
Latin America
72
North America
138

Page 20 of 22
Annex figure 3. Israel: Head office locations of the top 20 multinationals, 2009 Source: Israeli-Vale Columbia Center survey of Israeli multinationals.
Tel Aviv: 7
Petach Tikva: 3
Haifa: 2
Ra’anana: 2
Reno, Nevada, USA: 1
Migdal Haemek, Kibbutz Ramat Johanan,
Kibbutz Maagan Michael, Yokneam, Lod,
Yavne: 6 (1 each)

Page 21 of 22
Annex figure 4: Israel: Inward and outward FDI flows, 1990-2009 (USD million)
-
2 000
4 000
6 000
8 000
10 000
12 000
14 000
16 000
18 0001
99
0
199
1
199
2
199
3
199
4
199
5
199
6
199
7
199
8
199
9
200
0
200
1
200
2
200
3
200
4
200
5
200
6
200
7
200
8
200
9
FDI INFLOWS FDI OUTFLOWS
Source: Accountant General’s Office, Ministry of Finance.
Page 22 of 22
Annex figure 5: Israel: Inward and outward FDI stock, 1990-2009 (USD million)
-
10 000
20 000
30 000
40 000
50 000
60 000
70 000
80 0001990
1991
1992
1993
1994
1995
1996
1997
1998
1999
2000
2001
2002
2003
2004
2005
2006
2007
2008
2009
Inward FDI Stock Outward FDI Stock
Source: Accountant General’s Office, Ministry of Finance.