Embed Size (px)
Citation preview
Creation of nitrogen-vacancy centers in chemical vapor deposition diamond forsensing applications
T. Luoa, L. Lindnera, J. Langera, V. Cimallaa, F. Hahla, C. Schreyvogela, S. Onodab, S. Ishiib, T. Ohshimab, D.Wangc,d, D. A. Simpsonc, B. C. Johnsone, M. Capellif, R. Blinderg, J. Jeskea,∗
aFraunhofer Institute for Applied Solid State Physics (IAF), Tullastr. 72, 79108 Freiburg, GermanybNational Institutes for Quantum Science and Technology (QST), 1233 Watanuki, Takasaki, Gunma 370-1292, Japan
cSchool of Physics, University of Melbourne, Melbourne, VIC 3010, AustraliadARC Centre of Excellence in Exciton Science, School of Chemistry, University of Melbourne, Parkville VIC 3010, Australia
eSchool of Engineering, RMIT University, Melbourne 3000, AustraliafSchool of Science, RMIT University, Melbourne VIC 3001, Australia
gInstitut fur Quantenoptik, University of Ulm, D-89081 Ulm, Germany
Abstract
The nitrogen-vacancy (NV) center in diamond is a promising quantum system for magnetometry applications exhibitingoptical readout of minute energy shifts in its spin sub-levels. Key material requirements for NV ensembles are a highNV− concentration, a long spin coherence time and a stable charge state. However, these are interdependent and canbe difficult to optimize during diamond growth and subsequent NV creation. In this work, we systematically investigatethe NV center formation and properties in chemical vapor deposition (CVD) diamond. The nitrogen flow during growthis varied by over 4 orders of magnitude, resulting in a broad range of single substitutional nitrogen concentrations of0.2-20 parts per million. For a fixed nitrogen concentration, we optimize electron-irradiation fluences with two differentaccelerated electron energies, and we study defect formation via optical characterizations. We discuss a general approachto determine the optimal irradiation conditions, for which an enhanced NV concentration and an optimum of NV chargestates can both be satisfied. We achieve spin-spin coherence times T2 ranging from 45.5 to 549 µs for CVD diamondscontaining 168 to 1 parts per billion NV− centers, respectively. This study shows a pathway to engineer properties ofNV-doped CVD diamonds for improved sensitivity.
Keywords: nitrogen vacancy center, chemical vapor deposition, eletron-beam irradiation, magnetometry, quantumsensing, sensitivity
1. Introduction
The negatively charged nitrogen-vacancy (NV−) centeris a promising spin system for quantum sensing applica-tions [1–3]. Specifically, magnetic [4–7] and electric [8, 9]field, strain [10, 11], temperature [12–15] and pressure [16]sensing have all been demonstrated with the NV− center.
NV-ensembles with high NV− concentrations are fa-vored for precision magnetometries [17–20], for a consider-ably improved signal-to-noise ratio and sensitivity, whichboth ideally improve with the square root of the number ofsensing spins [21, 22]. High NV− concentrations require anenhanced nitrogen incorporation in diamonds, especially inthe form of isolated-substitutional-nitrogen atoms (calledP1 center or N0
s center) [23, 24], which are converted toNV centers via irradiation and annealing. However, thenitrogen impurities are also the main decoherence sourceof the NV spin, which limits the coherence time T2 [25–27]for quantum manipulation and sensing. These competing
∗Corresponding author. Tel: +49 761 5159-265Email address: [email protected] (J. Jeske)
parameters create a challenge when combining high NV−
concentrations with long coherence times, which are bothkey factors for improved sensitivity in magnetic field sens-ing [28, 29]. Consequently, the best achievable combina-tion of NV− concentration and coherence time becomes anessential question for material optimization, which needsto be investigated throughout the diamond synthesis andafter-growth treatments.
Chemical vapor deposition (CVD) synthesis of diamondallows for well-controlled nitrogen-doping by setting thegas flow to the reaction chamber, typically at the lowerend of nitrogen doping levels. High pressure high temper-ature (HPHT) synthesis, on the other hand, usually comeswith larger nitrogen content (up to several hundreds ofparts per million (ppm)) due to the contamination of themetal solvent-catalysts. However, HPHT diamonds oftenshow strong variations in nitrogen densities between crys-tals grown under the same conditions, or even show sectorswith vastly different P1 concentrations in a single crys-tal, due to the different nitrogen incorporation efficienciesalong different growth directions during synthesis [30]. Al-though both approaches have their advantages, the CVD
arX
iv:2
111.
0798
1v1
[qu
ant-
ph]
15
Nov
202
1
synthesis is typically more controllable and reproducible:it can realize a high homogeneity of nitrogen incorporationdue to growth in a single crystalline direction and a moreprecise control over the desired nitrogen density and thusNV coherence time.
In previous studies, limited ranges of nitrogen concen-trations for specific interests have been mostly discussed,for example recently Edmonds et al. [31] have investi-gated CVD diamonds containing ∼10-15 ppm P1 centersand shown the reproducibility of their growth method bystudying a large amount of samples; Rubinas et al. [32]have studied HPHT diamonds with over ∼0.5-3 ppm P1concentration range; and earlier Nobauer et al. [33] havepresented a study of HPHT diamonds with P1 densitiesof .200 ppm and CVD diamonds with P1 densities of.1 ppm. In this work, we have grown CVD diamond se-ries with a varying nitrogen flow over 4 orders of magni-tude, leading to a broad range of P1 densities from 0.2 to20 ppm. To ensure comparability, we use a single reac-tor for all samples in this work. We conducted systematiccharacterization on these CVD series to investigate P1,NV creations and NV charge states after growth, as wellas their transformation under subsequent electron beamirradiation. Furthermore, we explore the optimal irradia-tion parameters, by growing two additional diamond serieswith a fixed initial P1 density of ∼2.2 ppm and irradiatethem with multiple fluences at two different electron ener-gies.
Conventional procedures for NV creation pursue mainlya high P1 to NV centers conversion and a high concentra-tion of total NV centers. The simultaneous reduction ofthe favourable NV− charge state often has been ignored.Here through the irradiation, we study the increase in NVcenters as well as the change in charge state distribution.We aim to balance the increase of NV density with main-taining a high NV−/NV ratio. From this, we suggest gen-eral approaches to determine the optimal irradiation flu-ence for different nitrogen densities.
Moreover, we investigate the coherence time, T2, of theNV center after growth, as well as after irradiation and an-nealing. We show the connection between P1 center den-sity and T2 after growth and achieve NV ensembles withlong T2. Through irradiation and annealing treatments,we monitor the change in T2 and aim to increase the NVdensity without compromising T2. We discuss combina-tions from high NV− with short T2, to low NV− with longT2, which help to identify the appropriate combination toachieve the optimal sensitivity for different applications.
2. Materials and methods
2.1. Sample processing
In this study, we aim to systematically investigate thegrowth and irradiation steps, in order to study the NVcenter and P1 center creation and corresponding NV-T2
of CVD diamond. To this end, we have grown two sets of
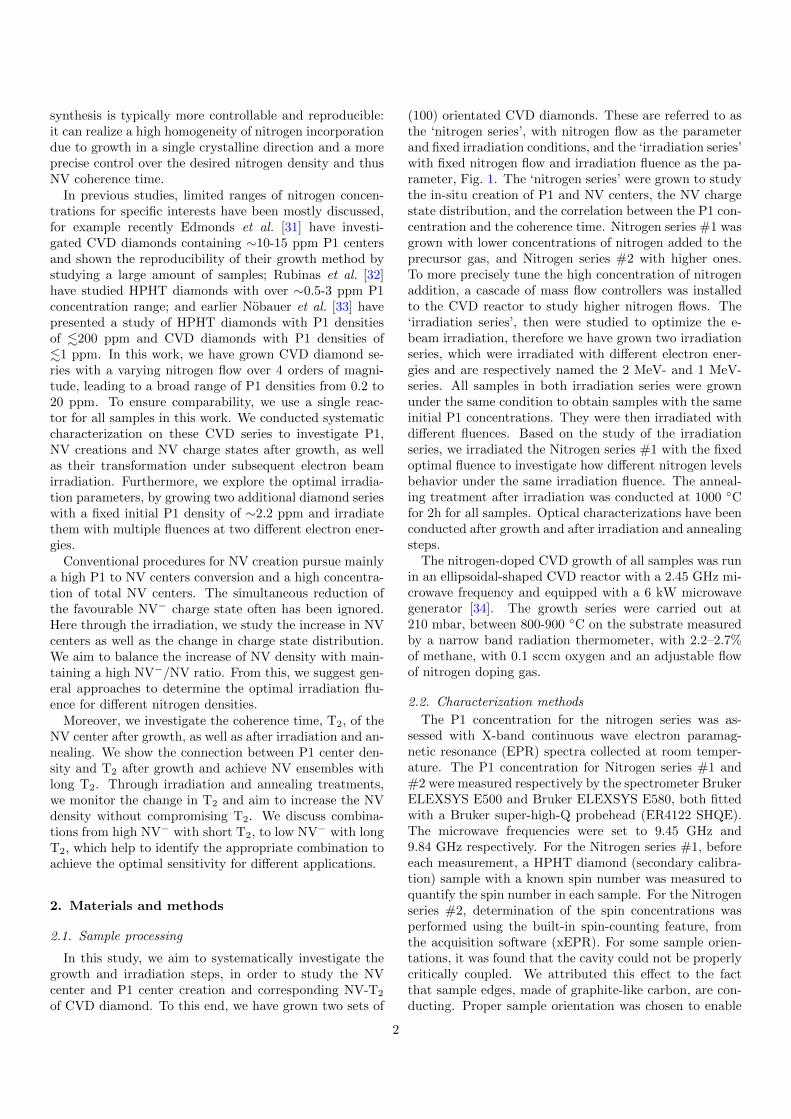
(100) orientated CVD diamonds. These are referred to asthe ‘nitrogen series’, with nitrogen flow as the parameterand fixed irradiation conditions, and the ‘irradiation series’with fixed nitrogen flow and irradiation fluence as the pa-rameter, Fig. 1. The ‘nitrogen series’ were grown to studythe in-situ creation of P1 and NV centers, the NV chargestate distribution, and the correlation between the P1 con-centration and the coherence time. Nitrogen series #1 wasgrown with lower concentrations of nitrogen added to theprecursor gas, and Nitrogen series #2 with higher ones.To more precisely tune the high concentration of nitrogenaddition, a cascade of mass flow controllers was installedto the CVD reactor to study higher nitrogen flows. The‘irradiation series’, then were studied to optimize the e-beam irradiation, therefore we have grown two irradiationseries, which were irradiated with different electron ener-gies and are respectively named the 2 MeV- and 1 MeV-series. All samples in both irradiation series were grownunder the same condition to obtain samples with the sameinitial P1 concentrations. They were then irradiated withdifferent fluences. Based on the study of the irradiationseries, we irradiated the Nitrogen series #1 with the fixedoptimal fluence to investigate how different nitrogen levelsbehavior under the same irradiation fluence. The anneal-ing treatment after irradiation was conducted at 1000 ◦Cfor 2h for all samples. Optical characterizations have beenconducted after growth and after irradiation and annealingsteps.
The nitrogen-doped CVD growth of all samples was runin an ellipsoidal-shaped CVD reactor with a 2.45 GHz mi-crowave frequency and equipped with a 6 kW microwavegenerator [34]. The growth series were carried out at210 mbar, between 800-900 ◦C on the substrate measuredby a narrow band radiation thermometer, with 2.2–2.7%of methane, with 0.1 sccm oxygen and an adjustable flowof nitrogen doping gas.
2.2. Characterization methods
The P1 concentration for the nitrogen series was as-sessed with X-band continuous wave electron paramag-netic resonance (EPR) spectra collected at room temper-ature. The P1 concentration for Nitrogen series #1 and#2 were measured respectively by the spectrometer BrukerELEXSYS E500 and Bruker ELEXSYS E580, both fittedwith a Bruker super-high-Q probehead (ER4122 SHQE).The microwave frequencies were set to 9.45 GHz and9.84 GHz respectively. For the Nitrogen series #1, beforeeach measurement, a HPHT diamond (secondary calibra-tion) sample with a known spin number was measured toquantify the spin number in each sample. For the Nitrogenseries #2, determination of the spin concentrations wasperformed using the built-in spin-counting feature, fromthe acquisition software (xEPR). For some sample orien-tations, it was found that the cavity could not be properlycritically coupled. We attributed this effect to the factthat sample edges, made of graphite-like carbon, are con-ducting. Proper sample orientation was chosen to enable
2
Opticalcharacterization
E-beam irradiationwith fixed conditions
e- 2 MeV 2E17 /cm2
Opticalcharacterization
CVD growth
Varying N/C ratio P1 ~0.2-20 ppm
Annealing
1000 °C 2 h
CVD growth withfixed N/C ratios
P1 ~2.2 ppm
Annealing
1000 °C 2 h
Opticalcharacterization
Annealing
1000 °C 2 h
Opticalcharacterization
Opticalcharacterization
Opticalcharacterization
1 MeV series
2 MeV series
Nitrogen series #1, #2
Irradiation series
Varying fluences 2 MeV1E16-1E18/cm2
E-beam irradiation
e-
Varying fluences 1 MeV1E17-3E18/cm2
E-beam irradiation
e-
a)
b)
Figure 1: Flowchart of the sample preparation and characterization. a) The ‘nitrogen series’ were grown with varying nitrogen concentrations,then irradiated and annealed under the same conditions. b) The ‘irradiation series’ were grown with fixed nitrogen concentration, thenirradiated under different conditions. Characterizations have been conducted after growth, then after irradiation and annealing steps.
critical coupling. This consists in putting two oppositeedges of the square samples parallel to the sample inser-tion axis. For that cavity, such orientation ensures thatno current loop will be created, because of the perpendic-ularity of the electric microwave field (TE102 mode) totwo of the sample edges. The EPR measurement for P1concentration carries a ∼6% error.
The P1 concentration of the irradiation series was es-timated from the absorption spectrum (measured withPerkinElmer Lambda 950) in the UV-Visible range (200-800 nm), in which an absorption band at 270 nm has beenassigned to the P1 center [35, 36]. To obtain the P1 con-centration from this band, we compared its strength toreference samples with known P1 concentration measuredby EPR. The main error was induced by calibration fromEPR method.
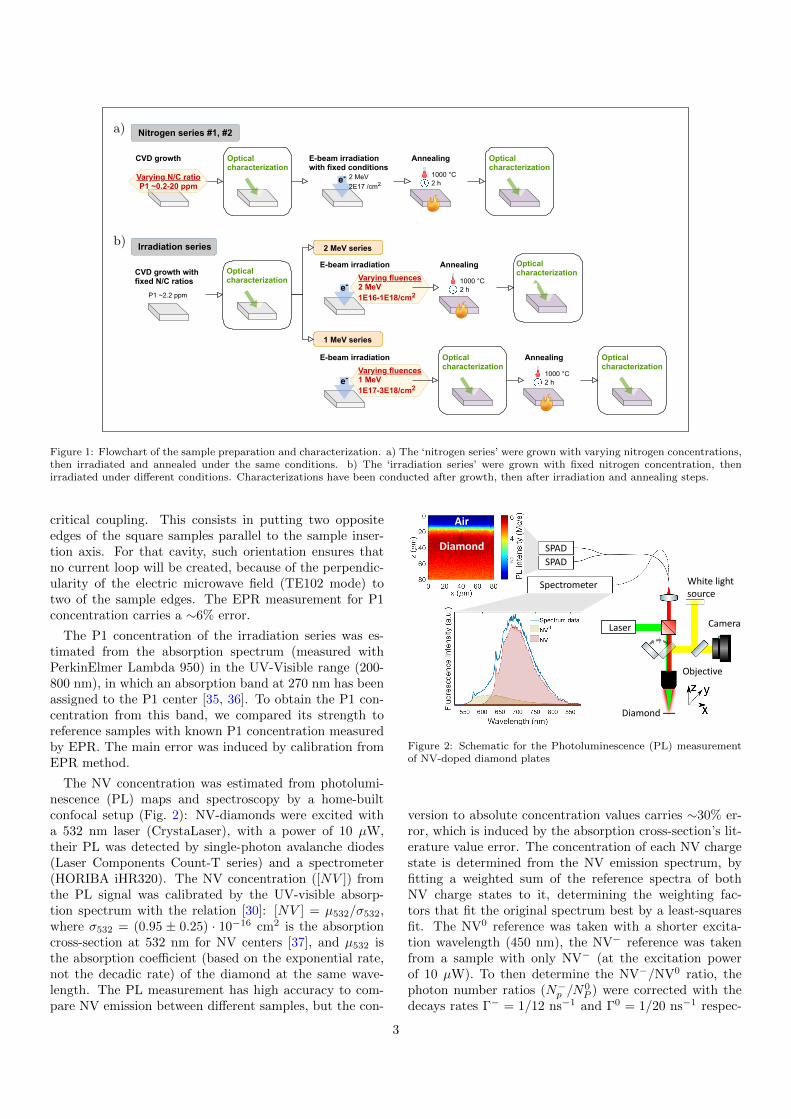
The NV concentration was estimated from photolumi-nescence (PL) maps and spectroscopy by a home-builtconfocal setup (Fig. 2): NV-diamonds were excited witha 532 nm laser (CrystaLaser), with a power of 10 µW,their PL was detected by single-photon avalanche diodes(Laser Components Count-T series) and a spectrometer(HORIBA iHR320). The NV concentration ([NV ]) fromthe PL signal was calibrated by the UV-visible absorp-tion spectrum with the relation [30]: [NV ] = µ532/σ532,where σ532 = (0.95 ± 0.25) · 10−16 cm2 is the absorptioncross-section at 532 nm for NV centers [37], and µ532 isthe absorption coefficient (based on the exponential rate,not the decadic rate) of the diamond at the same wave-length. The PL measurement has high accuracy to com-pare NV emission between different samples, but the con-
SPAD
SPAD
Spectrometer White light source
Camera
Objective
Laser
Diamond
Air
Diamond
Figure 2: Schematic for the Photoluminescence (PL) measurementof NV-doped diamond plates
version to absolute concentration values carries ∼30% er-ror, which is induced by the absorption cross-section’s lit-erature value error. The concentration of each NV chargestate is determined from the NV emission spectrum, byfitting a weighted sum of the reference spectra of bothNV charge states to it, determining the weighting fac-tors that fit the original spectrum best by a least-squaresfit. The NV0 reference was taken with a shorter excita-tion wavelength (450 nm), the NV− reference was takenfrom a sample with only NV− (at the excitation powerof 10 µW). To then determine the NV−/NV0 ratio, thephoton number ratios (N−
p /N0P ) were corrected with the
decays rates Γ− = 1/12 ns−1 and Γ0 = 1/20 ns−1 respec-
3
tively for the two charge states [38, 39], with the relation:[NV −]/[NV 0] = (N−
p /N0P ) · (Γ−/Γ0). Absolute NV− and
NV0 concentrations were then calculated as fractions ofthe total NV concentrations.
The coherence time, T2, was measured by a home-builtwidefield microscope. A modulated 532 nm excitationlaser (Laser Quantum opus) was focused onto the samplesat a power of 100 mW with a spot size of 0.25 mm, thenthe NV-PL from a small central region of (16×16 µm)was collected by a sCMOS camera (ANDOR ZYLA 5.5sCMOS). The T2 measurement was conducted using theHahn-echo protocol with MW π time of 120 ns and readoutlaser time of 8.5 µs and repeated for 20 ms. The initiallaser polarization time was 50 ms and background mag-netic field was 700 G. The microwave was delivered viaan omega-shaped gold resonator with inner diameter of0.3 cm. The collected PL count was referenced against animmediate secondary spin-echo measurement with an ad-dition π-pulse and T2 is extrapolated from the exponentialfunction f(t) = a · exp(−t/T2) + c.
3. Results and discussion
3.1. As-grown NV-doped CVD diamond
Nitrogen-doped CVD diamonds usually show detectableNV-fluorescence after growth, since some NV centers areformed directly in the growth, and the growth tempera-ture activates local vacancies to combine with P1 centersbut does not reach the point that NV centers become un-stable. Working with NV centers that are formed directlyduring CVD growth is appealing for its technological sim-plicity as it does not require any irradiation or annealingsteps. In this section we first study the in-situ creationof NV centers as well as the incorporation of P1 centers.We have grown the two nitrogen series to map concentra-tions of P1 centers and NV centers created by differentnitrogen flows, showing how NV centers correlate to P1centers; and how NV charge states behave in this phase.Furthermore, we investigate the coherence time of the se-ries, and plot it as a function of EPR-determined P1 centerdensities. With all these characterizations we discuss theperformance of nitrogen-doped CVD diamonds as a sens-ing material, without further treatments.
3.1.1. P1 and NV creation as grown
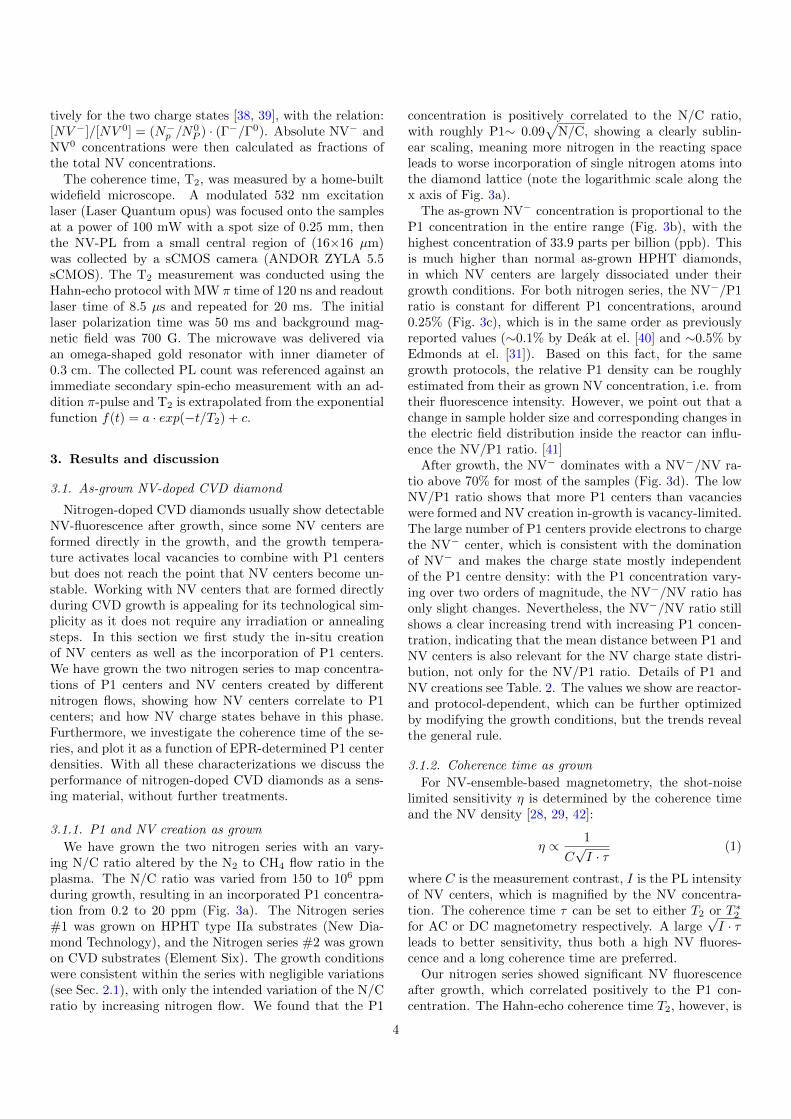
We have grown the two nitrogen series with an vary-ing N/C ratio altered by the N2 to CH4 flow ratio in theplasma. The N/C ratio was varied from 150 to 106 ppmduring growth, resulting in an incorporated P1 concentra-tion from 0.2 to 20 ppm (Fig. 3a). The Nitrogen series#1 was grown on HPHT type IIa substrates (New Dia-mond Technology), and the Nitrogen series #2 was grownon CVD substrates (Element Six). The growth conditionswere consistent within the series with negligible variations(see Sec. 2.1), with only the intended variation of the N/Cratio by increasing nitrogen flow. We found that the P1
concentration is positively correlated to the N/C ratio,with roughly P1∼ 0.09
√N/C, showing a clearly sublin-
ear scaling, meaning more nitrogen in the reacting spaceleads to worse incorporation of single nitrogen atoms intothe diamond lattice (note the logarithmic scale along thex axis of Fig. 3a).
The as-grown NV− concentration is proportional to theP1 concentration in the entire range (Fig. 3b), with thehighest concentration of 33.9 parts per billion (ppb). Thisis much higher than normal as-grown HPHT diamonds,in which NV centers are largely dissociated under theirgrowth conditions. For both nitrogen series, the NV−/P1ratio is constant for different P1 concentrations, around0.25% (Fig. 3c), which is in the same order as previouslyreported values (∼0.1% by Deak at el. [40] and ∼0.5% byEdmonds at el. [31]). Based on this fact, for the samegrowth protocols, the relative P1 density can be roughlyestimated from their as grown NV concentration, i.e. fromtheir fluorescence intensity. However, we point out that achange in sample holder size and corresponding changes inthe electric field distribution inside the reactor can influ-ence the NV/P1 ratio. [41]
After growth, the NV− dominates with a NV−/NV ra-tio above 70% for most of the samples (Fig. 3d). The lowNV/P1 ratio shows that more P1 centers than vacancieswere formed and NV creation in-growth is vacancy-limited.The large number of P1 centers provide electrons to chargethe NV− center, which is consistent with the dominationof NV− and makes the charge state mostly independentof the P1 centre density: with the P1 concentration vary-ing over two orders of magnitude, the NV−/NV ratio hasonly slight changes. Nevertheless, the NV−/NV ratio stillshows a clear increasing trend with increasing P1 concen-tration, indicating that the mean distance between P1 andNV centers is also relevant for the NV charge state distri-bution, not only for the NV/P1 ratio. Details of P1 andNV creations see Table. 2. The values we show are reactor-and protocol-dependent, which can be further optimizedby modifying the growth conditions, but the trends revealthe general rule.
3.1.2. Coherence time as grown
For NV-ensemble-based magnetometry, the shot-noiselimited sensitivity η is determined by the coherence timeand the NV density [28, 29, 42]:
η ∝ 1
C√I · τ
(1)
where C is the measurement contrast, I is the PL intensityof NV centers, which is magnified by the NV concentra-tion. The coherence time τ can be set to either T2 or T ∗
2
for AC or DC magnetometry respectively. A large√I · τ
leads to better sensitivity, thus both a high NV fluores-cence and a long coherence time are preferred.
Our nitrogen series showed significant NV fluorescenceafter growth, which correlated positively to the P1 con-centration. The Hahn-echo coherence time T2, however, is
4
102 103 104 105 106
N/C ratio (ppm)
0
5
10
15
20
25
P1
conc
entr
atio
n (p
pm)
Nitrogen series #1Nitrogen series #2
Fitting: y=0.086x0.4
a)
0 5 10 15 20
P1 concentration (ppm)
0
0.005
0.01
0.015
0.02
0.025
0.03
0.035
0.04
NV
- con
cent
ratio
n (p
pm)
Nitrogen series #1Nitrogen series #2Fitting: y=0.0025x
b)
0 5 10 15 20
P1 concentration (ppm)
0
0.1
0.2
0.3
0.4
0.5
NV
- /P1
ratio
(%
)
Nitrogen series #1Nitrogen series #2
c)
0 5 10 15 20
P1 concentration (ppm)
70
75
80
85
90
95
NV
- /NV
rat
io (
%)
Nitrogen series #1Nitrogen series #2
d)
Figure 3: Two nitrogen series were grown with varying N/C ratio, respectively Nitrogen series #1 with P1 of 0.2-2.6 ppm, and Nitrogenseries #2 with P1 of 2.6-20 ppm. (a) The as-grown P1 concentration is positively but sublinearly correlated to the N/C flow ratio in theplasma. (b),(c) The as-grown NV− concentration is proportional to the P1 concentration, with an NV/P1 ratio of ∼0.25%. (d) Both NV−
and NV0 were formed during the growth, the NV−/NV ratio increases slightly with the P1 concentration. The NV-PL has a high homogeneityin the measured area, and its high precision for relative concentration measurements leads to a negligible statistical error comparing to thesystematic error of ∼30%, which was induced by the calibration from the absorption cross-section (Sec. 2.2), therefore the error bars havenot been implemented for NV concentrations. For the same reason the P1 concentration measured by EPR with ∼6% error is also notimplemented. The error for the NV−/NV ratio was given by the standard deviation of data acquired at different sample positions.
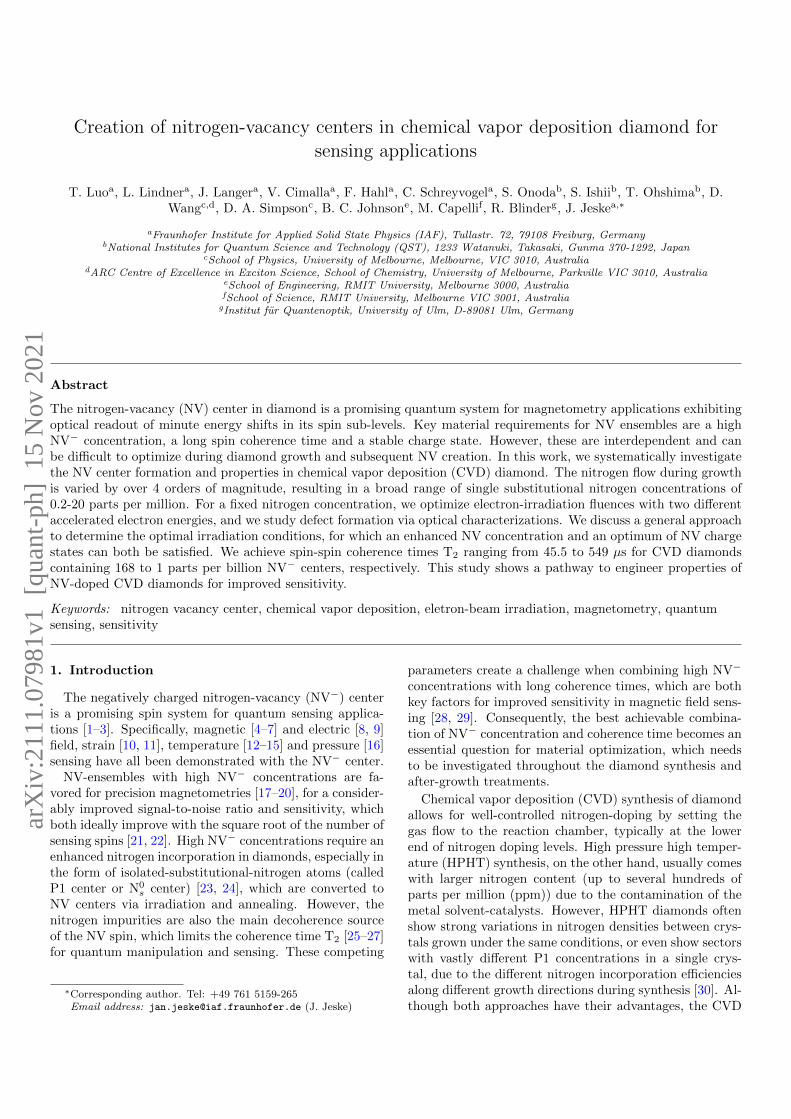
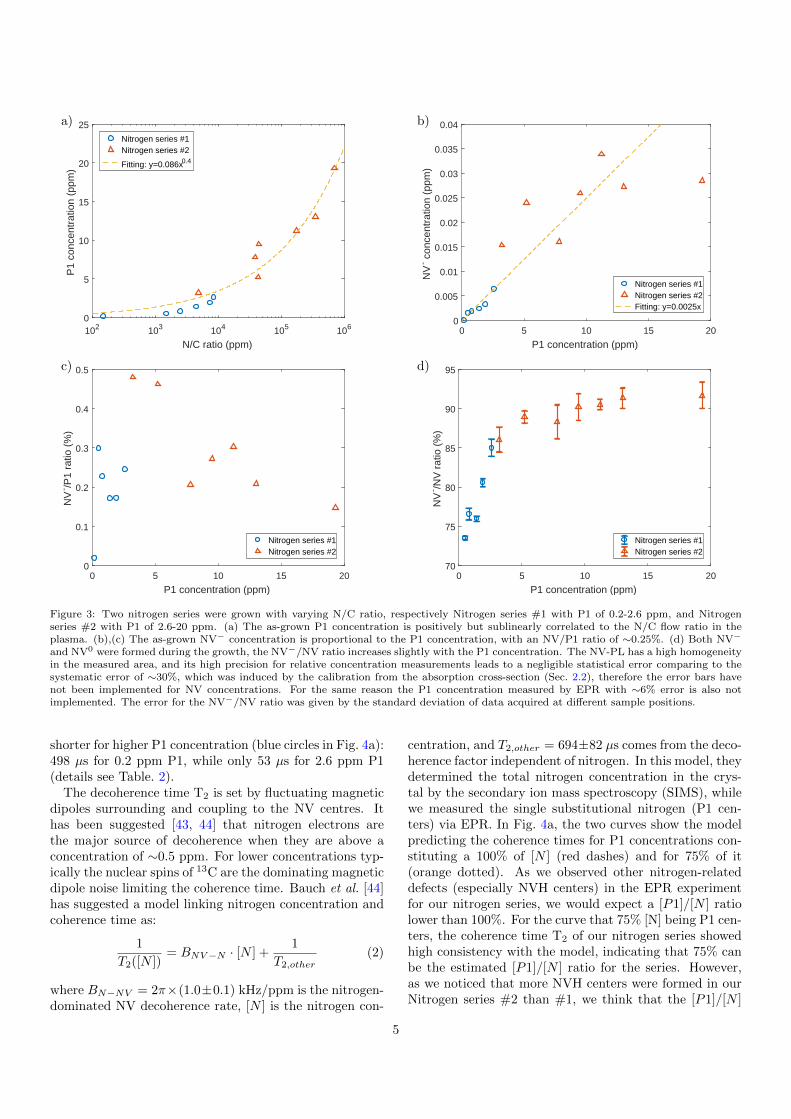
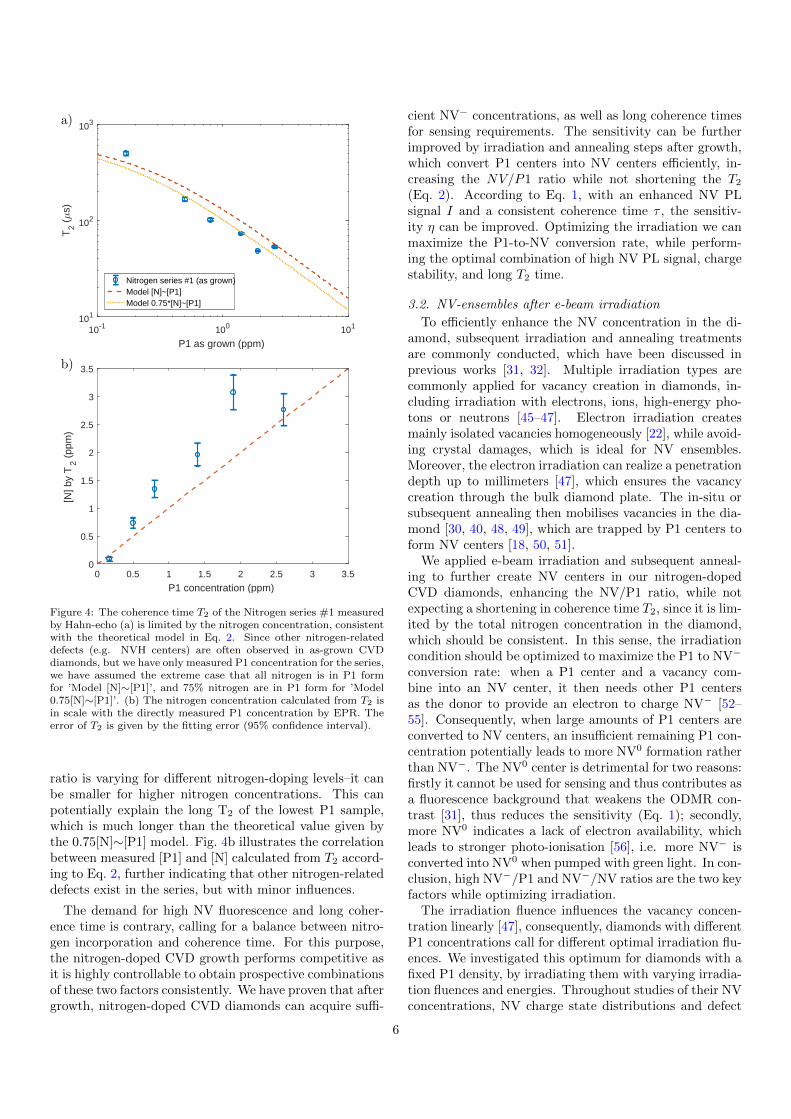
shorter for higher P1 concentration (blue circles in Fig. 4a):498 µs for 0.2 ppm P1, while only 53 µs for 2.6 ppm P1(details see Table. 2).
The decoherence time T2 is set by fluctuating magneticdipoles surrounding and coupling to the NV centres. Ithas been suggested [43, 44] that nitrogen electrons arethe major source of decoherence when they are above aconcentration of ∼0.5 ppm. For lower concentrations typ-ically the nuclear spins of 13C are the dominating magneticdipole noise limiting the coherence time. Bauch et al. [44]has suggested a model linking nitrogen concentration andcoherence time as:
1
T2([N ])= BNV−N · [N ] +
1
T2,other(2)
where BN−NV = 2π×(1.0±0.1) kHz/ppm is the nitrogen-dominated NV decoherence rate, [N ] is the nitrogen con-
centration, and T2,other = 694±82 µs comes from the deco-herence factor independent of nitrogen. In this model, theydetermined the total nitrogen concentration in the crys-tal by the secondary ion mass spectroscopy (SIMS), whilewe measured the single substitutional nitrogen (P1 cen-ters) via EPR. In Fig. 4a, the two curves show the modelpredicting the coherence times for P1 concentrations con-stituting a 100% of [N ] (red dashes) and for 75% of it(orange dotted). As we observed other nitrogen-relateddefects (especially NVH centers) in the EPR experimentfor our nitrogen series, we would expect a [P1]/[N ] ratiolower than 100%. For the curve that 75% [N] being P1 cen-ters, the coherence time T2 of our nitrogen series showedhigh consistency with the model, indicating that 75% canbe the estimated [P1]/[N ] ratio for the series. However,as we noticed that more NVH centers were formed in ourNitrogen series #2 than #1, we think that the [P1]/[N ]
5
10-1 100 101
P1 as grown (ppm)
101
102
103
T2 (
s)
Nitrogen series #1 (as grown)Model [N]~[P1]Model 0.75*[N]~[P1]
a)
0 0.5 1 1.5 2 2.5 3 3.5
P1 concentration (ppm)
0
0.5
1
1.5
2
2.5
3
3.5
[N] b
y T
2 (pp
m)
b)
Figure 4: The coherence time T2 of the Nitrogen series #1 measuredby Hahn-echo (a) is limited by the nitrogen concentration, consistentwith the theoretical model in Eq. 2. Since other nitrogen-relateddefects (e.g. NVH centers) are often observed in as-grown CVDdiamonds, but we have only measured P1 concentration for the series,we have assumed the extreme case that all nitrogen is in P1 formfor ’Model [N]∼[P1]’, and 75% nitrogen are in P1 form for ’Model0.75[N]∼[P1]’. (b) The nitrogen concentration calculated from T2 isin scale with the directly measured P1 concentration by EPR. Theerror of T2 is given by the fitting error (95% confidence interval).
ratio is varying for different nitrogen-doping levels–it canbe smaller for higher nitrogen concentrations. This canpotentially explain the long T2 of the lowest P1 sample,which is much longer than the theoretical value given bythe 0.75[N]∼[P1] model. Fig. 4b illustrates the correlationbetween measured [P1] and [N] calculated from T2 accord-ing to Eq. 2, further indicating that other nitrogen-relateddefects exist in the series, but with minor influences.
The demand for high NV fluorescence and long coher-ence time is contrary, calling for a balance between nitro-gen incorporation and coherence time. For this purpose,the nitrogen-doped CVD growth performs competitive asit is highly controllable to obtain prospective combinationsof these two factors consistently. We have proven that aftergrowth, nitrogen-doped CVD diamonds can acquire suffi-
cient NV− concentrations, as well as long coherence timesfor sensing requirements. The sensitivity can be furtherimproved by irradiation and annealing steps after growth,which convert P1 centers into NV centers efficiently, in-creasing the NV/P1 ratio while not shortening the T2(Eq. 2). According to Eq. 1, with an enhanced NV PLsignal I and a consistent coherence time τ , the sensitiv-ity η can be improved. Optimizing the irradiation we canmaximize the P1-to-NV conversion rate, while perform-ing the optimal combination of high NV PL signal, chargestability, and long T2 time.
3.2. NV-ensembles after e-beam irradiation
To efficiently enhance the NV concentration in the di-amond, subsequent irradiation and annealing treatmentsare commonly conducted, which have been discussed inprevious works [31, 32]. Multiple irradiation types arecommonly applied for vacancy creation in diamonds, in-cluding irradiation with electrons, ions, high-energy pho-tons or neutrons [45–47]. Electron irradiation createsmainly isolated vacancies homogeneously [22], while avoid-ing crystal damages, which is ideal for NV ensembles.Moreover, the electron irradiation can realize a penetrationdepth up to millimeters [47], which ensures the vacancycreation through the bulk diamond plate. The in-situ orsubsequent annealing then mobilises vacancies in the dia-mond [30, 40, 48, 49], which are trapped by P1 centers toform NV centers [18, 50, 51].
We applied e-beam irradiation and subsequent anneal-ing to further create NV centers in our nitrogen-dopedCVD diamonds, enhancing the NV/P1 ratio, while notexpecting a shortening in coherence time T2, since it is lim-ited by the total nitrogen concentration in the diamond,which should be consistent. In this sense, the irradiationcondition should be optimized to maximize the P1 to NV−
conversion rate: when a P1 center and a vacancy com-bine into an NV center, it then needs other P1 centersas the donor to provide an electron to charge NV− [52–55]. Consequently, when large amounts of P1 centers areconverted to NV centers, an insufficient remaining P1 con-centration potentially leads to more NV0 formation ratherthan NV−. The NV0 center is detrimental for two reasons:firstly it cannot be used for sensing and thus contributes asa fluorescence background that weakens the ODMR con-trast [31], thus reduces the sensitivity (Eq. 1); secondly,more NV0 indicates a lack of electron availability, whichleads to stronger photo-ionisation [56], i.e. more NV− isconverted into NV0 when pumped with green light. In con-clusion, high NV−/P1 and NV−/NV ratios are the two keyfactors while optimizing irradiation.
The irradiation fluence influences the vacancy concen-tration linearly [47], consequently, diamonds with differentP1 concentrations call for different optimal irradiation flu-ences. We investigated this optimum for diamonds with afixed P1 density, by irradiating them with varying irradia-tion fluences and energies. Throughout studies of their NVconcentrations, NV charge state distributions and defect
6

transformations, we suggested general rules to determineoptimal irradiation fluences for different P1 densities. Fur-thermore, by optimizing the irradiation condition, we cancombine enhanced NV− concentrations with long coher-ence times to achieve improved sensitivities.
3.2.1. Optimizing irradiation fluence for NV creation
To optimize the e-beam irradiation, and to under-stand how the fluence and energy influence the NV cre-ation, we have grown the two irradiation series with fixedgrowth parameters, which showed high PL consistency af-ter growth (Fig. 5a). The P1 concentration of the series,estimated from the UV-Vis spectrum, is also consistentwith ∼2.2 ppm. The two series have been irradiated withrespectively 2 MeV and 1 MeV electrons at the room tem-perature, with varying fluences (Fig. 5). The annealingwas performed after irradiation 1000 ◦C for 2 h in vacuum(Sec. 2.1). Additionally, we irradiated four HPHT dia-monds (Element Six, P1>20 ppm) with 1 MeV electrons,as an extension of our study for higher P1 concentrations.
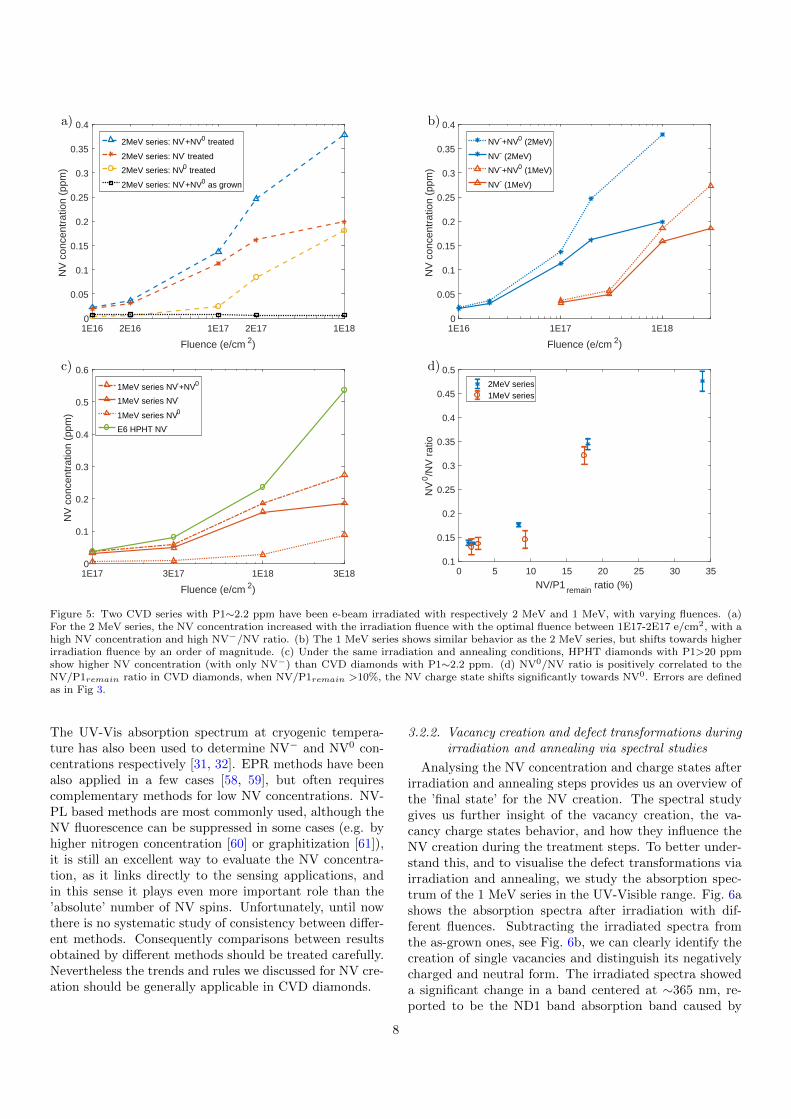
after treatment, for both the 2 MeV and 1 MeV series,the total NV concentration increased significantly, posi-tively correlated to the irradiation fluence, with strongvariations on the NV charge state distribution (Fig. 5). Forthe 2 MeV series, we can see the expected transition start-ing from 1E17 e/cm2 where NV− creation saturates andmostly NV0 is produced with increasing fluence (Fig. 5a).Around 1E17-2E17 e/cm2 seems to be the optimal pointwith still enough P1 centers in the diamond to charge NVcenters, but no excess which is positive for longer coher-ence times. The highest P1 to NV- conversion rate inthis series was ∼8.9% for 1E18 e/cm2, however a poorNV−/NV ratio of only 53% was achieved. For 2E17 e/cm2
the P1 to NV- ratio was ∼7.3%, maintaining an NV−/NVratio of 66%, indicating better robustness against photo-ionization.
The 1 MeV series showed similar behavior in NV con-centration and charge states, but shifted towards higherfluence by an order of magnitude (Fig. 5b), the optimumthen shifted to a range in 1-3E18 e/cm2. This strong in-fluence of the electron energy is in contrast to theoreticalcalculations [47] which predict that the 2MeV irradiationwith 1E17 e/cm2 creates roughly 1.1 ppm vacancies, whilefor 1 MeV it is 0.9 ppm with the same fluence, the va-cancy concentrations differ slightly but not by an orderof magnitude. Experimentally, our results clearly contra-dict this and show that the question of the influence ofelectron energy on vacancy creation needs to be reconsid-ered. However we point out that the two different energieswere performed at different facilities and suggest studiesof varying energies in the same facility for future studies.
For the same irradiation conditions, the NV concentra-tion also depends on the initial P1 concentration: as inFig. 5c, HPHT Ib diamonds showed higher NV concen-tration (with only NV−) than the CVD series, since theycontained more initial P1 centers before irradiation. This
indicates that the vacancies created via irradiation werenot fully converted into NV centers in the CVD series.However, the deviation between the HPHT series and theCVD series is small at low fluences and only becomes sig-nificant when the NV creation reaches a point where it islimited by the overall P1 availability.
In Sec. 3.1.1 we have discussed vacancy-limited NVcharge state distribution after CVD growth, as much fewervacancies than P1 centers were in the diamond. After irra-diation, we went to the point that the vacancy concentra-tion (up to ∼30 ppm for 3E18 e/cm2 with 1MeV) was inthe same order with–or even higher than–the P1 concen-tration (2.2 ppm), vacancies have not been fully convertedafter annealing and the NV creation was P1-limited. SinceNV− centers are charged by P1 centers, we suspected thatthe NV−/NV ratio is dependent on the remaining P1 cen-ters after conversion to charge the NV centers. As sup-port, for the two CVD irradiation series, we measured theP1 concentration twice, as after growth [P1grown] and af-ter irradiation and annealing [P1remain]. After treatment,the NV−/NV ratio seems in fact to be determined by theratio Rre=NV/P1remain, independent of irradiation flu-ence or energy (Fig. 5d). When Rre >10%, the NV0 ratiostarts to increase largely. As P1grown is partially con-verted to NV centers (and possibly other defects) duringthe treatment, [P1remain] as the final state is always lessthan [P1grown]. The conversion rate from P1grown to NVcenters after treatment, denoted as Rcon=NV/P1grown, al-ways fulfills Rcon < Rre, consequently Rcon <10% is re-quired to achieve NV0/NV<20%. Given that the photo-ionization can be largely promoted by higher green laserpower, the NV0/NV ratios we measured here with lowerlaser power (10 µW confocal) represent the intrinsic NV-charge-state distribution and usually get worse at highpower densities. Therefore to achieve a high charge statestability, we take Rcon <10% as an important criteria forthe fabrication.
Another criteria that might be interesting for some ap-plications is Rre ∼35%, for which half of NV centers will bein the neutral form NV0. This means to remain NV− dom-inated, Rre < 35% is required. For an initial P1 concen-tration of 2.2 ppm, the optimum can be set depending ondifferent purposes. When focusing on the NV-charge-statestability, we would suggest an optimum of 1E17 e/cm2
with 2MeV electron, or 1E18 e/cm2 with 1MeV electron,resulting an NV−/NV ratio of ∼82-86%. When focus-ing on the total NV creation, the optimum can be setto 2E17 e/cm2 with 2MeV electron, or 3E18 e/cm2 with1MeV electron, resulting an P1grown to NV− conversionrate R−
con of ∼7.3-8.4% while remaining an NV−/NV ratioof ∼66-68%. (More details see Table. 1)
We have also noticed that previous works have applieddifferent methods to determine the NV concentration. PLmeasurements are often applied with different calibrationmethods, for example comparing the NV-PL intensity witha single NV center [29, 57], or calibrating the NV-PL withthe absorption cross-section (as applied in this work) [30].
7
1E16 2E16 1E17 2E17 1E18
Fluence (e/cm 2)
0
0.05
0.1
0.15
0.2
0.25
0.3
0.35
0.4
NV
con
cent
ratio
n (p
pm)
2MeV series: NV-+NV0 treated
2MeV series: NV- treated
2MeV series: NV0 treated
2MeV series: NV-+NV0 as grown
a)
1E16 1E17 1E18
Fluence (e/cm 2)
0
0.05
0.1
0.15
0.2
0.25
0.3
0.35
0.4
NV
con
cent
ratio
n (p
pm)
NV-+NV0 (2MeV)
NV- (2MeV)
NV-+NV0 (1MeV)
NV- (1MeV)
b)
1E17 3E17 1E18 3E18
Fluence (e/cm 2)
0
0.1
0.2
0.3
0.4
0.5
0.6
NV
con
cent
ratio
n (p
pm)
1MeV series NV-+NV0
1MeV series NV-
1MeV series NV0
E6 HPHT NV-
c)
0 5 10 15 20 25 30 35
NV/P1 remain ratio (%)
0.1
0.15
0.2
0.25
0.3
0.35
0.4
0.45
0.5
NV
0 /NV
rat
io
2MeV series1MeV series
d)
Figure 5: Two CVD series with P1∼2.2 ppm have been e-beam irradiated with respectively 2 MeV and 1 MeV, with varying fluences. (a)For the 2 MeV series, the NV concentration increased with the irradiation fluence with the optimal fluence between 1E17-2E17 e/cm2, with ahigh NV concentration and high NV−/NV ratio. (b) The 1 MeV series shows similar behavior as the 2 MeV series, but shifts towards higherirradiation fluence by an order of magnitude. (c) Under the same irradiation and annealing conditions, HPHT diamonds with P1>20 ppmshow higher NV concentration (with only NV−) than CVD diamonds with P1∼2.2 ppm. (d) NV0/NV ratio is positively correlated to theNV/P1remain ratio in CVD diamonds, when NV/P1remain >10%, the NV charge state shifts significantly towards NV0. Errors are definedas in Fig 3.
The UV-Vis absorption spectrum at cryogenic tempera-ture has also been used to determine NV− and NV0 con-centrations respectively [31, 32]. EPR methods have beenalso applied in a few cases [58, 59], but often requirescomplementary methods for low NV concentrations. NV-PL based methods are most commonly used, although theNV fluorescence can be suppressed in some cases (e.g. byhigher nitrogen concentration [60] or graphitization [61]),it is still an excellent way to evaluate the NV concentra-tion, as it links directly to the sensing applications, andin this sense it plays even more important role than the’absolute’ number of NV spins. Unfortunately, until nowthere is no systematic study of consistency between differ-ent methods. Consequently comparisons between resultsobtained by different methods should be treated carefully.Nevertheless the trends and rules we discussed for NV cre-ation should be generally applicable in CVD diamonds.
3.2.2. Vacancy creation and defect transformations duringirradiation and annealing via spectral studies
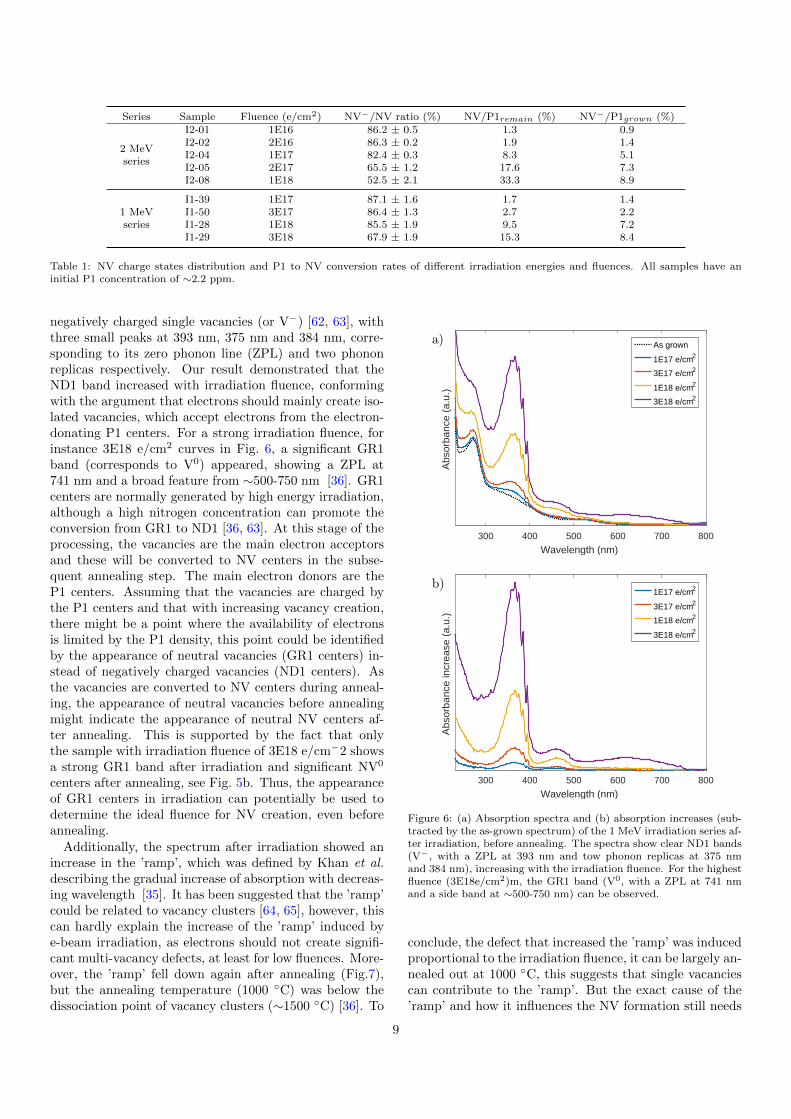
Analysing the NV concentration and charge states afterirradiation and annealing steps provides us an overview ofthe ’final state’ for the NV creation. The spectral studygives us further insight of the vacancy creation, the va-cancy charge states behavior, and how they influence theNV creation during the treatment steps. To better under-stand this, and to visualise the defect transformations viairradiation and annealing, we study the absorption spec-trum of the 1 MeV series in the UV-Visible range. Fig. 6ashows the absorption spectra after irradiation with dif-ferent fluences. Subtracting the irradiated spectra fromthe as-grown ones, see Fig. 6b, we can clearly identify thecreation of single vacancies and distinguish its negativelycharged and neutral form. The irradiated spectra showeda significant change in a band centered at ∼365 nm, re-ported to be the ND1 band absorption band caused by
8
Series Sample Fluence (e/cm2) NV−/NV ratio (%) NV/P1remain (%) NV−/P1grown (%)
2 MeVseries
I2-01 1E16 86.2 ± 0.5 1.3 0.9I2-02 2E16 86.3 ± 0.2 1.9 1.4I2-04 1E17 82.4 ± 0.3 8.3 5.1I2-05 2E17 65.5 ± 1.2 17.6 7.3I2-08 1E18 52.5 ± 2.1 33.3 8.9
1 MeVseries
I1-39 1E17 87.1 ± 1.6 1.7 1.4I1-50 3E17 86.4 ± 1.3 2.7 2.2I1-28 1E18 85.5 ± 1.9 9.5 7.2I1-29 3E18 67.9 ± 1.9 15.3 8.4
Table 1: NV charge states distribution and P1 to NV conversion rates of different irradiation energies and fluences. All samples have aninitial P1 concentration of ∼2.2 ppm.
negatively charged single vacancies (or V−) [62, 63], withthree small peaks at 393 nm, 375 nm and 384 nm, corre-sponding to its zero phonon line (ZPL) and two phononreplicas respectively. Our result demonstrated that theND1 band increased with irradiation fluence, conformingwith the argument that electrons should mainly create iso-lated vacancies, which accept electrons from the electron-donating P1 centers. For a strong irradiation fluence, forinstance 3E18 e/cm2 curves in Fig. 6, a significant GR1band (corresponds to V0) appeared, showing a ZPL at741 nm and a broad feature from ∼500-750 nm [36]. GR1centers are normally generated by high energy irradiation,although a high nitrogen concentration can promote theconversion from GR1 to ND1 [36, 63]. At this stage of theprocessing, the vacancies are the main electron acceptorsand these will be converted to NV centers in the subse-quent annealing step. The main electron donors are theP1 centers. Assuming that the vacancies are charged bythe P1 centers and that with increasing vacancy creation,there might be a point where the availability of electronsis limited by the P1 density, this point could be identifiedby the appearance of neutral vacancies (GR1 centers) in-stead of negatively charged vacancies (ND1 centers). Asthe vacancies are converted to NV centers during anneal-ing, the appearance of neutral vacancies before annealingmight indicate the appearance of neutral NV centers af-ter annealing. This is supported by the fact that onlythe sample with irradiation fluence of 3E18 e/cm−2 showsa strong GR1 band after irradiation and significant NV0
centers after annealing, see Fig. 5b. Thus, the appearanceof GR1 centers in irradiation can potentially be used todetermine the ideal fluence for NV creation, even beforeannealing.
Additionally, the spectrum after irradiation showed anincrease in the ’ramp’, which was defined by Khan et al.describing the gradual increase of absorption with decreas-ing wavelength [35]. It has been suggested that the ’ramp’could be related to vacancy clusters [64, 65], however, thiscan hardly explain the increase of the ’ramp’ induced bye-beam irradiation, as electrons should not create signifi-cant multi-vacancy defects, at least for low fluences. More-over, the ’ramp’ fell down again after annealing (Fig.7),but the annealing temperature (1000 ◦C) was below thedissociation point of vacancy clusters (∼1500 ◦C) [36]. To
300 400 500 600 700 800
Wavelength (nm)
Abs
orba
nce
(a.u
.)
As grown
1E17 e/cm2
3E17 e/cm2
1E18 e/cm2
3E18 e/cm2
a)
300 400 500 600 700 800
Wavelength (nm)
Abs
orba
nce
incr
ease
(a.
u.)
1E17 e/cm2
3E17 e/cm2
1E18 e/cm2
3E18 e/cm2
b)
Figure 6: (a) Absorption spectra and (b) absorption increases (sub-tracted by the as-grown spectrum) of the 1 MeV irradiation series af-ter irradiation, before annealing. The spectra show clear ND1 bands(V−, with a ZPL at 393 nm and tow phonon replicas at 375 nmand 384 nm), increasing with the irradiation fluence. For the highestfluence (3E18e/cm2)m, the GR1 band (V0, with a ZPL at 741 nmand a side band at ∼500-750 nm) can be observed.
conclude, the defect that increased the ’ramp’ was inducedproportional to the irradiation fluence, it can be largely an-nealed out at 1000 ◦C, this suggests that single vacanciescan contribute to the ’ramp’. But the exact cause of the’ramp’ and how it influences the NV formation still needs
9
further investigation. Furthermore, a center with ZPL at489 nm (and a phonon side band centered at ∼460 nm) ap-peared after irradiation. The 489 nm center was attributedto a defect containing nitrogen atom bound to interstitialcarbon atoms [66, 67], after annealing it vanished due toits low-temperature-stability [63].
300 400 500 600 700 800
Wavelength (nm)
Abs
orba
nce
(a.u
.)
As grown
1E17 e/cm2 (annealed)
3E17 e/cm2 (annealed)
1E18 e/cm2 (annealed)
3E18 e/cm2 (annealed)
a)
300 400 500 600 700 800
Wavelength (nm)
Abs
orba
nce
incr
ease
(a.
u.)
1E17 e/cm2 (annealed)
3E17 e/cm2 (annealed)
1E18 e/cm2 (annealed)
3E18 e/cm2 (annealed)
b)
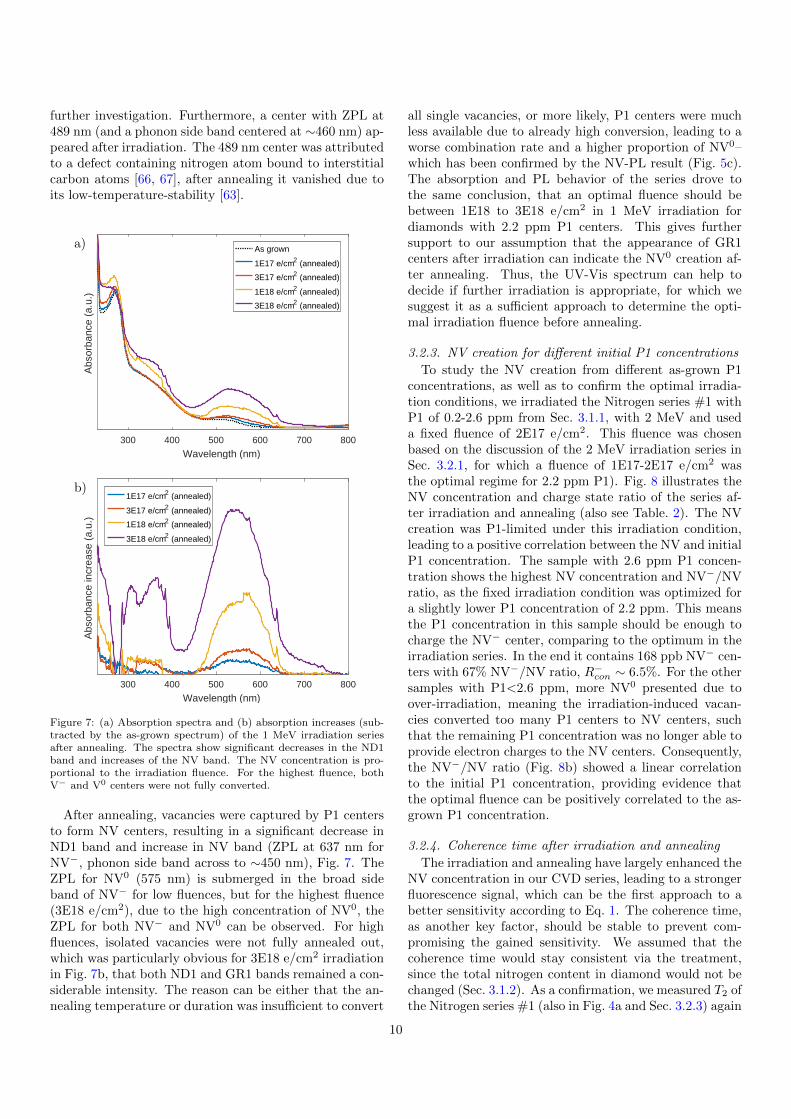
Figure 7: (a) Absorption spectra and (b) absorption increases (sub-tracted by the as-grown spectrum) of the 1 MeV irradiation seriesafter annealing. The spectra show significant decreases in the ND1band and increases of the NV band. The NV concentration is pro-portional to the irradiation fluence. For the highest fluence, bothV− and V0 centers were not fully converted.
After annealing, vacancies were captured by P1 centersto form NV centers, resulting in a significant decrease inND1 band and increase in NV band (ZPL at 637 nm forNV−, phonon side band across to ∼450 nm), Fig. 7. TheZPL for NV0 (575 nm) is submerged in the broad sideband of NV− for low fluences, but for the highest fluence(3E18 e/cm2), due to the high concentration of NV0, theZPL for both NV− and NV0 can be observed. For highfluences, isolated vacancies were not fully annealed out,which was particularly obvious for 3E18 e/cm2 irradiationin Fig. 7b, that both ND1 and GR1 bands remained a con-siderable intensity. The reason can be either that the an-nealing temperature or duration was insufficient to convert
all single vacancies, or more likely, P1 centers were muchless available due to already high conversion, leading to aworse combination rate and a higher proportion of NV0–which has been confirmed by the NV-PL result (Fig. 5c).The absorption and PL behavior of the series drove tothe same conclusion, that an optimal fluence should bebetween 1E18 to 3E18 e/cm2 in 1 MeV irradiation fordiamonds with 2.2 ppm P1 centers. This gives furthersupport to our assumption that the appearance of GR1centers after irradiation can indicate the NV0 creation af-ter annealing. Thus, the UV-Vis spectrum can help todecide if further irradiation is appropriate, for which wesuggest it as a sufficient approach to determine the opti-mal irradiation fluence before annealing.
3.2.3. NV creation for different initial P1 concentrations
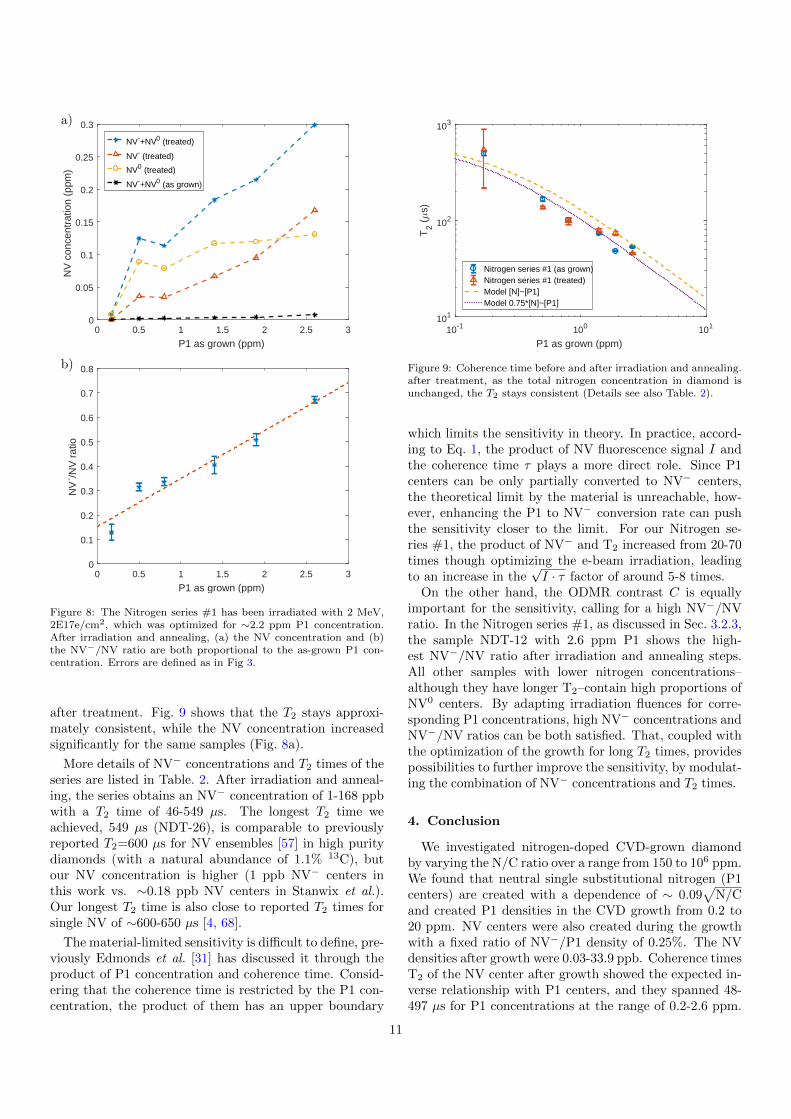
To study the NV creation from different as-grown P1concentrations, as well as to confirm the optimal irradia-tion conditions, we irradiated the Nitrogen series #1 withP1 of 0.2-2.6 ppm from Sec. 3.1.1, with 2 MeV and useda fixed fluence of 2E17 e/cm2. This fluence was chosenbased on the discussion of the 2 MeV irradiation series inSec. 3.2.1, for which a fluence of 1E17-2E17 e/cm2 wasthe optimal regime for 2.2 ppm P1). Fig. 8 illustrates theNV concentration and charge state ratio of the series af-ter irradiation and annealing (also see Table. 2). The NVcreation was P1-limited under this irradiation condition,leading to a positive correlation between the NV and initialP1 concentration. The sample with 2.6 ppm P1 concen-tration shows the highest NV concentration and NV−/NVratio, as the fixed irradiation condition was optimized fora slightly lower P1 concentration of 2.2 ppm. This meansthe P1 concentration in this sample should be enough tocharge the NV− center, comparing to the optimum in theirradiation series. In the end it contains 168 ppb NV− cen-ters with 67% NV−/NV ratio, R−
con ∼ 6.5%. For the othersamples with P1<2.6 ppm, more NV0 presented due toover-irradiation, meaning the irradiation-induced vacan-cies converted too many P1 centers to NV centers, suchthat the remaining P1 concentration was no longer able toprovide electron charges to the NV centers. Consequently,the NV−/NV ratio (Fig. 8b) showed a linear correlationto the initial P1 concentration, providing evidence thatthe optimal fluence can be positively correlated to the as-grown P1 concentration.
3.2.4. Coherence time after irradiation and annealing
The irradiation and annealing have largely enhanced theNV concentration in our CVD series, leading to a strongerfluorescence signal, which can be the first approach to abetter sensitivity according to Eq. 1. The coherence time,as another key factor, should be stable to prevent com-promising the gained sensitivity. We assumed that thecoherence time would stay consistent via the treatment,since the total nitrogen content in diamond would not bechanged (Sec. 3.1.2). As a confirmation, we measured T2 ofthe Nitrogen series #1 (also in Fig. 4a and Sec. 3.2.3) again
10
0 0.5 1 1.5 2 2.5 3
P1 as grown (ppm)
0
0.05
0.1
0.15
0.2
0.25
0.3
NV
con
cent
ratio
n (p
pm)
NV-+NV0 (treated)
NV- (treated)
NV0 (treated)
NV-+NV0 (as grown)
a)
0 0.5 1 1.5 2 2.5 3
P1 as grown (ppm)
0
0.1
0.2
0.3
0.4
0.5
0.6
0.7
0.8
NV
- /NV
rat
io
b)
Figure 8: The Nitrogen series #1 has been irradiated with 2 MeV,2E17e/cm2, which was optimized for ∼2.2 ppm P1 concentration.After irradiation and annealing, (a) the NV concentration and (b)the NV−/NV ratio are both proportional to the as-grown P1 con-centration. Errors are defined as in Fig 3.
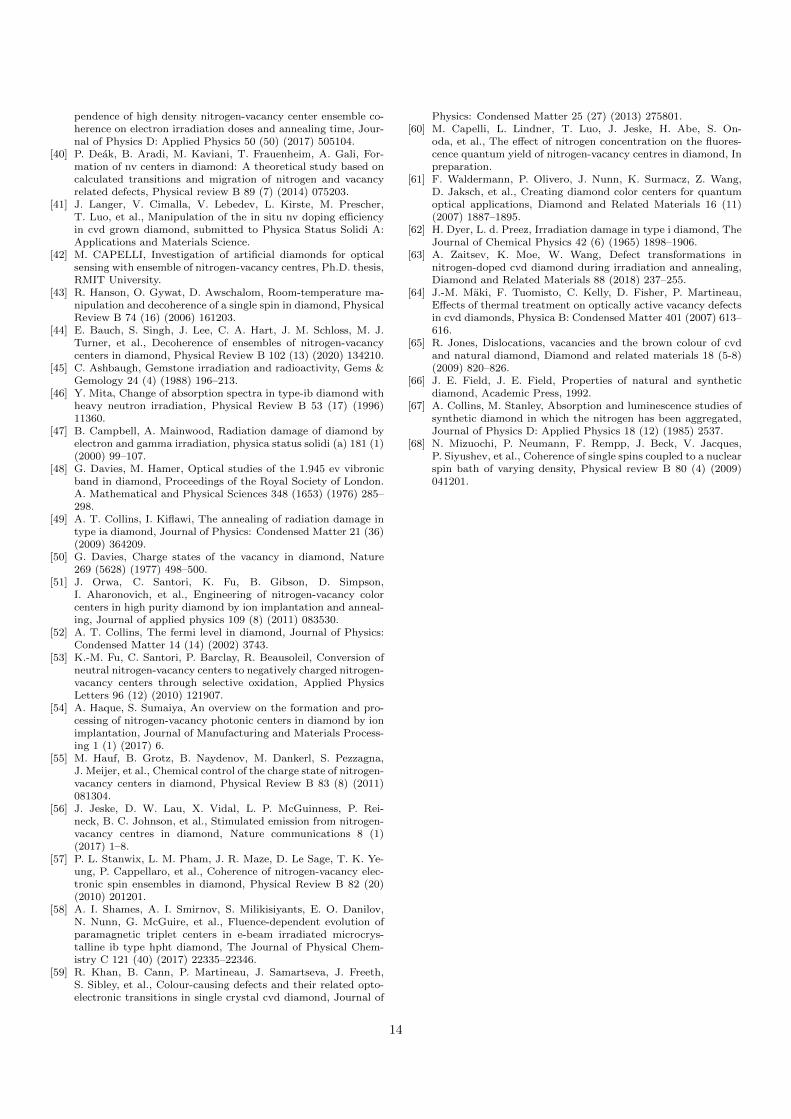
after treatment. Fig. 9 shows that the T2 stays approxi-mately consistent, while the NV concentration increasedsignificantly for the same samples (Fig. 8a).
More details of NV− concentrations and T2 times of theseries are listed in Table. 2. After irradiation and anneal-ing, the series obtains an NV− concentration of 1-168 ppbwith a T2 time of 46-549 µs. The longest T2 time weachieved, 549 µs (NDT-26), is comparable to previouslyreported T2=600 µs for NV ensembles [57] in high puritydiamonds (with a natural abundance of 1.1% 13C), butour NV concentration is higher (1 ppb NV− centers inthis work vs. ∼0.18 ppb NV centers in Stanwix et al.).Our longest T2 time is also close to reported T2 times forsingle NV of ∼600-650 µs [4, 68].
The material-limited sensitivity is difficult to define, pre-viously Edmonds et al. [31] has discussed it through theproduct of P1 concentration and coherence time. Consid-ering that the coherence time is restricted by the P1 con-centration, the product of them has an upper boundary
10-1 100 101
P1 as grown (ppm)
101
102
103
T2 (
s)
Nitrogen series #1 (as grown)Nitrogen series #1 (treated)Model [N]~[P1]Model 0.75*[N]~[P1]
Figure 9: Coherence time before and after irradiation and annealing.after treatment, as the total nitrogen concentration in diamond isunchanged, the T2 stays consistent (Details see also Table. 2).
which limits the sensitivity in theory. In practice, accord-ing to Eq. 1, the product of NV fluorescence signal I andthe coherence time τ plays a more direct role. Since P1centers can be only partially converted to NV− centers,the theoretical limit by the material is unreachable, how-ever, enhancing the P1 to NV− conversion rate can pushthe sensitivity closer to the limit. For our Nitrogen se-ries #1, the product of NV− and T2 increased from 20-70times though optimizing the e-beam irradiation, leadingto an increase in the
√I · τ factor of around 5-8 times.
On the other hand, the ODMR contrast C is equallyimportant for the sensitivity, calling for a high NV−/NVratio. In the Nitrogen series #1, as discussed in Sec. 3.2.3,the sample NDT-12 with 2.6 ppm P1 shows the high-est NV−/NV ratio after irradiation and annealing steps.All other samples with lower nitrogen concentrations–although they have longer T2–contain high proportions ofNV0 centers. By adapting irradiation fluences for corre-sponding P1 concentrations, high NV− concentrations andNV−/NV ratios can be both satisfied. That, coupled withthe optimization of the growth for long T2 times, providespossibilities to further improve the sensitivity, by modulat-ing the combination of NV− concentrations and T2 times.
4. Conclusion
We investigated nitrogen-doped CVD-grown diamondby varying the N/C ratio over a range from 150 to 106 ppm.We found that neutral single substitutional nitrogen (P1centers) are created with a dependence of ∼ 0.09
√N/C
and created P1 densities in the CVD growth from 0.2 to20 ppm. NV centers were also created during the growthwith a fixed ratio of NV−/P1 density of 0.25%. The NVdensities after growth were 0.03-33.9 ppb. Coherence timesT2 of the NV center after growth showed the expected in-verse relationship with P1 centers, and they spanned 48-497 µs for P1 concentrations at the range of 0.2-2.6 ppm.
11

Series SampleN/C ratio
(ppm)As-grownP1 (ppm)
As-grownNV− (ppb)
TreatedNV− (ppb)
TreatedNV−/NV (%)
As-grown T2(µs)
Treated T2(µs)
Nitrogenseries #1
NDT-26 150 0.2 0.03 1 12.8 ± 1.7 497.7 ± 26.2 549 ± 332NDT-14 500 - 0.2 10 38.4 ± 3.3 288.9 ± 31.3 329.3 ± 101.8NDT-07 1500 0.5 1.5 36 31.6 ± 1.6 166.1 ± 8.7 136.9 ± 3.9NDT-34 2500 0.8 1.8 35 33.7 ± 3.0 101.3 ± 3.3 98.5 ± 7.1NDT-01 4500 1.4 2.4 67 40.5 ± 3.3 72.8 ± 1.5 79.1 ± 3.2NDT-02 7429 1.9 3.3 95 50.9 ± 2.3 48.2 ± 1.0 74.2 ± 3.4NDT-12 8500 2.6 6.4 168 67.2 ± 1.2 53.3 ± 1.4 45.5 ± 1.2
Nitrogenseries #2
Cas-40 9722 3.2 15.3Cas-48 42777 5.2 21.3Cas-68 77142 7.8 16.0Cas-44 87499 9.5 25.9Cas-51 173571 11.2 33.9Cas-49 347143 13.0 27.1Cas-50 694286 19.3 28.5
Table 2: NV creations and coherence times in nitrogen-varying CVD series. The ’treated’ data were acquired after irradiation with 2 MeV,1E17 e/cm2, then annealing at 1000 ◦C for 2h. Errors are defined as in Fig. 3 and Fig. 4.
For that range, we showed the coherence time as a func-tion of the P1 concentration. Comparing this to a previ-ous study where absolute nitrogen content was studied bySIMS, we found agreement if we assume that 75% of thenitrogen was in the form of P1 centers. The created rangeof NV densities and coherence times showed that as-grownnitrogen-doped CVD diamond can be used as a sufficientand reproducible sensing material.
We investigated and optimized the fluence of subsequenthigh-energy electron irradiation. We found that increasingirradiation fluence increases NV concentrations, however,there is a certain optimal point, above which more flu-ence creates mainly additional NV0 and hardly any moreNV−. This optimum for 2.2 ppm initial P1 was at 1E17-2E17 e/cm2 for 2 MeV and at 1E18-3E18 e/cm2 for 1MeVirradiation. With this optimum, we achieved a P1 to NV−
conversion rate ∼7-8%, with an NV−/NV ratio ∼66-86%.Since P1 centers are the main electron donors to chargethe NV centers, we interpret the creation of NV0 abovethe optimum as the conversion of too many P1 centers toNV centers, such that not enough P1 centers are left toprovide electrons to charge the NV center. Based on thismodel, we assume that the optimal fluence scales with theP1 density for similarly grown CVD diamonds. We alsofound that for CVD diamonds, the conversion rate fromas-grown P1 to NV centers should be smaller than 10%to fulfill an NV−/NV ratio above 80%. In the future,this might be overcome by co-doping with another electrondonor, for example phosphorous as a potential candidate.
Furthermore, we studied the absorption spectral behav-ior at the UV-Visible range to visually describe defecttransformations during irradiation and annealing. We ob-served the generation of V− centers (ND1 band) after irra-diation, scaling with the fluence. Neutral V0 centers (GR1band) were also formed for high fluences. After annealing,V− centers were largely converted, forming NV centersproportional to the irradiation fluence. We found that theappearance of the GR1 band after irradiation can be anindicator of the NV0 formation after annealing. This sup-
ports further to our model, that for over-irradiated sam-ples, the remaining P1 centers are not enough to chargevacancies (or NV centers), therefore neutral vacancies andlater neutral NV centers tend to form. From that, we pro-vided a novel approach from the UV-Vis absorption spec-trum to determine the optimal irradiation fluence, beforeannealing the sample.
Being treated with our irradiation and annealing pro-tocol, the coherence time T2 stay consistent. This meansthe irradiation/annealing provides significant advantagesfor sensing and sensitivity by increasing the NV densityand thus the signal strength without compromising theT2. After treatment, we achieved a combination between549 µs T2 with 1 ppb NV− and 45.5 µs with 168 ppb. Thelongest T2=549 µs is comparable to T2 reported previouslyfor single NV [4, 68], as well as for NV ensembles [57], butwith higher NV− concentration in our sample. Combin-ing the enhanced NV− concentration with long T2 is aninteresting pathway to improve sensitivities in sensing.
5. Acknowledgement
We thank Xavier Vidal, Arne Gotze, Oliver Ambacher,Brant Gibson, Philipp Reineck and Andrew Greentree forvaluable discussions. We thank Michael Ardner for cut-ting and polishing the diamond plates, Dorothee Luick forthe technical support of UV-Vis measurements, ShangjingLiu for the technical support of PL measurements, andSioe See Volaric for technical EPR assistance. The partof electron irradiation was carried out within the frame-work of QST Internal Research Initiative. T.L and J.Jacknowledge the funding by the German federal ministryfor education and research Bundesministerium fur Bil-dung und Forschung (BMBF) under Grant No. 13XP5063.B.C.J. acknowledges support from the ARC Centre of Ex-cellence for Quantum Computation and CommunicationTechnology (CE170100012). D.W. acknowledges the sup-port through an Australian Government Research Train-ing Program Scholarship. M.C. acknowledges funding
12

from the Asian Office of Aerospace Research and Develop-ment (FA2386-18-1-4056).
References
[1] I. Aharonovich, A. D. Greentree, S. Prawer, Diamond photonics,Nature Photonics 5 (7) (2011) 397–405.
[2] M. Doherty, F. Dolde, H. Fedder, F. Jelezko, J. Wrachtrup,N. Manson, et al., Theory of the ground-state spin of the nv-center in diamond, Physical Review B 85 (20) (2012) 205203.
[3] M. W. Doherty, N. B. Manson, P. Delaney, F. Jelezko,J. Wrachtrup, L. C. Hollenberg, The nitrogen-vacancy colourcentre in diamond, Physics Reports 528 (1) (2013) 1–45.
[4] J. R. Maze, P. L. Stanwix, J. S. Hodges, S. Hong, J. M. Taylor,P. Cappellaro, et al., Nanoscale magnetic sensing with an in-dividual electronic spin in diamond, Nature 455 (7213) (2008)644–647.
[5] H. Mamin, M. Kim, M. Sherwood, C. Rettner, K. Ohno,D. Awschalom, et al., Nanoscale nuclear magnetic resonancewith a nitrogen-vacancy spin sensor, Science 339 (6119) (2013)557–560.
[6] M. S. Grinolds, S. Hong, P. Maletinsky, L. Luan, M. D. Lukin,R. L. Walsworth, et al., Nanoscale magnetic imaging of a singleelectron spin under ambient conditions, Nature Physics 9 (4)(2013) 215–219.
[7] D. Le Sage, K. Arai, D. R. Glenn, S. J. DeVience, L. M. Pham,L. Rahn-Lee, et al., Optical magnetic imaging of living cells,Nature 496 (7446) (2013) 486–489.
[8] F. Dolde, H. Fedder, M. W. Doherty, T. Nobauer, F. Rempp,G. Balasubramanian, et al., Electric-field sensing using singlediamond spins, Nature Physics 7 (6) (2011) 459–463.
[9] F. Dolde, M. W. Doherty, J. Michl, I. Jakobi, B. Naydenov,S. Pezzagna, et al., Nanoscale detection of a single fundamentalcharge in ambient conditions using the nv- center in diamond,Physical review letters 112 (9) (2014) 097603.
[10] P. Ovartchaiyapong, K. W. Lee, B. A. Myers, A. C. B. Jayich,Dynamic strain-mediated coupling of a single diamond spin to amechanical resonator, Nature communications 5 (1) (2014) 1–6.
[11] J. Teissier, A. Barfuss, P. Appel, E. Neu, P. Maletinsky,Strain coupling of a nitrogen-vacancy center spin to a diamondmechanical oscillator, Physical review letters 113 (2) (2014)020503.
[12] V. M. Acosta, E. Bauch, M. P. Ledbetter, A. Waxman, L.-S.Bouchard, D. Budker, Temperature dependence of the nitrogen-vacancy magnetic resonance in diamond, Physical review letters104 (7) (2010) 070801.
[13] G. Kucsko, P. C. Maurer, N. Y. Yao, M. Kubo, H. J. Noh, P. K.Lo, et al., Nanometre-scale thermometry in a living cell, Nature500 (7460) (2013) 54–58.
[14] P. Neumann, I. Jakobi, F. Dolde, C. Burk, R. Reuter, G. Wald-herr, et al., High-precision nanoscale temperature sensing usingsingle defects in diamond, Nano letters 13 (6) (2013) 2738–2742.
[15] D. M. Toyli, F. Charles, D. J. Christle, V. V. Dobrovitski, D. D.Awschalom, Fluorescence thermometry enhanced by the quan-tum coherence of single spins in diamond, Proceedings of theNational Academy of Sciences 110 (21) (2013) 8417–8421.
[16] M. W. Doherty, V. V. Struzhkin, D. A. Simpson, L. P. McGuin-ness, Y. Meng, A. Stacey, et al., Electronic properties andmetrology applications of the diamond nv- center under pres-sure, Physical review letters 112 (4) (2014) 047601.
[17] J. Taylor, P. Cappellaro, L. Childress, L. Jiang, D. Budker,P. Hemmer, et al., High-sensitivity diamond magnetometer withnanoscale resolution, Nature Physics 4 (10) (2008) 810–816.
[18] V. M. Acosta, E. Bauch, M. P. Ledbetter, C. Santori, K.-M. Fu,P. E. Barclay, et al., Diamonds with a high density of nitrogen-vacancy centers for magnetometry applications, Physical Re-view B 80 (11) (2009) 115202.
[19] J. F. Barry, M. J. Turner, J. M. Schloss, D. R. Glenn, Y. Song,M. D. Lukin, et al., Optical magnetic detection of single-neuron
action potentials using quantum defects in diamond, Proceed-ings of the National Academy of Sciences 113 (49) (2016) 14133–14138.
[20] J. Jeske, J. H. Cole, A. D. Greentree, Laser threshold magne-tometry, New Journal of Physics 18 (1) (2016) 013015.
[21] D. Budker, M. Romalis, Optical magnetometry, Nature physics3 (4) (2007) 227–234.
[22] J. F. Barry, J. M. Schloss, E. Bauch, M. J. Turner, C. A.Hart, L. M. Pham, et al., Sensitivity optimization for nv-diamond magnetometry, Reviews of Modern Physics 92 (1)(2020) 015004.
[23] S. C. Lawson, D. Fisher, D. C. Hunt, M. E. Newton, On theexistence of positively charged single-substitutional nitrogen indiamond, Journal of Physics: Condensed Matter 10 (27) (1998)6171.
[24] R. Jones, J. Goss, P. Briddon, Acceptor level of nitrogen indiamond and the 270-nm absorption band, Physical Review B80 (3) (2009) 033205.
[25] E. Van Oort, M. Glasbeek, Optically detected low field elec-tron spin echo envelope modulations of fluorescent nv centers indiamond, Chemical physics 143 (1) (1990) 131–140.
[26] E. van Oort, M. Glasbeek, Fluorescence detected level-anticrossing and spin coherence of a localized triplet state indiamond, Chemical physics 152 (3) (1991) 365–373.
[27] R. Hanson, V. Dobrovitski, A. Feiguin, O. Gywat,D. Awschalom, Coherent dynamics of a single spin interact-ing with an adjustable spin bath, Science 320 (5874) (2008)352–355.
[28] L. Rondin, J.-P. Tetienne, T. Hingant, J.-F. Roch,P. Maletinsky, V. Jacques, Magnetometry with nitrogen-vacancy defects in diamond, Reports on progress in physics77 (5) (2014) 056503.
[29] C. Osterkamp, M. Mangold, J. Lang, P. Balasubramanian,T. Teraji, B. Naydenov, et al., Engineering preferentially-aligned nitrogen-vacancy centre ensembles in cvd grown dia-mond, Scientific reports 9 (1) (2019) 1–7.
[30] M. Capelli, A. Heffernan, T. Ohshima, H. Abe, J. Jeske,A. Hope, et al., Increased nitrogen-vacancy centre creation yieldin diamond through electron beam irradiation at high temper-ature, Carbon 143 (2019) 714–719.
[31] A. M. Edmonds, C. A. Hart, M. J. Turner, P.-O. Colard, J. M.Schloss, K. S. Olsson, et al., Characterisation of cvd diamondwith high concentrations of nitrogen for magnetic-field sensingapplications, Materials for Quantum Technology 1 (2) (2021)025001.
[32] O. Rubinas, V. Soshenko, S. Bolshedvorskii, A. Zeleneev,A. Galkin, S. Tarelkin, et al., Optimization of the coherenceproperties of diamond samples with an intermediate concentra-tion of nv centers, Results in Physics 21 (2021) 103845.
[33] T. Nobauer, K. Buczak, A. Angerer, S. Putz, G. Steinhauser,J. Akbarzadeh, et al., Creation of ensembles of nitrogen-vacancycenters in diamond by neutron and electron irradiation, arXivpreprint arXiv:1309.0453.
[34] M. Funer, C. Wild, P. Koidl, Novel microwave plasma reactorfor diamond synthesis, Applied Physics Letters 72 (10) (1998)1149–1151.
[35] R. U. A. Khan, P. M. Martineau, B. Cann, M. New-ton, D. Twitchen, Charge transfer effects, thermo and pho-tochromism in single crystal cvd synthetic diamond, Journalof Physics: Condensed Matter 21 (36) (2009) 364214.
[36] I. A. Dobrinets, V. G. Vins, A. M. Zaitsev, HPHT-treated dia-monds, Springer, 2016.
[37] R. Chapman, T. Plakhotnik, Quantitative luminescence mi-croscopy on nitrogen-vacancy centres in diamond: Saturationeffects under pulsed excitation, Chemical Physics Letters 507 (1-3) (2011) 190–194.
[38] G. Liaugaudas, G. Davies, K. Suhling, R. Khan, D. Evans, Lu-minescence lifetimes of neutral nitrogen-vacancy centres in syn-thetic diamond containing nitrogen, Journal of Physics: Con-densed Matter 24 (43) (2012) 435503.
[39] C. Zhang, H. Yuan, N. Zhang, L. Xu, B. Li, G. Cheng, et al., De-
13
pendence of high density nitrogen-vacancy center ensemble co-herence on electron irradiation doses and annealing time, Jour-nal of Physics D: Applied Physics 50 (50) (2017) 505104.
[40] P. Deak, B. Aradi, M. Kaviani, T. Frauenheim, A. Gali, For-mation of nv centers in diamond: A theoretical study based oncalculated transitions and migration of nitrogen and vacancyrelated defects, Physical review B 89 (7) (2014) 075203.
[41] J. Langer, V. Cimalla, V. Lebedev, L. Kirste, M. Prescher,T. Luo, et al., Manipulation of the in situ nv doping efficiencyin cvd grown diamond, submitted to Physica Status Solidi A:Applications and Materials Science.
[42] M. CAPELLI, Investigation of artificial diamonds for opticalsensing with ensemble of nitrogen-vacancy centres, Ph.D. thesis,RMIT University.
[43] R. Hanson, O. Gywat, D. Awschalom, Room-temperature ma-nipulation and decoherence of a single spin in diamond, PhysicalReview B 74 (16) (2006) 161203.
[44] E. Bauch, S. Singh, J. Lee, C. A. Hart, J. M. Schloss, M. J.Turner, et al., Decoherence of ensembles of nitrogen-vacancycenters in diamond, Physical Review B 102 (13) (2020) 134210.
[45] C. Ashbaugh, Gemstone irradiation and radioactivity, Gems &Gemology 24 (4) (1988) 196–213.
[46] Y. Mita, Change of absorption spectra in type-ib diamond withheavy neutron irradiation, Physical Review B 53 (17) (1996)11360.
[47] B. Campbell, A. Mainwood, Radiation damage of diamond byelectron and gamma irradiation, physica status solidi (a) 181 (1)(2000) 99–107.
[48] G. Davies, M. Hamer, Optical studies of the 1.945 ev vibronicband in diamond, Proceedings of the Royal Society of London.A. Mathematical and Physical Sciences 348 (1653) (1976) 285–298.
[49] A. T. Collins, I. Kiflawi, The annealing of radiation damage intype ia diamond, Journal of Physics: Condensed Matter 21 (36)(2009) 364209.
[50] G. Davies, Charge states of the vacancy in diamond, Nature269 (5628) (1977) 498–500.
[51] J. Orwa, C. Santori, K. Fu, B. Gibson, D. Simpson,I. Aharonovich, et al., Engineering of nitrogen-vacancy colorcenters in high purity diamond by ion implantation and anneal-ing, Journal of applied physics 109 (8) (2011) 083530.
[52] A. T. Collins, The fermi level in diamond, Journal of Physics:Condensed Matter 14 (14) (2002) 3743.
[53] K.-M. Fu, C. Santori, P. Barclay, R. Beausoleil, Conversion ofneutral nitrogen-vacancy centers to negatively charged nitrogen-vacancy centers through selective oxidation, Applied PhysicsLetters 96 (12) (2010) 121907.
[54] A. Haque, S. Sumaiya, An overview on the formation and pro-cessing of nitrogen-vacancy photonic centers in diamond by ionimplantation, Journal of Manufacturing and Materials Process-ing 1 (1) (2017) 6.
[55] M. Hauf, B. Grotz, B. Naydenov, M. Dankerl, S. Pezzagna,J. Meijer, et al., Chemical control of the charge state of nitrogen-vacancy centers in diamond, Physical Review B 83 (8) (2011)081304.
[56] J. Jeske, D. W. Lau, X. Vidal, L. P. McGuinness, P. Rei-neck, B. C. Johnson, et al., Stimulated emission from nitrogen-vacancy centres in diamond, Nature communications 8 (1)(2017) 1–8.
[57] P. L. Stanwix, L. M. Pham, J. R. Maze, D. Le Sage, T. K. Ye-ung, P. Cappellaro, et al., Coherence of nitrogen-vacancy elec-tronic spin ensembles in diamond, Physical Review B 82 (20)(2010) 201201.
[58] A. I. Shames, A. I. Smirnov, S. Milikisiyants, E. O. Danilov,N. Nunn, G. McGuire, et al., Fluence-dependent evolution ofparamagnetic triplet centers in e-beam irradiated microcrys-talline ib type hpht diamond, The Journal of Physical Chem-istry C 121 (40) (2017) 22335–22346.
[59] R. Khan, B. Cann, P. Martineau, J. Samartseva, J. Freeth,S. Sibley, et al., Colour-causing defects and their related opto-electronic transitions in single crystal cvd diamond, Journal of
Physics: Condensed Matter 25 (27) (2013) 275801.[60] M. Capelli, L. Lindner, T. Luo, J. Jeske, H. Abe, S. On-
oda, et al., The effect of nitrogen concentration on the fluores-cence quantum yield of nitrogen-vacancy centres in diamond, Inpreparation.
[61] F. Waldermann, P. Olivero, J. Nunn, K. Surmacz, Z. Wang,D. Jaksch, et al., Creating diamond color centers for quantumoptical applications, Diamond and Related Materials 16 (11)(2007) 1887–1895.
[62] H. Dyer, L. d. Preez, Irradiation damage in type i diamond, TheJournal of Chemical Physics 42 (6) (1965) 1898–1906.
[63] A. Zaitsev, K. Moe, W. Wang, Defect transformations innitrogen-doped cvd diamond during irradiation and annealing,Diamond and Related Materials 88 (2018) 237–255.
[64] J.-M. Maki, F. Tuomisto, C. Kelly, D. Fisher, P. Martineau,Effects of thermal treatment on optically active vacancy defectsin cvd diamonds, Physica B: Condensed Matter 401 (2007) 613–616.
[65] R. Jones, Dislocations, vacancies and the brown colour of cvdand natural diamond, Diamond and related materials 18 (5-8)(2009) 820–826.
[66] J. E. Field, J. E. Field, Properties of natural and syntheticdiamond, Academic Press, 1992.
[67] A. Collins, M. Stanley, Absorption and luminescence studies ofsynthetic diamond in which the nitrogen has been aggregated,Journal of Physics D: Applied Physics 18 (12) (1985) 2537.
[68] N. Mizuochi, P. Neumann, F. Rempp, J. Beck, V. Jacques,P. Siyushev, et al., Coherence of single spins coupled to a nuclearspin bath of varying density, Physical review B 80 (4) (2009)041201.
14