Embed Size (px)
Citation preview

1
Observation • Understanding • Action Your pathway to liveable cities
Creating Liveable Cities 2
Understanding the Australian Urban Observatory’s
Indicators and Scorecard
September 2020

auo.org.au
2
Creating Liveable Cities 2
Using the Australian Urban Observatory’s Indicators to Support Health and Wellbeing in your Community
Table of Contents
The Australian Urban Observatory 3
How do we create liveable cities? First, we must work out the key ingredients 3
The Global Context - UN Sustainable Development Goals 3
Defining liveability 4
A new digital planning tool 4
Key liveability indicators 4
Mapped to three levels of detail 5
Liveability 6
Walkability 7 Access to Services of Daily Living 8 Dwelling Density 9 Street Connectivity 10
Social Infrastructure 11
Transport 12
Food 13
Alcohol 14
Public Open Space 15
Employment 17
Housing 18
Indicator Metadata 19
AUO Score card 20
Liveability at your fingertips 22
Our impact in Mitchell Shire 22
Our key supporters 23
Contact us 23

auo.org.au
3
The Australian Urban Observatory The Australian Urban Observatory provides decision-makers and everyday citizens with the best urban liveability indicators to promote health and wellbeing in their communities, helping to prioritise actions that support healthy liveable cities across Australia.
How do we create liveable cities? First, we must work out the key ingredients We live in an urbanising world. Cities are increasing in prominence as major social and economic hubs. For such cities, liveability rankings and awards can provide welcome global recognition and marketing tools. The key question is: liveable for whom? While helpful at the broadest level, these rankings focus on the inner city, remuneration packages and economic productivity. The rankings mask intra-city inequities, to overcome this, our definition of liveability considers the underlying conditions that support health. We focus on equity and recognition that where you live can predict health outcomes and life expectancy. We have created liveability indicators that are linked
to urban, transport and infrastructure planning policy. We are guided by our understanding that health is influenced by individual personal factors, social and community supports and broader socioeconomic, cultural and
environmental conditions – known collectively as the social determinants of health. We need to build cities based on a clear and consistent definition of liveability. The goal is that it can be objectively measured and tracked over time using indicators that provide an understanding of each city’s strengths and challenges. A city built well is a healthy city that provides all residents (not just the fortunate few) with opportunities to live in areas with all the essential ingredients of a liveable community. It is a place that promotes healthy and happy people and community wellbeing – a place where people want to live. First published in The Conversation, 7th December 2015.
The Global Context - UN Sustainable Development Goals Globally there is a major commitment, with growing urgency, for countries and cities to prioritise health and wellbeing, reduce poverty, and support environmental resilience. Most recently, this agenda has been championed through the UN’s 17 Sustainable Development Goals, commonly known as the SDGs, which are embedded within the New Urban Agenda. These goals provide important frameworks for measuring and monitoring cities’ progress across a range of health and social outcomes. In parallel to the development of the SDGs, the aspiration of making cities more ‘liveable’ has become a key priority for many cities. The notion of urban liveability has been popularised by international liveability rankings, which can be used to guide business investment, tourism, and employee remuneration. In contrast to such city rankings, urban liveability frameworks developed from a public health perspective seek to identify the tangible aspects of urban policy and infrastructure which shape residents’ health and urban sustainability outcomes. This social determinant of health-centred definition is underpinned by the long-standing recognition that cities are a key setting that shapes population health, which is embodied in the WHO’s Healthy Cities movement and Ottawa Charter for Health Promotion. Liveability resonates with the SDGs, particularly Goal 11, which aims to ‘make cities inclusive, safe, resilient, and sustainable’. The Australian Urban Observaoty enables organisations to meet these goals through an understanding of practical steps cities need to take to achieve these outcomes. Our indicators provide clear guidance about specific urban policies and their trajectories, infrastructure, and investments required to achieve more sustainable outcomes, and how to prioritise of the ambitious aspirations laid out in the SDGs and the New Urban Agenda. Amanda Alderton, Carl Higgs, Melanie Davern, Iain Butterworth, Joana Correia, Kornsupha Nitvimol & Hannah Badland (2020) Measuring and monitoring liveability in a low-to-middle income country: a proof-of-concept for Bangkok, Thailand and lessons from an international partnership, Cities & Health, DOI: 10.1080/23748834.2020.1813537
auo.org.au
4
Defining liveability Our definition of liveability has been widely received and is included in the 2015-2019 and 2020-2023 Victorian Public Health and Wellbeing Plans, Plan Melbourne and the DELWP 20 Minute Neighborhoods planning strategy. The definition is based on an extensive literature review completed in 2012 with the key ingredients understood as important influences of health. We define a liveable place as somewhere that is: safe, attractive, inclusive, and environmentally sustainable; with affordable and diverse types of housing, public open space, local shops, health and community services, leisure and cultural opportunities; with opportunities for employment and education all accessible by convenient public transport, walking and cycling Lowe, M., Whitzman, C., Badland, H., Davern, M., Hes, D., Aye, L.,
Butterworth, I. and Giles-Corti, B. (2013), Liveable, healthy, sustainable: What are the key indicators for Melbourne neighbourhoods? Research Paper 1, Place, Health and Liveability Research Program, University of Melbourne
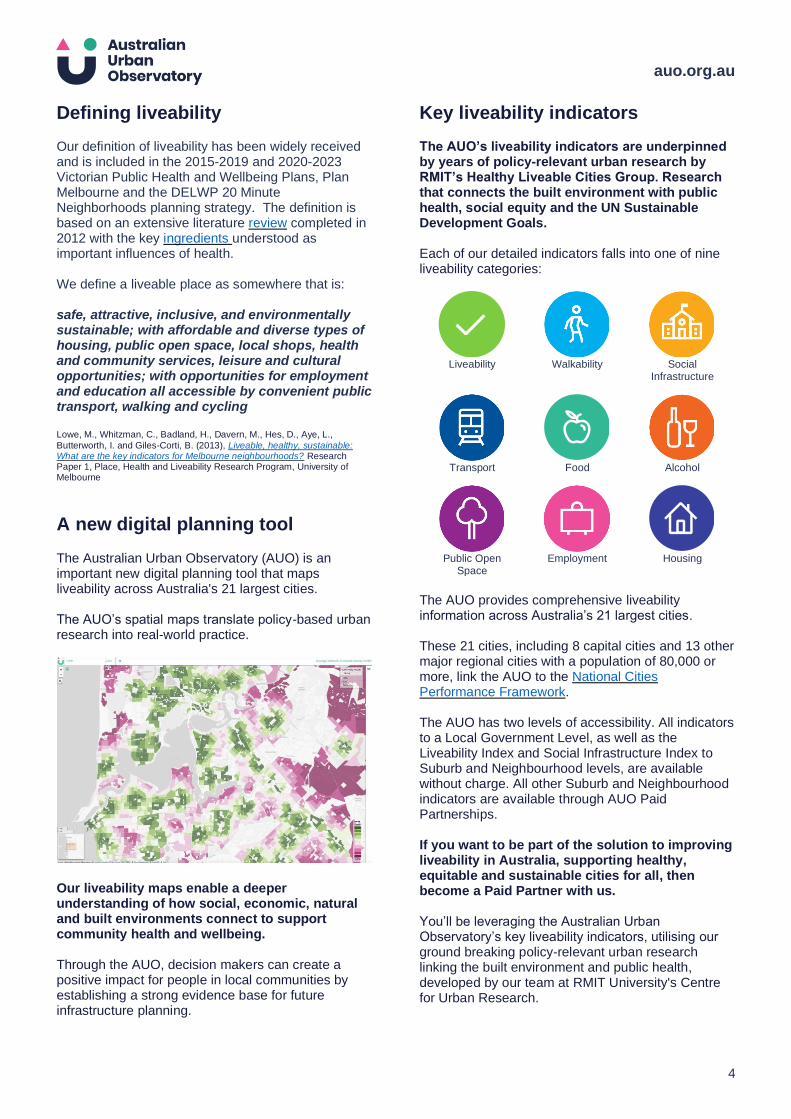
A new digital planning tool The Australian Urban Observatory (AUO) is an important new digital planning tool that maps liveability across Australia's 21 largest cities. The AUO’s spatial maps translate policy-based urban research into real-world practice.
Our liveability maps enable a deeper understanding of how social, economic, natural and built environments connect to support community health and wellbeing. Through the AUO, decision makers can create a positive impact for people in local communities by establishing a strong evidence base for future infrastructure planning.
Key liveability indicators The AUO’s liveability indicators are underpinned by years of policy-relevant urban research by RMIT’s Healthy Liveable Cities Group. Research that connects the built environment with public health, social equity and the UN Sustainable Development Goals. Each of our detailed indicators falls into one of nine liveability categories:
Liveability Walkability Social
Infrastructure
Transport Food Alcohol
Public Open
Space Employment Housing
The AUO provides comprehensive liveability information across Australia’s 21 largest cities. These 21 cities, including 8 capital cities and 13 other major regional cities with a population of 80,000 or more, link the AUO to the National Cities Performance Framework. The AUO has two levels of accessibility. All indicators to a Local Government Level, as well as the Liveability Index and Social Infrastructure Index to Suburb and Neighbourhood levels, are available without charge. All other Suburb and Neighbourhood indicators are available through AUO Paid Partnerships. If you want to be part of the solution to improving liveability in Australia, supporting healthy, equitable and sustainable cities for all, then become a Paid Partner with us. You’ll be leveraging the Australian Urban Observatory’s key liveability indicators, utilising our ground breaking policy-relevant urban research linking the built environment and public health, developed by our team at RMIT University's Centre for Urban Research.

auo.org.au
5
Mapped to three levels of detail Across Australia’s 21 largest cities our maps cover 170 Local Government Areas, 3,101 Suburbs and 39,967 Neighbourhoods (ABS SA1s). We can demonstrate liveability differences: Within cities
Within cities – suburbs
Within cities – neighbourhoods (SA1)
auo.org.au
6
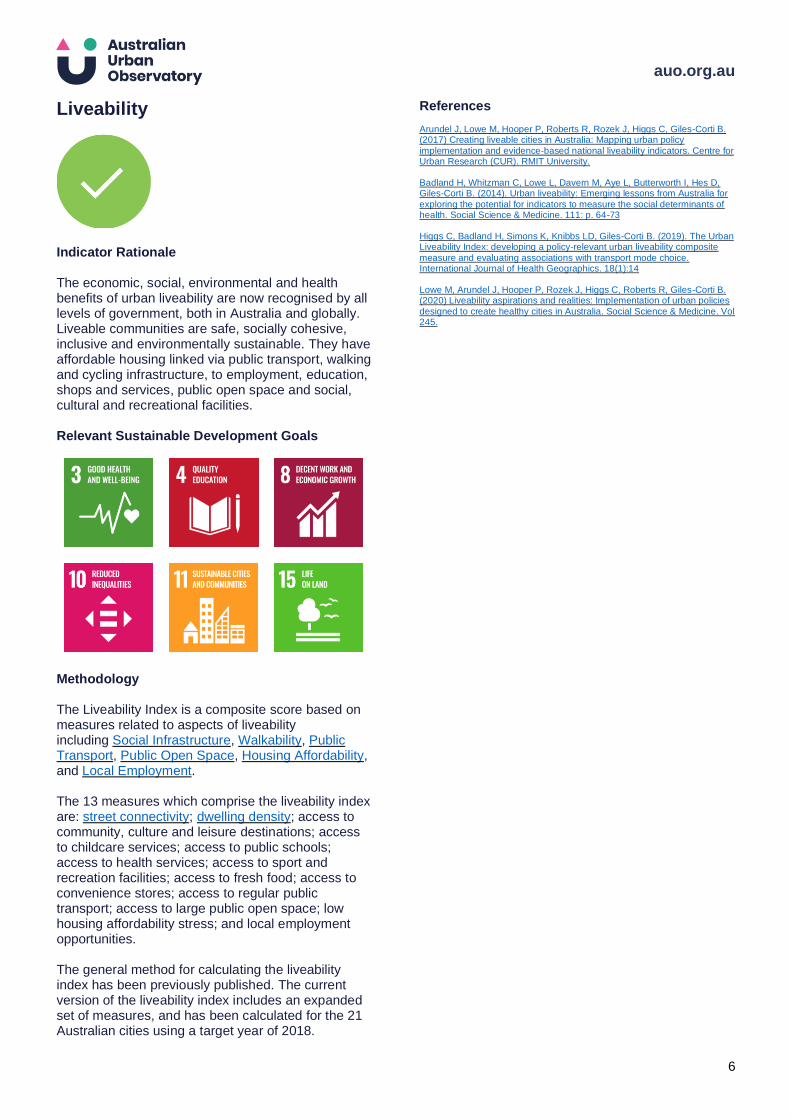
Liveability
Indicator Rationale The economic, social, environmental and health benefits of urban liveability are now recognised by all levels of government, both in Australia and globally. Liveable communities are safe, socially cohesive, inclusive and environmentally sustainable. They have affordable housing linked via public transport, walking and cycling infrastructure, to employment, education, shops and services, public open space and social, cultural and recreational facilities. Relevant Sustainable Development Goals
Methodology The Liveability Index is a composite score based on measures related to aspects of liveability including Social Infrastructure, Walkability, Public Transport, Public Open Space, Housing Affordability, and Local Employment. The 13 measures which comprise the liveability index are: street connectivity; dwelling density; access to community, culture and leisure destinations; access to childcare services; access to public schools; access to health services; access to sport and recreation facilities; access to fresh food; access to convenience stores; access to regular public transport; access to large public open space; low housing affordability stress; and local employment opportunities. The general method for calculating the liveability index has been previously published. The current version of the liveability index includes an expanded set of measures, and has been calculated for the 21 Australian cities using a target year of 2018.
References Arundel J, Lowe M, Hooper P, Roberts R, Rozek J, Higgs C, Giles-Corti B. (2017) Creating liveable cities in Australia: Mapping urban policy
implementation and evidence-based national liveability indicators. Centre for Urban Research (CUR). RMIT University. Badland H, Whitzman C, Lowe L, Davern M, Aye L, Butterworth I, Hes D, Giles-Corti B. (2014). Urban liveability: Emerging lessons from Australia for
exploring the potential for indicators to measure the social determinants of health. Social Science & Medicine. 111: p. 64-73 Higgs C, Badland H, Simons K, Knibbs LD, Giles-Corti B. (2019). The Urban Liveability Index: developing a policy-relevant urban liveability composite
measure and evaluating associations with transport mode choice. International Journal of Health Geographics. 18(1):14 Lowe M, Arundel J, Hooper P, Rozek J, Higgs C, Roberts R, Giles-Corti B. (2020) Liveability aspirations and realities: Implementation of urban policies
designed to create healthy cities in Australia. Social Science & Medicine. Vol 245.
auo.org.au
7
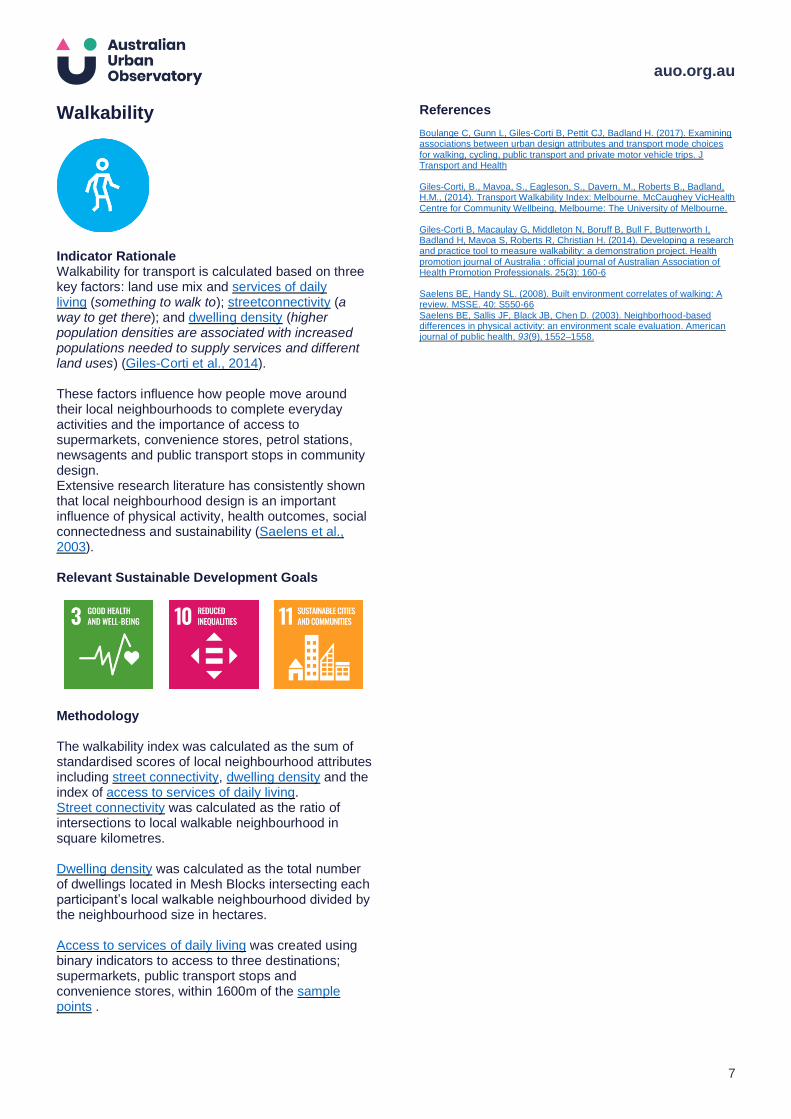
Walkability
Indicator Rationale Walkability for transport is calculated based on three key factors: land use mix and services of daily living (something to walk to); streetconnectivity (a way to get there); and dwelling density (higher population densities are associated with increased populations needed to supply services and different land uses) (Giles-Corti et al., 2014). These factors influence how people move around their local neighbourhoods to complete everyday activities and the importance of access to supermarkets, convenience stores, petrol stations, newsagents and public transport stops in community design. Extensive research literature has consistently shown that local neighbourhood design is an important influence of physical activity, health outcomes, social connectedness and sustainability (Saelens et al., 2003). Relevant Sustainable Development Goals
Methodology The walkability index was calculated as the sum of standardised scores of local neighbourhood attributes including street connectivity, dwelling density and the index of access to services of daily living. Street connectivity was calculated as the ratio of intersections to local walkable neighbourhood in square kilometres. Dwelling density was calculated as the total number of dwellings located in Mesh Blocks intersecting each participant’s local walkable neighbourhood divided by the neighbourhood size in hectares. Access to services of daily living was created using binary indicators to access to three destinations; supermarkets, public transport stops and convenience stores, within 1600m of the sample points .
References Boulange C, Gunn L, Giles-Corti B, Pettit CJ, Badland H. (2017). Examining associations between urban design attributes and transport mode choices
for walking, cycling, public transport and private motor vehicle trips. J Transport and Health Giles-Corti, B., Mavoa, S., Eagleson, S., Davern, M., Roberts B., Badland, H.M., (2014). Transport Walkability Index: Melbourne. McCaughey VicHealth
Centre for Community Wellbeing, Melbourne: The University of Melbourne. Giles-Corti B, Macaulay G, Middleton N, Boruff B, Bull F, Butterworth I, Badland H, Mavoa S, Roberts R, Christian H. (2014). Developing a research and practice tool to measure walkability: a demonstration project. Health
promotion journal of Australia : official journal of Australian Association of Health Promotion Professionals. 25(3): 160-6 Saelens BE, Handy SL. (2008). Built environment correlates of walking: A review. MSSE. 40: S550-66
Saelens BE, Sallis JF, Black JB, Chen D. (2003). Neighborhood-based differences in physical activity: an environment scale evaluation. American journal of public health, 93(9), 1552–1558.
auo.org.au
8
Access to Services of Daily Living
Indicator Rationale Liveable neighbourhoods have a range of essential shops and services within easy walking distance. Our definition of essential ‘daily living destinations’ includes three types of destinations:
Supermarkets (source of fresh, healthy food) Public transport stops (allow people to get to jobs, schools and other important places without relying on cars) Convenience (including convenience stores, newsagents and petrol stations- places where people can get basics like milk and a newspaper)
Having more of these daily living destinations close by allows people to meet their daily needs locally. Rather than driving, local and convenient facilities encourage walking or cycling which reduce the each individual’s risk of chronic diseases. Relevant Sustainable Development Goals
Measures
Average number of daily living destination types present within 1600m
Methodology To measure access to services of daily living, point data representing the location of supermarkets, public transport stops and convenience stores were used with a pedestrian road network and sample points. The index of access to services of daily living was created using a pedestrian road network, sample points and three destination types:
Supermarkets Public transport stops Convenience stores
The location of supermarkets and greengrocers was identified from five major supermarket chain
websites; Aldi, Coles, Foodworks, IGA and Woolworths. Three destination types were combined to create a ‘convenience store’ category. Pedestrian road network distances were calculated from each sample point to each type of daily living destination class and binary indicators were created to record the presence (=1) or absence (=0) of each destination type. A daily living index was created by summing the 3 binary indicators for each participant. Consequently, a maximum score of 3 represented the highest index of daily living with all types present. References Davern M, Roberts R, Higgs C. (2018). Neighbourhood Liveability in Benalla: Using Indicators to understand and plan for liveability in the town of Benalla. RMIT University, Melbourne, Australia
Higgs C, Badland H, Simons K, Knibbs LD, Giles-Corti B. (2019). The Urban Liveability Index: developing a policy-relevant urban liveability composite measure and evaluating associations with transport mode choice. International Journal of Health Geographics. 18(1):14
auo.org.au
9
Dwelling Density
Indicator Rationale A liveable, vibrant community requires a sufficient density of population to support local shops, jobs, public transport and other infrastructure. Having these amenities locally encourages people to walk and cycle, and discourages driving. Further, public transport is more viable in areas with higher population densities. Providing destinations and services within walking distance is less viable in sprawling suburbs with low dwelling densities. People living in low-density neighbourhoods with few local destinations are less likely to walk and more likely to drive. Relevant Sustainable Development Goals
Measures
Dwelling density Methodology A dwelling is a structure which is habitable and intended to have people live in it. Dwellings include houses, motels, flats, caravans, prisons, tents, humpies and houseboats. (ABS 2016). The 2016 Census dwelling counts by Mesh Block were downloaded from the ABS and linked to the Mesh Block digital boundaries using the Mesh Block code. Counts include all dwellings whether occupied or not. Dwelling density was calculated as the total number of dwellings located in 2016 ABS Mesh Blocks intersecting each participants’ local walkable neighbourhood divided by the neighbourhood size in hectares. References Forsyth A, Oakes J, Schmitz K, Hearst M. (2007). Does residential density increase walking and other physical activity? Urban Studies. 44:679–97
Giles-Corti B, Ryan K, Foster S. (2012). Increasing Density in Australia: Maximising the Health Benefits and Minimising Harm. Perth, Western Australia: National Heart Foundation of Australia
Glazier RH, Creatore MI, Weyman JT, Fazli G, Matheson FI, Gozdyra P, Moineddin R, Shriqui VK, Booth GL. (2014). Density, destinations or both? A comparison of measures of walkability in relation to transportation
behaviors, obesity and diabetes in Toronto, Canada. Plos One. 9(1):9
auo.org.au
10
Street Connectivity
Indicator Rationale Liveable neighbourhoods have a street network which promotes walking and cycling around the local area. Street connectivity describes how well connected streets are to each other and is typically measured as the density of intersections in a given area. Grid-style road layouts tend to have higher street connectivity as they provide residents with multiple direct and short routes between places. On the other hand, cul-de-sac and curvilinear layouts generally have lower street connectivity. This discourages walking and cycling because routes tend to be longer and less direct and there are fewer routes from which to choose. Relevant Sustainable Development Goals
Measures
Street connectivity
Methodology Street connectivity was calculated as the number of intersections of three or more streets per square kilometer in the local area, with the local area defined as the walkable road network within 1.6km, buffered by 50m. To calculate this measure, two datasets were used in the GIS analysis, a pedestrian road networkand sample points. Intersection points were derived from the pedestrian road network where three or more streets intersected. For each sample point, a 1.6km street network buffer was created to represent the local walkable neighbourhood based on the pedestrian road network. This dataset was created by selecting all walkable roads (or parts thereof) within 1.6km network distance of each sample point and buffering these roads by 50m on each side. The resulting dataset was a polygon feature for each sample point.
The GIS was used to calculate the area of each polygon in square kilometers and count the number of intersections within each. References Cerin E, Nathan A, van Cauwenberg J, Barnett DW, Barnett A, Council on Environment and Physical Activity (CEPA) – Older Adults working group.
(2017). The neighbourhood physical environment and active travel in older adults: a systematic review and meta-analysis. Int J Behav Nutr Phys Act, 14(1): p. 15 Kamruzzaman M, Washington S, Baker D, Brown W, Giles-Corti B, Turrell
G. (2016). Built environment impacts on walking for transport in Brisbane, Australia. Transportation, 43(1): p. 53-77 Koohsari MJ, Sugiyama T, Lamb KE, Villanueva K, Owen N. (2014). Street connectivity and walking for transport: Role of neighbourhood destinations.
Preventative Medicine
auo.org.au
11
Social Infrastructure
Indicator Rationale Social infrastructure refers to community and individual support services and resources such as health, education, early childhood, community support, community development, culture, sport and recreation, parks and emergency services. The provision of well-planned social infrastructure supports the liveability of communities by promoting walking and community social interaction. Similarly, it is associated with people’s improved physical and mental health and their increased satisfaction with the area in which they live. Relevant Sustainable Development Goals
Methodology Access to social infrastructure was calculated based on six measures: Community Centres, Culture and Leisure, Early Years, Education, Health and Social Services and Sport and Recreation. These measures were measured by 16 individual service types which were used to calculate the presence of service mix within a threshold distance as shown in the table below.
Measure Destination Distance Threshold
Community Centres Community centres 1000 Culture & Leisure Museum/Art gallery 3200 Cinema/Theatre 3200 Libraries 1000 Early Years Childcare 800 Out of school hours
care 1600
Education Government primary schools
1600
Government secondary schools
1600
Health and Social Services
Residential aged care facilities
1000
Dentists 1000 General practitioners
(GP) 1000
Maternal, child and family health centers
1000
Other community health care centers
1000
Pharmacies 1000 Sport and Recreation Public swimming pools 1200 Sports facilities 1000
Binary indicators were used to record the presence (=1) or absence (=0) for the 16 types of social infrastructure destinations and a social infrastructure mix score was created by summing the 16 binary indicators for each participant. Consequently, a maximum score of 16 represented the highest mix of social infrastructure with all types present. References Davern M, Gunn L, Whitzman C, Higgs C, Giles-Corti B, Simons K,
Villanueva K, Mavoa S, Roberts R, Badland H. (2017). Using spatial measures to test a conceptual model of social infrastructure that supports health and wellbeing; Cities and Health. vol. 1, no. 2, pp. 194-209

auo.org.au
12
Transport
Indicator Rationale Access to public transport is a key ingredient for liveability. Efficient and accessible public transport reduces inequities by facilitating access to services, education and jobs for low-income earners who may not be able to afford a car, individuals too young to hold a drivers licence and people with restricted mobility due to disability and/or older age. Additionally, living close to public transport supports community health in two significant ways: by encouraging walking and reducing people’s dependence on cars. People who live within walking distance of public transport stops, that is, 400m or approximately a 5-minute walk, are more likely to use public transport, and in turn achieve daily recommended exercise targets. However, the incentive to use public transport is also influenced but other factors including comfort, overcrowding, cost, directness of service and service frequency. For example, if residents have access to a nearby public transport stop but this stop is only serviced every 2-3 hours, then there will be less motivation to take public transport due to the inconvenience and cost of waiting. A public transport stop is considered to have regular service if there is at least one scheduled service every 30 minutes between 7.00am and 7.00pm on a normal weekday. Normal weekdays exclude school and public holidays. Relevant Sustainable Development Goals
Methodology Three datasets were used in the GIS analysis: public transport stops, a pedestrian road network and sample points. Pedestrian road network distances were calculated from each sample point to the closest public transport stop. Public transport stops with regular service were identified. Stops were considered to be frequently serviced if the average interval between departures was 30 minutes or less between 7.00am and 7.00pm, Monday to Friday, excluding school and public holidays. The reference
time period used across feeds for the included public transport indicators was 8 October 2019 to 5 December 2019. References Badland H, Mavoa S, Villanueva K, Roberts R, Davern M, Giles-Corti B. (2015). The development of policy-relevant transport indicators to monitor
health outcomes and behaviours. Journal of Transport & Health, 2:103-110 Besser LM, Dannenberg AL. (2005). Walking to public transit: steps to help meet physical activity recommendations. Am J Prev Med, 29(4): p. 273-280
Cerin E, Nathan A. (2017). The neighbourhood physical environment and active travel in older adults: a systematic review and meta-analysis. International Journal of Behavioural Nutrition and Physical Activity. 14(1): p. 15
Currie G, Richardson T, Smyth P, Vella-Brodrick D, Hine J, Lucas K, Stanley J, Morris J, Kinnear R, Stanley J. (2009). Investigating links between transport disadvantage, social exclusion and well-being in Melbourne—Preliminary results. Transp Policy (Oxf), 16(3): p. 97-105
auo.org.au
13
Food
Indicator Rationale Access to fresh food provides residents with the opportunity to purchase nutritional foods which support healthy eating behaviours and lifestyles. Supermarkets are a common source of fresh healthy foods, but additionally, local retail outlets such as fruit and vegetable retailers (greengrocers) also provide important opportunities to purchase these types of foods. Additionally, living within easy walking distance of fresh food stores encourages and enables people to walk or cycle instead of driving and hence, reduces their risk of chronic disease. Most people will not regularly walk distances greater than 800m – 1km to destinations such as shops and services (Gunn, King, et al., 2017; Gunn, Mavoa, et al., 2017) especially if bulky purchases need to be carried. Access to food is not always equitable throughout communities and some areas, known as ‘food deserts’, have limited or no access to foods. Food deserts force residents to be reliant on motorised transport and are of particular concern to those with limited mobility or in low socio-economic status areas where people may not be able to afford a private car. Eating fast food on a regular basis may contribute to individuals becoming overweight or obese, both of which are linked to an increased risk of developing chronic diseases such as type 2 diabetes, coronary heart disease and some cancers. Close proximity to fast food retailers, including those trading from food courts, may influence an individual’s diet, especially among those with walkable access. Relevant Sustainable Development Goals
Methodology The measures related to access to foods were created using point data representing the location of supermarkets, greengrocers and fast foods, a pedestrian road network and sample points. The location of supermarkets and greengrocers was identified from five major supermarket chain
websites, Aldi, Coles, Foodworks, IGA and Woolworths. Pedestrian road network distances were calculated from each sample point to the closest type of food. References Astell-Burt T, Feng X, Mavoa S, Badland H, Giles-Corti B. (2017). Modest ratios of fast food outlets to supermarkets and green grocers are associated
with higher body mass index: Longitudinal analysis of a sample of 15,229 Australians aged 45 years and older in the Australian National Liveability Study Burns C, Inglis A. (2007). Measuring food access in Melbourne: access to
healthy and fast foods by car, bus and foot in an urban municipality in Melbourne. Health & Place, 13(4), 877-885 Feng X, Astell-Burt T, Badland H, Mavoa S, Giles-Corti B. Association between body mass index and local food environment in a sample of 15,229
Australians aged 45 years and older: Findings from the National Liveability Study. Health Place. Under review Gunn L, King T, Mavoa S, Lamb K., Giles-Corti B, Kavanagh A. (2017). Identifying destination distances that support walking trips in local
neighborhoods. Journal of Transport & Health, 5, 133-141 Gunn L, Mavoa S, Boulangé C, Hooper P, Kavanagh A, Giles-Corti B. (2017). Designing healthy communities: creating evidence on metrics for built environment features associated with walkable neighbourhood activity
centres. International Journal of Behavioral Nutrition and Physical Activity. 14(1):164 Hubley T. (2011). Assessing the proximity of healthy food options and food deserts in a rural area in Maine. Applied Geography, 31(4), 1224-1231
Murphy M, Badland H, Koohsari MJ, Astell-Burt T, Trapp G, Villanueva K, Mavoa S, Davern M, Giles-Corti B. (2017). Indicators of a health-promoting local food environment: a conceptual framework to inform urban planning policy and practice. Health Promot J Aust. 28(1):82–84
Murphy M, Badland H, Koohsari MJ, Giles-Corti B. (2017). Supermarket access, transport mode and BMI: the potential for urban design and planning policy across socioeconomic areas. Public Health Nutrition, 20:3304-3315
Murphy M, Jordan H, Badland H, Giles-Corti B. (2018). Local food environments: A qualitative study into Australian stakeholder perspectives on urban planning and governance to advance health and equity within cities. Cities & Health, 15:10.1080/23748834.2018.1514802
auo.org.au
14
Alcohol
Indicator Rationale Long term and excessive use of alcohol can cause extreme harm to the physical and mental health of individuals, families and communities and is strongly associated with liver disease, stroke, numerous types of cancer and depression. Excessive alcohol abuse can also lead to injury and death through accident, suicide and violence and is often connected to family violence, assault and homicide. These physical and social costs increase the burden of preventable disease on Australia’s health care system. In Australia, alcohol can be purchased from licensed retailers and consumed by all people 18 years old and over. Outlets that sell alcohol which can be purchased and taken away to consume elsewhere are known as off-licence retailers while those who sell alcohol which must be consumed on the premises where is was purchased are known as on-licence retailers. It is possible for a retailer to have both an on and off-licence for alcohol sales. Relevant Sustainable Development Goals
Methodology Three datasets were used in the GIS analysis: alcohol, a pedestrian road network and sample points. The location of alcohol retailers was collected for each Australian state and territory from liquor licensing regulatory bodies classified into on and off-licence premises. Only retailers with a permanent address were included in the final data sets and wholesalers and retailers who served alcohol at temporary events were excluded. Pedestrian road network distances were calculated from each sample point to the closest venue with an on and off liquor licence. References Badland H, Mavoa S, Livingston M, David S, Giles-Corti B. (2016). Testing spatial measures of alcohol outlet density with self-rated health in the
Australian context: Implications for policy and practice. Drug Alcohol Rev. 35(3): 298-306 Foster S, Trapp G, Hooper P, Oddy WH, Wood L, Knuiman M. (2017). Liquor landscapes: Does access to alcohol outlets influence alcohol
consumption in young adults? Health Place. 45: 17-23 Livingstone M. (2011). Alcohol outlet density and harm: Comparing the impacts on violence and chronic harms. Drug Alcohol Rev. 30: 515-23
auo.org.au
15
Public Open Space
Indicator Rationale Public open spaces are areas such as parks and recreational reserves, public gardens, nature reserves, civic areas and promenades where everyone has the right to visit without being excluded due to economic or social conditions. Open spaces are important as they provide places for people to meet, socialise, play and connect and access to these areas is associated with increased physical activity and improved mental health. Small public open spaces often have limited facilities such as a single sporting field or a children’s playground which may discourage use by the broader community. Open spaces larger than 1.5 hectares can appeal to larger sections of the community because they are able to incorporate multiple full-sized playing fields for diverse organised sports and may contain amenities such as bike and walking tracks, as well as additional facilities such as shelters and toilets to support large social gatherings. Large parks and public open spaces can also preserve and promote biodiversity and are therefore extremely important from an environmental and conservation perspective. Challenges in accessing open space can arise from conflicting ideas about how these spaces should be utilised and by whom. As such, factors including proximity, distance to services, isolation, social exclusion, anti-social behaviour and the management and design of open spaces can affect the use of open space by different individuals within society. With the growth of cities and the loss of private open spaces due to increased housing density, it is therefore critical that public open spaces be managed and maintained in order to support liveability in urban environments. Relevant Sustainable Development Goals
Methodology Three datasets were used in the GIS analysis: public open space, the pedestrian road network, and sample points. Pedestrian road network distances were calculated from each sample point to all areas of open space within 3200 metres. Pseudo-entry points were created along the perimeter of each area of open space at 50 metre intervals, where this perimeter was within 30 metres distance of an accessible path. Areas of open space, and those which may be considered publicly accessible. Publication of the full method is forthcoming.

auo.org.au
16
References Davern M, Farrar A, Kenda D, Giles-Corti B. (2016). Quality green space supporting health, wellbeing and biodiversity: A literature review Adelaide,
South Australia: Heart Foundation of Australia Giles-Corti B, Foster S, Koohsari MJ, Francis J, Hooper P. (2015). The influence of urban design and planning on physical activity. In: Barton H, Thompson S, Burgess S, Grant M, editors. The Routledge handbook of
planning for health and well-being: Shaping a sustainable and healthy future. Oxon, UK: Routledge The Healthy Built Environments Program. Healthy built environments: A review of the literature. Fact sheets. Sydney, NSW: The Healthy Built
Environments Program, City Futures Research Centre, The University of New South Wales (2012) Villanueva K, Badland H, Hooper P, Koohsari MJ, Mavoa S, Davern M, Roberts R, Goldfield S, Giles-Corti B. (2015). Developing indicators of public
open space to promote health and wellbeing in communities. Applied Geography. 57: 112-9
auo.org.au
17
Employment
Indicator Rationale Commuting to work is a daily necessity for most Australians. Long commute distances are typically associated with lengthy commute times which can have a significant negative impact on aspects of the economy, the environment and the social fabric of communities. Long commute times are known to cause increased levels of stress and decrease the performance and productivity of employees. Additionally, long commute times can negatively impact work-life balance and time away from home, leading to detrimental effects on family and other social relationships. This compounds workplace stress and may significantly impact the overall physical and mental health of employees. By contrast, shorter commute times are likely to be associated with a positive work-life balance and increase the likelihood of maintaining healthy family and social relationships and self-care. Dependence on cars is higher in areas with poor public transport and especially high where individuals have to commute long distances to get to work. Cars and other private vehicles are not only costly to purchase, but require ongoing expenditure in terms of fuel, maintenance, parking and registration costs. When employees live closer to their workplaces, the likelihood of commuting to work using public transport, walking or cycling, as opposed to relying on private vehicles, is increased. The use of public and active transport reduces traffic congestion and emissions from private vehicles which positively supports the built and natural environment as well as an individual’s physical activity. Relevant Sustainable Development Goals
Methodology Customised Census data provided by the ABS for people within an SA1 who live and work in the same SA3 was used. These counts were converted to percentages to create this indicator. References Australian Bureau of Statistics. Census of Population and Housing: Commuting to Work – More Stories from the Census. (2016). cat. no. 2071.0.55.001
Badland H, Davern M, Villanueva K, Mavoa S, Milner A, Roberts R, Giles-Corti B. (2016). Conceptualising and measuring spatial indicators of employment through a liveability lens. Social Indicators Research, 127, 565–576.
Badland H, Milner A, Roberts R, Giles-Corti B. (2017). Are area-level measures of employment associated with health behaviours and outcomes? Social Indicators Research, 134:237-251
auo.org.au
18
Housing
Indicator Rationale Secure, safe and suitable housing is essential if the physical and mental health of individuals is to be maintained. Unsuitable housing due to location, overcrowding, tenure insecurity or unaffordability can have serious health impacts. Unaffordable housing is an issue for many low-income households and may lead to difficulty affording food, healthcare and other basic necessities. Affordable housing supports physical and mental health and is an important social determinant of health and wellbeing. Relevant Sustainable Development Goals
Methodology The housing affordability data set, i.e., the percentage of households in the bottom 40% of the income distribution spending more than 30% of household income on housing costs data, was created using customised Census data provided by the Australian Bureau of Statistics. Methods used to create the measure of dwelling density can be found here. References Badland H, Foster S, Bentley R, Higgs C, Roberts R, Pettit C, Giles-Corti B.
(2017). Examining associations between area-level spatial measures of housing with selected health and wellbeing behaviours and outcomes in an urban context. Health Place, 43,17–24 Howden-Chapman P. (2002). Housing and inequalities in health. J Epidemiol Community Health. 56: 645-6
Marco E, Burgess S. (2015). Healthy housing. In: Barton H, Thompson S, Burgess S, Grant M, editors. The Routledge handbook of planning for health and well-being: Shaping a sustainable and healthy future. Oxon, UK: Routledge, 97
Victorian Health Promotion Foundation. (2012). Housing and Health Research Summary: Addressing the Social and Economic Determinants of Mental and Physical Health. VicHealth Melbourne
Yates J. (2012). Housing policies and wealth inequality. In: Tomlinson R, editor. Australia’s unintended cities: the impact of housing on urban development. Melbourne, Victoria: CSIRO Publishing
auo.org.au
19
Indicator Metadata The Australian Urban Observatory metadata provides information about the data and methods used to produce this research. Data currency, descriptions of measures and links to supporting reference material are also included. Metadata is provided to enable members of the AUO to easily explore and apply this work in their own field and to ensure transparency of our research.
• Liveability
• Walkability
• Social Infrastructure
• Public Transport
• Food
• Alcohol
• Public Open Space
• Employment
• Housing
Common indicator components Many of the indicators are constructed from components that are common. These include:
• Data projection
• Digital boundaries
• Dwellings
• Sample points
• Pedestrian road network
• Local walkable neighbourhood
• Public transport stops
Data projection All datasets used were projected to the GDA2020 Geoscience Australia Lambert Conic Conformal projection (GDA2020 GA LCC, EPSG 7845) using the NTv2 transformation grid shift binary prior to analysis. Digital boundaries Digital boundaries for all indicators were obtained from the Australian Bureau of Statistics (ABS) Australian Statistical Geography Standard (ASGS) structures. Capital city boundaries were defined using the ABS Greater Capital City Statistic Areas (GCCSA) digital boundaries and the boundaries of other cities were defined using the ABS Significant Urban Areas (SUA) digital boundaries. Residential urban areas within cities were defined using ABS Sections of State (SOS) where the SOS classification was ‘major urban’ or ‘other urban’. Major urban centres have a population of 100,000 people of more and other urban centres have a population between 1,000 and 99,999.
Other ABS GCCSA digital boundaries included ABS Mesh Block, SA1, suburbs, and LGA. Dwellings A dwelling is a structure that is habitable and intended to have people live in it. Dwellings include houses, motels, flats, caravans, prisons, tents, humpies, and houseboats (ABS 2016). Total dwelling counts were obtained from the 2016 Census, Mesh Block Counts. Counts include all dwellings whether occupied or not. Indicator summaries for LGA, suburb and Statisttical Area 1 neighbourhood regions included in the Australian Urban Observatory are all weighted with regard to urban dwellings. Pedestrian road network The pedestrian road network represents the sections of the road network walkable by pedestrians, meaning that it excludes freeways, highways, proposed and private roads. It is assumed that all remaining roads contain a footpath or are otherwise walkable. Local walkable neighbourhood The local walkable neighbourhood represents the area around a sample point that is accessible within a 20-minute walk. This was calculated by determining for each sample point the subset of the pedestrian road network reachable within 1600 metres. Public transport stops In each state and territory in Australia the government department or authority responsible for planning public transport typically publishes data on public transport stops and timetables. Public transport stops and timetables were sourced or direct from transit agencies. Boeing, G. (2017). OSMnx: New Methods for Acquiring, Constructing, Analyzing, and Visualizing Complex Street Networks.” Computers, Environment and Urban Systems 65, 126-139. doi:10.1016/j.compenvurbsys.2017.05.004
Forsyth, A., Van Riper, D., Larson, N. et al. (2012). Creating a replicable, valid cross-platform buffering technique: The sausage network buffer for measuring food and physical activity built environments. International Journal of Health Geographics 11, 14. https://doi.org/10.1186/1476-072X-
11-14

auo.org.au
20
AUO Score card
Within the AUO you will find a Score card which summarises liveability data and ABS statistics for the LGA, Suburb or SA1 in question. Selected area SA1 / Suburb and / or LGA name taken from the Australian Statistical Geography Standard and used by the Australian Bureau of Statistics. Selected indicator Average: Across the SA1 / Suburb / LGA Percentile: Compared with the 21 cities
nationally Range: Across the SA1 / Suburb / LGA 25th to 75th percentile (usual range): Across the SA1 / Suburb / LGA
Liveability score card for dwellings in this urban area Liveability (100 is average) The Liveability Index is a composite score based on measures related to aspects of liveability including Social Infrastructure, Walkability, Public Transport, Public Open Space, Housing Affordability, and Local Employment. The 13 measures which comprise the liveability index are: street connectivity; dwelling density; access to community, culture and leisure destinations; access to childcare services; access to public schools; access to health services; access to sport and recreation facilities; access to fresh food; access to convenience stores; access to regular public transport; access to large public open space; low housing affordability stress; and local employment opportunities. The general method for calculating the liveability index has been previously published. The current version of the liveability index includes an expanded set of measures and has been calculated for the 21 Australian cities using a target year of 2018.
Walkability (0 is average)
The walkability index was calculated as the sum of standardised scores of local neighbourhood attributes including street connectivity, dwelling density and the index of access to services of daily living. Street connectivity was calculated as the ratio of intersections to local walkable neighbourhood in square kilometres. Dwelling density was calculated as the total number of dwellings located in Mesh Blocks intersecting each participant’s local walkable neighbourhood divided by the neighbourhood size in hectares. Access to services of daily living was created using binary indicators which record the presence (=1) or absence (=0) to access to three destinations; supermarkets, public transport stops and convenience stores, within 1600m of the sample points using a pedestrian road network. A daily living index was created by summing the 3 binary indicators for each sample point.
Social Infrastructure (/15) Access to social infrastructure was calculated based on six measures: Community Centres, Culture and Leisure, Early Years, Education, Health and Social Services and Sport and Recreation. These measures were measured by 16 individual service types which were used to calculate the presence of service mix within a threshold distance as shown in the table below. Measure Destination Distance Threshold (m) Community Centres Community centres 1000 Culture & Leisure Museum/Art gallery 3200
Cinema/Theatre 3200 Libraries 1000
Early Years Childcare 800 Out of school hours care 1600
Education Government primary schools 1600 Government secondary schools 1600
Health and Social Services Residential aged care facilities 1000 Dentists 1000 General practitioners (GP) 1000 Maternal, child & family health 1000 Other community health care 1000 Pharmacies 1000
Sport and Recreation Public swimming pools 1200 Sports facilities 1000
Binary indicators were used to record the presence (=1) or absence (=0) for the 16 types of social infrastructure destinations and a social infrastructure mix score was created by summing the 16 binary indicators for each participant. Consequently, a maximum score of 16 represented the highest mix of social infrastructure with all types present.
auo.org.au
21
Regular public transport access (%) Three datasets were used in the GIS analysis: public transport stops, a pedestrian road network and sample points. Pedestrian road network distances were calculated from each sample point to the closest public transport stop. Public transport stops with regular service were identified. Stops were considered to be frequently serviced if the average interval between departures was 30 minutes or less between 7.00am and 7.00pm, Monday to Friday, excluding school and public holidays. The reference time period used across feeds for the included public transport indicators was 8 October 2019 to 5 December 2019.
Distance to supermarket (m) The measures related to access to foods were created using point data representing the location of supermarkets, greengrocers and fast foods, a pedestrian road network and sample points. The location of supermarkets and greengrocers was identified from five major supermarket chain websites, Aldi, Coles, Foodworks, IGA and Woolworths. Pedestrian road network distances were calculated from each sample point to the closest type of food.
Alcohol off-licences within 800m (count) Three datasets were used in the GIS analysis: alcohol, a pedestrian road network and sample points. The location of alcohol retailers was collected for each Australian state and territory from liquor licensing regulatory bodies classified into on and off-licence premises. Only retailers with a permanent address were included in the final data sets and wholesalers and retailers who served alcohol at temporary events were excluded. Pedestrian road network distances were calculated from each sample point to the closest venue with an on and off liquor licence.
Large Public Open Space withing 400m (%) Three datasets were used in the GIS analysis: public open space, the pedestrian road network, and sample points. Pedestrian road network distances were calculated from each sample point to all areas of open space within 3200 metres. Pseudo-entry points were created along the perimeter of each area of open space at 50 metre intervals, where this perimeter was within 30 metres distance of an accessible path. Areas of open space, and those which may be considered publicly accessible, were identified. Publication of the full method is forthcoming.
Local Employment (%) The Australian Bureau of Statistics Table Builder Pro was used to create a table using 2016 Census data which contained counts of people by SA1 who live in the same SA3. These counts were converted to percentages to create this indicator.
Housing Affordabillity Stress (%) The housing affordability data set, i.e., the percentage of households in the bottom 40% of the income distribution spending more than 30% of household income on housing costs data, was was customised at SA1 level by the Australian Bureau of Statistics.
Australian Bureau of Statistics Census Census Data for population, age, median weekly household income, indigenous population, average household size for SA1 / Suburb or LGA. Additional Layer Selection Base layer None No map behind Satellite B&W Satellite Image behind Basic Simple greyscale map Detail Detailed greyscale map Boundary lines None No boundary lines LGA LGA boundaries in black Suburb Suburb boundaries in black City City boundaries in black Decile Key
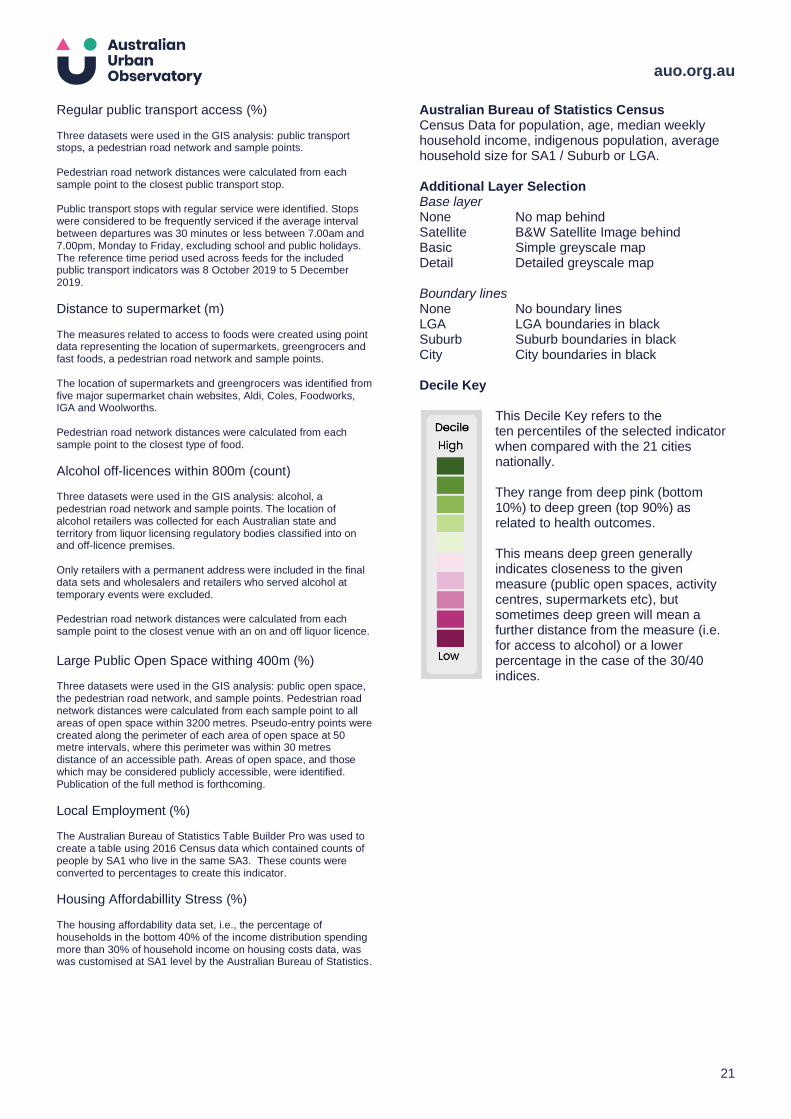
This Decile Key refers to the ten percentiles of the selected indicator when compared with the 21 cities nationally. They range from deep pink (bottom 10%) to deep green (top 90%) as related to health outcomes. This means deep green generally indicates closeness to the given measure (public open spaces, activity centres, supermarkets etc), but sometimes deep green will mean a further distance from the measure (i.e. for access to alcohol) or a lower percentage in the case of the 30/40 indices.

auo.org.au
22
Liveability at your fingertips We’ve made understanding liveability so much simpler. We’ve taken data out of the tables and put it on the map. We’re supporting observation, that leads to understanding and action that improves liveability.
Planners and policy makers use the AUO to:
• Understand details of liveability at a very granular level
• Identify liveability strengths and weaknesses in their community
• Analyse existing liveability strategies
• Develop new policies to support health and wellbeing
• Decide where to focus future investment
• Build an evidence base to advocate for policy change
• Monitor the impact of liveability strategies over time
Developers and consultants use the AUO to:
• Connect deliverables with Corporate Social Responsibility targets
• Develop project specific liveability strategies
• Identify the opportunities and risks of new places to invest
• Build business cases for future projects
• Understand liveability at national, regional and local levels
Journalists use the AUO to:
• Access policy-based urban liveability research
• Measure the impact of policy agendas
• Learn how liveability changes across different locations and cities
• Identify issues for rural cities and how these differ from capitals
• Measure the major influences of liveability
Our impact in Mitchell Shire “Advocacy is just another word for nagging but with an evidence base.
“That is what the Australian Urban Observatory helps you to do, build the evidence base for what may seem obvious, but to government you cannot sell anything based on intuition.
“It has helped Mitchell Shire create a starting point for each key town and growth area that is specific it, assisting in developing specific support or interventions that are not generic across the Shire.
“The indicators have also helped with the Seymour Revitalisation project providing the evidence that was utilised to develop a business case for a community/primary care hub, that was submitted to the State for consideration. Seymour is one of the most disadvantaged postcodes in Victoria, the liveability indicators provide a deeper understanding. We can now utilise the indicators (as they were at the start of the project) and measure whether targeted interventions have been successful in a couple of years.
“In new neighbourhoods, setting the culture/course early through monitoring, assessing and responding have long term positive impacts. Monitoring liveability at periodic checkpoints (every 2/3 years), can help you plan, ensuring you don’t bed entrenched issues, that can take years of retrofitting to address.”
Mary Agostino Acting Chief Executive Officer Mitchell Shire Council

auo.org.au
23
Our key supporters Healthy Liveable Cities Group research is recognised and funded by top Australian medical and scientific research organisations including:
Contact us
Dr Melanie Davern Senior Research Fellow Director Australian Urban Observatory Co-Director Healthy Liveable Cities Group [email protected]
Katherine Murray Partnerships & Development Australian Urban Observatory [email protected]
Australian Urban Observatory auo.org.au Healthy Liveable Cities Group Centre for Urban Research Building 8, Level 11 RMIT University City Campus [email protected]