Embed Size (px)
Citation preview

Creating Digital Libraries: Content Generation and Re-Mastering Steven J. Simske, Xiaofan Lin Imaging Systems Laboratory HP Laboratories Palo Alto HPL-2003-259 December 8th , 2003* E-mail: {steven.simske, xiaofan.lin}@hp.com zoning analysis, quality assurance, TIFF, OCR, PDF, meta-algorithmics
This paper has two main goals: to describe the automatic creation of a digital library and to provide an overview of the meta-algorithmic patterns that can be applied to increase the accuracy of its creation. Automating the creation of useful digital libraries-that is, digital libraries affording searchable text and reusable ("re-purposable ") output- is a complicated process, whether the original library is paper-based or already available in electronic form. In this paper, we outline the steps involved in the creation of a deployable digital library (> 1.2 x 10⁶ pages) for MIT Press, as well as its implications to other aspects of digital library creation, management, use and repurposing. Input, transformation, information extraction, and output processes are considered in light of their utility in creating layers of content. Interestingly, in some aspects, scanning directly from paper offers extra opportunities for error-checking through feedback-feedforward combination. Strategies for quality assurance (QA) at the document, chapter and book level are also discussed We emphasize the use of meta-algorithmic design patterns for application towards improving the content generation, extraction and re-mastering. This approach also increases the ease with which modules and algorithms are added to and deprecated from the system.
* Internal Accession Date Only Approved for External Publication To be published in and presented at the International Workshop on Document Image Analysis for Libraries (DIAL'04), 23-24 January 2004, Palo Alto, California Copyright IEEE 2003
Creating Digital Libraries: Content Generation and Re-Mastering
Steven J. Simske Xiaofan Lin
Imaging Systems Laboratory Hewlett-Packard Laboratories
E-mail: {steven.simske, xiaofan.lin}@hp.com December 1, 2003
ABSTRACT This paper has two main goals: to describe the automatic creation of a digital library and to provide an overview of the meta-algorithmic patterns that can be applied to increase the accuracy of its creation. Automating the creation of useful digital libraries—that is, digital libraries affording searchable text and reusable (“re-purposable”) output—is a complicated process, whether the original library is paper-based or already available in electronic form. In this paper, we outline the steps involved in the creation of a deployable digital library (>1.2 x 10⁶ pages) for MIT Press, as well as its implications to other aspects of digital library creation, management, use and repurposing. Input, transformation, information extraction, and output processes are considered in light of their utility in creating layers of content. Interestingly, in some aspects, scanning directly from paper offers extra opportunities for error-checking through feedback-feedforward combination. Strategies for quality assurance (QA) at the document, chapter and book level are also discussed. We emphasize the use of meta-algorithmic design patterns for application towards improving the content generation, extraction and re-mastering. This approach also increases the ease with which modules and algorithms are added to and deprecated from the system.
Keywords: Zoning Analysis, Quality Assurance, TIFF, OCR, PDF, Meta-Algorithmics 1 Introduction
In this paper, we introduce the digital library generation performed on the MIT Press out-of-print book collection. We then present the design and deployment methods for its generation, followed by a discussion of the quality assurance techniques used. Next, we discuss the data-related considerations: how content is extracted from scanned document images; how these documents are digitally re-mastered; and finally how the use of meta-algorithmic techniques and patterns benefits the generation of a digital library. Finally, we report on the output formats used, and finish up with a discussion and conclusions section. Type of File Resolution (ppi) Bits/pixel File Size (per page) 1. Black text only 600 1 4.2 MB 2. Grayscale only 400 8 15 MB 3. Color 400 + 200 8 + 24 26 MB
Table 1. Bit depth specifications for the MIT Press/Cognet [1,2] project.
The authors and their colleagues derived and published a digital library that was the front-end for both a large-scale print-on-demand system for MIT Press [1] and for the MIT cognitive network, or CogNet [2]. Users access this digital library in one of two ways: either by buying a “classic” book from MIT Press [1] or by signing up for membership in the Cognet community [2]. These publishing assets consisted of 4000 books, mostly scientific/technical, published before c. 1990 and generally in good condition. This system was used to convert raster scanned documents (saved, originally, as TIFF files) into printable and web-readable files (PDF was the preferred output). 4000 out-of-print books were band-sawed (to remove their covers) and then the pages were scanned according to the specifications shown in Table 1. For files that are
known to be (black) text-only, 600 ppi (pixels/inch, which is the same in x- and y-directions for all values shown) 1-bit data suffices. For pages with grayscale regions (black and white photos, etc.), 400 ppi, 8-bit data is used. For pages containing color, an additional 200 ppi, 24-bit file is necessary. To simplify the scanning specifications, we did not use the first option (600 ppi, 1-bit).
The original specifications were three-fold: text-only pages were to be scanned at 600 ppi, 1-bit; grayscale-only (text, drawings, black and white photos, no color regions) pages were to be scanned at 400 ppi, 8-bit; and pages with one or more color regions were to be scanned twice—once at 400 ppi, 8-bit and again at 200 ppi, 24-bit. Very few pages (<1%) contained color regions. Additionally, because the scanning was performed off-shore (in the Barbados and in Ciudad Obregón, Mexico), the specifications were further simplified: 400 ppi, 8-bit scanning was used for all pages, and a second—200 ppi, 24-bit—scan was made for pages with one or more color regions on it. 400 ppi was chosen to catch the fine detail in small font—e.g. 6-point—and line drawings and graphics. A bit depth of 8 was chosen to reduce storage overhead.
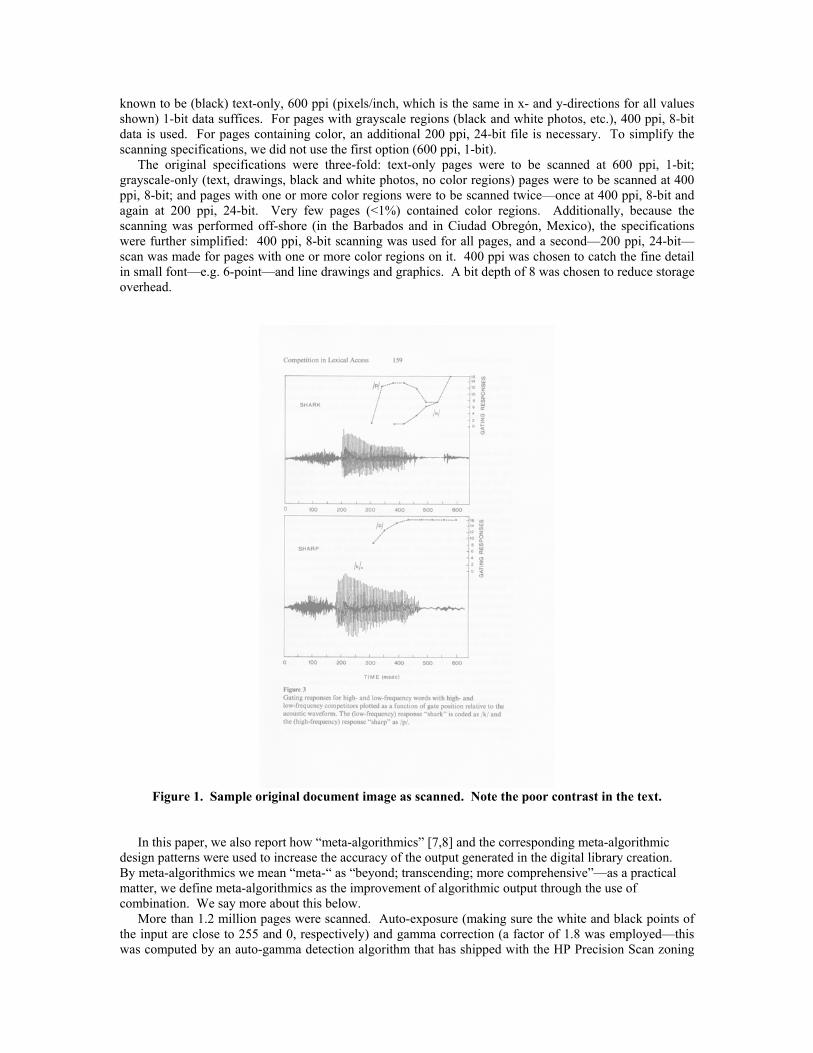
Figure 1. Sample original document image as scanned. Note the poor contrast in the text.
In this paper, we also report how “meta-algorithmics” [7,8] and the corresponding meta-algorithmic design patterns were used to increase the accuracy of the output generated in the digital library creation. By meta-algorithmics we mean “meta-“ as “beyond; transcending; more comprehensive”—as a practical matter, we define meta-algorithmics as the improvement of algorithmic output through the use of combination. We say more about this below.
More than 1.2 million pages were scanned. Auto-exposure (making sure the white and black points of the input are close to 255 and 0, respectively) and gamma correction (a factor of 1.8 was employed—this was computed by an auto-gamma detection algorithm that has shipped with the HP Precision Scan zoning
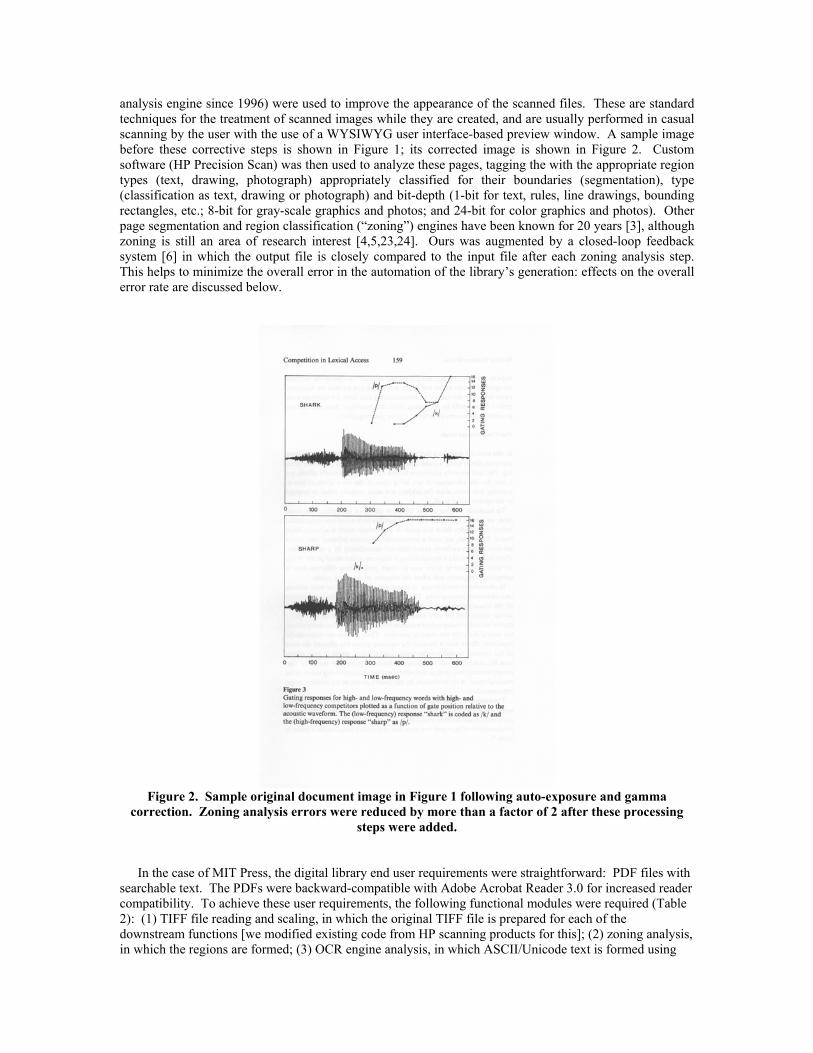
analysis engine since 1996) were used to improve the appearance of the scanned files. These are standard techniques for the treatment of scanned images while they are created, and are usually performed in casual scanning by the user with the use of a WYSIWYG user interface-based preview window. A sample image before these corrective steps is shown in Figure 1; its corrected image is shown in Figure 2. Custom software (HP Precision Scan) was then used to analyze these pages, tagging the with the appropriate region types (text, drawing, photograph) appropriately classified for their boundaries (segmentation), type (classification as text, drawing or photograph) and bit-depth (1-bit for text, rules, line drawings, bounding rectangles, etc.; 8-bit for gray-scale graphics and photos; and 24-bit for color graphics and photos). Other page segmentation and region classification (“zoning”) engines have been known for 20 years [3], although zoning is still an area of research interest [4,5,23,24]. Ours was augmented by a closed-loop feedback system [6] in which the output file is closely compared to the input file after each zoning analysis step. This helps to minimize the overall error in the automation of the library’s generation: effects on the overall error rate are discussed below.
Figure 2. Sample original document image in Figure 1 following auto-exposure and gamma
correction. Zoning analysis errors were reduced by more than a factor of 2 after these processing steps were added.
In the case of MIT Press, the digital library end user requirements were straightforward: PDF files with searchable text. The PDFs were backward-compatible with Adobe Acrobat Reader 3.0 for increased reader compatibility. To achieve these user requirements, the following functional modules were required (Table 2): (1) TIFF file reading and scaling, in which the original TIFF file is prepared for each of the downstream functions [we modified existing code from HP scanning products for this]; (2) zoning analysis, in which the regions are formed; (3) OCR engine analysis, in which ASCII/Unicode text is formed using

the identified text regions in the previous step; (4) clean-up of the OCR using dictionary look-up and voting, hyphen removal and other techniques; (5) OCR feedback to zoning analysis; (6) the generation of the output PDF files using custom code based on the PDF specification, and (7) the schema-drive generation of the output XML files.
The MIT Press digital library generation was customer-driven. MIT Press did not have its out-of-print books converted to offer a “free” library. Rather, it was used to support “classic” book sales through print-on-demand as well as to augment the cognitive network (“CogNet”) that they provide to a community of cognitive scientists. However, our partners at MIT Press were impassive to any advanced work we performed using their content insofar as the digital library so generated met their needs. We will discuss some of the additional research performed in creating the MIT Press digital library below. One such research thread, it should be noted, was immediately adopted by the MIT Press for use with their out-of-print journals. Thus, the “journal splitting” (splitting a journal comprising multiple articles into its separate articles) [16] we performed on the corpus will be an important example in the area of “content re-mastering”. Functional Requirement How implemented 1. TIFF file reading/scaling Custom TIFF reading software 2. Zoning analysis HP Precision Scan Pro + QA augmentations 3. OCR engine loading/analysis HP-licensed OCR engine/s 4. OCR clean-up Custom code feeding back to (3.) 5. OCR feedback to zoning analysis Custom code feeding back to (2.) 6. PDF generation Custom code based on the PDF specification 7. XML generation Schema-driven code with custom XML-parser Table 2. Functional requirements after appropriate (gamma corrected, auto-exposed) TIFF files with
correct resolution and bit depth had been captured. Most of the (C++-based) code was “custom” code, to avoid licensing issues and to provide full control of all source code in the project.
2 Design and Deployment Methods
The MIT Press digital library creation involved extensive Document Image Analysis (DIA) technologies. The DIA methods we used to achieve the functional requirements listed in Table 2 are discussed here. Where appropriate, we will allude to meta-algorithmic techniques that were used to improve the accuracy (if not performance) of the different steps.
All of the 1.2 x 10⁶ pages required for the MIT Press Digital Library creation have been processed. For the purposes of comparing different DIA methods, we supplemented the overall timing and error results, which were only broken out on a per-page basis, with specific timing and error results we obtained by running different settings within a 700 page sub-corpus. We will comment on the differences between these two sets of data where both exist. 2.1. DIA methods for the functional requirements in Table 2 1. TIFF file reading/scaling. The specifications of the scanned TIFF files were either 400 ppi resolution with 8 bits/pixel bit depth; or this in combination with 200 ppi resolution with 24 bits/pixel bit depth (Table 1). These specifications were preserved for the PDF generation—that is, the 400x8 raster and, if present, 200x24 raster were both loaded into memory for later PDF generation. Scaling was performed to generate the raster used for zoning analysis in the next step. The HP Precision Scan zoning analysis engine performs accurately on resolutions between 30-100 ppi—it was designed to handle “preview” data that shows up in a user interface (UI) on a PC, so variable-ppi raster input was important. In a non-UI mode, the HP Precision Scan zoning engine uses a 75 ppi raster, since this scales easily from the typical 150 ppi (photos) and 300 ppi (documents) defaults for scanning. This gave us some options relating to the trade off between (1) the time it takes to perform the scaling, (2) the time it takes to perform the zoning analysis, and (3) the accuracy of the zoning analysis. Since the time for (1) and (2) are relatively equal in length, we decided to simplify the scaling by making it an integral factor—this allows simple pixel averaging to obtain the scaled
raster. We chose a factor of 5, since the resulting zoning analysis resolution is 80—close to the default value of 75, and thus generally benefiting from extensive Beta-testing (combined “white-box” and “black box” testing of the software after the code was functionally complete) performed at this resolution. The difference in performance at 80 ppi compared to 75 ppi is negligible, and the overall combination is clearly preferable to other possibilities (Table 3). That is, at 80 ppi the error rate is nominally equivalent to that at even the higher 100 ppi, but with significantly reduced “scaling+zoning” processing time (from 5.7 sec/page to 4.1 sec/page). Compared to the lower resolutions, the 80 ppi option results in both improved error rate and equal or improved performance (the one exception to the latter is at 50 ppi, in which the combined processing time drops from 4.1 sec to 3.5 sec, but with a doubling in the error rate). 2. Zoning analysis. The zoning analysis engine was designed for a per-decision error rate of 0.1% (99.9% accuracy on segmentation, classification and bit-depth assignment) with a 75 ppi zoning analysis raster. If, on an average page, there are 10 regions, each of which must be segmented, classified and have its bit-depth assigned, then there are 30 decisions per page. At a per-decision error rate of 0.1%, this results in a per-page error rate of 100%x(1-(0.999)30), or 2.96%. The per-page error rate using an 80 ppi raster on a test set of ~700 pages was 3.1% (Table 3), indicating that a rough estimate for decisions/page was approximately 30. It should be noted that this “rule of thumb” is complicated by the fact that the overwhelming majority of pages were grayscale, and so “decisions” on bit depth were generally limited to non-text regions. Since the mean number of regions per page was approximately 10, this implies that the per-decision error rate was actually higher than 0.1% in the test set. In fact, the overall error rate for the 1.2 x 10⁶ page corpus was originally 5.4%, indicating that the sample set of documents chosen was slightly more uniform in quality than the overall set. However, we did not break out the error rates by resolution for the overall corpus (since it was generated only once, at 80 ppi, for an obvious reason: more than 2 processor-years for corpus generation), but have no reasons to suspect any substantive difference for the overall corpus from that shown in Table 3.
Option Scale
Factor Scaled Resolution (ppi)
Time for Scaling (sec)
Zoning Page Error Rate (pct)
Zoning Time (sec)
1 4 100 2.2 2.9 3.5 2 5 80 2.1 3.1 2.0 3 6 66.7 2.6 3.4 1.8 4 7 57.1 2.5 4.0 1.6 5 8 50 2.0 6.2 1.5
Table 3. Possible scale factors, time to perform scaling and its impact on zoning analysis performance and accuracy. The zoning error rate is a by the page (see QA section to see why this is justified)—that is, if even one error occurs on a segmentation, classification or bit depth assignment decision on a page, it is considered a page error (thus, a 2.96% per page error rate corresponds to a 0.1% per-decision error rate—see text for discussion). The scaling and zoning times—and zoning
page error rates—are based on a sample set of ~700 pages, and so are relatively representative if not absolutely representative of the entire 1.2 x 10⁶ pages in the digital library (see text for details).
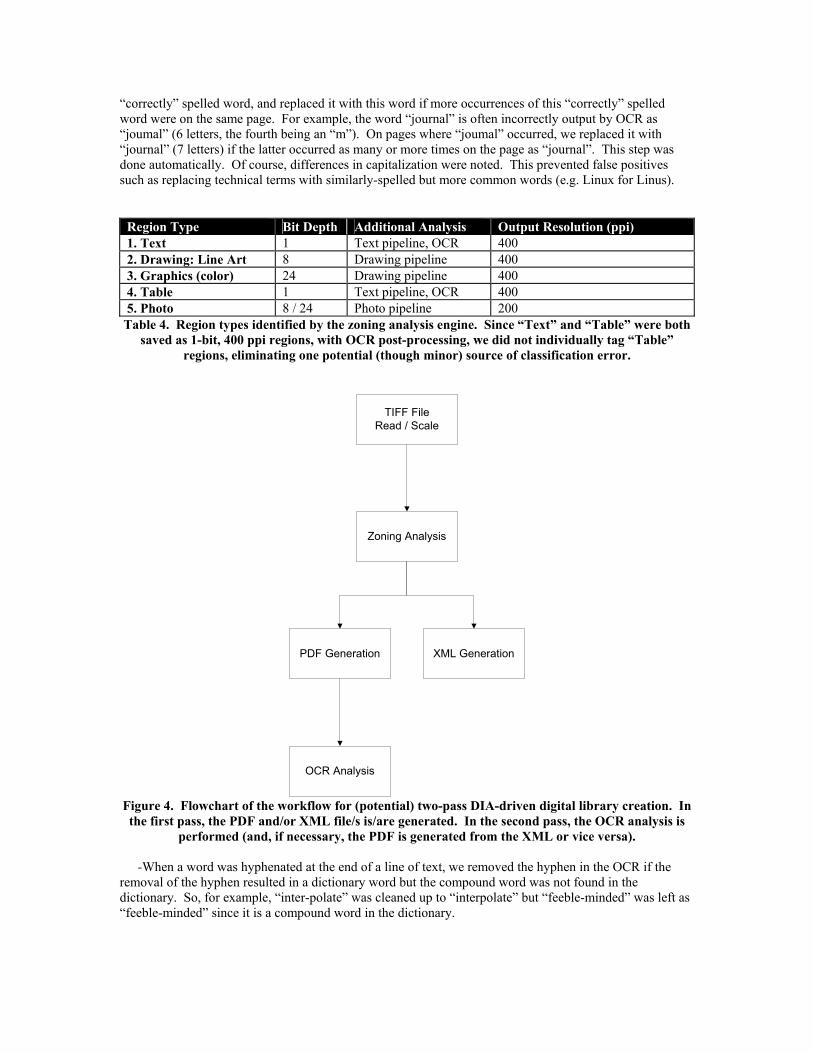
The zoning analysis classification and bit-depth assignment was limited to the region types described in Table 4. Because text and table regions were treated identically downstream from zoning analysis, we combined these regions into a single type (i.e. treated them both as text). Drawings and graphics were sharpened and snapped (similar to the pipeline used to clean up text), but no raster-to-vector conversion—for example, the creation of SVG [9]—was performed. Downstream analysis for photo regions consisted of blurring (via JPEG compression), and for text and table regions optical character recognition (OCR) was performed to generate ASCII/Unicode text from the raster.
3. OCR engine loading/analysis. In generating the MIT Press corpus, we integrated the OCR engine directly into the DIA workflow for two important reasons: (1) to allow OCR feedback to the zoning analysis engine, and (2) to generate overlain text in the PDF files in a single pass. The former we address shortly. The latter is for convenience. In a one-pass system, the following workflow is used (Figure 3):

We independently developed a DIA workflow engine that did not concomitantly generate OCR text—that is, no OCR engine was integrated—for purposes of performance and workflow comparison [17]. This system allows—but does not require—a “two-pass” approach, in which the OCR steps are deferred. PDF and XML files are generated in the first step. The flowchart for this workflow is shown in Figure 4.
TIFF FileRead / Scale
PDF Generation
OCR Analysis
Zoning Analysis
XML Generation
OCR Clean-up
Figure 3. Flowchart of the workflow for one-pass DIA-driven digital library creation. Notice that
there are two levels of feedback, one from the “OCR Clean-up” box back to the “OCR Analysis” box, and the second from the “OCR Analysis” box back to the “Zoning Analysis” box. In addition, a 2-
level feedback is possible; that is, “OCR Clean-up” information can be fed directly back to the “Zoning Analysis”—for example, hyphenation information can be fed back to the classification
engine in the zoning analysis system. We did not utilize this 2-level feedback, but rather allowed the “OCR Clean-up” information to affect the “OCR Analysis” directly (and “OCR Analysis”
information to affect the “Zoning Analysis” directly). In this matter, 2-level feedback was achieved indirectly.
4. OCR clean-up. OCR clean-up was straightforward in the MIT Press digital library, because all of the texts were written in English (some texts has foreign text in parts, but not in substantial quantity). We used a native-language dictionary to improve OCR as follows:
-When a word was ostensibly “misspelled”—that is, not in the dictionary—with a common glyph substitution, deletion or insertion, but spelled correctly with this error reversed, we changed the word to its
“correctly” spelled word, and replaced it with this word if more occurrences of this “correctly” spelled word were on the same page. For example, the word “journal” is often incorrectly output by OCR as “joumal” (6 letters, the fourth being an “m”). On pages where “joumal” occurred, we replaced it with “journal” (7 letters) if the latter occurred as many or more times on the page as “journal”. This step was done automatically. Of course, differences in capitalization were noted. This prevented false positives such as replacing technical terms with similarly-spelled but more common words (e.g. Linux for Linus).
Region Type Bit Depth Additional Analysis Output Resolution (ppi) 1. Text 1 Text pipeline, OCR 400 2. Drawing: Line Art 8 Drawing pipeline 400 3. Graphics (color) 24 Drawing pipeline 400 4. Table 1 Text pipeline, OCR 400 5. Photo 8 / 24 Photo pipeline 200
Table 4. Region types identified by the zoning analysis engine. Since “Text” and “Table” were both saved as 1-bit, 400 ppi regions, with OCR post-processing, we did not individually tag “Table”
regions, eliminating one potential (though minor) source of classification error.
TIFF FileRead / Scale
PDF Generation
OCR Analysis
Zoning Analysis
XML Generation
Figure 4. Flowchart of the workflow for (potential) two-pass DIA-driven digital library creation. In the first pass, the PDF and/or XML file/s is/are generated. In the second pass, the OCR analysis is
performed (and, if necessary, the PDF is generated from the XML or vice versa).
-When a word was hyphenated at the end of a line of text, we removed the hyphen in the OCR if the removal of the hyphen resulted in a dictionary word but the compound word was not found in the dictionary. So, for example, “inter-polate” was cleaned up to “interpolate” but “feeble-minded” was left as “feeble-minded” since it is a compound word in the dictionary.

5. OCR feedback to zoning analysis. After OCR clean-up took place, OCR results were obtained for “borderline” classified regions as follows. If a region was classified as text, but statistically it was close to being classified as a line drawing or else we had no statistical significance on its orientation, we performed OCR on the region more than once.
-Text vs. line drawing. Based on the thresholded pixels, we estimated how many words should be present in a region. Then we performed OCR on the region. If the number of OCR engine output words is less than 50% of the expected number of dictionary words, we declared the region a line drawing; otherwise, we kept the OCR results and declared the region a text region.
-Orientation. If it was unclear if the region was landscape or portrait, right-side up or upside-down text, we performed OCR sequentially until the same 50% dictionary look-up accuracy was obtained. If none of the OCR attempts reached 50% of expected, we declared the presumed text region to be a line drawing.
The information on orientation (portrait/landscape and upside down/rightside up) and/or classification (text/line drawing) was fed back to the zoning analysis, so that possible region clustering improvement could be made (for example, if a region had formerly been classified as “text” and was now classified as “line drawing”, the region could be combined with any apposing line drawing regions to simplify the segmentation). 6. PDF generation. PDF files were generated using custom-written PDF code because of licensing concerns. Our default compression scheme for text and line drawings was CCITT (now ITU) G4 compression, although Flate (Huffman encoding and LZ77) compression [25] was also allowed as an option. For photos, JPEG compression with a default quality setting of 95—that is, 95% quality—was implemented. Run-time options are discussed below. 7. XML generation. XML files were generated either in place of or in parallel with PDF files. A simple XML schema describing the region boundaries (segmentation), the region classification (region type), the region bit depth, and the region Z-order (Z-order is the level, in layers, of each region on a document—the background is level 0, overlying text is level 1, etc.) was implemented. 2.2. Timing
Timing information presented herein is based on runs of two books (~700 pages) on a Pentium-III laptop with 256 MB RAM and a clock speed of 1.13 GHz. The OCR engine loading and the actual character recognition process were the most prohibitive document image analyses performed in the project. The TIFF reading and scaling took 2-3 seconds, zoning analysis approximately 2 seconds, PDF generation 2-3 seconds, XML generation 1-2 seconds, OCR engine loading and analysis 20-30 seconds, and OCR clean-up and feedback 1-2 seconds. The mean page thus took 28-42 seconds to process. When the entire system for processing is accounted for [6], including page-based and book-based quality assurance, loading tapes and distributing files to a multiple-computer system, the overall processing time climbs to approximately one minute per page. This is 2.3 processor-years. 2.3. Run-time options
Because customer needs in quality, file size, and the ability to extract further information from the files will vary, we built many options into the DIA engine. Some of the more salient options are described here. 1. Input Directory. Where the files to be analyzed are located 2. Output Directory. Where the files (PDF, XML) that are created are to be stored. 3. Output region resolution. The default is 400 ppi for all regions to allow maximum re-purposability, although it can be specified to be lower (e.g. 200 ppi) to reduce file size. 4. Skew detection and correction. Skew of the files is automatically computed as part of the zoning analysis. If needed, the skew can be corrected. 5. Auto-exposure. If the scanned files are under-exposed, they can be corrected automatically (auto-exposure). 6. Bit depth for text (default 1) can be set to 8. 7. Bit depth for drawings (default 8) can be set to 1, 8, or 24. 8. Bit depth for photos (default 8) can be set to 1, 8 or 24.

9. JPEG quality can be set anywhere in the range of 0-100%. JPEG compression is used for all 8- and 24-bit regions in the output PDF files. The default setting for “quality” is 95%. This can be used to automatically make the file sizes match a pre-imposed restriction. 10. The users can choose to generate PDF and/or XML file output per their needs. 11. The user can choose between CCITT/G4 and Flate compression [25] for the 1-bit regions. 12. The user can force the zoning regions to be all rectangular (termed Manhattan layout, this is useful to simplify the zoning results, and in QA to give it a second chance to passed automatic QA). This is the “-rects” option shown in Figure 5. 13. The user can also force the zoning region to be a single black and white region (which is appropriate, for example, if the document is all text). This is the “-1bw” option shown in Figure 5. 14. The user can force the zoning regions to be all rectangular and to be either 1-bit (binary text) or 8-bit gray (this works well for true Manhattan layouts with only text and 8-bit gray regions). This is the “-rectgray” option in Figure 5. 15. The user can, additionally, force the zoning region to be a single 8-bit (gray) rectangle (this works well for true Manhattan layouts with no text regions). This is the “-1gray” option in Figure 5. 16. Finally, if the default zoning analysis and the options in (12-15) above do not pass automated QA, the user can use the ground truth schema (XML) as input for the zoning analysis (this allows 100% accurate zoning analysis to be specified using the separate Ground Truthing Engine application, also described below). This is the “-gt” option in Figure 5. We discuss the options 12-16 in more detail in the next section. 3 Quality Assurance
Automatic quality control during document image capture is an integral part of the MIT Press digital library system. We discuss automated quality assurance (QA) for code that we are responsible for (zoning analysis); we discuss improving the output of commercial-off-the-shelf (COTS) software such as OCR in terms of meta-algorithmics in the next section. QA is performed on a per-page basis. This is done for several reasons, the most important of which are (1) the distribution of tasks among processors hooked together for the project is done on a per-page basis, (2) the QA metric for zoning analysis (Figure 5) is based on comparing a single output page to its original TIFF page, and (3) the zoning on a per-page basis is often quite simple for most pages, allowing us to readily “rank” QA candidates for zoning.
As shown in Figure 5, our zoning analysis default is to call the API method AnalysisNew() that performs default segmentation and classification. This is followed by the method AnalysisAlterRegionPresentationAfterZoning() that enforces a specific region manager on the output of AnalysisNew(). For our purposes, we chose to have non-overlapping regions and to treat tables identically to text in this step. As noted in Table 3, 96.9% of the ~700 pages in our sample set passed subsequent QA without error after this step. Thus, in the first “decision diamond” shown in Figure 5, the question “Passes AutoQA?” is 96.9% YES, 3.1% NO.
For the 3.1% of documents that failed “AutoQA” after the default zoning analysis, the next “zoning analysis candidate” was used. We based the order of the next four engines on their conditional probabilities. Given a page has failed the original zoning analysis, which (if any) of the “-rects”, “-1bw”, “-rectgray” and “-1gray” options is most likely to correctly zone the page?
This ordering is important, because after the original zoning analysis engine has failed, the remaining zoning analysis candidates are simply guesswork. Moreover, each subsequent analysis attempt requires that a PDF output file be generated and compared to the original TIFF file using a regenerated TIFF file. This is a time-consuming process. However, since each subsequent attempt reduces the error rate substantially, by the time the “-1gray” option has been exhausted, the error rate has dropped from 3.1% to 0.8%.
A ground-truthing engine [10,11] is used as the final step in the QA of our digital library creation system. When automatic QA cannot be passed, a human operator needs to examine the document and specify the correct page layout. In creating the MIT Press digital library, as noted, 99.2% of all pages passed automatic QA after the completion of the method AnalysisForceGrayRectangularPageRegion() shown in Figure 5. The automatic QA assessment is performed using a verifier in which the PDF output file of the page gets regenerated as a TIFF image, which is then compared to the original scan [6]. Large deviation between the two images implies an error in page processing.

AnalysisForceManhattanRegions()mitprocess -rects -o outdir indir
START
AnalysisForceRectangularPageRegion()mitprocess -1bw -0 outdir indir
AnalysisForceManhattanTextAndGrayRegions()mitprocess -rectgray -0 outdir indir
AnalysisNew()AnalysisAlterRegionPresentationAfterZoning()
mitprocess -0 outdir indir
Use GroundTruthing Applicationon File to input desired regions via an XML file
mitprocess -gtxml -0 outdir indir
PassesAutoQA?
PassesAutoQA?
PassesAutoQA?
PassesAutoQA?
STOP
NO
NO
NO
NO
YES
YES
YES
YES
AnalysisForceGrayRectangularPageRegion()mitprocess -1gray -0 outdir indir
PassesAutoQA?
YES
NO
Figure 5. The distinct zoning analysis steps in the MIT Press digital library generation. Each of the analysis techniques, and the automatic quality assurance (“AutoQA”) are described in detail in the
text. Command-line invocations are listed in small text under the API method name(s).
While automated QA techniques provide us with 99.2% success rate, the remaining 0.8% has to be processed manually (the “–gt” option in Figure 5). On our 1.2 x 10⁶-page corpus, this turns out to be nearly 104 pages that either have to be looked at by a human operator or else run in “copier” mode (i.e. the page is directly copied to the output PDF with OCR run separately, a visually less appealing option). Pages that fail automated QA are usually indicative of low-contrast scanned originals: failures occur due to rendering photos in 1-bit and/or rendering line drawings in grayscale (8-bit). Most are binarization/gray issues, whereas lost regions and segmentation errors are mainly captured by the automated QA.
It should be noted that the pages that fail automated QA are converted into a useful (because they are the hardest to zone!) collection of truthed documents, which can then be used to benchmark zoning engines.
One unrelated but still important type of QA was also performed on each book in the MIT Press collection during the generation of the digital library. A special set of modulation transform function (MTF) targets (two sets of horizontal and two sets of vertical parallel lines, each of these four regions measuring 0.48” x 0.48”, with a target having 70 lines/inch, or lpi, and the other 30 lpi in each set) was pasted onto the title page of each book. Zoning analysis was then cued to look for this specific set of MTF targets. After identifying them, the MTF was computed in both the horizontal and vertical direction from: MTF = (Max – Min pixel value, 70 lpi target) / (Max – Min pixel value, 30 lpi target)
Sample output for MTF is shown here: <?xml version=\"1.0\"?> <!DOCTYPE MTF SYSTEM \"mtfdest.dtd\"> <MTF> <VERT_MTF>0.93</VERT_MTF>

<HORIZ_MTF>0.91</HORIZ_MTF> </MTF>
This was used to track the quality of the scanning throughout the project.
4 Data Considerations: Content Extraction and Re-Mastering via Meta-Algorithmics
In addition to the needs of our customer, MIT Press, we used the digital library creation as an opportunity to perform content extraction, recognition, tagging, and linking within the books (and journals) in the set. The output of zoning analysis, the output of OCR, and additional content extraction processes discussed in this section benefited from meta-algorithmic tools we have worked with in a variety of content extraction fields. 4.1. Content extraction overview
The customer requirements were merely a starting point for our digital library creation. In addition to creating PDF output with searchable text, we developed the following additional digital library-enhancing technologies: 1. Tagging of the books based on table of contents/chapter tagging [13]. 2. Journal splitting of the MIT Press journals [16].
The above two technologies are part of document logical structure analysis. Compared with previous research [19,20], the algorithms were designed to be generic and robust against OCR errors. In order to achieve such goals, we employed a statistical rather than rule-based approach. In intermediate steps, we avoided hard decisions by using quantitative scoring.
The basic idea relies on two criteria that are true for most long electronic books. First, there is an existing Table of Contents (TOC) in the document. The TOC need not be explicitly labeled, and one of our goals is to locate the TOC pages. Second, we assume that the text (for example, the article names and author names) in the TOC also appears on the start pages of individual chapters/articles. The algorithm matches the text in the TOC with the text in non-TOC pages. The detected good matches form the foundation of journal splitting and tagging of the electronic books. We utilized dynamic tree-structured dictionaries and directional graphs to make the algorithm more efficient. In addition, multiple sources of information were fused together. We took into account other factors such as page numbers, font size, and alphabet cases.
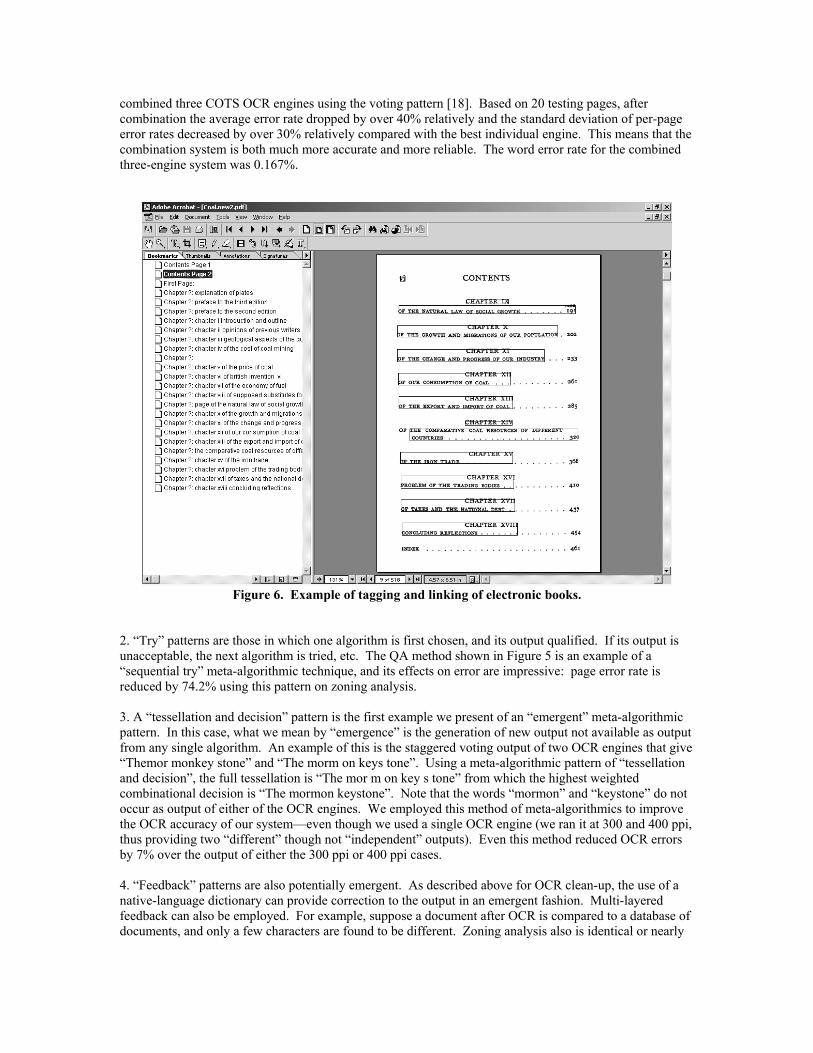
Figure 6 displays an example. The left panel contains bookmarks automatically generated from the TOC pages. Each bookmark corresponds to one chapter or article. The right panel is a TOC page. The rectangles are also automatically generated from the above algorithms. Each rectangle is linked with one chapter or article. 4.2. Overview of Meta-Algorithmics and Application to the MIT Press Digital Library Creation
Meta-algorithmics are design patterns and system methods for combining the output of two or more algorithms. We have defined and refined these patterns in performing content understanding over the past few years [7,8]. Several of the patterns are defined here:
1. “Voting” patterns use the output of 3 or more algorithms. While a variety of voting methods (plurality, majority, weighted, conditional, etc.) can be employed, the fundamental principal behind voting is that each algorithm has a certain “voting clout” under any situation. The interpretation of the content with the highest overall “voting clout” is the interpretation accepted. For example, suppose we have three algorithms A, B, and C, and they have, respectively, voting clout of 100, 70 and 60 in a given decision. Clearly, we will accept the output of algorithm A unless algorithms B and C agree with each other and disagree with A. One of the biggest challenges in our re-mastering project was to keep consistent OCR quality for a variety of printed materials under unattended environment. In order to achieve this goal, we
combined three COTS OCR engines using the voting pattern [18]. Based on 20 testing pages, after combination the average error rate dropped by over 40% relatively and the standard deviation of per-page error rates decreased by over 30% relatively compared with the best individual engine. This means that the combination system is both much more accurate and more reliable. The word error rate for the combined three-engine system was 0.167%.
Figure 6. Example of tagging and linking of electronic books.
2. “Try” patterns are those in which one algorithm is first chosen, and its output qualified. If its output is unacceptable, the next algorithm is tried, etc. The QA method shown in Figure 5 is an example of a “sequential try” meta-algorithmic technique, and its effects on error are impressive: page error rate is reduced by 74.2% using this pattern on zoning analysis. 3. A “tessellation and decision” pattern is the first example we present of an “emergent” meta-algorithmic pattern. In this case, what we mean by “emergence” is the generation of new output not available as output from any single algorithm. An example of this is the staggered voting output of two OCR engines that give “Themor monkey stone” and “The morm on keys tone”. Using a meta-algorithmic pattern of “tessellation and decision”, the full tessellation is “The mor m on key s tone” from which the highest weighted combinational decision is “The mormon keystone”. Note that the words “mormon” and “keystone” do not occur as output of either of the OCR engines. We employed this method of meta-algorithmics to improve the OCR accuracy of our system—even though we used a single OCR engine (we ran it at 300 and 400 ppi, thus providing two “different” though not “independent” outputs). Even this method reduced OCR errors by 7% over the output of either the 300 ppi or 400 ppi cases. 4. “Feedback” patterns are also potentially emergent. As described above for OCR clean-up, the use of a native-language dictionary can provide correction to the output in an emergent fashion. Multi-layered feedback can also be employed. For example, suppose a document after OCR is compared to a database of documents, and only a few characters are found to be different. Zoning analysis also is identical or nearly

identical for these documents. Then, the scanned document can be considered equivalent to the database document, and thus all OCR errors are instantly corrected.
Figure 7. Voting pattern used for the combination of 3 COTS OCR engines.
These and other meta-algorithmic patterns provide a way to improve on algorithmic accuracy (and often, performance) without involving the user in trying to improve individual algorithm accuracy. We used different patterns for different content extraction problems: an analysis of the algorithm and the problem it is intended to solve allow the user to choose the appropriate meta-algorithmic pattern to apply. Examples of how the correct pattern can be determined are overviewed here: 1. Number of similar algorithms in a population of algorithms. Clearly, if only one algorithm is available for a certain transformation, then “combinatorial algorithmics” are usually only possible if the single algorithm can be run with different settings (such as the OCR example above) 2. Non-emergent vs. emergent patterns. As discussed above, some algorithms allow “emergence”, others do not. Usually, this can be discerned at design phase as follows: “any algorithm whose data are composites or sets (that is, a more primitive data type can be decimated to) can use an emergent pattern.” This is not to say some data massaging need not occur. 3. Sequencing patterns. Suppose data must be transformed from A to F. Obviously, then, there are 4! = 24 possible pathways from A to F (e.g. ABCDEF, ABCEDF, … , ADECBF, AEDCBF), not allowing for the moment for the added complexity of multi-step transformations (e.g. the difference between A to B to C in one step versus A to B and then B to C in two steps). Which transformation sequences are allowable? What are the relative cost, performance, and output quality in each of these possible paths? (a) Sequential classification schemes are those used to adduce the sequencing in non-independent multi-level classification tasks. An example is in speech classification, wherein the classification task may be to determine the age, gender and accent of a speaker. Clearly, if P(A) is the probability distribution for age, P(B) is the probability distribution for gender, and P(C) is the probability distribution for accent, then clearly if the distributions are all independent, P(A|B|C) = P(A|C|B) = … = P(C|B|A). However, this is unlikely, because it is likely more accurate to first determine gender and then age than the reverse. With multiple transformation steps, clearly, sequencing matters.

(b) Multi-layered feedback algorithms are those in which higher-confidence data at one layer can be used to improve lower-confidence data at another layer. For example, in a text-based document, identification of key phrases or topics in a document can be used to improve earlier character and word level data. Suppose, for example, in a document after OCR there are several occurrences of the word “modem” and “modern” in a page (this is a common OCR error, since both words are legitimate and the character “m” and the two characters “r” and “n” are often confused. Next, if the document is found to be about low-speed Internet access, the balance may tip in favor of “modem”, whereas if it is found to be on surrealism and Dadaism, the balance may tip in favor of “modern”. Part of our effort to minimize content errors is in determining, when data proceeds from more primitive to more composite data, which layers fed back to more primitive layers are more effective in improving the system’s accuracy, performance, etc. 4. Establishing confidence and related patterns. Any time content processing occurs, the user wants to be confident that the transformations on the data are as accurate as possible. Given the imperfect nature of data transformation in document image analysis, confidence (statistical) measurements and reporting are of high importance. Various content systems, including text, zoning and speech recognition systems both within HP-Labs and Commercial-off-the-Shelf (COTS), report confidence values. These can be used, for example, in weighted voting schemes.
Establishing confidence can also be used upstream to sequencing. Predictive statistics can be used to plan for processing times, bandwidth availability, and other resources, allowing for a smoother, better-integrated content processing environment. Confidence statistics can also be used to determine the implications of choosing different transformation pathways, as introduced above. For example, estimating the relative effects on error of pathways such as ABCD versus ACBD can be compared to the availability of resources for transformations A-C, A-B, B-C and C-B to determine a throughput/accuracy tradeoff that is acceptable to the user. In addition, meta-algorithmics can be used to determine the extent to which transformational accuracy can possibly be improved (and simultaneously how independent two or more transformational algorithms are): IF = (Pcomb – PMAX)/(Ptheoretical – PMAX) where IF is the independence factor, Pcomb is the actual recognition rate (accuracy) of the combined classifiers (algorithms), Ptheoretical is the theoretical limit on the recognition rate of the combined classifiers (assuming all classifiers are statistical independent; i.e. uncorrelated), and PMAX is the best recognition rate of the individual classifiers [7]. If the value for IF is close to 1.0, then we will be more likely to combine algorithms to improve accuracy; if the value for IF is close to 0.0, we are likely to simply use the most accurate classifier/algorithm to ensure performance optimization. This is an important metric for “content re-mastering”—eliminating any errors engendered during the creation of the digital library. 5 Output
During the MIT Press digital library creation, we performed parallel tagging of images via two distinct methods: (1) through the parallel creation of PDF and XML output, and (2) through the tagging and journal splitting techniques described above. We used the XML output as an independent representation of the library; for example, we stored keyword, summarization and document-document linking fields in our XML output that we did not include in our PDF generation.
Because we wanted our output to be backward-compatible to Acrobat Reader 3.0, we used CCITT/G4 or Flate compression [25] for 1-bit data, and JPEG compression for 8- and 24-bit data. To make the end document files (PDF’s) compress better, newer compression techniques such as JPEG2000 and JBIG could be employed in the future. Such techniques are used, for example, with DjVu [14] files.
We chose PDF files for a number of reasons. The most important was that is was a customer specification, of course. However, the long-term support of PDF is also a good justification. The ready availability of PDF converters to create other important formats, such as eBook and HTML [15], is also justification. This ensures that the digital library will be readily legible on GUIs, eBooks, PDAs and other reading devices in the future.
6 Discussion and Conclusions In retrospect, the re-mastering effort used to generate the MIT Press digital library has a couple of unique characteristics compared with other digital library projects [19,22]:
First, we had complete control of most of the DIA algorithms that were involved in the production, from the preprocessing of the images to the output of PDF files. The only third-party software was OCR (We only utilized the pure character recognition capability of the OCR engines without tapping their other functionalities like preprocessing, layout analysis, and PDF generation). Besides the obvious economic incentive of reduced licensing cost, the most important reason for doing so was to guarantee the quality of the generated PDF files. Actually, we had tested the end-to-end (from TIFF to PDF) processing using several leading commercial OCR packages. Our conclusion was that their “turn-key” solutions would not be sufficient (our zoning engine greatly outperformed COTS OCR engines in graphics, line drawings and table segmentation and classification). Additionally, in order to implement the multi-pass QA workflow discussed earlier, we must be able to run the zoning engine in different customized modes, which were absent in most commercial OCR SDKs.
Second, human interaction was very limited in the production operations. This project was chartered to a research pilot led by HP Labs with little outside operational support, and the conversion from TIFF to PDF was completely designed, developed and deployed by the relatively small research team. Thus, as our top design goal, we wanted to automate things as much as possible while still maintaining the required high quality standard. A couple of factors helped us achieve this goal. In addition to the full control of most DIA technologies needed, integrated meta-algorithmic and QA techniques significantly benefited the generation of the MIT Press digital library. Full control of the DIA technologies allowed “simple” fixes, such as the auto-exposure and gamma correction shown in Figures 1-2, to be implemented. Automated MTF analysis provided cues to the zoning analysis engine on the quality of the original scan. Closed-loop QA allowed sequential zoning analysis attempts in an automated fashion, which reduced by nearly a factor of four the number of documents that required ground truthing by the ground truthing engine. The production of the ground truthing engine itself was a “parachute” for any residual QA. Finally, the meta-algorithmic techniques, particularly for the OCR clean-up, helped to further reduce the error rates in content generation.
In brief, this re-mastering effort is “technology-rich”, but nearly “operator-free”. This strategy motivated us to invent many novel DIA techniques. Although it is true that DIA is much more mature than a couple of decades back, there remain many interesting challenges in serious DL creation projects, some of which are addressed in this paper. As Henry Baird mentioned in his ICDAR 2003 opening talk [21], there is still “urgency of the need for solutions”, which is largely on the shoulder of the DIA R&D community. 7 Acknowledgements
The authors enthusiastically thank the following individuals for their tremendous technical, management and vision support provided throughout the MIT Press collaboration: Joann Becker, Igor Boyko, John Burns, Terry Ehling, Robin Gallimore, Douglas Heins, Glen Hall, Sheelagh Hudleston, Andrew Page, Yan Xiong and Sherif Yacoub. The authors also particularly thank Margaret Sturgill for all of her work on the DIA engine! We also thank numerous other colleagues and friends at HP Labs and MIT Press who have worked behind the scenes to make this interaction successful. 8 References [1] MIT Press Classics book collection release notice, http://mitpress.mit.edu/main/feature/classics/MITPClassics_release.pdf.
[2] MIT CogNet, http://cognet.mit.edu.
[3] F.M. Wahl, K.Y. Wong, and R.G. Casey “Block Segmentation and Text Extraction in Mixed/image Documents,” Computer Vision Graphics and Image Processing, vol. 2, 1982, pp. 375-390.
[4] S.V. Revankar, and Z. Fan, “Image Segmentation System”, U.S. Patent 5,767,978, January 21, 1997.

[5] J. Shi and J. Malik, “Normalized Cuts and Image Segmentation,” IEEE Trans Pattern Analysis Machine Intelligence, vol. 22, no. 8, 2000, pp. 888-905.
[6] S. Yacoub, “Automated quality assurance for document understanding systems,” IEEE Software, May/June 2003, pp 76-82.
[7] X. Lin, S. Yacoub, J. Burns, and S. Simske, “Performance Analysis of Pattern Classifier Combination by Plurality Voting,” Pattern Recog. Letters, vol. 24, no. 12, 2003, pp. 1959-1969.
[8] S. Yacoub and S. Simske, “Meta-algorithmic Patterns”, Hewlett-Packard Technical Report HPL-2002-106, 2002. [9] "Scalable Vector Graphics Specification", http://www.w3.org/TR/SVG/.
[10] M. Sturgill and S.J. Simske, “A Proofing, Templating and Purposing Engine in Java and C#/.NET,” Hewlett-Packard Technical Report HPL-2002-272, 2002.
[11] S. Simske and M. Sturgill, “A Ground Truthing Engine for Proofsetting, Publishing, Re-purposing and Quality Assurance,” DocEng 2003, ACM Symposium on Document Engineering, Grenoble France, Nov. 20-22, 2003.
[12] S. Simske, “The Use of XML and XML-Data to Provide Document Understanding at the Physical, Logical and Presentational Levels,” Proceedings of the ICDAR99 Workshop on Document Layout Interpretation and its Applications, Sept.1999.
[13] X. Lin and S. Simske, “Automatic Document Navigation for Digital Content Re-mastering,” to appear in Proceedings of SPIE Conference on Document Recognition and Retrieval XI, San Jose, January 2004.
[14] DjVu Home Page, http://www.djvuzone.org/.
[15] PDF Conversion Company Home Page, http://www.pdf-services.com/index.htm.
[16] X. Lin, “Text-mining based journal splitting,” Proceedings of ICDAR 2003, Edinburgh, UK, August 2003, pp. 1075-1079.
[17] X. Lin and J. Burns, “Using OCR in ‘Run Once, Use Everywhere’ Manner to Facilitate Re-use in a Document Processing Workflow,” Research Disclosure, June 2002, pp. 994-995.
[18] X. Lin, “Reliable OCR for digital content re-mastering,” Proceedings of SPIE Conference on Document Recognition and Retrieval IX, San Jose, 2002, pp. 223-231.
[19] G. Nagy, S. Seth, and M. Viswanathan, “A Prototype Document Image Analysis System for Technical Journals,” Computer, vol. 25, no. 7, 1992, pp. 10-22.
[20] S. Satoh, A. Takasu, and E. Katsura, “An Automated Generation of Electronic Library Based on Document Image Understanding,” Proceedings of ICDAR 1995, Tokyo, Japan, Aug 1995, pp. 163-166.
[21] H. Baird, “Digital Libraries and Document Image Analysis,” Proceedings of ICDAR 2003, Edinburgh, UK, August 2003, pp. 2-14.
[22] G.R. Thoma and G. Ford, “Automated Data Entry System: Performance Issues,” Proceedings of SPIE Conference on Document Recognition and Retrieval IX, San Jose, 2002, pp. 181-190.
[23] R. Cattani, T. Coianiz, S. Messelodi and C. Modena, “Geometric Layout Analysis Techniques for Document Image Understanding: A Review,” IRST Technical Report, Trento, Italy, 1998, 68 pp.
[24] S. Mao, A. Rosenfeld and T. Kanungo, “Document Structure Analysis Algorithms,” SPIE Symposium on Electronic Imaging Science and Technology, Santa Clara, CA, 2003, pp. 197-207.
[25] Flate/deflate compression web page, http://www.prepressure.com/techno/compressionflate.htm.


![Chapter 2: Understanding Libraries...Chapter 8: Advanced Gameplay Systems Mastering C++ Game Development [ 42 ] Mastering C++ Game Development [ 43 ] Mastering C++ Game Development](https://img.dokumen.tips/doc/110x75/5f049bb37e708231d40ed02c/chapter-2-understanding-libraries-chapter-8-advanced-gameplay-systems-mastering.jpg)