Embed Size (px)
Citation preview

1
Cooperative Research Centre
for National Plant Biosecurity
Final Report
CRC10001
Early warning of pre-emergent
emergency plant pest threats
Authors
Dean Paini, Susan Worner and David Cook
4 February, 2010
2
© Cooperative Research Centre for National Plant Biosecurity
All rights reserved
Project Leader contact details:
Name: David Cook
Address: CSIRO Entomology, Clunies Ross St, Acton, ACT 2601
Phone: +61 2 6246 4093
Fax: +61 2 6246 4000
Email: [email protected]
CRCNPB contact details:
Cooperative Research Centre for National Plant Biosecurity
LPO Box 5012
Bruce ACT 5012
Phone: +61 (0)2 6201 2882
Fax: +61 (0)2 6201 5067
Email: [email protected]
Web: www.crcplantbiosecurity.com.au
3
Table of contents
1. Executive Summary ....................................................................................... 8
2. Aims and objectives ..................................................................................... 10
3. Key findings ................................................................................................ 11
3.1. The SOM analysis .................................................................................... 11
3.2. Analysis of world wide data ....................................................................... 13
3.3. Analysis of Australian data ........................................................................ 21
3.4. Comparison with expert stakeholder opinion ............................................... 25
3.5. SOM sensitivity ....................................................................................... 27
3.6. SOM accuracy ......................................................................................... 36
3.7. US case study ......................................................................................... 49
3.8. SOMs and climate change ......................................................................... 56
4. Implications for stakeholders ........................................................................ 58
4.1. What have the SOMs told us? .................................................................... 58
4.2. How might the SOMs be used in its current form? ........................................ 58
4.3. What testing remains to be done? .............................................................. 59
4.4. How might the SOMs be used in future? ..................................................... 59
5. Recommendations ....................................................................................... 60
6. Abbreviations/glossary ................................................................................. 63
7. Plain English website summary ..................................................................... 63
8. Appendix .................................................................................................... 65
9. References ............................................................................................... 170

4
Tables Table 1. Top 100 risk list for insect pests from the SOM analysis. Lines indicate the three risk
categories utilised in the data analysis (see Section 3.5). For a full list see Appendix, Table 12. ....... 14
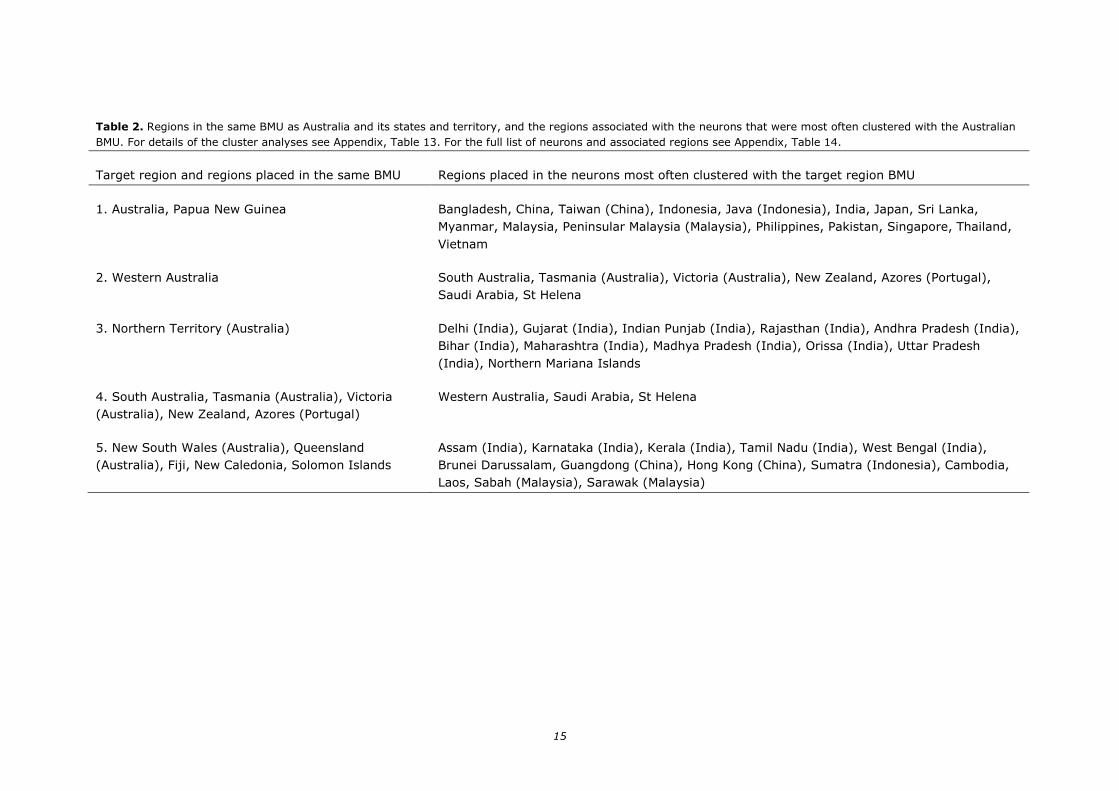
Table 2. Regions in the same BMU as Australia and its states and territory, and the regions associated
with the neurons that were most often clustered with the Australian BMU. For details of the cluster
analyses see Appendix, Table 13. For the full list of neurons and associated regions see Appendix,
Table 14. .............................................................................................................................. 15
Table 3. Species similarity indices between Australia and closely clustered regions. ....................... 18
Table 4. The top 20 countries exporting goods into Australia based on the mean monthly percentage
of total imports for 2007 (extracted from ABS, 2008). ................................................................ 19
Table 5. List of 58 of the world’s most invasive insect pests (Global Invasive Species Database -
http://www.issg.org/database) classified as either crop or forest pests or not. Of those that are crop
or forest pests, those that were present in the CABI CPC (CABI, 2003) are also indicated. .............. 20
Table 6. List of the insect pest families requested from states and territory to be submitted to the
Australian Plant Pest Database. ............................................................................................... 22
Table 7. A confusion matrix comparing the classification into 3 levels of likelihood of establishment by
the SOM analysis and Plant Health Australia (PHA)
(http://www.planthealthaustralia.com.au/site/Industry_Biosecurity_Plan_Mainpage.asp)................ 26
Table 8. Risk categories used by (a) Biosecurity Australia (Biosecurity Australia, 2001) and (b) the
three categories used in this analysis. ...................................................................................... 29
Table 9. Error rates present in the CABI CPC for 58 countries. Error rates were calculated using data
was extracted from Import Risk Assessments generated by the Australian Government’s Department
of Agriculture, Forestry, and Fisheries (http://www.daff.gov.au/ba/ira/final-plant). ........................ 30
Table 10. Spearman’s rank correlations comparing the original list generated by SOM with lists
generated from altered data. ................................................................................................... 33
Table 11. Weighting for the random selection of invasibility indices for regions in the virtual world. 38
Table 12. The full risk list for insect pest species absent from Australia. ...................................... 66
Table 13. The neurons clustered with Australia and its states and territory in cluster analyses using
seven different clustering algorithms. For a full list of the regions associated with these neurons see 72
Table 14. Full list of neurons and associated regions. ................................................................ 73
Table 15. NSW insect pest top 200 risk list generated from SOM analysis of Australian distributional
data. . * Species with the same risk index were ranked in alphabetical order................................. 78
Table 16. VIC insect pest top 200 risk list generated from SOM analysis of Australian distributional
data. . * Species with the same risk index were ranked in alphabetical order................................. 81
Table 17. TAS insect pest top 200 risk list generated from SOM analysis of Australian distributional
data. . * Species with the same risk index were ranked in alphabetical order................................. 84
Table 18. QLD insect pest top 200 risk list generated from SOM analysis of Australian distributional
data. . * Species with the same risk index were ranked in alphabetical order................................. 87
Table 19. NT insect pest top 200 risk list generated from SOM analysis of Australian distributional
data. . * Species with the same risk index were ranked in alphabetical order................................. 90
Table 20. SA insect pest top 200 risk list generated from SOM analysis of Australian distributional
data. . * Species with the same risk index were ranked in alphabetical order................................. 93
Table 21. WA insect pest top 200 risk list generated from SOM analysis of Australian distributional
data. . * Species with the same risk index were ranked in alphabetical order................................. 96
Table 22. NSW fungal pathogens top 200 risk list generated from SOM analysis of Australian
distributional data. . * Species with the same risk index were ranked in alphabetical order. ............ 99
Table 23. VIC fungal pathogens top 200 risk list generated from SOM analysis of Australian
distributional data. . * Species with the same risk index were ranked in alphabetical order. ........... 101
Table 24. TAS fungal pathogens top 200 risk list generated from SOM analysis of Australian
distributional data. . * Species with the same risk index were ranked in alphabetical order. ........... 103
5
Table 25. QLD fungal pathogens top 200 risk list generated from SOM analysis of Australian
distributional data. . * Species with the same risk index were ranked in alphabetical order. ........... 106
Table 26. NT fungal pathogens top 200 risk list generated from SOM analysis of Australian
distributional data. . * Species with the same risk index were ranked in alphabetical order. ........... 109
Table 27. SA fungal pathogens top 200 risk list generated from SOM analysis of Australian
distributional data. . * Species with the same risk index were ranked in alphabetical order. ........... 112
Table 28. WA fungal pathogens top 200 risk list generated from SOM analysis of Australian
distributional data. . * Species with the same risk index were ranked in alphabetical order. ........... 115
Table 29. NSW bacterial pathogens risk list generated from SOM analysis of Australian distributional
data. . * Species with the same risk index were ranked in alphabetical order................................ 118
Table 30. NT bacterial pathogens risk list generated from SOM analysis of Australian distributional
data. . * Species with the same risk index were ranked in alphabetical order................................ 119
Table 31. QLD bacterial pathogens risk list generated from SOM analysis of Australian distributional
data. . * Species with the same risk index were ranked in alphabetical order................................ 121
Table 32. SA bacterial pathogens risk list generated from SOM analysis of Australian distributional
data. . * Species with the same risk index were ranked in alphabetical order................................ 122
Table 33. TAS bacterial pathogens risk list generated from SOM analysis of Australian distributional
data. . * Species with the same risk index were ranked in alphabetical order................................ 124
Table 34. VIC bacterial pathogens risk list generated from SOM analysis of Australian distributional
data. . * Species with the same risk index were ranked in alphabetical order................................ 126
Table 35. WA bacterial pathogens risk list generated from SOM analysis of Australian distributional
data. . * Species with the same risk index were ranked in alphabetical order................................ 128
Table 36. NSW virus pathogens risk list generated from SOM analysis of Australian distributional
data. . * Species with the same risk index were ranked in alphabetical order................................ 130
Table 37. NT virus pathogens risk list generated from SOM analysis of Australian distributional data. .
* Species with the same risk index were ranked in alphabetical order. ......................................... 131
Table 38. QLD virus pathogens risk list generated from SOM analysis of Australian distributional data.
. * Species with the same risk index were ranked in alphabetical order. ....................................... 134
Table 39. SA virus pathogens risk list generated from SOM analysis of Australian distributional data. .
* Species with the same risk index were ranked in alphabetical order. ......................................... 136
Table 40. TAS virus pathogens risk list generated from SOM analysis of Australian distributional data.
. * Species with the same risk index were ranked in alphabetical order. ....................................... 138
Table 41. VIC virus pathogens risk list generated from SOM analysis of Australian distributional data.
. * Species with the same risk index were ranked in alphabetical order. ....................................... 140
Table 42. WA virus pathogens risk list generated from SOM analysis of Australian distributional data.
. * Species with the same risk index were ranked in alphabetical order. ....................................... 142
Table 43. Comparison of species risk rankings between the SOM analysis and PHA. ..................... 144
Table 44. The top 200 risk list for plant pathogen species absent from Australia. ......................... 149
Table 45. The top 200 risk list for plant pathogen species absent from NSW. .............................. 151
Table 46. The top 200 risk list for plant pathogen species absent from QLD. ............................... 153
Table 47. The top 200 risk list for plant pathogen species absent from VIC. ................................ 155
Table 48. The top 200 risk list for plant pathogen species absent from TAS. ................................ 157
Table 49. The top 200 risk list for plant pathogen species absent from NT. ................................. 159
Table 50. The top 200 risk list for plant pathogen species absent from SA. ................................. 161
Table 51. The top 200 risk list for plant pathogen species absent from WA.................................. 163
Table 52. Top 100 risk list of insect pests for the USA generated from a SOM analysis. ................ 165
Table 53. Comparison of SOM predictions of risk with species present in the NAPIS database. ....... 166
6
Figures Figure 1. SOM map with numbered neurons. Those neurons in which Australia, or one of its states or
territory, are placed are in bold. Refer to Appendix, ................................................................... 17
Figure 2. SOM of Australian insect distributional data. Red cells are neurons that do not have a state
or territory allocated to them. .................................................................................................. 23
Figure 3. SOM of Australian plant fungal pathogen distributional data. Red cells are neurons that do
not have a state or territory allocated to them. .......................................................................... 23
Figure 4. SOM of Australian plant bacterial pathogen distributional data. Red cells are neurons that do
not have a state or territory allocated to them. .......................................................................... 24
Figure 5. SOM of Australian plant viral pathogen distributional data. Red cells are neurons that do not
have a state or territory allocated to them. ............................................................................... 24
Figure 6. The proportion of species remaining in each risk category in response to an increasing level
of data alteration. .................................................................................................................. 31
Figure 7. The proportion of species remaining in the top 100 list in response to an increasing level of
data alteration. ...................................................................................................................... 32
Figure 8. The proportion of species remaining in each risk category in response to an increasing level
of data alteration for 31 randomly selected regions. The alteration rate for the remaining regions was
maintained at 10%................................................................................................................. 34
Figure 9. The proportion of species remaining in the top 100 list in response to an increasing level of
data alteration for 31 randomly selected regions. The alteration rate for the remaining regions
maintained at 10%................................................................................................................. 35
Figure 10. (a) For each species, the proportion of regions correctly predicted by SOM as being able or
unable to invade and establish in. Data generated from 100 simulations of the same virtual world and
with species initially distributed to 50% of the regions in which they could invade and establish in. (b)
Frequency distribution of species. Shaded area = 88% of species. ............................................... 40
Figure 11. (a) For each species, the proportion of regions correctly predicted by SOM as being able or
unable to invade and establish in. Data generated from 100 virtual worlds and with species initially
distributed to 50% of the regions in which they could invade and establish in. (b) Frequency
distribution of species. Shaded area = 87%. ............................................................................. 41
Figure 12. (a) For each region, the proportion of species correctly predicted by SOM as being able or
unable to invade and establish in. Data generated from 100 simulations of the same virtual world and
with species initially distributed to 50% of the regions in which they could invade and establish in. (b)
Frequency distribution of regions. Shaded area = 96%. .............................................................. 42
Figure 13. (a) For each region, the proportion of species correctly predicted by SOM as being able or
unable to invade and establish in. Data generated from 100 virtual worlds and with species initially
distributed to 50% of the regions in which they could invade and establish in. (b) Frequency
distribution of regions. ............................................................................................................ 43
Figure 14. (a) For each species, the proportion of regions correctly predicted by SOM as being able or
unable to invade and establish in. Data generated from 100 simulations of the same virtual world and
with species initially distributed to 10% of the regions in which they could invade and establish in. (b)
Frequency distribution of species. Shaded area = 95%. .............................................................. 44
Figure 15. (a) For each species, the proportion of regions correctly predicted by SOM as being able or
unable to invade and establish in. Data generated from 100 virtual worlds and with species initially
distributed to 10% of the regions in which they could invade and establish in. (b) Frequency
distribution of species. Shaded area = 71%. ............................................................................. 45
Figure 16. (a) For each region, the proportion of species correctly predicted by SOM as being able or
unable to invade and establish in. Data generated from 100 simulations of the same virtual world and
with species initially distributed to 10% of the regions in which they could invade and establish in. (b)
Frequency distribution of regions. Shaded area = 74%. .............................................................. 46
Figure 17. Frequency distribution for regions which only had between 1 and 9 species present
initially. Shaded area = 64%. The means that 64% of regions had 70% of species correctly predicted
by SOM as being either able or unable to invade and establish. ................................................... 46
7
Figure 18. (a) For each region, the proportion of species correctly predicted by SOM as being able or
unable to invade and establish in. Data generated from 100 virtual worlds and with species initially
distributed to 10% of the regions in which they could invade and establish in. (b) Frequency
distribution of species. Shaded area = 65%. ............................................................................. 47
Figure 19. Frequency distribution for regions which only had between 1 and 9 species present
initially. Shaded area = 69%. The means that 69% of regions had 70% of species correctly predicted
by SOM as being either able or unable to invade and establish. ................................................... 48
Figure 20. (a) Number of absent species in the top 100 risk list for each state of the contiguous USA,
(b) Mean number of other states in the contiguous USA an absent species in the top 100 risk list is
found (e.g. for Alabama, the 23 absent species in its top 100 risk list are found, on average, in 31
other states), (c) Percentage of absent species in a state’s top 100 risk list found in at least one
neighbouring state. ................................................................................................................ 51
Figure 21. Relationship between the number of incoming domestic flight passengers to a state and
the number of absent species in that state’s top 100 list (fitted curve: 17.96 + 20.04 × 0.749X). .... 53
Figure 22. Relationship between the gross state product and the number of absent species in that
state’s top 100 list (fitted curve: 10.81 + 31.73 × 0.995X). ......................................................... 54
Figure 23. Map of contiguous USA showing those states that were allocated to the same neuron in a
SOM analysis (same colour) and hence those states which have the most similar insect pest
assemblages. ........................................................................................................................ 55

8
1. Executive Summary
There are hundreds, perhaps thousands, of invasive species that have the potential to
arrive and establish in any particular region or country. Identifying which species are more
likely than others to invade and establish is extremely difficult, yet the capacity to do so is
vitally important to the biosecurity of a nation. Currently, government agencies consult
industry stakeholders and technical experts, as well as published data to generate a pest
risk assessment for a particular insect pest. While this can be valuable for many reasons,
any estimate of risk is ultimately subjective. An alternative is to use a more quantitative
modelling approach to generate more objective estimates of risk. One modelling approach
is to utilise a Self Organising Map (SOM), which is a type of artificial neural network. The
Early Warning of Pre-Emergent Emergency Plant Pest Threats (CRC10001) project has
investigated the use of the SOMs technique in quantitative risk assessments.
This report provides a detailed overview of the project and the path we have followed in
the development of the SOMs approach. Our research has explored the potential to use
SOM predictions of high-risk invasive species that could potentially affect Australian plant
industries. The report contains our experiences with using SOMs, and presents lists of
species ranked in order of their likelihood of establishment in Australia. This information
will be used primarily by state and federal government agencies charged with undertaking
the identification and assessment of external threats. The species lists we have generated
will assist in allocating pre-border and border biosecurity resources, and support the
development of pre-emptive approaches to threat mitigation. We also present the results
of SOMs analysis we conducted on the United States. These results demonstrate the
applicability of the SOMs technique to different countries and regions, and its potential use
by international biosecurity agencies.
The research methods we used can be summarised as follows. Presence and absence data
for pest species recorded over several hundred global geographic regions is used in this
analysis. An artificial neural network algorithm, the SOM, is used to classify geographic
areas based on similar pest species composition. Risk lists for regions are extracted from
the SOM analysis. These risk lists estimate the likelihood of a species establishing in that
region.
The key findings of our research were:
� SOM analysis is an extremely useful and cost effective method of generating
establishment probability indices for large numbers of species with minimal
computation time
� SOM analysis of world wide data reveals which regions around the world a potential
sources of future pests for Australia;
� SOM analysis of Australian data reveals that New South Wales (NSW) and Queensland
may already have the majority of pests and diseases present in Australia and few could
invade and establish from other states
� Comparing SOM-generated species lists of high-establishment-risk species with those
generated by Plant Health Australia reveals significant differences between rankings by
the two systems
� SOM methodology can generate robust risk lists resilient to error rates up to 20% in
the presence/absence data (Paini et al 2010). (see objectives (ii), (iii) and (vi) below);

9
� SOM methodology is extremely accurate in its ability to identify which species are able
to establish in a region. (see objective (ii) and (iii) below)
� SOM analysis applied to US species assemblages found the greatest threat to US states
to be those species present in the US as opposed to those outside, and
� The SOM methodology on its own is unable to incorporate climate change into its risk
lists as it requires future species assemblages in response to climate change (see
objective (iv) below).
The implications of this report for state and territory biosecurity agencies are that practical
tools are available that enable exotic pest species from different taxa to be prioritised on
the basis of their probability of becoming established in each region. This information has
not been available in the past, which has made resourcing of risk mitigation activities
difficult to justify. Based on the assemblages of species throughout the world, regional
biosecurity agencies now have access to a method of calculating the likelihood of a
particular species or group of species (for instance, those associated with a particular trade
pathway) becoming established in their area of influence.
Based on our findings, we have put forward the following recommendations:
1. The development of a communication strategy with Australian and international biosecurity agencies to encourage the uptake of SOMs as an effective risk identification technology
2. An online or PC-based SOM device be developed that is capable of producing country and (where possible) region-based estimates of exotic species potential to establish
3. The results of SOMs analyses that quantitatively express species establishment likelihoods should be incorporated into traditional forms of quantitative risk assessment
4. SOMs analysis can be incorporated in to existing pest risk analysis and import risk analysis methodologies
5. Strategies for the effective communication of risk and uncertainty in emergency plant pest prioritisation and preparedness decisions should form a part of future research proposals
6. Further research should be conducted on the use of SOMs (which identify high-risk species for a particular area) with methods identifying source regions for future invasive species under climate change, and
7. Caution must be exercised when quoting high-establishment-risk lists generated by SOMs using the Australian Plant Pest Database as data for some states and territories contains non-pest species, while for others there is insufficient data recorded.

10
2. Aims and objectives
There are seven objectives of the research project:
(i) Contrast the similarity approach to threat detection to the existing approached for
identifying pre-emergent emergency plant pest (EPP) threat and determine which is
the most robust approach to early warning of EPP threats
(ii) Develop a robust early warning capability for threat identification
(iii) Utilise a similarity approach based on that developed by Sue Worner, Lincoln
University to improve the capacity to identify pre-emergent EPPs
(iv) Incorporate within this a climate change scenario to determine the potential impact
of climate change of pest threats
(v) Data mine interception and Australian Pest and Disease databases; Department of
Primary Industry pest and disease records, and literature to identify those EPPs
already established in Australia and to identify EPPs that have a history of incursion
and identify pathways
(vi) Use a risk analysis approach to rank the threat posed by the pre-emergent EPPs
identified
(vii) Compare the pre-emergent EPPs identified through this process to those identified
using the PTQ/DTQ approach which follows the Food and Agriculture Organisation
(FAO) guidelines for pest prioritisation.

11
3. Key findings
3.1. The SOM analysis
Key finding:
SOM analysis is an extremely useful and cost effective method of generating establishment
probability indices for large numbers of species with minimal computation time.
Invasive species cause immense environmental and economic damage worldwide
(Blackburn et al., 2004; Traveset and Richardson, 2006; LaDeau et al., 2007; Asner et al.,
2008). There are currently large numbers of exotic species with the potential to invade
and establish within Australia, and of those species clearly identifying which are most likely
to become established is extremely difficult. But, from the point of view of policy-makers
trying to allocate biosecurity funds and resources to achieve the greatest amount of benefit
for society, the capacity to identify species with the highest establishment potential is
vitally important. Generally, biosecurity agencies worldwide consult industry stakeholders
and technical experts, as well as published data to generate risk assessments for particular
species (Pest Risk Analyses (PRA)) or potential entry pathways (Import Risk Analyses
(IRA)). Although a valid and often informative practice, the approach of asking individuals
their opinion about establishment potential requires species to be evaluated individually,
making it extremely time intensive to rank and prioritise large numbers of species.
Further, the reliance on expert testimony leaves the process susceptible to framing,
context dependence and motivational bias (Burgman, 2005), which may result in
misleading prioritisation. This is especially the case given that expert testimony can only
reflect upon the knowledge invested in the experts, which is seldom all encompassing. As a
consequence, it is difficult to assess all potential invasive pest species, and key threats
might be overlooked, particularly those where available knowledge and information is
lacking.
In addition, any estimate of establishment risk, though often based on a significant
amount of information, is ultimately subjective. Government organisations are, therefore,
continually searching for additional methods to prioritise pest lists and generate more
objective establishment estimates. One such approach is the use of climate envelope
models (Stephens et al., 2007) where the climatic parameters of a pest’s native range are
used to predict its likely exotic range. However, problems in the accuracy of these
predictions have been highlighted by several authors (Hulme, 2003;Sax et al., 2007).
Other statistical methods include generalised additive models (Bunnell et al., 2009),
boosted regression trees (Jacobs and Macisaac, 2009), maximum entry method (Brown et
al., 2008) and mechanistic niche modelling (Kearney and Porter, 2009). But, to rank and
prioritise hundreds of species using any of these approaches would again mean evaluating
each species individually. With so many species with invasive potential and of quarantine
significance to a country like Australia, the time required would be prohibitive and costly.
An alternative is to take a community ecology approach that studies the species
assemblage of a region. As such, a large number of species can be analysed
simultaneously and ranked according to their ‘likelihood’ of establishing in a particular
region based on species associations (i.e. any species that is commonly found with a
particular species assemblage is more likely to establish in a region where that species
assemblage is found). This would enable an initial screening of potential pests to a more
manageable number that could then be further analysed using any of the modelling
methods mentioned above. A self organising map (SOM), which is an unsupervised
artificial neural network, can be used to generate values that indicate the strength of
association of a species with a species assemblage, which can be used as a risk index.
12
Worner and Gevrey (2006) utilised invasive insect pest data from the Centre for
Agriculture and Biosciences International (CABI) Crop Protection Compendium (CPC)
(CABI, 2003) and constructed a SOM to classify and group 459 regions of the world into
clusters, based on their insect assemblages drawn from a global pool of 844 known insect
pest species. The insect assemblage present in a particular region captures a significant
proportion of biological, ecological, and abiotic factors that cannot be measured. Given the
assumption that regions with similar assemblages provide similar niches, Worner and
Gevrey were able to identify those regions with similar species assemblages to New
Zealand and hence those regions that may be of highest risk as a source of invasive
insects. In addition they were able to utilise the SOMs neuron weights to generate a
quantitative estimate of the risk of establishment in New Zealand for all 844 insect species
and we used this same dataset. This technique provides an innovative way of predicting
likelihood of establishment of a large number of species, and so adds valuable information
to the currently employed methods.
A SOM is an artificial neural network capable of converting high dimensional data into a
two dimensional map in which data points that are found close together on the map are
more similar than those that are further away. A SOM consists of two layers of artificial
neurons (or nodes), the input layer and the output layer. In the SOM, the input layer is
essentially the raw data and comprises 844 neurons (i.e. one neuron for each insect
species) with each neuron connected to all 459 regions. The output layer is the two
dimensional map comprising a suitable number of neurons, laid out in a hexagonal grid.
For this data set, a map of 108 neurons with dimensions of 12 rows by nine columns was
used (see Worner and Gevrey, 2006).
Each of the 459 regions contained within the CABI CPC data set occupies a particular point
in space of 844 dimensions. Each region’s position in this space is determined by the 844
element vector that is the presence or absence of all 844 insect pests in that region. The
SOM projects its 108 neurons into this space via neuron weight vectors. As with the region
vectors, these neuron weight vectors are comprised of 844 elements. In effect, each SOM
neuron is occupying a point in the same multidimensional space as the regions, thereby
allowing them to ‘interact’ with the regions (see below for further explanation)1.
These neuron weight vectors can be initially projected randomly into the multidimensional
space, but we use a linear initialisation that distributes the neuron weight vectors
corresponding to the first two eigenvalues of a principle component analysis. This linear
initialisation distributes the neuron weight vectors in a way that is more representative of
the raw data and significantly reduces the time taken to train the network and complete
the analysis (Kohonen, 2001).
When the analysis is initiated, each raw data point is assessed and the neuron that is
closest to a data point in this multidimensional space is deemed to be the best matching
unit (BMU). The neuron weight vector of the BMU is adjusted so that it moves closer to the
data point. Because all neurons are connected together similar to a large elastic net, the
process of one neuron moving exerts a gravitational force that drags other neurons in the
SOM with it. While each data point can be assessed individually, doing so means the
learning is highly dependent on the order in which data points are assessed (Worner and
1 Further details describing a SOM analysis can be obtained from (Kohonen, 2001;Worner and Gevrey, 2006).
13
Gevrey, 2006). Assessing data points simultaneously, using a batch algorithm solves this
problem, and this is the approach we used in our analysis.
Data points are repeatedly assessed and over time the neurons spread out to occupy
approximately the same area that the data points occupy in the multidimensional space.
When the analysis is complete each data point or region will have a BMU, which is its
closest neuron. Regions that have very similar pest assemblages will be located close
together in the multidimensional space and will have the same BMU. Each neuron
therefore occupies a point in the multidimensional space, which is described by its neuron
weight vector.
In this study the neuron weight vector is composed of 844 elements with each element
having a value between 0 and 1. Each element corresponds to one of the 844 insect
species and can be interpreted as a risk index or an index of how strongly that species is
associated with other species in that neuron and hence the species assemblage of any
region associated with that neuron. For Australia, the risk list generated would be the
neuron weight of its BMU. The analysis was performed using Matlab (Mathworks, 2007)
and the SOM Toolbox (version 2.0) developed by the Laboratory of Information and
Computer Science Helsinki University of Technology
(http://www.cis.hut.fi/projects/somtoolbox/).
Risk lists can subsequently be generated for Australia, its states and territory, and any
other regions in the dataset (see section 3.2).
3.2. Analysis of world wide data
Key finding:
SOM analysis of world wide data reveals which regions around the world are potential
sources of future pests for Australia.
In this section we generate a risk list for Australia using the same global pest dataset as
that used by Worner and Gevrey (2006).
The risk list for the top 100 insect pests of threat to Australia generated from the data is
shown in Table 1. Australia’s BMU (i.e. the neuron to which Australia is closest in the
multidimensional space) was the same neuron with which Papua New Guinea (PNG) is
associated. In addition, two other neurons were always clustered with Australia’s BMU
regardless of which clustering algorithm was used (Table 2). Countries associated with
these neurons that also happen to be prominent sources of Australian food imports include
China, Japan, Singapore, Thailand and Malaysia.

14
Table 1. Top 100 risk list for insect pests from the SOM analysis. Lines indicate the three risk categories utilised in the data analysis (see Section 3.5). For a full list see
Appendix, Table 12.
rank Insect pest species risk index rank Insect pest species risk index rank Insect pest species risk index
1 Scirpophaga incertulas 0.7924 35 Schizaphis graminum 0.4895 69 Helopeltis bradyi 0.3634
2 Oryctes rhinoceros 0.7722 36 Aproaerema modicella 0.4841 70 Phyllotreta striolata 0.3604
3 Sesamia inferens 0.7695 37 Xylotrechus quadripes 0.4835 71 Minthea rugicollis 0.36
4 Scrobipalpa heliopa 0.7128 38 Attacus atlas 0.4821 72 Idioscopus niveosparsus 0.3589
5 Marasmia exigua 0.6856 39 Ceratovacuna lanigera 0.4774 73 Scotinophara coarctata 0.3589
6 Diaphorina citri 0.6807 40 Bactrocera latifrons 0.4651 74 Naranga diffusa 0.3445
7 Aleurocanthus woglumi 0.6801 41 Hypothenemus hampei 0.4606 75 Liriomyza trifolii 0.3431
8 Leucinodes orbonalis 0.6748 42 Henosepilachna pusillanima 0.4605 76 Urentius hystricellus 0.342
9 Stephanitis typica 0.6675 43 Idioscopus clypealis 0.4589 77 Megymenum brevicorne 0.3326
10 Xylosandrus compactus 0.6632 44 Sternochetus frigidus 0.4586 78 Elaeidobius kamerunicus 0.3311
11 Pelopidas mathias 0.6446 45 Trichoplusia ni 0.4573 79 Aulacaspis tegalensis 0.3262
12 Dicladispa armigera 0.6378 46 Dialeurodes citri 0.4532 80 Bombyx mori 0.3194
13 Acherontia styx 0.6356 47 Pyrilla perpusilla 0.4499 81 Rhynchophorus vulneratus 0.3189
14 Chilo auricilius 0.6338 48 Chilo sacchariphagus 0.4491 82 Aulacophora foveicollis 0.3156
15 Nephotettix virescens 0.6279 49 Atherigona soccata 0.4395 83 Tessaratoma papillosa 0.3147
16 Planococcus lilacinus 0.594 50 Sinoxylon conigerum 0.4335 84 Statherotis discana 0.3145
17 Batocera rubus 0.5836 51 Cricula trifenestrata 0.4329 85 Cydia leucostoma 0.3132
18 Aulacophora lewisii 0.5702 52 Chilo partellus 0.4206 86 Bactrocera umbrosa 0.3105
19 Toxoptera odinae 0.5694 53 Orthezia insignis 0.4138 87 Pseudococcus jackbeardsleyi 0.3105
20 Orseolia oryzae 0.5676 54 Rhipiphorothrips cruentatus 0.4108 88 Perkinsiella vastatrix 0.3052
21 Odoiporus longicollis 0.5669 55 Batocera rufomaculata 0.41 89 Artona catoxantha 0.3043
22 Chilo infuscatellus 0.5559 56 Omiodes indicata 0.4097 90 Heterobostrychus aequalis 0.3037
23 Zeuzera coffeae 0.551 57 Plocaederus obesus 0.4047 91 Poecilocoris latus 0.3037
24 Helopeltis theivora 0.5425 58 Bactrocera tau 0.4008 92 Opisina arenosella 0.303
25 Hypomeces squamosus 0.5395 59 Adoretus versutus 0.3917 93 Chondracris rosea 0.2994
26 Orgyia postica 0.5343 60 Hieroglyphus banian 0.3888 94 Prays endocarpa 0.2905
27 Pinnaspis strachani 0.529 61 Rastrococcus iceryoides 0.3879 95 Chromatomyia horticola 0.2827
28 Rastrococcus invadens 0.519 62 Fulmekiola serrata 0.3834 96 Medythia suturalis 0.2746
29 Parasa lepida 0.5177 63 Phyllotreta chotanica 0.3803 97 Acherontia lachesis 0.2735
30 Papilio polytes 0.5119 64 Bactrocera zonata 0.3802 98 Aphis fabae 0.2704
31 Bactrocera dorsalis 0.5008 65 Melanagromyza obtusa 0.3747 99 Tetramoera schistaceana 0.2684
32 Hydrellia philippina 0.4957 66 Liriomyza huidobrensis 0.3743 100 Rhynchocoris poseidon 0.2682
33 Omphisa anastomosalis 0.4933 67 Tarophagus colocasiae 0.372
34 Erionota thrax 0.4931 68 Chilo polychrysus 0.3658
15
Table 2. Regions in the same BMU as Australia and its states and territory, and the regions associated with the neurons that were most often clustered with the Australian
BMU. For details of the cluster analyses see Appendix, Table 13. For the full list of neurons and associated regions see Appendix, Table 14.
Target region and regions placed in the same BMU Regions placed in the neurons most often clustered with the target region BMU
1. Australia, Papua New Guinea Bangladesh, China, Taiwan (China), Indonesia, Java (Indonesia), India, Japan, Sri Lanka,
Myanmar, Malaysia, Peninsular Malaysia (Malaysia), Philippines, Pakistan, Singapore, Thailand,
Vietnam
2. Western Australia South Australia, Tasmania (Australia), Victoria (Australia), New Zealand, Azores (Portugal),
Saudi Arabia, St Helena
3. Northern Territory (Australia) Delhi (India), Gujarat (India), Indian Punjab (India), Rajasthan (India), Andhra Pradesh (India),
Bihar (India), Maharashtra (India), Madhya Pradesh (India), Orissa (India), Uttar Pradesh
(India), Northern Mariana Islands
4. South Australia, Tasmania (Australia), Victoria
(Australia), New Zealand, Azores (Portugal)
Western Australia, Saudi Arabia, St Helena
5. New South Wales (Australia), Queensland
(Australia), Fiji, New Caledonia, Solomon Islands
Assam (India), Karnataka (India), Kerala (India), Tamil Nadu (India), West Bengal (India),
Brunei Darussalam, Guangdong (China), Hong Kong (China), Sumatra (Indonesia), Cambodia,
Laos, Sabah (Malaysia), Sarawak (Malaysia)
16
It should be noted that SOM estimations of establishment likelihood are based on current
distributions of species, which is inherently a function of historical pathways. If new trade
pathways become established, some species that have a restricted range due to pathway
limitation may invade new regions and species assemblages would be altered, thereby
altering SOM predictions. However, analyses conducted using simulations in a virtual world
of invasive pests indicate that SOM is able to predict even those species with restricted
ranges (see section 3.6) and we maintain our confidence in SOMs predictive powers.
Once a species’ risk of establishment is determined, further analysis of host availability and
distribution as well as possible entry pathways would be appropriate to assess overall risk.
That is, a species may have a high likelihood of establishment but if the pathway is absent,
then the likelihood of entry is low. In addition, species at the top of the list could be further
analysed using climate or niche matching models to identify specific regions within a
country at greatest risk from a pest species. Finally, information on economic costs of a
particular pest should also be considered. For example, the third highest pest species at
risk of establishing in Australia (Table 1) is Sesamia inferens (Lepidoptera: Noctuidae), and
while this species is a pest of rice, sugarcane, maize, sorghum and wheat, it is considered
the least destructive of the stem borer pests (CABI, 2003). An economic analysis might
suggest that despite this pest having a high likelihood of establishing in Australia, it may
not be considered a serious economic threat.
In contrast, Chromatomyia horticola (Diptera, Agromyzidae) is a very serious pest in
almost all countries in which it is found, causing serious damage to tomatoes, legumes,
lettuce, cruciferous crops and cucurbits, among others (CABI, 2003). Although this pest
was only ranked 95th in the top 100 risk list (Table 1) and has a low risk of establishment,
its potential to cause significant economic damage may motivate government authorities
to treat this pest as a more serious threat than indicated by establishment risk alone.
In addition to the pest rankings there is additional information provided by the SOM
analysis that can be utilised by biosecurity agencies. The first is determining which regions
have been allocated to the same neuron as the target region. For Australia, the only other
region associated with the same neuron is Papua New Guinea (PNG), indicating these two
regions have a significant percentage similarity in insect assemblage (48.4%). As such,
they may share similar climatic, biological and ecological characteristics and insect pests
that are established in PNG may therefore have a high risk of establishing in Australia.
Because this SOM analysis does not give ‘crisp edges’ to clustered regions of the world,
further analysis was performed by a conventional cluster analysis of the neuron weights.
As no one clustering algorithm is recommended, we repeated the cluster analysis using a
different clustering algorithm each time (single link, nearest neighbour, complete link,
furthest neighbour, average link, median sorting, and group average clustering) and
compared the results to determine which neurons were consistently clustered together.
This analysis was performed using GenStat (2007).
The regions belonging to these neighbouring neurons, though not such a close match to
the target region as those regions allocated to its BMU will have similar insect pest
assemblages and hence also represent a potential source of insect pests. Most neurons in a
SOM will have six neighbouring neurons unless it is on the edge of the map, where it will
have only four neighbours, or in the corner of the map, where it will have only three
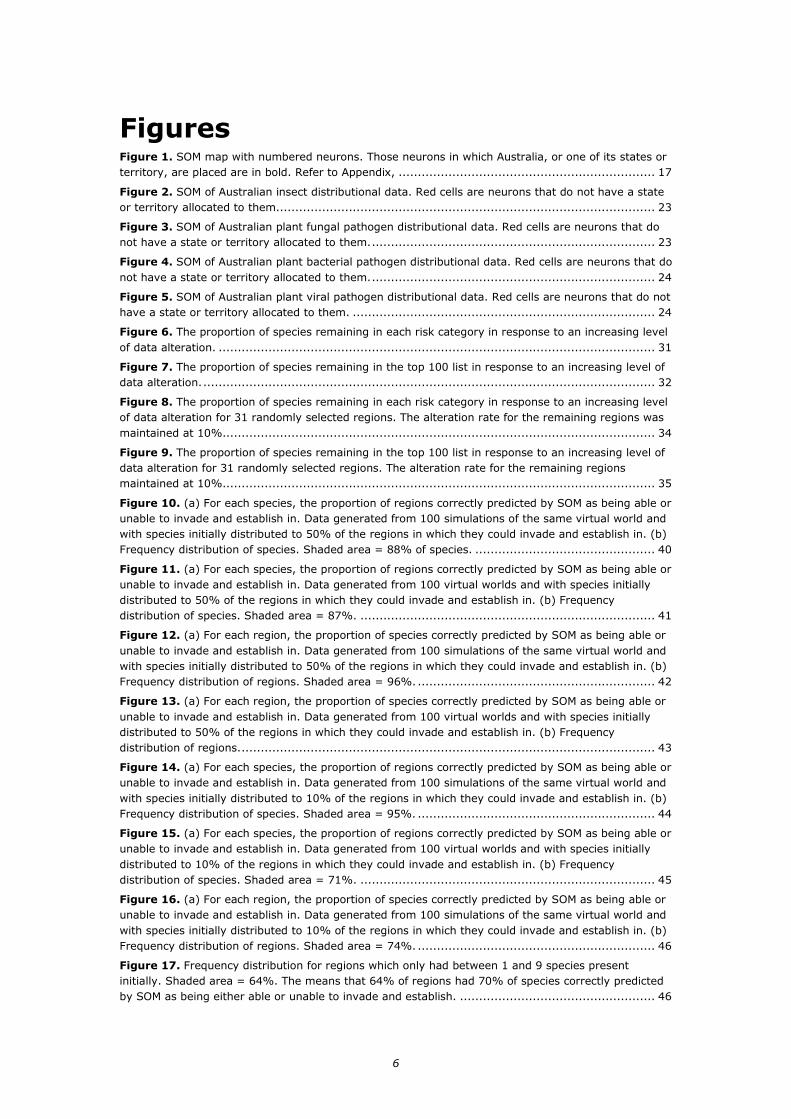
neighbouring neurons (Figure 1). These neurons occupy a point in the multidimensional
space and are not necessarily evenly distributed throughout this space. Some neighbouring
neurons may therefore be closer than others to a BMU. A conventional cluster analysis can

17
reveal which of these neighbouring neurons are closest to a BMU and hence which regions
are more similar to the target region. Australia’s BMU was on the edge of the map and it
therefore had only four neighbouring neurons. Of these four neurons, two were
consistently clustered with Australia’s BMU regardless of the clustering algorithm used
(Appendix, Table 13).
Figure 1. SOM map with numbered neurons. Those neurons in which Australia, or one of its states or
territory, are placed are in bold. Refer to Appendix, Table 14 for a full list of neurons and associated
regions.
18
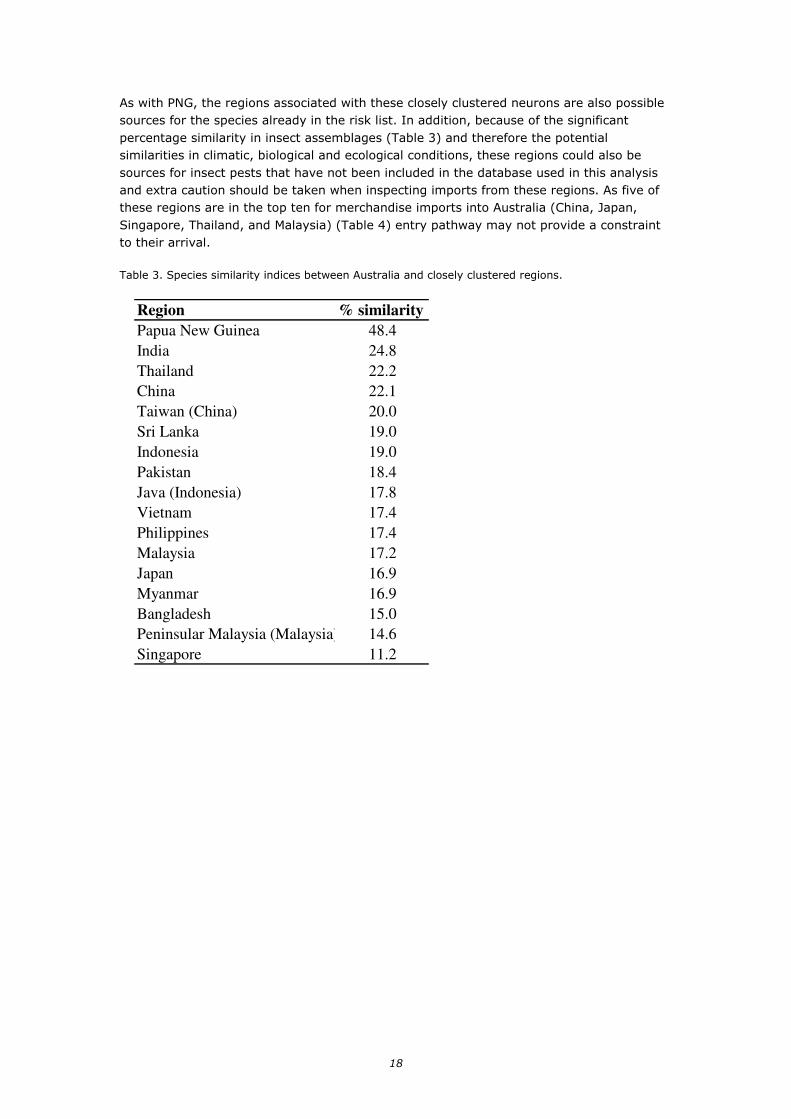
As with PNG, the regions associated with these closely clustered neurons are also possible
sources for the species already in the risk list. In addition, because of the significant
percentage similarity in insect assemblages (Table 3) and therefore the potential
similarities in climatic, biological and ecological conditions, these regions could also be
sources for insect pests that have not been included in the database used in this analysis
and extra caution should be taken when inspecting imports from these regions. As five of
these regions are in the top ten for merchandise imports into Australia (China, Japan,
Singapore, Thailand, and Malaysia) (Table 4) entry pathway may not provide a constraint
to their arrival.
Table 3. Species similarity indices between Australia and closely clustered regions.
Region % similarity
Papua New Guinea 48.4
India 24.8
Thailand 22.2
China 22.1
Taiwan (China) 20.0
Sri Lanka 19.0
Indonesia 19.0
Pakistan 18.4
Java (Indonesia) 17.8
Vietnam 17.4
Philippines 17.4
Malaysia 17.2
Japan 16.9
Myanmar 16.9
Bangladesh 15.0
Peninsular Malaysia (Malaysia) 14.6
Singapore 11.2

19
Table 4. The top 20 countries exporting goods into Australia based on the mean monthly percentage
of total imports for 2007 (extracted from ABS, 2008).
For example, the CABI CPC (CABI, 2003) provides distributional data on 21 of 30 (70%) of
the world’s worst invasive crop and forest insect pests as determined by the International
Union for Conservation of Nature (IUCN) (Table 5) (http://www.issg.org/database). One of
these species not found in the CPC and hence not included in the analysis is Aulacaspis
yasumatsui (Hemiptera: Diaspididae), a major pest of cycads. This insect is present in
China, Thailand, Singapore and Taiwan (Germain and Hodges, 2007), all countries closely
clustered with Australia (Table 2) and all exporting significant quantities of commodities
into Australia (Table 4). It follows that this pest, though not included in the database,
might present a high risk of establishing in Australia. Further analysis utilising habitat
suitability modelling (Kriticos et al., 2003), impact simulation modelling (Cook et al.,
2007), and benefit costs analysis (Cook, 2008) may reveal more about the risk this species
poses to Australia.
Country mean monthly percentage of total imports
1. China 15.4
2. USA 12.6
3. Japan 9.6
4. Singapore 5.6
5. Germany 5.2
6. United Kingdom 4.3
7. Thailand 4.2
8. Malaysia 3.9
9. New Zealand 3.3
10. Korea, Republic of 3.2
11. Indonesia 2.6
12. Italy 2.6
13. France 2.5
14. Vietnam 2.4
15. Taiwan 2.3
16. Papua New Guinea 1.3
17. Sweden 1.2
18. Ireland 1.1
19. United Arab Emirates 1.1
20. Canada 1.1

20
Table 5. List of 58 of the world’s most invasive insect pests (Global Invasive Species Database -
http://www.issg.org/database) classified as either crop or forest pests or not. Of those that are crop
or forest pests, those that were present in the CABI CPC (CABI, 2003) are also indicated.
IUCN Global Invasive Species Database (Insects) crop/forest pest present in CABI CPC
1. Acromyrmex octospinosus Y Y
2. Adelges piceae N N/A3. Adelges tsugae Y Y
4. Aedes albopictus N N/A
5. Agrilus planipennis N N/A6. Anopheles quadrimaculatus N N/A
7. Anoplolepis gracilipes N N/A
8. Anoplophora glabripennis Y Y9. Anthonomus grandis Y Y
10. Apis mellifera scutellata N N/A
11. Aulacaspis yasumatsui Y N12. Bactrocera tryoni Y N
13. Bemisia tabaci Y Y
14. Cactoblastis cactorum N N/A15. Calliphora vicina N N/A
16. Ceratitis capitata Y Y
17. Cinara cupressi Y Y
18. Coptotermes formosanus Y Y19. Culex quinquefasciatus N N/A
20. Harmonia axyridis N N/A
21. Hemiberlesia pitysophila Y Y22. Homalodisca vitripennis Y N
23. Hoplochelus marginalis Y Y
24. Hyphantria cunea Y Y25. Lasius neglectus Y N
26. Linepithema humile N N/A
27. Lymantria dispar Y Y28. Monomorium destructor N N/A
29. Monomorium pharaonis N N/A
30. Myrmica rubra Y Y31. Ochlerotatus japonicus japonicus N N/A
32. Oopterus soledadinus N N/A
33. Oracella acuta Y Y34. Orthotomicus erosus Y Y
35. Oryctes rhinoceros Y Y
36. Paratachardina pseudolobata (insect) N N/A37. Paratrechina longicornis Y Y
38. Pheidole megacephala Y N
39. Philornis downsi N N/A40. Polistes chinensis antennalis N N/A
41. Quadrastichus erythrinae N N/A
42. Radumeris tasmaniensis N N/A
43. Sirex noctilio Y Y44. Solenopsis geminata Y N
45. Solenopsis invicta N N/A
46. Solenopsis papuana N N/A47. Solenopsis richteri Y N
48. Tapinoma melanocephalum N N/A
49. Technomyrmex albipes N N/A50. Tetropium fuscum Y N
51. Tomicus piniperda Y Y
52. Trogoderma granarium Y Y53. Vespula germanica N N/A
54. Vespula pensylvanica N N/A
55. Vespula vulgaris N N/A56. Wasmannia auropunctata N N/A
57. Xylosandrus compactus Y Y
58. Xylosandrus mutilatus Y N
Total 30 21

21
In addition to risk lists for whole countries, the CABI CPC also has data for the states or
provinces within many of the larger countries. Countries in this database that have been
divided up into states or territories include Australia, Brazil, Canada, China, India,
Indonesia, Japan, Malaysia, Russia, and USA. This can give predictions at a finer scale and
also reveal which insect pests found in a state also present a high risk of establishment in
a neighbouring state. Government agencies could then identify not only those threats from
outside the country but also those from within.
Generating more accurate estimates for the risk of establishment of species is vital for
informed biosecurity. Government agencies require estimates to allocate resources in such
a way that will efficiently prioritise pest detection methods. These quantitative estimates
can also feed into economic models used in import risk assessments (e.g. Cook et al.,
2007) that can affect policy decisions. Importantly, the use of SOMs can be extended to
any taxa, such as weeds, marine pests, or even organisms of threat to natural systems. As
long as the worldwide distributional data is available, this methodology can be utilised by
any agency or researcher in which prioritisation or prediction of establishment likelihood is
required.
3.3. Analysis of Australian data
Key finding:
SOM analysis of Australian data reveals that NSW and Queensland may already have the
majority of pests and diseases present in Australia and few could invade and establish
from other states.
Thus far, this report has contained details of analyses conducted using world wide
distributional data from the CABI CPC, but other data sources can be used when applying
the SOM technique to Australia. To supplement our analyses using CABI data we also
analysed species distribution data collected by state and territory departments of
agriculture and primary industries for plant insect pests, fungal, bacterial and viral
pathogens. This enabled us to generate risk lists for each state and territory, thereby
indentifying inter-state invasive threats (i.e. those that could come from another Australian
state or territory).
Methods
Distributional data was extracted from the Australian Plant Pest Database (APPD)
(http://www.planthealthaustralia.com.au/go/phau/capacity-and-capability/information-
support-systems/appd), or directly from the state DPI’s or Agriculture Departments.
Insect pests
The APPD requested that only species from those families listed in Table 6 be submitted to
its database and of those families, only those insect species identified as plant pests. No
species were recorded in the database from the families Liriomyza (Diptera) and
Metabelidae (Lepidoptera).

22
Table 6. List of the insect pest families requested from states and territory to be submitted to the
Australian Plant Pest Database.
As this data is a record of collections as far back as the early 1900s, many represent
synonyms of modern species names. It was therefore necessary to obtain synonyms for all
species and cross check the list for synonym duplications. Synonym lists were obtained for
all families except Curculionidae. As there is no central list of Curculionidae species and
their synonyms it would have been necessary to check every entry by searching the
taxonomic literature. Unfortunately we did not have sufficient time available to us to
complete this task, and therefore Curculionidae are not included in the analysis below.
The final list contained 8,096 insect species and a SOM analysis was performed on this
data.
Fungal pathogens
The list of fungal species obtained from the APPD included both pathogenic and non-
pathogenic species. It was therefore necessary to check every entry for pathogenicity
(Holliday 1998) and for synonyms using Index Fungorum
(http://www.speciesfungorum.org/Names/Names.asp). The final list of fungal pathogens
contained 3,779 species and a SOM analysis was performed on this data.
Bacterial pathogens
This list contained 160 species and a SOM analysis was performed on this data.
Viral pathogens
This list contained 232 species and a SOM analysis was performed on this data.
Order Family Order Family
Coleoptera Anobiidae Hemiptera Pentatomidae
Coleoptera Bostrichidae Hemiptera Psyllidae
Coleoptera Cerambycidae Isoptera Kalotermitidae
Coleoptera Chrysomelidae Isoptera Mastotermitidae
Coleoptera Coccinelidae Isoptera Rhinotermitidae
Coleoptera Curculionidae Isoptera Termitidae
Coleoptera Dermestidae Isoptera Termopsidae
Coleoptera Elateridae Lepidoptera Gelechiidae
Coleoptera Nitidulidae Lepidoptera Gracilariidae
Coleoptera Scarabaeidae Lepidoptera Lymantriidae
Coleoptera Silvanidae Lepidoptera Metabelidae
Coleoptera Tenebrionidae Lepidoptera Noctuidae
Diptera Agromyzidae Lepidoptera Psychidae
Diptera Liriomyza Lepidoptera Pyralidae
Diptera Tephritidae Lepidoptera Tortricidae
Hemiptera Aleyrodidae Orthoptera Acrididae
Hemiptera Aphididae Orthoptera Gryllidae
Hemiptera Cicadellidae Orthoptera Gryllotalpidae
Hemiptera Coccidae Orthoptera Tettigoniidae
Hemiptera Coreidae Thysanoptera Aeolothripidae
Hemiptera Lygaeidae Thysanoptera Thripidae
Hemiptera Miridae

Results
Insect pests
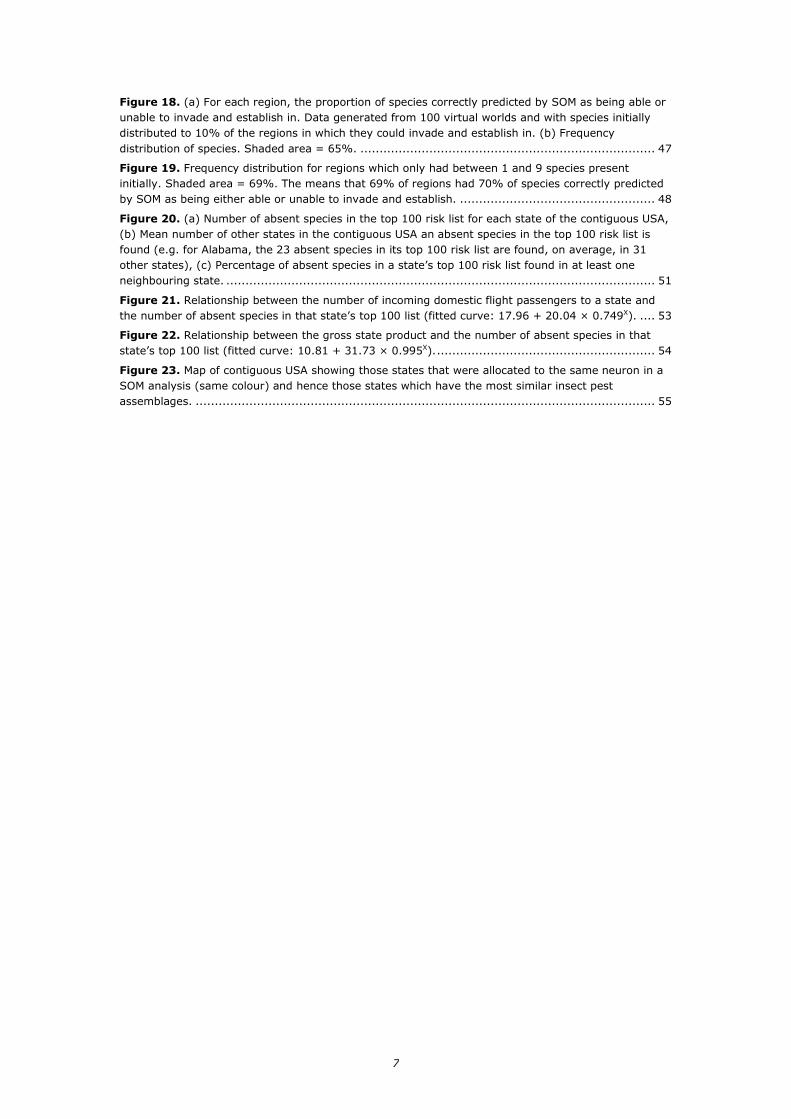
As the SOM analysis was performed on more than 8,000 insect species, we have only
presented the top 200 for each state and territory (
map identifies which states have the most similar species assemblage by grouping them
into the same neuron (Figure
Figure 2. SOM of Australian insect distributional data. Red cells are neurons that do not have a state
or territory allocated to them.
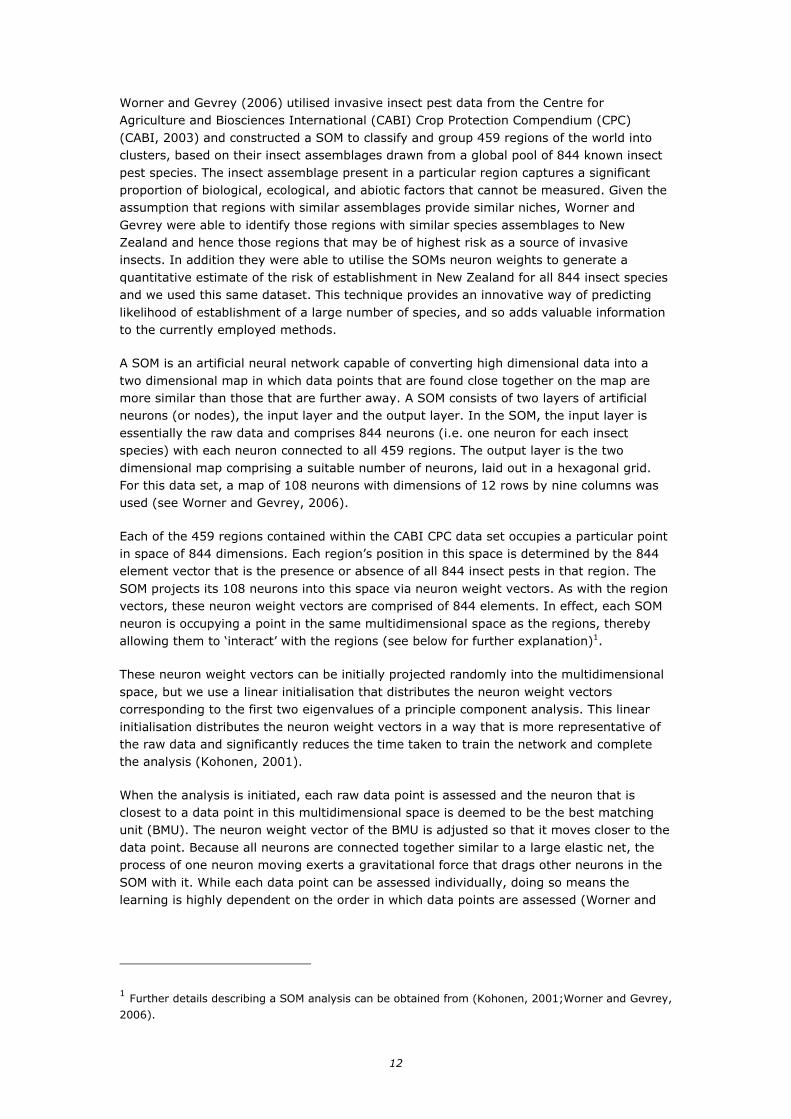
Fungal pathogens
The SOM analysis was performed on more than 3,000 fungal species,
presented the top 200 for each state and territory
map identifies which states have the most similar species assemblage by grouping them
into the same neuron (Figure
Figure 3. SOM of Australian plant fungal pathogen distributional data. Red cells are neurons that do
not have a state or territory allocated to them.
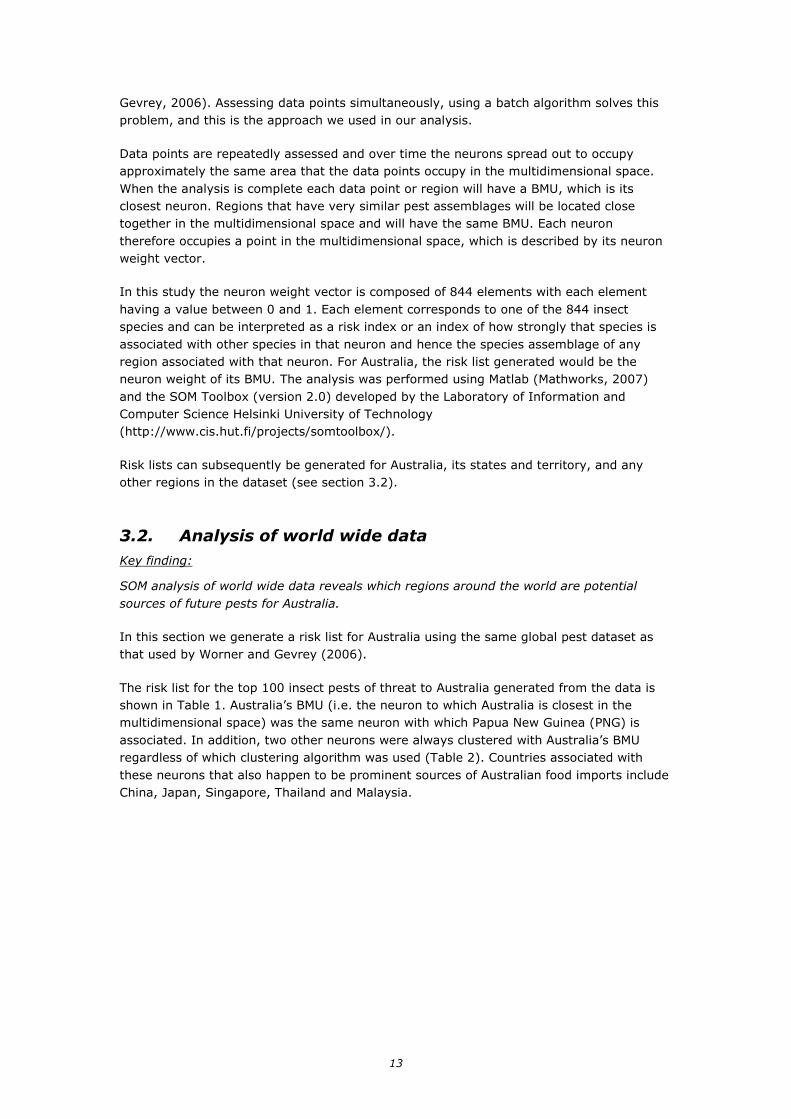
Bacterial pathogens
The rankings of bacterial pathogens are provided for each state and territory
Table 29-Table 35) and the SOM map (
similar species assemblage by groupi
23
performed on more than 8,000 insect species, we have only
presented the top 200 for each state and territory (Appendix, Table 15-Table
map identifies which states have the most similar species assemblage by grouping them
Figure 2).
SOM of Australian insect distributional data. Red cells are neurons that do not have a state
he SOM analysis was performed on more than 3,000 fungal species, but we have only
presented the top 200 for each state and territory (Appendix, Table 22-Table
map identifies which states have the most similar species assemblage by grouping them
Figure 3)
SOM of Australian plant fungal pathogen distributional data. Red cells are neurons that do
not have a state or territory allocated to them.
of bacterial pathogens are provided for each state and territory
and the SOM map (Figure 4) identifies which states have the most
similar species assemblage by grouping them into the same neuron.
performed on more than 8,000 insect species, we have only
Table 21). The SOM
map identifies which states have the most similar species assemblage by grouping them
SOM of Australian insect distributional data. Red cells are neurons that do not have a state
we have only
Table 28). The SOM
map identifies which states have the most similar species assemblage by grouping them
SOM of Australian plant fungal pathogen distributional data. Red cells are neurons that do
of bacterial pathogens are provided for each state and territory (Appendix,
) identifies which states have the most

Figure 4. SOM of Australian plant bacterial pathogen distributional data. Red cells are neurons that do
not have a state or territory allocated to them.
Viral pathogens
The rankings of bacterial pathogens are provided for each state and territory (
Table 36-Table 42) and the SOM map
similar species assemblage by grouping them into the same neuron.
Figure 5. SOM of Australian plant
have a state or territory allocated to them.
Discussion
It is important to recognise that APPD data
diseases, but often relate to non
or environmental significance
subsequently analysed by SOM may not be
stress that government authorities using the lists
first filter for those species that
prioritisations accordingly. This issue
incorporate the lists generate
practices allowing them to further optimise their priority lists of pests and diseases of
threat from other regions within Australia.
24
SOM of Australian plant bacterial pathogen distributional data. Red cells are neurons that do
not have a state or territory allocated to them.
pathogens are provided for each state and territory (
) and the SOM map (Figure 5) identifies which states have the most
similar species assemblage by grouping them into the same neuron.
SOM of Australian plant viral pathogen distributional data. Red cells are neurons that do not
have a state or territory allocated to them.
It is important to recognise that APPD data entries are not limited to plant pests or
, but often relate to non-native species that are benign or of low economic, social
or environmental significance. It follows that many species captured in the database and
subsequently analysed by SOM may not be bona fide pests or diseases. We must therefore
government authorities using the lists we have generated as part of this report
that are acknowledged plant pests or diseases and modify their
This issue aside, state and territory agencies may be able to
generated here (or the SOM methodology) into their biosecurity
practices allowing them to further optimise their priority lists of pests and diseases of
threat from other regions within Australia.
SOM of Australian plant bacterial pathogen distributional data. Red cells are neurons that do
pathogens are provided for each state and territory (Appendix,
identifies which states have the most
onal data. Red cells are neurons that do not
to plant pests or
f low economic, social
in the database and
We must therefore
e generated as part of this report
plant pests or diseases and modify their
, state and territory agencies may be able to
(or the SOM methodology) into their biosecurity
practices allowing them to further optimise their priority lists of pests and diseases of

25
It should be noted for some states, the species at the top of the list had very low risk
indices (less that 0.2). Queensland had low indices for lists from all four taxa. New South
Wales had low indices for insect pests and fungal pathogens, while Tasmania had low
indices for bacterial pathogens. For all these states, it is likely that these low indices
indicate that those taxa are unlikely to establish and that the species present in Australia
that are likely to establish in those states have already done so. As such, it may be more
appropriate for biosecurity agencies with these states to focus on potential invasive threats
from outside Australia when considering these taxa.
The Northern Territory list of present bacterial and viral pathogens contained only seven
and three species (respectively). As can be seen from the work presented in Section 3.6,
any list generated for a region which contains so few species initially can be prone to
significant levels of inaccuracy in the list rankings. We strongly recommend that these two
Northern Territory lists not be used in any biosecurity prioritisation process.
In addition, state and territory biosecurity agencies may wish for this analysis to be
repeated incorporating all insect pests and plant pathogens into one data set. This will
enable a comparison of establishment likelihood across taxa.
3.4. Comparison with expert stakeholder opinion
Key finding:
Comparing SOM-generated species lists of high-establishment-risk species with those
generated by Plant Health Australia reveals significant differences between rankings by the
two systems.
An important aspect of the SOM analysis is how it compares to risk assessment techniques
that rely on expert and stakeholder consultation. In this section we compare the
establishment risk values estimated using the SOM approach with estimates based on
expert stakeholder opinion, which is currently used to inform Australian biosecurity policy
and resource prioritisation.
Keller et al. (2007) demonstrated that the benefits generated by the adoption of a risk
assessment strategy based on expert judgement are potentially large. But, the perceived
lack of accuracy of this approach perhaps explains why the vast majority of countries have
not mandated risk analysis for non-indigenous species (Keller et al., 2007). On this basis,
a SOMs-supplemented method of risk assessment could generate substantial economic
gains over time if it produces higher confidence, and therefore greater adoption of pre-
import risk assessments as a key instrument of biosecurity policy.
To determine the differences in ranking that can occur between a SOM analysis and the
expert or stakeholder consultation currently employed by many biosecurity agencies, we
compared the risk estimates obtained in this analysis with those generated by Plant Health
Australia (PHA), a national coordinating body addressing the biosecurity of Australia’s plant
industries. As part of its role, this organisation generates industry biosecurity plans
(http://www.planthealthaustralia.com.au/site/Industry_Biosecurity_Plan_Mainpage.asp).
Within these plans, the risk of establishment for insect pests has been estimated using a
process of qualitative risk assessment, which consults expert opinion. These lists and
rankings for each industry are not intended as definitive or actionable lists for the purposes
of quarantine arrangements but are compiled for the purpose of determining biosecurity
threats for each plant industry. Of the 567 insect pests in our data set that are absent

26
from Australia, 226 (39.8%) were also evaluated by PHA. The risk of establishment for
these 226 insect pests were classified into four categories (high, medium, low, and
negligible) making direct comparison with our list relatively simple, if the ‘negligible’ and
‘low’ categories are grouped together.
Many of the species (21.9%) had multiple risk categories attributed to them by PHA,
depending on which crop was being considered. We counted species agreements if the
SOM categorisation agreed with any one of the classifications made by PHA. We also
calculated Cohen’s kappa statistic (Cohen, 1960), to test the level of agreement between
PHA and SOM after taking into account any agreement that could occur by chance.
However, the kappa statistic assumes a species is classified into only one category and
PHA classified many species into more than one category. For a species with multiple
classifications, we determined if one of these classifications matched the SOM classification
and if it did, we took that classification. If the classifications did not match we used the
highest classification PHA had given that species.
Comparing the groupings obtained by the SOM analysis with those estimated by PHA we
found that overall only 22.1% of species had the same risk estimate by the two methods.
The category with the lowest level of agreement was the low risk category where only
14.0% of species classified as low by the SOM analysis were also classified as low by PHA.
For the medium and high categories there was 53.3% and 50.0% agreement respectively.
Further, while the SOM analysis only classified two species as high risk, PHA classified 92
species as high risk and of these 92 species, 73 (79.3%) were classified as low risk by the
SOM analysis (Table 7, and Appendix, Table 43). Finally, Cohen’s kappa statistic indicated
very low agreement in the classification by SOM and PHA. Values for kappa range from -1
(complete disagreement) to 1 (complete agreement). A value close to zero, as reported
here, indicates that any agreement between PHA and SOM can only be attributed to
chance.
Table 7. A confusion matrix comparing the classification into 3 levels of likelihood of establishment by
the SOM analysis and Plant Health Australia (PHA)
(http://www.planthealthaustralia.com.au/site/Industry_Biosecurity_Plan_Mainpage.asp).
The large disparity between SOM and expert or stakeholder consultation may indicate the
inclination of people, even those with a significant level of biological and ecological
knowledge, to be risk averse and classify a species as a high risk when perhaps it is not.
These experts or stakeholders also may not have an in depth knowledge of all potential
pests and may therefore confuse the risk of establishment for a pest with the potential
impact of that pest (Gary Fitt, CSIRO – personal communication). In addition, expert or
stakeholder solicitation has often been found susceptible to a range of cognitive biases
such as the format of the question(s), past experience, overconfidence, motivational bias,
lack of independence, and cultural, political or philosophical context (see Burgman, 2005
for review). Despite this, there are a range of methods a facilitator can utilise to improve
any estimates. One of these methods is to give the expert feedback on their estimates and
allow them the opportunity to alter them (Burgman, 2005). Any species ranking list
PHASOM high medium low Totalhigh 1 1 0 2
medium 18 24 3 45low 73 81 25 179
Total 92 106 28 226

27
generated by a SOM analysis would not only be independent of the ‘human’ biases
mentioned above, but could be used by a facilitator as additional information that could
serve as feedback for the experts to consider in their final estimates.
The placing of a pest species into different categories by PHA can also complicate the pest
risk analysis and the second advantage therefore of using a SOM analysis is only one risk
estimate is provided and this can be utilised by biosecurity agencies without having to
consider the multiple risk categories that could be obtained in an expert or stakeholder
consultation process.
Finally, while classification into the three categories is possible in both methodologies, this
gives an equal ‘value’ of risk to all species within the same risk category. The SOM analysis
however, gives quantitative estimates of risk, which can allow further prioritisation within
each risk group and a more refined list.
One of the important reasons for using expert and stakeholder consultation is to ensure
that factors associated with specific production concerns are met. The ability therefore of
stakeholders to provide input and be part of the risk assessment procedure will ensure
these stakeholders accept a shared responsibility for managing biosecurity concerns. For
this reason, the SOM methodology should not replace the process of consultation, but can
provide a framework and guide to the consultative process, enabling consultants access to
more analytical assessments, which can better inform their recommendations regarding a
pest’s risk of establishment. Considering the cognitive biases mentioned above that are
inherent in any consultative process, the addition of the SOM methodology and the
information it provides can only improve the subsequent estimates of likelihood experts
and stakeholders will produce.
3.5. SOM sensitivity
Key finding:
SOM methodology can generate robust risk lists resilient to error rates up to 20% in the
presence/absence data (Paini et al 2010). (see objectives (ii), (iii) and (vi) section 2, p.8).
To determine the sensitivity of any risk list to errors in the data set, we deliberately altered
the data set by increasing amounts to simulate error rates. After the data were altered, a
new SOM was generated and a subsequent risk list for Australia extracted.
Once a risk list for Australia was generated, we classified all those species that are
recorded as absent from Australia into risk categories similar to the categories utilised by
Biosecurity Australia (the Australian government agency that undertakes science-based
risk assessment, and provides quarantine policy advice) to obtain a semi-quantified
estimate of risk of establishment. However, we condensed the lower four categories of
Biosecurity Australia’s scheme into one category as making fine grade distinctions between
low risk level pests is considered relatively unimportant (Table 8). We also generated a top
100 list.
While these three risk categories (Table 8), which are a function of the risk scores allotted
to each species, follow the established Biosecurity Australia model, other agencies might
be more interested in a basic ranking of species and identifying, for example, the top 100
threats. This approach has been used by the Global Invasive Species Program (GISP) in a
database, which lists 100 of the world’s worst invasive alien species
(http://www.issg.org/database/species/search.asp?st=100ss). In addition, biosecurity
28
agencies may wish to filter all the possible invasive species into a more manageable list for
which they would seek advice from experts or stakeholders. Generating a top 100 list
would be analogous to this filtering process. Such a list would not be directly dependent on
a risk value but rather the relative ranking. In line with this we also generated a top 100
list of species posing the highest establishment risk for Australia.
List before the data alteration and after the data alteration were then compared (list
fidelity). This list fidelity was assessed by recording the proportion of species present in
each of the three risk categories that stayed in those same risk categories after the data
were altered. For the top 100 insect pests, the proportion of these insects that stayed in
the top 100 was recorded. In addition, to get an assessment of the fidelity of the overall
list we performed Spearman’s rank correlations on the entire list before and after data
alteration.

29
Table 8. Risk categories used by (a) Biosecurity Australia (Biosecurity Australia, 2001) and (b) the
three categories used in this analysis.
(a) (b)
Likelihood Probability range Likelihood Probability range
High 0.7 - 1.0 High 0.7 - 1.0
Moderate 0.3 - 0.7 Moderate 0.3 - 0.69
Low 0.05 - 0.3 Low 0 - 0.29
Very Low 0.001 - 0.05
Extremely Low 0.000001 - 0.001
Negligible 0 - 0.000001
We utilised IRAs generated by the Australian Government’s Department of Agriculture,
Fisheries and Forestry (DAFF) (http://www.daff.gov.au/ba/ira/final-plant) to estimate the
error rate in a sample of the CABI data and determine the range of data alteration
required. These IRAs assess the risk of importing a particular product from another country
and identify the known insect pest species present in the exporting country and associated
with that product. These lists of pest species are generated from published sources and are
independent of the CABI database. We compared these lists with the CABI database and
found error rates for 58 countries ranging from 0% up to 38%, and averaging 8.54%
(Table 9). Included in this mean was an estimate for the error rate for Australia, which was
calculated by randomly selecting 200 species and comparing the CABI database with the
Australian Plant Pest Database
(http://www.planthealthaustralia.com.au/our_projects/display_project.asp?category=4&ID
=1) and by consulting taxonomy experts in the Australian National Insect Collection
(CSIRO ANIC). The error rate for these 200 species was 2.5%.

30
Table 9. Error rates present in the CABI CPC for 58 countries. Error rates were calculated using data was extracted from Import Risk Assessments generated by the
Australian Government’s Department of Agriculture, Forestry, and Fisheries (http://www.daff.gov.au/ba/ira/final-plant).
* The error rate for Australia was calculated using the Australian Plant Pest Database
(http://www.planthealthaustralia.com.au/our_projects/display_project.asp?category=4&ID=1) and taxonomy experts in the Australian National Insect
Collection (CSIRO ANIC).
Country Error rate Country Error rate Country Error rate
1 Angola 0.00% 21 Grenada 12.50% 41 Pakistan 0.00%
2 Antigua and Barbuda 14.29% 22 Guadeloupe 20.00% 42 Panama 0.00%
3 Argentina 0.00% 23 Guatemala 0.00% 43 Peru 16.67%
4 Australia* 2.50% 24 Guyana 0.00% 44 Phillipines 7.14%
5 Bangladesh 0.00% 25 Haiti 0.00% 45 PNG 0.00%
6 Barbados 0.00% 26 India 6.90% 46 Puerto Rico 0.00%
7 Brazil 7.14% 27 Indonesia 0.00% 47 Saint Kitts and Nevis 0.00%
8 Cameroon 11.11% 28 Jamaica 0.00% 48 Samoa 14.29%
9 Canada 34.38% 29 Japan 15.91% 49 Sierra Leone 0.00%
10 Chile 3.45% 30 Korea 19.15% 50 Singapore 0.00%
11 China 11.11% 31 Laos 16.67% 51 Solomon Islands 0.00%
12 Colombia 25.00% 32 Malaysia 26.32% 52 Sri Lanka 0.00%
13 Congo 0.00% 33 Mauritius 20.00% 53 Surniame 20.00%
14 Costa Rica 14.29% 34 Mexico 11.11% 54 Thailand 10.81%
15 Cote D'Ivoire 14.29% 35 Montserrat 20.00% 55 Tonga 20.00%
16 Cuba 12.50% 36 Mozambique 20.00% 56 Trinidad and Tobago 0.00%
17 Dominican Republic 0.00% 37 Myanmar 0.00% 57 USA 3.57%
18 Ecuador 12.50% 38 New Caledonia 16.67% 58 Venezuela 0.00%
19 Fiji 22.22% 39 New Zealand 10.42% 59 Vietnam 0.00%
20 Ghana 0.00% 40 Nigeria 11.11% Mean 8.54%
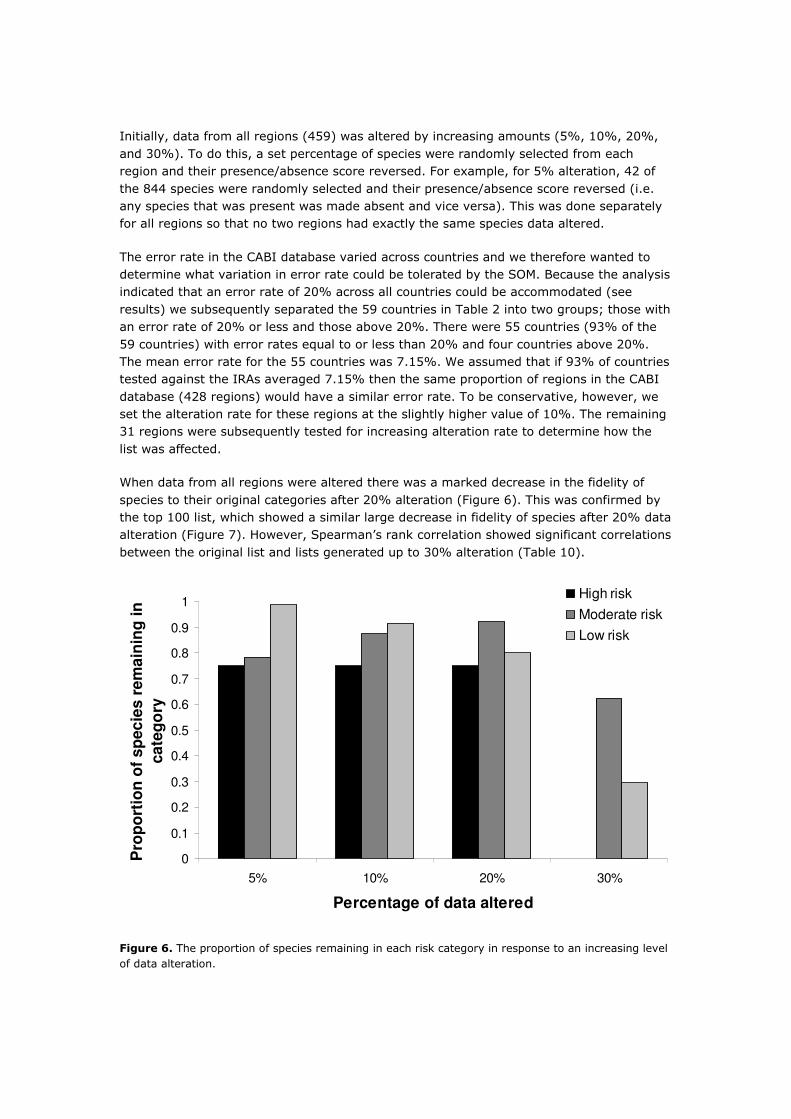
Initially, data from all regions (459) was altered by increasing amounts (5%, 10%, 20%,
and 30%). To do this, a set percentage of species were randomly selected from each
region and their presence/absence score reversed. For example, for 5% alteration, 42 of
the 844 species were randomly selected and their presence/absence score reversed (i.e.
any species that was present was made absent and vice versa). This was done separately
for all regions so that no two regions had exactly the same species data altered.
The error rate in the CABI database varied across countries and we therefore wanted to
determine what variation in error rate could be tolerated by the SOM. Because the analysis
indicated that an error rate of 20% across all countries could be accommodated (see
results) we subsequently separated the 59 countries in Table 2 into two groups; those with
an error rate of 20% or less and those above 20%. There were 55 countries (93% of the
59 countries) with error rates equal to or less than 20% and four countries above 20%.
The mean error rate for the 55 countries was 7.15%. We assumed that if 93% of countries
tested against the IRAs averaged 7.15% then the same proportion of regions in the CABI
database (428 regions) would have a similar error rate. To be conservative, however, we
set the alteration rate for these regions at the slightly higher value of 10%. The remaining
31 regions were subsequently tested for increasing alteration rate to determine how the
list was affected.
When data from all regions were altered there was a marked decrease in the fidelity of
species to their original categories after 20% alteration (Figure 6). This was confirmed by
the top 100 list, which showed a similar large decrease in fidelity of species after 20% data
alteration (Figure 7). However, Spearman’s rank correlation showed significant correlations
between the original list and lists generated up to 30% alteration (Table 10).
Figure 6. The proportion of species remaining in each risk category in response to an increasing level
of data alteration.
0
0.1
0.2
0.3
0.4
0.5
0.6
0.7
0.8
0.9
1
5% 10% 20% 30%
Percentage of data altered
Pro
po
rtio
n o
f s
pec
ies r
em
ain
ing
in
ca
teg
ory
High risk
Moderate risk
Low risk
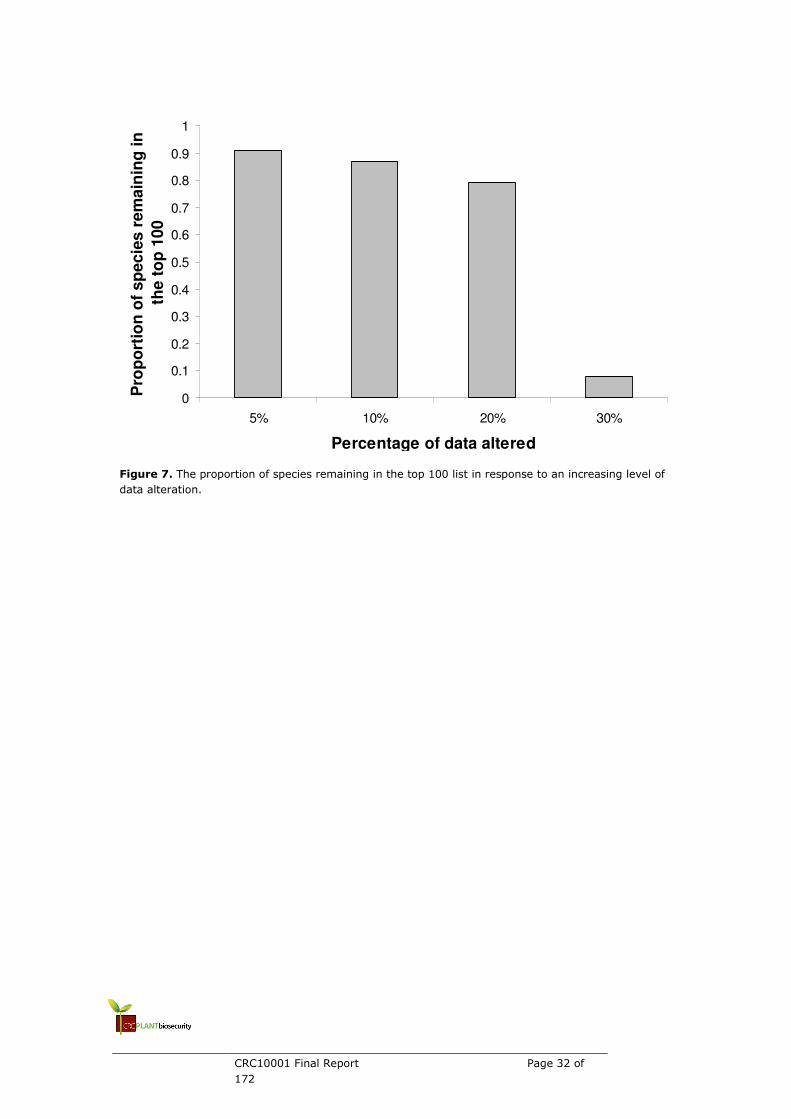
CRC10001 Final Report Page 32 of
172
Figure 7. The proportion of species remaining in the top 100 list in response to an increasing level of
data alteration.
0
0.1
0.2
0.3
0.4
0.5
0.6
0.7
0.8
0.9
1
5% 10% 20% 30%
Percentage of data altered
Pro
po
rtio
n o
f s
pe
cie
s r
em
ain
ing
in
the
to
p 1
00
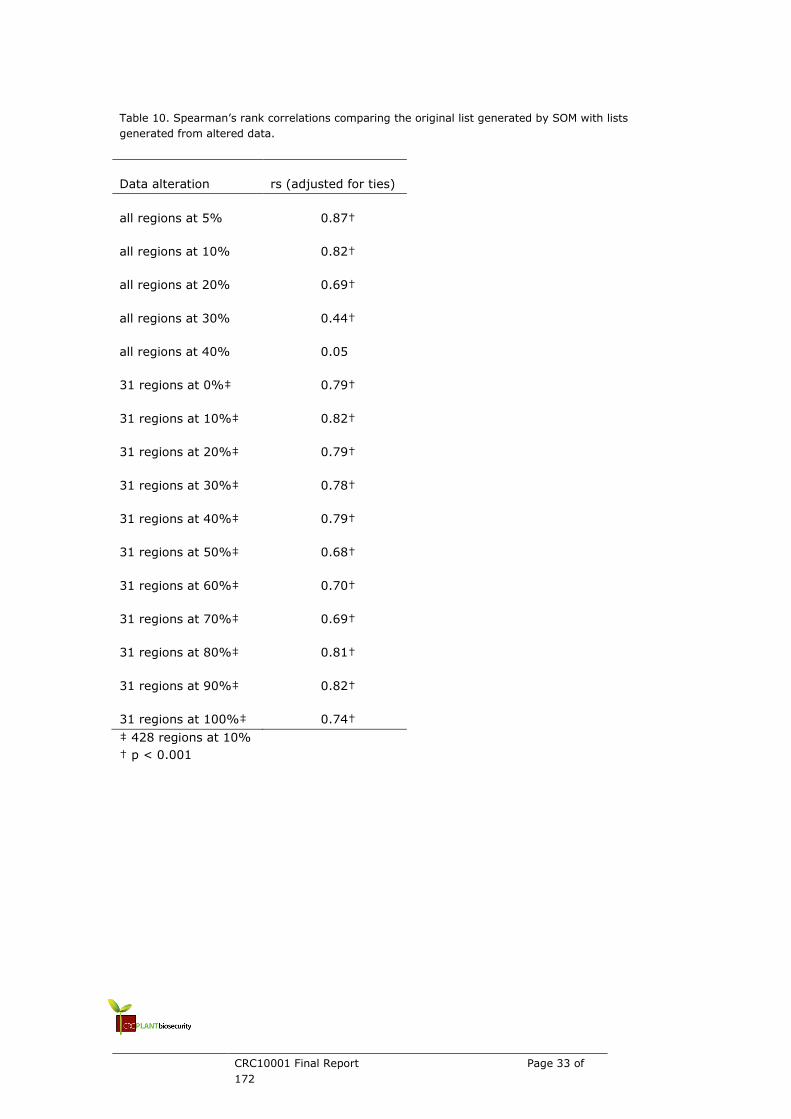
CRC10001 Final Report Page 33 of
172
Table 10. Spearman’s rank correlations comparing the original list generated by SOM with lists
generated from altered data.
Data alteration rs (adjusted for ties)
all regions at 5% 0.87†
all regions at 10% 0.82†
all regions at 20% 0.69†
all regions at 30% 0.44†
all regions at 40% 0.05
31 regions at 0%‡ 0.79†
31 regions at 10%‡ 0.82†
31 regions at 20%‡ 0.79†
31 regions at 30%‡ 0.78†
31 regions at 40%‡ 0.79†
31 regions at 50%‡ 0.68†
31 regions at 60%‡ 0.70†
31 regions at 70%‡ 0.69†
31 regions at 80%‡ 0.81†
31 regions at 90%‡ 0.82†
31 regions at 100%‡ 0.74†
‡ 428 regions at 10%
† p < 0.001

CRC10001 Final Report Page 34 of
172
When regions were separated into two groups (the larger group of regions with an
alteration rate of 10%) we found that, using the three categories, an alteration rate of
30% in the smaller group of regions maintained category fidelity (Figure 8). Using the top
100 list, this alteration rate could be increased to 40% before significant reductions in
fidelity occurred (Figure 9). The Spearman’s rank correlation analysis revealed that the
alteration rate for the smaller group of regions could be 100% and still maintain a
significant correlation over the entire list (Table 10).
Figure 8. The proportion of species remaining in each risk category in response to an increasing level
of data alteration for 31 randomly selected regions. The alteration rate for the remaining regions was
maintained at 10%.
0
0.1
0.2
0.3
0.4
0.5
0.6
0.7
0.8
0.9
1
0% 10% 20% 30% 40% 50%
Data alteration of 31 regions
pro
po
rtio
n o
f s
pe
cie
s r
em
ain
ing
in c
ate
go
ry
High risk
Moderate risk
Low risk

CRC10001 Final Report Page 35 of
172
Figure 9. The proportion of species remaining in the top 100 list in response to an increasing level of
data alteration for 31 randomly selected regions. The alteration rate for the remaining regions
maintained at 10%.
0
0.1
0.2
0.3
0.4
0.5
0.6
0.7
0.8
0.9
1
0% 10% 20% 30% 40% 50%
Data alteration of 31 regions
Pro
po
rtio
n o
f s
pe
cie
s t
ha
t
sta
ye
d in
th
e t
op
10
0

CRC10001 Final Report Page 36 of
172
Discussion of results
As current methods for quantifying the risk of establishment of invasive species can be
relatively subjective, identifying and evaluating new methods that could help in generating
more accurate invasive risk lists is paramount, and Worner and Gevrey (2006) have
introduced the novel idea of using a self organising map to generate these risk lists. As
with any modelling technique, it is important to obtain high quality data and/or test model
sensitivity to data error. We found that an error rate in species distribution lists of up to
20% across all regions will still generate risk lists of relatively high fidelity.
Although an overall error rate of 20% would appear to be adequately handled by any SOM
analysis, our estimation of the error rate showed that a small proportion of regions had
higher error rates (Table 9). The error rate for these countries averaged 27% and the
subsequent analysis that separated the 459 regions into two groups indicated that either a
categorical list or a top 100 list could both be insensitive to errors at this level. In addition,
rank correlations were maintained at significant levels up to 100% (i.e. all species in this
small proportion of countries could be incorrectly classified as present or absent),
indicating that, when considering all species, the list still maintained constant rankings.
If a biosecurity agency wished to use SOM as an initial filtering device that would enable a
large number of species to be reduced to a smaller manageable number that could be
utilised in any expert solicitation, then the Spearman rank correlations indicate that error
rates up to 30% could be accommodated. Considering the error rate we found in the CABI
CPC data averaged only 8.5%, SOM would appear to be very robust.
Our analysis suggests that SOMs can provide important information for the evaluation and
prioritisation of pest lists, with species rankings appearing relatively robust to quite large
errors in species distribution data. Given such errors are inevitable, these findings illustrate
the practical utility of this approach and the utility of SOMs as a method, which can
complement the current approaches used by biosecurity agencies.
3.6. SOM accuracy
Key finding:
SOM methodology is extremely accurate in its ability to identify which species are able to
establish in a region.
While the previous section showed that the SOM method is robust to significant errors in
the distributional data, there has never been a test of its predictive powers. There are two
possible methods that could be used to achieve this. The first is to use a historical world
wide invasive species assemblage, perform an analysis using SOM and compare the SOM
predictions to the current distribution of invasive species. One would expect, if the SOM is
accurate in its predictions that those species identified by the SOM as having a high
likelihood of establishing in a region to have subsequently established. However, if a
species identified as a high risk by SOM has not subsequently established it is possible that
the SOM was incorrect in its assumptions or the species simply has not had the
opportunity to establish (i.e. not arrived to the region via some pathway).
The alternative is to create a virtual world filled with virtual invasive species and test SOM
predictions in this arena. The advantage of this alternative is that all the regions in which a
species are able to establish are known and it is a relatively simple task to compare the
SOM predictions to what is known to be true.

CRC10001 Final Report Page 37 of
172
We therefore generated an Australian risk list for invasive fungal plant pathogens from
data extracted from the CABI CPC (CABI, 2003) and determined the reliability of these
predictions by building a virtual world of invasive species of similar size and species
distribution.
Methods
Fungal pathogen data and SOM anlaysis
Fungal pathogen data was extracted from the CABI CPC (CABI, 2003). This was the
presence/absence data for 486 fungal pathogen species distributed over 459 regions of the
world. A 459 x 486 matrix was thus generated in which the presence or absence of each
fungal pathogen species was recorded in each region. The SOM analysis was performed
and a risk list (top 200) generated for Australia and its states and territories.
Virtual World
We created a virtual world that consisted of the same number of regions as the CABI CPC
data set (i.e. 459 regions) and allocated each region with a value or range of values
between 1 and 10 that represented its invasibility index (InIx). We then generated the
same number of species as the fungal pathogen data set (486 species) and applied a value
between 1 and 10 to each species, which represented its invasibility requirements (InRq).
If a species’ InRq matched a region’s InIx, then that species was able to invade and
establish in that region. For example, if a region had an InIx range of 3-5, then any
species that had an InRq of 3, 4, or 5 was able to establish in that region. While the InRq
for species were randomly selected, the InIx for regions were also random, but weighted.
We wanted to simulate a world similar to the real world in which the range of InIx’s of the
virtual world was similar to that in the real world. However, it is not possible to determine
how invasible the world’s regions are, as the invasive species of the world have not fully
invaded all the regions they are able to. This ‘invasion equilibrium’ point has not yet been
achieved and we therefore used a proxy to determine the ranges of invasibility by
examining worldwide species plant diversity (Kier et al 2005).
Using this dataset, we determined the maximum species diversity in any one ecoregion
(10,000 species). We used these values as proxies for the range of invasibility indices
applied to any region in the virtual world. If an ecoregion had the maximum 10,000
species that was equivalent to the maximum invasibility range (all InIx values between 1
and 10). If an ecoregion had 9,000 species that was equivalent to an invasibility range of 9
(9 values between 1 and 10), etc. The proportion of ecoregions in each of the ten species
diversity categories was used to determine the weighting for the random selection of
invasibility indices for regions in the virtual world (Table 11).
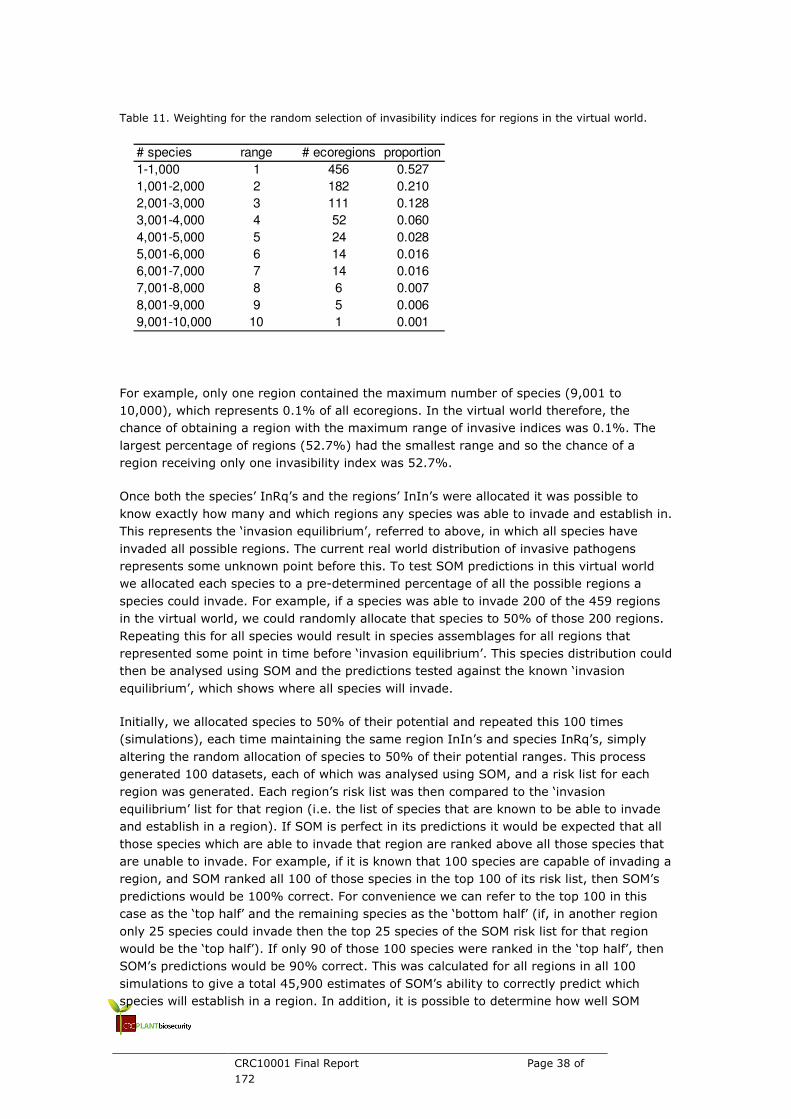
CRC10001 Final Report Page 38 of
172
Table 11. Weighting for the random selection of invasibility indices for regions in the virtual world.
For example, only one region contained the maximum number of species (9,001 to
10,000), which represents 0.1% of all ecoregions. In the virtual world therefore, the
chance of obtaining a region with the maximum range of invasive indices was 0.1%. The
largest percentage of regions (52.7%) had the smallest range and so the chance of a
region receiving only one invasibility index was 52.7%.
Once both the species’ InRq’s and the regions’ InIn’s were allocated it was possible to
know exactly how many and which regions any species was able to invade and establish in.
This represents the ‘invasion equilibrium’, referred to above, in which all species have
invaded all possible regions. The current real world distribution of invasive pathogens
represents some unknown point before this. To test SOM predictions in this virtual world
we allocated each species to a pre-determined percentage of all the possible regions a
species could invade. For example, if a species was able to invade 200 of the 459 regions
in the virtual world, we could randomly allocate that species to 50% of those 200 regions.
Repeating this for all species would result in species assemblages for all regions that
represented some point in time before ‘invasion equilibrium’. This species distribution could
then be analysed using SOM and the predictions tested against the known ‘invasion
equilibrium’, which shows where all species will invade.
Initially, we allocated species to 50% of their potential and repeated this 100 times
(simulations), each time maintaining the same region InIn’s and species InRq’s, simply
altering the random allocation of species to 50% of their potential ranges. This process
generated 100 datasets, each of which was analysed using SOM, and a risk list for each
region was generated. Each region’s risk list was then compared to the ‘invasion
equilibrium’ list for that region (i.e. the list of species that are known to be able to invade
and establish in a region). If SOM is perfect in its predictions it would be expected that all
those species which are able to invade that region are ranked above all those species that
are unable to invade. For example, if it is known that 100 species are capable of invading a
region, and SOM ranked all 100 of those species in the top 100 of its risk list, then SOM’s
predictions would be 100% correct. For convenience we can refer to the top 100 in this
case as the ‘top half’ and the remaining species as the ‘bottom half’ (if, in another region
only 25 species could invade then the top 25 species of the SOM risk list for that region
would be the ‘top half’). If only 90 of those 100 species were ranked in the ‘top half’, then
SOM’s predictions would be 90% correct. This was calculated for all regions in all 100
simulations to give a total 45,900 estimates of SOM’s ability to correctly predict which
species will establish in a region. In addition, it is possible to determine how well SOM
# species range # ecoregions proportion
1-1,000 1 456 0.527
1,001-2,000 2 182 0.210
2,001-3,000 3 111 0.128
3,001-4,000 4 52 0.060
4,001-5,000 5 24 0.028
5,001-6,000 6 14 0.016
6,001-7,000 7 14 0.016
7,001-8,000 8 6 0.007
8,001-9,000 9 5 0.006
9,001-10,000 10 1 0.001

CRC10001 Final Report Page 39 of
172
predicts any one species in all of the available regions. If a species could establish in 50 of
the available 459 regions, then in those 50 regions SOM should have ranked that species
in the ‘top half’, while in the remaining regions, SOM should have ranked that species in
the ‘bottom half’. This was calculated for all 100 simulations giving a total of 48,600
estimates of SOM’s ability to predict species invasibility across regions. We were therefore
able to estimate SOM’s ability to predict which species should establish in a region and
which regions a species should establish in.
We then repeated the above process, but this time allocated species to only 10% of their
potential distribution. This enabled us to test the SOM’s ability to predict when species
distributions (and therefore species associations) are significantly more restricted.
In addition, we also generated multiple virtual worlds to eliminate the possibility of
idiosyncracies of a single virtual world biasing results. Had we only used the single virtual
world we initially created and just randomly distributed the species into that world, it was
possible that the characteristics of that world would be unique. Therefore, the SOMs ability
to make predictions could have been reduced or enhanced by these unique characteristics.
We subsequently generated 200 virtual worlds in which each region’s InIn and species’
InRq were randomly selected. Each virtual world was therefore different to all others. For
100 virtual worlds we allocated species to 50% of their potential range and for the
remaining 100 virtual worlds we allocated species to 10% of their potential range. We were
able to determine if this added level of variation increased the variation in predictive power
of SOM.
Results
Plant Pathogen Dataset
Of the 486 plant pest pathogens in the CABI CPC data set, 237 are absent from Australia.
These species have been ranked by the SOM analysis and the full list for Australia and its
states and territory can be found in Appendix, Table 44-Table 51.
Virtual World Results - 50% Initial distribution
Predicting a species across all regions (100 simulations):
All species were initially distributed to between 27 and 58 regions. We found that the SOM
predictions for all these species ranged from 92.8% to 100% correct (Figure 10 (a)) and
averaged 98.9%. On average therefore, each species was correctly predicted by SOM as
being able or not be able to invade 454 of the 459 regions. Of the 48,600 data points (486
species in 100 simulations), 88% were correctly predicted in 98% of regions (450 regions)
(Figure 10(b)).

CRC10001
172
Figure 10. (a) For each species, the proportion of regions correctly predicted by SOM as being able or
unable to invade and establish in. Data generated from 100 simulations of the same virtual world and
with species initially distributed to 50% of the regions in which they
Frequency distribution of species. Shaded area = 88% of species.
Predicting a species across all regions (100 virtual worlds)
Though the creation of 100 different virtual worlds increased the variation in number of
regions a species was initially found in (19 to 68 regions), the mean success rate for SOM
predicting which species would or would not be able to invade and establish in a region is
still at an extremely high level (98.9%), ranging from 92.1% up to 100% (
In addition, 87% of species were correctly predicted by SOM in at least 98% of regions
(Figure 11(b)).
10001 Final Report Page 40
each species, the proportion of regions correctly predicted by SOM as being able or
unable to invade and establish in. Data generated from 100 simulations of the same virtual world and
with species initially distributed to 50% of the regions in which they could invade and establish in. (b)
Frequency distribution of species. Shaded area = 88% of species.
Predicting a species across all regions (100 virtual worlds):
Though the creation of 100 different virtual worlds increased the variation in number of
ons a species was initially found in (19 to 68 regions), the mean success rate for SOM
predicting which species would or would not be able to invade and establish in a region is
still at an extremely high level (98.9%), ranging from 92.1% up to 100% (
In addition, 87% of species were correctly predicted by SOM in at least 98% of regions
of
each species, the proportion of regions correctly predicted by SOM as being able or
unable to invade and establish in. Data generated from 100 simulations of the same virtual world and
could invade and establish in. (b)
Though the creation of 100 different virtual worlds increased the variation in number of
ons a species was initially found in (19 to 68 regions), the mean success rate for SOM
predicting which species would or would not be able to invade and establish in a region is
still at an extremely high level (98.9%), ranging from 92.1% up to 100% (Figure 11(a)).
In addition, 87% of species were correctly predicted by SOM in at least 98% of regions
CRC10001
172
Figure 11. (a) For each species, the proportion of regions correctly predicted by SOM as being able or
unable to invade and establish in. Data generated from 10
distributed to 50% of the regions in which they could invade and establish in. (b) Frequency
distribution of species. Shaded area = 87%.
Predicting species within a region (100 simulations):
For all regions in all simulations (45,900), SOM was able, on average, to correctly predict
whether or not 98.7% of the species were able to establish and invade a region. Although
there was a wide spread of prediction success
12(a))), for the majority of regions (96%) most species (95%) were correctly predicted by
SOM as being able or unable to invade and establish (
10001 Final Report Page 41
(a) For each species, the proportion of regions correctly predicted by SOM as being able or
unable to invade and establish in. Data generated from 100 virtual worlds and with species initially
distributed to 50% of the regions in which they could invade and establish in. (b) Frequency
distribution of species. Shaded area = 87%.
Predicting species within a region (100 simulations):
ll simulations (45,900), SOM was able, on average, to correctly predict
whether or not 98.7% of the species were able to establish and invade a region. Although
there was a wide spread of prediction success (i.e. from as low as 6% up to 100% (
, for the majority of regions (96%) most species (95%) were correctly predicted by
SOM as being able or unable to invade and establish (Figure 12(b)).
of
(a) For each species, the proportion of regions correctly predicted by SOM as being able or
0 virtual worlds and with species initially
distributed to 50% of the regions in which they could invade and establish in. (b) Frequency
ll simulations (45,900), SOM was able, on average, to correctly predict
whether or not 98.7% of the species were able to establish and invade a region. Although
from as low as 6% up to 100% (Figure
, for the majority of regions (96%) most species (95%) were correctly predicted by

CRC10001
172
Figure 12. (a) For each region, the proportion of species correctly predicted by SOM as being able or
unable to invade and establish in. Data generated from 100 simulations of the same virtual world and
with species initially distributed to 50% of the regions in which they could invade and establish in. (b)
Frequency distribution of regions. Shaded area = 96%.
Predicting species within a region (100 virtual worlds):
For all regions in all virtual worlds (45,900), SOM was able, on average, to correctly
predict whether a not 98.7% of species were able to establish and invade a region.
Although the number of species
44.9% (Figure 13(a)), the majority of regions (91.6%) had at least 95% of species
correctly predicted by SOM as being able or unable to invade and establish (
10001 Final Report Page 42
(a) For each region, the proportion of species correctly predicted by SOM as being able or
to invade and establish in. Data generated from 100 simulations of the same virtual world and
with species initially distributed to 50% of the regions in which they could invade and establish in. (b)
Frequency distribution of regions. Shaded area = 96%.
redicting species within a region (100 virtual worlds):
For all regions in all virtual worlds (45,900), SOM was able, on average, to correctly
predict whether a not 98.7% of species were able to establish and invade a region.
Although the number of species in a region correctly predicted by SOM was as low as
(a)), the majority of regions (91.6%) had at least 95% of species
icted by SOM as being able or unable to invade and establish (
of
(a) For each region, the proportion of species correctly predicted by SOM as being able or
to invade and establish in. Data generated from 100 simulations of the same virtual world and
with species initially distributed to 50% of the regions in which they could invade and establish in. (b)
For all regions in all virtual worlds (45,900), SOM was able, on average, to correctly
predict whether a not 98.7% of species were able to establish and invade a region.
in a region correctly predicted by SOM was as low as
(a)), the majority of regions (91.6%) had at least 95% of species
icted by SOM as being able or unable to invade and establish (Figure 13(b)).

CRC10001
172
Figure 13. (a) For each region, the proportion
unable to invade and establish in. Data generated from 100 virtual worlds and with species initially
distributed to 50% of the regions in which they could invade and establish in. (b) Frequency
distribution of regions.
10001 Final Report Page 43
(a) For each region, the proportion of species correctly predicted by SOM as being able or
unable to invade and establish in. Data generated from 100 virtual worlds and with species initially
distributed to 50% of the regions in which they could invade and establish in. (b) Frequency
of
of species correctly predicted by SOM as being able or
unable to invade and establish in. Data generated from 100 virtual worlds and with species initially
distributed to 50% of the regions in which they could invade and establish in. (b) Frequency

CRC10001
172
Virtual World Results - 10% Initial distribution
Predicting a species across all regions (100 simulations):
Species were initially distributed to between 5 and 12 regions. The SOM success rate for
predicting whether or not a species
regions correct up to 98.9% of regions correct (
to correctly predict whether or not a species was able to invade 91.5% of regions (420
regions). In addition, 95% of species were correctly predicted in greater than 85% of
regions (Figure 14(b)).
Figure 14. (a) For each species, the proportion of regions correctly predicted by SOM as being able or
unable to invade and establish in. Data generated from 100 simulations of the same
with species initially distributed to 10% of the regions in which they could invade and establish in. (b)
Frequency distribution of species. Shaded area = 95%.
Predicting a species across all regions (100
Species were initially distributed to between 4 and 14 regions. The SOM success rate for
predicting which regions a species was able to establish in ranged from 71.0% up to
99.3% (Figure 15(a)), and averaged 91.7%. In addition, 71% of species were correctly
predicted in greater than 90% of regions (
10001 Final Report Page 44
10% Initial distribution
Predicting a species across all regions (100 simulations):
Species were initially distributed to between 5 and 12 regions. The SOM success rate for
predicting whether or not a species could establish in a region ranged from 69.2% of
regions correct up to 98.9% of regions correct (Figure 14(a)). On average, SOM was able
predict whether or not a species was able to invade 91.5% of regions (420
regions). In addition, 95% of species were correctly predicted in greater than 85% of
(a) For each species, the proportion of regions correctly predicted by SOM as being able or
unable to invade and establish in. Data generated from 100 simulations of the same
with species initially distributed to 10% of the regions in which they could invade and establish in. (b)
Frequency distribution of species. Shaded area = 95%.
Predicting a species across all regions (100 virtual worlds):
itially distributed to between 4 and 14 regions. The SOM success rate for
predicting which regions a species was able to establish in ranged from 71.0% up to
(a)), and averaged 91.7%. In addition, 71% of species were correctly
predicted in greater than 90% of regions (Figure 15(b)).
of
Species were initially distributed to between 5 and 12 regions. The SOM success rate for
could establish in a region ranged from 69.2% of
(a)). On average, SOM was able
predict whether or not a species was able to invade 91.5% of regions (420
regions). In addition, 95% of species were correctly predicted in greater than 85% of
(a) For each species, the proportion of regions correctly predicted by SOM as being able or
unable to invade and establish in. Data generated from 100 simulations of the same virtual world and
with species initially distributed to 10% of the regions in which they could invade and establish in. (b)
itially distributed to between 4 and 14 regions. The SOM success rate for
predicting which regions a species was able to establish in ranged from 71.0% up to
(a)), and averaged 91.7%. In addition, 71% of species were correctly

CRC10001
172
Figure 15. (a) For each species, the proportion of regions correctly predicted by SOM as being able or
unable to invade and establish in. Data generated from 100 virtual worlds and with species initially
distributed to 10% of the regions in which they could invade and establish in. (b) Frequency
distribution of species. Shaded area = 71%.
Predicting species within a region (100 simulations):
For all regions in all simulation (45,900), SOM was able on average to correctly predict
whether or not 75% of the species were able to establish and invade a region. For the
majority of regions (74%), most species (75%) were correctly predicted by SOM as being
able or unable to invade and establish (
only 1 and 9 species appear to be particularly difficult SOM to predict with success rates
that vary from 1.7% up to 100% (
success rate for these regions was 71.4%, with 64% of regions having a 70% correct
prediction rate (Figure 17).
10001 Final Report Page 45
(a) For each species, the proportion of regions correctly predicted by SOM as being able or
unable to invade and establish in. Data generated from 100 virtual worlds and with species initially
e regions in which they could invade and establish in. (b) Frequency
distribution of species. Shaded area = 71%.
Predicting species within a region (100 simulations):
For all regions in all simulation (45,900), SOM was able on average to correctly predict
whether or not 75% of the species were able to establish and invade a region. For the
majority of regions (74%), most species (75%) were correctly predicted by SOM as being
able or unable to invade and establish (Figure 16(b)). Regions which initially had between
only 1 and 9 species appear to be particularly difficult SOM to predict with success rates
that vary from 1.7% up to 100% (Figure 16(a)). Despite this large variation, the average
success rate for these regions was 71.4%, with 64% of regions having a 70% correct
of
(a) For each species, the proportion of regions correctly predicted by SOM as being able or
unable to invade and establish in. Data generated from 100 virtual worlds and with species initially
e regions in which they could invade and establish in. (b) Frequency
For all regions in all simulation (45,900), SOM was able on average to correctly predict
whether or not 75% of the species were able to establish and invade a region. For the
majority of regions (74%), most species (75%) were correctly predicted by SOM as being
(b)). Regions which initially had between
only 1 and 9 species appear to be particularly difficult SOM to predict with success rates
(a)). Despite this large variation, the average
success rate for these regions was 71.4%, with 64% of regions having a 70% correct
CRC10001 Final Report Page 46 of
172
Figure 16. (a) For each region, the proportion of species correctly predicted by SOM as being able or
unable to invade and establish in. Data generated from 100 simulations of the same virtual world and
with species initially distributed to 10% of the regions in which they could invade and establish in. (b)
Frequency distribution of regions. Shaded area = 74%.
Figure 17. Frequency distribution for regions which only had between 1 and 9 species present
initially. Shaded area = 64%. The means that 64% of regions had 70% of species correctly predicted
by SOM as being either able or unable to invade and establish.
0.00
0.04
0.08
0.12
0.16
0.20
Pro
po
rtio
n o
f re
gio
ns
Proportion of species in a regioncorrectly predicted by SOM
CRC10001
172
Predicting species within a region (100 virtual worlds):
For all regions in all virtual worlds (45,900), SOM was able, on average, to correctly
predict whether or not 76.0% of the species were able to invade and establish in a regi
For the majority of regions (65%), most species (75%) were correctly predicted by SOM as
being able or unable to establish (
and 9 species (Figure 18(a)), appear to be particularly difficult for SOM to predict, with
success rates that vary from 1.5% up to 100%. Despite this large variation, the average
success rate for these regions was 73.2% of species, with 69% of regions having a 70%
correct prediction rate (Figure
Figure 18. (a) For each region, the proportion of species correctly predicted by SOM as being able or
unable to invade and establish in. Data generated from 100 virtual worlds and with species
distributed to 10% of the regions in which they could invade and establish in. (b) Frequency
distribution of species. Shaded area = 65%.
10001 Final Report Page 47
Predicting species within a region (100 virtual worlds):
For all regions in all virtual worlds (45,900), SOM was able, on average, to correctly
predict whether or not 76.0% of the species were able to invade and establish in a regi
For the majority of regions (65%), most species (75%) were correctly predicted by SOM as
being able or unable to establish (Figure 18(b)). Regions which initially had between only 1
(a)), appear to be particularly difficult for SOM to predict, with
rom 1.5% up to 100%. Despite this large variation, the average
success rate for these regions was 73.2% of species, with 69% of regions having a 70%
Figure 19).
(a) For each region, the proportion of species correctly predicted by SOM as being able or
unable to invade and establish in. Data generated from 100 virtual worlds and with species
distributed to 10% of the regions in which they could invade and establish in. (b) Frequency
distribution of species. Shaded area = 65%.
of
For all regions in all virtual worlds (45,900), SOM was able, on average, to correctly
predict whether or not 76.0% of the species were able to invade and establish in a region.
For the majority of regions (65%), most species (75%) were correctly predicted by SOM as
which initially had between only 1
(a)), appear to be particularly difficult for SOM to predict, with
rom 1.5% up to 100%. Despite this large variation, the average
success rate for these regions was 73.2% of species, with 69% of regions having a 70%
(a) For each region, the proportion of species correctly predicted by SOM as being able or
unable to invade and establish in. Data generated from 100 virtual worlds and with species initially
distributed to 10% of the regions in which they could invade and establish in. (b) Frequency
CRC10001 Final Report Page 48 of
172
Figure 19. Frequency distribution for regions which only had between 1 and 9 species present
initially. Shaded area = 69%. The means that 69% of regions had 70% of species correctly predicted
by SOM as being either able or unable to invade and establish.
Discussion
Although SOM was tested in two different scenarios, (100 simulations of the same virtual
world and 100 different virtual worlds), the results indicate little difference between the
two with respect to SOM prediction success. Clearly, SOM is very good at making
predictions, specifically at ranking those species most likely of establishing in different
regions above those species that are not.
The SOM analysis of fungal pathogens generated a risk list for Australia. Utilising Figure
13(a) we can determine a level of confidence around this list. Australia has approximately
250 fungal pathogen species present. SOM was able to successfully rank approximately
99% of the species in regions with approximately 250 species. This result gives a great
deal of confidence in this list. We can also determine, to some degree, the level of
confidence in the state lists generated (Appendix, Table 44-Table 51). New South Wales,
and Queensland both have approximately 200 species present. From Figure 13(a) we can
see that SOM ranked approximately 93% of species correctly. South Australia, Victoria,
Tasmania, and Western Australia all have approximately 100 species and the ranking
success for regions with this many species present was 95%. The Northern Territory only
has 40 species of fungal pathogens present and from Figure 18(a) we could estimate a
success rate of 86%.
SOM generated risk lists can be utilised by government biosecurity agencies around the
world wishing to prioritise and rank pest lists. Currently, this process often involves
consulting experts, industry stakeholders, and government employees. While the work
presented in this section shows that there is significant confidence in a list’s resilience to
errors in the data, this work shows that there is significant confidence in the accuracy of
the ranked predictions generated by SOM.
Present distributions of invasive species are a function of historic trade routes, which have
given these species the opportunities to invade the regions they have invaded. One
0.00
0.04
0.08
0.12
0.16
0.20
Pro
po
rtio
n o
f re
gio
ns
Proportion of species in a regioncorrectly predicted by SOM
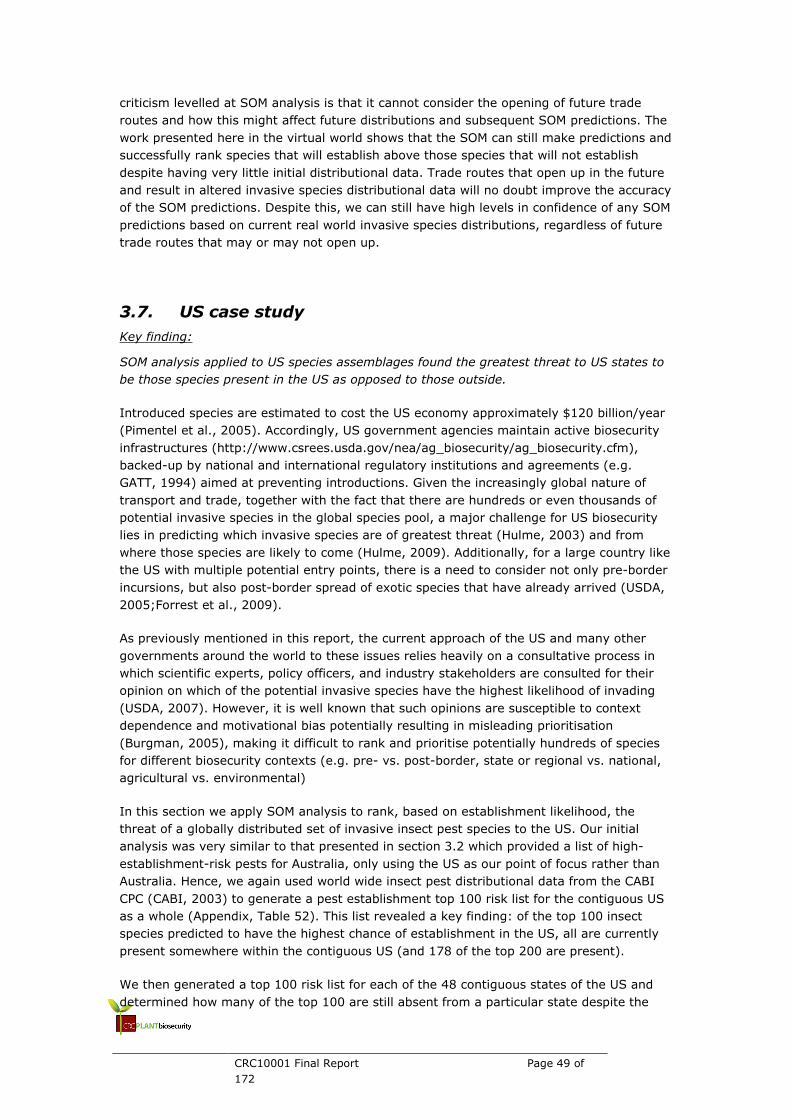
CRC10001 Final Report Page 49 of
172
criticism levelled at SOM analysis is that it cannot consider the opening of future trade
routes and how this might affect future distributions and subsequent SOM predictions. The
work presented here in the virtual world shows that the SOM can still make predictions and
successfully rank species that will establish above those species that will not establish
despite having very little initial distributional data. Trade routes that open up in the future
and result in altered invasive species distributional data will no doubt improve the accuracy
of the SOM predictions. Despite this, we can still have high levels in confidence of any SOM
predictions based on current real world invasive species distributions, regardless of future
trade routes that may or may not open up.
3.7. US case study
Key finding:
SOM analysis applied to US species assemblages found the greatest threat to US states to
be those species present in the US as opposed to those outside.
Introduced species are estimated to cost the US economy approximately $120 billion/year
(Pimentel et al., 2005). Accordingly, US government agencies maintain active biosecurity
infrastructures (http://www.csrees.usda.gov/nea/ag_biosecurity/ag_biosecurity.cfm),
backed-up by national and international regulatory institutions and agreements (e.g.
GATT, 1994) aimed at preventing introductions. Given the increasingly global nature of
transport and trade, together with the fact that there are hundreds or even thousands of
potential invasive species in the global species pool, a major challenge for US biosecurity
lies in predicting which invasive species are of greatest threat (Hulme, 2003) and from
where those species are likely to come (Hulme, 2009). Additionally, for a large country like
the US with multiple potential entry points, there is a need to consider not only pre-border
incursions, but also post-border spread of exotic species that have already arrived (USDA,
2005;Forrest et al., 2009).
As previously mentioned in this report, the current approach of the US and many other
governments around the world to these issues relies heavily on a consultative process in
which scientific experts, policy officers, and industry stakeholders are consulted for their
opinion on which of the potential invasive species have the highest likelihood of invading
(USDA, 2007). However, it is well known that such opinions are susceptible to context
dependence and motivational bias potentially resulting in misleading prioritisation
(Burgman, 2005), making it difficult to rank and prioritise potentially hundreds of species
for different biosecurity contexts (e.g. pre- vs. post-border, state or regional vs. national,
agricultural vs. environmental)
In this section we apply SOM analysis to rank, based on establishment likelihood, the
threat of a globally distributed set of invasive insect pest species to the US. Our initial
analysis was very similar to that presented in section 3.2 which provided a list of high-
establishment-risk pests for Australia, only using the US as our point of focus rather than
Australia. Hence, we again used world wide insect pest distributional data from the CABI
CPC (CABI, 2003) to generate a pest establishment top 100 risk list for the contiguous US
as a whole (Appendix, Table 52). This list revealed a key finding: of the top 100 insect
species predicted to have the highest chance of establishment in the US, all are currently
present somewhere within the contiguous US (and 178 of the top 200 are present).
We then generated a top 100 risk list for each of the 48 contiguous states of the US and
determined how many of the top 100 are still absent from a particular state despite the

CRC10001 Final Report Page 50 of
172
presence of a plant host in that state (Figure 20(a)).Note: we obtained plant host lists for
every pest species absent from a state and in that state’s top 100 list from the CABI CPC
(CABI, 2003). Using data from the United States Department of Agriculture (USDA) Plants
Database (http://plants.usda.gov/index.html), we determined for each pest if at least one
of these host plants was present in the state in which the species concerned was absent.
This indicated if a pest species was able to establish in principle in a state.
In contrast to the national risk list, we found that all states had species absent in their top
100, with most states having at least 20 absent species in their top 100 and one state
(Vermont) having almost half of the 100 absent (48).
We then asked, of those absent species in a states’ top 100, how many are present in
another state in the US? In all but one of the 48 contiguous states of the US, every absent
species in the top 100 for a state can be found in at least one other state and on average
will be found in 27 other states (Figure 20(b)). Moreover, we found the majority of absent
species in any states’ top 100 can be found in a neighbouring state that shares a border
(Figure 20(c)). On average, 84.3% of the absent species will be found in at least one
neighbouring state, with 12 states having all absent species in their top 100 present in a
neighbouring state (Figure 20(c)). The emergent conclusion from this information is that
for any state, the immediate present-day threat from known invasive insect pests is
greater from within the US than from foreign sources.

CRC10001 Final Report Page 51 of
172
Figure 20. (a) Number of absent species in the top 100 risk list for each state of the contiguous USA,
(b) Mean number of other states in the contiguous USA an absent species in the top 100 risk list is
found (e.g. for Alabama, the 23 absent species in its top 100 risk list are found, on average, in 31
other states), (c) Percentage of absent species in a state’s top 100 risk list found in at least one
neighbouring state.
0
5
10
15
20
25
30
35
Ala
bam
aLo
uis
ian
aG
eo
rgia
Texas
Ne
w Y
ork
Mis
sis
sip
pi
Ca
liforn
iaA
rkansas
Idaho
Arizo
na
Wa
shin
gto
nU
tah
Ore
gon
Ne
w M
exi
co
We
st V
irgin
iaM
ain
eM
ichig
an
Tenn
ess
ee
Monta
na
Okla
hom
aC
onnectic
ut
Wyom
ing
Ne
w H
am
pshire
South
Caro
lina
Massa
chusetts
Rh
ode I
slan
dK
ansas
Kentu
cky
Iow
aN
eva
da
De
law
are
Wis
con
sin
Ohio
Co
lora
do
Mis
souri
Ne
w J
ers
ey
India
na
Ne
bra
ska
No
rth C
aro
lina
No
rth D
akota
Virgin
iaM
innesota
Verm
on
tIllin
ois
Mary
land
Pennsyl
vania
South
Dakota
Flo
rid
a
me
an
# s
tate
s
0
10
20
30
40
50
Verm
on
tN
eva
da
Rh
ode I
slan
dN
ew
Ham
pshire
Wyom
ing
No
rth D
akota
South
Dakota
Arizo
na
Okla
hom
aM
onta
na
We
st V
irgin
iaA
rkansas
Ne
w M
exi
co
Kentu
cky
De
law
are
Iow
aN
ebra
ska
Main
eM
innesota
Idaho
Uta
hLo
uis
ian
aO
regon
Ala
bam
aT
enn
ess
ee
Kansas
Mis
sis
sip
pi
Co
lora
do
Wa
shin
gto
nC
onnectic
ut
Mis
souri
Flo
rid
aIn
dia
na
Massa
chusetts
Wis
con
sin
Geo
rgia
Ca
liforn
iaIllin
ois
South
Caro
lina
Ne
w J
ers
ey
Mic
hig
an
Texas
No
rth C
aro
lina
Virgin
iaM
ary
land
Ohio
Pennsyl
vania
Ne
w Y
ork
# a
bsen
t sp
ecie
s i
n t
op
100
0
10
20
30
40
50
60
70
80
90
100
We
st V
irgin
iaK
entu
cky
Tenn
ess
ee
Mis
souri
Wis
con
sin
Geo
rgia
Illin
ois
Mic
hig
an
No
rth C
aro
lina
Virgin
iaO
hio
Pennsyl
vania
Okla
hom
aC
olo
rad
oIn
dia
na
Ne
vad
aA
rkansas
South
Caro
lina
Iow
aN
ew
Jers
ey
South
Dakota
Ala
bam
aM
issis
sip
pi
Co
nnectic
ut
De
law
are
Ne
bra
ska
Massa
chusetts
Mary
land
Lo
uis
ian
aK
ansas
Wyom
ing
No
rth D
akota
Ne
w Y
ork
Monta
na
Idaho
Ne
w M
exi
co
Min
nesota
Arizo
na
Ore
gon
Verm
on
tR
hode I
slan
dU
tah
Texas
Ca
liforn
iaN
ew
Ham
pshire
Wa
shin
gto
nM
ain
eF
lorid
a
% o
f ab
se
nt
sp
ec
ies
fo
un
d in
a
ne
igh
bo
uri
ng
sta
te

CRC10001 Final Report Page 52 of
172
The one partial exception to this conclusion is Florida, for which nine out of the 18 species
absent in its top 100 are not found anywhere else in the contiguous USA, and a further
three species are only found in one other state. Thus, the immediate threat from outside
the US may be proportionately greater for Florida than any other contiguous US state.
Interestingly, of all inspection stations at US ports-of-entry (airports, maritime ports, and
land border sites), Miami had the greatest percentage (21.8%) of insect interceptions
(McCullough et al., 2006) indicating that it receives a significant number of insect pests
and may be a ‘doorway’ to insect pests entering the US.
In determining what factors could predict whether a state has a large number of absent
species in the top 100, it might be expected that larger states would accumulate more
species than smaller states and therefore have fewer absent species. We obtained state
size data from Wikipedia (http://en.wikipedia.org/wiki/List_of_U.S._states_by_area) and
used linear regression to determine if there was a significant relationship between the size
of the state and the number of absent species in a states’ top 100 list. We found no
relationship between the number of absent species in a state and state size (F1,46 = 0.06, p
= 0.8). Similarly, species diversity tends to decrease with latitude (Hillebrand, 2004) so it
might be expected that southern states would have fewer absent species than northern
states. We obtained state latitudinal range from Wikipedia’s web page for each individual
state. We then took the midpoint in a state’s latitudinal range and used linear regression to
determine if there was a significant relationship between a state’s latitude and the number
of absent species in a states’ top 100 list. Again there was no significant relationship
between the number of absent species in a states’ top 100 and the state latitudinal
midpoint (F1,46 = 2.45, p = 0.125).
We also tested inbound domestic passengers and gross state product against the number
of absent species in a state’s top 100. We obtained domestic passenger data from the US
Bureau of Transportation Statistics
(http://www.transtats.bts.gov/DL_SelectFields.asp?Table_ID=258), T-100 Domestic
Market (US Carriers) database (2007 data). We used asymptotic regression (exponential
curve) to determine if there was a significant relationship between the numbers of
passengers arriving into a state and the number of absent species in a state’s top 100 list.
We obtained gross state product (GSP) from Wikipedia
(http://en.wikipedia.org/wiki/List_of_U.S._states_by_GDP_(nominal)) and used
asymptotic regression (exponential curve) to determine if there was a significant
relationship between a state’s GSP and the number of absent species in a state’s top 100
list.
In contrast to state size or latitude, there was a significant negative relationship with the
number of inbound domestic passengers (F2,45 = 12.46, p < 0.001, R2 = 0.328, Figure 21),
and also gross state product (F2,45 = 43.48, p < 0.001, R2 = 0.644, Figure 22). These
measures can be considered surrogates for propagule pressure and ecological disturbance,
respectively (Westphal et al., 2008), both of which have been identified as determinants of
species invasion in other contexts (Lonsdale, 1999;Dalmazzone, 2000;Kolar and Lodge,
2001;Westphal et al., 2008). Thus, transport (‘propagule pressure’) and economic activity
(‘disturbance’) appear to be factors in determining the probability of establishment of
known invasive crop pests in the US states.

CRC10001 Final Report Page 53 of
172
Figure 21. Relationship between the number of incoming domestic flight passengers to a state and
the number of absent species in that state’s top 100 list (fitted curve: 17.96 + 20.04 × 0.749X).
0 20
10
40
20
30
40
50
10 5030
# domestic passengers (millions)
# s
pecie
s abs
ent
fro
m a
sta
te's
top
100
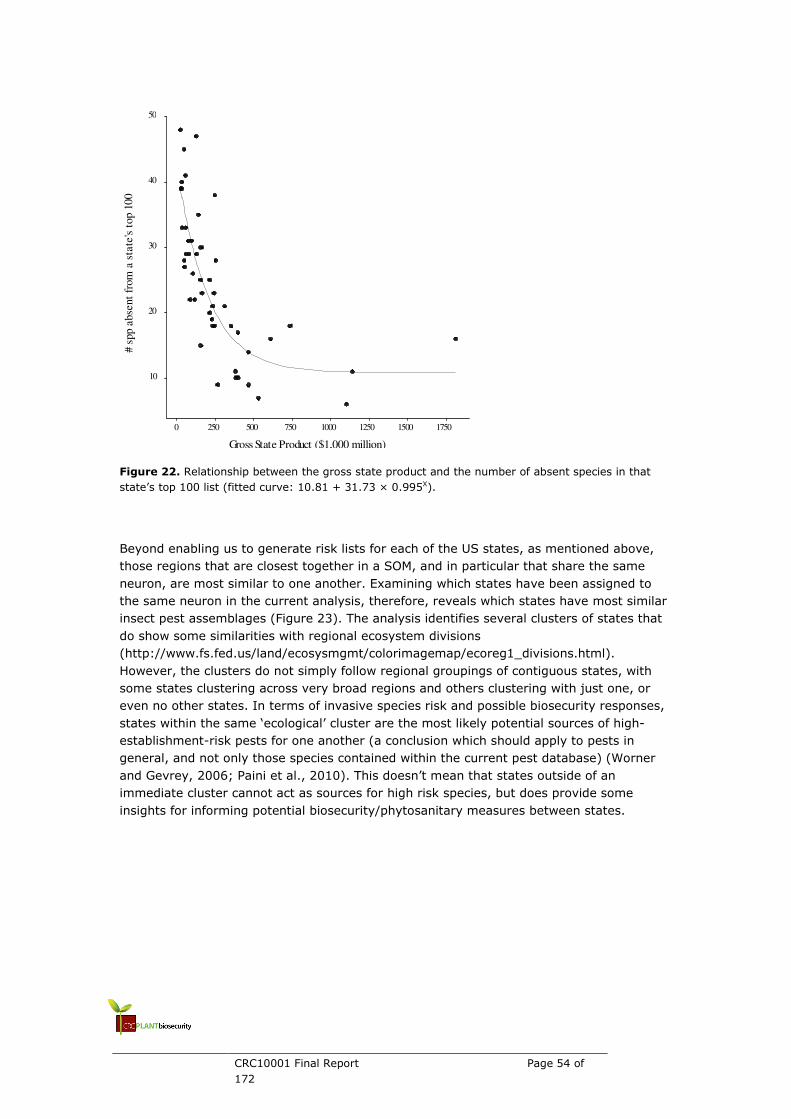
CRC10001 Final Report Page 54 of
172
Figure 22. Relationship between the gross state product and the number of absent species in that
state’s top 100 list (fitted curve: 10.81 + 31.73 × 0.995X).
Beyond enabling us to generate risk lists for each of the US states, as mentioned above,
those regions that are closest together in a SOM, and in particular that share the same
neuron, are most similar to one another. Examining which states have been assigned to
the same neuron in the current analysis, therefore, reveals which states have most similar
insect pest assemblages (Figure 23). The analysis identifies several clusters of states that
do show some similarities with regional ecosystem divisions
(http://www.fs.fed.us/land/ecosysmgmt/colorimagemap/ecoreg1_divisions.html).
However, the clusters do not simply follow regional groupings of contiguous states, with
some states clustering across very broad regions and others clustering with just one, or
even no other states. In terms of invasive species risk and possible biosecurity responses,
states within the same ‘ecological’ cluster are the most likely potential sources of high-
establishment-risk pests for one another (a conclusion which should apply to pests in
general, and not only those species contained within the current pest database) (Worner
and Gevrey, 2006; Paini et al., 2010). This doesn’t mean that states outside of an
immediate cluster cannot act as sources for high risk species, but does provide some
insights for informing potential biosecurity/phytosanitary measures between states.
0 500 1000 1500
10
20
30
40
250
50
1250750 1750
Gross State Product ($1,000 million)
# s
pp a
bse
nt
from
a s
tate
's t
op
100
CRC10001 Final Report Page 55 of
172
Figure 23. Map of contiguous USA showing those states that were allocated to the same neuron in a
SOM analysis (same colour) and hence those states which have the most similar insect pest
assemblages.
The SOM is essentially a statistical approach for predicting risk of establishment and
identifying the most suitable ‘source’ locations for pests, but it does not consider the risk of
a species actually arriving in a state. Therefore, if the SOM model predicts a high risk of
establishment for a species that is currently absent from a state, it is not possible to
determine if the species is absent because it has failed to arrive, or if the SOM prediction is
simply inaccurate. However, examining the distribution of absent species across risk levels
reveals that most absent species from a region occur in the lowest risk values, and of
those species with high risk values, most have already established. Thus, the model
predictions do not appear confounded by lack of appropriate introduction pathways or time
for establishment.
Further validation of the SOM technique can be obtained by comparing our predictions with
independent pest distribution data for the US. The National Agricultural Pest Information
System (NAPIS) pest tracker website (http://pest.ceris.purdue.edu/pestlist.php) publishes
maps for pests of agricultural and forest commodities based on survey data collected by
the Cooperative Agricultural Pest Survey (CAPS) and USDA Animal and Plant Health
Inspection Service’s (APHIS) Plant Protection and Quarantine (PPQ) program. These survey
maps show, on a county by county basis, where a pest species has or has not been found.
We identified 59 insect pest species present in this online database that were also present
in the CABI database and compared their observed distributions with the predicted risk of
establishment from the SOM. Although not a categorical threshold, assuming a risk value
of 0.5 indicates that the SOM model predicts a species is more likely to be present than
CRC10001 Final Report Page 56 of
172
absent, we found 86% agreement between observed (from the NAPIS website) and
predicted (from the SOM model) species distribution (Appendix, Table 53).
These validation results, together with analyses demonstrating that the method is resilient
to realistic reporting errors in the species presence/absence data (Paini et al., 2010),
suggest the SOM approach provides a robust method for exploring invasion risk, and
identifying the greatest pest threats plus the likely source sites based on pest assemblage
similarity. Our study reveals that, based on a known global list of insect pests, the greatest
immediate threats to the US come from within, since the majority of pest species most
capable of establishing have already established. This is reflected at the state level where,
for the majority of states, those species of highest risk of invading and establishing can be
found in another state, and often a neighbouring state. While this does not mean that the
US could not be invaded by other recognized pest species, or that new exotic insects can
not arrive and attain pest status, in terms of invasive species policy the results suggest the
need for increased awareness of state-level post-border biosecurity
(http://www.cdfa.ca.gov/phpps/ar/pe_exterior.html), especially amongst ecologically
clustered states.
3.8. SOMs and climate change
Key finding:
The SOM methodology on its own is unable to incorporate climate change into its risk lists
as it requires future species assemblages in response to climate change.
A SOM analysis alone can not make predictions of invasive species under climate change
as the data utilised is the invasion history of species (i.e. where invasive species have
invaded and established). There is little to no information on future species invasions
under climate change.
Ferrier (2005) has developed the Generalised Dissimilarity Model (GDM) and describes it as
a method to determine the level of species diversity dissimilarity between geographical
locations. Briefly, GDM estimates the expected dissimilarity in species composition of
ecological communities at different locations as a non-linear function of environmental
(including climatic) differences between these locations. The predictive maps generated
using the GDM technique are of a high spatial resolution, enabling specific area to be
examined in relatively fine detail. The predictive maps can therefore identify geographical
points that have the lowest level of dissimilarity (i.e. the most similar).
Using GDM it would be possible to generate a dissimilarity map for Australia based on
invasive species diversity. A geographical point of interest could be identified and its future
dissimilarity score under climate change could then be calculated. Present day
geographical points most similar to this geographical point under climate change could
then be identified and the SOM predictions for those points could be applied to the original
geographical point under climate change. In this way, invasive species predictions under
climate change could be made.
Unfortunately, the GDM analysis is conducted at a different scale to the SOM analysis. The
SOM analysis was conducted on data from the CABI CPC, in which the geographic unit was
country (in some cases for large countries, such as Australia, the country was further
divided into states, territories, provinces, etc.). The GDM analysis is conducted at a
significantly finer scale, 1km2 or 5km2 grids. This scale is not available at present for
CRC10001 Final Report Page 57 of
172
invasive species distributions and so it has not been possible to incorporate climate change
predictions with invasive species predictions.

CRC10001 Final Report Page 58 of
172
4. Implications for stakeholders
As a result of the work presented in this report, there are a number of implications for
stakeholders. The first and most important implication is that the SOM methodology is one
that is resilient to significant errors in the raw data and that there can be significant
confidence in the rankings generated by a SOM analysis. Given this, it is clear that SOMs
can be a useful and reliable analytical technique, which can be incorporated into the
current species prioritisation processes. These prioritisation processes often involve expert
and/or stakeholder solicitation and as such is prone to ‘human’ error. A SOM analysis could
be used initially to ‘screen’ the potential invasive species down to a more manageable
number, for this consultative process. In addition, the SOM rankings of this reduced list
can be included in the consultative process and provide extra information to be utilised by
those being consulted.
4.1. What have the SOMs told us?
Table 43 gives an indication of how some species previously thought to have a high risk of
establishment may not. For example, Anthonomus grandis (Cotton Boll Weevil) has been
ranked by PHA in their high risk of establishment category. However, according to the SOM
analysis of pest species from the CABI CPC this species has an extremely low likelihood of
establishment in Australia (risk index = 0). Of course, likelihood of establishment is just
one aspect of a risk assessment and it might be decided that despite this low likelihood of
establishment, the potential economic impact may warrant continued vigilance for this
pest. But, based on global pest assemblage data, the SOM analysis indicates that it’s
capacity to establish is much lower than previously thought.
This is only one example, but it highlights how SOMs, being a quantitative, objective
estimation of likelihood of establishment can be used by biosecurity agencies and industry
as a guide to prioritising invasion risk lists. This being the case, what are some of the
implications of our research and the SOM analysis in general in terms of how our
stakeholders might go about their future business?
4.2. How might the SOMs be used in its current form?
Results for an important supplement to existing IRAs
It is important to note that a SOM analysis is not something that should be solely used in
isolation when prioritising potential invasive pests. It can be thought of as providing an
important piece of the plant pest invasion jigsaw puzzle, but without the remaining pieces
it is largely ineffectual from a policy perspective. However, when combined with these
other pieces, such as pathway analysis, habitat suitability modelling and economic impact
simulations, it becomes empowering to biosecurity policy-makers who have had no
previous access to quantitative establishment risk information.
As highlighted in section 3.4, the information obtained from a SOM analysis (chiefly the
species establishment risk indexes) could in future form an important supplement for
existing pest prioritisation methods relying on expert opinion. Risk indices provided to
experts and stakeholders could potentially form an objective starting point for experts to
begin entering their views and opinions based on experiences. In addition, when the
number of species requiring expert consultations is prohibitively large, the SOM analysis
could be used as an initial screening device to eliminate species with low establishment

CRC10001 Final Report Page 59 of
172
risk. SOMs may in fact be used in a similar capacity in future border quarantine activities
involving species interceptions and the assessment of interception information. A SOM
ranking of potential pests could potentially give border protection officers an indication of
the likelihood of any intercepted species to establish within a given region.
Input into predictive models
As with other fields of research, biosecurity economics is becoming increasing quantitative.
But, while methods of assessing invasion consequences are advancing rapidly in this area,
the provision of supporting data and materials often lags behind. Probability models, and in
particular economic impact assessment models like those outlined in Cook (2008), Cook et
al. (2007), Cook and Matheson (2008) and Hodda and Cook (2010), require an
assessment of establishment likelihood as an input parameter. These studies have
highlighted, the sensitivity of results to this parameter is typically large, and there is a
great deal of importance on its accurate specification when results are to be used to inform
policy decisions. Up until this point in time quantitative estimates of establishment risk that
could be used in these assessments have been lacking, and analysts have resorted to
using Monte Carlo analyses with high numbers of iterations and broad parameter ranges to
demonstrate the possible effects of misspecification. This process of sensitivity testing is
set to benefit tremendously from the risk indices produced by SOM analysis for individual
species.
The CRC NPB project Enhanced Risk Analysis Tools (CRC10010) has explored the design
and implementation of quantitative bioeconomic models providing consequence
assessments, and we have maintained an on-going dialogue about the future use of SOM
outputs into this process. Cook et al. (in press) represents the first attempt to use SOM
establishment indices to inform these models.
4.3. What testing remains to be done?
While the work presented in this report shows that SOM analysis is both resilient to
significant errors in the data and accurate in its ability to predict and rank invasive pests,
the next logical step is to assess the risk indices generated from the SOM analysis and
applied to each species. It would be desirable to be able to inform biosecurity agencies and
policy-makers what SOM establishment risk index corresponds to a 95% likelihood of a
species establishing in a region. This ‘cut off’ point can be obtained from the same virtual
world presented in this report, by comparing the risk indices given to those species that
cannot establish in a region with those that can. A second (and perhaps more desirable)
methods of determining this cut off point might involve the use of historical interception
data for species that have consistently arrived into a region but failed to establish.
Determining the risk index given to these species in a SOM analysis will indicate the range
of risk indices that will not result in establishment.
4.4. How might the SOMs be used in future?
Identifying high-risk species and their likely source
As we have shown throughout this report, a SOM analysis has the ability to identify
potential invasive species. A powerful supplement to this approach in future could be the
identification of source regions of these species. We have identified GDMs as an existing
modelling technique that could be used in conjunction with SOMs to identify potential
source regions, and feel that an exploration of the potential to combine the two
approaches is warranted. Recall from section 3.8, GDM produces high-resolution predictive

CRC10001 Final Report Page 60 of
172
maps comparing regions in different parts of the world to reveal geographical points that
have the highest ecological similarity. These similar regions represent areas from which
species could be transferred and survive, and therefore those regions that might contain
future pest species. When combined with a SOM analysis, analysts would be in a position
to identify species with a high risk of establishing within a region (i.e. using SOM) and
where that species is likely to come from (i.e. using GDMs). Moreover, GDMs have the
advantage of being able to incorporate climate change into its predictions, bringing
significantly more power to the predictions of SOM analyses.
Indentifying highly vulnerable species
The work presented here focuses on predicting invasive species, but we believe this
analytical technique could also be applied in the biodiversity arena and used to identify
vulnerable native species. While the SOM generates risk indices for species that are absent
from a region, it also generates risk indices for species that are present. If a SOM analysis
was applied to native distributions, examining the lowest risk indices given to those
species present in a region will identify those species most vulnerable to extinction in that
region.
5. Recommendations
1. The development of a communication strategy with Australian and
international biosecurity agencies to encourage the uptake of SOMs as an effective risk identification technology.
Further interactions with Australian and international biosecurity agencies to encourage
the uptake of this technology are recommended. SOMs represent a reliable and cost
effective method of generating quantitative measures of species arrival likelihoods that
equip biosecurity agencies with a pre-invasion early-warning device for risk
management planning.
2. An online or PC-based SOM device be developed that is capable of producing
country and (where possible) region-based estimates of exotic species potential to establish.
The development of an online or ‘off the shelf’ product that could be made available to
these biosecurity agencies would further enhance the likelihood of uptake and we
strongly recommend this focus.
3. The results of SOMs analyses that quantitatively express species
establishment likelihoods should be incorporated into traditional forms of quantitative risk assessment.
Given the reliability and cost effectiveness of the SOMs method of generating
establishment likelihood indexes for invasive species, the use of SOMs to supplement
other predictive decision-support tools is to be encouraged. These include
epidemiological models and economic impact assessment models. Establishment
likelihood is a critical parameter most often characterised by complete ignorance or
profound uncertainty, and is therefore the cause of significant disturbances in

CRC10001 Final Report Page 61 of
172
predictive models. The ability of the SOMs method to generate results that can be
directly applied in these models will prove of great benefit in this regard.
4. SOM analysis can be incorporated in to existing pest risk analysis and import risk analysis methodologies.
SOM methodology potentially has two functions in import risk analysis and pest risk analysis. The first is to use as an initial screening process, which can reduce the list of potential invasive species to a more manageable list for expert and stakeholder solicitation. Secondly, species establishment indices generated by the SOM can be used in the solicitation process as an unbiased and objective assessment of the relative likelihood of establishment for potential invasive pests.
5. Strategies for the effective communication of risk and uncertainty in
emergency plant pest prioritisation and preparedness decisions should form a part of future research proposals.
As a SOM analysis assesses the likelihood of establishment, there is a significant need
to generate similar rankings of the likelihood of a species arriving to Australia. In this
way, both aspects of the likelihood equation (arrival and establishment) can be
combined to generate an overall estimate of likelihood of an invasion occurring. We
recommend funding further research into estimating arrival likelihood and in particular,
the use of social network theory to analyse the available data.
6. Further research should be conducted on the use of SOMs - which identify
high-risk species for a particular area) - with methods identifying source regions for future invasive species under climate change.
There is a strong likelihood that complementarities exist between SOMs and other
existing methods of habitat matching. Generalised Dissimilarity Modelling (GDM), for
instance, is able to identify high-risk regions related to a given area within Australia.
Research is needed to explore the compatibility of results produced by both, which
might in future be used as complements to provide comprehensive risk assessments in
a timely and cost-effective manner.
7. Caution must be exercised when quoting high-establishment-risk lists
generated by SOMs using the Australian Plant Pest Database as data for some
states and territories contains non-pest species, while for others there is insufficient data recorded.
APPD data entries are not limited to plant pests or diseases, and often contain species
that are harmless or of low economic, social or environmental significance. Hence,
when using SOMs output generated from APPD, appropriate filters should be used to
isolate those species that are of negligible biosecurity significance.
For some regions there is simply insufficient data in the APPD to make a meaningful
comparison of species distributions elsewhere. Of particular concern are the Northern
Territory lists of present bacterial and viral pathogens, which currently contained only
seven and three species (respectively). As we have shown in Section 3.6, any list
generated for a region which contains so few species initially can be prone to
significant levels of inaccuracy in the list rankings. We strongly recommend that these
two Northern Territory lists not be used in any biosecurity prioritisation process.

CRC10001 Final Report Page 62 of
172

CRC10001 Final Report Page 63 of
172
6. Abbreviations/glossary
ABBREVIATION FULL TITLE
APHIS Animal and Plant Health Inspection Service’s
APPD Australian Plant Pest Database
BMU Best Matching Unit
CABI Centre for Agriculture and Biosciences International
CPC Crop Protection Compendium
CRCNPB Cooperative Research Centre for National Plant
Biosecurity
DAFF Department of Agriculture, Fisheries and Forestry
EPP Emergency plant pest
GDM Generalised Dissimilarity Modelling
InIx Invasibility Index
InRq Invasibility Requirements
IRA Import Risk Analysis
IUCN International Union for Conservation of Nature
NAPIS National Agricultural Pest Information System
PHA Plant Health Australia
PNG Papua New Guinea
PPQ Plant Protection and Quarantine
PRA Pest Risk Analysis
SOM Self Organising Map
USDA United States Department of Agriculture
7. Plain English website summary
CRC project no: CRC10001
Project title: Early warning of pre-emergent emergency plant pest threats
Project leader: Dr David Cook
Project team: Dr David Cook, Dr Dean Paini, Dr Sue Worner
Research outcomes: Self organising maps (SOM) are a useful tool for ranking
species by their likelihood of establishment. We have tested
this tool and found it to be both resilient to significant errors
in the distributional data (up to 20%) and very reliable in its
predictions of which species will and wont invade a region.
Research implications: SOM would be a valuable tool to integrate into the current
biosecurity practices. It could be used initially to screen a
large number of potential invasive species down to a more
manageable number. The rankings generated by SOM for this
CRC10001 Final Report Page 64 of
172
reduced list could then be included in the consultative process
currently used to prioritise pest lists.
Research publications: 1. Paini, D.R., Worner, S.P., Cook, D.C., De Barro, P.J.,
Thomas, M.B. (2010) Using a self organising map to predict
invasive species: sensitivity to data errors and a comparison
with expert opinion. Journal of Applied Ecology, in press.
Acknowledgements: The project team would like to thank the following
government agencies for their gracious support of the project:
Department of Agriculture, Fisheries and Forestry – Bureau of
Rural Science; Department of Agriculture and Food Western
Australia, Department of Primary Industries Victoria; the
South Australian Research and Development Institute; New
South Wales Department of Primary Industries; Northern
Territory Department of Primary Industries, Fisheries and
Mines; the Tasmanian Department of Primary Industries and
Water; and the Queensland Department of Primary Industries
and Fisheries.
We would like to acknowledge the help and advice of the
following people and organisations: Richard Mack, Andy
Sheppard, Paul De Barro, Matthew Thomas, CAB
International, Tak Ikeda, Roger Magarey, Dan Fieselmann,
Karl Suiter, Sharyn Taylor, Nadiah Kristensen, Simon Barry,
John LaSalle, Marianne Horak, Rolf Oberprieler, Peter
Gillespie, Bob Forrester, Alice Wells, Darren Kriticos, Felix
Bianchi, Gary Fitt, Roger Shivas, Mike Watts, Greg Baker and
Marc Poole.
Thank you very much to CRC NPB’s Delivery and Adoption
Program and CSIRO Computational and Simulation Sciences
Transformational Capability Platform for their generous
support of the Technologies Enhancing Biosecurity
Preparedness workshop held at the Rydges Lakeside Canberra
Hotel on the 21st May 2009. We particularly thank John Taylor
(CSIRO), Cain Roberts (CRC NPB) and Melanie Hay (CRC NPB)
for their help in arranging the workshop. We would also like to
thank all who participated and helped to make it a success,
including Jeanine Baker (DAFF – BRS), Joanne Banyer (ABIN),
Mike Cole (OCPPO), Andrew Copp (DEWHA), Daniel
Fieselmann (USDA – APHIS), Neil Grant (DAFF – BA), Don
Gunusekera (DAFF – ABARE), Takayoshi Ikeda (Lincoln
University), Jon Knight (Imperial College London/PRATIQUE),
Gwenael Leday (Lincoln University), Simon McKirdy (CRC
NPB), Steve McMahon (ABIN), David Newth (CSIRO), Bill
Roberts (DAFF – BA), John Sandow (CRC NPB), Andy
Sheppard (CSIRO), John Taylor (CSIRO), Sharyn Taylor
(PHA), Louise Van Meurs (DAFF – BA).

8. Appendix

CRC10001 Final Report Page 66 of
172
Table 12. The full risk list for insect pest species absent from Australia.
Rank Species names Risk Index Rank Species names Risk Index Rank Species names Risk Index
1 Scirpophaga incertulas 0.7924 190 Nephotettix cincticeps 0.0971 379 Anthonomus grandis 0
2 Oryctes rhinoceros 0.7722 191 Acrobasis pyrivorella 0.0971 380 Choristoneura conflictana 0
3 Sesamia inferens 0.7695 192 Hadula trifolii 0.0969 381 Choristoneura occidentalis 0
4 Scrobipalpa heliopa 0.7128 193 Lymantria monacha 0.0956 382 Hedya nubiferana 0
5 Marasmia exigua 0.6856 194 Orosius orientalis 0.0954 383 Aspidiella sacchari 0
6 Diaphorina citri 0.6807 195 Acronicta rumicis 0.094 384 Asterolecanium pustulans 0
7 Aleurocanthus woglumi 0.6801 196 Trialeurodes vaporariorum 0.0938 385 Mamestra configurata 0
8 Leucinodes orbonalis 0.6748 197 Bactrocera minax 0.093 386 Blissus leucopterus 0
9 Stephanitis typica 0.6675 198 Euscepes postfasciatus 0.0923 387 Brachycerus muricatus 0
10 Xylosandrus compactus 0.6632 199 Paranthrene tabaniformis 0.0923 388 Archips rosana 0
11 Pelopidas mathias 0.6446 200 Autographa gamma 0.0923 389 Castniomera licus 0
12 Dicladispa armigera 0.6378 201 Jacobiasca lybica 0.0874 390 Caulophilus oryzae 0
13 Acherontia styx 0.6356 202 Zabrotes subfasciatus 0.086 391 Cephus cinctus 0
14 Chilo auricilius 0.6338 203 Schistocerca gregaria 0.0818 392 Cephus pygmeus 0
15 Nephotettix virescens 0.6279 204 Henosepilachna elaterii 0.0778 393 Cerotoma trifurcata 0
16 Planococcus lilacinus 0.594 205 Adoxophyes orana 0.0732 394 Ceroplastes cirripediformis 0
17 Batocera rubus 0.5836 206 Carposina sasakii 0.0717 395 Ceutorhynchus assimilis 0
18 Aulacophora lewisii 0.5702 207 Popillia japonica 0.0716 396 Choristoneura fumiferana 0
19 Toxoptera odinae 0.5694 208 Bactrocera oleae 0.0708 397 Choristoneura pinus 0
20 Orseolia oryzae 0.5676 209 Anoplophora glabripennis 0.0707 398 Choristoneura rosaceana 0
21 Odoiporus longicollis 0.5669 210 Diuraphis noxia 0.0702 399 Cnephasia longana 0
22 Chilo infuscatellus 0.5559 211 Coptotermes formosanus 0.07 400 Colaspis hypochlora 0
23 Zeuzera coffeae 0.551 212 Grapholita inopinata 0.0699 401 Conotrachelus nenuphar 0
24 Helopeltis theivora 0.5425 213 Carpomya pardalina 0.0695 402 Contarinia lycopersici 0
25 Hypomeces squamosus 0.5395 214 Phyllotreta cruciferae 0.0695 403 Corynothrips stenopterus 0
26 Orgyia postica 0.5343 215 Sipha maydis 0.0685 404 Corythuca gossypii 0
27 Pinnaspis strachani 0.529 216 Ceroplastes japonicus 0.068 405 Cerataphis lantaniae 0
28 Rastrococcus invadens 0.519 217 Anoplophora malasiaca 0.0664 406 Corythaica cyathicollis 0
29 Parasa lepida 0.5177 218 Dendrolimus spectabilis 0.0661 407 Curculio elephas 0
30 Papilio polytes 0.5119 219 Oedaleus senegalensis 0.0655 408 Grapholita packardi 0
31 Bactrocera dorsalis 0.5008 220 Selenaspidus articulatus 0.0655 409 Dalbulus maidis 0
32 Hydrellia philippina 0.4957 221 Hyphantria cunea 0.0647 410 Dasineura brassicae 0
33 Omphisa anastomosalis 0.4933 222 Ips cembrae 0.0647 411 Dasineura mali 0
34 Erionota thrax 0.4931 223 Ips typographus 0.0647 412 Dasineura pyri 0

CRC10001 Final Report Page 67 of
172
Table 12 (continued).
Rank Species names Risk Index Rank Species names Risk Index Rank Species names Risk Index
35 Schizaphis graminum 0.4895 224 Sitodiplosis mosellana 0.0647 413 Dendroctonus brevicomis 0
36 Aproaerema modicella 0.4841 225 Delia floralis 0.0646 414 Dendroctonus frontalis 0
37 Xylotrechus quadripes 0.4835 226 Malacosoma neustria 0.0646 415 Dendroctonus ponderosae 0
38 Attacus atlas 0.4821 227 Caryedon serratus 0.0645 416 Dendroctonus pseudotsugae 0
39 Ceratovacuna lanigera 0.4774 228 Atherigona biseta 0.0633 417 Dendroctonus rufipennis 0
40 Bactrocera latifrons 0.4651 229 Contarinia tritici 0.0633 418 Diabrotica balteata 0
41 Hypothenemus hampei 0.4606 230 Anthonomus pomorum 0.0631 419 Diabrotica barberi 0
42 Henosepilachna pusillanima 0.4605 231 Gilpinia hercyniae 0.0631 420 Diabrotica speciosa 0
43 Idioscopus clypealis 0.4589 232 Ips sexdentatus 0.0631 421 Diabrotica undecimpunctata 0
44 Sternochetus frigidus 0.4586 233 Cacopsylla pyrisuga 0.063 422 Diabrotica virgifera virgifera 0
45 Trichoplusia ni 0.4573 234 Sitona hispidulus 0.063 423 Diaspis boisduvalii 0
46 Dialeurodes citri 0.4532 235 Metamasius hemipterus 0.0627 424 Diatraea centrella 0
47 Pyrilla perpusilla 0.4499 236 Melolontha melolontha 0.0617 425 Diatraea grandiosella 0
48 Chilo sacchariphagus 0.4491 237 Aeolesthes sarta 0.0616 426 Diatraea lineolata 0
49 Atherigona soccata 0.4395 238 Dendroctonus micans 0.0616 427 Diatraea saccharalis 0
50 Sinoxylon conigerum 0.4335 239 Eulecanium tiliae 0.0616 428 Diprion pini 0
51 Cricula trifenestrata 0.4329 240 Pegomya hyoscyami 0.0616 429 Diaphania nitidalis 0
52 Chilo partellus 0.4206 241 Stephanitis pyrioides 0.0616 430 Diaprepes abbreviatus 0
53 Orthezia insignis 0.4138 242 Zeuzera pyrina 0.0616 431 Diaprepes famelicus 0
54 Rhipiphorothrips cruentatus 0.4108 243 Cryptomyzus ribis 0.0615 432 Dryocoetes confusus 0
55 Batocera rufomaculata 0.41 244 Hylobius abietis 0.0615 433 Dysdercus andreae 0
56 Omiodes indicata 0.4097 245 Grapholita funebrana 0.0615 434 Dyspessa ulula 0
57 Plocaederus obesus 0.4047 246 Monochamus saltuarius 0.0615 435 Edessa meditabunda 0
58 Bactrocera tau 0.4008 247 Pandemis heparana 0.0615 436 Epidiaspis leperii 0
59 Adoretus versutus 0.3917 248 Sphaerolecanium prunastri 0.0615 437 Crocidosema aporema 0
60 Hieroglyphus banian 0.3888 249 Opogona sacchari 0.059 438 Epitrix cucumeris 0
61 Rastrococcus iceryoides 0.3879 250 Protopulvinaria mangiferae 0.0392 439 Epitrix hirtipennis 0
62 Fulmekiola serrata 0.3834 251 Neoaliturus tenellus 0.0382 440 Epitrix tuberis 0
63 Phyllotreta chotanica 0.3803 252 Chelonus insularis 0.0376 441 Erinnyis alope 0
64 Bactrocera zonata 0.3802 253 Pissodes nemorensis 0.0376 442 Erinnyis ello 0
65 Melanagromyza obtusa 0.3747 254 Cacoecimorpha pronubana 0.0376 443 Saturnia pavonia 0
66 Liriomyza huidobrensis 0.3743 255 Anthonomus bisignifer 0.0356 444 Eutinobothrus brasiliensis 0
67 Tarophagus colocasiae 0.372 256 Athalia rosae 0.0356 445 Feltia subterranea 0
68 Chilo polychrysus 0.3658 257 Lobesia botrana 0.0345 446 Frankliniella fusca 0

CRC10001 Final Report Page 68 of
172
Table 12 (continued).
Rank Species names Risk Index Rank Species names Risk Index Rank Species names Risk Index
69 Helopeltis bradyi 0.3634 258 Byturus tomentosus 0.0339 447 Frankliniella insularis 0
70 Phyllotreta striolata 0.3604 259 Euproctis chrysorrhoea 0.0339 448 Frankliniella melanommatus 0
71 Minthea rugicollis 0.36 260 Characoma stictigrapta 0.033 449 Frankliniella tritici 0
72 Idioscopus niveosparsus 0.3589 261 Phorodon humuli 0.0329 450 Fundella pellucens 0
73 Scotinophara coarctata 0.3589 262 Dendrolimus sibiricus 0.0324 451 Gnathotrichus sulcatus 0
74 Naranga diffusa 0.3445 263 Operophtera brumata 0.0324 452 Keiferia lycopersicella 0
75 Liriomyza trifolii 0.3431 264 Epilachna varivestis 0.0323 453 Heliothis virescens 0
76 Urentius hystricellus 0.342 265 Ips duplicatus 0.0323 454 Helicoverpa zea 0
77 Megymenum brevicorne 0.3326 266 Philaenus spumarius 0.0323 455 Agrius cingulatus 0
78 Elaeidobius kamerunicus 0.3311 267 Cacopsylla pyricola 0.0323 456 Heterotermes tenuis 0
79 Aulacaspis tegalensis 0.3262 268 Taeniothrips inconsequens 0.0323 457 Hellula phidilealis 0
80 Bombyx mori 0.3194 269 Mythimna unipuncta 0.0317 458 Homalodisca coagulata 0
81 Rhynchophorus vulneratus 0.3189 270 Hypera zoilus 0.0313 459 Horcias nobilellus 0
82 Aulacophora foveicollis 0.3156 271 Acrolepiopsis assectella 0.0308 460 Hortensia similis 0
83 Tessaratoma papillosa 0.3147 272 Amphimallon solstitiale 0.0308 461 Howardia biclavis 0
84 Statherotis discana 0.3145 273 Bothynoderes punctiventris 0.0308 462 Hypothenemus obscurus 0
85 Cydia leucostoma 0.3132 274 Coleophora laricella 0.0308 463 Herpetogramma bipunctalis 0
86 Bactrocera umbrosa 0.3105 275 Dysmicoccus boninsis 0.0308 464 Hylurgopinus rufipes 0
87 Pseudococcus jackbeardsleyi 0.3105 276 Elasmopalpus lignosellus 0.0308 465 Ips amitinus 0
88 Perkinsiella vastatrix 0.3052 277 Empoasca fabae 0.0308 466 Ips confusus 0
89 Artona catoxantha 0.3043 278 Epirrita autumnata 0.0308 467 Ips pini 0
90 Heterobostrychus aequalis 0.3037 279 Eurygaster integriceps 0.0308 468 Ischnaspis longirostris 0
91 Poecilocoris latus 0.3037 280 Rhyacionia buoliana 0.0308 469 Spodoptera frugiperda 0
92 Opisina arenosella 0.303 281 Haplothrips tritici 0.0308 470 Grapholita prunivora 0
93 Chondracris rosea 0.2994 282 Hydraecia micacea 0.0308 471 Leptinotarsa decemlineata 0
94 Prays endocarpa 0.2905 283 Delia radicum 0.0308 472 Lagocheirus araneiformis 0
95 Chromatomyia horticola 0.2827 284 Delia coarctata 0.0308 473 Ligyrus cuniculus 0
96 Medythia suturalis 0.2746 285 Hypsipyla grandella 0.0308 474 Lixus juncii 0
97 Acherontia lachesis 0.2735 286 Ips calligraphus 0.0308 475 Lygus lineolaris 0
98 Aphis fabae 0.2704 287 Cydia splendana 0.0308 476 Macrosiphoniella sanborni 0
99 Tetramoera schistaceana 0.2684 288 Oulema melanopus 0.0308 477 Macrosteles quadrilineatus 0
100 Rhynchocoris poseidon 0.2682 289 Leucoptera malifoliella 0.0308 478 Malacosoma americanum 0
101 Acanthocoris scabrator 0.2649 290 Leucoma salicis 0.0308 479 Malacosoma disstria 0
102 Eurydema pulchrum 0.2647 291 Loxostege sticticalis 0.0308 480 Mayetiola destructor 0

CRC10001 Final Report Page 69 of
172
Table 12 (continued).
Rank Species names Risk Index Rank Species names Risk Index Rank Species names Risk Index
103 Stauropus alternus 0.2642 292 Meromyza saltatrix 0.0308 481 Mycetaspis personata 0
104 Frankliniella intonsa 0.2636 293 Monochamus sutor 0.0308 482 Megachile rotundata 0
105 Nipaecoccus nipae 0.2619 294 Orgyia antiqua 0.0308 483 Megastes grandalis 0
106 Promecotheca cumingii 0.2598 295 Pandemis cerasana 0.0308 484 Megastigmus spermotrophus 0
107 Clanis bilineata 0.2594 296 Psila rosae 0.0308 485 Meligethes aeneus 0
108 Pieris brassicae 0.2576 297 Cacopsylla pyri 0.0308 486 Cydia latiferreana 0
109 Indarbela quadrinotata 0.2559 298 Scolytus rugulosus 0.0308 487 Melanoplus bivittatus 0
110 Adoretus sinicus 0.2547 299 Scolytus scolytus 0.0308 488 Melanoplus sanguinipes 0
111 Amsacta lactinea 0.2544 300 Tuta absoluta 0.0308 489 Mocis latipes 0
112 Hyblaea puera 0.2541 301 Sitona cylindricollis 0.0308 490 Monochamus carolinensis 0
113 Deporaus marginatus 0.2532 302 Tomicus piniperda 0.0308 491 Monochamus galloprovincialis 0
114 Chlumetia transversa 0.253 303 Spodoptera littoralis 0.0304 492 Monochamus scutellatus 0
115 Lepidiota stigma 0.2529 304 Cryptophlebia leucotreta 0.03 493 Metcalfa pruinosa 0
116 Bactrocera papayae 0.249 305 Sesamia calamistis 0.03 494 Mythimna latiuscula 0
117 Setora nitens 0.2427 306 Earias biplaga 0.0286 495 Nasonovia ribisnigri 0
118 Lopholeucaspis japonica 0.2419 307 Oryctes monoceros 0.0286 496 Neodiprion sertifer 0
119 Parnara guttatus 0.2413 308 Oryctes boas 0.0285 497 Acrosternum hilare 0
120 Mimegralla coeruleifrons 0.2404 309 Nomadacris septemfasciata 0.0283 498 Neoaliturus haematoceps 0
121 Holotrichia serrata 0.2382 310 Clavigralla elongata 0.0268 499 Nasutitermes costalis 0
122 Trialeurodes ricini 0.2376 311 Trioza erytreae 0.0266 500 Orgyia pseudotsugata 0
123 Plocaederus ruficornis 0.2359 312 Phenacoccus manihoti 0.0222 501 Orthezia praelonga 0
124 Caloptilia theivora 0.235 313 Clavigralla tomentosicollis 0.0221 502 Orthosia cerasi 0
125 Laodelphax striatellus 0.2348 314 Eldana saccharina 0.0221 503 Otiorhynchus armadillo 0
126 Amsacta moorei 0.2331 315 Megalurothrips sjostedti 0.022 504 Otiorhynchus singularis 0
127 Bactrocera carambolae 0.229 316 Ceratitis cosyra 0.0209 505 Paracoccus marginatus 0
128 Melanaspis glomerata 0.2269 317 Heteronychus licas 0.0208 506 Acleris variana 0
129 Brachycaudus helichrysi 0.2237 318 Dysdercus fasciatus 0.0205 507 Phyllonorycter blancardella 0
130 Acrocercops syngramma 0.2233 319 Ceratitis rosa 0.0203 508 Phyllonorycter crataegella 0
131 Oxya chinensis 0.2226 320 Scirtothrips aurantii 0.0196 509 Phthia picta 0
132 Empoasca vitis 0.2201 321 Trichispa sericea 0.0191 510 Scrobipalpa ocellatella 0
133 Pseudococcus comstocki 0.2102 322 Zonocerus elegans 0.0184 511 Piezodorus guildinii 0
134 Hysteroneura setariae 0.2096 323 Busseola fusca 0.0153 512 Chionaspis minor 0
135 Sesamia cretica 0.2093 324 Ootheca mutabilis 0.0144 513 Pissodes castaneus 0
136 Sitobion avenae 0.2092 325 Cylas puncticollis 0.0142 514 Pissodes strobi 0

CRC10001 Final Report Page 70 of
172
Table 12 (continued).
Rank Species names Risk Index Rank Species names Risk Index Rank Species names Risk Index
137 Amritodus atkinsoni 0.2068 326 Alcidodes dentipes 0.0133 515 Pissodes terminalis 0
138 Citripestis sagittiferella 0.2051 327 Rhynchophorus phoenicis 0.0132 516 Pityogenes chalcographus 0
139 Darna diducta 0.2051 328 Monochamus leuconotus 0.0131 517 Platynota stultana 0
140 Xyleborus ferrugineus 0.2044 329 Antestiopsis orbitalis 0.0126 518 Amblyptilia pica 0
141 Deilephila elpenor 0.2029 330 Mesoplatys cincta 0.0126 519 Platypus parallelus 0
142 Callosobruchus analis 0.2005 331 Mesoplatys ochroptera 0.0126 520 Prays oleae 0
143 Trogoderma granarium 0.1894 332 Ceratitis punctata 0.012 521 Spodoptera eridania 0
144 Atherigona pulla 0.1853 333 Apomecyna binubila 0.0115 522 Manduca sexta 0
145 Parabemisia myricae 0.1823 334 Coelaenomenodera elaeidis 0.011 523 Psylliodes chrysocephala 0
146 Biston suppressaria 0.1793 335 Sahlbergella singularis 0.0105 524 Ostrinia nubilalis 0
147 Ampelophaga rubiginosa 0.1792 336 Eulophonotus myrmeleon 0.0104 525 Rhagoletis cerasi 0
148 Dioryctria abietella 0.1771 337 Cacyreus marshalli 0.008 526 Rhagoletis cingulata 0
149 Liriomyza sativae 0.1733 338 Helopeltis schoutedeni 0.0077 527 Rhagoletis completa 0
150 Pseudodendrothrips mori 0.166 339 Leucoptera caffeina 0.007 528 Rhagoletis fausta 0
151 Aonidomytilus albus 0.1657 340 Perileucoptera coffeella 0.007 529 Rhagoletis indifferens 0
152 Erosomyia mangiferae 0.1655 341 Diabolocatantops axillaris 0.0068 530 Rhagoletis mendax 0
153 Oryzaephilus mercator 0.1636 342 Phenacoccus madeirensis 0.0054 531 Rhagoletis pomonella 0
154 Dacus ciliatus 0.1614 343 Zonocerus variegatus 0.0054 532 Rhagoletis ribicola 0
155 Chrysodeixis chalcites 0.1606 344 Planococcus kenyae 0.0053 533 Rhyacionia frustrana 0
156 Agromyza oryzae 0.157 345 Mussidia nigrivenella 0.005 534 Rhynchophorus palmarum 0
157 Mamestra brassicae 0.156 346 Antestiopsis intricata 0.0047 535 Rhinostomus barbirostris 0
158 Ahasverus advena 0.1555 347 Orseolia oryzivora 0.0047 536 Rupela albinella 0
159 Ceroplastes rusci 0.1533 348 Acraea acerata 0.0046 537 Scaphoideus titanus 0
160 Cossus cossus 0.1518 349 Diparopsis watersi 0.0045 538 Saccharosydne saccharivora 0
161 Clavigralla scutellaris 0.1499 350 Apate monachus 0.0043 539 Schistocerca pallens 0
162 Monochamus alternatus 0.1492 351 Bathycoelia thalassina 0.0042 540 Silba chalybea 0
163 Prostephanus truncatus 0.1476 352 Bixadus sierricola 0.0038 541 Sipha flava 0
164 Acanthiophilus helianthi 0.1459 353 Sesamia nonagrioides 0.0037 542 Sitona humeralis 0
165 Chaetocnema confinis 0.1458 354 Pimelephila ghesquierei 0.0034 543 Sitona lepidus 0
166 Parlatoria oleae 0.1453 355 Helopeltis bergrothi 0.0033 544 Spilonota ocellana 0
167 Cryptoblabes gnidiella 0.1442 356 Planococcoides njalensis 0.0032 545 Spodoptera dolichos 0
168 Liriomyza bryoniae 0.1406 357 Archips podana 0.0015 546 Spodoptera latifascia 0
169 Autographa nigrisigna 0.1369 358 Metopolophium festucae 0.0006 547 Ceresa alta 0
170 Delia antiqua 0.1347 359 Acalymma vittatum 0 548 Stenoma catenifer 0
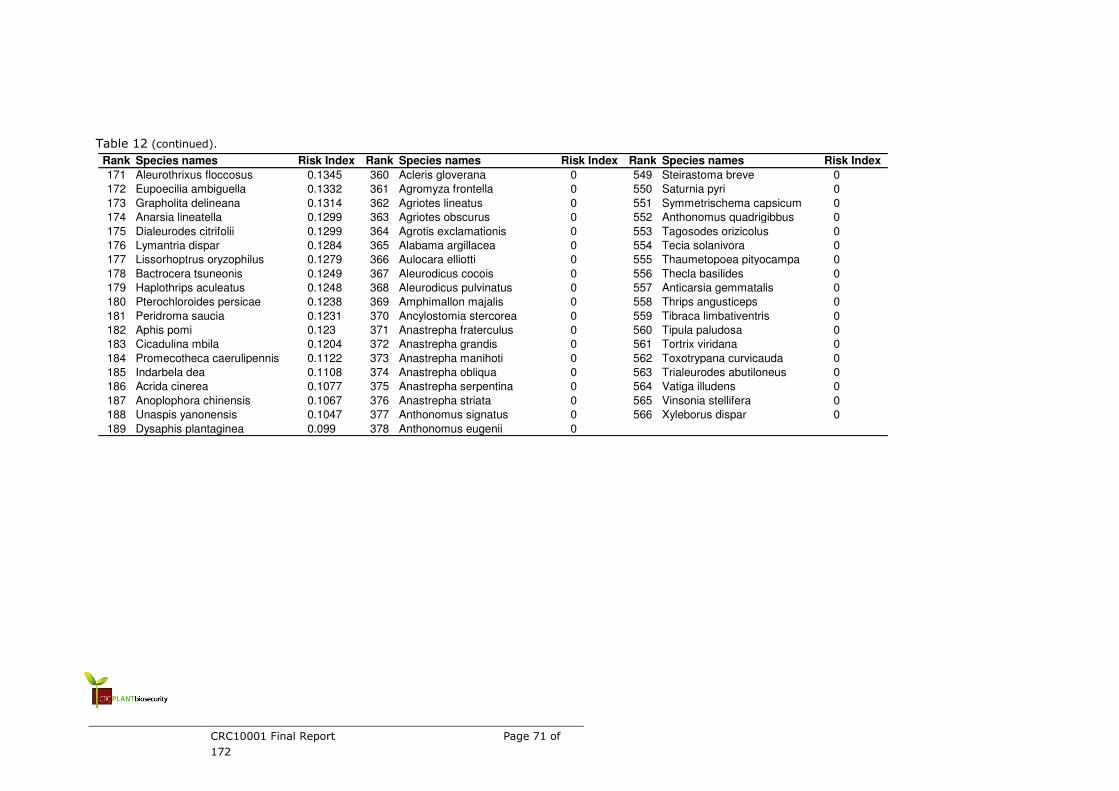
CRC10001 Final Report Page 71 of
172
Table 12 (continued).
Rank Species names Risk Index Rank Species names Risk Index Rank Species names Risk Index
171 Aleurothrixus floccosus 0.1345 360 Acleris gloverana 0 549 Steirastoma breve 0
172 Eupoecilia ambiguella 0.1332 361 Agromyza frontella 0 550 Saturnia pyri 0
173 Grapholita delineana 0.1314 362 Agriotes lineatus 0 551 Symmetrischema capsicum 0
174 Anarsia lineatella 0.1299 363 Agriotes obscurus 0 552 Anthonomus quadrigibbus 0
175 Dialeurodes citrifolii 0.1299 364 Agrotis exclamationis 0 553 Tagosodes orizicolus 0
176 Lymantria dispar 0.1284 365 Alabama argillacea 0 554 Tecia solanivora 0
177 Lissorhoptrus oryzophilus 0.1279 366 Aulocara elliotti 0 555 Thaumetopoea pityocampa 0
178 Bactrocera tsuneonis 0.1249 367 Aleurodicus cocois 0 556 Thecla basilides 0
179 Haplothrips aculeatus 0.1248 368 Aleurodicus pulvinatus 0 557 Anticarsia gemmatalis 0
180 Pterochloroides persicae 0.1238 369 Amphimallon majalis 0 558 Thrips angusticeps 0
181 Peridroma saucia 0.1231 370 Ancylostomia stercorea 0 559 Tibraca limbativentris 0
182 Aphis pomi 0.123 371 Anastrepha fraterculus 0 560 Tipula paludosa 0
183 Cicadulina mbila 0.1204 372 Anastrepha grandis 0 561 Tortrix viridana 0
184 Promecotheca caerulipennis 0.1122 373 Anastrepha manihoti 0 562 Toxotrypana curvicauda 0
185 Indarbela dea 0.1108 374 Anastrepha obliqua 0 563 Trialeurodes abutiloneus 0
186 Acrida cinerea 0.1077 375 Anastrepha serpentina 0 564 Vatiga illudens 0
187 Anoplophora chinensis 0.1067 376 Anastrepha striata 0 565 Vinsonia stellifera 0
188 Unaspis yanonensis 0.1047 377 Anthonomus signatus 0 566 Xyleborus dispar 0
189 Dysaphis plantaginea 0.099 378 Anthonomus eugenii 0
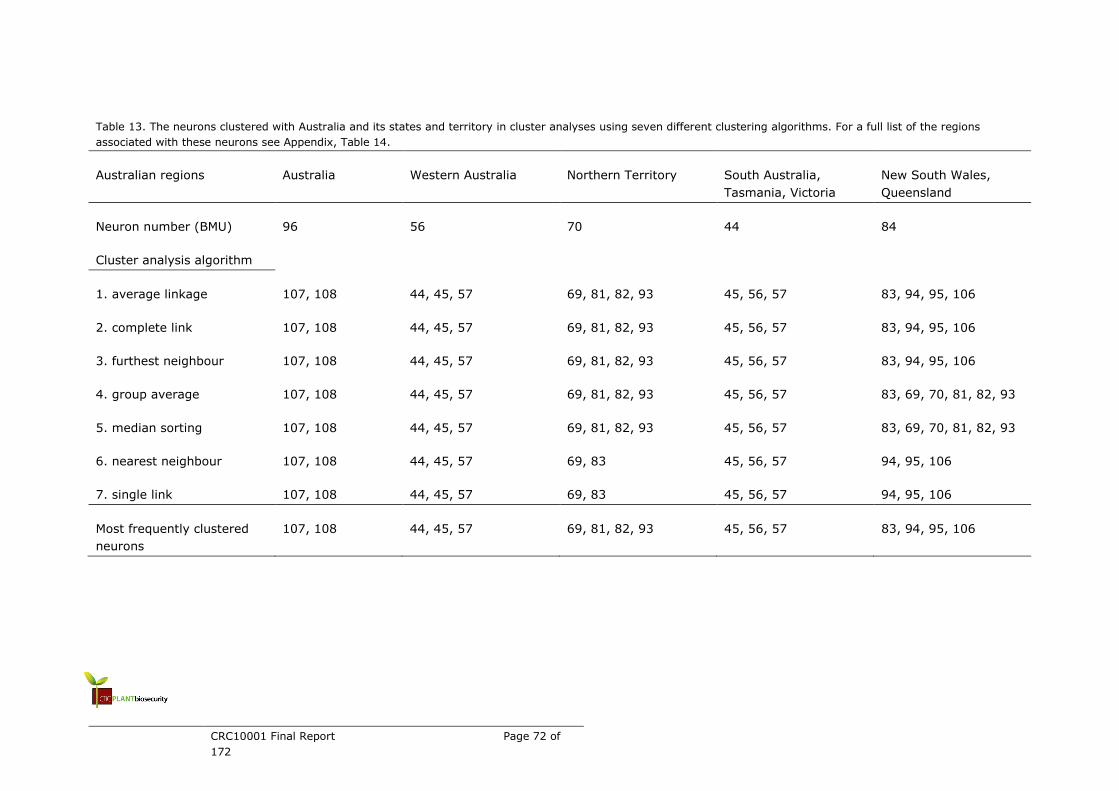
CRC10001 Final Report Page 72 of
172
Table 13. The neurons clustered with Australia and its states and territory in cluster analyses using seven different clustering algorithms. For a full list of the regions
associated with these neurons see Appendix, Table 14.
Australian regions Australia Western Australia Northern Territory South Australia,
Tasmania, Victoria
New South Wales,
Queensland
Neuron number (BMU) 96 56 70 44 84
Cluster analysis algorithm
1. average linkage 107, 108 44, 45, 57 69, 81, 82, 93 45, 56, 57 83, 94, 95, 106
2. complete link 107, 108 44, 45, 57 69, 81, 82, 93 45, 56, 57 83, 94, 95, 106
3. furthest neighbour 107, 108 44, 45, 57 69, 81, 82, 93 45, 56, 57 83, 94, 95, 106
4. group average 107, 108 44, 45, 57 69, 81, 82, 93 45, 56, 57 83, 69, 70, 81, 82, 93
5. median sorting 107, 108 44, 45, 57 69, 81, 82, 93 45, 56, 57 83, 69, 70, 81, 82, 93
6. nearest neighbour 107, 108 44, 45, 57 69, 83 45, 56, 57 94, 95, 106
7. single link 107, 108 44, 45, 57 69, 83 45, 56, 57 94, 95, 106
Most frequently clustered
neurons
107, 108 44, 45, 57 69, 81, 82, 93 45, 56, 57 83, 94, 95, 106

Table 14. Full list of neurons and associated regions.
Neuron # Allocated regions
1 Alabama (USA), Arkansas (USA), Georgia (USA), Illinois (USA), Louisiana (USA), Maryland (USA), Missouri (USA), Mississippi (USA), North Carolina (USA), South Carolina (USA), Tennessee (USA), Texas (USA), Virginia (USA)
2 Connecticut (USA), Massachusetts (USA), Michigan (USA), New Jersey (USA), New York (USA), Ohio (USA), Pennsylvania (USA)
3 Canada, Ontario (Canada), California (USA)
4
5 Austria, Belgium, Bulgaria, Switzerland, Czechoslovakia (former -), Germany, Denmark, Finland, United Kingdom, Hungary, Netherlands, Poland, Romania, Sweden
6 Russian Federation
7 Spain, France, Greece, Italy, Portugal, Turkey
8 Algeria, Egypt, Israel, Iran, Morocco
9 Chile, USA
10 Argentina, Brazil, Sao Paulo (Brazil), Colombia, Mexico, Peru, Florida (USA), Hawaii (USA)
11 Cuba, Jamaica, Puerto Rico, Venezuela
12 Antigua and Barbuda, Barbados, Dominica, Dominican Republic, Grenada, Guadeloupe, Guyana, Saint Kitts and Nevis, Saint Lucia, Martinique, Montserrat, Trinidad and Tobago, Saint Vincent and the Grenadines
13 Arizona (USA), Delaware (USA), Iowa (USA), Indiana (USA), Kansas (USA), Kentucky (USA), Oklahoma (USA), West Virginia (USA)
14 Maine (USA), Wisconsin (USA)
15 British Columbia (Canada), Nova Scotia (Canada), Quebec (Canada), Oregon (USA), Washington (USA)
16
17 Norway, Ukraine, Former Yugoslavia
18 Yugoslavia
19
20 Cyprus, Canary Islands (Spain), Iraq, Lebanon, Libya, Malta, Syria, Tunisia
21
22 Bermuda, Bolivia, Rio Grande do Sul (Brazil), Ecuador, Uruguay
23

CRC10001 Final Report Page 74 of
172
Table 14 (continued).
Neuron # Allocated regions
24 Bahamas, Costa Rica, French Guiana, Guatemala, Honduras, Haiti, Nicaragua, Panama, Suriname
25 Colorado (USA), Minnesota (USA), Nebraska (USA), New Hampshire (USA), New Mexico (USA), Rhode Island (USA), Utah (USA)
26 Manitoba (Canada), New Brunswick (Canada), Idaho (USA)
27
28 Latvia
29 Czech Republic, Ireland, Lithuania, Russua (Europe)
30 Azerbaijan, Georgia (Republic)
31 Corsica (France)
32 Sicily (Italy), Jordan, Madeira (Portugal)
33
34 Parana (Brazil), Santa Catarina (Brazil)
35 Bahia (Brazil), Minas Gerais (Brazil), Pará (Brazil), Rio de Janeiro (Brazil), Belize, Paraguay, El Salvador, United States Virgin Islands
36
37 Alberta (Canada), Saskatchewan (Canada), Montana (USA), North Dakota (USA), Nevada (USA), South Dakota (USA), Vermont (USA), Wyoming (USA)
38 Prince Edward Island (Canada)
39
40 Belarus, Estonia, England and Wales (United Kingdom), Luxembourg, Siberia (Russia), Slovenia
41 Albania, Armenia, Croatia, Kazakhstan, Moldova, Central Russia (Russia), Russian Far East (Russia), Slovakia
42 Tajikistan, Turkmenistan, Uzbekistan
43 Sardinia (Italy)
44 South Australia (Australia), Tasmania (Australia), New Zealand, Azores (Portugal)
45
46 Burundi, Cape Verde
47
48 Côte d’Ivoire
49 Newfoundland (Canada), Alaska (USA)
50 Channel Islands (United Kingdom), Scotland (United Kingdom)

CRC10001 Final Report Page 75 of
172
Table 14 (continued).
Neuron # Allocated regions
51 Bosnia and Herzegovina
52 Macedonia, Mongolia, Western Siberia (Russia)
53 Kyrgyzstan, Southern Russia
54
55 Afghanistan, Balearic Islands (Spain)
56 Western Australia (Australia)
57 Saudi Arabia, Saint Helena
58 Burkina Faso, French Guiana, Niger, Réunion, Seychelles, Yemen
59 Benin, Congo, Guinea, Mali, Rwanda, Somalia, Togo
60 Angola, Cameroon, Ethiopia, Ghana, Kenya, Malawi, Mozambique, Nigeria, Sudan, Senegal, Tanzania, Uganda, Zambia, Congo Democratic Republic, Zimbabwe
61 Northwest Territories (Canada), Yukon Territory (Canada), Faroe Islands, Iceland
62 Andorra, Ningxia (China), Qinghai (China), Monaco, San Marino, Former USSR
63 Gansu (China), Gibraltar, Liechtenstein, Eastern Siberia (Russia), Northern Russia
64 Crete (Greece)
65 Xinjiang (China)
66 Heilongjiang (China), Jilin (China), Liaoning (China), Nei Menggu (China), Shanxi (China), Shaanxi (China), Xizhang (China)
67 Jammu and Kashmir (India), Hokkaido (Japan)
68
69
70 Northern Territory (Australia)
71
72 Madagascar, Mauritius, South Africa
73 Northern Island (United Kingdom), Greenland, Arunachal Pradesh (India), Chandigarh (India), Damman (India), Dadra and Nagar Haveli (India), Diu (India), Goa (India), Lakshadweep (India), Mizoram (India), Nagaland (India), Russia (Asia), Serbia (Yugoslavia)
74 Gaza, Tokelau
75 Bahrain, Djibouti, Western Sahara, Kuwait, Qatar

CRC10001 Final Report Page 76 of
172
Table 14 (continued).
Neuron # Allocated regions
76 United Arab Emirates, Botswana, Central African Republic, Gabon, Equatorial
Guinea, Guinea-Bissau, Liberia, Lesotho, Mauritania, Namibia, Swaziland,
Chad
77 Eritrea
78 Meghalaya (India), Manipur (India)
79 Anhui (China), Hebei (China), Henan (China), Shandong (China)
80 Himachal Pradesh (India), Haryana (India), Korea - DPR
81 Delhi (India), Gujarat (India), Indian Punjab (India), Rajasthan (India)
82 Andhra Pradesh (India), Bihar (India), Maharashtra (India), Madya Pradesh
(India), Orissa (India), Uttar Pradesh (India)
83
84 New South Wales (Australia), Queensland (Australia), Fiji, New Caledonia,
Solomon Islands
85 Lord Howe Island (Australia), Aruba, Bonaire, Acre (Brazil), Amapa (Brazil),
Fernando de Noronha (Brazil), Roraima (Brazil), Beijing (China), Shanghai
(China), Falkland Islands, Carriacou (Grenada), Isle of Man, Line Islands
(Kiribati), Kanton and Enderbury (Kiribati), St. Martin, Kermadec Islands
(New Zealand), Marquesas (French Polynesia), Bismarck Archipeligo (Papua
New Guinea), Bougainville (Papua New Guinea), Saint Pierre and Miquelon,
Severo-Osetinskaya Respublika (Russia), Aldabra (Seychelles), Saba, Turks
and Caicos Islands, East Timor, Krymskaya Oblast (Ukraine), Former USSR-
in-Europe, Former USSR-in-Asia, US Minor Outlying Islands, Midway Islands
(US Minor Outlying Islands), Wake Islands (US Minor Outlying Islands),
Socotra (Yemen), Mayotte
86 Macau (China), Nauru, Ascension (Saint Helena)
87 Pitcairn Islands
88 Tripura (India)
89
90 Kalimantan (Indonesia), Moluccas (Indonesia), Andaman and Nicobar Islands
(India)
91 Guizhou (China), Jiangsu (China)
92 Bhutan, Hubei (China), Sikkim (India), Shikoku (Japan)
93 Northern Mariana Islands
94 Assam (India), Kerala (India)
95 Karnataka (India), Tamil Nadu (India), West Bengal (India)
96 Australia, Papua New Guinea
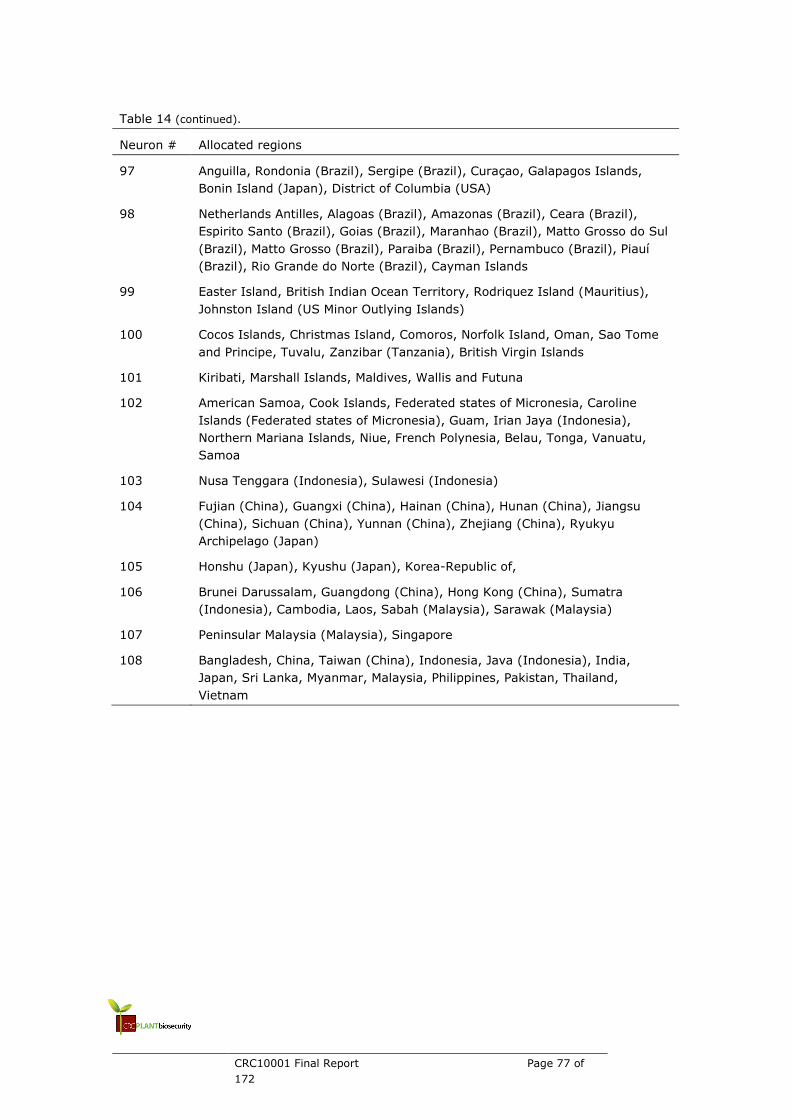
CRC10001 Final Report Page 77 of
172
Table 14 (continued).
Neuron # Allocated regions
97 Anguilla, Rondonia (Brazil), Sergipe (Brazil), Curaçao, Galapagos Islands,
Bonin Island (Japan), District of Columbia (USA)
98 Netherlands Antilles, Alagoas (Brazil), Amazonas (Brazil), Ceara (Brazil),
Espirito Santo (Brazil), Goias (Brazil), Maranhao (Brazil), Matto Grosso do Sul
(Brazil), Matto Grosso (Brazil), Paraiba (Brazil), Pernambuco (Brazil), Piauí
(Brazil), Rio Grande do Norte (Brazil), Cayman Islands
99 Easter Island, British Indian Ocean Territory, Rodriquez Island (Mauritius),
Johnston Island (US Minor Outlying Islands)
100 Cocos Islands, Christmas Island, Comoros, Norfolk Island, Oman, Sao Tome
and Principe, Tuvalu, Zanzibar (Tanzania), British Virgin Islands
101 Kiribati, Marshall Islands, Maldives, Wallis and Futuna
102 American Samoa, Cook Islands, Federated states of Micronesia, Caroline
Islands (Federated states of Micronesia), Guam, Irian Jaya (Indonesia),
Northern Mariana Islands, Niue, French Polynesia, Belau, Tonga, Vanuatu,
Samoa
103 Nusa Tenggara (Indonesia), Sulawesi (Indonesia)
104 Fujian (China), Guangxi (China), Hainan (China), Hunan (China), Jiangsu
(China), Sichuan (China), Yunnan (China), Zhejiang (China), Ryukyu
Archipelago (Japan)
105 Honshu (Japan), Kyushu (Japan), Korea-Republic of,
106 Brunei Darussalam, Guangdong (China), Hong Kong (China), Sumatra
(Indonesia), Cambodia, Laos, Sabah (Malaysia), Sarawak (Malaysia)
107 Peninsular Malaysia (Malaysia), Singapore
108 Bangladesh, China, Taiwan (China), Indonesia, Java (Indonesia), India,
Japan, Sri Lanka, Myanmar, Malaysia, Philippines, Pakistan, Thailand,
Vietnam
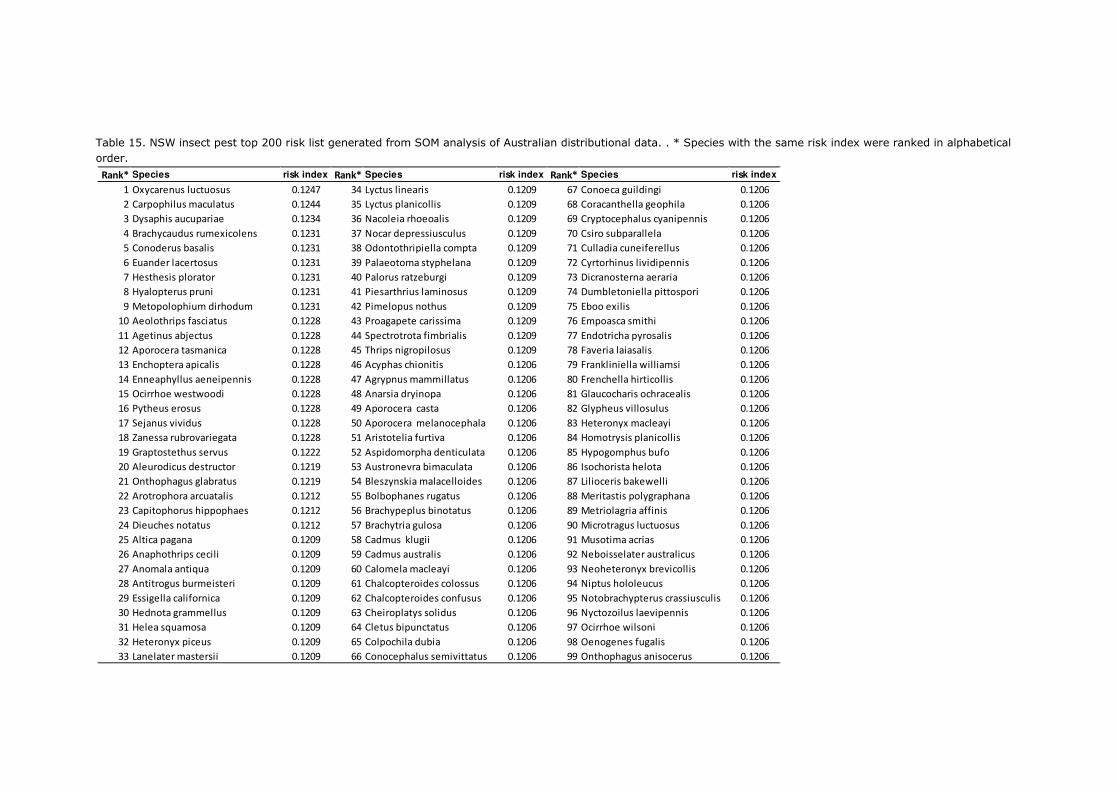
Table 15. NSW insect pest top 200 risk list generated from SOM analysis of Australian distributional data. . * Species with the same risk index were ranked in alphabetical
order.
Rank* Species risk index Rank* Species risk index Rank* Species risk index
1 Oxycarenus luctuosus 0.1247 34 Lyctus linearis 0.1209 67 Conoeca guildingi 0.1206
2 Carpophilus maculatus 0.1244 35 Lyctus planicollis 0.1209 68 Coracanthella geophila 0.1206
3 Dysaphis aucupariae 0.1234 36 Nacoleia rhoeoalis 0.1209 69 Cryptocephalus cyanipennis 0.1206
4 Brachycaudus rumexicolens 0.1231 37 Nocar depressiusculus 0.1209 70 Csiro subparallela 0.1206
5 Conoderus basalis 0.1231 38 Odontothripiella compta 0.1209 71 Culladia cuneiferellus 0.1206
6 Euander lacertosus 0.1231 39 Palaeotoma styphelana 0.1209 72 Cyrtorhinus lividipennis 0.1206
7 Hesthesis plorator 0.1231 40 Palorus ratzeburgi 0.1209 73 Dicranosterna aeraria 0.1206
8 Hyalopterus pruni 0.1231 41 Piesarthrius laminosus 0.1209 74 Dumbletoniella pittospori 0.1206
9 Metopolophium dirhodum 0.1231 42 Pimelopus nothus 0.1209 75 Eboo exilis 0.1206
10 Aeolothrips fasciatus 0.1228 43 Proagapete carissima 0.1209 76 Empoasca smithi 0.1206
11 Agetinus abjectus 0.1228 44 Spectrotrota fimbrialis 0.1209 77 Endotricha pyrosalis 0.1206
12 Aporocera tasmanica 0.1228 45 Thrips nigropilosus 0.1209 78 Faveria laiasalis 0.1206
13 Enchoptera apicalis 0.1228 46 Acyphas chionitis 0.1206 79 Frankliniella williamsi 0.1206
14 Enneaphyllus aeneipennis 0.1228 47 Agrypnus mammillatus 0.1206 80 Frenchella hirticollis 0.1206
15 Ocirrhoe westwoodi 0.1228 48 Anarsia dryinopa 0.1206 81 Glaucocharis ochracealis 0.1206
16 Pytheus erosus 0.1228 49 Aporocera casta 0.1206 82 Glypheus villosulus 0.1206
17 Sejanus vividus 0.1228 50 Aporocera melanocephala 0.1206 83 Heteronyx macleayi 0.1206
18 Zanessa rubrovariegata 0.1228 51 Aristotelia furtiva 0.1206 84 Homotrysis planicollis 0.1206
19 Graptostethus servus 0.1222 52 Aspidomorpha denticulata 0.1206 85 Hypogomphus bufo 0.1206
20 Aleurodicus destructor 0.1219 53 Austronevra bimaculata 0.1206 86 Isochorista helota 0.1206
21 Onthophagus glabratus 0.1219 54 Bleszynskia malacelloides 0.1206 87 Lilioceris bakewelli 0.1206
22 Arotrophora arcuatalis 0.1212 55 Bolbophanes rugatus 0.1206 88 Meritastis polygraphana 0.1206
23 Capitophorus hippophaes 0.1212 56 Brachypeplus binotatus 0.1206 89 Metriolagria affinis 0.1206
24 Dieuches notatus 0.1212 57 Brachytria gulosa 0.1206 90 Microtragus luctuosus 0.1206
25 Altica pagana 0.1209 58 Cadmus klugii 0.1206 91 Musotima acrias 0.1206
26 Anaphothrips cecili 0.1209 59 Cadmus australis 0.1206 92 Neboisselater australicus 0.1206
27 Anomala antiqua 0.1209 60 Calomela macleayi 0.1206 93 Neoheteronyx brevicollis 0.1206
28 Antitrogus burmeisteri 0.1209 61 Chalcopteroides colossus 0.1206 94 Niptus hololeucus 0.1206
29 Essigella californica 0.1209 62 Chalcopteroides confusus 0.1206 95 Notobrachypterus crassiusculis 0.1206
30 Hednota grammellus 0.1209 63 Cheiroplatys solidus 0.1206 96 Nyctozoilus laevipennis 0.1206
31 Helea squamosa 0.1209 64 Cletus bipunctatus 0.1206 97 Ocirrhoe wilsoni 0.1206
32 Heteronyx piceus 0.1209 65 Colpochila dubia 0.1206 98 Oenogenes fugalis 0.1206
33 Lanelater mastersii 0.1209 66 Conocephalus semivittatus 0.1206 99 Onthophagus anisocerus 0.1206

CRC10001 Final Report Page 79 of
172
Table 15 (continued).
Rank* Species risk index Rank* Species risk index Rank* Species risk index
100 Onthophagus ferox 0.1206 133 Acroelytrum muricatum 0.1201 166 Aleurodicus dispersus 0.1198
101 Onthophagus squalidus 0.1206 134 Agrotis interjectionis 0.1201 167 Amyotea erythromelas 0.1198
102 Palorus depressus 0.1206 135 Amblypelta lutescens 0.1201 168 Andrallus spinidens 0.1198
103 Paracardiophorus divisus 0.1206 136 Bactrocera decurtans 0.1201 169 Anoplognathus brevicollis 0.1198
104 Paropsis morio 0.1206 137 Bactrocera frauenfeldi 0.1201 170 Antineda princeps 0.1198
105 Paropsis pictipennis 0.1206 138 Bactrocera mayi 0.1201 171 Assara quadriguttella 0.1198
106 Paropsis sexpustulata 0.1206 139 Campylomma austrinum 0.1201 172 Ataenius walkeri 0.1198
107 Paropsisterna semivittata 0.1206 140 Colpochila deceptor 0.1201 173 Australitermes perlevis 0.1198
108 Phalota obscura 0.1206 141 Cryptoblabes adoceta 0.1201 174 Ayyaria chaetophora 0.1198
109 Piesarthrius brevicornis 0.1206 142 Dendrothripoides innoxius 0.1201 175 Bactrocera diospyri 0.1198
110 Polysoma eumetalla 0.1206 143 Hemipharis insularis 0.1201 176 Bactrocera melanothoracica 0.1198
111 Priasus bilunulatus 0.1206 144 Lepidiota delicatula 0.1201 177 Bactrocera signatifera 0.1198
112 Proagapete auricoma 0.1206 145 Lepidiota perkinsi 0.1201 178 Bemisia afer 0.1198
113 Promethis opaca 0.1206 146 Lepidiota rothei 0.1201 179 Calguia deltophora 0.1198
114 Pseudanaphothrips uniformis 0.1206 147 Lipaleyrodes euphorbiae 0.1201 180 Callistomyia horni 0.1198
115 Rhyzobius discolor 0.1206 148 Microcerotermes nervosus 0.1201 181 Calloodes grayianus 0.1198
116 Scrobipalpa pyrrhanthes 0.1206 149 Nasutitermes longipennis 0.1201 182 Callosobruchus phaseoli 0.1198
117 Serangium mysticum 0.1206 150 Oncocoris coelebs 0.1201 183 Cephaloplatus darwini 0.1198
118 Sinomegoura citricola 0.1206 151 Oncocoris favillaceus 0.1201 184 Chilocorus flavidus 0.1198
119 Stylogeocoris capricornutus 0.1206 152 Onthophagus symbioticus 0.1201 185 Cicadella spectra 0.1198
120 Tarachota mersana 0.1206 153 Platyomopsis pedicornis 0.1201 186 Clavigralla horrens 0.1198
121 Tessaromma sericans 0.1206 154 Rhyparida didyma 0.1201 187 Clavigralloides spinosus 0.1198
122 Thalycrodes mixtum 0.1206 155 Scirpophaga innotata 0.1201 188 Cnaphalocrocis poeyalis 0.1198
123 Toxicum insigne 0.1206 156 Stenocatantops angustifrons 0.1201 189 Cofana perkinsi 0.1198
124 Tracholena sulfurosa 0.1206 157 Stenocatantops vitripennis 0.1201 190 Colasposoma sellatum 0.1198
125 Trachymela pustulosa 0.1206 158 Teleogryllus oceanicus 0.1201 191 Collessomyia setiger 0.1198
126 Udeocoris nigroaeneus 0.1206 159 Thrips unispinus 0.1201 192 Colpochila griffithi 0.1198
127 Yarranum crenicolle 0.1206 160 Tirathaba rufivena 0.1201 193 Colpochila iota 0.1198
128 Zaletta nereias 0.1206 161 Adisura marginalis 0.1198 194 Colpochila paula 0.1198
129 Bactrocera tenuifascia 0.1204 162 Adoxophyes templana 0.1198 195 Colpochila scutalis 0.1198
130 Dacus axanus 0.1204 163 Adrama biseta 0.1198 196 Colpochila secreta 0.1198
131 Pectinophora gossypiella 0.1204 164 Agrotera amathealis 0.1198 197 Colpochila setosa 0.1198
132 Thrips palmi 0.1204 165 Aleurocanthus spiniferus 0.1198 198 Conoguinula coeruleopennis 0.1198
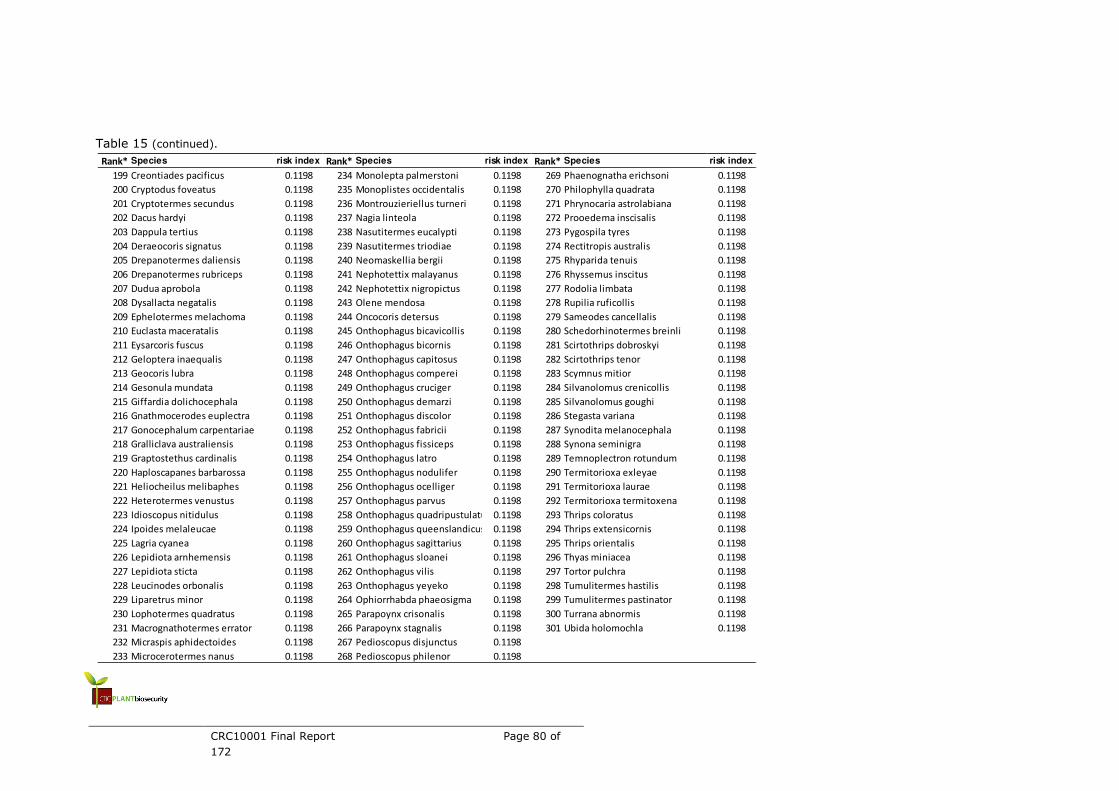
CRC10001 Final Report Page 80 of
172
Table 15 (continued).
Rank* Species risk index Rank* Species risk index Rank* Species risk index
199 Creontiades pacificus 0.1198 234 Monolepta palmerstoni 0.1198 269 Phaenognatha erichsoni 0.1198
200 Cryptodus foveatus 0.1198 235 Monoplistes occidentalis 0.1198 270 Philophylla quadrata 0.1198
201 Cryptotermes secundus 0.1198 236 Montrouzieriellus turneri 0.1198 271 Phrynocaria astrolabiana 0.1198
202 Dacus hardyi 0.1198 237 Nagia linteola 0.1198 272 Prooedema inscisalis 0.1198
203 Dappula tertius 0.1198 238 Nasutitermes eucalypti 0.1198 273 Pygospila tyres 0.1198
204 Deraeocoris signatus 0.1198 239 Nasutitermes triodiae 0.1198 274 Rectitropis australis 0.1198
205 Drepanotermes daliensis 0.1198 240 Neomaskellia bergii 0.1198 275 Rhyparida tenuis 0.1198
206 Drepanotermes rubriceps 0.1198 241 Nephotettix malayanus 0.1198 276 Rhyssemus inscitus 0.1198
207 Dudua aprobola 0.1198 242 Nephotettix nigropictus 0.1198 277 Rodolia limbata 0.1198
208 Dysallacta negatalis 0.1198 243 Olene mendosa 0.1198 278 Rupilia ruficollis 0.1198
209 Ephelotermes melachoma 0.1198 244 Oncocoris detersus 0.1198 279 Sameodes cancellalis 0.1198
210 Euclasta maceratalis 0.1198 245 Onthophagus bicavicollis 0.1198 280 Schedorhinotermes breinli 0.1198
211 Eysarcoris fuscus 0.1198 246 Onthophagus bicornis 0.1198 281 Scirtothrips dobroskyi 0.1198
212 Geloptera inaequalis 0.1198 247 Onthophagus capitosus 0.1198 282 Scirtothrips tenor 0.1198
213 Geocoris lubra 0.1198 248 Onthophagus comperei 0.1198 283 Scymnus mitior 0.1198
214 Gesonula mundata 0.1198 249 Onthophagus cruciger 0.1198 284 Silvanolomus crenicollis 0.1198
215 Giffardia dolichocephala 0.1198 250 Onthophagus demarzi 0.1198 285 Silvanolomus goughi 0.1198
216 Gnathmocerodes euplectra 0.1198 251 Onthophagus discolor 0.1198 286 Stegasta variana 0.1198
217 Gonocephalum carpentariae 0.1198 252 Onthophagus fabricii 0.1198 287 Synodita melanocephala 0.1198
218 Gralliclava australiensis 0.1198 253 Onthophagus fissiceps 0.1198 288 Synona seminigra 0.1198
219 Graptostethus cardinalis 0.1198 254 Onthophagus latro 0.1198 289 Temnoplectron rotundum 0.1198
220 Haploscapanes barbarossa 0.1198 255 Onthophagus nodulifer 0.1198 290 Termitorioxa exleyae 0.1198
221 Heliocheilus melibaphes 0.1198 256 Onthophagus ocelliger 0.1198 291 Termitorioxa laurae 0.1198
222 Heterotermes venustus 0.1198 257 Onthophagus parvus 0.1198 292 Termitorioxa termitoxena 0.1198
223 Idioscopus nitidulus 0.1198 258 Onthophagus quadripustulatus 0.1198 293 Thrips coloratus 0.1198
224 Ipoides melaleucae 0.1198 259 Onthophagus queenslandicus 0.1198 294 Thrips extensicornis 0.1198
225 Lagria cyanea 0.1198 260 Onthophagus sagittarius 0.1198 295 Thrips orientalis 0.1198
226 Lepidiota arnhemensis 0.1198 261 Onthophagus sloanei 0.1198 296 Thyas miniacea 0.1198
227 Lepidiota sticta 0.1198 262 Onthophagus vilis 0.1198 297 Tortor pulchra 0.1198
228 Leucinodes orbonalis 0.1198 263 Onthophagus yeyeko 0.1198 298 Tumulitermes hastilis 0.1198
229 Liparetrus minor 0.1198 264 Ophiorrhabda phaeosigma 0.1198 299 Tumulitermes pastinator 0.1198
230 Lophotermes quadratus 0.1198 265 Parapoynx crisonalis 0.1198 300 Turrana abnormis 0.1198
231 Macrognathotermes errator 0.1198 266 Parapoynx stagnalis 0.1198 301 Ubida holomochla 0.1198
232 Micraspis aphidectoides 0.1198 267 Pedioscopus disjunctus 0.1198
233 Microcerotermes nanus 0.1198 268 Pedioscopus philenor 0.1198

CRC10001 Final Report Page 81 of
172
Table 16. VIC insect pest top 200 risk list generated from SOM analysis of Australian distributional data. . * Species with the same risk index were ranked in alphabetical
order.
Rank* Species risk index Rank* Species risk index Rank* Species risk index
1 Stethorus histrio 0.5659 34 Arotrophora arcuatalis 0.5517 67 Chasmina pulchra 0.4941
2 Stethorus vagans 0.5659 35 Euoniticellus fulvus 0.5516 68 Mataeomera dubia 0.4941
3 Carpophilus dimidiatus 0.5659 36 Sinoxylon anale 0.5072 69 Pantydia sparsa 0.4941
4 Alphitobius laevigatus 0.5659 37 Palorus subdepressus 0.5072 70 Faveria tritalis 0.4941
5 Lipaphis erysimi 0.5659 38 Aproaerema simplexella 0.5072 71 Hygraula nitens 0.4941
6 Sitotroga cerealella 0.5659 39 Ephestia cautella 0.507 72 Meyriccia latro 0.4941
7 Agrotis ipsilon 0.5659 40 Acheta domesticus 0.507 73 Musotima ochropteralis 0.4941
8 Achroia grisella 0.5659 41 Graptostethus servus 0.5061 74 Salma pyrastis 0.4941
9 Hellula hydralis 0.5659 42 Tragocerus spencei 0.4941 75 Cryptoptila immersana 0.4941
10 Sceliodes cordalis 0.5659 43 Altica corusca 0.4941 76 Epiphyas xylodes 0.4941
11 Merophyas divulsana 0.5659 44 Altica gravida 0.4941 77 Holocola triangulana 0.4941
12 Gastrimargus musicus 0.5659 45 Cassida mera 0.4941 78 Cryptobothrus chrysophorus 0.4941
13 Xylobosca bispinosus 0.5528 46 Paropsisterna nigerrima 0.4941 79 Goniaea australasiae 0.4941
14 Chrysophtharta variicollis 0.5528 47 Phyllotreta undulata 0.4941 80 Lepidogryllus parvulus 0.4941
15 Anthrenus museorum 0.5528 48 Adalia bipunctata 0.4941 81 Andrewarthaia kellyana 0.4941
16 Idiopterus nephrelepidis 0.5528 49 Dicteniophorus ramifer 0.4941 82 Desmothrips obsoletus 0.4941
17 Cryptes baccatus 0.5528 50 Colpochila obesa 0.4941 83 Toxeutes arcuatus 0.4939
18 Parthenolecanium persicae 0.5528 51 Glycyphana stolata 0.4941 84 Zygocera canosa 0.4939
19 Athetis tenuis 0.5528 52 Heteronyx aequalis 0.4941 85 Dermestes peruvianus 0.4939
20 Cadra cautella 0.5528 53 Onthophagus binodis 0.4941 86 Trogoderma sternale 0.4939
21 Ephestia kuehniella 0.5528 54 Semanopterus solidus 0.4941 87 Carpophilus aterrimus 0.4939
22 Isotenes miserana 0.5528 55 Gnatocerus cornutus 0.4941 88 Heteronyx dimidiata 0.4939
23 Austroicetes pusilla 0.5528 56 Cinara juniperi 0.4941 89 Rhotidoides montana 0.4939
24 Macrotona australis 0.5528 57 Pulvinaria mesembryanthemi 0.4941 90 Rhotidoides punctivena 0.4939
25 Gryllotalpa australis 0.5528 58 Amorbus rubiginosus 0.4941 91 Uloprora risdonensis 0.4939
26 Caedicia otivacea 0.5528 59 Anaxilaus vesiculosus 0.4941 92 Pamerapa thoracica 0.4939
27 Symmetrischema tangolias 0.5527 60 Dictyotus inconspicuus 0.4941 93 Coridromius variegatus 0.4939
28 Persectania dyscrita 0.5527 61 Dictyotus roei 0.4941 94 Omyta centrolineata 0.4939
29 Strepsicrates macropetana 0.5527 62 Diemenia rubromarginata 0.4941 95 Armactica conchidia 0.4939
30 Austroicetes frater 0.5527 63 Paramenestheus terricolor 0.4941 96 Earias paralella 0.4939
31 Austroicetes vulgaris 0.5527 64 Poecilometis strigatus 0.4941 97 Ectopatria mundoides 0.4939
32 Limothrips angulicornis 0.5527 65 Tholosanus proximus 0.4941 98 Eudesmeola lawsoni 0.4939
33 Dieuches notatus 0.5517 66 Aedia leucomelas 0.4941 99 Neumichtis nigerrima 0.4939

CRC10001 Final Report Page 82 of
172
Table 16 (continued).
Rank* Species risk index Rank* Species risk index Rank* Species risk index
100 Altica pagana 0.493 133 Cardiaspina squamula 0.4928 166 Phyllocharis cyanicornis 0.4353
101 Pimelopus nothus 0.493 134 Cryptoneossa vulgaris 0.4928 167 Rhyparida commutabilis 0.4353
102 Nocar depressiusculus 0.493 135 Platyobria maddeni 0.4928 168 Epilachna guttatopustulata 0.4353
103 Palorus ratzeburgi 0.493 136 Scrobipalpa heliopa 0.4928 169 Rhyzobius forestieri 0.4353
104 Hednota grammellus 0.493 137 Ectopatria paurogramma 0.4928 170 Idaethina pilistriata 0.4353
105 Nacoleia rhoeoalis 0.493 138 Proteuxoa amaurodes 0.4928 171 Thalycrodes pulchrum 0.4353
106 Spectrotrota fimbrialis 0.493 139 Proteuxoa atrisquamata 0.4928 172 Phyllotocus ruficollis 0.4353
107 Palaeotoma styphelana 0.493 140 Proteuxoa oxygona 0.4928 173 Scitala aureorufa 0.4353
108 Anaphothrips cecili 0.493 141 Paralipsa gularis 0.4928 174 Sericesthis consanguinea 0.4353
109 Odontothripiella compta 0.493 142 Exarna includens 0.4928 175 Ishidaella angustata 0.4353
110 Macrones purpureipes 0.4928 143 Minyacris manum 0.4928 176 Pascoepus nymphias 0.4353
111 Phlyctaenodes pustulosus 0.4928 144 Peakesia brunnea 0.4928 177 Rosopaella evansi 0.4353
112 Arsipoda kingensis 0.4928 145 Urnisa rugosa 0.4928 178 Amorbus obscuricornis 0.4353
113 Chrysophtharta bimaculata 0.4928 146 Buangina diminuens 0.4928 179 Felisacus elegantulus 0.4353
114 Chrysophtharta nobilitata 0.4928 147 Apterothrips secticornis 0.4928 180 Lygaeoscytus cimicoides 0.4353
115 Ellopidia pedestris 0.4928 148 Callosobruchus maculatus 0.4484 181 Diaphyta fulvescens 0.4353
116 Paropsis tasmanica 0.4928 149 Carpophilus obsoletus 0.4484 182 Diaphyta pulchra 0.4353
117 Carpophilus frivolus 0.4928 150 Taylorilygus pallidulus 0.4472 183 Monteithiella humeralis 0.4353
118 Aphodius suberosus 0.4928 151 Xylobosca elongatula 0.4353 184 Notius consputus 0.4353
119 Colpochilodes peregrina 0.4928 152 Amphirhoe decora 0.4353 185 Ocirrhoe australis 0.4353
120 Heteronyx glabrata 0.4928 153 Illaena exilis 0.4353 186 Ocirrhoe lutescens 0.4353
121 Heteronyx obesus 0.4928 154 Mecynopus cothurnatus 0.4353 187 Poecilotoma grandicornis 0.4353
122 Heteronyx praecox 0.4928 155 Paratesta dorsalis 0.4353 188 Ardozyga mesochra 0.4353
123 Onthophagus taurus 0.4928 156 Phoracantha longipennis 0.4353 189 Scrobipalpa aptatella 0.4353
124 Pachygastra tasmanica 0.4928 157 Rhinophthalmus nusutus 0.4353 190 Prometopus inassueta 0.4353
125 Silvanus lateritius 0.4928 158 Syllitus microps 0.4353 191 Proteuxoa flexirena 0.4353
126 Jacksonia papillata 0.4928 159 Zoedia triangularis 0.4353 192 Metura elongatus 0.4353
127 Anacephaleus minutus 0.4928 160 Adoxia femoralis 0.4353 193 Callionyma sarcodes 0.4353
128 Ishidaella naomiae 0.4928 161 Arsipoda bifrons 0.4353 194 Corynophora lativittalis 0.4353
129 Parthenolecanium corni 0.4928 162 Chrysophtharta decolorata 0.4353 195 Crocydopora cinigerella 0.4353
130 Anoeconeossa assimilis 0.4928 163 Chrysophtharta hectica 0.4353 196 Endotricha ignealis 0.4353
131 Anoeconeossa copidiformis 0.4928 164 Monochirus multispinosus 0.4353 197 Hednota bivittella 0.4353
132 Blastopsylla moorei 0.4928 165 Paropsis charybids 0.4353 198 Hednota pleniferellus 0.4353
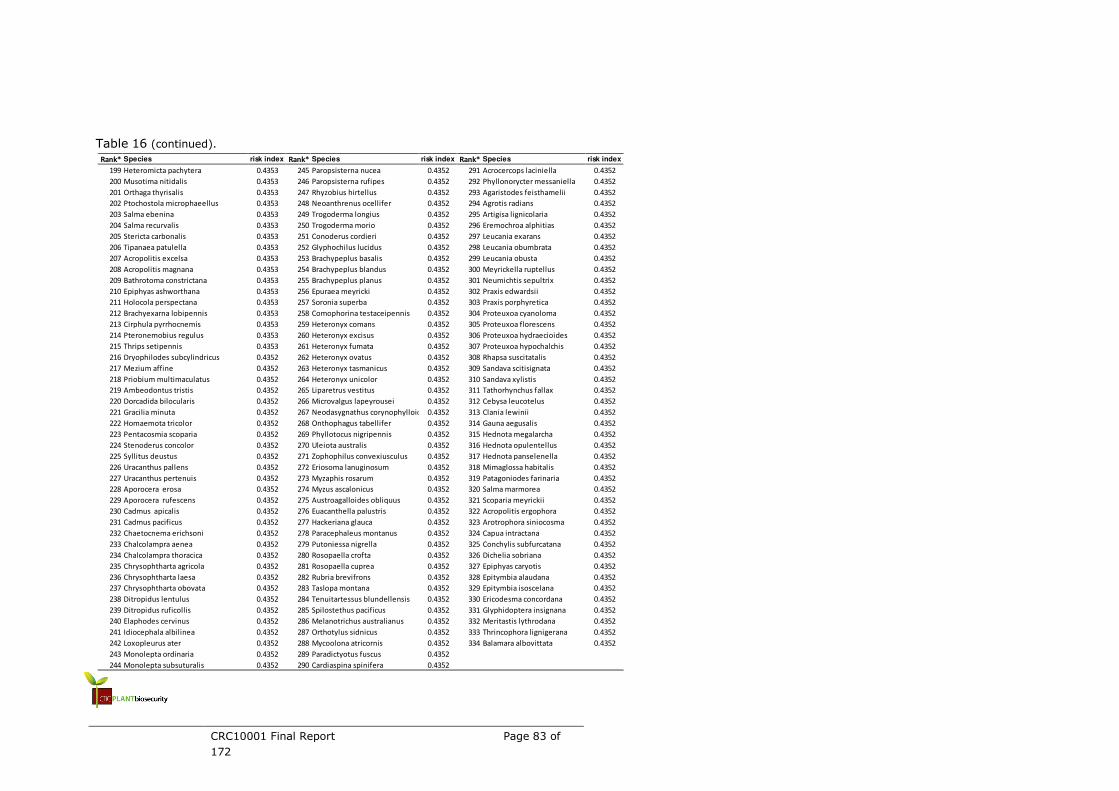
CRC10001 Final Report Page 83 of
172
Table 16 (continued).
Rank* Species risk index Rank* Species risk index Rank* Species risk index
199 Heteromicta pachytera 0.4353 245 Paropsisterna nucea 0.4352 291 Acrocercops laciniella 0.4352
200 Musotima nitidalis 0.4353 246 Paropsisterna rufipes 0.4352 292 Phyllonorycter messaniella 0.4352
201 Orthaga thyrisalis 0.4353 247 Rhyzobius hirtellus 0.4352 293 Agaristodes feisthamelii 0.4352
202 Ptochostola microphaeellus 0.4353 248 Neoanthrenus ocellifer 0.4352 294 Agrotis radians 0.4352
203 Salma ebenina 0.4353 249 Trogoderma longius 0.4352 295 Artigisa lignicolaria 0.4352
204 Salma recurvalis 0.4353 250 Trogoderma morio 0.4352 296 Eremochroa alphitias 0.4352
205 Stericta carbonalis 0.4353 251 Conoderus cordieri 0.4352 297 Leucania exarans 0.4352
206 Tipanaea patulella 0.4353 252 Glyphochilus lucidus 0.4352 298 Leucania obumbrata 0.4352
207 Acropolitis excelsa 0.4353 253 Brachypeplus basalis 0.4352 299 Leucania obusta 0.4352
208 Acropolitis magnana 0.4353 254 Brachypeplus blandus 0.4352 300 Meyrickella ruptellus 0.4352
209 Bathrotoma constrictana 0.4353 255 Brachypeplus planus 0.4352 301 Neumichtis sepultrix 0.4352
210 Epiphyas ashworthana 0.4353 256 Epuraea meyricki 0.4352 302 Praxis edwardsii 0.4352
211 Holocola perspectana 0.4353 257 Soronia superba 0.4352 303 Praxis porphyretica 0.4352
212 Brachyexarna lobipennis 0.4353 258 Comophorina testaceipennis 0.4352 304 Proteuxoa cyanoloma 0.4352
213 Cirphula pyrrhocnemis 0.4353 259 Heteronyx comans 0.4352 305 Proteuxoa florescens 0.4352
214 Pteronemobius regulus 0.4353 260 Heteronyx excisus 0.4352 306 Proteuxoa hydraecioides 0.4352
215 Thrips setipennis 0.4353 261 Heteronyx fumata 0.4352 307 Proteuxoa hypochalchis 0.4352
216 Dryophilodes subcylindricus 0.4352 262 Heteronyx ovatus 0.4352 308 Rhapsa suscitatalis 0.4352
217 Mezium affine 0.4352 263 Heteronyx tasmanicus 0.4352 309 Sandava scitisignata 0.4352
218 Priobium multimaculatus 0.4352 264 Heteronyx unicolor 0.4352 310 Sandava xylistis 0.4352
219 Ambeodontus tristis 0.4352 265 Liparetrus vestitus 0.4352 311 Tathorhynchus fallax 0.4352
220 Dorcadida bilocularis 0.4352 266 Microvalgus lapeyrousei 0.4352 312 Cebysa leucotelus 0.4352
221 Gracilia minuta 0.4352 267 Neodasygnathus corynophylloides 0.4352 313 Clania lewinii 0.4352
222 Homaemota tricolor 0.4352 268 Onthophagus tabellifer 0.4352 314 Gauna aegusalis 0.4352
223 Pentacosmia scoparia 0.4352 269 Phyllotocus nigripennis 0.4352 315 Hednota megalarcha 0.4352
224 Stenoderus concolor 0.4352 270 Uleiota australis 0.4352 316 Hednota opulentellus 0.4352
225 Syllitus deustus 0.4352 271 Zophophilus convexiusculus 0.4352 317 Hednota panselenella 0.4352
226 Uracanthus pallens 0.4352 272 Eriosoma lanuginosum 0.4352 318 Mimaglossa habitalis 0.4352
227 Uracanthus pertenuis 0.4352 273 Myzaphis rosarum 0.4352 319 Patagoniodes farinaria 0.4352
228 Aporocera erosa 0.4352 274 Myzus ascalonicus 0.4352 320 Salma marmorea 0.4352
229 Aporocera rufescens 0.4352 275 Austroagalloides obliquus 0.4352 321 Scoparia meyrickii 0.4352
230 Cadmus apicalis 0.4352 276 Euacanthella palustris 0.4352 322 Acropolitis ergophora 0.4352
231 Cadmus pacificus 0.4352 277 Hackeriana glauca 0.4352 323 Arotrophora siniocosma 0.4352
232 Chaetocnema erichsoni 0.4352 278 Paracephaleus montanus 0.4352 324 Capua intractana 0.4352
233 Chalcolampra aenea 0.4352 279 Putoniessa nigrella 0.4352 325 Conchylis subfurcatana 0.4352
234 Chalcolampra thoracica 0.4352 280 Rosopaella crofta 0.4352 326 Dichelia sobriana 0.4352
235 Chrysophtharta agricola 0.4352 281 Rosopaella cuprea 0.4352 327 Epiphyas caryotis 0.4352
236 Chrysophtharta laesa 0.4352 282 Rubria brevifrons 0.4352 328 Epitymbia alaudana 0.4352
237 Chrysophtharta obovata 0.4352 283 Taslopa montana 0.4352 329 Epitymbia isoscelana 0.4352
238 Ditropidus lentulus 0.4352 284 Tenuitartessus blundellensis 0.4352 330 Ericodesma concordana 0.4352
239 Ditropidus ruficollis 0.4352 285 Spilostethus pacificus 0.4352 331 Glyphidoptera insignana 0.4352
240 Elaphodes cervinus 0.4352 286 Melanotrichus australianus 0.4352 332 Meritastis lythrodana 0.4352
241 Idiocephala albilinea 0.4352 287 Orthotylus sidnicus 0.4352 333 Thrincophora lignigerana 0.4352
242 Loxopleurus ater 0.4352 288 Mycoolona atricornis 0.4352 334 Balamara albovittata 0.4352
243 Monolepta ordinaria 0.4352 289 Paradictyotus fuscus 0.4352
244 Monolepta subsuturalis 0.4352 290 Cardiaspina spinifera 0.4352

CRC10001 Final Report Page 84 of
172
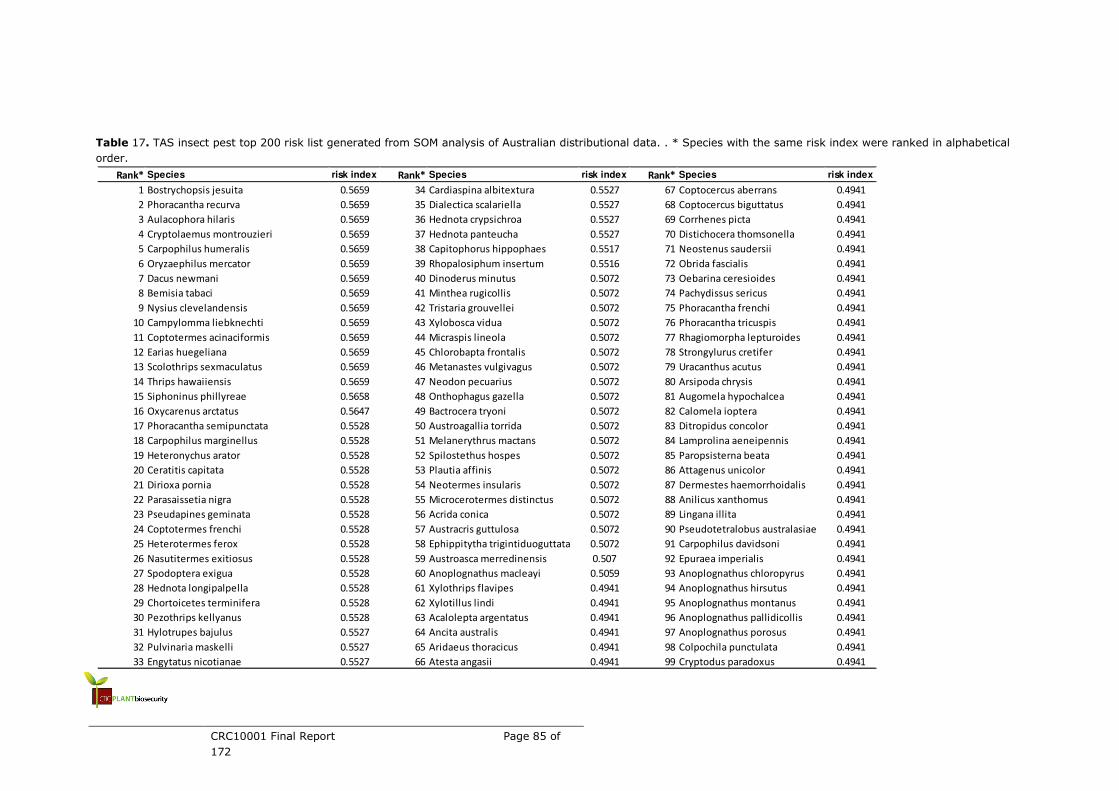
CRC10001 Final Report Page 85 of
172
Table 17. TAS insect pest top 200 risk list generated from SOM analysis of Australian distributional data. . * Species with the same risk index were ranked in alphabetical
order.
Rank* Species risk index Rank* Species risk index Rank* Species risk index
1 Bostrychopsis jesuita 0.5659 34 Cardiaspina albitextura 0.5527 67 Coptocercus aberrans 0.4941
2 Phoracantha recurva 0.5659 35 Dialectica scalariella 0.5527 68 Coptocercus biguttatus 0.4941
3 Aulacophora hilaris 0.5659 36 Hednota crypsichroa 0.5527 69 Corrhenes picta 0.4941
4 Cryptolaemus montrouzieri 0.5659 37 Hednota panteucha 0.5527 70 Distichocera thomsonella 0.4941
5 Carpophilus humeralis 0.5659 38 Capitophorus hippophaes 0.5517 71 Neostenus saudersii 0.4941
6 Oryzaephilus mercator 0.5659 39 Rhopalosiphum insertum 0.5516 72 Obrida fascialis 0.4941
7 Dacus newmani 0.5659 40 Dinoderus minutus 0.5072 73 Oebarina ceresioides 0.4941
8 Bemisia tabaci 0.5659 41 Minthea rugicollis 0.5072 74 Pachydissus sericus 0.4941
9 Nysius clevelandensis 0.5659 42 Tristaria grouvellei 0.5072 75 Phoracantha frenchi 0.4941
10 Campylomma liebknechti 0.5659 43 Xylobosca vidua 0.5072 76 Phoracantha tricuspis 0.4941
11 Coptotermes acinaciformis 0.5659 44 Micraspis lineola 0.5072 77 Rhagiomorpha lepturoides 0.4941
12 Earias huegeliana 0.5659 45 Chlorobapta frontalis 0.5072 78 Strongylurus cretifer 0.4941
13 Scolothrips sexmaculatus 0.5659 46 Metanastes vulgivagus 0.5072 79 Uracanthus acutus 0.4941
14 Thrips hawaiiensis 0.5659 47 Neodon pecuarius 0.5072 80 Arsipoda chrysis 0.4941
15 Siphoninus phillyreae 0.5658 48 Onthophagus gazella 0.5072 81 Augomela hypochalcea 0.4941
16 Oxycarenus arctatus 0.5647 49 Bactrocera tryoni 0.5072 82 Calomela ioptera 0.4941
17 Phoracantha semipunctata 0.5528 50 Austroagallia torrida 0.5072 83 Ditropidus concolor 0.4941
18 Carpophilus marginellus 0.5528 51 Melanerythrus mactans 0.5072 84 Lamprolina aeneipennis 0.4941
19 Heteronychus arator 0.5528 52 Spilostethus hospes 0.5072 85 Paropsisterna beata 0.4941
20 Ceratitis capitata 0.5528 53 Plautia affinis 0.5072 86 Attagenus unicolor 0.4941
21 Dirioxa pornia 0.5528 54 Neotermes insularis 0.5072 87 Dermestes haemorrhoidalis 0.4941
22 Parasaissetia nigra 0.5528 55 Microcerotermes distinctus 0.5072 88 Anilicus xanthomus 0.4941
23 Pseudapines geminata 0.5528 56 Acrida conica 0.5072 89 Lingana illita 0.4941
24 Coptotermes frenchi 0.5528 57 Austracris guttulosa 0.5072 90 Pseudotetralobus australasiae 0.4941
25 Heterotermes ferox 0.5528 58 Ephippitytha trigintiduoguttata 0.5072 91 Carpophilus davidsoni 0.4941
26 Nasutitermes exitiosus 0.5528 59 Austroasca merredinensis 0.507 92 Epuraea imperialis 0.4941
27 Spodoptera exigua 0.5528 60 Anoplognathus macleayi 0.5059 93 Anoplognathus chloropyrus 0.4941
28 Hednota longipalpella 0.5528 61 Xylothrips flavipes 0.4941 94 Anoplognathus hirsutus 0.4941
29 Chortoicetes terminifera 0.5528 62 Xylotillus lindi 0.4941 95 Anoplognathus montanus 0.4941
30 Pezothrips kellyanus 0.5528 63 Acalolepta argentatus 0.4941 96 Anoplognathus pallidicollis 0.4941
31 Hylotrupes bajulus 0.5527 64 Ancita australis 0.4941 97 Anoplognathus porosus 0.4941
32 Pulvinaria maskelli 0.5527 65 Aridaeus thoracicus 0.4941 98 Colpochila punctulata 0.4941
33 Engytatus nicotianae 0.5527 66 Atesta angasii 0.4941 99 Cryptodus paradoxus 0.4941
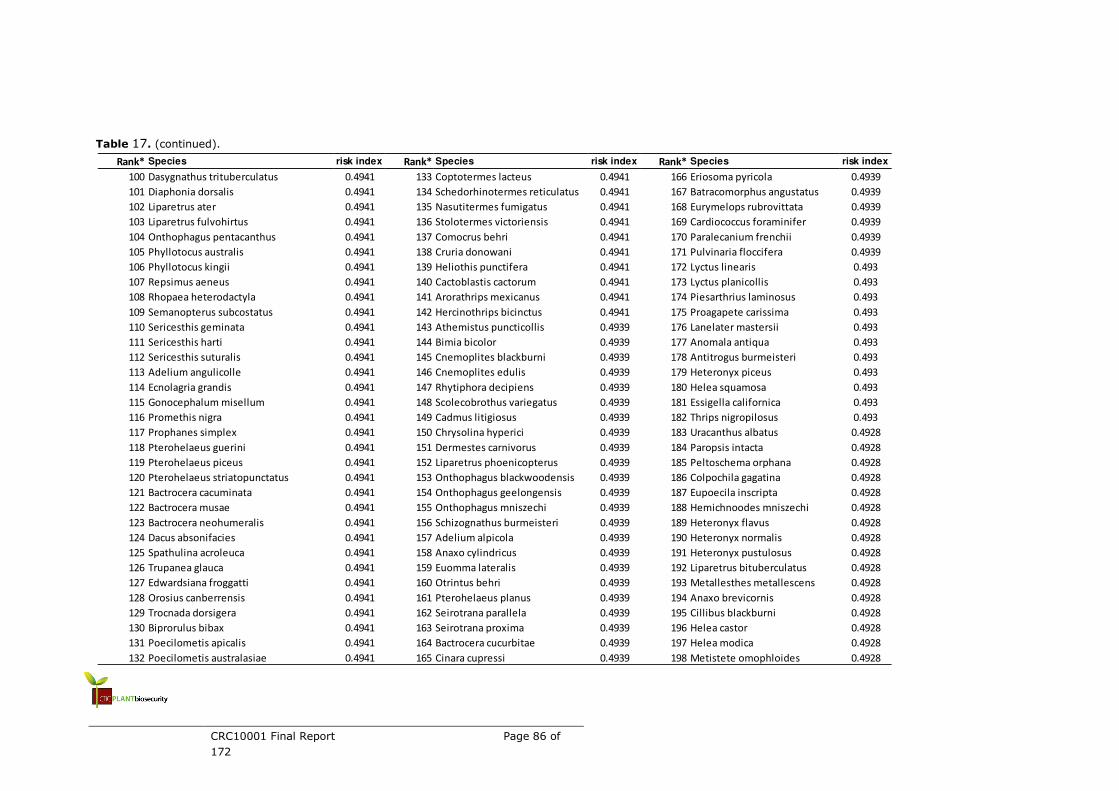
CRC10001 Final Report Page 86 of
172
Table 17. (continued).
Rank* Species risk index Rank* Species risk index Rank* Species risk index
100 Dasygnathus trituberculatus 0.4941 133 Coptotermes lacteus 0.4941 166 Eriosoma pyricola 0.4939
101 Diaphonia dorsalis 0.4941 134 Schedorhinotermes reticulatus 0.4941 167 Batracomorphus angustatus 0.4939
102 Liparetrus ater 0.4941 135 Nasutitermes fumigatus 0.4941 168 Eurymelops rubrovittata 0.4939
103 Liparetrus fulvohirtus 0.4941 136 Stolotermes victoriensis 0.4941 169 Cardiococcus foraminifer 0.4939
104 Onthophagus pentacanthus 0.4941 137 Comocrus behri 0.4941 170 Paralecanium frenchii 0.4939
105 Phyllotocus australis 0.4941 138 Cruria donowani 0.4941 171 Pulvinaria floccifera 0.4939
106 Phyllotocus kingii 0.4941 139 Heliothis punctifera 0.4941 172 Lyctus linearis 0.493
107 Repsimus aeneus 0.4941 140 Cactoblastis cactorum 0.4941 173 Lyctus planicollis 0.493
108 Rhopaea heterodactyla 0.4941 141 Arorathrips mexicanus 0.4941 174 Piesarthrius laminosus 0.493
109 Semanopterus subcostatus 0.4941 142 Hercinothrips bicinctus 0.4941 175 Proagapete carissima 0.493
110 Sericesthis geminata 0.4941 143 Athemistus puncticollis 0.4939 176 Lanelater mastersii 0.493
111 Sericesthis harti 0.4941 144 Bimia bicolor 0.4939 177 Anomala antiqua 0.493
112 Sericesthis suturalis 0.4941 145 Cnemoplites blackburni 0.4939 178 Antitrogus burmeisteri 0.493
113 Adelium angulicolle 0.4941 146 Cnemoplites edulis 0.4939 179 Heteronyx piceus 0.493
114 Ecnolagria grandis 0.4941 147 Rhytiphora decipiens 0.4939 180 Helea squamosa 0.493
115 Gonocephalum misellum 0.4941 148 Scolecobrothus variegatus 0.4939 181 Essigella californica 0.493
116 Promethis nigra 0.4941 149 Cadmus litigiosus 0.4939 182 Thrips nigropilosus 0.493
117 Prophanes simplex 0.4941 150 Chrysolina hyperici 0.4939 183 Uracanthus albatus 0.4928
118 Pterohelaeus guerini 0.4941 151 Dermestes carnivorus 0.4939 184 Paropsis intacta 0.4928
119 Pterohelaeus piceus 0.4941 152 Liparetrus phoenicopterus 0.4939 185 Peltoschema orphana 0.4928
120 Pterohelaeus striatopunctatus 0.4941 153 Onthophagus blackwoodensis 0.4939 186 Colpochila gagatina 0.4928
121 Bactrocera cacuminata 0.4941 154 Onthophagus geelongensis 0.4939 187 Eupoecila inscripta 0.4928
122 Bactrocera musae 0.4941 155 Onthophagus mniszechi 0.4939 188 Hemichnoodes mniszechi 0.4928
123 Bactrocera neohumeralis 0.4941 156 Schizognathus burmeisteri 0.4939 189 Heteronyx flavus 0.4928
124 Dacus absonifacies 0.4941 157 Adelium alpicola 0.4939 190 Heteronyx normalis 0.4928
125 Spathulina acroleuca 0.4941 158 Anaxo cylindricus 0.4939 191 Heteronyx pustulosus 0.4928
126 Trupanea glauca 0.4941 159 Euomma lateralis 0.4939 192 Liparetrus bituberculatus 0.4928
127 Edwardsiana froggatti 0.4941 160 Otrintus behri 0.4939 193 Metallesthes metallescens 0.4928
128 Orosius canberrensis 0.4941 161 Pterohelaeus planus 0.4939 194 Anaxo brevicornis 0.4928
129 Trocnada dorsigera 0.4941 162 Seirotrana parallela 0.4939 195 Cillibus blackburni 0.4928
130 Biprorulus bibax 0.4941 163 Seirotrana proxima 0.4939 196 Helea castor 0.4928
131 Poecilometis apicalis 0.4941 164 Bactrocera cucurbitae 0.4939 197 Helea modica 0.4928
132 Poecilometis australasiae 0.4941 165 Cinara cupressi 0.4939 198 Metistete omophloides 0.4928

CRC10001 Final Report Page 87 of
172
Table 17. (continued).
Rank* Species risk index Rank* Species risk index Rank* Species risk index
199 Pterohelaeus dispersus 0.4928 207 Coelophora inaequalis 0.4484 215 Creiis lituratus 0.4484
200 Pterohelaeus nitidissimus 0.4928 208 Coptodactyla glabricollis 0.4484 216 Cryptotermes domesticus 0.4484
201 Saragus latus 0.4928 209 Onthophagus laminatus 0.4484 217 Nomophila corticalis 0.4484
202 Tetraneura nigriabdominalis 0.4928 210 Brunotartessus fulvus 0.4484 218 Anthrenus flavipes 0.4483
203 Cuspicona obesula 0.4928 211 Exitianus nanus 0.4484 219 Onthophagus glabratus 0.4473
204 Aporocera parenthetica 0.4484 212 Nesoclutha pallida 0.4484 220 Aleurodicus destructor 0.4473
205 Hispellinus multispinosus 0.4484 213 Recilia hospes 0.4484
206 Paropsis variolosa 0.4484 214 Soractellus nigrominutus 0.4484

CRC10001 Final Report Page 88 of
172
Table 18. QLD insect pest top 200 risk list generated from SOM analysis of Australian distributional data. . * Species with the same risk index were ranked in alphabetical
order.
Rank* Species risk index Rank* Species risk index Rank* Species risk index
1 Latheticus oryzae 0.1461 34 Hylotrupes bajulus 0.1201 67 Aphodius fimetarius 0.1182
2 Siphoninus phillyreae 0.1459 35 Pulvinaria maskelli 0.1201 68 Aphodius granarius 0.1182
3 Ophiomyia phaseoli 0.1456 36 Engytatus nicotianae 0.1201 69 Diphucephala colaspidoides 0.1182
4 Piezodorus hybneri 0.1456 37 Cardiaspina albitextura 0.1201 70 Adelium similatum 0.1182
5 Mythimna separata 0.1456 38 Symmetrischema tangolias 0.1201 71 Isopteron aversum 0.1182
6 Lyctus brunneus 0.144 39 Dialectica scalariella 0.1201 72 Promethis angulata 0.1182
7 Austroasca merredinensis 0.1437 40 Persectania dyscrita 0.1201 73 Saragus costatus 0.1182
8 Ephestia cautella 0.1437 41 Hednota crypsichroa 0.1201 74 Myzus cerasi 0.1182
9 Acheta domesticus 0.1437 42 Hednota panteucha 0.1201 75 Ovatus crataegarius 0.1182
10 Ceratitella loranthi 0.1435 43 Strepsicrates macropetana 0.1201 76 Rhodobium porosum 0.1182
11 Minchamia hubbardae 0.1435 44 Austroicetes frater 0.1201 77 Pulvinaria hydrangeae 0.1182
12 Penicillaria jocosatrix 0.1435 45 Austroicetes vulgaris 0.1201 78 Dictyotus conspicuus 0.1182
13 Anthrenus flavipes 0.1416 46 Limothrips angulicornis 0.1201 79 Bathytricha truncata 0.1182
14 Lyctus africanus 0.1413 47 Cadmus excrementarius 0.1198 80 Dasygaster padockina 0.1182
15 Onthophagus bindaree 0.1413 48 Chrysolina quadrigemina 0.1198 81 Diarsia intermixta 0.1182
16 Onthophagus erichsoni 0.1413 49 Trogoderma variabile 0.1198 82 Eutrichopidia latinus 0.1182
17 Tropicomyia polyphyta 0.1413 50 Euoniticellus africanus 0.1198 83 Neumichtis saliaris 0.1182
18 Cicadulina bipunctatus 0.1413 51 Euoniticellus pallipes 0.1198 84 Phalaenoides tristifica 0.1182
19 Ipoides honiala 0.1413 52 Anomalaphis comperei 0.1198 85 Anaphothrips varii 0.1182
20 Katipo pallescens 0.1413 53 Coccus pseudomagnoliarum 0.1198 86 Athemistus puncticollis 0.118
21 Brithys crini 0.1413 54 Pulvinaria flavicans 0.1198 87 Bimia bicolor 0.118
22 Ernobius mollis 0.1204 55 Earias vittella 0.1198 88 Cnemoplites blackburni 0.118
23 Heteronyx elongatus 0.1204 56 Leucania stenographa 0.1198 89 Cnemoplites edulis 0.118
24 Isopteron punctatissimus 0.1204 57 Xanthodes congenita 0.1198 90 Rhytiphora decipiens 0.118
25 Chaetosiphon tetrarhodum 0.1204 58 Catamola thyrisalis 0.1198 91 Scolecobrothus variegatus 0.118
26 Uroleucon sonchi 0.1204 59 Megabregmus australiensis 0.1182 92 Toxeutes arcuatus 0.118
27 Parthenolecanium pruinosum 0.1204 60 Phoracantha lata 0.1182 93 Zygocera canosa 0.118
28 Ctenarytaina eucalypti 0.1204 61 Dermestes lardarius 0.1182 94 Cadmus litigiosus 0.118
29 Acyphas semiochrea 0.1204 62 Agrypnus caliginosus 0.1182 95 Chrysolina hyperici 0.118
30 Persectania ewingii 0.1204 63 Crepidomenus decoratus 0.1182 96 Dermestes carnivorus 0.118
31 Hednota pedionoma 0.1204 64 Elatichrosis trisulcatus 0.1182 97 Dermestes peruvianus 0.118
32 Apterothrips apteris 0.1204 65 Acrossidius tasmaniae 0.1182 98 Trogoderma sternale 0.118
33 Odontothripiella australis 0.1204 66 Anoplognathus rugosus 0.1182 99 Carpophilus aterrimus 0.118

CRC10001 Final Report Page 89 of
172
Table 18. (continued).
Rank* Species risk index Rank* Species risk index Rank* Species risk index
100 Heteronyx dimidiata 0.118 133 Bardistus cibarius 0.1177 166 Blaps polychresta 0.1177
101 Liparetrus phoenicopterus 0.118 134 Neoclytus acuminatus 0.1177 167 Brises acuticornis 0.1177
102 Onthophagus blackwoodensis 0.118 135 Omotes erosicollis 0.1177 168 Celibe costatus 0.1177
103 Onthophagus geelongensis 0.118 136 Phoracantha gigas 0.1177 169 Celibe emarginata 0.1177
104 Onthophagus mniszechi 0.118 137 Phoracantha impavida 0.1177 170 Celibe interrupta 0.1177
105 Schizognathus burmeisteri 0.118 138 Rhytiphora saundersii 0.1177 171 Lyphia australis 0.1177
106 Adelium alpicola 0.118 139 Symphyletes nigrovirens 0.1177 172 Mesomorphus darlingensis 0.1177
107 Anaxo cylindricus 0.118 140 Xystoena vittata 0.1177 173 Pterohelaeus tristis 0.1177
108 Euomma lateralis 0.118 141 Aporocera haematodes 0.1177 174 Cerodontha australis 0.1177
109 Otrintus behri 0.118 142 Chaetocnema concinna 0.1177 175 Melanagromyza apii 0.1177
110 Pterohelaeus planus 0.118 143 Chaetocnema olliffi 0.1177 176 Bactrocera dorsalis 0.1177
111 Seirotrana parallela 0.118 144 Chaetocnema propinqua 0.1177 177 Bactrocera kirki 0.1177
112 Seirotrana proxima 0.118 145 Leucispa odewahni 0.1177 178 Bactrocera melanota 0.1177
113 Bactrocera cucurbitae 0.118 146 Cyrema nigellum 0.1177 179 Bactrocera passiflorae 0.1177
114 Cinara cupressi 0.118 147 Trogoderma granarium 0.1177 180 Bactrocera psidii 0.1177
115 Eriosoma pyricola 0.118 148 Trogoderma inclusum 0.1177 181 Xenaleyrodes eucalypti 0.1177
116 Batracomorphus angustatus 0.118 149 Trogoderma irroratum 0.1177 182 Acyrthosiphon pelargonii 0.1177
117 Eurymelops rubrovittata 0.118 150 Australaethina froggatti 0.1177 183 Tinocallis ulmiparvifoliae 0.1177
118 Rhotidoides montana 0.118 151 Epuraea lindensis 0.1177 184 Eurymela rubrolimbata 0.1177
119 Rhotidoides punctivena 0.118 152 Anoplognathus narmarus 0.1177 185 Austrolichtensia hakearum 0.1177
120 Uloprora risdonensis 0.118 153 Corynophyllus fortnumi 0.1177 186 Cardiococcus fossilis 0.1177
121 Cardiococcus foraminifer 0.118 154 Frenchella iridescens 0.1177 187 Ctenochiton eucalypti 0.1177
122 Paralecanium frenchii 0.118 155 Heteronyx granum 0.1177 188 Symonicoccus australis 0.1177
123 Pulvinaria floccifera 0.118 156 Liparetrus nigrinus 0.1177 189 Symonicoccus ovalis 0.1177
124 Pamerapa thoracica 0.118 157 Liparetrus xanthotrichus 0.1177 190 Nysius huttoni 0.1177
125 Coridromius variegatus 0.118 158 Micropoecila cincta 0.1177 191 Eumecopus australasiae 0.1177
126 Omyta centrolineata 0.118 159 Phyllotocus basalis 0.1177 192 Oncocoris desertus 0.1177
127 Armactica conchidia 0.118 160 Phyllotocus moestus 0.1177 193 Aconopsylla sterculiae 0.1177
128 Earias paralella 0.118 161 Popillia japonica 0.1177 194 Cardiaspina fiscella 0.1177
129 Ectopatria mundoides 0.118 162 Sericesthis nemoralis 0.1177 195 Eucalyptolyma maideni 0.1177
130 Eudesmeola lawsoni 0.118 163 Sericesthis tetrica 0.1177 196 Glycaspis brimblecombei 0.1177
131 Neumichtis nigerrima 0.118 164 Telura petiolata 0.1177 197 Phyllolyma rufa 0.1177
132 Xyloperthella crinitarsis 0.1177 165 Adelium rotundum 0.1177 198 Incisitermes minor 0.1177

CRC10001 Final Report Page 90 of
172
Table 18. (continued).
Rank* Species risk index Rank* Species risk index Rank* Species risk index
199 Coptotermes havilandi 0.1177 225 Ambeodontus pilosus 0.1161 251 Dendrophagus australis 0.1161
200 Ephysteris subdiminutella 0.1177 226 Atesta tasmanica 0.1161 252 Uleiota militaris 0.1161
201 Acrocercops plebeia 0.1177 227 Callidiopis praecox 0.1161 253 Atoichus bicolor 0.1161
202 Acontia nivipicta 0.1177 228 Callidiopis scutellaris 0.1161 254 Caediomorpha heteromera 0.1161
203 Anomis sabulifera 0.1177 229 Phlyctaenodes pustulatus 0.1161 255 Isopteron triviale 0.1161
204 Armactica columbina 0.1177 230 Phoracantha acanthocera 0.1161 256 Kaszaba corvina 0.1161
205 Earias chlorodes 0.1177 231 Zoedia divisa 0.1161 257 Lepispilus stygianus 0.1161
206 Eublemma amoena 0.1177 232 Aporocera viridipennis 0.1161 258 Neocistela ovalis 0.1161
207 Proteuxoa tibiata 0.1177 233 Cadmus braccatus 0.1161 259 Platydema tetraspilotum 0.1161
208 Ectomyelois ceratoniae 0.1177 234 Chloroplisma viridis 0.1161 260 Cerodontha milleri 0.1161
209 Cydia molesta 0.1177 235 Hispellinus fimbriatus 0.1161 261 Aulacorthum circumflexum 0.1161
210 Acrida turrita 0.1177 236 Monolepta minima 0.1161 262 Myzocallis coryli 0.1161
211 Belpessia dispar 0.1177 237 Paropsis porosa 0.1161 263 Shinjia orientalis 0.1161
212 Histrioacrida roseopennis 0.1177 238 Platycolaspis australis 0.1161 264 Microlopa minuta 0.1161
213 Kosciuskola usitatus 0.1177 239 Rhyzobius pulcher 0.1161 265 Ribautiana ulmi 0.1161
214 Macrolopholia ayersii 0.1177 240 Crepidomenus fulgidus 0.1161 266 Rosopaella kirkaldyi 0.1161
215 Percassa rugifrons 0.1177 241 Wynarka sylvestre 0.1161 267 Rosopaella swani 0.1161
216 Perloccia evittata 0.1177 242 Carpophilus terminalis 0.1161 268 Xestocephalus tasmaniensis 0.1161
217 Qualetta maculata 0.1177 243 Cryptarcha australis 0.1161 269 Niastama obscuritarsis 0.1161
218 Urnisiella rubropunctata 0.1177 244 Epuraea victoriensis 0.1161 270 Kalotermes atratus 0.1161
219 Bobilla bivittata 0.1177 245 Diphucephala pulchella 0.1161 271 Kalotermes convexus 0.1161
220 Pseudorhynchus mimeticus 0.1177 246 Heteronyx crinitus 0.1161 272 Hecatesia fenestrata 0.1161
221 Lamprothrips miltoni 0.1177 247 Onthophagus mutatus 0.1161 273 Hypoperigea tonsa 0.1161
222 Leucothrips nigripennis 0.1177 248 Pimelopus dubius 0.1161 274 Proteuxoa capularis 0.1161
223 Ptinus cupreoniger 0.1161 249 Pimelopus porcellus 0.1161 275 Proteuxoa tortisigna 0.1161
224 Ptinus tectus 0.1161 250 Telura alta 0.1161 276 Aptinothrips rufus 0.1161

CRC10001 Final Report Page 91 of
172
Table 19. NT insect pest top 200 risk list generated from SOM analysis of Australian distributional data. . * Species with the same risk index were ranked in alphabetical
order.
Rank* Species risk index Rank* Species risk index Rank* Species risk index
1 Coleocoptus senio 0.5662 34 Rhopalosiphum rufiabdominalis 0.5662 67 Xylobosca bispinosus 0.5531
2 Coptocercus rubripes 0.5662 35 Sitobion miscanthi 0.5662 68 Phoracantha semipunctata 0.5531
3 Phaolus metallicus 0.5662 36 Therioaphis trifolii 0.5662 69 Chrysophtharta variicollis 0.5531
4 Scolecobrothus westwoodi 0.5662 37 Toxoptera aurantii 0.5662 70 Anthrenus museorum 0.5531
5 Uracanthus triangularis 0.5662 38 Toxoptera citricida 0.5662 71 Carpophilus marginellus 0.5531
6 Cadmus crucicollis 0.5662 39 Tuberculatus annulatus 0.5662 72 Heteronychus arator 0.5531
7 Paropsis atomaria 0.5662 40 Zygina zealandica 0.5662 73 Heteronyx elongatus 0.5531
8 Harmonia conformis 0.5662 41 Coccus hesperidum 0.5662 74 Isopteron punctatissimus 0.5531
9 Hippodamia variegata 0.5662 42 Saissetia coffeae 0.5662 75 Ceratitis capitata 0.5531
10 Rodolia cardinalis 0.5662 43 Saissetia oleae 0.5662 76 Dirioxa pornia 0.5531
11 Anthrenocerus australis 0.5662 44 Cermatulus nasalis 0.5662 77 Chaetosiphon tetrarhodum 0.5531
12 Australaphodius frenchi 0.5662 45 Dictyotus caenosus 0.5662 78 Idiopterus nephrelepidis 0.5531
13 Adelium brevicorne 0.5662 46 Phthorimaea operculella 0.5662 79 Uroleucon sonchi 0.5531
14 Tenebrio molitor 0.5662 47 Agrotis infusa 0.5662 80 Cryptes baccatus 0.5531
15 Chromatomyia syngenesiae 0.5662 48 Apina callisto 0.5662 81 Parasaissetia nigra 0.5531
16 Orchamoplatus citri 0.5662 49 Australothis rubrescens 0.5662 82 Parthenolecanium persicae 0.5531
17 Acyrthosiphon pisum 0.5662 50 Cosmodes elegans 0.5662 83 Parthenolecanium pruinosum 0.5531
18 Aphis spiraecola 0.5662 51 Mythimna convecta 0.5662 84 Pseudapines geminata 0.5531
19 Aulacorthum solani 0.5662 52 Phalaenoides glycinae 0.5662 85 Ctenarytaina eucalypti 0.5531
20 Brachycaudus helichrysi 0.5662 53 Uraba lugens 0.5662 86 Coptotermes frenchi 0.5531
21 Brachycaudus persicae 0.5662 54 Clania ignobilis 0.5662 87 Heterotermes ferox 0.5531
22 Capitophorus elaeagni 0.5662 55 Achyra affinitalis 0.5662 88 Nasutitermes exitiosus 0.5531
23 Cavariella aegopodii 0.5662 56 Uresiphita ornithopteralis 0.5662 89 Acyphas semiochrea 0.5531
24 Chaetosiphon fragaefolii 0.5662 57 Phaulacridium vittatum 0.5662 90 Athetis tenuis 0.5531
25 Cinara tujafilina 0.5662 58 Teleogryllus commodus 0.5662 91 Persectania ewingii 0.5531
26 Dysaphis foeniculus 0.5662 59 Desmothrips propinquus 0.5662 92 Spodoptera exigua 0.5531
27 Dysaphis tulipae 0.5662 60 Desmothrips tenuicornis 0.5662 93 Cadra cautella 0.5531
28 Hyadaphis foeniculi 0.5662 61 Chirothrips manicatus 0.5662 94 Ephestia kuehniella 0.5531
29 Hyperomyzus lactucae 0.5662 62 Frankliniella occidentalis 0.5662 95 Hednota longipalpella 0.5531
30 Macrosiphoniella sanborni 0.5662 63 Limothrips cerealium 0.5662 96 Hednota pedionoma 0.5531
31 Macrosiphum rosae 0.5662 64 Thrips australis 0.5662 97 Isotenes miserana 0.5531
32 Myzus ornatus 0.5662 65 Dysaphis aucupariae 0.5655 98 Austroicetes pusilla 0.5531
33 Rhopalosiphum padi 0.5662 66 Ernobius mollis 0.5531 99 Chortoicetes terminifera 0.5531
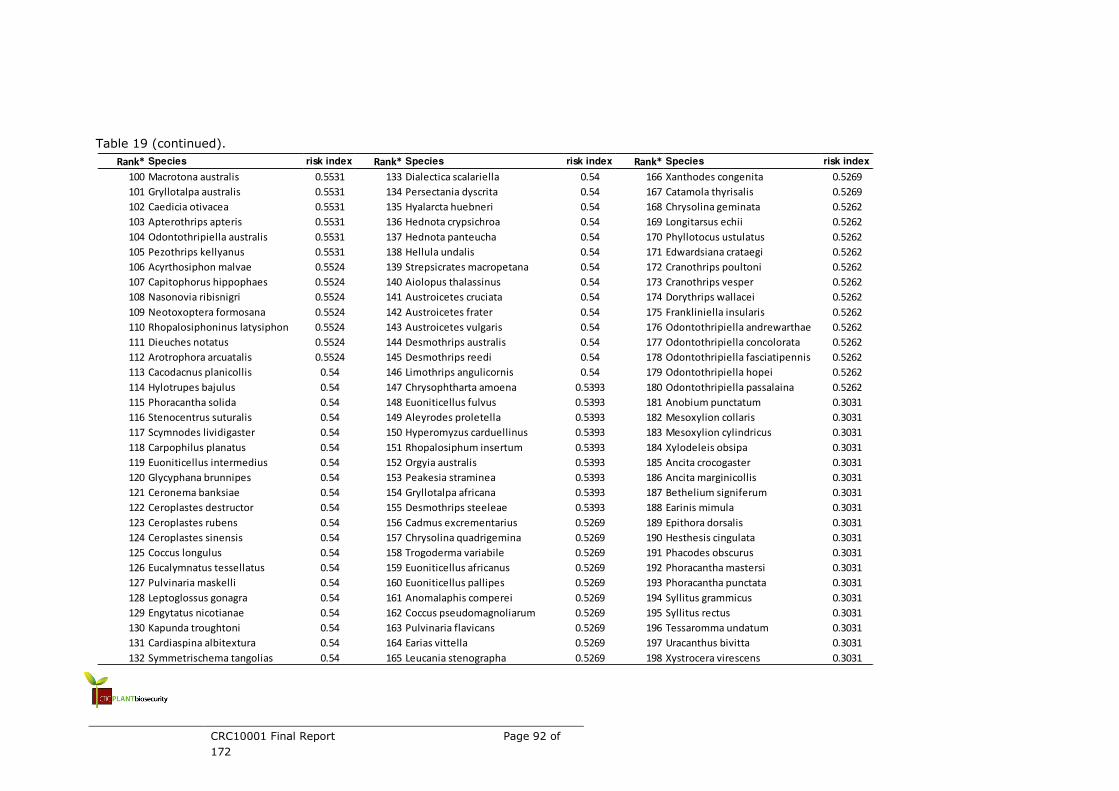
CRC10001 Final Report Page 92 of
172
Table 19 (continued).
Rank* Species risk index Rank* Species risk index Rank* Species risk index
100 Macrotona australis 0.5531 133 Dialectica scalariella 0.54 166 Xanthodes congenita 0.5269
101 Gryllotalpa australis 0.5531 134 Persectania dyscrita 0.54 167 Catamola thyrisalis 0.5269
102 Caedicia otivacea 0.5531 135 Hyalarcta huebneri 0.54 168 Chrysolina geminata 0.5262
103 Apterothrips apteris 0.5531 136 Hednota crypsichroa 0.54 169 Longitarsus echii 0.5262
104 Odontothripiella australis 0.5531 137 Hednota panteucha 0.54 170 Phyllotocus ustulatus 0.5262
105 Pezothrips kellyanus 0.5531 138 Hellula undalis 0.54 171 Edwardsiana crataegi 0.5262
106 Acyrthosiphon malvae 0.5524 139 Strepsicrates macropetana 0.54 172 Cranothrips poultoni 0.5262
107 Capitophorus hippophaes 0.5524 140 Aiolopus thalassinus 0.54 173 Cranothrips vesper 0.5262
108 Nasonovia ribisnigri 0.5524 141 Austroicetes cruciata 0.54 174 Dorythrips wallacei 0.5262
109 Neotoxoptera formosana 0.5524 142 Austroicetes frater 0.54 175 Frankliniella insularis 0.5262
110 Rhopalosiphoninus latysiphon 0.5524 143 Austroicetes vulgaris 0.54 176 Odontothripiella andrewarthae 0.5262
111 Dieuches notatus 0.5524 144 Desmothrips australis 0.54 177 Odontothripiella concolorata 0.5262
112 Arotrophora arcuatalis 0.5524 145 Desmothrips reedi 0.54 178 Odontothripiella fasciatipennis 0.5262
113 Cacodacnus planicollis 0.54 146 Limothrips angulicornis 0.54 179 Odontothripiella hopei 0.5262
114 Hylotrupes bajulus 0.54 147 Chrysophtharta amoena 0.5393 180 Odontothripiella passalaina 0.5262
115 Phoracantha solida 0.54 148 Euoniticellus fulvus 0.5393 181 Anobium punctatum 0.3031
116 Stenocentrus suturalis 0.54 149 Aleyrodes proletella 0.5393 182 Mesoxylion collaris 0.3031
117 Scymnodes lividigaster 0.54 150 Hyperomyzus carduellinus 0.5393 183 Mesoxylion cylindricus 0.3031
118 Carpophilus planatus 0.54 151 Rhopalosiphum insertum 0.5393 184 Xylodeleis obsipa 0.3031
119 Euoniticellus intermedius 0.54 152 Orgyia australis 0.5393 185 Ancita crocogaster 0.3031
120 Glycyphana brunnipes 0.54 153 Peakesia straminea 0.5393 186 Ancita marginicollis 0.3031
121 Ceronema banksiae 0.54 154 Gryllotalpa africana 0.5393 187 Bethelium signiferum 0.3031
122 Ceroplastes destructor 0.54 155 Desmothrips steeleae 0.5393 188 Earinis mimula 0.3031
123 Ceroplastes rubens 0.54 156 Cadmus excrementarius 0.5269 189 Epithora dorsalis 0.3031
124 Ceroplastes sinensis 0.54 157 Chrysolina quadrigemina 0.5269 190 Hesthesis cingulata 0.3031
125 Coccus longulus 0.54 158 Trogoderma variabile 0.5269 191 Phacodes obscurus 0.3031
126 Eucalymnatus tessellatus 0.54 159 Euoniticellus africanus 0.5269 192 Phoracantha mastersi 0.3031
127 Pulvinaria maskelli 0.54 160 Euoniticellus pallipes 0.5269 193 Phoracantha punctata 0.3031
128 Leptoglossus gonagra 0.54 161 Anomalaphis comperei 0.5269 194 Syllitus grammicus 0.3031
129 Engytatus nicotianae 0.54 162 Coccus pseudomagnoliarum 0.5269 195 Syllitus rectus 0.3031
130 Kapunda troughtoni 0.54 163 Pulvinaria flavicans 0.5269 196 Tessaromma undatum 0.3031
131 Cardiaspina albitextura 0.54 164 Earias vittella 0.5269 197 Uracanthus bivitta 0.3031
132 Symmetrischema tangolias 0.54 165 Leucania stenographa 0.5269 198 Xystrocera virescens 0.3031
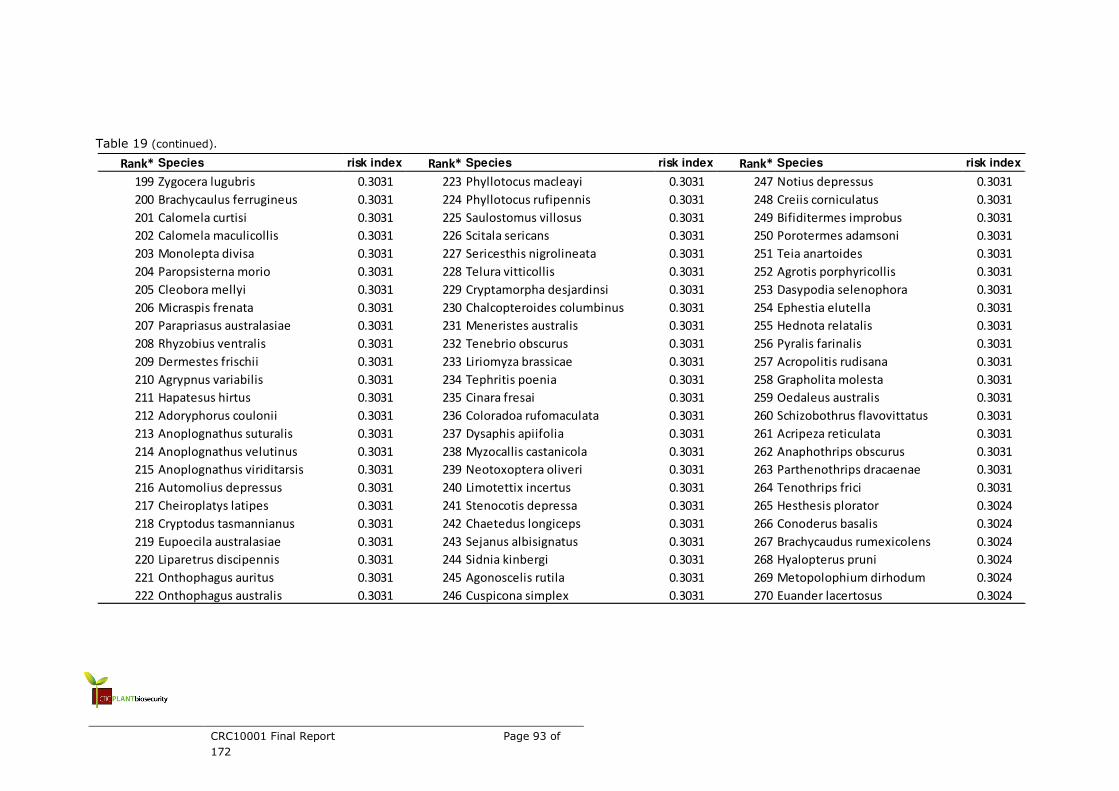
CRC10001 Final Report Page 93 of
172
Table 19 (continued).
Rank* Species risk index Rank* Species risk index Rank* Species risk index
199 Zygocera lugubris 0.3031 223 Phyllotocus macleayi 0.3031 247 Notius depressus 0.3031
200 Brachycaulus ferrugineus 0.3031 224 Phyllotocus rufipennis 0.3031 248 Creiis corniculatus 0.3031
201 Calomela curtisi 0.3031 225 Saulostomus villosus 0.3031 249 Bifiditermes improbus 0.3031
202 Calomela maculicollis 0.3031 226 Scitala sericans 0.3031 250 Porotermes adamsoni 0.3031
203 Monolepta divisa 0.3031 227 Sericesthis nigrolineata 0.3031 251 Teia anartoides 0.3031
204 Paropsisterna morio 0.3031 228 Telura vitticollis 0.3031 252 Agrotis porphyricollis 0.3031
205 Cleobora mellyi 0.3031 229 Cryptamorpha desjardinsi 0.3031 253 Dasypodia selenophora 0.3031
206 Micraspis frenata 0.3031 230 Chalcopteroides columbinus 0.3031 254 Ephestia elutella 0.3031
207 Parapriasus australasiae 0.3031 231 Meneristes australis 0.3031 255 Hednota relatalis 0.3031
208 Rhyzobius ventralis 0.3031 232 Tenebrio obscurus 0.3031 256 Pyralis farinalis 0.3031
209 Dermestes frischii 0.3031 233 Liriomyza brassicae 0.3031 257 Acropolitis rudisana 0.3031
210 Agrypnus variabilis 0.3031 234 Tephritis poenia 0.3031 258 Grapholita molesta 0.3031
211 Hapatesus hirtus 0.3031 235 Cinara fresai 0.3031 259 Oedaleus australis 0.3031
212 Adoryphorus coulonii 0.3031 236 Coloradoa rufomaculata 0.3031 260 Schizobothrus flavovittatus 0.3031
213 Anoplognathus suturalis 0.3031 237 Dysaphis apiifolia 0.3031 261 Acripeza reticulata 0.3031
214 Anoplognathus velutinus 0.3031 238 Myzocallis castanicola 0.3031 262 Anaphothrips obscurus 0.3031
215 Anoplognathus viriditarsis 0.3031 239 Neotoxoptera oliveri 0.3031 263 Parthenothrips dracaenae 0.3031
216 Automolius depressus 0.3031 240 Limotettix incertus 0.3031 264 Tenothrips frici 0.3031
217 Cheiroplatys latipes 0.3031 241 Stenocotis depressa 0.3031 265 Hesthesis plorator 0.3024
218 Cryptodus tasmannianus 0.3031 242 Chaetedus longiceps 0.3031 266 Conoderus basalis 0.3024
219 Eupoecila australasiae 0.3031 243 Sejanus albisignatus 0.3031 267 Brachycaudus rumexicolens 0.3024
220 Liparetrus discipennis 0.3031 244 Sidnia kinbergi 0.3031 268 Hyalopterus pruni 0.3024
221 Onthophagus auritus 0.3031 245 Agonoscelis rutila 0.3031 269 Metopolophium dirhodum 0.3024
222 Onthophagus australis 0.3031 246 Cuspicona simplex 0.3031 270 Euander lacertosus 0.3024
CRC10001 Final Report Page 94 of
172
Table 20. SA insect pest top 200 risk list generated from SOM analysis of Australian distributional data. . * Species with the same risk index were ranked in alphabetical
order.
Rank* Species risk index Rank* Species risk index Rank* Species risk index
1 Xylopsocus gibbicollis 0.6528 34 Antigastra catalaunalis 0.5588 67 Penicillaria jocosatrix 0.5579
2 Trialeurodes vaporariorum 0.6528 35 Cnaphalocrocis medinalis 0.5588 68 Bactrocera mendosa 0.5578
3 Xylobosca vidua 0.6058 36 Corcyra cephalonica 0.5588 69 Dacus pallidus 0.5578
4 Micraspis lineola 0.6058 37 Diaphania indica 0.5588 70 Graptostethus diffusus 0.5578
5 Plautia affinis 0.6058 38 Herpetogramma licarsisalis 0.5588 71 Helopeltis pernicialis 0.5578
6 Microcerotermes distinctus 0.6058 39 Omiodes diemenalis 0.5588 72 Microcerotermes boreus 0.5578
7 Aproaerema simplexella 0.6058 40 Spoladea recurvalis 0.5588 73 Leptocneria binotata 0.5578
8 Austracris guttulosa 0.6058 41 Cryptophlebia ombrodelta 0.5588 74 Orgyia papuana 0.5578
9 Graptostethus servus 0.6057 42 Heteropternis obscurella 0.5588 75 Nanaguna breviuscula 0.5578
10 Austroasca merredinensis 0.6049 43 Australothrips bicolor 0.5588 76 Austracris basalis 0.5578
11 Anoplognathus macleayi 0.6048 44 Scirtothrips dorsalis 0.5588 77 Retithrips javanicus 0.5578
12 Acalolepta mixtus 0.5588 45 Selenothrips rubrocinctus 0.5588 78 Xylodeleis obsipa 0.4422
13 Apomecyna histrio 0.5588 46 Thrips florum 0.5588 79 Uracanthus bivitta 0.4422
14 Zygrita diva 0.5588 47 Thrips parvispinus 0.5588 80 Rhyzobius ventralis 0.4422
15 Aulacophora abdominalis 0.5588 48 Platyomopsis pedicornis 0.5587 81 Liriomyza brassicae 0.4422
16 Oulema rufotincta 0.5588 49 Rhyparida didyma 0.5587 82 Dysaphis apiifolia 0.4422
17 Harmonia octomaculata 0.5588 50 Hemipharis insularis 0.5587 83 Limotettix incertus 0.4422
18 Carpophilus mutilatus 0.5588 51 Lepidiota delicatula 0.5587 84 Sejanus albisignatus 0.4422
19 Dialeuropora decempuncta 0.5588 52 Lepidiota perkinsi 0.5587 85 Sidnia kinbergi 0.4422
20 Amrasca terraereginae 0.5588 53 Bactrocera decurtans 0.5587 86 Agrotis porphyricollis 0.4422
21 Austroasca alfalfae 0.5588 54 Lipaleyrodes euphorbiae 0.5587 87 Anaphothrips obscurus 0.4422
22 Balclutha incisa 0.5588 55 Acroelytrum muricatum 0.5587 88 Parthenothrips dracaenae 0.4422
23 Eysarcoris trimaculatus 0.5588 56 Amblypelta lutescens 0.5587 89 Tenothrips frici 0.4422
24 Anomis flava 0.5588 57 Campylomma austrinum 0.5587 90 Brachycaudus rumexicolens 0.4421
25 Helicoverpa assulta 0.5588 58 Oncocoris coelebs 0.5587 91 Ovatus crataegarius 0.4413
26 Mocis alterna 0.5588 59 Microcerotermes nervosus 0.5587 92 Rhodobium porosum 0.4413
27 Mocis frugalis 0.5588 60 Cryptoblabes adoceta 0.5587 93 Anaphothrips varii 0.4413
28 Ophiusa coronata 0.5588 61 Scirpophaga innotata 0.5587 94 Rhopalosiphoninus staphyleae 0.4412
29 Ophiusa tirhaca 0.5588 62 Stenocatantops angustifrons 0.5587 95 Smynthurodes betae 0.4412
30 Pericyma cruegeri 0.5588 63 Stenocatantops vitripennis 0.5587 96 Phoracantha frenchi 0.3952
31 Spodoptera exempta 0.5588 64 Teleogryllus oceanicus 0.5587 97 Adalia bipunctata 0.3952
32 Spodoptera litura 0.5588 65 Dendrothripoides innoxius 0.5587 98 Carpophilus davidsoni 0.3952
33 Spodoptera mauritia 0.5588 66 Thrips unispinus 0.5587 99 Glycyphana stolata 0.3952
CRC10001 Final Report Page 95 of
172
Table 20 (continued).
Rank* Species risk index Rank* Species risk index Rank* Species risk index
100 Orosius canberrensis 0.3952 133 Coccus viridis 0.3482 166 Xenaleyrodes eucalypti 0.3473
101 Trocnada dorsigera 0.3952 134 Pulvinaria psidii 0.3482 167 Tinocallis ulmiparvifoliae 0.3473
102 Schedorhinotermes reticulatus 0.3952 135 Pulvinaria urbicola 0.3482 168 Cardiaspina fiscella 0.3473
103 Faveria tritalis 0.3952 136 Ardozyga stratifera 0.3482 169 Acrocercops plebeia 0.3473
104 Hygraula nitens 0.3952 137 Helicoverpa prepodes 0.3482 170 Anomis sabulifera 0.3473
105 Cryptoptila immersana 0.3952 138 Calamotropha leptogrammellus 0.3482 171 Eublemma amoena 0.3473
106 Epiphyas xylodes 0.3952 139 Ostrinia furnacalis 0.3482 172 Lamprothrips miltoni 0.3473
107 Andrewarthaia kellyana 0.3952 140 Epiphyas sobrina 0.3482 173 Leucothrips nigripennis 0.3473
108 Desmothrips obsoletus 0.3952 141 Valanga irregularis 0.3482 174 Xylopsocus rubidus 0.3472
109 Arorathrips mexicanus 0.3952 142 Gryllodes supplicans 0.3482 175 Atesta patula 0.3472
110 Hercinothrips bicinctus 0.3952 143 Franklinothrips variegatus 0.3482 176 Atesta sita 0.3472
111 Anomala antiqua 0.3951 144 Thrips safrus 0.3482 177 Pachydissus boops 0.3472
112 Essigella californica 0.3951 145 Algarobius prosopis 0.3481 178 Phoracantha odewahni 0.3472
113 Batracomorphus angustatus 0.3943 146 Gonocephalum walkeri 0.3481 179 Phoracantha punctipennis 0.3472
114 Neumichtis nigerrima 0.3943 147 Cicadulina bimaculata 0.3481 180 Sceleocantha pilosicollis 0.3472
115 Chrysophtharta nobilitata 0.3942 148 Saissetia miranda 0.3481 181 Algarobius bottimeri 0.3472
116 Carpophilus frivolus 0.3942 149 Oncocoris hackeri 0.3481 182 Aporocera bynoei 0.3472
117 Heteronyx pustulosus 0.3942 150 Ctenarytaina longicauda 0.3481 183 Cadmus breweri 0.3472
118 Tetraneura nigriabdominalis 0.3942 151 Heterotermes paradoxus 0.3481 184 Cadmus nothus 0.3472
119 Anacephaleus minutus 0.3942 152 Agrotis emboloma 0.3481 185 Chrysophtharta mentatrix 0.3472
120 Cardiaspina squamula 0.3942 153 Agrotis poliotis 0.3481 186 Monolepta haemorrhoidalis 0.3472
121 Xylothrips religiosus 0.3482 154 Bermiella acuta 0.3481 187 Paropsis yilgarnensis 0.3472
122 Tryphocaria acanthrophora 0.3482 155 Craspedothrips minor 0.3481 188 Paropsisterna picta 0.3472
123 Paropsis geographica 0.3482 156 Dendrothrips diaspora 0.3481 189 Penthobruchus germanini 0.3472
124 Trachymela tincticollis 0.3482 157 Hercinothrips femoralis 0.3481 190 Rhyparida alcyone 0.3472
125 Halmus chalybeus 0.3482 158 Hydatothrips haschemi 0.3481 191 Rhyparida vittata 0.3472
126 Dilochrosis atripennis 0.3482 159 Megalurothrips typicus 0.3481 192 Terrillus suturalis 0.3472
127 Ophiomyia lantanae 0.3482 160 Neohydatothrips samayunkur 0.3481 193 Chilocorus bipustulatus 0.3472
128 Dumbletoniella eucalypti 0.3482 161 Panchaetothrips timonii 0.3481 194 Macroura deceptor 0.3472
129 Orchamoplatus mammaeferus 0.3482 162 Rhamphothrips pandens 0.3481 195 Colymbomorpha lineata 0.3472
130 Austrogallia torrida 0.3482 163 Scirtothrips australiae 0.3481 196 Diphucephala edwardsii 0.3472
131 Balclutha viridinervis 0.3482 164 Stenchaetothrips biformis 0.3481 197 Heteronyx exectus 0.3472
132 Ceroplastes ceriferus 0.3482 165 Phoracantha impavida 0.3473 198 Heteronyx proxima 0.3472
CRC10001 Final Report Page 96 of
172
Table 20 (continued).
Rank* Species risk index Rank* Species risk index Rank* Species risk index
199 Lepidiota alticalceus 0.3472 232 Gilippsus hostilis 0.3472 265 Desmothrips marilynae 0.3472
200 Lepidiota amitina 0.3472 233 Oncocoris ovalis 0.3472 266 Desmothrips mendozai 0.3472
201 Lepidiota gilesi 0.3472 234 Tectocoris diophthalmus 0.3472 267 Dorythrips jenkinsi 0.3472
202 Liparetrus jenkinsi 0.3472 235 Blastopsylla nigricollaris 0.3472 268 Liothrips atratus 0.3472
203 Liparetrus similis 0.3472 236 Blastopsylla occidentalis 0.3472 269 Rhipidothrips brunneus 0.3472
204 Gonocephalum elderi 0.3472 237 Cardiaspina jerramungae 0.3472 270 Anaphothrips newmani 0.3472
205 Delia platura 0.3472 238 Cardiaspina tetragonae 0.3472 271 Anaphothrips occidentalis 0.3472
206 Hylemya urbana 0.3472 239 Cardiaspina tetrodontae 0.3472 272 Anascirtothrips arorai 0.3472
207 Phytoliriomyza pittosporphylli 0.3472 240 Creiis periculosus 0.3472 273 Caliothrips graminicola 0.3472
208 Aleurotrachelus dryandrae 0.3472 241 Coptotermes michaelseni 0.3472 274 Cerathrips frici 0.3472
209 Dialeurodes dryandrae 0.3472 242 Neotermes insularis 0.3472 275 Frankliniella lantanae 0.3472
210 Synaleurodicus hakeae 0.3472 243 Xerometra crocina 0.3472 276 Hercothrips bifasciipennis 0.3472
211 Synaleurodicus serratus 0.3472 244 Teia athlophora 0.3472 277 Isochaetothrips ignobilis 0.3472
212 Tetraleurodes pluto 0.3472 245 Agrotis poliophaea 0.3472 278 Isochaetothrips uniformis 0.3472
213 Apomatalis rufictus 0.3472 246 Anomis planalis 0.3472 279 Karphothrips dugdalei 0.3472
214 Ceriferella dossuaria 0.3472 247 Chlorodea obsoleta 0.3472 280 Odontothripiella bispinosa 0.3472
215 Dysaphis lappae 0.3472 248 Earias luteolaria 0.3472 281 Odontothripiella magna 0.3472
216 Meringosiphon paradisicum 0.3472 249 Helicoverpa hardwicki 0.3472 282 Odontothripiella moundi 0.3472
217 Reticulaphis distylii 0.3472 250 Apomyelois ceratoniae 0.3472 283 Odontothripiella unidentata 0.3472
218 Rhopalosiphum conni 0.3472 251 Cadra elutella 0.3472 284 Pseudodendrothrips mori 0.3472
219 Rhopalosiphum rufomaculata 0.3472 252 Niphadoses palleucus 0.3472 285 Rhamphiskothrips rhipistos 0.3472
220 Sitobion ragariae 0.3472 253 Arotrophora diadela 0.3472 286 Scirtothrips astibos 0.3472
221 Austroasca bancrofti 0.3472 254 Cryptophlebia gilva 0.3472 287 Scirtothrips eremicus 0.3472
222 Austroasca terraereginae 0.3472 255 Epiphyas liadelpha 0.3472 288 Scirtothrips moneres 0.3472
223 Stogatella furcifera 0.3472 256 Epiphyas pulla 0.3472 289 Scirtothrips pilbara 0.3472
224 Alecanopsis mirus 0.3472 257 Peraglyphis idiogenes 0.3472 290 Scirtothrips quadriseta 0.3472
225 Ceronema dryandrae 0.3472 258 Phaulacridium crassum 0.3472 291 Scirtothrips solus 0.3472
226 Coccus synapheae 0.3472 259 Aritella leengila 0.3472 292 Thrips seticollis 0.3472
227 Odonaspis ruthae 0.3472 260 Madsumma planiceps 0.3472 293 Thrips subnudula 0.3472
228 Leptocorisa acuta 0.3472 261 Gryllotalpa pluvialis 0.3472 294 Acanthoscelides obtectus 0.3056
229 Leptoglossus bidentatus 0.3472 262 Cranothrips kartus 0.3472 295 Altica ignea 0.3056
230 Campylomma kununurraensis 0.3472 263 Cranothrips ravidus 0.3472
231 Nesidiocoris tenuis 0.3472 264 Cycadothrips emmaliami 0.3472
CRC10001 Final Report Page 97 of
172
Table 21. WA insect pest top 200 risk list generated from SOM analysis of Australian distributional data. . * Species with the same risk index were ranked in alphabetical
order.
Rank* Species risk index Rank* Species risk index Rank* Species risk index
1 Altica cyanea 0.6528 34 Neagenor spinosus 0.5588 67 Bethelium signiferum 0.4422
2 Diomus notescens 0.6528 35 Phyllocnistis citrella 0.5588 68 Earinis mimula 0.4422
3 Dermestes ater 0.6528 36 Donuca orbigera 0.5588 69 Epithora dorsalis 0.4422
4 Heteronyx australis 0.6528 37 Eudocima salaminia 0.5588 70 Hesthesis cingulata 0.4422
5 Cydia pomonella 0.6528 38 Pandesma submurina 0.5588 71 Phacodes obscurus 0.4422
6 Carpophilus maculatus 0.6527 39 Pycnostictus seriatus 0.5588 72 Phoracantha mastersi 0.4422
7 Lyctus brunneus 0.6519 40 Sphingonotus erythropterus 0.5588 73 Phoracantha punctata 0.4422
8 Dinoderus minutus 0.6058 41 Chaetanaphothrips signipennis 0.5588 74 Syllitus grammicus 0.4422
9 Minthea rugicollis 0.6058 42 Chirothrips atricorpus 0.5588 75 Syllitus rectus 0.4422
10 Sinoxylon anale 0.6058 43 Colpochila deceptor 0.5587 76 Tessaromma undatum 0.4422
11 Tristaria grouvellei 0.6058 44 Lepidiota rothei 0.5587 77 Xystrocera virescens 0.4422
12 Chlorobapta frontalis 0.6058 45 Onthophagus symbioticus 0.5587 78 Zygocera lugubris 0.4422
13 Metanastes vulgivagus 0.6058 46 Bactrocera frauenfeldi 0.5587 79 Brachycaulus ferrugineus 0.4422
14 Neodon pecuarius 0.6058 47 Bactrocera mayi 0.5587 80 Calomela curtisi 0.4422
15 Onthophagus gazella 0.6058 48 Oncocoris favillaceus 0.5587 81 Calomela maculicollis 0.4422
16 Palorus subdepressus 0.6058 49 Nasutitermes longipennis 0.5587 82 Monolepta divisa 0.4422
17 Bactrocera tryoni 0.6058 50 Agrotis interjectionis 0.5587 83 Paropsisterna morio 0.4422
18 Austroagallia torrida 0.6058 51 Tirathaba rufivena 0.5587 84 Cleobora mellyi 0.4422
19 Melanerythrus mactans 0.6058 52 Ceratitella loranthi 0.5579 85 Micraspis frenata 0.4422
20 Spilostethus hospes 0.6058 53 Minchamia hubbardae 0.5579 86 Parapriasus australasiae 0.4422
21 Neotermes insularis 0.6058 54 Rosenbergia megalocephala 0.5578 87 Dermestes frischii 0.4422
22 Acrida conica 0.6058 55 Anoplostethus roseus 0.5578 88 Agrypnus variabilis 0.4422
23 Ephippitytha trigintiduoguttata 0.6058 56 Apogonia destructor 0.5578 89 Hapatesus hirtus 0.4422
24 Ephestia cautella 0.6049 57 Ischiopsopha yorkiana 0.5578 90 Adoryphorus coulonii 0.4422
25 Acheta domesticus 0.6049 58 Pterohelaeus costatus 0.5578 91 Anoplognathus suturalis 0.4422
26 Heterobostrychus aequalis 0.5588 59 Elasmolomus sordidus 0.5578 92 Anoplognathus velutinus 0.4422
27 Eurynassa australis 0.5588 60 Pseudopachybrachius guttus 0.5578 93 Anoplognathus viriditarsis 0.4422
28 Penthea pardalis 0.5588 61 Syllepte derogata 0.5578 94 Automolius depressus 0.4422
29 Aspidomorpha deusta 0.5588 62 Anobium punctatum 0.4422 95 Cheiroplatys latipes 0.4422
30 Onitis alexis 0.5588 63 Mesoxylion collaris 0.4422 96 Cryptodus tasmannianus 0.4422
31 Onthophagus consentaneus 0.5588 64 Mesoxylion cylindricus 0.4422 97 Eupoecila australasiae 0.4422
32 Xylotrupes gideon 0.5588 65 Ancita crocogaster 0.4422 98 Liparetrus discipennis 0.4422
33 Caedius sphaeroides 0.5588 66 Ancita marginicollis 0.4422 99 Onthophagus auritus 0.4422
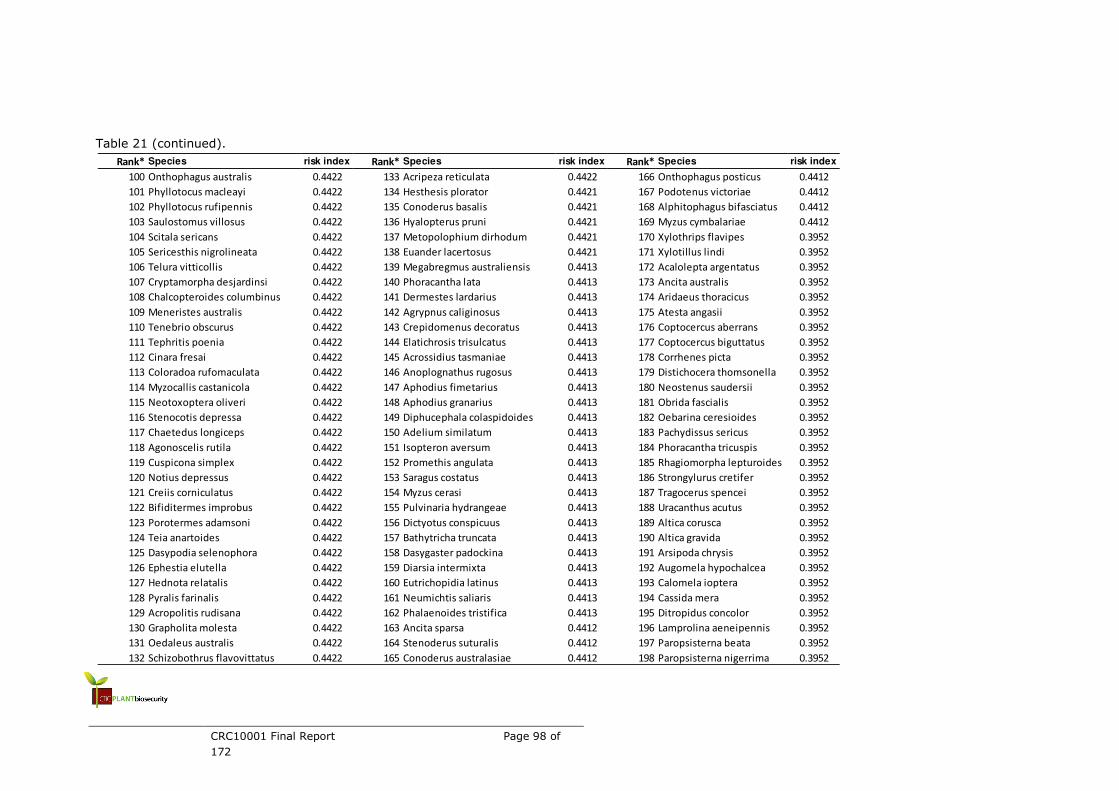
CRC10001 Final Report Page 98 of
172
Table 21 (continued).
Rank* Species risk index Rank* Species risk index Rank* Species risk index
100 Onthophagus australis 0.4422 133 Acripeza reticulata 0.4422 166 Onthophagus posticus 0.4412
101 Phyllotocus macleayi 0.4422 134 Hesthesis plorator 0.4421 167 Podotenus victoriae 0.4412
102 Phyllotocus rufipennis 0.4422 135 Conoderus basalis 0.4421 168 Alphitophagus bifasciatus 0.4412
103 Saulostomus villosus 0.4422 136 Hyalopterus pruni 0.4421 169 Myzus cymbalariae 0.4412
104 Scitala sericans 0.4422 137 Metopolophium dirhodum 0.4421 170 Xylothrips flavipes 0.3952
105 Sericesthis nigrolineata 0.4422 138 Euander lacertosus 0.4421 171 Xylotillus lindi 0.3952
106 Telura vitticollis 0.4422 139 Megabregmus australiensis 0.4413 172 Acalolepta argentatus 0.3952
107 Cryptamorpha desjardinsi 0.4422 140 Phoracantha lata 0.4413 173 Ancita australis 0.3952
108 Chalcopteroides columbinus 0.4422 141 Dermestes lardarius 0.4413 174 Aridaeus thoracicus 0.3952
109 Meneristes australis 0.4422 142 Agrypnus caliginosus 0.4413 175 Atesta angasii 0.3952
110 Tenebrio obscurus 0.4422 143 Crepidomenus decoratus 0.4413 176 Coptocercus aberrans 0.3952
111 Tephritis poenia 0.4422 144 Elatichrosis trisulcatus 0.4413 177 Coptocercus biguttatus 0.3952
112 Cinara fresai 0.4422 145 Acrossidius tasmaniae 0.4413 178 Corrhenes picta 0.3952
113 Coloradoa rufomaculata 0.4422 146 Anoplognathus rugosus 0.4413 179 Distichocera thomsonella 0.3952
114 Myzocallis castanicola 0.4422 147 Aphodius fimetarius 0.4413 180 Neostenus saudersii 0.3952
115 Neotoxoptera oliveri 0.4422 148 Aphodius granarius 0.4413 181 Obrida fascialis 0.3952
116 Stenocotis depressa 0.4422 149 Diphucephala colaspidoides 0.4413 182 Oebarina ceresioides 0.3952
117 Chaetedus longiceps 0.4422 150 Adelium similatum 0.4413 183 Pachydissus sericus 0.3952
118 Agonoscelis rutila 0.4422 151 Isopteron aversum 0.4413 184 Phoracantha tricuspis 0.3952
119 Cuspicona simplex 0.4422 152 Promethis angulata 0.4413 185 Rhagiomorpha lepturoides 0.3952
120 Notius depressus 0.4422 153 Saragus costatus 0.4413 186 Strongylurus cretifer 0.3952
121 Creiis corniculatus 0.4422 154 Myzus cerasi 0.4413 187 Tragocerus spencei 0.3952
122 Bifiditermes improbus 0.4422 155 Pulvinaria hydrangeae 0.4413 188 Uracanthus acutus 0.3952
123 Porotermes adamsoni 0.4422 156 Dictyotus conspicuus 0.4413 189 Altica corusca 0.3952
124 Teia anartoides 0.4422 157 Bathytricha truncata 0.4413 190 Altica gravida 0.3952
125 Dasypodia selenophora 0.4422 158 Dasygaster padockina 0.4413 191 Arsipoda chrysis 0.3952
126 Ephestia elutella 0.4422 159 Diarsia intermixta 0.4413 192 Augomela hypochalcea 0.3952
127 Hednota relatalis 0.4422 160 Eutrichopidia latinus 0.4413 193 Calomela ioptera 0.3952
128 Pyralis farinalis 0.4422 161 Neumichtis saliaris 0.4413 194 Cassida mera 0.3952
129 Acropolitis rudisana 0.4422 162 Phalaenoides tristifica 0.4413 195 Ditropidus concolor 0.3952
130 Grapholita molesta 0.4422 163 Ancita sparsa 0.4412 196 Lamprolina aeneipennis 0.3952
131 Oedaleus australis 0.4422 164 Stenoderus suturalis 0.4412 197 Paropsisterna beata 0.3952
132 Schizobothrus flavovittatus 0.4422 165 Conoderus australasiae 0.4412 198 Paropsisterna nigerrima 0.3952
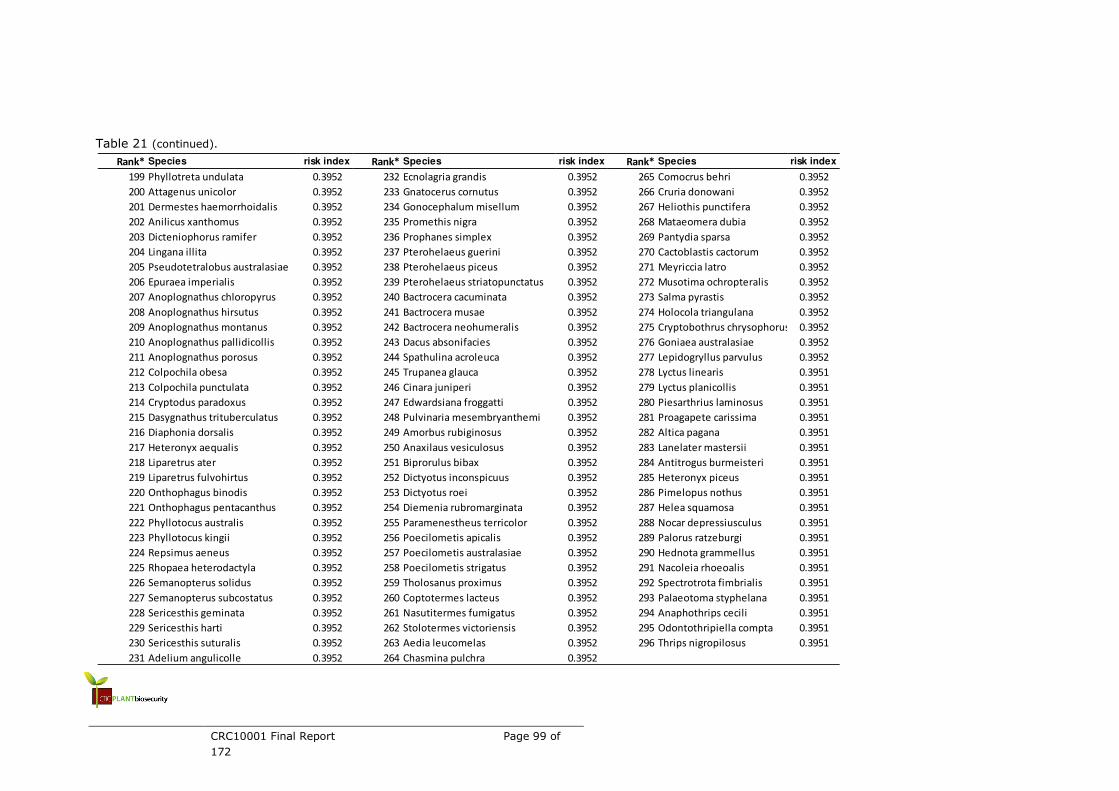
CRC10001 Final Report Page 99 of
172
Table 21 (continued).
Rank* Species risk index Rank* Species risk index Rank* Species risk index
199 Phyllotreta undulata 0.3952 232 Ecnolagria grandis 0.3952 265 Comocrus behri 0.3952
200 Attagenus unicolor 0.3952 233 Gnatocerus cornutus 0.3952 266 Cruria donowani 0.3952
201 Dermestes haemorrhoidalis 0.3952 234 Gonocephalum misellum 0.3952 267 Heliothis punctifera 0.3952
202 Anilicus xanthomus 0.3952 235 Promethis nigra 0.3952 268 Mataeomera dubia 0.3952
203 Dicteniophorus ramifer 0.3952 236 Prophanes simplex 0.3952 269 Pantydia sparsa 0.3952
204 Lingana illita 0.3952 237 Pterohelaeus guerini 0.3952 270 Cactoblastis cactorum 0.3952
205 Pseudotetralobus australasiae 0.3952 238 Pterohelaeus piceus 0.3952 271 Meyriccia latro 0.3952
206 Epuraea imperialis 0.3952 239 Pterohelaeus striatopunctatus 0.3952 272 Musotima ochropteralis 0.3952
207 Anoplognathus chloropyrus 0.3952 240 Bactrocera cacuminata 0.3952 273 Salma pyrastis 0.3952
208 Anoplognathus hirsutus 0.3952 241 Bactrocera musae 0.3952 274 Holocola triangulana 0.3952
209 Anoplognathus montanus 0.3952 242 Bactrocera neohumeralis 0.3952 275 Cryptobothrus chrysophorus 0.3952
210 Anoplognathus pallidicollis 0.3952 243 Dacus absonifacies 0.3952 276 Goniaea australasiae 0.3952
211 Anoplognathus porosus 0.3952 244 Spathulina acroleuca 0.3952 277 Lepidogryllus parvulus 0.3952
212 Colpochila obesa 0.3952 245 Trupanea glauca 0.3952 278 Lyctus linearis 0.3951
213 Colpochila punctulata 0.3952 246 Cinara juniperi 0.3952 279 Lyctus planicollis 0.3951
214 Cryptodus paradoxus 0.3952 247 Edwardsiana froggatti 0.3952 280 Piesarthrius laminosus 0.3951
215 Dasygnathus trituberculatus 0.3952 248 Pulvinaria mesembryanthemi 0.3952 281 Proagapete carissima 0.3951
216 Diaphonia dorsalis 0.3952 249 Amorbus rubiginosus 0.3952 282 Altica pagana 0.3951
217 Heteronyx aequalis 0.3952 250 Anaxilaus vesiculosus 0.3952 283 Lanelater mastersii 0.3951
218 Liparetrus ater 0.3952 251 Biprorulus bibax 0.3952 284 Antitrogus burmeisteri 0.3951
219 Liparetrus fulvohirtus 0.3952 252 Dictyotus inconspicuus 0.3952 285 Heteronyx piceus 0.3951
220 Onthophagus binodis 0.3952 253 Dictyotus roei 0.3952 286 Pimelopus nothus 0.3951
221 Onthophagus pentacanthus 0.3952 254 Diemenia rubromarginata 0.3952 287 Helea squamosa 0.3951
222 Phyllotocus australis 0.3952 255 Paramenestheus terricolor 0.3952 288 Nocar depressiusculus 0.3951
223 Phyllotocus kingii 0.3952 256 Poecilometis apicalis 0.3952 289 Palorus ratzeburgi 0.3951
224 Repsimus aeneus 0.3952 257 Poecilometis australasiae 0.3952 290 Hednota grammellus 0.3951
225 Rhopaea heterodactyla 0.3952 258 Poecilometis strigatus 0.3952 291 Nacoleia rhoeoalis 0.3951
226 Semanopterus solidus 0.3952 259 Tholosanus proximus 0.3952 292 Spectrotrota fimbrialis 0.3951
227 Semanopterus subcostatus 0.3952 260 Coptotermes lacteus 0.3952 293 Palaeotoma styphelana 0.3951
228 Sericesthis geminata 0.3952 261 Nasutitermes fumigatus 0.3952 294 Anaphothrips cecili 0.3951
229 Sericesthis harti 0.3952 262 Stolotermes victoriensis 0.3952 295 Odontothripiella compta 0.3951
230 Sericesthis suturalis 0.3952 263 Aedia leucomelas 0.3952 296 Thrips nigropilosus 0.3951
231 Adelium angulicolle 0.3952 264 Chasmina pulchra 0.3952
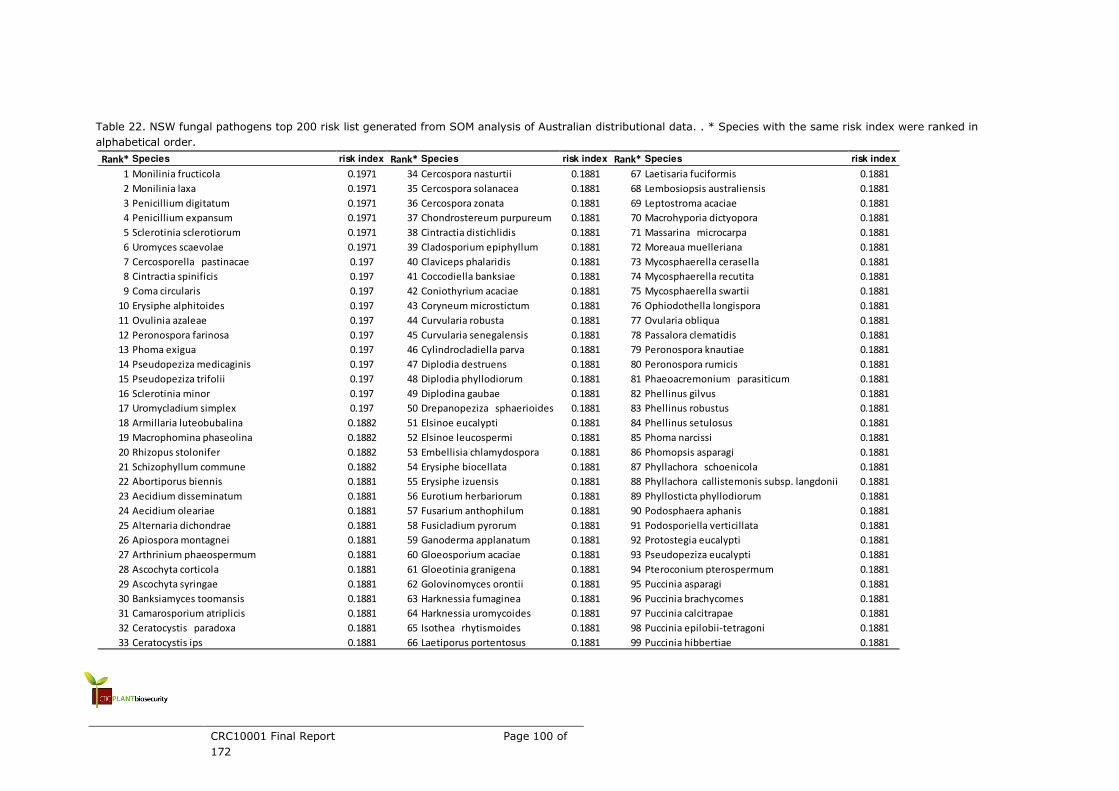
CRC10001 Final Report Page 100 of
172
Table 22. NSW fungal pathogens top 200 risk list generated from SOM analysis of Australian distributional data. . * Species with the same risk index were ranked in
alphabetical order.
Rank* Species risk index Rank* Species risk index Rank* Species risk index
1 Monilinia fructicola 0.1971 34 Cercospora nasturtii 0.1881 67 Laetisaria fuciformis 0.1881
2 Monilinia laxa 0.1971 35 Cercospora solanacea 0.1881 68 Lembosiopsis australiensis 0.1881
3 Penicillium digitatum 0.1971 36 Cercospora zonata 0.1881 69 Leptostroma acaciae 0.1881
4 Penicillium expansum 0.1971 37 Chondrostereum purpureum 0.1881 70 Macrohyporia dictyopora 0.1881
5 Sclerotinia sclerotiorum 0.1971 38 Cintractia distichlidis 0.1881 71 Massarina microcarpa 0.1881
6 Uromyces scaevolae 0.1971 39 Cladosporium epiphyllum 0.1881 72 Moreaua muelleriana 0.1881
7 Cercosporella pastinacae 0.197 40 Claviceps phalaridis 0.1881 73 Mycosphaerella cerasella 0.1881
8 Cintractia spinificis 0.197 41 Coccodiella banksiae 0.1881 74 Mycosphaerella recutita 0.1881
9 Coma circularis 0.197 42 Coniothyrium acaciae 0.1881 75 Mycosphaerella swartii 0.1881
10 Erysiphe alphitoides 0.197 43 Coryneum microstictum 0.1881 76 Ophiodothella longispora 0.1881
11 Ovulinia azaleae 0.197 44 Curvularia robusta 0.1881 77 Ovularia obliqua 0.1881
12 Peronospora farinosa 0.197 45 Curvularia senegalensis 0.1881 78 Passalora clematidis 0.1881
13 Phoma exigua 0.197 46 Cylindrocladiella parva 0.1881 79 Peronospora knautiae 0.1881
14 Pseudopeziza medicaginis 0.197 47 Diplodia destruens 0.1881 80 Peronospora rumicis 0.1881
15 Pseudopeziza trifolii 0.197 48 Diplodia phyllodiorum 0.1881 81 Phaeoacremonium parasiticum 0.1881
16 Sclerotinia minor 0.197 49 Diplodina gaubae 0.1881 82 Phellinus gilvus 0.1881
17 Uromycladium simplex 0.197 50 Drepanopeziza sphaerioides 0.1881 83 Phellinus robustus 0.1881
18 Armillaria luteobubalina 0.1882 51 Elsinoe eucalypti 0.1881 84 Phellinus setulosus 0.1881
19 Macrophomina phaseolina 0.1882 52 Elsinoe leucospermi 0.1881 85 Phoma narcissi 0.1881
20 Rhizopus stolonifer 0.1882 53 Embellisia chlamydospora 0.1881 86 Phomopsis asparagi 0.1881
21 Schizophyllum commune 0.1882 54 Erysiphe biocellata 0.1881 87 Phyllachora schoenicola 0.1881
22 Abortiporus biennis 0.1881 55 Erysiphe izuensis 0.1881 88 Phyllachora callistemonis subsp. langdonii 0.1881
23 Aecidium disseminatum 0.1881 56 Eurotium herbariorum 0.1881 89 Phyllosticta phyllodiorum 0.1881
24 Aecidium oleariae 0.1881 57 Fusarium anthophilum 0.1881 90 Podosphaera aphanis 0.1881
25 Alternaria dichondrae 0.1881 58 Fusicladium pyrorum 0.1881 91 Podosporiella verticillata 0.1881
26 Apiospora montagnei 0.1881 59 Ganoderma applanatum 0.1881 92 Protostegia eucalypti 0.1881
27 Arthrinium phaeospermum 0.1881 60 Gloeosporium acaciae 0.1881 93 Pseudopeziza eucalypti 0.1881
28 Ascochyta corticola 0.1881 61 Gloeotinia granigena 0.1881 94 Pteroconium pterospermum 0.1881
29 Ascochyta syringae 0.1881 62 Golovinomyces orontii 0.1881 95 Puccinia asparagi 0.1881
30 Banksiamyces toomansis 0.1881 63 Harknessia fumaginea 0.1881 96 Puccinia brachycomes 0.1881
31 Camarosporium atriplicis 0.1881 64 Harknessia uromycoides 0.1881 97 Puccinia calcitrapae 0.1881
32 Ceratocystis paradoxa 0.1881 65 Isothea rhytismoides 0.1881 98 Puccinia epilobii-tetragoni 0.1881
33 Ceratocystis ips 0.1881 66 Laetiporus portentosus 0.1881 99 Puccinia hibbertiae 0.1881
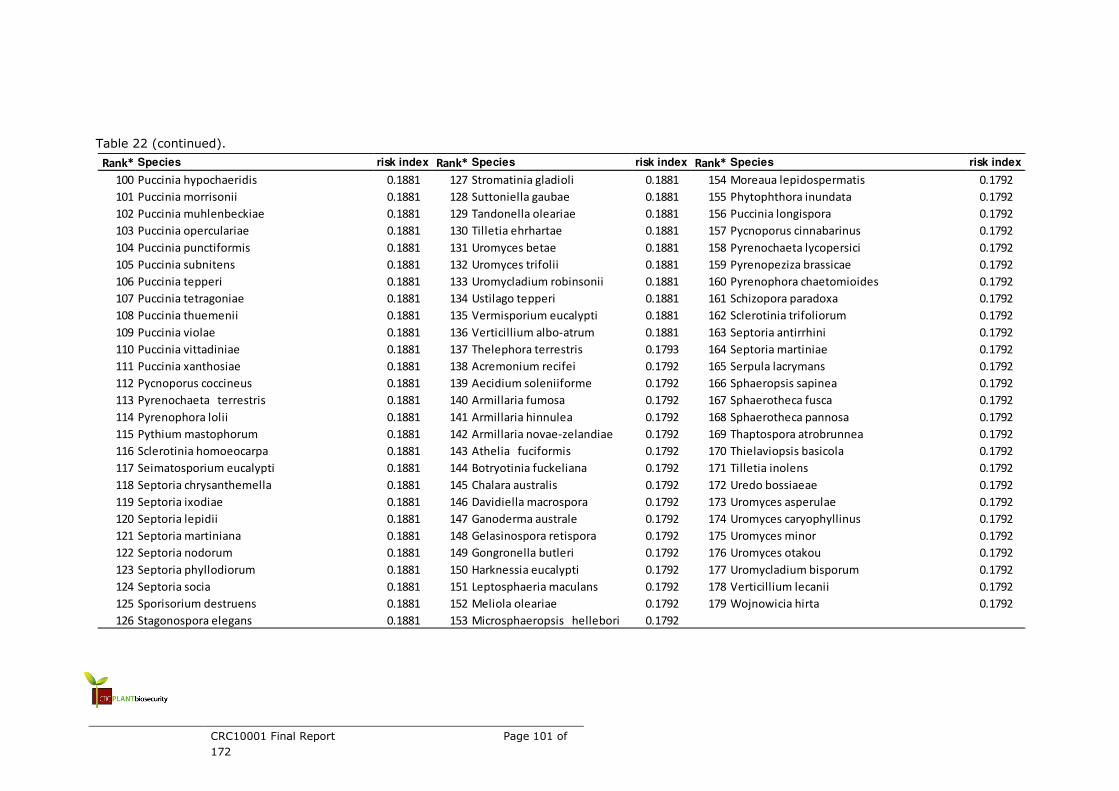
CRC10001 Final Report Page 101 of
172
Table 22 (continued).
Rank* Species risk index Rank* Species risk index Rank* Species risk index
100 Puccinia hypochaeridis 0.1881 127 Stromatinia gladioli 0.1881 154 Moreaua lepidospermatis 0.1792
101 Puccinia morrisonii 0.1881 128 Suttoniella gaubae 0.1881 155 Phytophthora inundata 0.1792
102 Puccinia muhlenbeckiae 0.1881 129 Tandonella oleariae 0.1881 156 Puccinia longispora 0.1792
103 Puccinia operculariae 0.1881 130 Tilletia ehrhartae 0.1881 157 Pycnoporus cinnabarinus 0.1792
104 Puccinia punctiformis 0.1881 131 Uromyces betae 0.1881 158 Pyrenochaeta lycopersici 0.1792
105 Puccinia subnitens 0.1881 132 Uromyces trifolii 0.1881 159 Pyrenopeziza brassicae 0.1792
106 Puccinia tepperi 0.1881 133 Uromycladium robinsonii 0.1881 160 Pyrenophora chaetomioides 0.1792
107 Puccinia tetragoniae 0.1881 134 Ustilago tepperi 0.1881 161 Schizopora paradoxa 0.1792
108 Puccinia thuemenii 0.1881 135 Vermisporium eucalypti 0.1881 162 Sclerotinia trifoliorum 0.1792
109 Puccinia violae 0.1881 136 Verticillium albo-atrum 0.1881 163 Septoria antirrhini 0.1792
110 Puccinia vittadiniae 0.1881 137 Thelephora terrestris 0.1793 164 Septoria martiniae 0.1792
111 Puccinia xanthosiae 0.1881 138 Acremonium recifei 0.1792 165 Serpula lacrymans 0.1792
112 Pycnoporus coccineus 0.1881 139 Aecidium soleniiforme 0.1792 166 Sphaeropsis sapinea 0.1792
113 Pyrenochaeta terrestris 0.1881 140 Armillaria fumosa 0.1792 167 Sphaerotheca fusca 0.1792
114 Pyrenophora lolii 0.1881 141 Armillaria hinnulea 0.1792 168 Sphaerotheca pannosa 0.1792
115 Pythium mastophorum 0.1881 142 Armillaria novae-zelandiae 0.1792 169 Thaptospora atrobrunnea 0.1792
116 Sclerotinia homoeocarpa 0.1881 143 Athelia fuciformis 0.1792 170 Thielaviopsis basicola 0.1792
117 Seimatosporium eucalypti 0.1881 144 Botryotinia fuckeliana 0.1792 171 Tilletia inolens 0.1792
118 Septoria chrysanthemella 0.1881 145 Chalara australis 0.1792 172 Uredo bossiaeae 0.1792
119 Septoria ixodiae 0.1881 146 Davidiella macrospora 0.1792 173 Uromyces asperulae 0.1792
120 Septoria lepidii 0.1881 147 Ganoderma australe 0.1792 174 Uromyces caryophyllinus 0.1792
121 Septoria martiniana 0.1881 148 Gelasinospora retispora 0.1792 175 Uromyces minor 0.1792
122 Septoria nodorum 0.1881 149 Gongronella butleri 0.1792 176 Uromyces otakou 0.1792
123 Septoria phyllodiorum 0.1881 150 Harknessia eucalypti 0.1792 177 Uromycladium bisporum 0.1792
124 Septoria socia 0.1881 151 Leptosphaeria maculans 0.1792 178 Verticillium lecanii 0.1792
125 Sporisorium destruens 0.1881 152 Meliola oleariae 0.1792 179 Wojnowicia hirta 0.1792
126 Stagonospora elegans 0.1881 153 Microsphaeropsis hellebori 0.1792
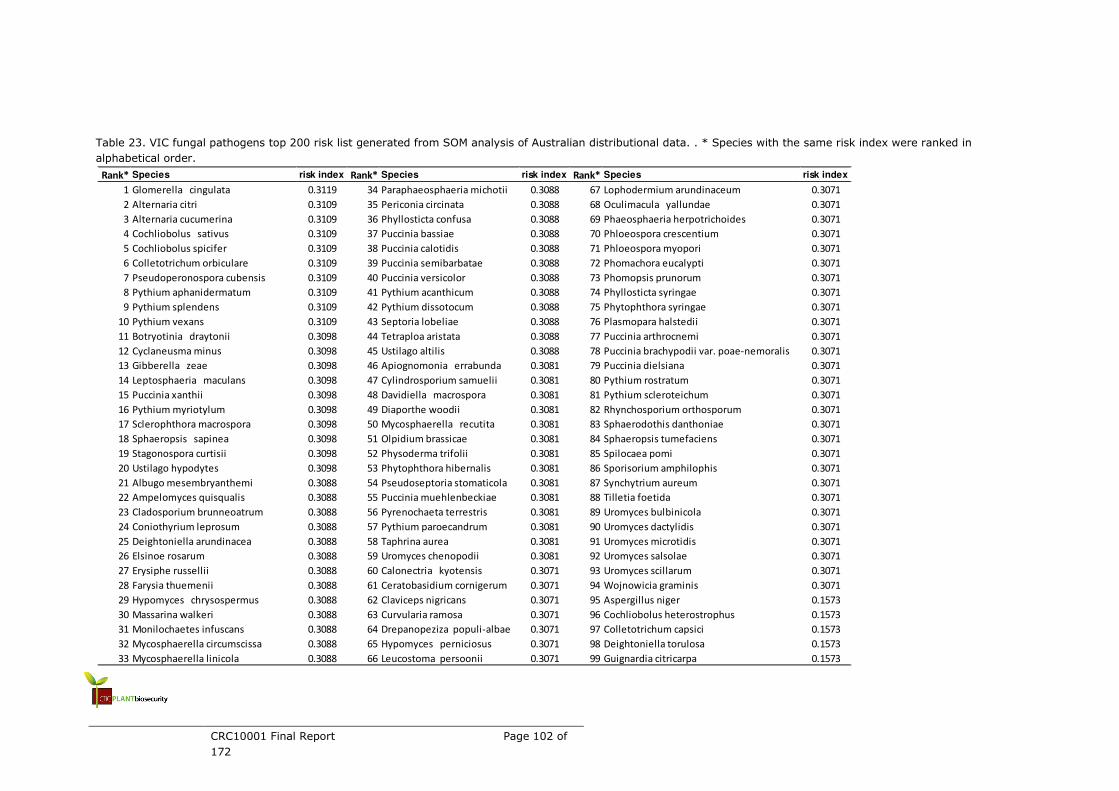
CRC10001 Final Report Page 102 of
172
Table 23. VIC fungal pathogens top 200 risk list generated from SOM analysis of Australian distributional data. . * Species with the same risk index were ranked in
alphabetical order.
Rank* Species risk index Rank* Species risk index Rank* Species risk index
1 Glomerella cingulata 0.3119 34 Paraphaeosphaeria michotii 0.3088 67 Lophodermium arundinaceum 0.3071
2 Alternaria citri 0.3109 35 Periconia circinata 0.3088 68 Oculimacula yallundae 0.3071
3 Alternaria cucumerina 0.3109 36 Phyllosticta confusa 0.3088 69 Phaeosphaeria herpotrichoides 0.3071
4 Cochliobolus sativus 0.3109 37 Puccinia bassiae 0.3088 70 Phloeospora crescentium 0.3071
5 Cochliobolus spicifer 0.3109 38 Puccinia calotidis 0.3088 71 Phloeospora myopori 0.3071
6 Colletotrichum orbiculare 0.3109 39 Puccinia semibarbatae 0.3088 72 Phomachora eucalypti 0.3071
7 Pseudoperonospora cubensis 0.3109 40 Puccinia versicolor 0.3088 73 Phomopsis prunorum 0.3071
8 Pythium aphanidermatum 0.3109 41 Pythium acanthicum 0.3088 74 Phyllosticta syringae 0.3071
9 Pythium splendens 0.3109 42 Pythium dissotocum 0.3088 75 Phytophthora syringae 0.3071
10 Pythium vexans 0.3109 43 Septoria lobeliae 0.3088 76 Plasmopara halstedii 0.3071
11 Botryotinia draytonii 0.3098 44 Tetraploa aristata 0.3088 77 Puccinia arthrocnemi 0.3071
12 Cyclaneusma minus 0.3098 45 Ustilago altilis 0.3088 78 Puccinia brachypodii var. poae-nemoralis 0.3071
13 Gibberella zeae 0.3098 46 Apiognomonia errabunda 0.3081 79 Puccinia dielsiana 0.3071
14 Leptosphaeria maculans 0.3098 47 Cylindrosporium samuelii 0.3081 80 Pythium rostratum 0.3071
15 Puccinia xanthii 0.3098 48 Davidiella macrospora 0.3081 81 Pythium scleroteichum 0.3071
16 Pythium myriotylum 0.3098 49 Diaporthe woodii 0.3081 82 Rhynchosporium orthosporum 0.3071
17 Sclerophthora macrospora 0.3098 50 Mycosphaerella recutita 0.3081 83 Sphaerodothis danthoniae 0.3071
18 Sphaeropsis sapinea 0.3098 51 Olpidium brassicae 0.3081 84 Sphaeropsis tumefaciens 0.3071
19 Stagonospora curtisii 0.3098 52 Physoderma trifolii 0.3081 85 Spilocaea pomi 0.3071
20 Ustilago hypodytes 0.3098 53 Phytophthora hibernalis 0.3081 86 Sporisorium amphilophis 0.3071
21 Albugo mesembryanthemi 0.3088 54 Pseudoseptoria stomaticola 0.3081 87 Synchytrium aureum 0.3071
22 Ampelomyces quisqualis 0.3088 55 Puccinia muehlenbeckiae 0.3081 88 Tilletia foetida 0.3071
23 Cladosporium brunneoatrum 0.3088 56 Pyrenochaeta terrestris 0.3081 89 Uromyces bulbinicola 0.3071
24 Coniothyrium leprosum 0.3088 57 Pythium paroecandrum 0.3081 90 Uromyces dactylidis 0.3071
25 Deightoniella arundinacea 0.3088 58 Taphrina aurea 0.3081 91 Uromyces microtidis 0.3071
26 Elsinoe rosarum 0.3088 59 Uromyces chenopodii 0.3081 92 Uromyces salsolae 0.3071
27 Erysiphe russellii 0.3088 60 Calonectria kyotensis 0.3071 93 Uromyces scillarum 0.3071
28 Farysia thuemenii 0.3088 61 Ceratobasidium cornigerum 0.3071 94 Wojnowicia graminis 0.3071
29 Hypomyces chrysospermus 0.3088 62 Claviceps nigricans 0.3071 95 Aspergillus niger 0.1573
30 Massarina walkeri 0.3088 63 Curvularia ramosa 0.3071 96 Cochliobolus heterostrophus 0.1573
31 Monilochaetes infuscans 0.3088 64 Drepanopeziza populi-albae 0.3071 97 Colletotrichum capsici 0.1573
32 Mycosphaerella circumscissa 0.3088 65 Hypomyces perniciosus 0.3071 98 Deightoniella torulosa 0.1573
33 Mycosphaerella linicola 0.3088 66 Leucostoma persoonii 0.3071 99 Guignardia citricarpa 0.1573
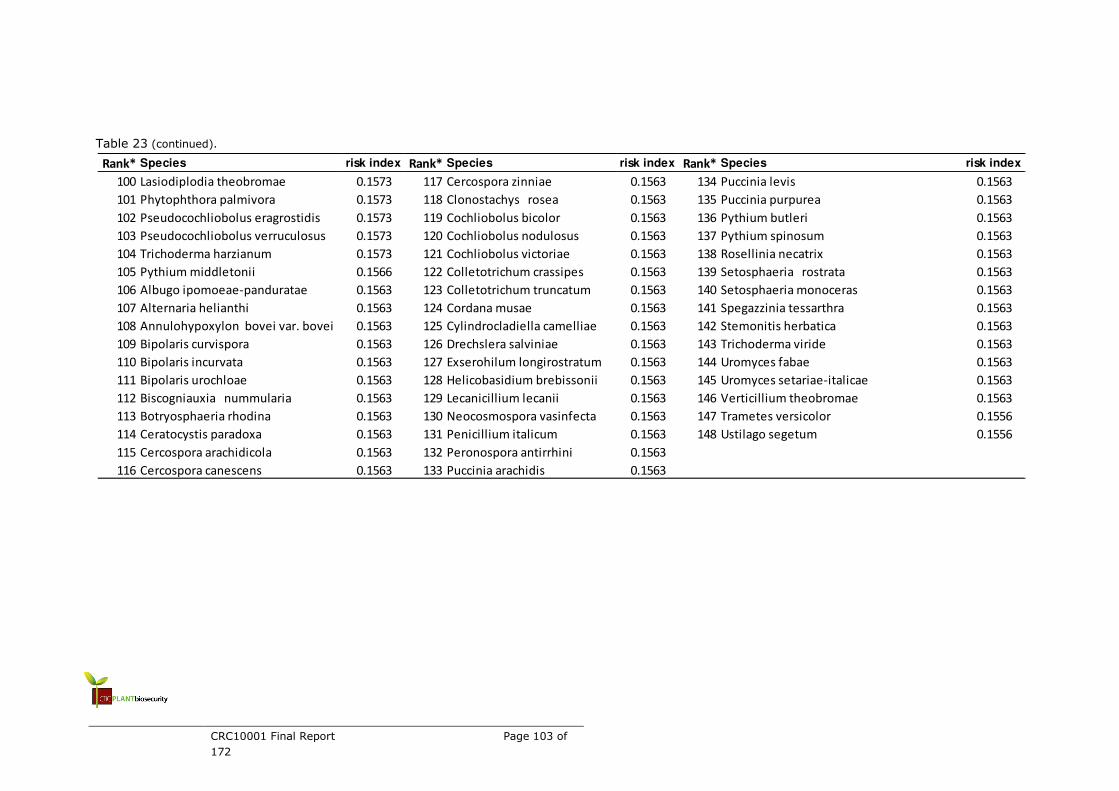
CRC10001 Final Report Page 103 of
172
Table 23 (continued).
Rank* Species risk index Rank* Species risk index Rank* Species risk index
100 Lasiodiplodia theobromae 0.1573 117 Cercospora zinniae 0.1563 134 Puccinia levis 0.1563
101 Phytophthora palmivora 0.1573 118 Clonostachys rosea 0.1563 135 Puccinia purpurea 0.1563
102 Pseudocochliobolus eragrostidis 0.1573 119 Cochliobolus bicolor 0.1563 136 Pythium butleri 0.1563
103 Pseudocochliobolus verruculosus 0.1573 120 Cochliobolus nodulosus 0.1563 137 Pythium spinosum 0.1563
104 Trichoderma harzianum 0.1573 121 Cochliobolus victoriae 0.1563 138 Rosellinia necatrix 0.1563
105 Pythium middletonii 0.1566 122 Colletotrichum crassipes 0.1563 139 Setosphaeria rostrata 0.1563
106 Albugo ipomoeae-panduratae 0.1563 123 Colletotrichum truncatum 0.1563 140 Setosphaeria monoceras 0.1563
107 Alternaria helianthi 0.1563 124 Cordana musae 0.1563 141 Spegazzinia tessarthra 0.1563
108 Annulohypoxylon bovei var. bovei 0.1563 125 Cylindrocladiella camelliae 0.1563 142 Stemonitis herbatica 0.1563
109 Bipolaris curvispora 0.1563 126 Drechslera salviniae 0.1563 143 Trichoderma viride 0.1563
110 Bipolaris incurvata 0.1563 127 Exserohilum longirostratum 0.1563 144 Uromyces fabae 0.1563
111 Bipolaris urochloae 0.1563 128 Helicobasidium brebissonii 0.1563 145 Uromyces setariae-italicae 0.1563
112 Biscogniauxia nummularia 0.1563 129 Lecanicillium lecanii 0.1563 146 Verticillium theobromae 0.1563
113 Botryosphaeria rhodina 0.1563 130 Neocosmospora vasinfecta 0.1563 147 Trametes versicolor 0.1556
114 Ceratocystis paradoxa 0.1563 131 Penicillium italicum 0.1563 148 Ustilago segetum 0.1556
115 Cercospora arachidicola 0.1563 132 Peronospora antirrhini 0.1563
116 Cercospora canescens 0.1563 133 Puccinia arachidis 0.1563

CRC10001 Final Report Page 104 of
172
Table 24. TAS fungal pathogens top 200 risk list generated from SOM analysis of Australian distributional data. . * Species with the same risk index were ranked in
alphabetical order.
Rank* Species risk index Rank* Species risk index Rank* Species risk index
1 Didymella bryoniae 0.6843 34 Pestalotiopsis mangiferae 0.6315 67 Chondrostereum purpureum 0.359
2 Elsinoe ampelina 0.6843 35 Pycnoporus sanguineus 0.6315 68 Drechslera campanulata 0.359
3 Khuskia oryzae 0.6843 36 Alternaria porri 0.3685 69 Ganoderma applanatum 0.359
4 Leptosphaeria sacchari 0.6843 37 Asterina baileyi 0.3685 70 Gibberella baccata 0.359
5 Puccinia helianthi 0.6843 38 Botrytis allii 0.3685 71 Melampsoridium betulinum 0.359
6 Uromyces dianthi 0.6843 39 Ceratocystis fimbriata 0.3685 72 Phellinus gilvus 0.359
7 Alternaria citri 0.6838 40 Cochliobolus cynodontis 0.3685 73 Phellinus robustus 0.359
8 Alternaria cucumerina 0.6838 41 Colletotrichum coccodes 0.3685 74 Phellinus setulosus 0.359
9 Aspergillus niger 0.6838 42 Coniothyrium olivaceum 0.3685 75 Phoma medicaginis 0.359
10 Cochliobolus spicifer 0.6838 43 Davidiella dianthi 0.3685 76 Pycnoporus coccineus 0.359
11 Pseudoperonospora cubensis 0.6838 44 Erysiphe necator 0.3685 77 Sphaerotheca fuliginea 0.359
12 Pythium aphanidermatum 0.6838 45 Fusarium proliferatum 0.3685 78 Aecidium myopori 0.3585
13 Pythium vexans 0.6838 46 Gibberella fujikuroi 0.3685 79 Curvularia inaequalis 0.3585
14 Thanatephorus cucumeris 0.6747 47 Glomerella graminicola 0.3685 80 Diaporthe woodii 0.3585
15 Cochliobolus hawaiiensis 0.6415 48 Leveillula taurica 0.3685 81 Phytophthora hibernalis 0.3585
16 Cochliobolus lunatus 0.6415 49 Myrothecium roridum 0.3685 82 Pyrenochaeta terrestris 0.3585
17 Fusarium chlamydosporum 0.6415 50 Pestalotiopsis guepinii 0.3685 83 Pythium intermedium 0.3585
18 Moesziomyces bullatus 0.6415 51 Phoma pomorum var. pomorum 0.3685 84 Pythium paroecandrum 0.3585
19 Phakopsora pachyrhizi 0.6415 52 Phomopsis obscurans 0.3685 85 Uromyces chenopodii 0.3585
20 Alternaria padwickii 0.641 53 Phytophthora megasperma 0.3685 86 Alternaria longissima 0.3258
21 Aspergillus flavus 0.641 54 Pleospora herbarum 0.3685 87 Alternaria tenuissima 0.3258
22 Cochliobolus heterostrophus 0.641 55 Podosphaera pannosa 0.3685 88 Alternaria zinniae 0.3258
23 Colletotrichum capsici 0.641 56 Puccinia hieracii var. hieracii 0.3685 89 Botryosphaeria ribis 0.3258
24 Deightoniella torulosa 0.641 57 Pyrenophora tritici-repentis 0.3685 90 Cercospora apii 0.3258
25 Gloeocercospora sorghi 0.641 58 Uromyces transversalis 0.3685 91 Cerotelium fici 0.3258
26 Guignardia citricarpa 0.641 59 Gibberella zeae 0.368 92 Colletotrichum musae 0.3258
27 Lasiodiplodia theobromae 0.641 60 Leptosphaeria maculans 0.368 93 Coniella castaneicola 0.3258
28 Phytophthora palmivora 0.641 61 Penicillium italicum 0.368 94 Corynespora cassiicola 0.3258
29 Pseudocochliobolus eragrostidis 0.641 62 Puccinia xanthii 0.368 95 Epicoccum nigrum 0.3258
30 Pseudocochliobolus verruculosus 0.641 63 Pythium myriotylum 0.368 96 Fusarium anthophilum 0.3258
31 Trichoderma harzianum 0.641 64 Sclerophthora macrospora 0.368 97 Fusarium compactum 0.3258
32 Thelephora terrestris 0.632 65 Sphaeropsis sapinea 0.368 98 Fusarium poae 0.3258
33 Ganoderma lucidum 0.6315 66 Ustilago hypodytes 0.368 99 Fusarium sporotrichioides 0.3258

CRC10001 Final Report Page 105 of
172
Table 24 (continued).
Rank* Species risk index Rank* Species risk index Rank* Species risk index
100 Fusarium subglutinans 0.3258 133 Cochliobolus miyabeanus 0.3253 166 Puccinia arachidis 0.3253
101 Gliocladium vermoesenii 0.3258 134 Cochliobolus nodulosus 0.3253 167 Puccinia fuirenicola 0.3253
102 Lewia infectoria 0.3258 135 Cochliobolus perotidis 0.3253 168 Puccinia levis 0.3253
103 Mycosphaerella berkeleyi 0.3258 136 Cochliobolus victoriae 0.3253 169 Puccinia liberta 0.3253
104 Pestalotiopsis palmarum 0.3258 137 Colletotrichum crassipes 0.3253 170 Puccinia nakanishikii 0.3253
105 Pithomyces chartarum 0.3258 138 Colletotrichum truncatum 0.3253 171 Puccinia polysora 0.3253
106 Pseudocochliobolus pallescens 0.3258 139 Coniella musaiaensis 0.3253 172 Puccinia purpurea 0.3253
107 Puccinia oahuensis 0.3258 140 Cordana musae 0.3253 173 Puccinia roseana 0.3253
108 Pythium sulcatum 0.3258 141 Curvularia fallax 0.3253 174 Pythium butleri 0.3253
109 Quambalaria pitereka 0.3258 142 Curvularia intermedia 0.3253 175 Pythium deliense 0.3253
110 Ramularia pitereka 0.3258 143 Cylindrocladiella camelliae 0.3253 176 Pythium spinosum 0.3253
111 Ulocladium atrum 0.3258 144 Daldinia eschscholzii 0.3253 177 Rigidoporus vinctus 0.3253
112 Aecidium crini 0.3253 145 Drechslera salviniae 0.3253 178 Rosellinia necatrix 0.3253
113 Albugo ipomoeae-aquaticae 0.3253 146 Eballistra oryzae 0.3253 179 Setosphaeria rostrata 0.3253
114 Albugo ipomoeae-panduratae 0.3253 147 Exserohilum longirostratum 0.3253 180 Setosphaeria monoceras 0.3253
115 Alternaria helianthi 0.3253 148 Fusarium oxysporum f.sp. niveum 0.3253 181 Sorosporium anthisteriae 0.3253
116 Aspergillus fumigatus 0.3253 149 Helicobasidium brebissonii 0.3253 182 Spegazzinia tessarthra 0.3253
117 Bipolaris curvispora 0.3253 150 Lecanicillium lecanii 0.3253 183 Sphaerophragmium acaciae 0.3253
118 Bipolaris incurvata 0.3253 151 Leucocintractia leucoderma 0.3253 184 Stemonitis herbatica 0.3253
119 Bipolaris sorghicola 0.3253 152 Mycosphaerella cruenta 0.3253 185 Stigmina mangiferae 0.3253
120 Bipolaris urochloae 0.3253 153 Mycosphaerella henningsii 0.3253 186 Trichoderma viride 0.3253
121 Botryosphaeria rhodina 0.3253 154 Nattrassia mangiferae 0.3253 187 Uromyces clignyi 0.3253
122 Calonectria quinqueseptata 0.3253 155 Neocosmospora vasinfecta 0.3253 188 Uromyces dactyloctenii 0.3253
123 Ceratiomyxa fruticulosa 0.3253 156 Ophiodothella syzygii 0.3253 189 Uromyces fabae 0.3253
124 Ceratocystis paradoxa 0.3253 157 Pericladium grewiae 0.3253 190 Uromyces orientalis 0.3253
125 Cercospora arachidicola 0.3253 158 Peronosclerospora maydis 0.3253 191 Uromyces setariae-italicae 0.3253
126 Cercospora canescens 0.3253 159 Pestalotiopsis theae 0.3253 192 Ustilago porosa 0.3253
127 Cercospora sorghi 0.3253 160 Phakopsora gossypii 0.3253 193 Verticillium theobromae 0.3253
128 Cercospora taccae 0.3253 161 Phyllachora sacchari 0.3253 194 Acremonium recifei 0.3162
129 Cercospora zinniae 0.3253 162 Phytophthora capsici 0.3253 195 Botryosphaeria stevensii 0.3162
130 Claviceps africana 0.3253 163 Pseudocercospora bradburyae 0.3253 196 Botryotinia fuckeliana 0.3162
131 Clonostachys rosea 0.3253 164 Pseudocercospora fuligena 0.3253 197 Cephaleuros virescens 0.3162
132 Cochliobolus bicolor 0.3253 165 Pseudocercospora stahlii 0.3253 198 Davidiella macrospora 0.3162

CRC10001 Final Report Page 106 of
172
Table 24 (continued).
Rank* Species risk index Rank* Species risk index Rank* Species risk index
199 Fuligo septica var. septica 0.3162 204 Phytophthora inundata 0.3162 209 Sphaerotheca pannosa 0.3162
200 Ganoderma australe 0.3162 205 Pycnoporus cinnabarinus 0.3162 210 Thielaviopsis basicola 0.3162
201 Gibberella pulicaris 0.3162 206 Schizopora paradoxa 0.3162 211 Verticillium lecanii 0.3162
202 Gongronella butleri 0.3162 207 Sordaria fimicola 0.3162 212 Wojnowicia hirta 0.3162
203 Myrothecium verrucaria 0.3162 208 Sphaerotheca fusca 0.3162

CRC10001 Final Report Page 107 of
172
Table 25. QLD fungal pathogens top 200 risk list generated from SOM analysis of Australian distributional data. . * Species with the same risk index were ranked in
alphabetical order.
Rank* Species risk index Rank* Species risk index Rank* Species risk index
1 Rhizopus stolonifer 0.0934 34 Gibberella avenacea 0.0492 67 Diaporthe woodii 0.047
2 Schizophyllum commune 0.0934 35 Gibberella baccata 0.0492 68 Mycosphaerella recutita 0.047
3 Pythium middletonii 0.0912 36 Heteropatella antirrhini 0.0492 69 Olpidium brassicae 0.047
4 Aecidium eburneum 0.0763 37 Heterotolyposporium piluliforme 0.0492 70 Physoderma trifolii 0.047
5 Bipolaris iridis 0.0763 38 Lophodermium pinastri 0.0492 71 Phytophthora hibernalis 0.047
6 Botrytis tulipae 0.0763 39 Melampsoridium betulinum 0.0492 72 Pseudoseptoria stomaticola 0.047
7 Didymella fabae 0.0763 40 Microdochium panattonianum 0.0492 73 Puccinia muehlenbeckiae 0.047
8 Mycosphaerella pinodes 0.0763 41 Microstroma juglandis 0.0492 74 Pyrenochaeta terrestris 0.047
9 Neonectria radicicola 0.0763 42 Parodiella banksiae 0.0492 75 Pythium paroecandrum 0.047
10 Phomopsis leptostromiformis 0.0763 43 Peronospora grisea 0.0492 76 Taphrina aurea 0.047
11 Pythium echinulatum 0.0763 44 Peronospora polygoni 0.0492 77 Uromyces chenopodii 0.047
12 Pythium mamillatum 0.0763 45 Phoma medicaginis 0.0492 78 Aecidium disciforme 0.0393
13 Rhizoctonia solani 0.0763 46 Phragmidium tuberculatum 0.0492 79 Aecidium oleariae 0.0393
14 Thanatephorus cucumeris 0.0763 47 Physoderma pulposum 0.0492 80 Aecidium plantaginis-variae 0.0393
15 Armillaria luteobubalina 0.0663 48 Phytophthora citricola 0.0492 81 Apiognomonia veneta 0.0393
16 Cylindrocarpon didymum 0.0663 49 Phytophthora erythroseptica 0.0492 82 Botryosphaeria stevensii 0.0393
17 Phoma macrostoma 0.0663 50 Puccinia alyxiae 0.0492 83 Botrytis elliptica 0.0393
18 Spilocaea pyracanthae 0.0663 51 Puccinia boroniae 0.0492 84 Cephaleuros virescens 0.0393
19 Trametes versicolor 0.0641 52 Puccinia dichondrae 0.0492 85 Ceratocystis paradoxa 0.0393
20 Ustilago segetum 0.0641 53 Puccinia pulverulenta 0.0492 86 Chondrostereum purpureum 0.0393
21 Thelephora terrestris 0.0564 54 Rhynchosporium secalis 0.0492 87 Chrysomyxa ledi var. ledi 0.0393
22 Armillaria mellea 0.0542 55 Seimatosporium dilophosporum 0.0492 88 Cladosporium macrocarpum 0.0393
23 Ganoderma lucidum 0.0542 56 Spermospora avenae 0.0492 89 Colletogloeum cryptum 0.0393
24 Pestalotiopsis guepini 0.0542 57 Sphaerotheca fuliginea 0.0492 90 Cylindrocarpon obtusisporum 0.0393
25 Pestalotiopsis mangiferae 0.0542 58 Sphaerotheca mors-uvae 0.0492 91 Drepanopeziza sphaerioides 0.0393
26 Pycnoporus sanguineus 0.0542 59 Uredo rhagodiae 0.0492 92 Entorrhiza casparyana 0.0393
27 Albugo trianthemae 0.0492 60 Uredo scirpi-nodosi 0.0492 93 Fuligo septica var. septica 0.0393
28 Alternaria radicina 0.0492 61 Uromyces danthoniae 0.0492 94 Fusicladium veronicae 0.0393
29 Botrytis fabae 0.0492 62 Uromycladium maritimum 0.0492 95 Ganoderma applanatum 0.0393
30 Colletotrichum circinans 0.0492 63 Wettsteinina phyllodiorum 0.0492 96 Gibberella pulicaris 0.0393
31 Dilophospora alopecuri 0.0492 64 Apiognomonia errabunda 0.047 97 Gloeotinia granigena 0.0393
32 Drechslera campanulata 0.0492 65 Cylindrosporium samuelii 0.047 98 Glomerella miyabeana 0.0393
33 Elsinoe veneta 0.0492 66 Davidiella macrospora 0.047 99 Heteropatella valtellinensis 0.0393
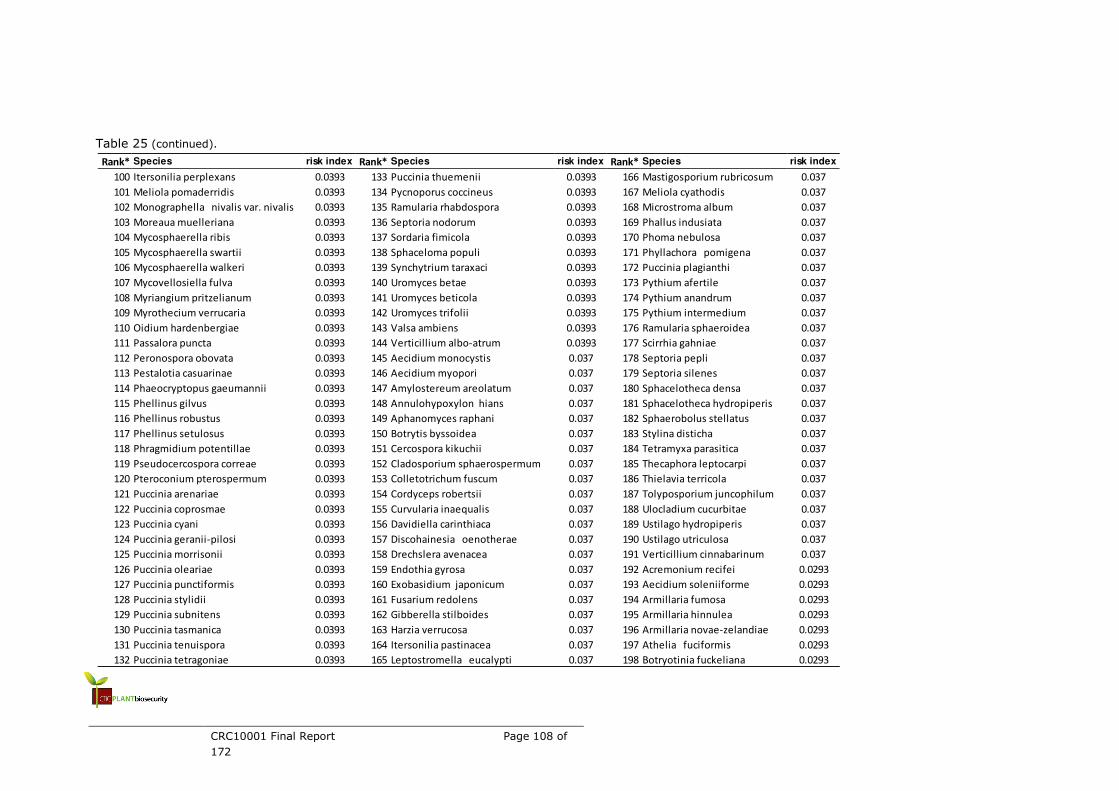
CRC10001 Final Report Page 108 of
172
Table 25 (continued).
Rank* Species risk index Rank* Species risk index Rank* Species risk index
100 Itersonilia perplexans 0.0393 133 Puccinia thuemenii 0.0393 166 Mastigosporium rubricosum 0.037
101 Meliola pomaderridis 0.0393 134 Pycnoporus coccineus 0.0393 167 Meliola cyathodis 0.037
102 Monographella nivalis var. nivalis 0.0393 135 Ramularia rhabdospora 0.0393 168 Microstroma album 0.037
103 Moreaua muelleriana 0.0393 136 Septoria nodorum 0.0393 169 Phallus indusiata 0.037
104 Mycosphaerella ribis 0.0393 137 Sordaria fimicola 0.0393 170 Phoma nebulosa 0.037
105 Mycosphaerella swartii 0.0393 138 Sphaceloma populi 0.0393 171 Phyllachora pomigena 0.037
106 Mycosphaerella walkeri 0.0393 139 Synchytrium taraxaci 0.0393 172 Puccinia plagianthi 0.037
107 Mycovellosiella fulva 0.0393 140 Uromyces betae 0.0393 173 Pythium afertile 0.037
108 Myriangium pritzelianum 0.0393 141 Uromyces beticola 0.0393 174 Pythium anandrum 0.037
109 Myrothecium verrucaria 0.0393 142 Uromyces trifolii 0.0393 175 Pythium intermedium 0.037
110 Oidium hardenbergiae 0.0393 143 Valsa ambiens 0.0393 176 Ramularia sphaeroidea 0.037
111 Passalora puncta 0.0393 144 Verticillium albo-atrum 0.0393 177 Scirrhia gahniae 0.037
112 Peronospora obovata 0.0393 145 Aecidium monocystis 0.037 178 Septoria pepli 0.037
113 Pestalotia casuarinae 0.0393 146 Aecidium myopori 0.037 179 Septoria silenes 0.037
114 Phaeocryptopus gaeumannii 0.0393 147 Amylostereum areolatum 0.037 180 Sphacelotheca densa 0.037
115 Phellinus gilvus 0.0393 148 Annulohypoxylon hians 0.037 181 Sphacelotheca hydropiperis 0.037
116 Phellinus robustus 0.0393 149 Aphanomyces raphani 0.037 182 Sphaerobolus stellatus 0.037
117 Phellinus setulosus 0.0393 150 Botrytis byssoidea 0.037 183 Stylina disticha 0.037
118 Phragmidium potentillae 0.0393 151 Cercospora kikuchii 0.037 184 Tetramyxa parasitica 0.037
119 Pseudocercospora correae 0.0393 152 Cladosporium sphaerospermum 0.037 185 Thecaphora leptocarpi 0.037
120 Pteroconium pterospermum 0.0393 153 Colletotrichum fuscum 0.037 186 Thielavia terricola 0.037
121 Puccinia arenariae 0.0393 154 Cordyceps robertsii 0.037 187 Tolyposporium juncophilum 0.037
122 Puccinia coprosmae 0.0393 155 Curvularia inaequalis 0.037 188 Ulocladium cucurbitae 0.037
123 Puccinia cyani 0.0393 156 Davidiella carinthiaca 0.037 189 Ustilago hydropiperis 0.037
124 Puccinia geranii-pilosi 0.0393 157 Discohainesia oenotherae 0.037 190 Ustilago utriculosa 0.037
125 Puccinia morrisonii 0.0393 158 Drechslera avenacea 0.037 191 Verticillium cinnabarinum 0.037
126 Puccinia oleariae 0.0393 159 Endothia gyrosa 0.037 192 Acremonium recifei 0.0293
127 Puccinia punctiformis 0.0393 160 Exobasidium japonicum 0.037 193 Aecidium soleniiforme 0.0293
128 Puccinia stylidii 0.0393 161 Fusarium redolens 0.037 194 Armillaria fumosa 0.0293
129 Puccinia subnitens 0.0393 162 Gibberella stilboides 0.037 195 Armillaria hinnulea 0.0293
130 Puccinia tasmanica 0.0393 163 Harzia verrucosa 0.037 196 Armillaria novae-zelandiae 0.0293
131 Puccinia tenuispora 0.0393 164 Itersonilia pastinacea 0.037 197 Athelia fuciformis 0.0293
132 Puccinia tetragoniae 0.0393 165 Leptostromella eucalypti 0.037 198 Botryotinia fuckeliana 0.0293

CRC10001 Final Report Page 109 of
172
Table 25 (continued).
Rank* Species risk index Rank* Species risk index Rank* Species risk index
199 Chalara australis 0.0293 211 Pycnoporus cinnabarinus 0.0293 223 Thaptospora atrobrunnea 0.0293
200 Davidiella macrospora 0.0293 212 Pyrenochaeta lycopersici 0.0293 224 Thielaviopsis basicola 0.0293
201 Ganoderma australe 0.0293 213 Pyrenopeziza brassicae 0.0293 225 Tilletia inolens 0.0293
202 Gelasinospora retispora 0.0293 214 Pyrenophora chaetomioides 0.0293 226 Uredo bossiaeae 0.0293
203 Gongronella butleri 0.0293 215 Schizopora paradoxa 0.0293 227 Uromyces asperulae 0.0293
204 Harknessia eucalypti 0.0293 216 Sclerotinia trifoliorum 0.0293 228 Uromyces caryophyllinus 0.0293
205 Leptosphaeria maculans 0.0293 217 Septoria antirrhini 0.0293 229 Uromyces minor 0.0293
206 Meliola oleariae 0.0293 218 Septoria martiniae 0.0293 230 Uromyces otakou 0.0293
207 Microsphaeropsis hellebori 0.0293 219 Serpula lacrymans 0.0293 231 Uromycladium bisporum 0.0293
208 Moreaua lepidospermatis 0.0293 220 Sphaeropsis sapinea 0.0293 232 Verticillium lecanii 0.0293
209 Phytophthora inundata 0.0293 221 Sphaerotheca fusca 0.0293 233 Wojnowicia hirta 0.0293
210 Puccinia longispora 0.0293 222 Sphaerotheca pannosa 0.0293
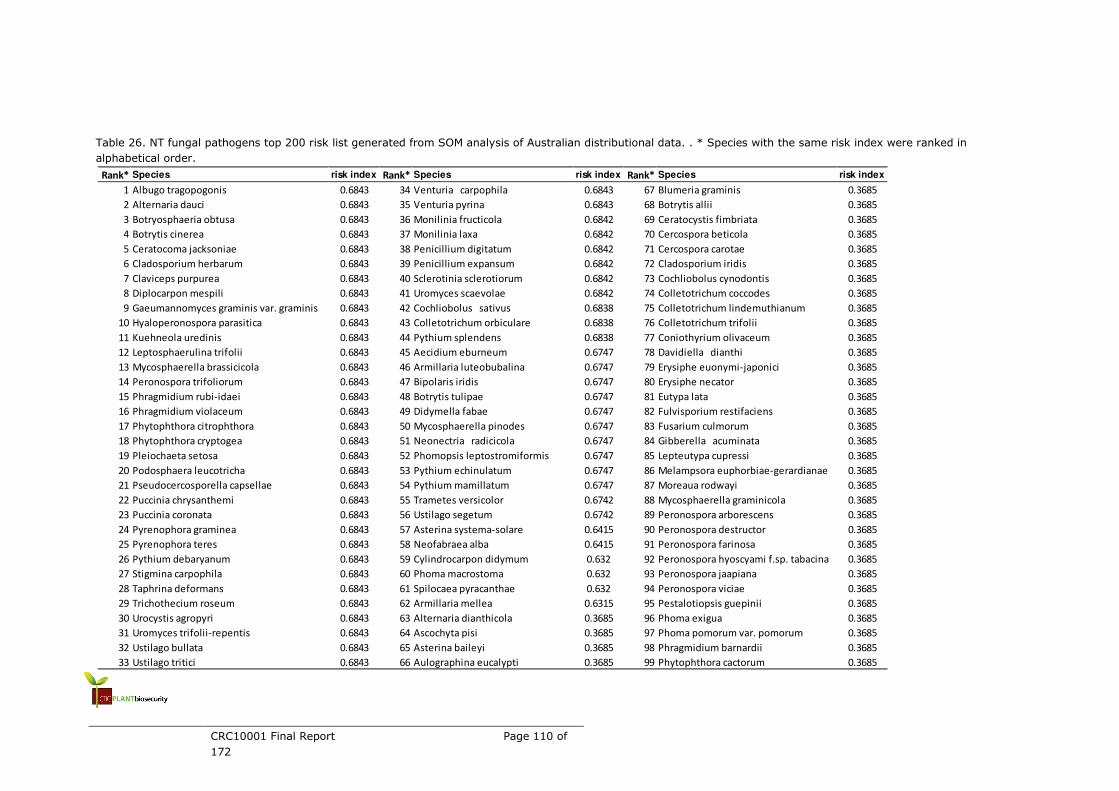
CRC10001 Final Report Page 110 of
172
Table 26. NT fungal pathogens top 200 risk list generated from SOM analysis of Australian distributional data. . * Species with the same risk index were ranked in
alphabetical order.
Rank* Species risk index Rank* Species risk index Rank* Species risk index
1 Albugo tragopogonis 0.6843 34 Venturia carpophila 0.6843 67 Blumeria graminis 0.3685
2 Alternaria dauci 0.6843 35 Venturia pyrina 0.6843 68 Botrytis allii 0.3685
3 Botryosphaeria obtusa 0.6843 36 Monilinia fructicola 0.6842 69 Ceratocystis fimbriata 0.3685
4 Botrytis cinerea 0.6843 37 Monilinia laxa 0.6842 70 Cercospora beticola 0.3685
5 Ceratocoma jacksoniae 0.6843 38 Penicillium digitatum 0.6842 71 Cercospora carotae 0.3685
6 Cladosporium herbarum 0.6843 39 Penicillium expansum 0.6842 72 Cladosporium iridis 0.3685
7 Claviceps purpurea 0.6843 40 Sclerotinia sclerotiorum 0.6842 73 Cochliobolus cynodontis 0.3685
8 Diplocarpon mespili 0.6843 41 Uromyces scaevolae 0.6842 74 Colletotrichum coccodes 0.3685
9 Gaeumannomyces graminis var. graminis 0.6843 42 Cochliobolus sativus 0.6838 75 Colletotrichum lindemuthianum 0.3685
10 Hyaloperonospora parasitica 0.6843 43 Colletotrichum orbiculare 0.6838 76 Colletotrichum trifolii 0.3685
11 Kuehneola uredinis 0.6843 44 Pythium splendens 0.6838 77 Coniothyrium olivaceum 0.3685
12 Leptosphaerulina trifolii 0.6843 45 Aecidium eburneum 0.6747 78 Davidiella dianthi 0.3685
13 Mycosphaerella brassicicola 0.6843 46 Armillaria luteobubalina 0.6747 79 Erysiphe euonymi-japonici 0.3685
14 Peronospora trifoliorum 0.6843 47 Bipolaris iridis 0.6747 80 Erysiphe necator 0.3685
15 Phragmidium rubi-idaei 0.6843 48 Botrytis tulipae 0.6747 81 Eutypa lata 0.3685
16 Phragmidium violaceum 0.6843 49 Didymella fabae 0.6747 82 Fulvisporium restifaciens 0.3685
17 Phytophthora citrophthora 0.6843 50 Mycosphaerella pinodes 0.6747 83 Fusarium culmorum 0.3685
18 Phytophthora cryptogea 0.6843 51 Neonectria radicicola 0.6747 84 Gibberella acuminata 0.3685
19 Pleiochaeta setosa 0.6843 52 Phomopsis leptostromiformis 0.6747 85 Lepteutypa cupressi 0.3685
20 Podosphaera leucotricha 0.6843 53 Pythium echinulatum 0.6747 86 Melampsora euphorbiae-gerardianae 0.3685
21 Pseudocercosporella capsellae 0.6843 54 Pythium mamillatum 0.6747 87 Moreaua rodwayi 0.3685
22 Puccinia chrysanthemi 0.6843 55 Trametes versicolor 0.6742 88 Mycosphaerella graminicola 0.3685
23 Puccinia coronata 0.6843 56 Ustilago segetum 0.6742 89 Peronospora arborescens 0.3685
24 Pyrenophora graminea 0.6843 57 Asterina systema-solare 0.6415 90 Peronospora destructor 0.3685
25 Pyrenophora teres 0.6843 58 Neofabraea alba 0.6415 91 Peronospora farinosa 0.3685
26 Pythium debaryanum 0.6843 59 Cylindrocarpon didymum 0.632 92 Peronospora hyoscyami f.sp. tabacina 0.3685
27 Stigmina carpophila 0.6843 60 Phoma macrostoma 0.632 93 Peronospora jaapiana 0.3685
28 Taphrina deformans 0.6843 61 Spilocaea pyracanthae 0.632 94 Peronospora viciae 0.3685
29 Trichothecium roseum 0.6843 62 Armillaria mellea 0.6315 95 Pestalotiopsis guepinii 0.3685
30 Urocystis agropyri 0.6843 63 Alternaria dianthicola 0.3685 96 Phoma exigua 0.3685
31 Uromyces trifolii-repentis 0.6843 64 Ascochyta pisi 0.3685 97 Phoma pomorum var. pomorum 0.3685
32 Ustilago bullata 0.6843 65 Asterina baileyi 0.3685 98 Phragmidium barnardii 0.3685
33 Ustilago tritici 0.6843 66 Aulographina eucalypti 0.3685 99 Phytophthora cactorum 0.3685
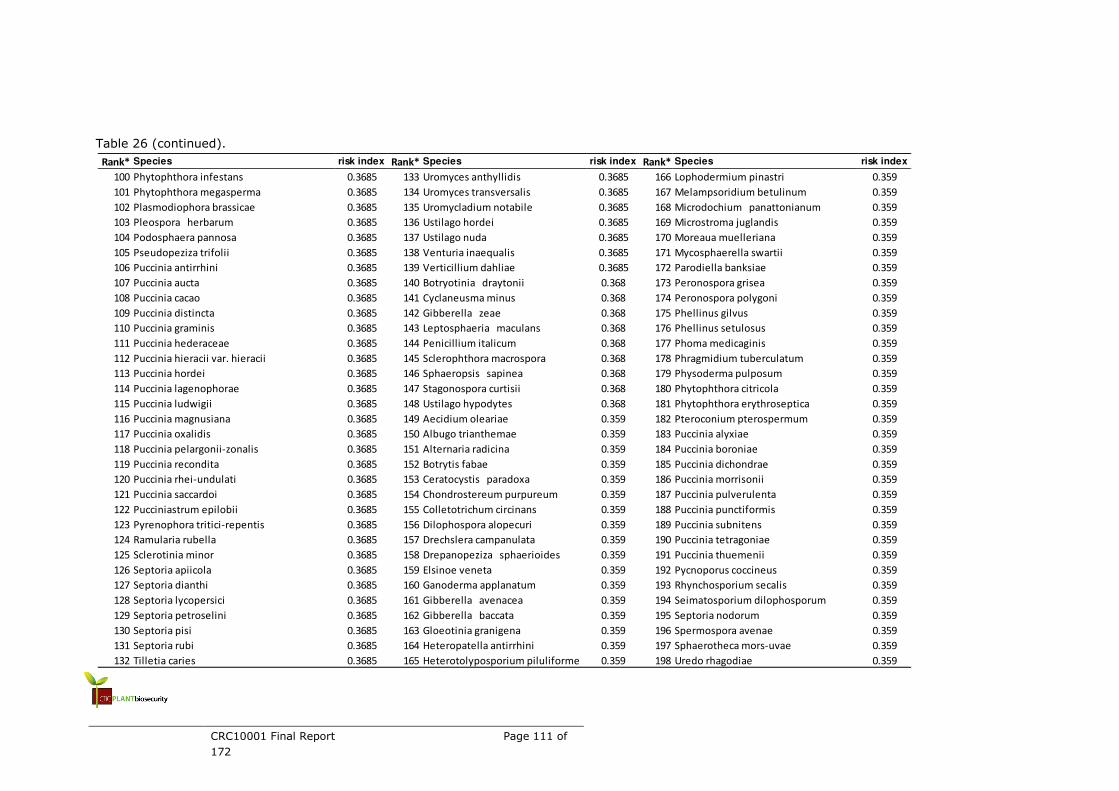
CRC10001 Final Report Page 111 of
172
Table 26 (continued).
Rank* Species risk index Rank* Species risk index Rank* Species risk index
100 Phytophthora infestans 0.3685 133 Uromyces anthyllidis 0.3685 166 Lophodermium pinastri 0.359
101 Phytophthora megasperma 0.3685 134 Uromyces transversalis 0.3685 167 Melampsoridium betulinum 0.359
102 Plasmodiophora brassicae 0.3685 135 Uromycladium notabile 0.3685 168 Microdochium panattonianum 0.359
103 Pleospora herbarum 0.3685 136 Ustilago hordei 0.3685 169 Microstroma juglandis 0.359
104 Podosphaera pannosa 0.3685 137 Ustilago nuda 0.3685 170 Moreaua muelleriana 0.359
105 Pseudopeziza trifolii 0.3685 138 Venturia inaequalis 0.3685 171 Mycosphaerella swartii 0.359
106 Puccinia antirrhini 0.3685 139 Verticillium dahliae 0.3685 172 Parodiella banksiae 0.359
107 Puccinia aucta 0.3685 140 Botryotinia draytonii 0.368 173 Peronospora grisea 0.359
108 Puccinia cacao 0.3685 141 Cyclaneusma minus 0.368 174 Peronospora polygoni 0.359
109 Puccinia distincta 0.3685 142 Gibberella zeae 0.368 175 Phellinus gilvus 0.359
110 Puccinia graminis 0.3685 143 Leptosphaeria maculans 0.368 176 Phellinus setulosus 0.359
111 Puccinia hederaceae 0.3685 144 Penicillium italicum 0.368 177 Phoma medicaginis 0.359
112 Puccinia hieracii var. hieracii 0.3685 145 Sclerophthora macrospora 0.368 178 Phragmidium tuberculatum 0.359
113 Puccinia hordei 0.3685 146 Sphaeropsis sapinea 0.368 179 Physoderma pulposum 0.359
114 Puccinia lagenophorae 0.3685 147 Stagonospora curtisii 0.368 180 Phytophthora citricola 0.359
115 Puccinia ludwigii 0.3685 148 Ustilago hypodytes 0.368 181 Phytophthora erythroseptica 0.359
116 Puccinia magnusiana 0.3685 149 Aecidium oleariae 0.359 182 Pteroconium pterospermum 0.359
117 Puccinia oxalidis 0.3685 150 Albugo trianthemae 0.359 183 Puccinia alyxiae 0.359
118 Puccinia pelargonii-zonalis 0.3685 151 Alternaria radicina 0.359 184 Puccinia boroniae 0.359
119 Puccinia recondita 0.3685 152 Botrytis fabae 0.359 185 Puccinia dichondrae 0.359
120 Puccinia rhei-undulati 0.3685 153 Ceratocystis paradoxa 0.359 186 Puccinia morrisonii 0.359
121 Puccinia saccardoi 0.3685 154 Chondrostereum purpureum 0.359 187 Puccinia pulverulenta 0.359
122 Pucciniastrum epilobii 0.3685 155 Colletotrichum circinans 0.359 188 Puccinia punctiformis 0.359
123 Pyrenophora tritici-repentis 0.3685 156 Dilophospora alopecuri 0.359 189 Puccinia subnitens 0.359
124 Ramularia rubella 0.3685 157 Drechslera campanulata 0.359 190 Puccinia tetragoniae 0.359
125 Sclerotinia minor 0.3685 158 Drepanopeziza sphaerioides 0.359 191 Puccinia thuemenii 0.359
126 Septoria apiicola 0.3685 159 Elsinoe veneta 0.359 192 Pycnoporus coccineus 0.359
127 Septoria dianthi 0.3685 160 Ganoderma applanatum 0.359 193 Rhynchosporium secalis 0.359
128 Septoria lycopersici 0.3685 161 Gibberella avenacea 0.359 194 Seimatosporium dilophosporum 0.359
129 Septoria petroselini 0.3685 162 Gibberella baccata 0.359 195 Septoria nodorum 0.359
130 Septoria pisi 0.3685 163 Gloeotinia granigena 0.359 196 Spermospora avenae 0.359
131 Septoria rubi 0.3685 164 Heteropatella antirrhini 0.359 197 Sphaerotheca mors-uvae 0.359
132 Tilletia caries 0.3685 165 Heterotolyposporium piluliforme 0.359 198 Uredo rhagodiae 0.359
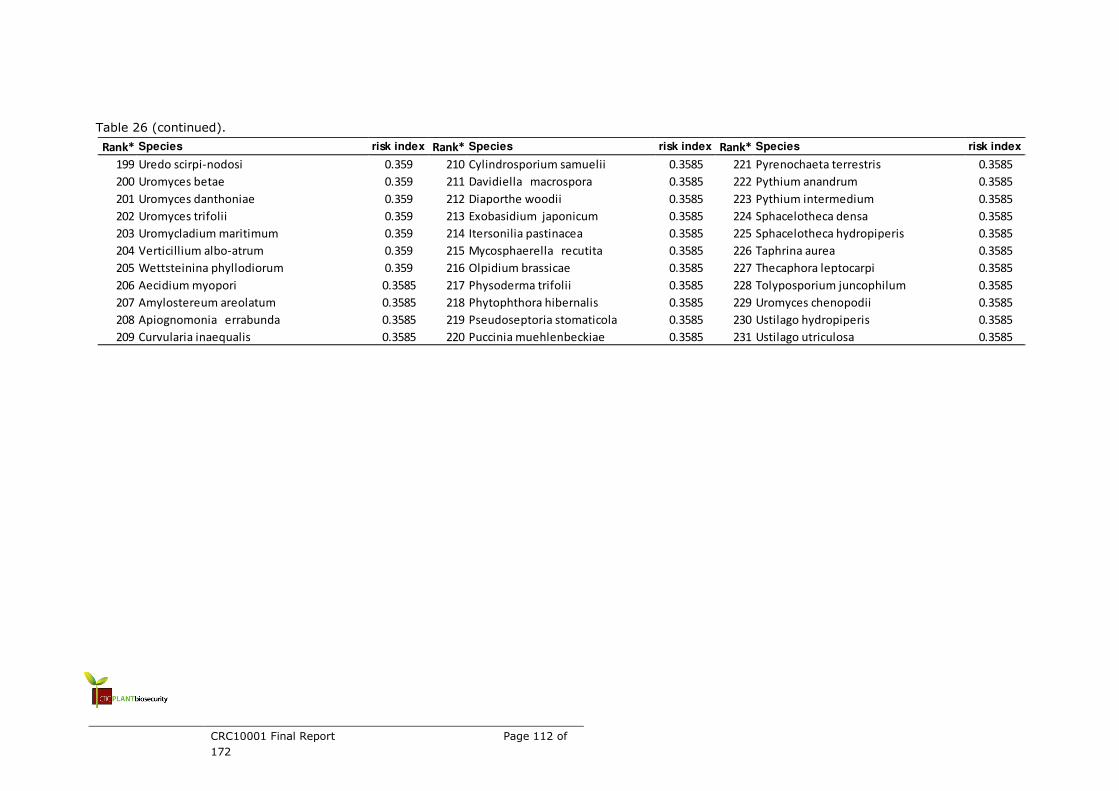
CRC10001 Final Report Page 112 of
172
Table 26 (continued).
Rank* Species risk index Rank* Species risk index Rank* Species risk index
199 Uredo scirpi-nodosi 0.359 210 Cylindrosporium samuelii 0.3585 221 Pyrenochaeta terrestris 0.3585
200 Uromyces betae 0.359 211 Davidiella macrospora 0.3585 222 Pythium anandrum 0.3585
201 Uromyces danthoniae 0.359 212 Diaporthe woodii 0.3585 223 Pythium intermedium 0.3585
202 Uromyces trifolii 0.359 213 Exobasidium japonicum 0.3585 224 Sphacelotheca densa 0.3585
203 Uromycladium maritimum 0.359 214 Itersonilia pastinacea 0.3585 225 Sphacelotheca hydropiperis 0.3585
204 Verticillium albo-atrum 0.359 215 Mycosphaerella recutita 0.3585 226 Taphrina aurea 0.3585
205 Wettsteinina phyllodiorum 0.359 216 Olpidium brassicae 0.3585 227 Thecaphora leptocarpi 0.3585
206 Aecidium myopori 0.3585 217 Physoderma trifolii 0.3585 228 Tolyposporium juncophilum 0.3585
207 Amylostereum areolatum 0.3585 218 Phytophthora hibernalis 0.3585 229 Uromyces chenopodii 0.3585
208 Apiognomonia errabunda 0.3585 219 Pseudoseptoria stomaticola 0.3585 230 Ustilago hydropiperis 0.3585
209 Curvularia inaequalis 0.3585 220 Puccinia muehlenbeckiae 0.3585 231 Ustilago utriculosa 0.3585
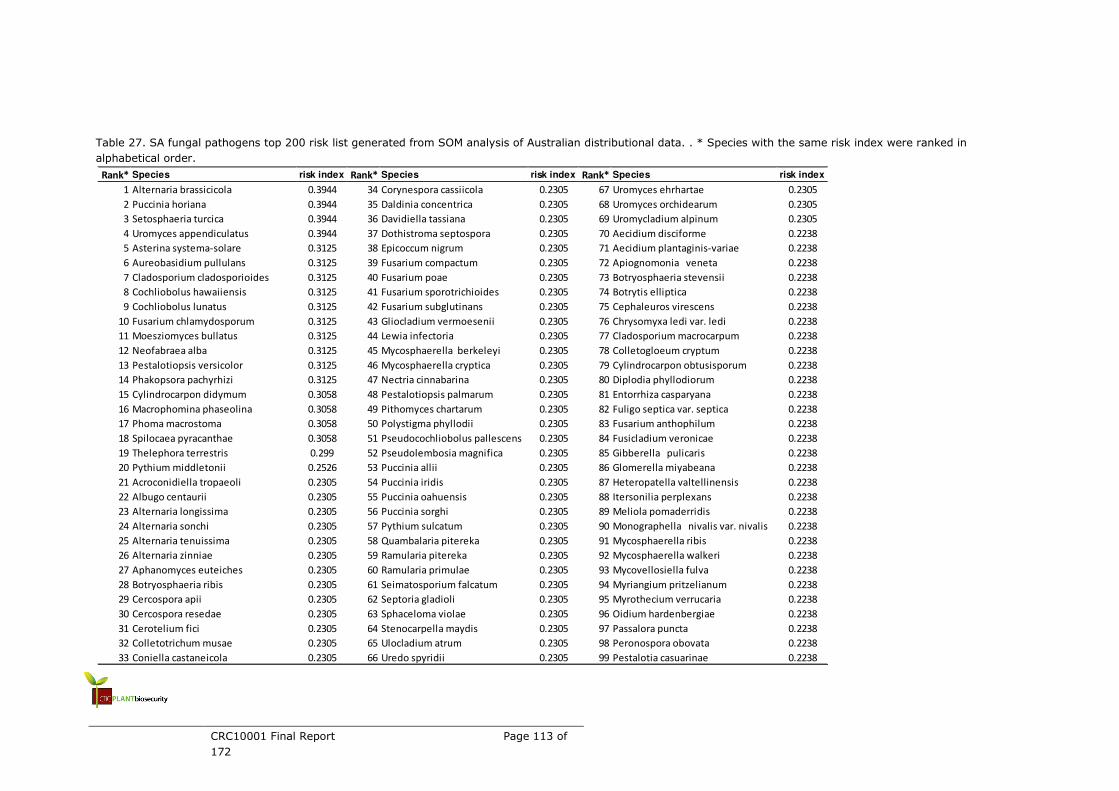
CRC10001 Final Report Page 113 of
172
Table 27. SA fungal pathogens top 200 risk list generated from SOM analysis of Australian distributional data. . * Species with the same risk index were ranked in
alphabetical order.
Rank* Species risk index Rank* Species risk index Rank* Species risk index
1 Alternaria brassicicola 0.3944 34 Corynespora cassiicola 0.2305 67 Uromyces ehrhartae 0.2305
2 Puccinia horiana 0.3944 35 Daldinia concentrica 0.2305 68 Uromyces orchidearum 0.2305
3 Setosphaeria turcica 0.3944 36 Davidiella tassiana 0.2305 69 Uromycladium alpinum 0.2305
4 Uromyces appendiculatus 0.3944 37 Dothistroma septospora 0.2305 70 Aecidium disciforme 0.2238
5 Asterina systema-solare 0.3125 38 Epicoccum nigrum 0.2305 71 Aecidium plantaginis-variae 0.2238
6 Aureobasidium pullulans 0.3125 39 Fusarium compactum 0.2305 72 Apiognomonia veneta 0.2238
7 Cladosporium cladosporioides 0.3125 40 Fusarium poae 0.2305 73 Botryosphaeria stevensii 0.2238
8 Cochliobolus hawaiiensis 0.3125 41 Fusarium sporotrichioides 0.2305 74 Botrytis elliptica 0.2238
9 Cochliobolus lunatus 0.3125 42 Fusarium subglutinans 0.2305 75 Cephaleuros virescens 0.2238
10 Fusarium chlamydosporum 0.3125 43 Gliocladium vermoesenii 0.2305 76 Chrysomyxa ledi var. ledi 0.2238
11 Moesziomyces bullatus 0.3125 44 Lewia infectoria 0.2305 77 Cladosporium macrocarpum 0.2238
12 Neofabraea alba 0.3125 45 Mycosphaerella berkeleyi 0.2305 78 Colletogloeum cryptum 0.2238
13 Pestalotiopsis versicolor 0.3125 46 Mycosphaerella cryptica 0.2305 79 Cylindrocarpon obtusisporum 0.2238
14 Phakopsora pachyrhizi 0.3125 47 Nectria cinnabarina 0.2305 80 Diplodia phyllodiorum 0.2238
15 Cylindrocarpon didymum 0.3058 48 Pestalotiopsis palmarum 0.2305 81 Entorrhiza casparyana 0.2238
16 Macrophomina phaseolina 0.3058 49 Pithomyces chartarum 0.2305 82 Fuligo septica var. septica 0.2238
17 Phoma macrostoma 0.3058 50 Polystigma phyllodii 0.2305 83 Fusarium anthophilum 0.2238
18 Spilocaea pyracanthae 0.3058 51 Pseudocochliobolus pallescens 0.2305 84 Fusicladium veronicae 0.2238
19 Thelephora terrestris 0.299 52 Pseudolembosia magnifica 0.2305 85 Gibberella pulicaris 0.2238
20 Pythium middletonii 0.2526 53 Puccinia allii 0.2305 86 Glomerella miyabeana 0.2238
21 Acroconidiella tropaeoli 0.2305 54 Puccinia iridis 0.2305 87 Heteropatella valtellinensis 0.2238
22 Albugo centaurii 0.2305 55 Puccinia oahuensis 0.2305 88 Itersonilia perplexans 0.2238
23 Alternaria longissima 0.2305 56 Puccinia sorghi 0.2305 89 Meliola pomaderridis 0.2238
24 Alternaria sonchi 0.2305 57 Pythium sulcatum 0.2305 90 Monographella nivalis var. nivalis 0.2238
25 Alternaria tenuissima 0.2305 58 Quambalaria pitereka 0.2305 91 Mycosphaerella ribis 0.2238
26 Alternaria zinniae 0.2305 59 Ramularia pitereka 0.2305 92 Mycosphaerella walkeri 0.2238
27 Aphanomyces euteiches 0.2305 60 Ramularia primulae 0.2305 93 Mycovellosiella fulva 0.2238
28 Botryosphaeria ribis 0.2305 61 Seimatosporium falcatum 0.2305 94 Myriangium pritzelianum 0.2238
29 Cercospora apii 0.2305 62 Septoria gladioli 0.2305 95 Myrothecium verrucaria 0.2238
30 Cercospora resedae 0.2305 63 Sphaceloma violae 0.2305 96 Oidium hardenbergiae 0.2238
31 Cerotelium fici 0.2305 64 Stenocarpella maydis 0.2305 97 Passalora puncta 0.2238
32 Colletotrichum musae 0.2305 65 Ulocladium atrum 0.2305 98 Peronospora obovata 0.2238
33 Coniella castaneicola 0.2305 66 Uredo spyridii 0.2305 99 Pestalotia casuarinae 0.2238
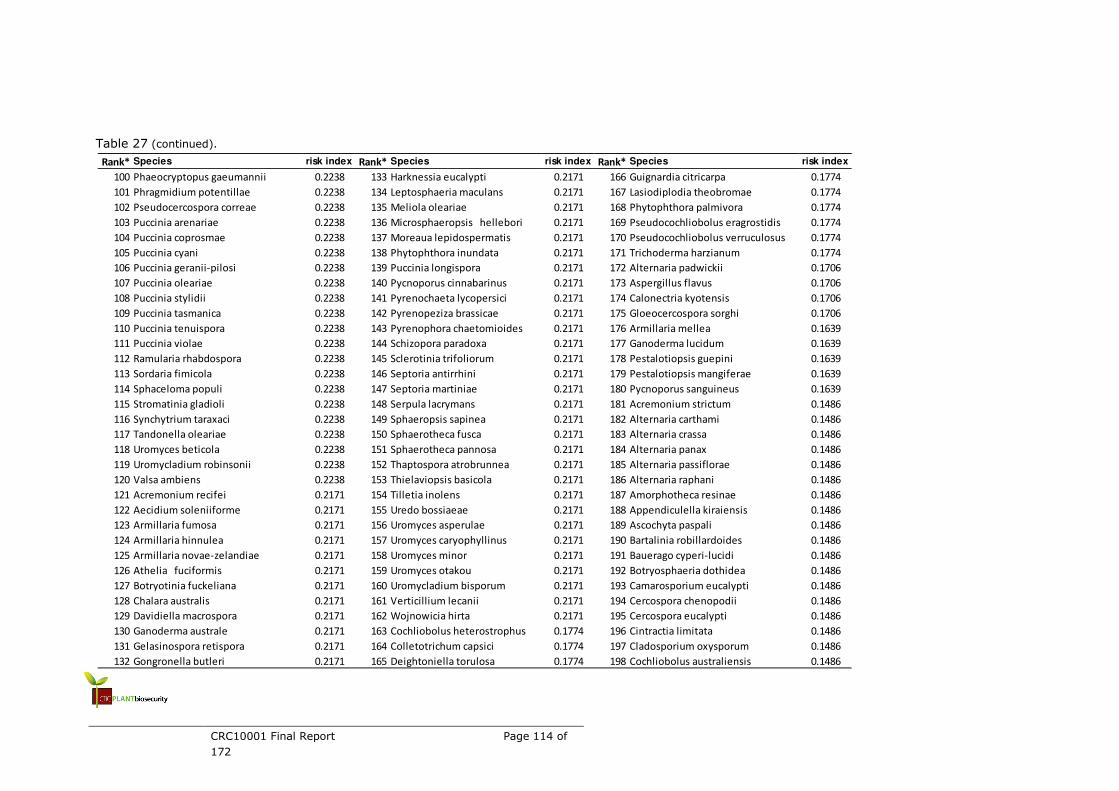
CRC10001 Final Report Page 114 of
172
Table 27 (continued).
Rank* Species risk index Rank* Species risk index Rank* Species risk index
100 Phaeocryptopus gaeumannii 0.2238 133 Harknessia eucalypti 0.2171 166 Guignardia citricarpa 0.1774
101 Phragmidium potentillae 0.2238 134 Leptosphaeria maculans 0.2171 167 Lasiodiplodia theobromae 0.1774
102 Pseudocercospora correae 0.2238 135 Meliola oleariae 0.2171 168 Phytophthora palmivora 0.1774
103 Puccinia arenariae 0.2238 136 Microsphaeropsis hellebori 0.2171 169 Pseudocochliobolus eragrostidis 0.1774
104 Puccinia coprosmae 0.2238 137 Moreaua lepidospermatis 0.2171 170 Pseudocochliobolus verruculosus 0.1774
105 Puccinia cyani 0.2238 138 Phytophthora inundata 0.2171 171 Trichoderma harzianum 0.1774
106 Puccinia geranii-pilosi 0.2238 139 Puccinia longispora 0.2171 172 Alternaria padwickii 0.1706
107 Puccinia oleariae 0.2238 140 Pycnoporus cinnabarinus 0.2171 173 Aspergillus flavus 0.1706
108 Puccinia stylidii 0.2238 141 Pyrenochaeta lycopersici 0.2171 174 Calonectria kyotensis 0.1706
109 Puccinia tasmanica 0.2238 142 Pyrenopeziza brassicae 0.2171 175 Gloeocercospora sorghi 0.1706
110 Puccinia tenuispora 0.2238 143 Pyrenophora chaetomioides 0.2171 176 Armillaria mellea 0.1639
111 Puccinia violae 0.2238 144 Schizopora paradoxa 0.2171 177 Ganoderma lucidum 0.1639
112 Ramularia rhabdospora 0.2238 145 Sclerotinia trifoliorum 0.2171 178 Pestalotiopsis guepini 0.1639
113 Sordaria fimicola 0.2238 146 Septoria antirrhini 0.2171 179 Pestalotiopsis mangiferae 0.1639
114 Sphaceloma populi 0.2238 147 Septoria martiniae 0.2171 180 Pycnoporus sanguineus 0.1639
115 Stromatinia gladioli 0.2238 148 Serpula lacrymans 0.2171 181 Acremonium strictum 0.1486
116 Synchytrium taraxaci 0.2238 149 Sphaeropsis sapinea 0.2171 182 Alternaria carthami 0.1486
117 Tandonella oleariae 0.2238 150 Sphaerotheca fusca 0.2171 183 Alternaria crassa 0.1486
118 Uromyces beticola 0.2238 151 Sphaerotheca pannosa 0.2171 184 Alternaria panax 0.1486
119 Uromycladium robinsonii 0.2238 152 Thaptospora atrobrunnea 0.2171 185 Alternaria passiflorae 0.1486
120 Valsa ambiens 0.2238 153 Thielaviopsis basicola 0.2171 186 Alternaria raphani 0.1486
121 Acremonium recifei 0.2171 154 Tilletia inolens 0.2171 187 Amorphotheca resinae 0.1486
122 Aecidium soleniiforme 0.2171 155 Uredo bossiaeae 0.2171 188 Appendiculella kiraiensis 0.1486
123 Armillaria fumosa 0.2171 156 Uromyces asperulae 0.2171 189 Ascochyta paspali 0.1486
124 Armillaria hinnulea 0.2171 157 Uromyces caryophyllinus 0.2171 190 Bartalinia robillardoides 0.1486
125 Armillaria novae-zelandiae 0.2171 158 Uromyces minor 0.2171 191 Bauerago cyperi-lucidi 0.1486
126 Athelia fuciformis 0.2171 159 Uromyces otakou 0.2171 192 Botryosphaeria dothidea 0.1486
127 Botryotinia fuckeliana 0.2171 160 Uromycladium bisporum 0.2171 193 Camarosporium eucalypti 0.1486
128 Chalara australis 0.2171 161 Verticillium lecanii 0.2171 194 Cercospora chenopodii 0.1486
129 Davidiella macrospora 0.2171 162 Wojnowicia hirta 0.2171 195 Cercospora eucalypti 0.1486
130 Ganoderma australe 0.2171 163 Cochliobolus heterostrophus 0.1774 196 Cintractia limitata 0.1486
131 Gelasinospora retispora 0.2171 164 Colletotrichum capsici 0.1774 197 Cladosporium oxysporum 0.1486
132 Gongronella butleri 0.2171 165 Deightoniella torulosa 0.1774 198 Cochliobolus australiensis 0.1486
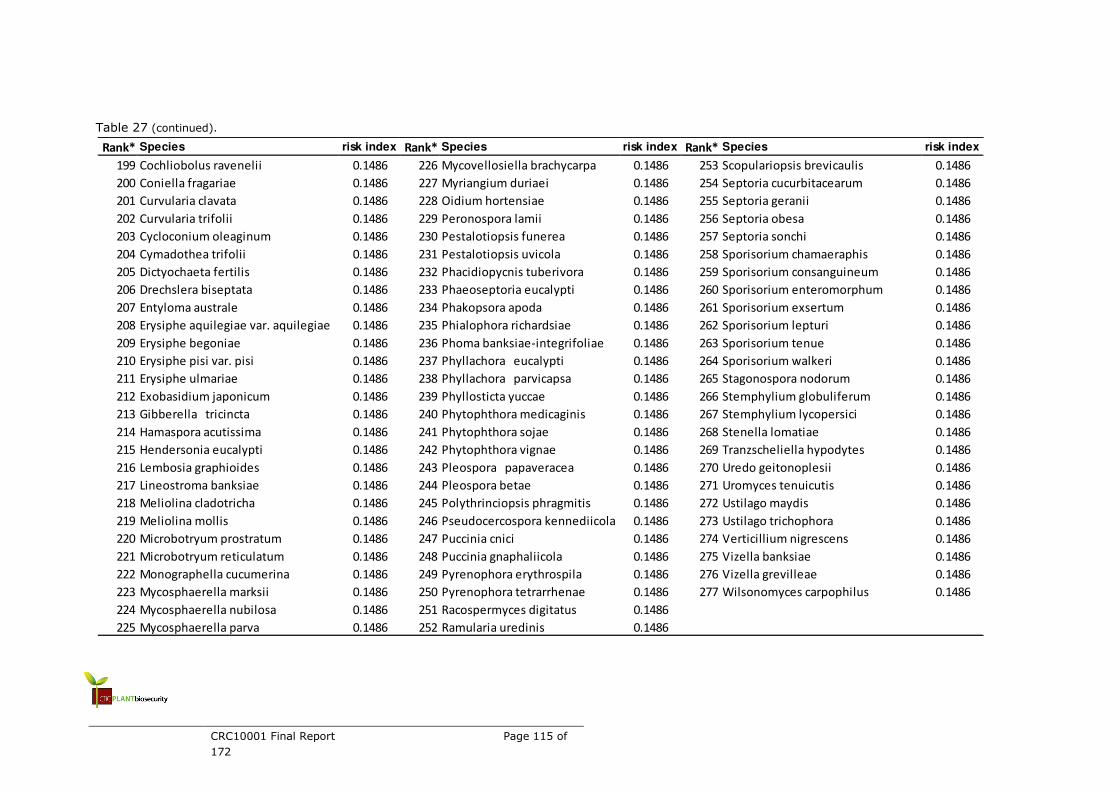
CRC10001 Final Report Page 115 of
172
Table 27 (continued).
Rank* Species risk index Rank* Species risk index Rank* Species risk index
199 Cochliobolus ravenelii 0.1486 226 Mycovellosiella brachycarpa 0.1486 253 Scopulariopsis brevicaulis 0.1486
200 Coniella fragariae 0.1486 227 Myriangium duriaei 0.1486 254 Septoria cucurbitacearum 0.1486
201 Curvularia clavata 0.1486 228 Oidium hortensiae 0.1486 255 Septoria geranii 0.1486
202 Curvularia trifolii 0.1486 229 Peronospora lamii 0.1486 256 Septoria obesa 0.1486
203 Cycloconium oleaginum 0.1486 230 Pestalotiopsis funerea 0.1486 257 Septoria sonchi 0.1486
204 Cymadothea trifolii 0.1486 231 Pestalotiopsis uvicola 0.1486 258 Sporisorium chamaeraphis 0.1486
205 Dictyochaeta fertilis 0.1486 232 Phacidiopycnis tuberivora 0.1486 259 Sporisorium consanguineum 0.1486
206 Drechslera biseptata 0.1486 233 Phaeoseptoria eucalypti 0.1486 260 Sporisorium enteromorphum 0.1486
207 Entyloma australe 0.1486 234 Phakopsora apoda 0.1486 261 Sporisorium exsertum 0.1486
208 Erysiphe aquilegiae var. aquilegiae 0.1486 235 Phialophora richardsiae 0.1486 262 Sporisorium lepturi 0.1486
209 Erysiphe begoniae 0.1486 236 Phoma banksiae-integrifoliae 0.1486 263 Sporisorium tenue 0.1486
210 Erysiphe pisi var. pisi 0.1486 237 Phyllachora eucalypti 0.1486 264 Sporisorium walkeri 0.1486
211 Erysiphe ulmariae 0.1486 238 Phyllachora parvicapsa 0.1486 265 Stagonospora nodorum 0.1486
212 Exobasidium japonicum 0.1486 239 Phyllosticta yuccae 0.1486 266 Stemphylium globuliferum 0.1486
213 Gibberella tricincta 0.1486 240 Phytophthora medicaginis 0.1486 267 Stemphylium lycopersici 0.1486
214 Hamaspora acutissima 0.1486 241 Phytophthora sojae 0.1486 268 Stenella lomatiae 0.1486
215 Hendersonia eucalypti 0.1486 242 Phytophthora vignae 0.1486 269 Tranzscheliella hypodytes 0.1486
216 Lembosia graphioides 0.1486 243 Pleospora papaveracea 0.1486 270 Uredo geitonoplesii 0.1486
217 Lineostroma banksiae 0.1486 244 Pleospora betae 0.1486 271 Uromyces tenuicutis 0.1486
218 Meliolina cladotricha 0.1486 245 Polythrinciopsis phragmitis 0.1486 272 Ustilago maydis 0.1486
219 Meliolina mollis 0.1486 246 Pseudocercospora kennediicola 0.1486 273 Ustilago trichophora 0.1486
220 Microbotryum prostratum 0.1486 247 Puccinia cnici 0.1486 274 Verticillium nigrescens 0.1486
221 Microbotryum reticulatum 0.1486 248 Puccinia gnaphaliicola 0.1486 275 Vizella banksiae 0.1486
222 Monographella cucumerina 0.1486 249 Pyrenophora erythrospila 0.1486 276 Vizella grevilleae 0.1486
223 Mycosphaerella marksii 0.1486 250 Pyrenophora tetrarrhenae 0.1486 277 Wilsonomyces carpophilus 0.1486
224 Mycosphaerella nubilosa 0.1486 251 Racospermyces digitatus 0.1486
225 Mycosphaerella parva 0.1486 252 Ramularia uredinis 0.1486
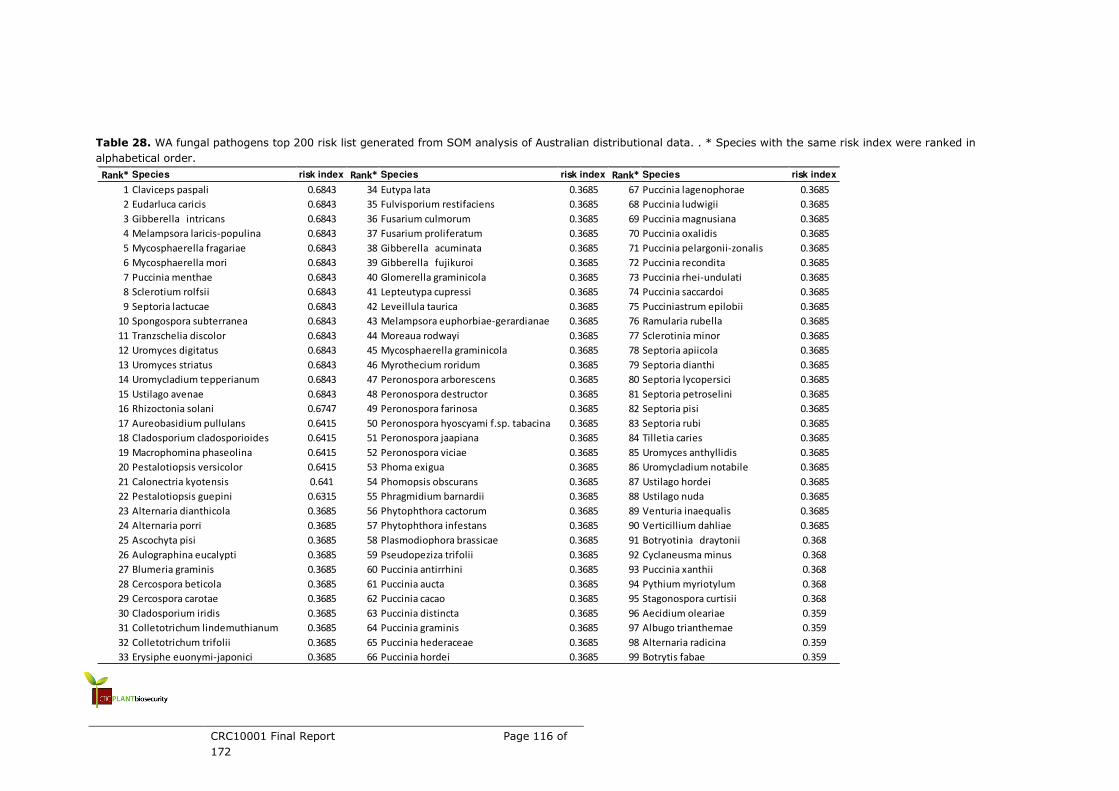
CRC10001 Final Report Page 116 of
172
Table 28. WA fungal pathogens top 200 risk list generated from SOM analysis of Australian distributional data. . * Species with the same risk index were ranked in
alphabetical order.
Rank* Species risk index Rank* Species risk index Rank* Species risk index
1 Claviceps paspali 0.6843 34 Eutypa lata 0.3685 67 Puccinia lagenophorae 0.3685
2 Eudarluca caricis 0.6843 35 Fulvisporium restifaciens 0.3685 68 Puccinia ludwigii 0.3685
3 Gibberella intricans 0.6843 36 Fusarium culmorum 0.3685 69 Puccinia magnusiana 0.3685
4 Melampsora laricis-populina 0.6843 37 Fusarium proliferatum 0.3685 70 Puccinia oxalidis 0.3685
5 Mycosphaerella fragariae 0.6843 38 Gibberella acuminata 0.3685 71 Puccinia pelargonii-zonalis 0.3685
6 Mycosphaerella mori 0.6843 39 Gibberella fujikuroi 0.3685 72 Puccinia recondita 0.3685
7 Puccinia menthae 0.6843 40 Glomerella graminicola 0.3685 73 Puccinia rhei-undulati 0.3685
8 Sclerotium rolfsii 0.6843 41 Lepteutypa cupressi 0.3685 74 Puccinia saccardoi 0.3685
9 Septoria lactucae 0.6843 42 Leveillula taurica 0.3685 75 Pucciniastrum epilobii 0.3685
10 Spongospora subterranea 0.6843 43 Melampsora euphorbiae-gerardianae 0.3685 76 Ramularia rubella 0.3685
11 Tranzschelia discolor 0.6843 44 Moreaua rodwayi 0.3685 77 Sclerotinia minor 0.3685
12 Uromyces digitatus 0.6843 45 Mycosphaerella graminicola 0.3685 78 Septoria apiicola 0.3685
13 Uromyces striatus 0.6843 46 Myrothecium roridum 0.3685 79 Septoria dianthi 0.3685
14 Uromycladium tepperianum 0.6843 47 Peronospora arborescens 0.3685 80 Septoria lycopersici 0.3685
15 Ustilago avenae 0.6843 48 Peronospora destructor 0.3685 81 Septoria petroselini 0.3685
16 Rhizoctonia solani 0.6747 49 Peronospora farinosa 0.3685 82 Septoria pisi 0.3685
17 Aureobasidium pullulans 0.6415 50 Peronospora hyoscyami f.sp. tabacina 0.3685 83 Septoria rubi 0.3685
18 Cladosporium cladosporioides 0.6415 51 Peronospora jaapiana 0.3685 84 Tilletia caries 0.3685
19 Macrophomina phaseolina 0.6415 52 Peronospora viciae 0.3685 85 Uromyces anthyllidis 0.3685
20 Pestalotiopsis versicolor 0.6415 53 Phoma exigua 0.3685 86 Uromycladium notabile 0.3685
21 Calonectria kyotensis 0.641 54 Phomopsis obscurans 0.3685 87 Ustilago hordei 0.3685
22 Pestalotiopsis guepini 0.6315 55 Phragmidium barnardii 0.3685 88 Ustilago nuda 0.3685
23 Alternaria dianthicola 0.3685 56 Phytophthora cactorum 0.3685 89 Venturia inaequalis 0.3685
24 Alternaria porri 0.3685 57 Phytophthora infestans 0.3685 90 Verticillium dahliae 0.3685
25 Ascochyta pisi 0.3685 58 Plasmodiophora brassicae 0.3685 91 Botryotinia draytonii 0.368
26 Aulographina eucalypti 0.3685 59 Pseudopeziza trifolii 0.3685 92 Cyclaneusma minus 0.368
27 Blumeria graminis 0.3685 60 Puccinia antirrhini 0.3685 93 Puccinia xanthii 0.368
28 Cercospora beticola 0.3685 61 Puccinia aucta 0.3685 94 Pythium myriotylum 0.368
29 Cercospora carotae 0.3685 62 Puccinia cacao 0.3685 95 Stagonospora curtisii 0.368
30 Cladosporium iridis 0.3685 63 Puccinia distincta 0.3685 96 Aecidium oleariae 0.359
31 Colletotrichum lindemuthianum 0.3685 64 Puccinia graminis 0.3685 97 Albugo trianthemae 0.359
32 Colletotrichum trifolii 0.3685 65 Puccinia hederaceae 0.3685 98 Alternaria radicina 0.359
33 Erysiphe euonymi-japonici 0.3685 66 Puccinia hordei 0.3685 99 Botrytis fabae 0.359

CRC10001 Final Report Page 117 of
172
Table 28 (continued).
Rank* Species risk index Rank* Species risk index Rank* Species risk index
100 Ceratocystis paradoxa 0.359 133 Seimatosporium dilophosporum 0.359 166 Acroconidiella tropaeoli 0.3258
101 Colletotrichum circinans 0.359 134 Septoria nodorum 0.359 167 Albugo centaurii 0.3258
102 Dilophospora alopecuri 0.359 135 Spermospora avenae 0.359 168 Alternaria longissima 0.3258
103 Drepanopeziza sphaerioides 0.359 136 Sphaerotheca fuliginea 0.359 169 Alternaria sonchi 0.3258
104 Elsinoe veneta 0.359 137 Sphaerotheca mors-uvae 0.359 170 Alternaria zinniae 0.3258
105 Gibberella avenacea 0.359 138 Uredo rhagodiae 0.359 171 Aphanomyces euteiches 0.3258
106 Gloeotinia granigena 0.359 139 Uredo scirpi-nodosi 0.359 172 Cercospora resedae 0.3258
107 Heteropatella antirrhini 0.359 140 Uromyces betae 0.359 173 Cerotelium fici 0.3258
108 Heterotolyposporium piluliforme 0.359 141 Uromyces danthoniae 0.359 174 Coniella castaneicola 0.3258
109 Lophodermium pinastri 0.359 142 Uromyces trifolii 0.359 175 Corynespora cassiicola 0.3258
110 Microdochium panattonianum 0.359 143 Uromycladium maritimum 0.359 176 Daldinia concentrica 0.3258
111 Microstroma juglandis 0.359 144 Verticillium albo-atrum 0.359 177 Davidiella tassiana 0.3258
112 Moreaua muelleriana 0.359 145 Wettsteinina phyllodiorum 0.359 178 Diplodia phyllodiorum 0.3258
113 Mycosphaerella swartii 0.359 146 Amylostereum areolatum 0.3585 179 Dothistroma septospora 0.3258
114 Parodiella banksiae 0.359 147 Apiognomonia errabunda 0.3585 180 Fusarium anthophilum 0.3258
115 Peronospora grisea 0.359 148 Cylindrosporium samuelii 0.3585 181 Fusarium compactum 0.3258
116 Peronospora polygoni 0.359 149 Davidiella macrospora 0.3585 182 Fusarium poae 0.3258
117 Phellinus robustus 0.359 150 Exobasidium japonicum 0.3585 183 Fusarium subglutinans 0.3258
118 Phragmidium tuberculatum 0.359 151 Itersonilia pastinacea 0.3585 184 Gliocladium vermoesenii 0.3258
119 Physoderma pulposum 0.359 152 Mycosphaerella recutita 0.3585 185 Mycosphaerella cryptica 0.3258
120 Phytophthora citricola 0.359 153 Olpidium brassicae 0.3585 186 Nectria cinnabarina 0.3258
121 Phytophthora erythroseptica 0.359 154 Physoderma trifolii 0.3585 187 Polystigma phyllodii 0.3258
122 Pteroconium pterospermum 0.359 155 Pseudoseptoria stomaticola 0.3585 188 Pseudocochliobolus pallescens 0.3258
123 Puccinia alyxiae 0.359 156 Puccinia muehlenbeckiae 0.3585 189 Pseudolembosia magnifica 0.3258
124 Puccinia boroniae 0.359 157 Pythium anandrum 0.3585 190 Puccinia allii 0.3258
125 Puccinia dichondrae 0.359 158 Pythium paroecandrum 0.3585 191 Puccinia iridis 0.3258
126 Puccinia morrisonii 0.359 159 Sphacelotheca densa 0.3585 192 Puccinia oahuensis 0.3258
127 Puccinia pulverulenta 0.359 160 Sphacelotheca hydropiperis 0.3585 193 Puccinia sorghi 0.3258
128 Puccinia punctiformis 0.359 161 Taphrina aurea 0.3585 194 Puccinia violae 0.3258
129 Puccinia subnitens 0.359 162 Thecaphora leptocarpi 0.3585 195 Ramularia pitereka 0.3258
130 Puccinia tetragoniae 0.359 163 Tolyposporium juncophilum 0.3585 196 Ramularia primulae 0.3258
131 Puccinia thuemenii 0.359 164 Ustilago hydropiperis 0.3585 197 Seimatosporium falcatum 0.3258
132 Rhynchosporium secalis 0.359 165 Ustilago utriculosa 0.3585 198 Septoria gladioli 0.3258
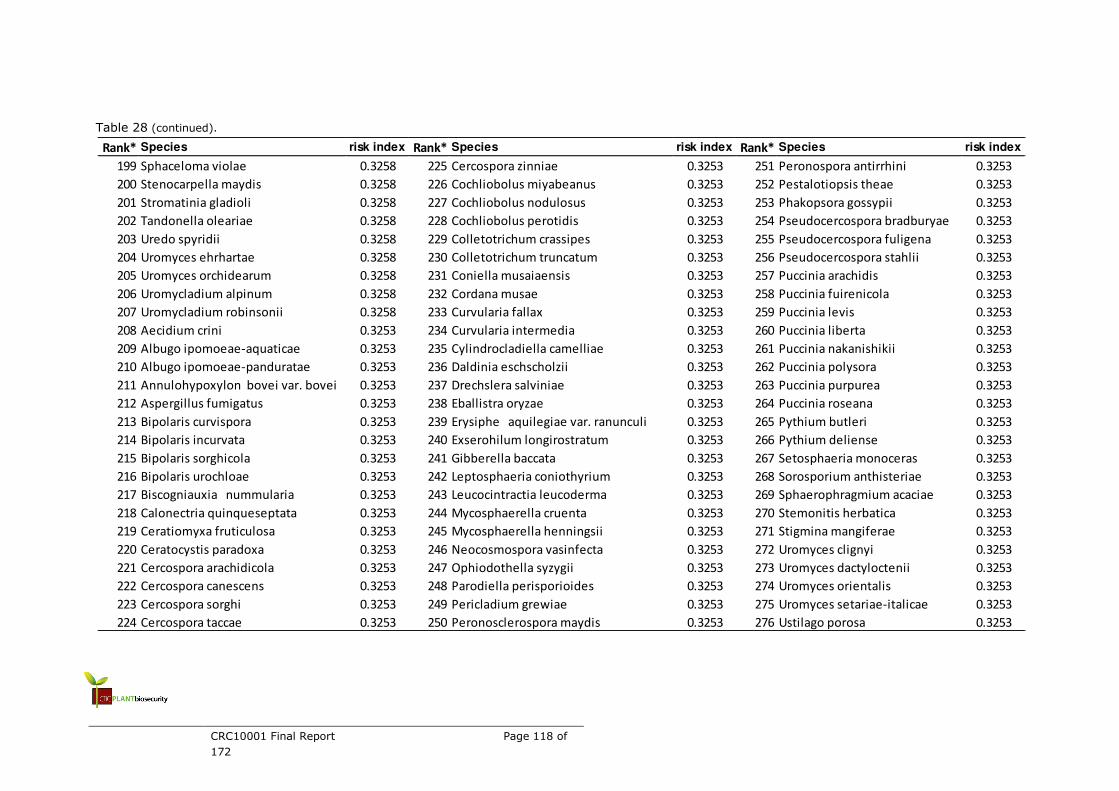
CRC10001 Final Report Page 118 of
172
Table 28 (continued).
Rank* Species risk index Rank* Species risk index Rank* Species risk index
199 Sphaceloma violae 0.3258 225 Cercospora zinniae 0.3253 251 Peronospora antirrhini 0.3253
200 Stenocarpella maydis 0.3258 226 Cochliobolus miyabeanus 0.3253 252 Pestalotiopsis theae 0.3253
201 Stromatinia gladioli 0.3258 227 Cochliobolus nodulosus 0.3253 253 Phakopsora gossypii 0.3253
202 Tandonella oleariae 0.3258 228 Cochliobolus perotidis 0.3253 254 Pseudocercospora bradburyae 0.3253
203 Uredo spyridii 0.3258 229 Colletotrichum crassipes 0.3253 255 Pseudocercospora fuligena 0.3253
204 Uromyces ehrhartae 0.3258 230 Colletotrichum truncatum 0.3253 256 Pseudocercospora stahlii 0.3253
205 Uromyces orchidearum 0.3258 231 Coniella musaiaensis 0.3253 257 Puccinia arachidis 0.3253
206 Uromycladium alpinum 0.3258 232 Cordana musae 0.3253 258 Puccinia fuirenicola 0.3253
207 Uromycladium robinsonii 0.3258 233 Curvularia fallax 0.3253 259 Puccinia levis 0.3253
208 Aecidium crini 0.3253 234 Curvularia intermedia 0.3253 260 Puccinia liberta 0.3253
209 Albugo ipomoeae-aquaticae 0.3253 235 Cylindrocladiella camelliae 0.3253 261 Puccinia nakanishikii 0.3253
210 Albugo ipomoeae-panduratae 0.3253 236 Daldinia eschscholzii 0.3253 262 Puccinia polysora 0.3253
211 Annulohypoxylon bovei var. bovei 0.3253 237 Drechslera salviniae 0.3253 263 Puccinia purpurea 0.3253
212 Aspergillus fumigatus 0.3253 238 Eballistra oryzae 0.3253 264 Puccinia roseana 0.3253
213 Bipolaris curvispora 0.3253 239 Erysiphe aquilegiae var. ranunculi 0.3253 265 Pythium butleri 0.3253
214 Bipolaris incurvata 0.3253 240 Exserohilum longirostratum 0.3253 266 Pythium deliense 0.3253
215 Bipolaris sorghicola 0.3253 241 Gibberella baccata 0.3253 267 Setosphaeria monoceras 0.3253
216 Bipolaris urochloae 0.3253 242 Leptosphaeria coniothyrium 0.3253 268 Sorosporium anthisteriae 0.3253
217 Biscogniauxia nummularia 0.3253 243 Leucocintractia leucoderma 0.3253 269 Sphaerophragmium acaciae 0.3253
218 Calonectria quinqueseptata 0.3253 244 Mycosphaerella cruenta 0.3253 270 Stemonitis herbatica 0.3253
219 Ceratiomyxa fruticulosa 0.3253 245 Mycosphaerella henningsii 0.3253 271 Stigmina mangiferae 0.3253
220 Ceratocystis paradoxa 0.3253 246 Neocosmospora vasinfecta 0.3253 272 Uromyces clignyi 0.3253
221 Cercospora arachidicola 0.3253 247 Ophiodothella syzygii 0.3253 273 Uromyces dactyloctenii 0.3253
222 Cercospora canescens 0.3253 248 Parodiella perisporioides 0.3253 274 Uromyces orientalis 0.3253
223 Cercospora sorghi 0.3253 249 Pericladium grewiae 0.3253 275 Uromyces setariae-italicae 0.3253
224 Cercospora taccae 0.3253 250 Peronosclerospora maydis 0.3253 276 Ustilago porosa 0.3253

CRC10001 Final Report Page 119 of
172
Table 29. NSW bacterial pathogens risk list generated from SOM analysis of Australian distributional data. . * Species with the same risk index were ranked in alphabetical
order.
Rank* Species risk index Rank* Species risk index Rank* Species risk index
1 Pseudomonas maculicola 0.4176 36 Xanthomonas holcicola 0.0761 71 Pseudomonas syringae pv tabaci 0.0014
2 Pseudomonas viridiflava 0.4176 37 Xanthomonas malvacearum 0.0761 72 Pseudomonas syringae pv tomato 0.0014
3 Xanthomonas vesicatoria 0.4176 38 Bacterium campestris 0.017 73 Pseudomonas viridiflava 0.0014
4 Pseudomonas cichorii 0.4174 39 Bacterium chrysanthemi 0.017 74 Pseudomonas cepacea 0.0014
5 Pseudomonas marginalis 0.4174 40 Bacterium solanacearum 0.017 75 Pseudomonas gladioli 0.0014
6 Xanthomonas pruni 0.4174 41 Corynebacterium insidiosum 0.0016 76 Pseudomonas syringae pv coriandricola 0.0014
7 Pseudomonas syringae pv phaseolicola 0.3426 42 Pseudomonas syringae pv syringae 0.0016 77 Pseudomonas syringae pv pisi 0.0014
8 Pseudomonas pseudoalcaligenes 0.3414 43 Xanthomonas campestris pv campestris 0.0016 78 Streptomyces scabies 0.0014
9 Chryseobacterium balustinum 0.3413 44 Xanthomonas campestris pv juglandis 0.0016 79 Xanthomonas arboricola pv pruni 0.0014
10 Hafnia alvei 0.3413 45 Acidovorax avenae ss avenae 0.0014 80 Xanthomonas campestris pv campestris 0.0014
11 Micrococcus radiourans 0.3413 46 Acidovorax avenae ss citrulli 0.0014 81 Xanthomonas campestris pv mangiferaeindicae 0.0014
12 Ochrobactrum anthropi 0.3413 47 Burkholderia gladioli ss gladioli 0.0014 82 Xanthomonas campestris pv begoniae 0.0014
13 Pseudomonas corrugata 0.3413 48 Clavibacter tritici 0.0014 83 Xanthomonas campestris pv carotae 0.0014
14 Pseudomonas eriobotryae 0.3413 49 Clavibacter michiganensis ss michiganensis 0.0014 84 Xanthomonas campestris pv incanae 0.0014
15 Xanthomonas vitians 0.3413 50 Clavibacter michiganense ss insidiosum 0.0014 85 Xanthomonas campestris pv pelargonii 0.0014
16 Corynebacterium michiganense 0.0775 51 Clavibacter michiganense ss michiganense 0.0014 86 Xanthomonas campestris pv pruni 0.0014
17 Pseudomonas marginata 0.0763 52 Clavibacter toxicus 0.0014 87 Xanthomonas fragariae 0.0014
18 Pseudomonas phaseolicola 0.0763 53 Corynebacterium flaccumfaciens 0.0014 88 Corynebacterium michiganense pv Insidiosum 0.0002
19 Xanthomonas begoniae 0.0763 54 Erwinia carotovora ss carotovora 0.0014 89 Corynebacterium michiganense pv Michiganense 0.0002
20 Xanthomonas juglandis 0.0763 55 Erwinia chrysanthemi 0.0014 90 Pseudomonas alliicola 0.0002
21 Xanthomonas phaseoli 0.0763 56 Erwinia herbicola 0.0014 91 Pseudomonas coronafaciens 0.0002
22 Bacillus mycoides 0.0761 57 Erwinia cypripedii 0.0014 92 Pseudomonas delphinii 0.0002
23 Erwinia aroideae 0.0761 58 Erwinia tracheiphila 0.0014 93 Pseudomonas gladioli pv Gladioli 0.0002
24 Herbaspirillum huttiense 0.0761 59 Pseudomonas cichorii 0.0014 94 Pseudomonas lachrymans 0.0002
25 Herbaspirillum rubrisubalbicans 0.0761 60 Pseudomonas fluorescens 0.0014 95 Pseudomonas mori 0.0002
26 Pseudomonas aeruginosa 0.0761 61 Pseudomonas syringae pv atrofaciens 0.0014 96 Pseudomonas primulae 0.0002
27 Pseudomonas flectens 0.0761 62 Pseudomonas syringae pv coronafaciens 0.0014 97 Pseudomonas savastanoi f sp Nerii 0.0002
28 Pseudomonas glycinea 0.0761 63 Pseudomonas syringae pv lachrymans 0.0014 98 Pseudomonas syringae pv Maculicola 0.0002
29 Pseudomonas striafaciens 0.0761 64 Pseudomonas syringae pv maculicola 0.0014 99 Pseudomonas syringae pv Mori 0.0002
30 Pseudomonas tabaci 0.0761 65 Pseudomonas syringae pv mori 0.0014 100 Pseudomonas syringae pv tomato 0.0002
31 Pseudomonas tonelliana 0.0761 66 Pseudomonas syringae pv passiflorae 0.0014 101 Pseudomonas tolaasi 0.0002
32 Serratia liquefaciens 0.0761 67 Pseudomonas syringae pv pisi 0.0014 102 Pseudomonas tomato 0.0002
33 Streptomyces scabiei 0.0761 68 Pseudomonas syringae pv porri 0.0014 103 Xanthomonas campestris pv vitians 0.0002
34 Xanthomonas antirrhini 0.0761 69 Pseudomonas syringae pv striafaciens 0.0014 104 Xanthomonas hyacinthi 0.0002
35 Xanthomonas cucurbitae 0.0761 70 Pseudomonas syringae pv syringae 0.0014 105 Xanthomonas papavericola 0.0002

CRC10001 Final Report Page 120 of
172
Table 30. NT bacterial pathogens risk list generated from SOM analysis of Australian distributional data. . * Species with the same risk index were ranked in alphabetical
order.
Rank* Species risk index Rank* Species risk index Rank* Species risk index
1 Agrobacterium tumefaciens 0.3569 35 Pseudomonas syringae pv lachrymans 0.2428 69 Pseudomonas viridiflava 0.102
2 Erwinia carotovora 0.3569 36 Pseudomonas syringae pv maculicola 0.2428 70 Ralstonia solanacearum 0.102
3 Pseudomonas syringae 0.3569 37 Pseudomonas syringae pv mori 0.2428 71 Xanthomonas vesicatoria 0.102
4 Xanthomonas campestris 0.3569 38 Pseudomonas syringae pv passiflorae 0.2428 72 Pantoea agglomerans 0.1014
5 Streptomyces scabies 0.3563 39 Pseudomonas syringae pv pisi 0.2428 73 Pectobacterium carotovorum 0.1014
6 Curtobacterium flaccumfaciens 0.3448 40 Pseudomonas syringae pv porri 0.2428 74 Pseudomonas pseudoalcaligenes 0.1014
7 Agrobacterium vitis 0.3442 41 Pseudomonas syringae pv striafaciens 0.2428 75 Serratia marcescens 0.1014
8 Pseudomonas syringae pv phaseolicola 0.3321 42 Pseudomonas syringae pv syringae 0.2428 76 Pseudomonas cichorii 0.0899
9 Burkholderia cepacia 0.2555 43 Pseudomonas syringae pv tabaci 0.2428 77 Pseudomonas marginalis 0.0899
10 Burkholderia gladioli 0.2555 44 Pseudomonas syringae pv tomato 0.2428 78 Xanthomonas pruni 0.0899
11 Clavibacter michiganense 0.2549 45 Pseudomonas viridiflava 0.2428 79 Chryseobacterium balustinum 0.0893
12 Corynebacterium insidiosum 0.2549 46 Pseudomonas cepacea 0.2428 80 Hafnia alvei 0.0893
13 Pseudomonas syringae pv syringae 0.2549 47 Pseudomonas gladioli 0.2428 81 Micrococcus radiourans 0.0893
14 Xanthomonas campestris pv campestris 0.2549 48 Pseudomonas syringae pv coriandricola 0.2428 82 Ochrobactrum anthropi 0.0893
15 Xanthomonas campestris pv juglandis 0.2549 49 Pseudomonas syringae pv pisi 0.2428 83 Pseudomonas corrugata 0.0893
16 Corynebacterium michiganense 0.2434 50 Streptomyces scabies 0.2428 84 Pseudomonas eriobotryae 0.0893
17 Acidovorax avenae ss avenae 0.2428 51 Xanthomonas arboricola pv pruni 0.2428 85 Xanthomonas vitians 0.0893
18 Acidovorax avenae ss citrulli 0.2428 52 Xanthomonas campestris pv campestris 0.2428 86 Agrobacterium rhizogenes 0.0242
19 Burkholderia gladioli ss gladioli 0.2428 53 Xanthomonas campestris pv mangiferaeindicae 0.2428 87 Pseudomonas pisi 0.0242
20 Clavibacter tritici 0.2428 54 Xanthomonas campestris pv begoniae 0.2428 88 Bacillus subtilis 0.0127
21 Clavibacter michiganensis ss michiganensis 0.2428 55 Xanthomonas campestris pv carotae 0.2428 89 Enterobacter cloacae 0.0127
22 Clavibacter michiganense ss insidiosum 0.2428 56 Xanthomonas campestris pv incanae 0.2428 90 Erwinia herbicola 0.0127
23 Clavibacter michiganense ss michiganense 0.2428 57 Xanthomonas campestris pv pelargonii 0.2428 91 Pantoea ananatis 0.0127
24 Clavibacter toxicus 0.2428 58 Xanthomonas campestris pv pruni 0.2428 92 Pseudomonas marginata 0.0127
25 Corynebacterium flaccumfaciens 0.2428 59 Xanthomonas fragariae 0.2428 93 Pseudomonas phaseolicola 0.0127
26 Erwinia carotovora ss carotovora 0.2428 60 Clavibacter michiganensis 0.1141 94 Pseudomonas solanacearum 0.0127
27 Erwinia chrysanthemi 0.2428 61 Pseudomonas fluorescens 0.1135 95 Sphingomonas suberifaciens 0.0127
28 Erwinia herbicola 0.2428 62 Pseudomonas putida 0.1135 96 Stenotrophomonas maltophilia 0.0127
29 Erwinia cypripedii 0.2428 63 Acidovorax avenae 0.102 97 Xanthomonas begoniae 0.0127
30 Erwinia tracheiphila 0.2428 64 Bacillus cereus 0.102 98 Xanthomonas juglandis 0.0127
31 Pseudomonas cichorii 0.2428 65 Burkholderia andropogonis 0.102 99 Xanthomonas phaseoli 0.0127
32 Pseudomonas fluorescens 0.2428 66 Erwinia chrysanthemi 0.102 100 Agrobacterium radiobacter 0.0121
33 Pseudomonas syringae pv atrofaciens 0.2428 67 Pseudomonas andropogonis 0.102 101 Agrobacterium rubi 0.0121
34 Pseudomonas syringae pv coronafaciens 0.2428 68 Pseudomonas maculicola 0.102 102 Bacillus thuringiensis 0.0121

CRC10001 Final Report Page 121 of
172
Table 30 (continued).
Rank* Species risk index Rank* Species risk index Rank* Species risk index
103 Burkholderia caryophylli 0.0121 122 Pseudomonas delphinii 0.0121 141 Xanthomonas papavericola 0.0121
104 Cellulomonas flavigena 0.0121 123 Pseudomonas gladioli pv Gladioli 0.0121 142 Bacillus mycoides 0.0006
105 Chryseobacterium indologenes 0.0121 124 Pseudomonas lachrymans 0.0121 143 Erwinia aroideae 0.0006
106 Citrobacter freundii 0.0121 125 Pseudomonas mori 0.0121 144 Herbaspirillum huttiense 0.0006
107 Corynebacterium michiganense pv Insidiosum 0.0121 126 Pseudomonas mors-prunorum 0.0121 145 Herbaspirillum rubrisubalbicans 0.0006
108 Corynebacterium michiganense pv Michiganense 0.0121 127 Pseudomonas primulae 0.0121 146 Pseudomonas aeruginosa 0.0006
109 Enterobacter aerogenes 0.0121 128 Pseudomonas savastanoi 0.0121 147 Pseudomonas flectens 0.0006
110 Enterobacter gergoviae 0.0121 129 Pseudomonas savastanoi f sp Nerii 0.0121 148 Pseudomonas glycinea 0.0006
111 Erwinia mangiferae 0.0121 130 Pseudomonas syringae pv Maculicola 0.0121 149 Pseudomonas striafaciens 0.0006
112 Erwinia rhapontici 0.0121 131 Pseudomonas syringae pv Mori 0.0121 150 Pseudomonas tabaci 0.0006
113 Escherichia coli 0.0121 132 Pseudomonas syringae pv tomato 0.0121 151 Pseudomonas tonelliana 0.0006
114 Klebsiella oxytoca 0.0121 133 Pseudomonas tolaasi 0.0121 152 Serratia liquefaciens 0.0006
115 Klebsiella pneumoniae 0.0121 134 Pseudomonas tomato 0.0121 153 Streptomyces scabiei 0.0006
116 Methylobacterium mesophilum 0.0121 135 Rathayibacter toxicus 0.0121 154 Xanthomonas antirrhini 0.0006
117 Oerskovia turbata 0.0121 136 Rhizobium trifolii 0.0121 155 Xanthomonas cucurbitae 0.0006
118 Paenibacillus macerans 0.0121 137 Serratia fonticola 0.0121 156 Xanthomonas holcicola 0.0006
119 Pectobacterium atrosepticum 0.0121 138 Serratia proteamaculans 0.0121 157 Xanthomonas malvacearum 0.0006
120 Pseudomonas alliicola 0.0121 139 Xanthomonas campestris pv vitians 0.0121
121 Pseudomonas coronafaciens 0.0121 140 Xanthomonas hyacinthi 0.0121

CRC10001 Final Report Page 122 of
172
Table 31. QLD bacterial pathogens risk list generated from SOM analysis of Australian distributional data. . * Species with the same risk index were ranked in alphabetical
order.
Rank* Species risk index Rank* Species risk index Rank* Species risk index
1 Streptomyces scabies 0.1439 38 Hafnia alvei 0.0258 75 Clavibacter michiganense ss michiganense 0.0003
2 Pseudomonas fluorescens 0.1436 39 Micrococcus radiourans 0.0258 76 Clavibacter toxicus 0.0003
3 Pseudomonas putida 0.1436 40 Ochrobactrum anthropi 0.0258 77 Corynebacterium flaccumfaciens 0.0003
4 Agrobacterium vitis 0.1417 41 Pseudomonas corrugata 0.0258 78 Erwinia carotovora ss carotovora 0.0003
5 Pantoea agglomerans 0.1415 42 Pseudomonas eriobotryae 0.0258 79 Erwinia chrysanthemi 0.0003
6 Pectobacterium carotovorum 0.1415 43 Xanthomonas vitians 0.0258 80 Erwinia herbicola 0.0003
7 Serratia marcescens 0.1415 44 Corynebacterium insidiosum 0.0024 81 Erwinia cypripedii 0.0003
8 Agrobacterium rhizogenes 0.1178 45 Pseudomonas syringae pv syringae 0.0024 82 Erwinia tracheiphila 0.0003
9 Pseudomonas pisi 0.1178 46 Xanthomonas campestris pv campestris 0.0024 83 Pseudomonas cichorii 0.0003
10 Clavibacter michiganense 0.1159 47 Xanthomonas campestris pv juglandis 0.0024 84 Pseudomonas fluorescens 0.0003
11 Agrobacterium radiobacter 0.1157 48 Corynebacterium michiganense pv Insidiosum 0.0021 85 Pseudomonas syringae pv atrofaciens 0.0003
12 Agrobacterium rubi 0.1157 49 Corynebacterium michiganense pv Michiganense 0.0021 86 Pseudomonas syringae pv coronafaciens 0.0003
13 Bacillus thuringiensis 0.1157 50 Pseudomonas alliicola 0.0021 87 Pseudomonas syringae pv lachrymans 0.0003
14 Burkholderia caryophylli 0.1157 51 Pseudomonas coronafaciens 0.0021 88 Pseudomonas syringae pv maculicola 0.0003
15 Cellulomonas flavigena 0.1157 52 Pseudomonas delphinii 0.0021 89 Pseudomonas syringae pv mori 0.0003
16 Chryseobacterium indologenes 0.1157 53 Pseudomonas gladioli pv Gladioli 0.0021 90 Pseudomonas syringae pv passiflorae 0.0003
17 Citrobacter freundii 0.1157 54 Pseudomonas lachrymans 0.0021 91 Pseudomonas syringae pv pisi 0.0003
18 Enterobacter aerogenes 0.1157 55 Pseudomonas mori 0.0021 92 Pseudomonas syringae pv porri 0.0003
19 Enterobacter gergoviae 0.1157 56 Pseudomonas primulae 0.0021 93 Pseudomonas syringae pv striafaciens 0.0003
20 Erwinia mangiferae 0.1157 57 Pseudomonas savastanoi f sp Nerii 0.0021 94 Pseudomonas syringae pv syringae 0.0003
21 Erwinia rhapontici 0.1157 58 Pseudomonas syringae pv Maculicola 0.0021 95 Pseudomonas syringae pv tabaci 0.0003
22 Escherichia coli 0.1157 59 Pseudomonas syringae pv Mori 0.0021 96 Pseudomonas syringae pv tomato 0.0003
23 Klebsiella oxytoca 0.1157 60 Pseudomonas syringae pv tomato 0.0021 97 Pseudomonas viridiflava 0.0003
24 Klebsiella pneumoniae 0.1157 61 Pseudomonas tolaasi 0.0021 98 Pseudomonas cepacea 0.0003
25 Methylobacterium mesophilum 0.1157 62 Pseudomonas tomato 0.0021 99 Pseudomonas gladioli 0.0003
26 Oerskovia turbata 0.1157 63 Xanthomonas campestris pv vitians 0.0021 100 Pseudomonas syringae pv coriandricola 0.0003
27 Paenibacillus macerans 0.1157 64 Xanthomonas hyacinthi 0.0021 101 Pseudomonas syringae pv pisi 0.0003
28 Pectobacterium atrosepticum 0.1157 65 Xanthomonas papavericola 0.0021 102 Streptomyces scabies 0.0003
29 Pseudomonas mors-prunorum 0.1157 66 Bacterium campestris 0.0013 103 Xanthomonas arboricola pv pruni 0.0003
30 Pseudomonas savastanoi 0.1157 67 Bacterium chrysanthemi 0.0013 104 Xanthomonas campestris pv campestris 0.0003
31 Rathayibacter toxicus 0.1157 68 Bacterium solanacearum 0.0013 105 Xanthomonas campestris pv mangiferaeindicae 0.0003
32 Rhizobium trifolii 0.1157 69 Acidovorax avenae ss avenae 0.0003 106 Xanthomonas campestris pv begoniae 0.0003
33 Serratia fonticola 0.1157 70 Acidovorax avenae ss citrulli 0.0003 107 Xanthomonas campestris pv carotae 0.0003
34 Serratia proteamaculans 0.1157 71 Burkholderia gladioli ss gladioli 0.0003 108 Xanthomonas campestris pv incanae 0.0003
35 Pseudomonas pseudoalcaligenes 0.0279 72 Clavibacter tritici 0.0003 109 Xanthomonas campestris pv pelargonii 0.0003
36 Pseudomonas syringae pv phaseolicola 0.0261 73 Clavibacter michiganensis ss michiganensis 0.0003 110 Xanthomonas campestris pv pruni 0.0003
37 Chryseobacterium balustinum 0.0258 74 Clavibacter michiganense ss insidiosum 0.0003 111 Xanthomonas fragariae 0.0003
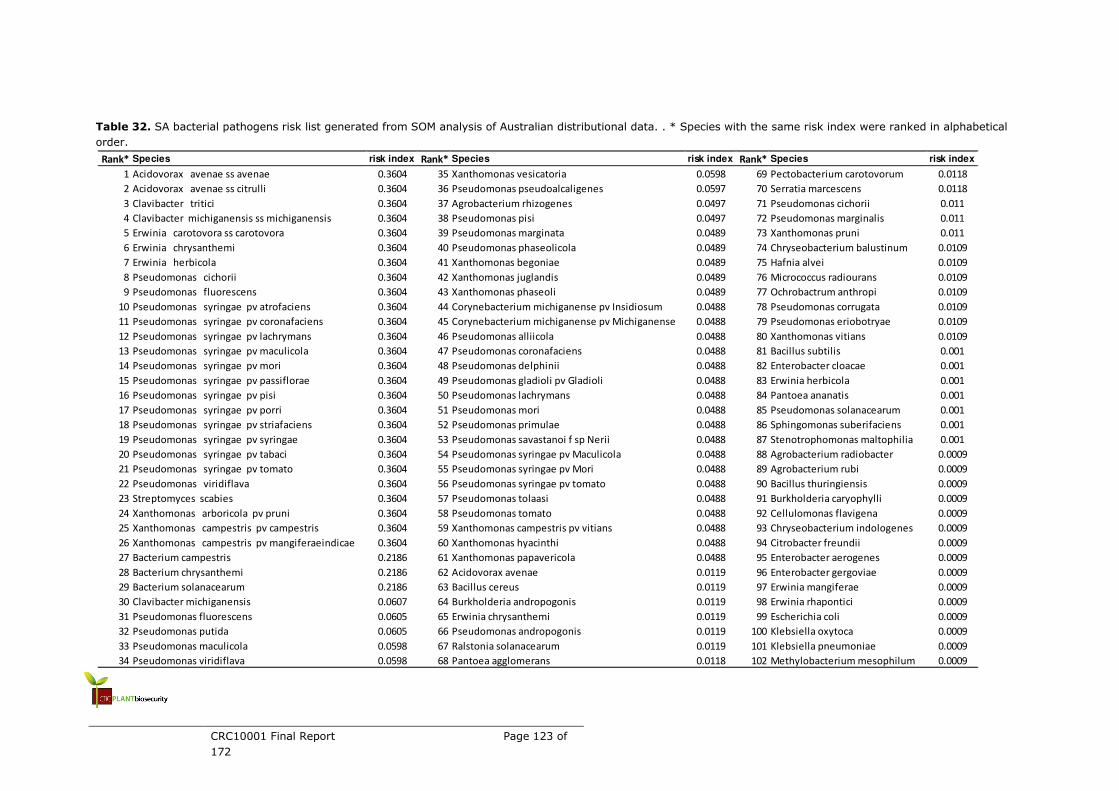
CRC10001 Final Report Page 123 of
172
Table 32. SA bacterial pathogens risk list generated from SOM analysis of Australian distributional data. . * Species with the same risk index were ranked in alphabetical
order.
Rank* Species risk index Rank* Species risk index Rank* Species risk index
1 Acidovorax avenae ss avenae 0.3604 35 Xanthomonas vesicatoria 0.0598 69 Pectobacterium carotovorum 0.0118
2 Acidovorax avenae ss citrulli 0.3604 36 Pseudomonas pseudoalcaligenes 0.0597 70 Serratia marcescens 0.0118
3 Clavibacter tritici 0.3604 37 Agrobacterium rhizogenes 0.0497 71 Pseudomonas cichorii 0.011
4 Clavibacter michiganensis ss michiganensis 0.3604 38 Pseudomonas pisi 0.0497 72 Pseudomonas marginalis 0.011
5 Erwinia carotovora ss carotovora 0.3604 39 Pseudomonas marginata 0.0489 73 Xanthomonas pruni 0.011
6 Erwinia chrysanthemi 0.3604 40 Pseudomonas phaseolicola 0.0489 74 Chryseobacterium balustinum 0.0109
7 Erwinia herbicola 0.3604 41 Xanthomonas begoniae 0.0489 75 Hafnia alvei 0.0109
8 Pseudomonas cichorii 0.3604 42 Xanthomonas juglandis 0.0489 76 Micrococcus radiourans 0.0109
9 Pseudomonas fluorescens 0.3604 43 Xanthomonas phaseoli 0.0489 77 Ochrobactrum anthropi 0.0109
10 Pseudomonas syringae pv atrofaciens 0.3604 44 Corynebacterium michiganense pv Insidiosum 0.0488 78 Pseudomonas corrugata 0.0109
11 Pseudomonas syringae pv coronafaciens 0.3604 45 Corynebacterium michiganense pv Michiganense 0.0488 79 Pseudomonas eriobotryae 0.0109
12 Pseudomonas syringae pv lachrymans 0.3604 46 Pseudomonas alliicola 0.0488 80 Xanthomonas vitians 0.0109
13 Pseudomonas syringae pv maculicola 0.3604 47 Pseudomonas coronafaciens 0.0488 81 Bacillus subtilis 0.001
14 Pseudomonas syringae pv mori 0.3604 48 Pseudomonas delphinii 0.0488 82 Enterobacter cloacae 0.001
15 Pseudomonas syringae pv passiflorae 0.3604 49 Pseudomonas gladioli pv Gladioli 0.0488 83 Erwinia herbicola 0.001
16 Pseudomonas syringae pv pisi 0.3604 50 Pseudomonas lachrymans 0.0488 84 Pantoea ananatis 0.001
17 Pseudomonas syringae pv porri 0.3604 51 Pseudomonas mori 0.0488 85 Pseudomonas solanacearum 0.001
18 Pseudomonas syringae pv striafaciens 0.3604 52 Pseudomonas primulae 0.0488 86 Sphingomonas suberifaciens 0.001
19 Pseudomonas syringae pv syringae 0.3604 53 Pseudomonas savastanoi f sp Nerii 0.0488 87 Stenotrophomonas maltophilia 0.001
20 Pseudomonas syringae pv tabaci 0.3604 54 Pseudomonas syringae pv Maculicola 0.0488 88 Agrobacterium radiobacter 0.0009
21 Pseudomonas syringae pv tomato 0.3604 55 Pseudomonas syringae pv Mori 0.0488 89 Agrobacterium rubi 0.0009
22 Pseudomonas viridiflava 0.3604 56 Pseudomonas syringae pv tomato 0.0488 90 Bacillus thuringiensis 0.0009
23 Streptomyces scabies 0.3604 57 Pseudomonas tolaasi 0.0488 91 Burkholderia caryophylli 0.0009
24 Xanthomonas arboricola pv pruni 0.3604 58 Pseudomonas tomato 0.0488 92 Cellulomonas flavigena 0.0009
25 Xanthomonas campestris pv campestris 0.3604 59 Xanthomonas campestris pv vitians 0.0488 93 Chryseobacterium indologenes 0.0009
26 Xanthomonas campestris pv mangiferaeindicae 0.3604 60 Xanthomonas hyacinthi 0.0488 94 Citrobacter freundii 0.0009
27 Bacterium campestris 0.2186 61 Xanthomonas papavericola 0.0488 95 Enterobacter aerogenes 0.0009
28 Bacterium chrysanthemi 0.2186 62 Acidovorax avenae 0.0119 96 Enterobacter gergoviae 0.0009
29 Bacterium solanacearum 0.2186 63 Bacillus cereus 0.0119 97 Erwinia mangiferae 0.0009
30 Clavibacter michiganensis 0.0607 64 Burkholderia andropogonis 0.0119 98 Erwinia rhapontici 0.0009
31 Pseudomonas fluorescens 0.0605 65 Erwinia chrysanthemi 0.0119 99 Escherichia coli 0.0009
32 Pseudomonas putida 0.0605 66 Pseudomonas andropogonis 0.0119 100 Klebsiella oxytoca 0.0009
33 Pseudomonas maculicola 0.0598 67 Ralstonia solanacearum 0.0119 101 Klebsiella pneumoniae 0.0009
34 Pseudomonas viridiflava 0.0598 68 Pantoea agglomerans 0.0118 102 Methylobacterium mesophilum 0.0009
CRC10001 Final Report Page 124 of
172
Table 32 (continued).
Rank* Species risk index Rank* Species risk index Rank* Species risk index
103 Oerskovia turbata 0.0009 112 Bacillus mycoides 0.0001 121 Pseudomonas tonelliana 0.0001
104 Paenibacillus macerans 0.0009 113 Erwinia aroideae 0.0001 122 Serratia liquefaciens 0.0001
105 Pectobacterium atrosepticum 0.0009 114 Herbaspirillum huttiense 0.0001 123 Streptomyces scabiei 0.0001
106 Pseudomonas mors-prunorum 0.0009 115 Herbaspirillum rubrisubalbicans 0.0001 124 Xanthomonas antirrhini 0.0001
107 Pseudomonas savastanoi 0.0009 116 Pseudomonas aeruginosa 0.0001 125 Xanthomonas cucurbitae 0.0001
108 Rathayibacter toxicus 0.0009 117 Pseudomonas flectens 0.0001 126 Xanthomonas holcicola 0.0001
109 Rhizobium trifolii 0.0009 118 Pseudomonas glycinea 0.0001 127 Xanthomonas malvacearum 0.0001
110 Serratia fonticola 0.0009 119 Pseudomonas striafaciens 0.0001
111 Serratia proteamaculans 0.0009 120 Pseudomonas tabaci 0.0001

CRC10001 Final Report Page 125 of
172
Table 33. TAS bacterial pathogens risk list generated from SOM analysis of Australian distributional data. . * Species with the same risk index were ranked in alphabetical
order.
Rank* Species risk index Rank* Species risk index Rank* Species risk index
1 Curtobacterium flaccumfaciens 0.107 35 Pseudomonas syringae pv tomato 0.1037 69 Stenotrophomonas maltophilia 0.0022
2 Burkholderia cepacia 0.1058 36 Pseudomonas viridiflava 0.1037 70 Bacillus mycoides 0.0019
3 Burkholderia gladioli 0.1058 37 Pseudomonas cepacea 0.1037 71 Erwinia aroideae 0.0019
4 Corynebacterium michiganense 0.1056 38 Pseudomonas gladioli 0.1037 72 Herbaspirillum huttiense 0.0019
5 Agrobacterium vitis 0.1051 39 Pseudomonas syringae pv coriandricola 0.1037 73 Herbaspirillum rubrisubalbicans 0.0019
6 Pseudomonas syringae pv phaseolicola 0.1048 40 Pseudomonas syringae pv pisi 0.1037 74 Pseudomonas aeruginosa 0.0019
7 Clavibacter michiganense 0.1039 41 Streptomyces scabies 0.1037 75 Pseudomonas flectens 0.0019
8 Acidovorax avenae ss avenae 0.1037 42 Xanthomonas arboricola pv pruni 0.1037 76 Pseudomonas glycinea 0.0019
9 Acidovorax avenae ss citrulli 0.1037 43 Xanthomonas campestris pv campestris 0.1037 77 Pseudomonas striafaciens 0.0019
10 Burkholderia gladioli ss gladioli 0.1037 44 Xanthomonas campestris pv mangiferaeindicae 0.1037 78 Pseudomonas tabaci 0.0019
11 Clavibacter tritici 0.1037 45 Xanthomonas campestris pv begoniae 0.1037 79 Pseudomonas tonelliana 0.0019
12 Clavibacter michiganensis ss michiganensis 0.1037 46 Xanthomonas campestris pv carotae 0.1037 80 Serratia liquefaciens 0.0019
13 Clavibacter michiganense ss insidiosum 0.1037 47 Xanthomonas campestris pv incanae 0.1037 81 Streptomyces scabiei 0.0019
14 Clavibacter michiganense ss michiganense 0.1037 48 Xanthomonas campestris pv pelargonii 0.1037 82 Xanthomonas antirrhini 0.0019
15 Clavibacter toxicus 0.1037 49 Xanthomonas campestris pv pruni 0.1037 83 Xanthomonas cucurbitae 0.0019
16 Corynebacterium flaccumfaciens 0.1037 50 Xanthomonas fragariae 0.1037 84 Xanthomonas holcicola 0.0019
17 Erwinia carotovora ss carotovora 0.1037 51 Bacterium campestris 0.0231 85 Xanthomonas malvacearum 0.0019
18 Erwinia chrysanthemi 0.1037 52 Bacterium chrysanthemi 0.0231 86 Pantoea agglomerans 0.0014
19 Erwinia herbicola 0.1037 53 Bacterium solanacearum 0.0231 87 Pectobacterium carotovorum 0.0014
20 Erwinia cypripedii 0.1037 54 Acidovorax avenae 0.0033 88 Serratia marcescens 0.0014
21 Erwinia tracheiphila 0.1037 55 Bacillus cereus 0.0033 89 Chryseobacterium balustinum 0.0012
22 Pseudomonas cichorii 0.1037 56 Burkholderia andropogonis 0.0033 90 Hafnia alvei 0.0012
23 Pseudomonas fluorescens 0.1037 57 Erwinia chrysanthemi 0.0033 91 Micrococcus radiourans 0.0012
24 Pseudomonas syringae pv atrofaciens 0.1037 58 Pseudomonas andropogonis 0.0033 92 Ochrobactrum anthropi 0.0012
25 Pseudomonas syringae pv coronafaciens 0.1037 59 Ralstonia solanacearum 0.0033 93 Pseudomonas corrugata 0.0012
26 Pseudomonas syringae pv lachrymans 0.1037 60 Pseudomonas cichorii 0.0031 94 Pseudomonas eriobotryae 0.0012
27 Pseudomonas syringae pv maculicola 0.1037 61 Pseudomonas marginalis 0.0031 95 Xanthomonas vitians 0.0012
28 Pseudomonas syringae pv mori 0.1037 62 Xanthomonas pruni 0.0031 96 Agrobacterium radiobacter 0.0003
29 Pseudomonas syringae pv passiflorae 0.1037 63 Bacillus subtilis 0.0022 97 Agrobacterium rubi 0.0003
30 Pseudomonas syringae pv pisi 0.1037 64 Enterobacter cloacae 0.0022 98 Bacillus thuringiensis 0.0003
31 Pseudomonas syringae pv porri 0.1037 65 Erwinia herbicola 0.0022 99 Burkholderia caryophylli 0.0003
32 Pseudomonas syringae pv striafaciens 0.1037 66 Pantoea ananatis 0.0022 100 Cellulomonas flavigena 0.0003
33 Pseudomonas syringae pv syringae 0.1037 67 Pseudomonas solanacearum 0.0022 101 Chryseobacterium indologenes 0.0003
34 Pseudomonas syringae pv tabaci 0.1037 68 Sphingomonas suberifaciens 0.0022 102 Citrobacter freundii 0.0003

CRC10001 Final Report Page 126 of
172
Table 33 (continued).
Rank* Species risk index Rank* Species risk index Rank* Species risk index
103 Enterobacter aerogenes 0.0003 109 Klebsiella pneumoniae 0.0003 115 Pseudomonas savastanoi 0.0003
104 Enterobacter gergoviae 0.0003 110 Methylobacterium mesophilum 0.0003 116 Rathayibacter toxicus 0.0003
105 Erwinia mangiferae 0.0003 111 Oerskovia turbata 0.0003 117 Rhizobium trifolii 0.0003
106 Erwinia rhapontici 0.0003 112 Paenibacillus macerans 0.0003 118 Serratia fonticola 0.0003
107 Escherichia coli 0.0003 113 Pectobacterium atrosepticum 0.0003 119 Serratia proteamaculans 0.0003
108 Klebsiella oxytoca 0.0003 114 Pseudomonas mors-prunorum 0.0003
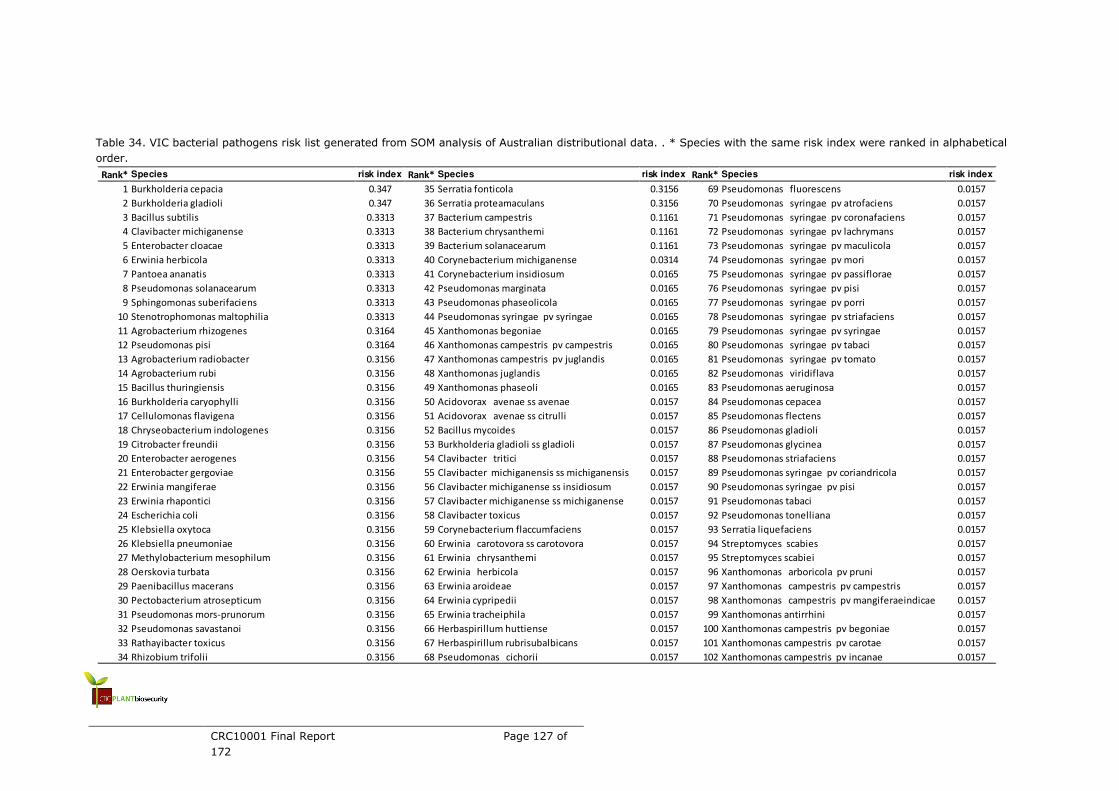
CRC10001 Final Report Page 127 of
172
Table 34. VIC bacterial pathogens risk list generated from SOM analysis of Australian distributional data. . * Species with the same risk index were ranked in alphabetical
order.
Rank* Species risk index Rank* Species risk index Rank* Species risk index
1 Burkholderia cepacia 0.347 35 Serratia fonticola 0.3156 69 Pseudomonas fluorescens 0.0157
2 Burkholderia gladioli 0.347 36 Serratia proteamaculans 0.3156 70 Pseudomonas syringae pv atrofaciens 0.0157
3 Bacillus subtilis 0.3313 37 Bacterium campestris 0.1161 71 Pseudomonas syringae pv coronafaciens 0.0157
4 Clavibacter michiganense 0.3313 38 Bacterium chrysanthemi 0.1161 72 Pseudomonas syringae pv lachrymans 0.0157
5 Enterobacter cloacae 0.3313 39 Bacterium solanacearum 0.1161 73 Pseudomonas syringae pv maculicola 0.0157
6 Erwinia herbicola 0.3313 40 Corynebacterium michiganense 0.0314 74 Pseudomonas syringae pv mori 0.0157
7 Pantoea ananatis 0.3313 41 Corynebacterium insidiosum 0.0165 75 Pseudomonas syringae pv passiflorae 0.0157
8 Pseudomonas solanacearum 0.3313 42 Pseudomonas marginata 0.0165 76 Pseudomonas syringae pv pisi 0.0157
9 Sphingomonas suberifaciens 0.3313 43 Pseudomonas phaseolicola 0.0165 77 Pseudomonas syringae pv porri 0.0157
10 Stenotrophomonas maltophilia 0.3313 44 Pseudomonas syringae pv syringae 0.0165 78 Pseudomonas syringae pv striafaciens 0.0157
11 Agrobacterium rhizogenes 0.3164 45 Xanthomonas begoniae 0.0165 79 Pseudomonas syringae pv syringae 0.0157
12 Pseudomonas pisi 0.3164 46 Xanthomonas campestris pv campestris 0.0165 80 Pseudomonas syringae pv tabaci 0.0157
13 Agrobacterium radiobacter 0.3156 47 Xanthomonas campestris pv juglandis 0.0165 81 Pseudomonas syringae pv tomato 0.0157
14 Agrobacterium rubi 0.3156 48 Xanthomonas juglandis 0.0165 82 Pseudomonas viridiflava 0.0157
15 Bacillus thuringiensis 0.3156 49 Xanthomonas phaseoli 0.0165 83 Pseudomonas aeruginosa 0.0157
16 Burkholderia caryophylli 0.3156 50 Acidovorax avenae ss avenae 0.0157 84 Pseudomonas cepacea 0.0157
17 Cellulomonas flavigena 0.3156 51 Acidovorax avenae ss citrulli 0.0157 85 Pseudomonas flectens 0.0157
18 Chryseobacterium indologenes 0.3156 52 Bacillus mycoides 0.0157 86 Pseudomonas gladioli 0.0157
19 Citrobacter freundii 0.3156 53 Burkholderia gladioli ss gladioli 0.0157 87 Pseudomonas glycinea 0.0157
20 Enterobacter aerogenes 0.3156 54 Clavibacter tritici 0.0157 88 Pseudomonas striafaciens 0.0157
21 Enterobacter gergoviae 0.3156 55 Clavibacter michiganensis ss michiganensis 0.0157 89 Pseudomonas syringae pv coriandricola 0.0157
22 Erwinia mangiferae 0.3156 56 Clavibacter michiganense ss insidiosum 0.0157 90 Pseudomonas syringae pv pisi 0.0157
23 Erwinia rhapontici 0.3156 57 Clavibacter michiganense ss michiganense 0.0157 91 Pseudomonas tabaci 0.0157
24 Escherichia coli 0.3156 58 Clavibacter toxicus 0.0157 92 Pseudomonas tonelliana 0.0157
25 Klebsiella oxytoca 0.3156 59 Corynebacterium flaccumfaciens 0.0157 93 Serratia liquefaciens 0.0157
26 Klebsiella pneumoniae 0.3156 60 Erwinia carotovora ss carotovora 0.0157 94 Streptomyces scabies 0.0157
27 Methylobacterium mesophilum 0.3156 61 Erwinia chrysanthemi 0.0157 95 Streptomyces scabiei 0.0157
28 Oerskovia turbata 0.3156 62 Erwinia herbicola 0.0157 96 Xanthomonas arboricola pv pruni 0.0157
29 Paenibacillus macerans 0.3156 63 Erwinia aroideae 0.0157 97 Xanthomonas campestris pv campestris 0.0157
30 Pectobacterium atrosepticum 0.3156 64 Erwinia cypripedii 0.0157 98 Xanthomonas campestris pv mangiferaeindicae 0.0157
31 Pseudomonas mors-prunorum 0.3156 65 Erwinia tracheiphila 0.0157 99 Xanthomonas antirrhini 0.0157
32 Pseudomonas savastanoi 0.3156 66 Herbaspirillum huttiense 0.0157 100 Xanthomonas campestris pv begoniae 0.0157
33 Rathayibacter toxicus 0.3156 67 Herbaspirillum rubrisubalbicans 0.0157 101 Xanthomonas campestris pv carotae 0.0157
34 Rhizobium trifolii 0.3156 68 Pseudomonas cichorii 0.0157 102 Xanthomonas campestris pv incanae 0.0157
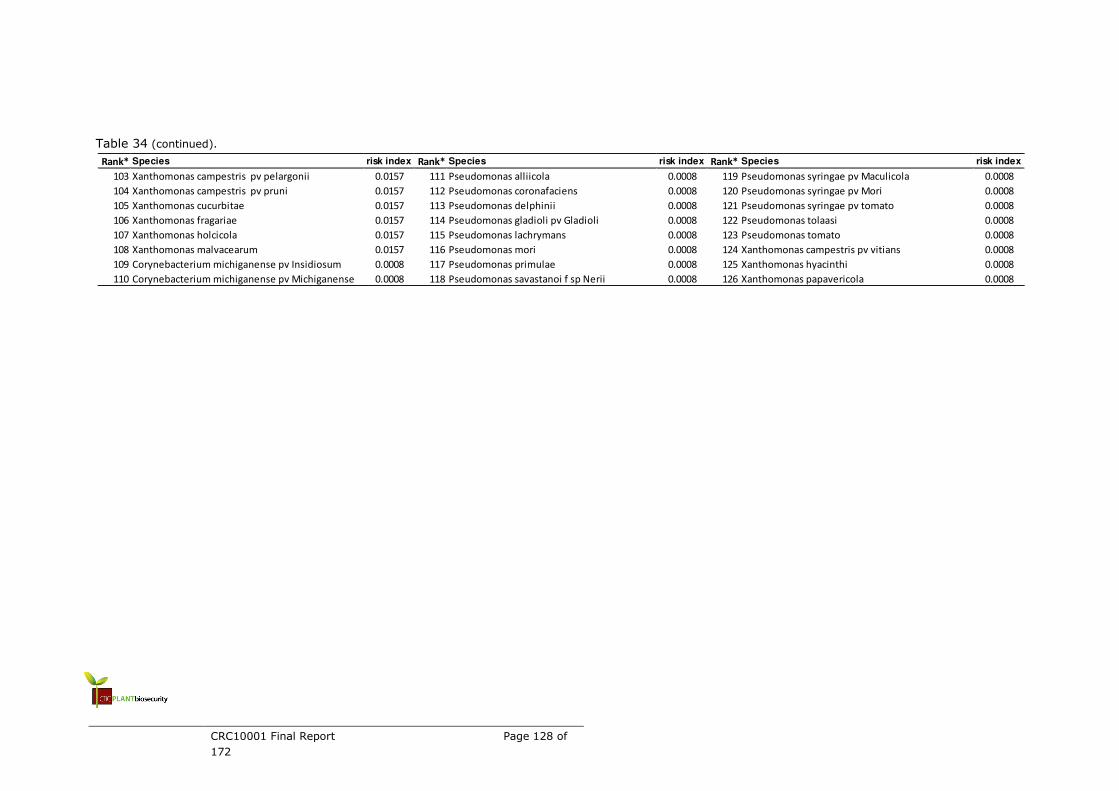
CRC10001 Final Report Page 128 of
172
Table 34 (continued).
Rank* Species risk index Rank* Species risk index Rank* Species risk index
103 Xanthomonas campestris pv pelargonii 0.0157 111 Pseudomonas alliicola 0.0008 119 Pseudomonas syringae pv Maculicola 0.0008
104 Xanthomonas campestris pv pruni 0.0157 112 Pseudomonas coronafaciens 0.0008 120 Pseudomonas syringae pv Mori 0.0008
105 Xanthomonas cucurbitae 0.0157 113 Pseudomonas delphinii 0.0008 121 Pseudomonas syringae pv tomato 0.0008
106 Xanthomonas fragariae 0.0157 114 Pseudomonas gladioli pv Gladioli 0.0008 122 Pseudomonas tolaasi 0.0008
107 Xanthomonas holcicola 0.0157 115 Pseudomonas lachrymans 0.0008 123 Pseudomonas tomato 0.0008
108 Xanthomonas malvacearum 0.0157 116 Pseudomonas mori 0.0008 124 Xanthomonas campestris pv vitians 0.0008
109 Corynebacterium michiganense pv Insidiosum 0.0008 117 Pseudomonas primulae 0.0008 125 Xanthomonas hyacinthi 0.0008
110 Corynebacterium michiganense pv Michiganense 0.0008 118 Pseudomonas savastanoi f sp Nerii 0.0008 126 Xanthomonas papavericola 0.0008

CRC10001 Final Report Page 129 of
172
Table 35. WA bacterial pathogens risk list generated from SOM analysis of Australian distributional data. . * Species with the same risk index were ranked in alphabetical
order.
Rank* Species risk index Rank* Species risk index Rank* Species risk index
1 Agrobacterium tumefaciens 0.421 35 Bacterium chrysanthemi 0.2186 69 Acidovorax avenae 0.0119
2 Erwinia carotovora 0.421 36 Bacterium solanacearum 0.2186 70 Bacillus cereus 0.0119
3 Pseudomonas syringae 0.421 37 Clavibacter michiganensis 0.0607 71 Burkholderia andropogonis 0.0119
4 Xanthomonas campestris 0.421 38 Pseudomonas fluorescens 0.0605 72 Erwinia chrysanthemi 0.0119
5 Streptomyces scabies 0.4209 39 Pseudomonas putida 0.0605 73 Pseudomonas andropogonis 0.0119
6 Corynebacterium insidiosum 0.4091 40 Pseudomonas maculicola 0.0598 74 Ralstonia solanacearum 0.0119
7 Pseudomonas syringae pv syringae 0.4091 41 Pseudomonas viridiflava 0.0598 75 Pantoea agglomerans 0.0118
8 Xanthomonas campestris pv campestris 0.4091 42 Xanthomonas vesicatoria 0.0598 76 Pectobacterium carotovorum 0.0118
9 Xanthomonas campestris pv juglandis 0.4091 43 Pseudomonas pseudoalcaligenes 0.0597 77 Serratia marcescens 0.0118
10 Curtobacterium flaccumfaciens 0.3723 44 Agrobacterium rhizogenes 0.0497 78 Pseudomonas cichorii 0.011
11 Agrobacterium vitis 0.3722 45 Pseudomonas pisi 0.0497 79 Pseudomonas marginalis 0.011
12 Pseudomonas syringae pv phaseolicola 0.3713 46 Pseudomonas marginata 0.0489 80 Xanthomonas pruni 0.011
13 Burkholderia cepacia 0.3614 47 Pseudomonas phaseolicola 0.0489 81 Chryseobacterium balustinum 0.0109
14 Burkholderia gladioli 0.3614 48 Xanthomonas begoniae 0.0489 82 Hafnia alvei 0.0109
15 Clavibacter michiganense 0.3613 49 Xanthomonas juglandis 0.0489 83 Micrococcus radiourans 0.0109
16 Corynebacterium michiganense 0.3605 50 Xanthomonas phaseoli 0.0489 84 Ochrobactrum anthropi 0.0109
17 Burkholderia gladioli ss gladioli 0.3604 51 Corynebacterium michiganense pv Insidiosum 0.0488 85 Pseudomonas corrugata 0.0109
18 Clavibacter michiganense ss insidiosum 0.3604 52 Corynebacterium michiganense pv Michiganense 0.0488 86 Pseudomonas eriobotryae 0.0109
19 Clavibacter michiganense ss michiganense 0.3604 53 Pseudomonas alliicola 0.0488 87 Xanthomonas vitians 0.0109
20 Clavibacter toxicus 0.3604 54 Pseudomonas coronafaciens 0.0488 88 Bacillus subtilis 0.001
21 Corynebacterium flaccumfaciens 0.3604 55 Pseudomonas delphinii 0.0488 89 Enterobacter cloacae 0.001
22 Erwinia cypripedii 0.3604 56 Pseudomonas gladioli pv Gladioli 0.0488 90 Erwinia herbicola 0.001
23 Erwinia tracheiphila 0.3604 57 Pseudomonas lachrymans 0.0488 91 Pantoea ananatis 0.001
24 Pseudomonas cepacea 0.3604 58 Pseudomonas mori 0.0488 92 Pseudomonas solanacearum 0.001
25 Pseudomonas gladioli 0.3604 59 Pseudomonas primulae 0.0488 93 Sphingomonas suberifaciens 0.001
26 Pseudomonas syringae pv coriandricola 0.3604 60 Pseudomonas savastanoi f sp Nerii 0.0488 94 Stenotrophomonas maltophilia 0.001
27 Pseudomonas syringae pv pisi 0.3604 61 Pseudomonas syringae pv Maculicola 0.0488 95 Agrobacterium radiobacter 0.0009
28 Xanthomonas campestris pv begoniae 0.3604 62 Pseudomonas syringae pv Mori 0.0488 96 Agrobacterium rubi 0.0009
29 Xanthomonas campestris pv carotae 0.3604 63 Pseudomonas syringae pv tomato 0.0488 97 Bacillus thuringiensis 0.0009
30 Xanthomonas campestris pv incanae 0.3604 64 Pseudomonas tolaasi 0.0488 98 Burkholderia caryophylli 0.0009
31 Xanthomonas campestris pv pelargonii 0.3604 65 Pseudomonas tomato 0.0488 99 Cellulomonas flavigena 0.0009
32 Xanthomonas campestris pv pruni 0.3604 66 Xanthomonas campestris pv vitians 0.0488 100 Chryseobacterium indologenes 0.0009
33 Xanthomonas fragariae 0.3604 67 Xanthomonas hyacinthi 0.0488 101 Citrobacter freundii 0.0009
34 Bacterium campestris 0.2186 68 Xanthomonas papavericola 0.0488 102 Enterobacter aerogenes 0.0009
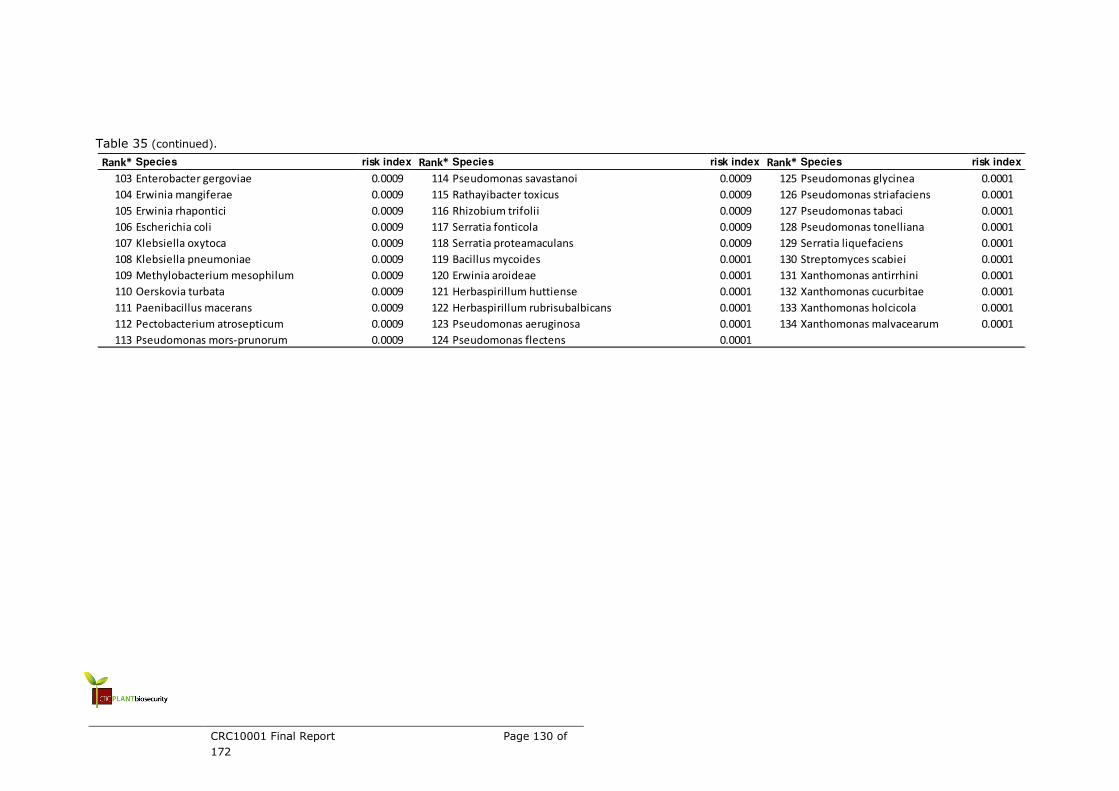
CRC10001 Final Report Page 130 of
172
Table 35 (continued).
Rank* Species risk index Rank* Species risk index Rank* Species risk index
103 Enterobacter gergoviae 0.0009 114 Pseudomonas savastanoi 0.0009 125 Pseudomonas glycinea 0.0001
104 Erwinia mangiferae 0.0009 115 Rathayibacter toxicus 0.0009 126 Pseudomonas striafaciens 0.0001
105 Erwinia rhapontici 0.0009 116 Rhizobium trifolii 0.0009 127 Pseudomonas tabaci 0.0001
106 Escherichia coli 0.0009 117 Serratia fonticola 0.0009 128 Pseudomonas tonelliana 0.0001
107 Klebsiella oxytoca 0.0009 118 Serratia proteamaculans 0.0009 129 Serratia liquefaciens 0.0001
108 Klebsiella pneumoniae 0.0009 119 Bacillus mycoides 0.0001 130 Streptomyces scabiei 0.0001
109 Methylobacterium mesophilum 0.0009 120 Erwinia aroideae 0.0001 131 Xanthomonas antirrhini 0.0001
110 Oerskovia turbata 0.0009 121 Herbaspirillum huttiense 0.0001 132 Xanthomonas cucurbitae 0.0001
111 Paenibacillus macerans 0.0009 122 Herbaspirillum rubrisubalbicans 0.0001 133 Xanthomonas holcicola 0.0001
112 Pectobacterium atrosepticum 0.0009 123 Pseudomonas aeruginosa 0.0001 134 Xanthomonas malvacearum 0.0001
113 Pseudomonas mors-prunorum 0.0009 124 Pseudomonas flectens 0.0001

CRC10001 Final Report Page 131 of
172
Table 36. NSW virus pathogens risk list generated from SOM analysis of Australian distributional data. . * Species with the same risk index were ranked in alphabetical
order.
Rank* Species risk index Rank* Species risk index Rank* Species risk index
1 Apple stem grooving virus 0.5554 38 Raspberry bushy dwarf virus 0.4432 75 Sweet potato feathery mottle virus 0.0134
2 Apple stem pitting virus 0.5554 39 Ryegrass cryptic virus 0.4432 76 Tobacco necrosis virus 0.0134
3 strawberry mild yellow edge virus 0.5421 40 Ryegrass mosaic virus 0.4432 77 Tobacco streak virus 0.0134
4 strawberry vein banding virus 0.5421 41 Viola mottle virus 0.4432 78 Tomato yellow leaf curl virus 0.0134
5 Poinsettia mosaic virus 0.4566 42 Prune dwarf virus 0.099 79 watermelon mosaic virus 2 0.0134
6 Beet mosaic virus 0.4443 43 Alstroemeria mosaic virus 0.0989 80 Australian grapevine viroid 0.0011
7 Broccoli necrotic yellows virus 0.4443 44 carrot mosaic virus Y 0.0989 81 Australian grapevine yellows 0.0011
8 Carrot mottle virus 0.4443 45 dasheen mosaic virus 0.0989 82 Broad bean stain virus 0.0011
9 Carrot red leaf virus 0.4443 46 Dianella chlorotic mottle virus 0.0989 83 Chlorotic leaf spot virus 0.0011
10 Lucerne transient streak virus 0.4443 47 grapevine fleck virus 0.0989 84 Chrysanthemum carlavirus B 0.0011
11 Strawberry latent ringspot virus 0.4443 48 Grapevine leafroll ass. virus 1 0.0989 85 Chrysanthemum stunt viroid 0.0011
12 Tobacco ringspot virus 0.4443 49 Grapevine leafroll ass. virus 3 0.0989 86 Echtes Ackerbohnenmosaik virus 0.0011
13 Tomato aspermy virus 0.4443 50 Grapevine rupestris stem pitting virus 0.0989 87 Frangipani mosaic virus 0.0011
14 Arabis mosaic virus 0.4432 51 grapevine virus A 0.0989 88 Garlic yellow streak virus 0.0011
15 Beet cryptic virus 1 0.4432 52 leek yellow stripe virus 0.0989 89 Grapevine yellow speckle viroid 1 0.0011
16 Beet cryptic virus 2 0.4432 53 Pear blister canker viroid 0.0989 90 Grapevine yellow speckle viroid 2 0.0011
17 Beet pseudoyellows virus 0.4432 54 strawberry mottle virus 0.0989 91 Hibiscus chlorotic ringspot virus 0.0011
18 Carnation etched ring virus 0.4432 55 strawberry pallidosis virus 0.0989 92 Hop stunt viroid 0.0011
19 Carnation vein mottle virus 0.4432 56 Tomato leaf curl virus 0.0135 93 Lilium symptomless virus 0.0011
20 Cereal yellow dwarf virus 0.4432 57 Alternanthera mosaic virus 0.0134 94 Nicotiana velutina mosaic virus 0.0011
21 Chrysanthemum virus B 0.4432 58 Apium virus Y 0.0134 95 Ribgrass mosaic virus 0.0011
22 Dahlia mosaic virus 0.4432 59 Bamboo mosaic virus 0.0134 96 Soybean dwarf virus 0.0011
23 Hop latent virus 0.4432 60 Banana bunchy top virus 0.0134 97 Subterranean clover mottle virus 0.0011
24 Hop mosaic virus 0.4432 61 Banana streak mysore virus 0.0134 98 Tomato ringspot virus 0.0011
25 Iris severe mosaic virus 0.4432 62 Barley stripe mosaic virus 0.0134 99 Tristeza virus 0.0011
26 Lily symptomless virus 0.4432 63 Blackeye cowpea mosaic virus 0.0134 100 Velvet tobacco mottle virus 0.0011
27 Lily virus X 0.4432 64 Chloris striate mosaic virus 0.0134 101 Squash mosaic virus 0.0003
28 Maize mosaic virus 0.4432 65 Datura yellow vein virus 0.0134 102 Apple mosaic virus 0.0001
29 Malva vein clearing virus 0.4432 66 Ginger chlorotic fleck virus 0.0134 103 Bean yellow mosaic virus 0.0001
30 Narcissus latent virus 0.4432 67 Kennedia yellow mosaic virus 0.0134 104 Carrot mottle virus 0.0001
31 Narcissus mosaic virus 0.4432 68 Pandanus ringspot virus 0.0134 105 Cowpea aphid borne mosaic virus 0.0001
32 Narcissus yellow stripe virus 0.4432 69 Parsley latent virus 0.0134 106 Cucumber mosaic virus 0.0001
33 Nerine latent virus 0.4432 70 Paspalum striate mosaic virus 0.0134 107 Iris yellow spot virus 0.0001
34 Nerine virus X 0.4432 71 Passiflora virus Y 0.0134 108 Prunus necrotic ringspot virus 0.0001
35 Nerine virus Y 0.4432 72 Soybean spherical virus 0.0134 109 Rupestris stem pitting-associated virus 0.0001
36 Nerine yellow stripe virus 0.4432 73 Sugarcane bacilliform virus 0.0134 110 Sweet potato feathery mottle virus 0.0001
37 Potato virus A 0.4432 74 Sweet potato chlorotic stunt virus 0.0134 111 Sweet potato virus 2 0.0001

CRC10001 Final Report Page 132 of
172
Table 37. NT virus pathogens risk list generated from SOM analysis of Australian distributional data. . * Species with the same risk index were ranked in alphabetical order.
Rank* Species risk index Rank* Species risk index Rank* Species risk index
1 Apple chlorotic leaf spot virus 0.5447 35 Cauliflower mosaic virus 0.0619 69 Subterranean clover mottle virus 0.0616
2 Turnip mosaic virus 0.5447 36 Cymbidium mosaic virus 0.0619 70 Tomato ringspot virus 0.0616
3 Tobacco mosaic virus 0.531 37 Grapevine fanleaf virus 0.0619 71 Tristeza virus 0.0616
4 Sugarcane mosaic virus 0.4692 38 Orchid fleck virus 0.0619 72 Velvet tobacco mottle virus 0.0616
5 Prune dwarf virus 0.469 39 Subterranean clover red leaf virus 0.0619 73 Apple mosaic virus 0.0278
6 Avocado Sun blotch viroid 0.4554 40 Beet mosaic virus 0.0618 74 Wheat streak mosaic virus 0.0278
7 Cherry rasp leaf virus 0.4554 41 Broccoli necrotic yellows virus 0.0618 75 Apple stem grooving virus 0.0276
8 Apple mosaic virus 0.4553 42 Carrot mottle virus 0.0618 76 Apple stem pitting virus 0.0276
9 Bean yellow mosaic virus 0.4553 43 Carrot red leaf virus 0.0618 77 Bean leafroll virus 0.0276
10 Carrot mottle virus 0.4553 44 Citrus exocortis viroid 0.0618 78 Carrot virus Y 0.0276
11 Cucumber mosaic virus 0.4553 45 Citrus psorosis 0.0618 79 Citrus tristeza 0.0276
12 Iris yellow spot virus 0.4553 46 Lucerne transient streak virus 0.0618 80 Bean common mosaic virus 0.0141
13 Prunus necrotic ringspot virus 0.4553 47 Lucerne witches broom 0.0618 81 Beet western yellows virus 0.0141
14 Rupestris stem pitting-associated virus 0.4553 48 Prune dwarf virus 0.0618 82 Broad bean wilt virus 0.0141
15 Sweet potato feathery mottle virus 0.4553 49 Strawberry latent ringspot virus 0.0618 83 carnation latent virus 0.0141
16 Sweet potato virus 2 0.4553 50 Tobacco ringspot virus 0.0618 84 carnation mottle virus 0.0141
17 Alfalfa mosaic virus 0.0894 51 Tomato aspermy virus 0.0618 85 iris mild mosaic virus 0.0141
18 Bean yellow mosaic virus 0.0894 52 Australian grapevine viroid 0.0616 86 Potato virus S 0.0141
19 cucumber mosaic virus 0.0894 53 Australian grapevine yellows 0.0616 87 Sowbane mosaic virus 0.0141
20 Potato leafroll virus 0.0894 54 Broad bean stain virus 0.0616 88 Strawberry crinkle virus 0.0141
21 Potato virus Y 0.0894 55 Chlorotic leaf spot virus 0.0616 89 Subterranean clover stunt virus 0.0141
22 Tobacco yellow dwarf virus 0.0894 56 Chrysanthemum carlavirus B 0.0616 90 tulip breaking virus 0.0141
23 Tomato spotted wilt virus 0.0894 57 Chrysanthemum stunt viroid 0.0616 91 white clover mosaic virus 0.0141
24 Celery mosaic virus 0.0893 58 Echtes Ackerbohnenmosaik virus 0.0616 92 Banana mild mosaic virus 0.0139
25 Pea Seed-borne Mosaic virus 0.0893 59 Frangipani mosaic virus 0.0616 93 Banana streak virus 0.0139
26 Barley yellow dwarf virus 0.0757 60 Garlic yellow streak virus 0.0616 94 Capsicum chlorosis virus 0.0139
27 Clover Yellow Vein virus 0.0757 61 Grapevine yellow speckle viroid 1 0.0616 95 High plains virus 0.0139
28 Lettuce mosaic virus 0.0757 62 Grapevine yellow speckle viroid 2 0.0616 96 Iris yellow spot virus 0.0139
29 Lettuce necrotic yellows virus 0.0757 63 Hibiscus chlorotic ringspot virus 0.0616 97 lettuce big vein virus 0.0139
30 Odontoglossum ringspot virus 0.0757 64 Hop stunt viroid 0.0616 98 Ornithogalum mosaic virus 0.0139
31 Potato virus X 0.0757 65 Lilium symptomless virus 0.0616 99 Passiflora latent virus 0.0139
32 Prunus necrotic ringspot virus 0.0757 66 Nicotiana velutina mosaic virus 0.0616 100 Passionfruit latent virus 0.0139
33 Tomato mosaic virus 0.0757 67 Ribgrass mosaic virus 0.0616 101 Peanut mottle virus 0.0139
34 Passionfruit woodiness virus 0.0755 68 Soybean dwarf virus 0.0616 102 Poinsettia mosaic virus 0.0139
CRC10001 Final Report Page 133 of
172
Table 37 (continued).
Rank* Species risk index Rank* Species risk index Rank* Species risk index
103 Solanum nodiflorum mottle virus 0.0139 137 strawberry pallidosis virus 0.0137 171 Chrysanthemum virus B 0.0002
104 Soybean mosaic virus 0.0139 138 Sugarcane bacilliform virus 0.0137 172 Citrus cachexia 0.0002
105 strawberry mild yellow edge virus 0.0139 139 Sweet potato chlorotic stunt virus 0.0137 173 Citrus tatter leaf 0.0002
106 strawberry vein banding virus 0.0139 140 Sweet potato feathery mottle virus 0.0137 174 Citrus vein enation 0.0002
107 Sunflower ringspot virus 0.0139 141 Tobacco necrosis virus 0.0137 175 Citrus xyloporosis 0.0002
108 Tomato big bud virus 0.0139 142 Tobacco streak virus 0.0137 176 Cymbidium ringspot virus 0.0002
109 Alstroemeria mosaic virus 0.0137 143 Tomato yellow leaf curl virus 0.0137 177 Dahlia mosaic virus 0.0002
110 Alternanthera mosaic virus 0.0137 144 watermelon mosaic virus 2 0.0137 178 Datura rugose 0.0002
111 Apium virus Y 0.0137 145 Freesia mosaic virus 0.0003 179 Fig mosaic virus 0.0002
112 Bamboo mosaic virus 0.0137 146 Onion yellow dwarf virus 0.0003 180 Hop latent virus 0.0002
113 Banana bunchy top virus 0.0137 147 Abutilon mosaic 0.0002 181 Hop mosaic virus 0.0002
114 Banana streak mysore virus 0.0137 148 Apple flat limb 0.0002 182 Iris mosaic virus 0.0002
115 Barley stripe mosaic virus 0.0137 149 Apple platycarpa 0.0002 183 Iris severe mosaic virus 0.0002
116 Blackeye cowpea mosaic virus 0.0137 150 Apple ring spot 0.0002 184 Lily symptomless virus 0.0002
117 carrot mosaic virus Y 0.0137 151 Apple russet ring 0.0002 185 Lily virus X 0.0002
118 Chloris striate mosaic virus 0.0137 152 Apricot ring pox 0.0002 186 Maize dwarf mosaic 0.0002
119 dasheen mosaic virus 0.0137 153 Arabis mosaic virus 0.0002 187 Maize mosaic virus 0.0002
120 Datura yellow vein virus 0.0137 154 Avocado pear sunblotch 0.0002 188 Malva vein clearing virus 0.0002
121 Dianella chlorotic mottle virus 0.0137 155 Bean summer death 0.0002 189 Narcissus latent virus 0.0002
122 Ginger chlorotic fleck virus 0.0137 156 Beet cryptic virus 1 0.0002 190 Narcissus mosaic virus 0.0002
123 grapevine fleck virus 0.0137 157 Beet cryptic virus 2 0.0002 191 Narcissus yellow stripe virus 0.0002
124 Grapevine leafroll ass. virus 1 0.0137 158 Beet pseudoyellows virus 0.0002 192 Nerine latent virus 0.0002
125 Grapevine leafroll ass. virus 3 0.0137 159 Cabbage black ring spot 0.0002 193 Nerine virus X 0.0002
126 Grapevine rupestris stem pitting virus 0.0137 160 Capsicum mosaic 0.0002 194 Nerine virus Y 0.0002
127 grapevine virus A 0.0137 161 Carnation etched ring virus 0.0002 195 Nerine yellow stripe virus 0.0002
128 Kennedia yellow mosaic virus 0.0137 162 Carnation mosaic 0.0002 196 Nothoscordum mosaic virus 0.0002
129 leek yellow stripe virus 0.0137 163 Carnation ringspot 0.0002 197 Parsley virus Y 0.0002
130 Pandanus ringspot virus 0.0137 164 Carnation vein mottle virus 0.0002 198 Patchouli mild mosaic virus 0.0002
131 Parsley latent virus 0.0137 165 Cereal yellow dwarf virus 0.0002 199 Pea pimple pod virus 0.0002
132 Paspalum striate mosaic virus 0.0137 166 Chenopodium mosaic 0.0002 200 Peach calico virus 0.0002
133 Passiflora virus Y 0.0137 167 Cherry black canker 0.0002 201 Peach ringspot virus 0.0002
134 Pear blister canker viroid 0.0137 168 Cherry mottle leaf 0.0002 202 Pear stony pit virus 0.0002
135 Soybean spherical virus 0.0137 169 Cherry ring spot 0.0002 203 Pelargonium leaf-curl virus 0.0002
136 strawberry mottle virus 0.0137 170 Cherry rugose mosaic 0.0002 204 Peony ringspot virus 0.0002

CRC10001 Final Report Page 134 of
172

CRC10001 Final Report Page 135 of
172
Table 37 (continued).
Rank* Species risk index Rank* Species risk index Rank* Species risk index
205 Pepper Mild Mottle virus 0.0002 212 Rose mosaic virus 0.0002 219 Stock mosaic virus 0.0002
206 Plum line pattern virus 0.0002 213 Rugose leaf curl virus 0.0002 220 Sugarcane Fiji disease 0.0002
207 Potato aucuba mosaic virus 0.0002 214 Rugose leaf mosaic virus 0.0002 221 Sweet potato russet crack 0.0002
208 Potato spindle tuber virus 0.0002 215 Ryegrass cryptic virus 0.0002 222 Tomato yellow top virus 0.0002
209 Potato virus A 0.0002 216 Ryegrass mosaic virus 0.0002 223 Turnip yellow mosaic virus 0.0002
210 Raspberry bushy dwarf virus 0.0002 217 Sobemovirus 0.0002 224 Viola mottle virus 0.0002
211 Rhubarb closterovirus 0.0002 218 Sow thistle yellow vein virus 0.0002 225 Witches broom virus 0.0002
CRC10001 Final Report Page 136 of
172
Table 38. QLD virus pathogens risk list generated from SOM analysis of Australian distributional data. . * Species with the same risk index were ranked in alphabetical
order.
Rank* Species risk index Rank* Species risk index Rank* Species risk index
1 Tobacco mosaic virus 0.1061 35 Lucerne transient streak virus 0.0275 69 Cherry rugose mosaic 0.0262
2 Barley yellow dwarf virus 0.0799 36 Lucerne witches broom 0.0275 70 Chrysanthemum virus B 0.0262
3 Odontoglossum ringspot virus 0.0799 37 Prune dwarf virus 0.0275 71 Citrus cachexia 0.0262
4 Prunus necrotic ringspot virus 0.0799 38 Strawberry latent ringspot virus 0.0275 72 Citrus tatter leaf 0.0262
5 carnation latent virus 0.0786 39 Tobacco ringspot virus 0.0275 73 Citrus vein enation 0.0262
6 carnation mottle virus 0.0786 40 Tomato aspermy virus 0.0275 74 Citrus xyloporosis 0.0262
7 iris mild mosaic virus 0.0786 41 Abutilon mosaic 0.0262 75 Cowpea aphid borne mosaic virus 0.0262
8 Strawberry crinkle virus 0.0786 42 Alstroemeria mosaic virus 0.0262 76 Cucumber mosaic virus 0.0262
9 Subterranean clover stunt virus 0.0786 43 Apple flat limb 0.0262 77 Cymbidium ringspot virus 0.0262
10 tulip breaking virus 0.0786 44 Apple mosaic virus 0.0262 78 Dahlia mosaic virus 0.0262
11 white clover mosaic virus 0.0786 45 Apple platycarpa 0.0262 79 dasheen mosaic virus 0.0262
12 Cauliflower mosaic virus 0.0537 46 Apple ring spot 0.0262 80 Datura rugose 0.0262
13 Cymbidium mosaic virus 0.0537 47 Apple russet ring 0.0262 81 Dianella chlorotic mottle virus 0.0262
14 Grapevine fanleaf virus 0.0537 48 Apricot ring pox 0.0262 82 Fig mosaic virus 0.0262
15 Orchid fleck virus 0.0537 49 Arabis mosaic virus 0.0262 83 grapevine fleck virus 0.0262
16 Subterranean clover red leaf virus 0.0537 50 Avocado pear sunblotch 0.0262 84 Grapevine leafroll ass. virus 1 0.0262
17 Avocado Sun blotch viroid 0.0524 51 Bean summer death 0.0262 85 Grapevine leafroll ass. virus 3 0.0262
18 Cherry rasp leaf virus 0.0524 52 Bean yellow mosaic virus 0.0262 86 Grapevine rupestris stem pitting virus 0.0262
19 Freesia mosaic virus 0.0524 53 Beet cryptic virus 1 0.0262 87 grapevine virus A 0.0262
20 Iris yellow spot virus 0.0524 54 Beet cryptic virus 2 0.0262 88 Hop latent virus 0.0262
21 lettuce big vein virus 0.0524 55 Beet pseudoyellows virus 0.0262 89 Hop mosaic virus 0.0262
22 Onion yellow dwarf virus 0.0524 56 Cabbage black ring spot 0.0262 90 Iris mosaic virus 0.0262
23 Ornithogalum mosaic virus 0.0524 57 Capsicum mosaic 0.0262 91 Iris severe mosaic virus 0.0262
24 Prune dwarf virus 0.0524 58 Carnation etched ring virus 0.0262 92 Iris yellow spot virus 0.0262
25 Squash mosaic virus 0.0524 59 Carnation mosaic 0.0262 93 leek yellow stripe virus 0.0262
26 strawberry mild yellow edge virus 0.0524 60 Carnation ringspot 0.0262 94 Lily symptomless virus 0.0262
27 strawberry vein banding virus 0.0524 61 Carnation vein mottle virus 0.0262 95 Lily virus X 0.0262
28 Tomato big bud virus 0.0524 62 carrot mosaic virus Y 0.0262 96 Maize dwarf mosaic 0.0262
29 Beet mosaic virus 0.0275 63 Carrot mottle virus 0.0262 97 Maize mosaic virus 0.0262
30 Broccoli necrotic yellows virus 0.0275 64 Cereal yellow dwarf virus 0.0262 98 Malva vein clearing virus 0.0262
31 Carrot mottle virus 0.0275 65 Chenopodium mosaic 0.0262 99 Narcissus latent virus 0.0262
32 Carrot red leaf virus 0.0275 66 Cherry black canker 0.0262 100 Narcissus mosaic virus 0.0262
33 Citrus exocortis viroid 0.0275 67 Cherry mottle leaf 0.0262 101 Narcissus yellow stripe virus 0.0262
34 Citrus psorosis 0.0275 68 Cherry ring spot 0.0262 102 Nerine latent virus 0.0262

CRC10001 Final Report Page 137 of
172
Table 38 (continued).
Rank* Species risk index Rank* Species risk index Rank* Species risk index
103 Nerine virus X 0.0262 124 Rose mosaic virus 0.0262 145 Broad bean stain virus 0.0013
104 Nerine virus Y 0.0262 125 Rugose leaf curl virus 0.0262 146 Chlorotic leaf spot virus 0.0013
105 Nerine yellow stripe virus 0.0262 126 Rugose leaf mosaic virus 0.0262 147 Chrysanthemum carlavirus B 0.0013
106 Nothoscordum mosaic virus 0.0262 127 Rupestris stem pitting-associated virus 0.0262 148 Chrysanthemum stunt viroid 0.0013
107 Parsley virus Y 0.0262 128 Ryegrass cryptic virus 0.0262 149 Echtes Ackerbohnenmosaik virus 0.0013
108 Patchouli mild mosaic virus 0.0262 129 Ryegrass mosaic virus 0.0262 150 Frangipani mosaic virus 0.0013
109 Pea pimple pod virus 0.0262 130 Sobemovirus 0.0262 151 Garlic yellow streak virus 0.0013
110 Peach calico virus 0.0262 131 Sow thistle yellow vein virus 0.0262 152 Grapevine yellow speckle viroid 1 0.0013
111 Peach ringspot virus 0.0262 132 Stock mosaic virus 0.0262 153 Grapevine yellow speckle viroid 2 0.0013
112 Pear blister canker viroid 0.0262 133 strawberry mottle virus 0.0262 154 Hibiscus chlorotic ringspot virus 0.0013
113 Pear stony pit virus 0.0262 134 strawberry pallidosis virus 0.0262 155 Hop stunt viroid 0.0013
114 Pelargonium leaf-curl virus 0.0262 135 Sugarcane Fiji disease 0.0262 156 Lilium symptomless virus 0.0013
115 Peony ringspot virus 0.0262 136 Sweet potato feathery mottle virus 0.0262 157 Nicotiana velutina mosaic virus 0.0013
116 Pepper Mild Mottle virus 0.0262 137 Sweet potato russet crack 0.0262 158 Ribgrass mosaic virus 0.0013
117 Plum line pattern virus 0.0262 138 Sweet potato virus 2 0.0262 159 Soybean dwarf virus 0.0013
118 Potato aucuba mosaic virus 0.0262 139 Tomato yellow top virus 0.0262 160 Subterranean clover mottle virus 0.0013
119 Potato spindle tuber virus 0.0262 140 Turnip yellow mosaic virus 0.0262 161 Tomato ringspot virus 0.0013
120 Potato virus A 0.0262 141 Viola mottle virus 0.0262 162 Tristeza virus 0.0013
121 Prunus necrotic ringspot virus 0.0262 142 Witches broom virus 0.0262 163 Velvet tobacco mottle virus 0.0013
122 Raspberry bushy dwarf virus 0.0262 143 Australian grapevine viroid 0.0013
123 Rhubarb closterovirus 0.0262 144 Australian grapevine yellows 0.0013
CRC10001 Final Report Page 138 of
172
Table 39. SA virus pathogens risk list generated from SOM analysis of Australian distributional data. . * Species with the same risk index were ranked in alphabetical order.
Rank* Species risk index Rank* Species risk index Rank* Species risk index
1 Papaya ringspot virus 0.3318 35 Pear blister canker viroid 0.1487 69 Soybean mosaic virus 0.0027
2 Watermelon mosaic virus 0.2416 36 strawberry mottle virus 0.1487 70 Sunflower ringspot virus 0.0027
3 Prune dwarf virus 0.2389 37 strawberry pallidosis virus 0.1487 71 Abutilon mosaic 0.0017
4 Squash mosaic virus 0.1804 38 Johnsongrass mosaic virus 0.0929 72 Apple flat limb 0.0017
5 Apple mosaic virus 0.153 39 Sugarcane mosaic virus 0.0929 73 Apple platycarpa 0.0017
6 Wheat streak mosaic virus 0.153 40 Avocado Sun blotch viroid 0.0919 74 Apple ring spot 0.0017
7 carnation latent virus 0.152 41 Cherry rasp leaf virus 0.0919 75 Apple russet ring 0.0017
8 carnation mottle virus 0.152 42 Tomato leaf curl virus 0.0912 76 Apricot ring pox 0.0017
9 iris mild mosaic virus 0.152 43 Apple mosaic virus 0.0902 77 Arabis mosaic virus 0.0017
10 Strawberry crinkle virus 0.152 44 Bean yellow mosaic virus 0.0902 78 Avocado pear sunblotch 0.0017
11 Subterranean clover stunt virus 0.152 45 Carrot mottle virus 0.0902 79 Bean summer death 0.0017
12 tulip breaking virus 0.152 46 Cowpea aphid borne mosaic virus 0.0902 80 Beet cryptic virus 1 0.0017
13 white clover mosaic virus 0.152 47 Cucumber mosaic virus 0.0902 81 Beet cryptic virus 2 0.0017
14 Apple stem grooving virus 0.1514 48 Iris yellow spot virus 0.0902 82 Beet pseudoyellows virus 0.0017
15 Apple stem pitting virus 0.1514 49 Prunus necrotic ringspot virus 0.0902 83 Cabbage black ring spot 0.0017
16 Bean leafroll virus 0.1514 50 Rupestris stem pitting-associated virus 0.0902 84 Capsicum mosaic 0.0017
17 Carrot virus Y 0.1514 51 Sweet potato feathery mottle virus 0.0902 85 Carnation etched ring virus 0.0017
18 Citrus tristeza 0.1514 52 Sweet potato virus 2 0.0902 86 Carnation mosaic 0.0017
19 Iris yellow spot virus 0.1504 53 Bean common mosaic virus 0.0043 87 Carnation ringspot 0.0017
20 lettuce big vein virus 0.1504 54 Beet western yellows virus 0.0043 88 Carnation vein mottle virus 0.0017
21 Ornithogalum mosaic virus 0.1504 55 Broad bean wilt virus 0.0043 89 Cereal yellow dwarf virus 0.0017
22 strawberry mild yellow edge virus 0.1504 56 Potato virus S 0.0043 90 Chenopodium mosaic 0.0017
23 strawberry vein banding virus 0.1504 57 Sowbane mosaic virus 0.0043 91 Cherry black canker 0.0017
24 Tomato big bud virus 0.1504 58 Freesia mosaic virus 0.0033 92 Cherry mottle leaf 0.0017
25 Alstroemeria mosaic virus 0.1487 59 Onion yellow dwarf virus 0.0033 93 Cherry ring spot 0.0017
26 carrot mosaic virus Y 0.1487 60 Banana mild mosaic virus 0.0027 94 Cherry rugose mosaic 0.0017
27 dasheen mosaic virus 0.1487 61 Banana streak virus 0.0027 95 Chrysanthemum virus B 0.0017
28 Dianella chlorotic mottle virus 0.1487 62 Capsicum chlorosis virus 0.0027 96 Citrus cachexia 0.0017
29 grapevine fleck virus 0.1487 63 High plains virus 0.0027 97 Citrus tatter leaf 0.0017
30 Grapevine leafroll ass. virus 1 0.1487 64 Passiflora latent virus 0.0027 98 Citrus vein enation 0.0017
31 Grapevine leafroll ass. virus 3 0.1487 65 Passionfruit latent virus 0.0027 99 Citrus xyloporosis 0.0017
32 Grapevine rupestris stem pitting virus 0.1487 66 Peanut mottle virus 0.0027 100 Cymbidium ringspot virus 0.0017
33 grapevine virus A 0.1487 67 Poinsettia mosaic virus 0.0027 101 Dahlia mosaic virus 0.0017
34 leek yellow stripe virus 0.1487 68 Solanum nodiflorum mottle virus 0.0027 102 Datura rugose 0.0017

CRC10001 Final Report Page 139 of
172
Table 39 (continued).
Rank* Species risk index Rank* Species risk index Rank* Species risk index
103 Fig mosaic virus 0.0017 127 Pelargonium leaf-curl virus 0.0017 151 Apium virus Y 0.001
104 Hop latent virus 0.0017 128 Peony ringspot virus 0.0017 152 Bamboo mosaic virus 0.001
105 Hop mosaic virus 0.0017 129 Pepper Mild Mottle virus 0.0017 153 Banana bunchy top virus 0.001
106 Iris mosaic virus 0.0017 130 Plum line pattern virus 0.0017 154 Banana streak mysore virus 0.001
107 Iris severe mosaic virus 0.0017 131 Potato aucuba mosaic virus 0.0017 155 Barley stripe mosaic virus 0.001
108 Lily symptomless virus 0.0017 132 Potato spindle tuber virus 0.0017 156 Blackeye cowpea mosaic virus 0.001
109 Lily virus X 0.0017 133 Potato virus A 0.0017 157 Chloris striate mosaic virus 0.001
110 Maize dwarf mosaic 0.0017 134 Raspberry bushy dwarf virus 0.0017 158 Datura yellow vein virus 0.001
111 Maize mosaic virus 0.0017 135 Rhubarb closterovirus 0.0017 159 Ginger chlorotic fleck virus 0.001
112 Malva vein clearing virus 0.0017 136 Rose mosaic virus 0.0017 160 Kennedia yellow mosaic virus 0.001
113 Narcissus latent virus 0.0017 137 Rugose leaf curl virus 0.0017 161 Pandanus ringspot virus 0.001
114 Narcissus mosaic virus 0.0017 138 Rugose leaf mosaic virus 0.0017 162 Parsley latent virus 0.001
115 Narcissus yellow stripe virus 0.0017 139 Ryegrass cryptic virus 0.0017 163 Paspalum striate mosaic virus 0.001
116 Nerine latent virus 0.0017 140 Ryegrass mosaic virus 0.0017 164 Passiflora virus Y 0.001
117 Nerine virus X 0.0017 141 Sobemovirus 0.0017 165 Soybean spherical virus 0.001
118 Nerine virus Y 0.0017 142 Sow thistle yellow vein virus 0.0017 166 Sugarcane bacilliform virus 0.001
119 Nerine yellow stripe virus 0.0017 143 Stock mosaic virus 0.0017 167 Sweet potato chlorotic stunt virus 0.001
120 Nothoscordum mosaic virus 0.0017 144 Sugarcane Fiji disease 0.0017 168 Sweet potato feathery mottle virus 0.001
121 Parsley virus Y 0.0017 145 Sweet potato russet crack 0.0017 169 Tobacco necrosis virus 0.001
122 Patchouli mild mosaic virus 0.0017 146 Tomato yellow top virus 0.0017 170 Tobacco streak virus 0.001
123 Pea pimple pod virus 0.0017 147 Turnip yellow mosaic virus 0.0017 171 Tomato yellow leaf curl virus 0.001
124 Peach calico virus 0.0017 148 Viola mottle virus 0.0017 172 watermelon mosaic virus 2 0.001
125 Peach ringspot virus 0.0017 149 Witches broom virus 0.0017
126 Pear stony pit virus 0.0017 150 Alternanthera mosaic virus 0.001

CRC10001 Final Report Page 140 of
172
Table 40. TAS virus pathogens risk list generated from SOM analysis of Australian distributional data. . * Species with the same risk index were ranked in alphabetical
order.
Rank* Species risk index Rank* Species risk index Rank* Species risk index
1 Celery mosaic virus 0.5565 35 Apple russet ring 0.4432 69 Potato spindle tuber virus 0.4432
2 Pea Seed-borne Mosaic virus 0.5565 36 Apricot ring pox 0.4432 70 Rhubarb closterovirus 0.4432
3 Papaya ringspot virus 0.5557 37 Avocado pear sunblotch 0.4432 71 Rose mosaic virus 0.4432
4 Watermelon mosaic virus 0.5556 38 Bean summer death 0.4432 72 Rugose leaf curl virus 0.4432
5 Bean leafroll virus 0.5554 39 Cabbage black ring spot 0.4432 73 Rugose leaf mosaic virus 0.4432
6 Carrot virus Y 0.5554 40 Capsicum mosaic 0.4432 74 Sobemovirus 0.4432
7 Citrus tristeza 0.5554 41 Carnation mosaic 0.4432 75 Sow thistle yellow vein virus 0.4432
8 Iris yellow spot virus 0.5421 42 Carnation ringspot 0.4432 76 Stock mosaic virus 0.4432
9 lettuce big vein virus 0.5421 43 Chenopodium mosaic 0.4432 77 Sugarcane Fiji disease 0.4432
10 Ornithogalum mosaic virus 0.5421 44 Cherry black canker 0.4432 78 Sweet potato russet crack 0.4432
11 Tomato big bud virus 0.5421 45 Cherry mottle leaf 0.4432 79 Tomato yellow top virus 0.4432
12 Passionfruit woodiness virus 0.4576 46 Cherry ring spot 0.4432 80 Turnip yellow mosaic virus 0.4432
13 Johnsongrass mosaic virus 0.4567 47 Cherry rugose mosaic 0.4432 81 Witches broom virus 0.4432
14 Sugarcane mosaic virus 0.4567 48 Citrus cachexia 0.4432 82 Prune dwarf virus 0.099
15 Banana mild mosaic virus 0.4566 49 Citrus tatter leaf 0.4432 83 Alstroemeria mosaic virus 0.0989
16 Banana streak virus 0.4566 50 Citrus vein enation 0.4432 84 carrot mosaic virus Y 0.0989
17 Capsicum chlorosis virus 0.4566 51 Citrus xyloporosis 0.4432 85 dasheen mosaic virus 0.0989
18 High plains virus 0.4566 52 Cymbidium ringspot virus 0.4432 86 Dianella chlorotic mottle virus 0.0989
19 Passiflora latent virus 0.4566 53 Datura rugose 0.4432 87 grapevine fleck virus 0.0989
20 Passionfruit latent virus 0.4566 54 Fig mosaic virus 0.4432 88 Grapevine leafroll ass. virus 1 0.0989
21 Peanut mottle virus 0.4566 55 Iris mosaic virus 0.4432 89 Grapevine leafroll ass. virus 3 0.0989
22 Solanum nodiflorum mottle virus 0.4566 56 Maize dwarf mosaic 0.4432 90 Grapevine rupestris stem pitting virus 0.0989
23 Soybean mosaic virus 0.4566 57 Nothoscordum mosaic virus 0.4432 91 grapevine virus A 0.0989
24 Sunflower ringspot virus 0.4566 58 Parsley virus Y 0.4432 92 leek yellow stripe virus 0.0989
25 Citrus exocortis viroid 0.4443 59 Patchouli mild mosaic virus 0.4432 93 Pear blister canker viroid 0.0989
26 Citrus psorosis 0.4443 60 Pea pimple pod virus 0.4432 94 strawberry mottle virus 0.0989
27 Lucerne witches broom 0.4443 61 Peach calico virus 0.4432 95 strawberry pallidosis virus 0.0989
28 Prune dwarf virus 0.4443 62 Peach ringspot virus 0.4432 96 Tomato leaf curl virus 0.0135
29 Avocado Sun blotch viroid 0.4433 63 Pear stony pit virus 0.4432 97 Alternanthera mosaic virus 0.0134
30 Cherry rasp leaf virus 0.4433 64 Pelargonium leaf-curl virus 0.4432 98 Apium virus Y 0.0134
31 Abutilon mosaic 0.4432 65 Peony ringspot virus 0.4432 99 Bamboo mosaic virus 0.0134
32 Apple flat limb 0.4432 66 Pepper Mild Mottle virus 0.4432 100 Banana bunchy top virus 0.0134
33 Apple platycarpa 0.4432 67 Plum line pattern virus 0.4432 101 Banana streak mysore virus 0.0134
34 Apple ring spot 0.4432 68 Potato aucuba mosaic virus 0.4432 102 Barley stripe mosaic virus 0.0134
CRC10001 Final Report Page 141 of
172
Table 40 (continued).
Rank* Species risk index Rank* Species risk index Rank* Species risk index
103 Blackeye cowpea mosaic virus 0.0134 120 Australian grapevine viroid 0.0011 137 Subterranean clover mottle virus 0.0011
104 Chloris striate mosaic virus 0.0134 121 Australian grapevine yellows 0.0011 138 Tomato ringspot virus 0.0011
105 Datura yellow vein virus 0.0134 122 Broad bean stain virus 0.0011 139 Tristeza virus 0.0011
106 Ginger chlorotic fleck virus 0.0134 123 Chlorotic leaf spot virus 0.0011 140 Velvet tobacco mottle virus 0.0011
107 Kennedia yellow mosaic virus 0.0134 124 Chrysanthemum carlavirus B 0.0011 141 Squash mosaic virus 0.0003
108 Pandanus ringspot virus 0.0134 125 Chrysanthemum stunt viroid 0.0011 142 Apple mosaic virus 0.0001
109 Parsley latent virus 0.0134 126 Echtes Ackerbohnenmosaik virus 0.0011 143 Bean yellow mosaic virus 0.0001
110 Paspalum striate mosaic virus 0.0134 127 Frangipani mosaic virus 0.0011 144 Carrot mottle virus 0.0001
111 Passiflora virus Y 0.0134 128 Garlic yellow streak virus 0.0011 145 Cowpea aphid borne mosaic virus 0.0001
112 Soybean spherical virus 0.0134 129 Grapevine yellow speckle viroid 1 0.0011 146 Cucumber mosaic virus 0.0001
113 Sugarcane bacilliform virus 0.0134 130 Grapevine yellow speckle viroid 2 0.0011 147 Iris yellow spot virus 0.0001
114 Sweet potato chlorotic stunt virus 0.0134 131 Hibiscus chlorotic ringspot virus 0.0011 148 Prunus necrotic ringspot virus 0.0001
115 Sweet potato feathery mottle virus 0.0134 132 Hop stunt viroid 0.0011 149 Rupestris stem pitting-associated virus 0.0001
116 Tobacco necrosis virus 0.0134 133 Lilium symptomless virus 0.0011 150 Sweet potato feathery mottle virus 0.0001
117 Tobacco streak virus 0.0134 134 Nicotiana velutina mosaic virus 0.0011 151 Sweet potato virus 2 0.0001
118 Tomato yellow leaf curl virus 0.0134 135 Ribgrass mosaic virus 0.0011
119 watermelon mosaic virus 2 0.0134 136 Soybean dwarf virus 0.0011

CRC10001 Final Report Page 142 of
172
Table 41. VIC virus pathogens risk list generated from SOM analysis of Australian distributional data. . * Species with the same risk index were ranked in alphabetical order.
Rank* Species risk index Rank* Species risk index Rank* Species risk index
1 Zucchini Yellow Mosaic virus 0.4318 35 Banana mild mosaic virus 0.1439 69 Chenopodium mosaic 0.1268
2 Clover Yellow Vein virus 0.3975 36 Banana streak virus 0.1439 70 Cherry black canker 0.1268
3 Lettuce mosaic virus 0.3975 37 Capsicum chlorosis virus 0.1439 71 Cherry mottle leaf 0.1268
4 Lettuce necrotic yellows virus 0.3975 38 Cherry rasp leaf virus 0.1439 72 Cherry ring spot 0.1268
5 Potato virus X 0.3975 39 High plains virus 0.1439 73 Cherry rugose mosaic 0.1268
6 Tomato mosaic virus 0.3975 40 Passiflora latent virus 0.1439 74 Chlorotic leaf spot virus 0.1268
7 Cauliflower mosaic virus 0.3803 41 Passionfruit latent virus 0.1439 75 Chrysanthemum carlavirus B 0.1268
8 Cymbidium mosaic virus 0.3803 42 Peanut mottle virus 0.1439 76 Chrysanthemum stunt viroid 0.1268
9 Grapevine fanleaf virus 0.3803 43 Poinsettia mosaic virus 0.1439 77 Chrysanthemum virus B 0.1268
10 Orchid fleck virus 0.3803 44 Solanum nodiflorum mottle virus 0.1439 78 Citrus cachexia 0.1268
11 Subterranean clover red leaf virus 0.3803 45 Soybean mosaic virus 0.1439 79 Citrus tatter leaf 0.1268
12 Bean common mosaic virus 0.2707 46 Sunflower ringspot virus 0.1439 80 Citrus vein enation 0.1268
13 Beet western yellows virus 0.2707 47 Abutilon mosaic 0.1268 81 Citrus xyloporosis 0.1268
14 Broad bean wilt virus 0.2707 48 Apple flat limb 0.1268 82 Cymbidium ringspot virus 0.1268
15 Passionfruit woodiness virus 0.2707 49 Apple platycarpa 0.1268 83 Dahlia mosaic virus 0.1268
16 Potato virus S 0.2707 50 Apple ring spot 0.1268 84 Datura rugose 0.1268
17 Sowbane mosaic virus 0.2707 51 Apple russet ring 0.1268 85 Echtes Ackerbohnenmosaik virus 0.1268
18 Beet mosaic virus 0.2536 52 Apricot ring pox 0.1268 86 Fig mosaic virus 0.1268
19 Broccoli necrotic yellows virus 0.2536 53 Arabis mosaic virus 0.1268 87 Frangipani mosaic virus 0.1268
20 Carrot mottle virus 0.2536 54 Australian grapevine viroid 0.1268 88 Garlic yellow streak virus 0.1268
21 Carrot red leaf virus 0.2536 55 Australian grapevine yellows 0.1268 89 Grapevine yellow speckle viroid 1 0.1268
22 Citrus exocortis viroid 0.2536 56 Avocado pear sunblotch 0.1268 90 Grapevine yellow speckle viroid 2 0.1268
23 Citrus psorosis 0.2536 57 Bean summer death 0.1268 91 Hibiscus chlorotic ringspot virus 0.1268
24 Freesia mosaic virus 0.2536 58 Beet cryptic virus 1 0.1268 92 Hop latent virus 0.1268
25 Lucerne transient streak virus 0.2536 59 Beet cryptic virus 2 0.1268 93 Hop mosaic virus 0.1268
26 Lucerne witches broom 0.2536 60 Beet pseudoyellows virus 0.1268 94 Hop stunt viroid 0.1268
27 Onion yellow dwarf virus 0.2536 61 Broad bean stain virus 0.1268 95 Iris mosaic virus 0.1268
28 Prune dwarf virus 0.2536 62 Cabbage black ring spot 0.1268 96 Iris severe mosaic virus 0.1268
29 Strawberry latent ringspot virus 0.2536 63 Capsicum mosaic 0.1268 97 Lilium symptomless virus 0.1268
30 Tobacco ringspot virus 0.2536 64 Carnation etched ring virus 0.1268 98 Lily symptomless virus 0.1268
31 Tomato aspermy virus 0.2536 65 Carnation mosaic 0.1268 99 Lily virus X 0.1268
32 Johnsongrass mosaic virus 0.1611 66 Carnation ringspot 0.1268 100 Maize dwarf mosaic 0.1268
33 Sugarcane mosaic virus 0.1611 67 Carnation vein mottle virus 0.1268 101 Maize mosaic virus 0.1268
34 Avocado Sun blotch viroid 0.1439 68 Cereal yellow dwarf virus 0.1268 102 Malva vein clearing virus 0.1268

CRC10001 Final Report Page 143 of
172
Table 41 (continued).
Rank* Species risk index Rank* Species risk index Rank* Species risk index
103 Narcissus latent virus 0.1268 130 Rugose leaf mosaic virus 0.1268 157 Blackeye cowpea mosaic virus 0.0172
104 Narcissus mosaic virus 0.1268 131 Ryegrass cryptic virus 0.1268 158 Carrot mottle virus 0.0172
105 Narcissus yellow stripe virus 0.1268 132 Ryegrass mosaic virus 0.1268 159 Chloris striate mosaic virus 0.0172
106 Nerine latent virus 0.1268 133 Sobemovirus 0.1268 160 Cowpea aphid borne mosaic virus 0.0172
107 Nerine virus X 0.1268 134 Sow thistle yellow vein virus 0.1268 161 Cucumber mosaic virus 0.0172
108 Nerine virus Y 0.1268 135 Soybean dwarf virus 0.1268 162 Datura yellow vein virus 0.0172
109 Nerine yellow stripe virus 0.1268 136 Stock mosaic virus 0.1268 163 Ginger chlorotic fleck virus 0.0172
110 Nicotiana velutina mosaic virus 0.1268 137 Subterranean clover mottle virus 0.1268 164 Iris yellow spot virus 0.0172
111 Nothoscordum mosaic virus 0.1268 138 Sugarcane Fiji disease 0.1268 165 Kennedia yellow mosaic virus 0.0172
112 Parsley virus Y 0.1268 139 Sweet potato russet crack 0.1268 166 Pandanus ringspot virus 0.0172
113 Patchouli mild mosaic virus 0.1268 140 Tomato ringspot virus 0.1268 167 Parsley latent virus 0.0172
114 Pea pimple pod virus 0.1268 141 Tomato yellow top virus 0.1268 168 Paspalum striate mosaic virus 0.0172
115 Peach calico virus 0.1268 142 Tristeza virus 0.1268 169 Passiflora virus Y 0.0172
116 Peach ringspot virus 0.1268 143 Turnip yellow mosaic virus 0.1268 170 Prunus necrotic ringspot virus 0.0172
117 Pear stony pit virus 0.1268 144 Velvet tobacco mottle virus 0.1268 171 Rupestris stem pitting-associated virus 0.0172
118 Pelargonium leaf-curl virus 0.1268 145 Viola mottle virus 0.1268 172 Soybean spherical virus 0.0172
119 Peony ringspot virus 0.1268 146 Witches broom virus 0.1268 173 Sugarcane bacilliform virus 0.0172
120 Pepper Mild Mottle virus 0.1268 147 Squash mosaic virus 0.0343 174 Sweet potato chlorotic stunt virus 0.0172
121 Plum line pattern virus 0.1268 148 Tomato leaf curl virus 0.0343 175 Sweet potato feathery mottle virus 0.0172
122 Potato aucuba mosaic virus 0.1268 149 Alternanthera mosaic virus 0.0172 176 Sweet potato feathery mottle virus 0.0172
123 Potato spindle tuber virus 0.1268 150 Apium virus Y 0.0172 177 Sweet potato virus 2 0.0172
124 Potato virus A 0.1268 151 Apple mosaic virus 0.0172 178 Tobacco necrosis virus 0.0172
125 Raspberry bushy dwarf virus 0.1268 152 Bamboo mosaic virus 0.0172 179 Tobacco streak virus 0.0172
126 Rhubarb closterovirus 0.1268 153 Banana bunchy top virus 0.0172 180 Tomato yellow leaf curl virus 0.0172
127 Ribgrass mosaic virus 0.1268 154 Banana streak mysore virus 0.0172 181 watermelon mosaic virus 2 0.0172
128 Rose mosaic virus 0.1268 155 Barley stripe mosaic virus 0.0172
129 Rugose leaf curl virus 0.1268 156 Bean yellow mosaic virus 0.0172

CRC10001 Final Report Page 144 of
172
Table 42. WA virus pathogens risk list generated from SOM analysis of Australian distributional data. . * Species with the same risk index were ranked in alphabetical order.
Rank* Species risk index Rank* Species risk index Rank* Species risk index
1 Watermelon mosaic virus 0.4829 35 Lucerne witches broom 0.0618 69 Beet western yellows virus 0.0141
2 Johnsongrass mosaic virus 0.4692 36 Prune dwarf virus 0.0618 70 Broad bean wilt virus 0.0141
3 Tomato leaf curl virus 0.469 37 Strawberry latent ringspot virus 0.0618 71 carnation latent virus 0.0141
4 Cowpea aphid borne mosaic virus 0.4553 38 Tobacco ringspot virus 0.0618 72 carnation mottle virus 0.0141
5 Alfalfa mosaic virus 0.0894 39 Tomato aspermy virus 0.0618 73 iris mild mosaic virus 0.0141
6 Bean yellow mosaic virus 0.0894 40 Australian grapevine viroid 0.0616 74 Potato virus S 0.0141
7 cucumber mosaic virus 0.0894 41 Australian grapevine yellows 0.0616 75 Sowbane mosaic virus 0.0141
8 Potato leafroll virus 0.0894 42 Broad bean stain virus 0.0616 76 Strawberry crinkle virus 0.0141
9 Potato virus Y 0.0894 43 Chlorotic leaf spot virus 0.0616 77 Subterranean clover stunt virus 0.0141
10 Tobacco yellow dwarf virus 0.0894 44 Chrysanthemum carlavirus B 0.0616 78 tulip breaking virus 0.0141
11 Tomato spotted wilt virus 0.0894 45 Chrysanthemum stunt viroid 0.0616 79 white clover mosaic virus 0.0141
12 Celery mosaic virus 0.0893 46 Echtes Ackerbohnenmosaik virus 0.0616 80 Banana mild mosaic virus 0.0139
13 Pea Seed-borne Mosaic virus 0.0893 47 Frangipani mosaic virus 0.0616 81 Banana streak virus 0.0139
14 Barley yellow dwarf virus 0.0757 48 Garlic yellow streak virus 0.0616 82 Capsicum chlorosis virus 0.0139
15 Clover Yellow Vein virus 0.0757 49 Grapevine yellow speckle viroid 1 0.0616 83 High plains virus 0.0139
16 Lettuce mosaic virus 0.0757 50 Grapevine yellow speckle viroid 2 0.0616 84 Iris yellow spot virus 0.0139
17 Lettuce necrotic yellows virus 0.0757 51 Hibiscus chlorotic ringspot virus 0.0616 85 lettuce big vein virus 0.0139
18 Odontoglossum ringspot virus 0.0757 52 Hop stunt viroid 0.0616 86 Ornithogalum mosaic virus 0.0139
19 Potato virus X 0.0757 53 Lilium symptomless virus 0.0616 87 Passiflora latent virus 0.0139
20 Prunus necrotic ringspot virus 0.0757 54 Nicotiana velutina mosaic virus 0.0616 88 Passionfruit latent virus 0.0139
21 Tomato mosaic virus 0.0757 55 Ribgrass mosaic virus 0.0616 89 Peanut mottle virus 0.0139
22 Passionfruit woodiness virus 0.0755 56 Soybean dwarf virus 0.0616 90 Poinsettia mosaic virus 0.0139
23 Cauliflower mosaic virus 0.0619 57 Subterranean clover mottle virus 0.0616 91 Solanum nodiflorum mottle virus 0.0139
24 Cymbidium mosaic virus 0.0619 58 Tomato ringspot virus 0.0616 92 Soybean mosaic virus 0.0139
25 Grapevine fanleaf virus 0.0619 59 Tristeza virus 0.0616 93 strawberry mild yellow edge virus 0.0139
26 Orchid fleck virus 0.0619 60 Velvet tobacco mottle virus 0.0616 94 strawberry vein banding virus 0.0139
27 Subterranean clover red leaf virus 0.0619 61 Apple mosaic virus 0.0278 95 Sunflower ringspot virus 0.0139
28 Beet mosaic virus 0.0618 62 Wheat streak mosaic virus 0.0278 96 Tomato big bud virus 0.0139
29 Broccoli necrotic yellows virus 0.0618 63 Apple stem grooving virus 0.0276 97 Alstroemeria mosaic virus 0.0137
30 Carrot mottle virus 0.0618 64 Apple stem pitting virus 0.0276 98 Alternanthera mosaic virus 0.0137
31 Carrot red leaf virus 0.0618 65 Bean leafroll virus 0.0276 99 Apium virus Y 0.0137
32 Citrus exocortis viroid 0.0618 66 Carrot virus Y 0.0276 100 Bamboo mosaic virus 0.0137
33 Citrus psorosis 0.0618 67 Citrus tristeza 0.0276 101 Banana bunchy top virus 0.0137
34 Lucerne transient streak virus 0.0618 68 Bean common mosaic virus 0.0141 102 Banana streak mysore virus 0.0137

CRC10001 Final Report Page 145 of
172
Table 42 (continued).
Rank* Species risk index Rank* Species risk index Rank* Species risk index
103 Barley stripe mosaic virus 0.0137 140 Apricot ring pox 0.0002 177 Narcissus latent virus 0.0002
104 Blackeye cowpea mosaic virus 0.0137 141 Arabis mosaic virus 0.0002 178 Narcissus mosaic virus 0.0002
105 carrot mosaic virus Y 0.0137 142 Avocado pear sunblotch 0.0002 179 Narcissus yellow stripe virus 0.0002
106 Chloris striate mosaic virus 0.0137 143 Bean summer death 0.0002 180 Nerine latent virus 0.0002
107 dasheen mosaic virus 0.0137 144 Beet cryptic virus 1 0.0002 181 Nerine virus X 0.0002
108 Datura yellow vein virus 0.0137 145 Beet cryptic virus 2 0.0002 182 Nerine virus Y 0.0002
109 Dianella chlorotic mottle virus 0.0137 146 Beet pseudoyellows virus 0.0002 183 Nerine yellow stripe virus 0.0002
110 Ginger chlorotic fleck virus 0.0137 147 Cabbage black ring spot 0.0002 184 Nothoscordum mosaic virus 0.0002
111 grapevine fleck virus 0.0137 148 Capsicum mosaic 0.0002 185 Parsley virus Y 0.0002
112 Grapevine leafroll ass. virus 1 0.0137 149 Carnation etched ring virus 0.0002 186 Patchouli mild mosaic virus 0.0002
113 Grapevine leafroll ass. virus 3 0.0137 150 Carnation mosaic 0.0002 187 Pea pimple pod virus 0.0002
114 Grapevine rupestris stem pitting virus 0.0137 151 Carnation ringspot 0.0002 188 Peach calico virus 0.0002
115 grapevine virus A 0.0137 152 Carnation vein mottle virus 0.0002 189 Peach ringspot virus 0.0002
116 Kennedia yellow mosaic virus 0.0137 153 Cereal yellow dwarf virus 0.0002 190 Pear stony pit virus 0.0002
117 leek yellow stripe virus 0.0137 154 Chenopodium mosaic 0.0002 191 Pelargonium leaf-curl virus 0.0002
118 Pandanus ringspot virus 0.0137 155 Cherry black canker 0.0002 192 Peony ringspot virus 0.0002
119 Parsley latent virus 0.0137 156 Cherry mottle leaf 0.0002 193 Pepper Mild Mottle virus 0.0002
120 Paspalum striate mosaic virus 0.0137 157 Cherry ring spot 0.0002 194 Plum line pattern virus 0.0002
121 Passiflora virus Y 0.0137 158 Cherry rugose mosaic 0.0002 195 Potato aucuba mosaic virus 0.0002
122 Pear blister canker viroid 0.0137 159 Chrysanthemum virus B 0.0002 196 Potato spindle tuber virus 0.0002
123 Soybean spherical virus 0.0137 160 Citrus cachexia 0.0002 197 Potato virus A 0.0002
124 strawberry mottle virus 0.0137 161 Citrus tatter leaf 0.0002 198 Raspberry bushy dwarf virus 0.0002
125 strawberry pallidosis virus 0.0137 162 Citrus vein enation 0.0002 199 Rhubarb closterovirus 0.0002
126 Sugarcane bacilliform virus 0.0137 163 Citrus xyloporosis 0.0002 200 Rose mosaic virus 0.0002
127 Sweet potato chlorotic stunt virus 0.0137 164 Cymbidium ringspot virus 0.0002 201 Rugose leaf curl virus 0.0002
128 Sweet potato feathery mottle virus 0.0137 165 Dahlia mosaic virus 0.0002 202 Rugose leaf mosaic virus 0.0002
129 Tobacco necrosis virus 0.0137 166 Datura rugose 0.0002 203 Ryegrass cryptic virus 0.0002
130 Tobacco streak virus 0.0137 167 Fig mosaic virus 0.0002 204 Ryegrass mosaic virus 0.0002
131 Tomato yellow leaf curl virus 0.0137 168 Hop latent virus 0.0002 205 Sobemovirus 0.0002
132 watermelon mosaic virus 2 0.0137 169 Hop mosaic virus 0.0002 206 Sow thistle yellow vein virus 0.0002
133 Freesia mosaic virus 0.0003 170 Iris mosaic virus 0.0002 207 Stock mosaic virus 0.0002
134 Onion yellow dwarf virus 0.0003 171 Iris severe mosaic virus 0.0002 208 Sugarcane Fiji disease 0.0002
135 Abutilon mosaic 0.0002 172 Lily symptomless virus 0.0002 209 Sweet potato russet crack 0.0002
136 Apple flat limb 0.0002 173 Lily virus X 0.0002 210 Tomato yellow top virus 0.0002
137 Apple platycarpa 0.0002 174 Maize dwarf mosaic 0.0002 211 Turnip yellow mosaic virus 0.0002
138 Apple ring spot 0.0002 175 Maize mosaic virus 0.0002 212 Viola mottle virus 0.0002
139 Apple russet ring 0.0002 176 Malva vein clearing virus 0.0002 213 Witches broom virus 0.0002
Table 43. Comparison of species risk rankings between the SOM analysis and PHA.
SOM
rank
Species names SOM risk
index
SOM risk
category
PHA risk
category
1 Oryctes rhinoceros 0.7722 H M
2 Sesamia inferens 0.7695 H H, M
3 Diaphorina citri 0.6807 M H
4 Aleurocanthus woglumi 0.6801 M H, M
5 Stephanitis typica 0.6675 M M
6 Xylosandrus compactus 0.6632 M H
7 Pelopidas mathias 0.6446 M M
8 Dicladispa armigera 0.6378 M M
9 Acherontia styx 0.6356 M M
10 Chilo auricilius 0.6338 M H
11 Planococcus lilacinus 0.594 M H, L
12 Batocera rubus 0.5836 M H
13 Toxoptera odinae 0.5694 M M
14 Orseolia oryzae 0.5676 M M
15 Odoiporus longicollis 0.5669 M H
16 Chilo infuscatellus 0.5559 M H
17 Hypomeces squamosus 0.5395 M H, M
18 Orgyia postica 0.5343 M M
19 Rastrococcus invadens 0.519 M H, M-H, M
20 Parasa lepida 0.5177 M H
21 Bactrocera dorsalis 0.5008 M H, M-H, M
22 Erionota thrax 0.4931 M M-H
23 Schizaphis graminum 0.4895 M M
24 Aproaerema modicella 0.4841 M H
25 Attacus atlas 0.4821 M H
26 Ceratovacuna lanigera 0.4774 M H
27 Sternochetus frigidus 0.4586 M H
28 Trichoplusia ni 0.4573 M H, M
29 Dialeurodes citri 0.4532 M M
30 Pyrilla perpusilla 0.4499 M H, M
31 Chilo sacchariphagus 0.4491 M H
32 Atherigona soccata 0.4395 M H
33 Cricula trifenestrata 0.4329 M H
34 Chilo partellus 0.4206 M H
35 Omiodes indicata 0.4097 M M
36 Bactrocera tau 0.4008 M M
37 Bactrocera zonata 0.3802 M H
38 Liriomyza huidobrensis 0.3743 M H, M
39 Phyllotreta striolata 0.3604 M M
40 Scotinophara coarctata 0.3589 M M
41 Liriomyza trifolii 0.3431 M H, M
42 Aulacaspis tegalensis 0.3262 M H
43 Pseudococcus jackbeardsleyi 0.3105 M H, M
44 Perkinsiella vastatrix 0.3052 M H, M
45 Artona catoxantha 0.3043 M L
46 Heterobostrychus aequalis 0.3037 M L
47 Opisina arenosella 0.303 M L
48 Chondracris rosea 0.2994 L M

CRC10001 Final Report Page 147 of
172
Table 43 (continued).
SOM
rank
Species names SOM risk
index
SOM risk
category
PHA risk
category
49 Chromatomyia horticola 0.2827 L H, M
50 Aphis fabae 0.2704 L H, M
51 Tetramoera schistaceana 0.2684 L H
52 Stauropus alternus 0.2642 L H
53 Frankliniella intonsa 0.2636 L H, M
54 Clanis bilineata 0.2594 L M
55 Pieris brassicae 0.2576 L M
56 Adoretus sinicus 0.2547 L N
57 Amsacta lactinea 0.2544 L M
58 Chlumetia transversa 0.253 L H
59 Lepidiota stigma 0.2529 L H, M
60 Bactrocera papayae 0.249 L H, M-H, M
61 Holotrichia serrata 0.2382 L M
62 Amsacta moorei 0.2331 L M
63 Bactrocera carambolae 0.229 L H
64 Oxya chinensis 0.2226 L N
65 Pseudococcus comstocki 0.2102 L H, M
66 Sesamia cretica 0.2093 L M
67 Sitobion avenae 0.2092 L M
68 Callosobruchus analis 0.2005 L M
69 Trogoderma granarium 0.1894 L H
70 Parabemisia myricae 0.1823 L H, N
71 Liriomyza sativae 0.1733 L H, M
72 Chrysodeixis chalcites 0.1606 L M
73 Agromyza oryzae 0.157 L H
74 Mamestra brassicae 0.156 L H, M
75 Monochamus alternatus 0.1492 L H
76 Prostephanus truncatus 0.1476 L M
77 Cryptoblabes gnidiella 0.1442 L M-H, N-L
78 Liriomyza bryoniae 0.1406 L H
79 Autographa nigrisigna 0.1369 L M
80 Delia antiqua 0.1347 L M
81 Aleurothrixus floccosus 0.1345 L L
82 Dialeurodes citrifolii 0.1299 L H
83 Lymantria dispar 0.1284 L H, M
84 Lissorhoptrus oryzophilus 0.1279 L H
85 Haplothrips aculeatus 0.1248 L M
86 Peridroma saucia 0.1231 L H, M
87 Cicadulina mbila 0.1204 L H, M
88 Anoplophora chinensis 0.1067 L H
89 Dysaphis plantaginea 0.099 L H
90 Hadula trifolii 0.0969 L H, M
91 Lymantria monacha 0.0956 L H
92 Acronicta rumicis 0.094 L M
93 Autographa gamma 0.0923 L M
94 Zabrotes subfasciatus 0.086 L M
95 Schistocerca gregaria 0.0818 L M
96 Adoxophyes orana 0.0732 L M
CRC10001 Final Report Page 148 of
172
Table 43 (continued).
SOM
rank
Species names SOM risk
index
SOM risk
category
PHA risk
category
97 Carposina sasakii 0.0717 L M, L
98 Popillia japonica 0.0716 L M
99 Anoplophora glabripennis 0.0707 L M
100 Diuraphis noxia 0.0702 L H
101 Coptotermes formosanus 0.07 L H
102 Grapholita inopinata 0.0699 L L
103 Phyllotreta cruciferae 0.0695 L M
104 Anoplophora malasiaca 0.0664 L M
105 Selenaspidus articulatus 0.0655 L H
106 Sitodiplosis mosellana 0.0647 L M
107 Delia floralis 0.0646 L M
108 Caryedon serratus 0.0645 L M
109 Contarinia tritici 0.0633 L M
110 Sitona hispidulus 0.063 L M
111 Metamasius hemipterus 0.0627 L M, L
112 Grapholita funebrana 0.0615 L H
113 Opogona sacchari 0.059 L M
114 Cacoecimorpha pronubana 0.0376 L M
115 Anthonomus bisignifer 0.0356 L M
116 Phorodon humuli 0.0329 L M
117 Cacopsylla pyricola 0.0323 L L
117 Philaenus spumarius 0.0323 L L-M
117 Epilachna varivestis 0.0323 L M
120 Mythimna unipuncta 0.0317 L H
121 Cydia splendana 0.0308 L H
121 Pandemis cerasana 0.0308 L H
121 Psila rosae 0.0308 L H
121 Eurygaster integriceps 0.0308 L H, M
121 Loxostege sticticalis 0.0308 L H, M
121 Meromyza saltatrix 0.0308 L H, M
121 Acrolepiopsis assectella 0.0308 L L
121 Delia coarctata 0.0308 L M
121 Delia radicum 0.0308 L M
121 Elasmopalpus lignosellus 0.0308 L M
121 Empoasca fabae 0.0308 L M
121 Haplothrips tritici 0.0308 L M
121 Oulema melanopus 0.0308 L M
121 Rhyacionia buoliana 0.0308 L M
121 Sitona cylindricollis 0.0308 L M
136 Spodoptera littoralis 0.0304 L H, M
137 Cryptophlebia leucotreta 0.03 L H, M, L
137 Sesamia calamistis 0.03 L M
139 Nomadacris septemfasciata 0.0283 L H
140 Megalurothrips sjostedti 0.022 L M
141 Ceratitis cosyra 0.0209 L M
142 Heteronychus licas 0.0208 L H
143 Scirtothrips aurantii 0.0196 L H, M
144 Zonocerus elegans 0.0184 L M

CRC10001 Final Report Page 149 of
172
Table 43 (continued).
SOM
rank
Species names SOM risk
index
SOM risk
category
PHA risk
category
145 Busseola fusca 0.0153 L H
146 Helopeltis schoutedeni 0.0077 L M
147 Phenacoccus madeirensis 0.0054 L L
147 Zonocerus variegatus 0.0054 L M
149 Sesamia nonagrioides 0.0037 L N
150 Anastrepha fraterculus 0 L H
150 Anthonomus grandis 0 L H
150 Cerataphis lantaniae 0 L H
150 Ceroplastes cirripediformis 0 L H
150 Ceutorhynchus assimilis 0 L H
150 Curculio elephas 0 L H
150 Dalbulus maidis 0 L H
150 Dasineura pyri 0 L H
150 Dendroctonus frontalis 0 L H
150 Dendroctonus ponderosae 0 L H
150 Diaprepes abbreviatus 0 L H
150 Frankliniella insularis 0 L H
150 Frankliniella tritici 0 L H
150 Hypothenemus obscurus 0 L H
150 Melanoplus sanguinipes 0 L H
150 Meligethes aeneus 0 L H
150 Monochamus galloprovincialis 0 L H
150 Stenoma catenifer 0 L H
150 Trialeurodes abutiloneus 0 L H
150 Xyleborus dispar 0 L H
150 Anastrepha striata 0 L H, M
150 Cephus cinctus 0 L H, M
150 Cephus pygmeus 0 L H, M
150 Dasineura brassicae 0 L H, M
150 Helicoverpa zea 0 L H, M
150 Lygus lineolaris 0 L H, M
150 Ostrinia nubilalis 0 L H, M
150 Platynota stultana 0 L H, M
150 Rhagoletis pomonella 0 L H, M
150 Spodoptera eridania 0 L H, M
150 Thrips angusticeps 0 L H, M
150 Choristoneura rosaceana 0 L M-H, M
150 Spodoptera frugiperda 0 L H, M, N
150 Mamestra configurata 0 L L
150 Agriotes obscurus 0 L L
150 Diaspis boisduvalii 0 L L
150 Dyspessa ulula 0 L L
150 Orthezia praelonga 0 L L
150 Paracoccus marginatus 0 L L
150 Spilonota ocellana 0 L L
150 Macrosteles quadrilineatus 0 L N
150 Acrosternum hilare 0 L M, L
CRC10001 Final Report Page 150 of
172
Table 43 (continued).
SOM
rank
Species names SOM risk
index
SOM risk
category
PHA risk
category
150 Epitrix cucumeris 0 L M, L
150 Acalymma vittatum 0 L M
150 Agriotes lineatus 0 L M
150 Agrotis exclamationis 0 L M
150 Anastrepha obliqua 0 L M
150 Anastrepha serpentina 0 L M
150 Anthonomus signatus 0 L M
150 Anticarsia gemmatalis 0 L M
150 Castniomera licus 0 L M
150 Caulophilus oryzae 0 L M
150 Cerotoma trifurcata 0 L M
150 Colaspis hypochlora 0 L M
150 Conotrachelus nenuphar 0 L M
150 Corythuca gossypii 0 L M
150 Diabrotica balteata 0 L M
150 Diabrotica barberi 0 L M
150 Diabrotica undecimpunctata 0 L M
150 Diabrotica virgifera virgifera 0 L M
150 Diatraea saccharalis 0 L M
150 Edessa meditabunda 0 L M
150 Frankliniella fusca 0 L M
150 Heliothis virescens 0 L M
150 Homalodisca coagulata 0 L M
150 Hortensia similis 0 L M
150 Leptinotarsa decemlineata 0 L M
150 Malacosoma disstria 0 L M
150 Mayetiola destructor 0 L M
150 Melanoplus bivittatus 0 L M
150 Metcalfa pruinosa 0 L M
150 Piezodorus guildinii 0 L M
150 Psylliodes chrysocephala 0 L M
150 Rhagoletis fausta 0 L M
150 Rhagoletis indifferens 0 L M
150 Spodoptera latifascia 0 L M
150 Tecia solanivora 0 L M
Table 44. The top 200 risk list for plant pathogen species absent from Australia.
Rank Species Name Risk Index Rank Species Name Risk Index Rank Species Name Risk Index
1 Ustilago avenae 0.9108 35 Alternaria japonica 0.517 69 Mycosphaerella cruenta 0.3161
2 Phytophthora infestans 0.8872 36 Fusarium oxysporum f.sp. lini 0.5162 70 Phytophthora colocasiae 0.3156
3 Mycovellosiella fulva 0.8867 37 Pyrenophora tritici-repentis 0.5118 71 Verticillium albo-atrum 0.309
4 Cochliobolus sativus 0.8655 38 Nectria galligena 0.492 72 Ulocladium atrum 0.3073
5 Setosphaeria turcica 0.8121 39 Cronartium ribicola 0.484 73 Asperisporium caricae 0.3071
6 Phytophthora nicotianae 0.8069 40 Fusarium sacchari 0.4713 74 Armillaria ostoyae 0.3031
7 Sporisorium sorghi 0.8067 41 Ceratocystis fimbriata 0.4634 75 Monosporascus cannonballus 0.303
8 Gaeumannomyces graminis var. tritici 0.7891 42 Septoria cannabis 0.4512 76 Ophiostoma piceae 0.3022
9 Claviceps purpurea 0.7767 43 Pythium splendens 0.4478 77 Pseudoperonospora cannabina 0.3022
10 Puccinia striiformis 0.7655 44 Cryphonectria parasitica 0.4406 78 Cronartium quercuum 0.2936
11 Phaeosphaeria nodorum 0.7488 45 Didymella lycopersici 0.4313 79 Aecidium mori 0.2931
12 Colletotrichum orbiculare 0.7477 46 Podosphaera macularis 0.4301 80 Olpidium brassicae 0.2919
13 Mycosphaerella graminicola 0.7291 47 Passalora sojina 0.4287 81 Uredo cajani 0.2871
14 Sclerotinia sclerotiorum 0.7132 48 Cercospora sorghi 0.4227 82 Mycosphaerella pruni-persicae 0.2858
15 Sporisorium cruentum 0.7106 49 Nematospora coryli 0.419 83 Alternaria solani 0.2825
16 Rosellinia necatrix 0.709 50 Didymella rabiei 0.4177 84 Ustilago shiraiana 0.2795
17 Septoria apiicola 0.6835 51 Mycosphaerella pyri 0.4164 85 Gymnosporangium fuscum 0.2761
18 Cladosporium cucumerinum 0.6833 52 Phomopsis asparagi 0.4024 86 Fusarium oxysporum f.sp. lentis 0.2725
19 Phytophthora capsici 0.6762 53 Erysiphe orontii 0.3991 87 Stagonospora sacchari 0.2583
20 Sclerospora graminicola 0.6737 54 Alternaria sesami 0.399 88 Cryptodiaporthe populea 0.2553
21 Botrytis fabae 0.6663 55 Fomes fomentarius 0.3914 89 Lachnella willkommii 0.2512
22 Puccinia graminis 0.6455 56 Colletotrichum linicola 0.3804 90 Monographella nivalis 0.2476
23 Colletotrichum sublineolum 0.6376 57 Septoria glycines 0.3766 91 Phialophora cinerescens 0.2475
24 Fusarium oxysporum f.sp. vasinfectum 0.6292 58 Mycosphaerella gibsonii 0.362 92 Peronosclerospora philippinensis 0.2465
25 Puccinia asparagi 0.5988 59 Hemileia vastatrix 0.3564 93 Synchytrium endobioticum 0.2392
26 Leptosphaeria coniothyrium 0.5971 60 Guignardia bidwellii 0.3509 94 Hypocrea rufa 0.2387
27 Phaeolus schweinitzii 0.5839 61 Didymella lentis 0.3448 95 Armillaria mellea 0.2371
28 Bipolaris sacchari 0.5802 62 Kabatiella zeae 0.34 96 Moesziomyces bullatus 0.234
29 Puccinia coronata 0.5606 63 Cronartium flaccidum 0.3384 97 Exobasidium vexans 0.2328
30 Colletotrichum circinans 0.5551 64 Aphanomyces euteiches 0.3359 98 Fomitopsis pinicola 0.2327
31 Monilinia fructigena 0.5498 65 Ceratocystis ulmi 0.3312 99 Fusarium oxysporum f.sp. batatas 0.2299
32 Puccinia purpurea 0.5404 66 Peronospora viciae 0.3278 100 Corticium koleroga 0.2295
33 Ustilago crameri 0.5274 67 Colletotrichum tabacum 0.3272 101 Mycosphaerella dearnessii 0.2282
34 Pseudoperonospora humuli 0.5224 68 Elsino veneta 0.3212 102 Acremonium strictum 0.2279

CRC10001 Final Report Page 152 of
172
Table 44 (continued).
Rank Species Name Risk Index Rank Species Name Risk Index Rank Species Name Risk Index
103 Botryosphaeria dothidea 0.2261 137 Gymnosporangium yamadae 0.1818 171 Armillaria heimii 0.1132
104 Gremmeniella abietina 0.2258 138 Mycosphaerella laricis-leptolepidis 0.1818 172 Pseudopeziza tracheiphila 0.1124
105 Fusarium oxysporum f.sp. phaseoli 0.2247 139 Phialophora gregata 0.1775 173 Gibberella xylarioides 0.1113
106 Tilletia indica 0.2245 140 Didymella applanata 0.1772 174 Peronospora rubi 0.1069
107 Mycosphaerella holci 0.2226 141 Fusarium proliferatum 0.1759 175 Bipolaris heveae 0.104
108 Alternaria gaisen 0.2223 142 Phoma pinodella 0.1702 176 Camptomeris leucaenae 0.1039
109 Rhizopus stolonifer 0.2223 143 Fusarium oxysporum f.sp. tracheiphilum 0.1701 177 Puccinia cacabata 0.1038
110 Cercospora zeae-maydis 0.22 144 Rhizina undulata 0.1687 178 Dactuliochaeta glycines 0.1021
111 Gymnosporangium asiaticum 0.2171 145 Puccinia polysora 0.1686 179 Calonectria kyotensis 0.1011
112 Ascochyta sorghi 0.2141 146 Phomopsis juniperivora 0.1653 180 Sclerotinia borealis 0.0998
113 Blumeriella jaapii 0.2122 147 Diaporthe phaseolorum var. meridionalis 0.1645 181 Sclerophthora rayssiae var. zeae 0.0981
114 Sphaeropsis sapinea 0.2095 148 Erysiphe cichoracearum 0.1544 182 Didymascella thujina 0.0933
115 Sphaceloma arachidis 0.2088 149 Ciborinia camelliae 0.1535 183 Cercospora caribaea 0.0902
116 Pythium ultimum 0.2085 150 Oidium heveae 0.1522 184 Mycosphaerella henningsii 0.089
117 Sphacelotheca sacchari 0.2083 151 Inonotus weirii 0.1482 185 Ganoderma boninense 0.0888
118 Sphaceloma perseae 0.2055 152 Polyscytalum pustulans 0.1467 186 Phytophthora drechsleri f.sp. cajani 0.0879
119 Pleospora herbarum 0.2051 153 Physoderma leproides 0.1444 187 Rhizoctonia oryzae 0.0878
120 Diaporthe helianthi 0.2005 154 Sphaeropsis tumefaciens 0.1385 188 Mycosphaerella populorum 0.0876
121 Cercospora nicotianae 0.1982 155 Coleosporium ipomoeae 0.1384 189 Rhabdocline pseudotsugae 0.0854
122 Venturia cerasi 0.1981 156 Ganoderma philippii 0.1351 190 Apiognomonia erythrostoma 0.0845
123 Peronosclerospora sacchari 0.1965 157 Meria laricis 0.1351 191 Rhizoctonia tuliparum 0.0831
124 Phakopsora vitis 0.1959 158 Mycosphaerella tassiana 0.1347 192 Elsino? australis 0.0768
125 Phakopsora ampelopsidis 0.1954 159 Phragmidium rubi-idaei 0.1307 193 Ramularia onobrychidis 0.0753
126 Botryosphaeria berengeriana f.sp. pyricola 0.1953 160 Phomopsis sclerotioides 0.1302 194 Phomopsis cocoes 0.0752
127 Balansia oryzae-sativae 0.1952 161 Phoma tracheiphila 0.1277 195 Choanephora cucurbitarum 0.0697
128 Diaporthe phaseolorum var. caulivora 0.1923 162 Phomopsis theae 0.1275 196 Claviceps fusiformis 0.0694
129 Rigidoporus microporus 0.1898 163 Rosellinia arcuata 0.1233 197 Puccinia hemerocallidis 0.0691
130 Fusarium oxysporum f.sp. radicis-lycopersici 0.1891 164 Oncobasidium theobromae 0.1216 198 Cryptostroma corticale 0.0676
131 Chrysomyxa abietis 0.187 165 Nectria rigidiuscula 0.1213 199 Phakopsora meibomiae 0.0657
132 Aspergillus fumigatus 0.1869 166 Rosellinia bunodes 0.1212 200 Mycena citricolor 0.0611
133 Cladosporium musae 0.1864 167 Puccinia psidii 0.1209 201 Bipolaris incurvata 0.0609
134 Gibberella pulicaris 0.1853 168 Gibberella stilboides 0.1151 202 Alternaria linicola 0.0579
135 Armillaria tabescens 0.1852 169 Diaporthe eres 0.1147 203 Colletotrichum kahawae 0.0545
136 Peronospora farinosa f.sp. spinaciae 0.1834 170 Fusarium oxysporum f.sp. cannabis 0.1145 204 Phaeoramularia angolensis 0.0526

CRC10001 Final Report Page 153 of
172
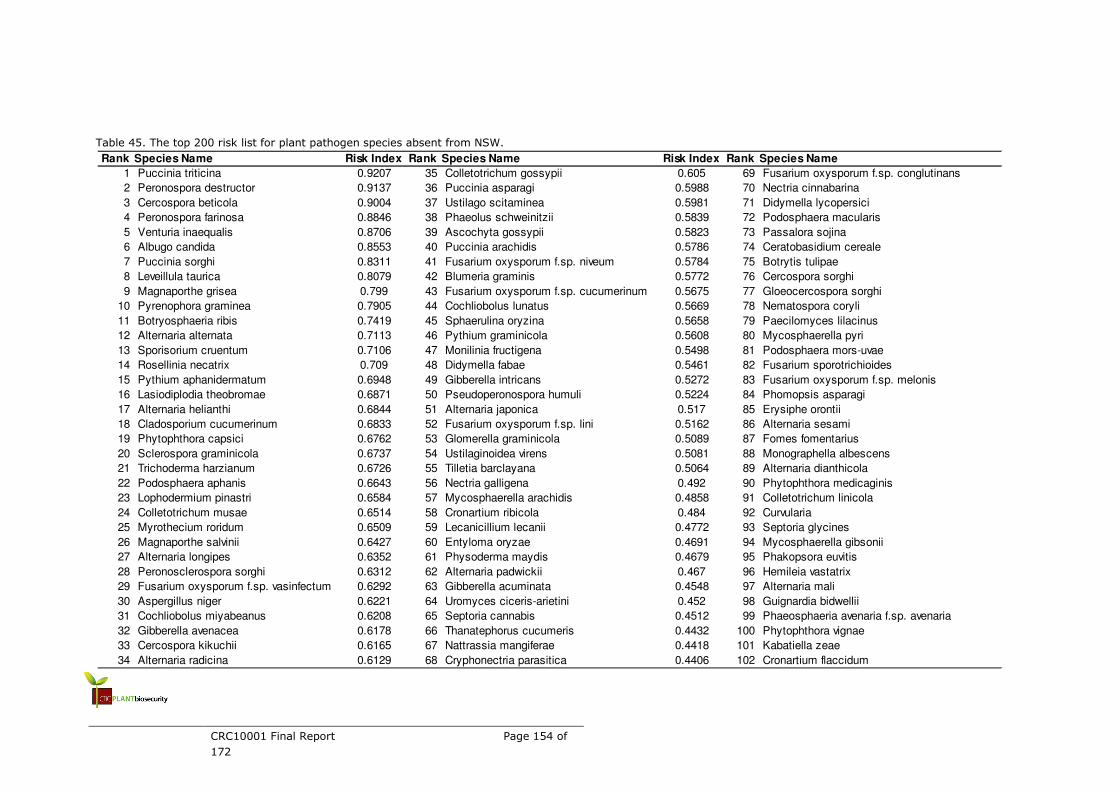
CRC10001 Final Report Page 154 of
172
Table 45. The top 200 risk list for plant pathogen species absent from NSW.
Rank Species Name Risk Index Rank Species Name Risk Index Rank Species Name
1 Puccinia triticina 0.9207 35 Colletotrichum gossypii 0.605 69 Fusarium oxysporum f.sp. conglutinans
2 Peronospora destructor 0.9137 36 Puccinia asparagi 0.5988 70 Nectria cinnabarina
3 Cercospora beticola 0.9004 37 Ustilago scitaminea 0.5981 71 Didymella lycopersici
4 Peronospora farinosa 0.8846 38 Phaeolus schweinitzii 0.5839 72 Podosphaera macularis
5 Venturia inaequalis 0.8706 39 Ascochyta gossypii 0.5823 73 Passalora sojina
6 Albugo candida 0.8553 40 Puccinia arachidis 0.5786 74 Ceratobasidium cereale
7 Puccinia sorghi 0.8311 41 Fusarium oxysporum f.sp. niveum 0.5784 75 Botrytis tulipae
8 Leveillula taurica 0.8079 42 Blumeria graminis 0.5772 76 Cercospora sorghi
9 Magnaporthe grisea 0.799 43 Fusarium oxysporum f.sp. cucumerinum 0.5675 77 Gloeocercospora sorghi
10 Pyrenophora graminea 0.7905 44 Cochliobolus lunatus 0.5669 78 Nematospora coryli
11 Botryosphaeria ribis 0.7419 45 Sphaerulina oryzina 0.5658 79 Paecilomyces lilacinus
12 Alternaria alternata 0.7113 46 Pythium graminicola 0.5608 80 Mycosphaerella pyri
13 Sporisorium cruentum 0.7106 47 Monilinia fructigena 0.5498 81 Podosphaera mors-uvae
14 Rosellinia necatrix 0.709 48 Didymella fabae 0.5461 82 Fusarium sporotrichioides
15 Pythium aphanidermatum 0.6948 49 Gibberella intricans 0.5272 83 Fusarium oxysporum f.sp. melonis
16 Lasiodiplodia theobromae 0.6871 50 Pseudoperonospora humuli 0.5224 84 Phomopsis asparagi
17 Alternaria helianthi 0.6844 51 Alternaria japonica 0.517 85 Erysiphe orontii
18 Cladosporium cucumerinum 0.6833 52 Fusarium oxysporum f.sp. lini 0.5162 86 Alternaria sesami
19 Phytophthora capsici 0.6762 53 Glomerella graminicola 0.5089 87 Fomes fomentarius
20 Sclerospora graminicola 0.6737 54 Ustilaginoidea virens 0.5081 88 Monographella albescens
21 Trichoderma harzianum 0.6726 55 Tilletia barclayana 0.5064 89 Alternaria dianthicola
22 Podosphaera aphanis 0.6643 56 Nectria galligena 0.492 90 Phytophthora medicaginis
23 Lophodermium pinastri 0.6584 57 Mycosphaerella arachidis 0.4858 91 Colletotrichum linicola
24 Colletotrichum musae 0.6514 58 Cronartium ribicola 0.484 92 Curvularia
25 Myrothecium roridum 0.6509 59 Lecanicillium lecanii 0.4772 93 Septoria glycines
26 Magnaporthe salvinii 0.6427 60 Entyloma oryzae 0.4691 94 Mycosphaerella gibsonii
27 Alternaria longipes 0.6352 61 Physoderma maydis 0.4679 95 Phakopsora euvitis
28 Peronosclerospora sorghi 0.6312 62 Alternaria padwickii 0.467 96 Hemileia vastatrix
29 Fusarium oxysporum f.sp. vasinfectum 0.6292 63 Gibberella acuminata 0.4548 97 Alternaria mali
30 Aspergillus niger 0.6221 64 Uromyces ciceris-arietini 0.452 98 Guignardia bidwellii
31 Cochliobolus miyabeanus 0.6208 65 Septoria cannabis 0.4512 99 Phaeosphaeria avenaria f.sp. avenaria
32 Gibberella avenacea 0.6178 66 Thanatephorus cucumeris 0.4432 100 Phytophthora vignae
33 Cercospora kikuchii 0.6165 67 Nattrassia mangiferae 0.4418 101 Kabatiella zeae
34 Alternaria radicina 0.6129 68 Cryphonectria parasitica 0.4406 102 Cronartium flaccidum
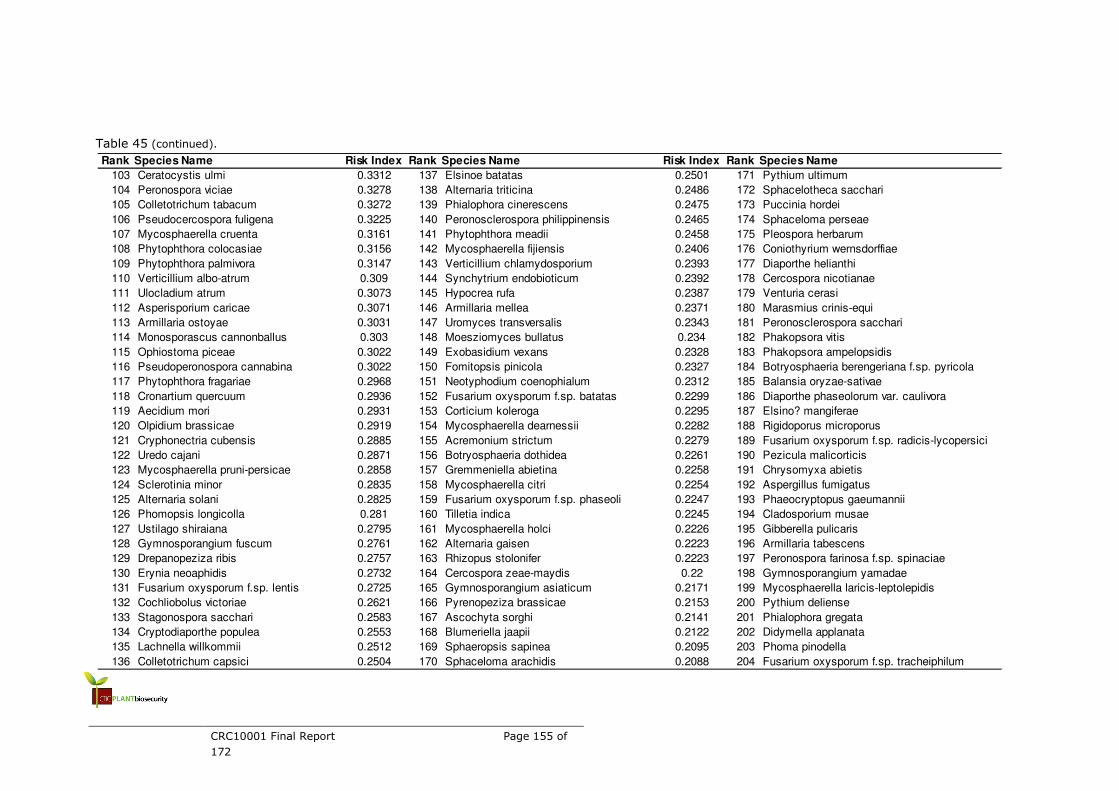
CRC10001 Final Report Page 155 of
172
Table 45 (continued).
Rank Species Name Risk Index Rank Species Name Risk Index Rank Species Name
103 Ceratocystis ulmi 0.3312 137 Elsinoe batatas 0.2501 171 Pythium ultimum
104 Peronospora viciae 0.3278 138 Alternaria triticina 0.2486 172 Sphacelotheca sacchari
105 Colletotrichum tabacum 0.3272 139 Phialophora cinerescens 0.2475 173 Puccinia hordei
106 Pseudocercospora fuligena 0.3225 140 Peronosclerospora philippinensis 0.2465 174 Sphaceloma perseae
107 Mycosphaerella cruenta 0.3161 141 Phytophthora meadii 0.2458 175 Pleospora herbarum
108 Phytophthora colocasiae 0.3156 142 Mycosphaerella fijiensis 0.2406 176 Coniothyrium wernsdorffiae
109 Phytophthora palmivora 0.3147 143 Verticillium chlamydosporium 0.2393 177 Diaporthe helianthi
110 Verticillium albo-atrum 0.309 144 Synchytrium endobioticum 0.2392 178 Cercospora nicotianae
111 Ulocladium atrum 0.3073 145 Hypocrea rufa 0.2387 179 Venturia cerasi
112 Asperisporium caricae 0.3071 146 Armillaria mellea 0.2371 180 Marasmius crinis-equi
113 Armillaria ostoyae 0.3031 147 Uromyces transversalis 0.2343 181 Peronosclerospora sacchari
114 Monosporascus cannonballus 0.303 148 Moesziomyces bullatus 0.234 182 Phakopsora vitis
115 Ophiostoma piceae 0.3022 149 Exobasidium vexans 0.2328 183 Phakopsora ampelopsidis
116 Pseudoperonospora cannabina 0.3022 150 Fomitopsis pinicola 0.2327 184 Botryosphaeria berengeriana f.sp. pyricola
117 Phytophthora fragariae 0.2968 151 Neotyphodium coenophialum 0.2312 185 Balansia oryzae-sativae
118 Cronartium quercuum 0.2936 152 Fusarium oxysporum f.sp. batatas 0.2299 186 Diaporthe phaseolorum var. caulivora
119 Aecidium mori 0.2931 153 Corticium koleroga 0.2295 187 Elsino? mangiferae
120 Olpidium brassicae 0.2919 154 Mycosphaerella dearnessii 0.2282 188 Rigidoporus microporus
121 Cryphonectria cubensis 0.2885 155 Acremonium strictum 0.2279 189 Fusarium oxysporum f.sp. radicis-lycopersici
122 Uredo cajani 0.2871 156 Botryosphaeria dothidea 0.2261 190 Pezicula malicorticis
123 Mycosphaerella pruni-persicae 0.2858 157 Gremmeniella abietina 0.2258 191 Chrysomyxa abietis
124 Sclerotinia minor 0.2835 158 Mycosphaerella citri 0.2254 192 Aspergillus fumigatus
125 Alternaria solani 0.2825 159 Fusarium oxysporum f.sp. phaseoli 0.2247 193 Phaeocryptopus gaeumannii
126 Phomopsis longicolla 0.281 160 Tilletia indica 0.2245 194 Cladosporium musae
127 Ustilago shiraiana 0.2795 161 Mycosphaerella holci 0.2226 195 Gibberella pulicaris
128 Gymnosporangium fuscum 0.2761 162 Alternaria gaisen 0.2223 196 Armillaria tabescens
129 Drepanopeziza ribis 0.2757 163 Rhizopus stolonifer 0.2223 197 Peronospora farinosa f.sp. spinaciae
130 Erynia neoaphidis 0.2732 164 Cercospora zeae-maydis 0.22 198 Gymnosporangium yamadae
131 Fusarium oxysporum f.sp. lentis 0.2725 165 Gymnosporangium asiaticum 0.2171 199 Mycosphaerella laricis-leptolepidis
132 Cochliobolus victoriae 0.2621 166 Pyrenopeziza brassicae 0.2153 200 Pythium deliense
133 Stagonospora sacchari 0.2583 167 Ascochyta sorghi 0.2141 201 Phialophora gregata
134 Cryptodiaporthe populea 0.2553 168 Blumeriella jaapii 0.2122 202 Didymella applanata
135 Lachnella willkommii 0.2512 169 Sphaeropsis sapinea 0.2095 203 Phoma pinodella
136 Colletotrichum capsici 0.2504 170 Sphaceloma arachidis 0.2088 204 Fusarium oxysporum f.sp. tracheiphilum

CRC10001 Final Report Page 156 of
172

CRC10001 Final Report Page 157 of
172
Table 46. The top 200 risk list for plant pathogen species absent from QLD.
Rank Species Name Risk Index Rank Species Name Risk Index Rank Species Name
1 Ustilago scitaminea 0.8756 35 Botrytis aclada 0.4961 69 Cladosporium musae
2 Cercospora beticola 0.8606 36 Rhynchosporium secalis 0.4802 70 Trichoderma harzianum
3 Puccinia sorghi 0.8123 37 Phytophthora capsici 0.478 71 Colletotrichum kahawae
4 Puccinia triticina 0.8057 38 Sarocladium oryzae 0.4647 72 Phomopsis theae
5 Cochliobolus miyabeanus 0.7917 39 Cochliobolus lunatus 0.4614 73 Guignardia bidwellii
6 Colletotrichum gossypii 0.7915 40 Phytophthora cactorum 0.4542 74 Alternaria japonica
7 Puccinia striiformis 0.777 41 Puccinia asparagi 0.4531 75 Urocystis cepulae
8 Lasiodiplodia theobromae 0.7534 42 Monographella albescens 0.4512 76 Alternaria alternata
9 Alternaria longipes 0.7519 43 Plasmopara halstedii 0.449 77 Didymella lycopersici
10 Hemileia vastatrix 0.7421 44 Rosellinia necatrix 0.4476 78 Puccinia psidii
11 Sphaerulina oryzina 0.7289 45 Helminthosporium solani 0.4437 79 Blumeria graminis
12 Ustilaginoidea virens 0.728 46 Sphaceloma perseae 0.4393 80 Uromyces ciceris-arietini
13 Myrothecium roridum 0.7153 47 Entyloma oryzae 0.4355 81 Phaeolus schweinitzii
14 Botryosphaeria ribis 0.7116 48 Pyrenophora graminea 0.4269 82 Armillaria heimii
15 Sporisorium cruentum 0.7026 49 Diaporthe phaseolorum var. sojae 0.4218 83 Septoria glycines
16 Pythium aphanidermatum 0.6926 50 Coleosporium ipomoeae 0.4196 84 Cryphonectria cubensis
17 Asperisporium caricae 0.6553 51 Mycosphaerella gibsonii 0.4094 85 Phomopsis asparagi
18 Podosphaera pannosa 0.6468 52 Cladosporium cucumerinum 0.4087 86 Phaeoramularia angolensis
19 Stenocarpella maydis 0.6451 53 Colletotrichum circinans 0.4056 87 Camptomeris leucaenae
20 Thanatephorus cucumeris 0.6306 54 Nectria rigidiuscula 0.4044 88 Puccinia carthami
21 Nematospora coryli 0.6274 55 Pseudocercospora fuligena 0.3985 89 Moesziomyces bullatus
22 Mycosphaerella henningsii 0.6256 56 Curvularia 0.3915 90 Uredo cajani
23 Albugo candida 0.6242 57 Lophodermium pinastri 0.3851 91 Phakopsora meibomiae
24 Puccinia allii 0.6221 58 Alternaria sesami 0.3805 92 Dactuliochaeta glycines
25 Gloeocercospora sorghi 0.6188 59 Corticium koleroga 0.377 93 Fusarium sporotrichioides
26 Cercospora kikuchii 0.5866 60 Rigidoporus microporus 0.3712 94 Alternaria padwickii
27 Pyrenophora teres 0.5769 61 Rosellinia bunodes 0.3412 95 Microcyclus ulei
28 Peronospora farinosa 0.5729 62 Colletotrichum tabacum 0.341 96 Gibberella xylarioides
29 Erysiphe necator 0.557 63 Stemphylium sarciniforme 0.3397 97 Claviceps fusiformis
30 Cercospora zeae-maydis 0.5566 64 Phakopsora euvitis 0.3377 98 Gibberella avenacea
31 Passalora sojina 0.5542 65 Fusarium oxysporum f.sp. lini 0.3366 99 Nectria cinnabarina
32 Aspergillus niger 0.5154 66 Gibberella stilboides 0.3327 100 Phomopsis longicolla
33 Venturia inaequalis 0.5055 67 Lecanicillium lecanii 0.3254 101 Fusarium oxysporum f.sp. phaseoli
34 Sclerospora graminicola 0.497 68 Mycena citricolor 0.3251 102 Colletotrichum capsici

CRC10001 Final Report Page 158 of
172
Table 46 (continued).
Rank Species Name Risk Index Rank Species Name Risk Index Rank Species Name
103 Fusarium sacchari 0.243 137 Cronartium quercuum 0.1876 171 Phialophora gregata
104 Bipolaris heveae 0.2424 138 Moniliophthora roreri 0.1864 172 Ustilago shiraiana
105 Coniella diplodiella 0.2411 139 Stagonospora sacchari 0.1854 173 Diaporthe helianthi
106 Ustilago crameri 0.2383 140 Phytophthora fragariae 0.1835 174 Tilletia indica
107 Erysiphe orontii 0.2371 141 Alternaria radicina 0.1831 175 Cercospora elaeidis
108 Podosphaera aphanis 0.2365 142 Fusarium culmorum 0.1802 176 Phomopsis juniperivora
109 Fusarium oxysporum f.sp. niveum 0.2352 143 Monographella nivalis 0.1799 177 Alternaria solani
110 Phytophthora colocasiae 0.2347 144 Puccinia cacabata 0.179 178 Elsino? veneta
111 Botrytis fabae 0.2346 145 Olpidium brassicae 0.1761 179 Fusarium oxysporum f.sp. lentis
112 Oidium heveae 0.2285 146 Crinipellis perniciosa 0.1744 180 Phoma foveata
113 Phomopsis viticola 0.2265 147 Mycosphaerella holci 0.1724 181 Peronospora viciae
114 Botryosphaeria dothidea 0.2258 148 Sphaeropsis tumefaciens 0.1699 182 Mycosphaerella pyri
115 Ascochyta sorghi 0.225 149 Botryotinia squamosa 0.1661 183 Didymella fabae
116 Rosellinia pepo 0.2231 150 Puccinia hordei 0.1639 184 Fusarium oxysporum f.sp. elaeidis
117 Choanephora cucurbitarum 0.2219 151 Peronosclerospora philippinensis 0.1629 185 Phomopsis cocoes
118 Puccinia pittieriana 0.218 152 Aecidium mori 0.1622 186 Ganoderma philippii
119 Cercospora caribaea 0.2176 153 Synchytrium psophocarpi 0.1609 187 Microdochium panattonianum
120 Mycosphaerella dearnessii 0.2164 154 Armillaria mellea 0.16 188 Mycovellosiella koepkei
121 Alternaria dianthicola 0.2129 155 Monilinia fructigena 0.1598 189 Didymella lentis
122 Phytophthora erythroseptica var. erythroseptica 0.2111 156 Cronartium ribicola 0.1581 190 Phoma pinodella
123 Nectria galligena 0.2104 157 Chondrostereum purpureum 0.1569 191 Alternaria linicola
124 Elsinoe brasiliensis 0.209 158 Tranzschelia pruni-spinosae var. discolor 0.1548 192 Podosphaera macularis
125 Eutypa lata 0.2063 159 Peronosclerospora sacchari 0.1524 193 Kabatiella zeae
126 Verticillium albo-atrum 0.202 160 Exobasidium vexans 0.1514 194 Fusarium oxysporum f.sp. tracheiphilum
127 Pleospora betae 0.1993 161 Sclerotinia trifoliorum 0.1514 195 Phakopsora vitis
128 Monosporascus cannonballus 0.1971 162 Alternaria mali 0.1508 196 Phakopsora ampelopsidis
129 Cochliobolus victoriae 0.1937 163 Sphaceloma poinsettiae 0.1505 197 Podosphaera mors-uvae
130 Phaeosphaeria avenaria f.sp. avenaria 0.1924 164 Colletotrichum linicola 0.1498 198 Erysiphe cichoracearum
131 Diaporthe phaseolorum var. meridionalis 0.1917 165 Cryphonectria parasitica 0.1479 199 Gymnosporangium clavipes
132 Fusarium oxysporum f.sp. batatas 0.1912 166 Sphaceloma arachidis 0.1473 200 Spilocaea pyracanthae
133 Septoria cannabis 0.1909 167 Alternaria triticina 0.144 201 Armillaria ostoyae
134 Erynia radicans 0.1906 168 Spilocaea oleaginea 0.1422 202 Fomitopsis pinicola
135 Didymella rabiei 0.1898 169 Marasmius crinis-equi 0.1388 203 Alternaria gaisen
136 Mycosphaerella rabiei 0.1898 170 Aspergillus fumigatus 0.1381 204 Gymnosporangium asiaticum
CRC10001 Final Report Page 159 of
172
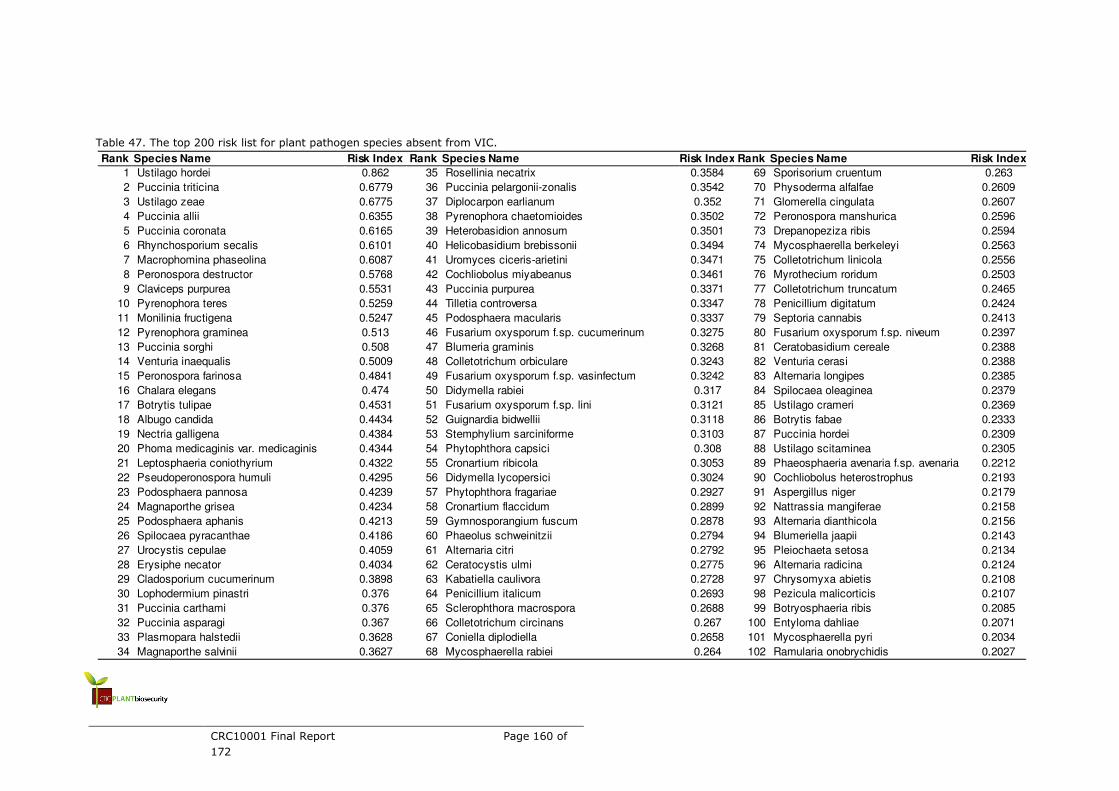
CRC10001 Final Report Page 160 of
172
Table 47. The top 200 risk list for plant pathogen species absent from VIC.
Rank Species Name Risk Index Rank Species Name Risk Index Rank Species Name Risk Index
1 Ustilago hordei 0.862 35 Rosellinia necatrix 0.3584 69 Sporisorium cruentum 0.263
2 Puccinia triticina 0.6779 36 Puccinia pelargonii-zonalis 0.3542 70 Physoderma alfalfae 0.2609
3 Ustilago zeae 0.6775 37 Diplocarpon earlianum 0.352 71 Glomerella cingulata 0.2607
4 Puccinia allii 0.6355 38 Pyrenophora chaetomioides 0.3502 72 Peronospora manshurica 0.2596
5 Puccinia coronata 0.6165 39 Heterobasidion annosum 0.3501 73 Drepanopeziza ribis 0.2594
6 Rhynchosporium secalis 0.6101 40 Helicobasidium brebissonii 0.3494 74 Mycosphaerella berkeleyi 0.2563
7 Macrophomina phaseolina 0.6087 41 Uromyces ciceris-arietini 0.3471 75 Colletotrichum linicola 0.2556
8 Peronospora destructor 0.5768 42 Cochliobolus miyabeanus 0.3461 76 Myrothecium roridum 0.2503
9 Claviceps purpurea 0.5531 43 Puccinia purpurea 0.3371 77 Colletotrichum truncatum 0.2465
10 Pyrenophora teres 0.5259 44 Tilletia controversa 0.3347 78 Penicillium digitatum 0.2424
11 Monilinia fructigena 0.5247 45 Podosphaera macularis 0.3337 79 Septoria cannabis 0.2413
12 Pyrenophora graminea 0.513 46 Fusarium oxysporum f.sp. cucumerinum 0.3275 80 Fusarium oxysporum f.sp. niveum 0.2397
13 Puccinia sorghi 0.508 47 Blumeria graminis 0.3268 81 Ceratobasidium cereale 0.2388
14 Venturia inaequalis 0.5009 48 Colletotrichum orbiculare 0.3243 82 Venturia cerasi 0.2388
15 Peronospora farinosa 0.4841 49 Fusarium oxysporum f.sp. vasinfectum 0.3242 83 Alternaria longipes 0.2385
16 Chalara elegans 0.474 50 Didymella rabiei 0.317 84 Spilocaea oleaginea 0.2379
17 Botrytis tulipae 0.4531 51 Fusarium oxysporum f.sp. lini 0.3121 85 Ustilago crameri 0.2369
18 Albugo candida 0.4434 52 Guignardia bidwellii 0.3118 86 Botrytis fabae 0.2333
19 Nectria galligena 0.4384 53 Stemphylium sarciniforme 0.3103 87 Puccinia hordei 0.2309
20 Phoma medicaginis var. medicaginis 0.4344 54 Phytophthora capsici 0.308 88 Ustilago scitaminea 0.2305
21 Leptosphaeria coniothyrium 0.4322 55 Cronartium ribicola 0.3053 89 Phaeosphaeria avenaria f.sp. avenaria 0.2212
22 Pseudoperonospora humuli 0.4295 56 Didymella lycopersici 0.3024 90 Cochliobolus heterostrophus 0.2193
23 Podosphaera pannosa 0.4239 57 Phytophthora fragariae 0.2927 91 Aspergillus niger 0.2179
24 Magnaporthe grisea 0.4234 58 Cronartium flaccidum 0.2899 92 Nattrassia mangiferae 0.2158
25 Podosphaera aphanis 0.4213 59 Gymnosporangium fuscum 0.2878 93 Alternaria dianthicola 0.2156
26 Spilocaea pyracanthae 0.4186 60 Phaeolus schweinitzii 0.2794 94 Blumeriella jaapii 0.2143
27 Urocystis cepulae 0.4059 61 Alternaria citri 0.2792 95 Pleiochaeta setosa 0.2134
28 Erysiphe necator 0.4034 62 Ceratocystis ulmi 0.2775 96 Alternaria radicina 0.2124
29 Cladosporium cucumerinum 0.3898 63 Kabatiella caulivora 0.2728 97 Chrysomyxa abietis 0.2108
30 Lophodermium pinastri 0.376 64 Penicillium italicum 0.2693 98 Pezicula malicorticis 0.2107
31 Puccinia carthami 0.376 65 Sclerophthora macrospora 0.2688 99 Botryosphaeria ribis 0.2085
32 Puccinia asparagi 0.367 66 Colletotrichum circinans 0.267 100 Entyloma dahliae 0.2071
33 Plasmopara halstedii 0.3628 67 Coniella diplodiella 0.2658 101 Mycosphaerella pyri 0.2034
34 Magnaporthe salvinii 0.3627 68 Mycosphaerella rabiei 0.264 102 Ramularia onobrychidis 0.2027
CRC10001 Final Report Page 161 of
172
Table 47 (continued).
Rank Species Name Risk Index Rank Species Name Risk Index Rank Species Name Risk Index
103 Cryphonectria parasitica 0.1999 137 Monilochaetes infuscans 0.1416 171 Diaporthe eres 0.1037
104 Peronospora viciae 0.1988 138 Polyscytalum pustulans 0.138 172 Rhabdocline pseudotsugae 0.1033
105 Glomerella tucumanensis 0.1903 139 Diaporthe helianthi 0.137 173 Mycosphaerella arachidis 0.1018
106 Ceratocystis paradoxa 0.1901 140 Pseudoperonospora cannabina 0.1367 174 Peronospora rubi 0.1007
107 Sclerospora graminicola 0.1868 141 Nectria cinnabarina 0.1351 175 Cochliobolus carbonum 0.0995
108 Gremmeniella abietina 0.1851 142 Fomes fomentarius 0.135 176 Alternaria alternata 0.0966
109 Botrytis anthophila 0.1762 143 Rhizina undulata 0.1338 177 Peronospora farinosa f.sp. chenopodii 0.0963
110 Fusarium sporotrichioides 0.1758 144 Didymella fabae 0.1304 178 Passalora sojina 0.0937
111 Neotyphodium coenophialum 0.1746 145 Glomerella graminicola 0.1293 179 Gibberella acuminata 0.0858
112 Coniothyrium wernsdorffiae 0.1712 146 Mycocentrospora cladosporioides 0.1291 180 Hypoxylon mammatum 0.0857
113 Lachnella willkommii 0.1706 147 Alternaria mali 0.1289 181 Cronartium quercuum 0.0848
114 Colletotrichum gossypii 0.17 148 Phytophthora palmivora 0.1288 182 Aspergillus terreus 0.0832
115 Armillaria mellea 0.1687 149 Monosporascus cannonballus 0.1223 183 Paecilomyces lilacinus 0.0824
116 Pythium splendens 0.1679 150 Fusarium oxysporum f.sp. cannabis 0.1204 184 Didymascella thujina 0.0815
117 Alternaria japonica 0.1638 151 Fusarium oxysporum f.sp. cubense 0.1187 185 Septoria glycines 0.0815
118 Alternaria helianthi 0.1624 152 Pythium graminicola 0.118 186 Fusarium proliferatum 0.0809
119 Synchytrium endobioticum 0.1551 153 Phytophthora porri 0.1165 187 Phomopsis longicolla 0.0807
120 Erysiphe orontii 0.1549 154 Gnomonia comari 0.1163 188 Phomopsis asparagi 0.0806
121 Meria laricis 0.1545 155 Lasiodiplodia theobromae 0.1163 189 Curvularia 0.0803
122 Pythium myriotylum 0.1535 156 Alternaria sesami 0.1157 190 Phomopsis juniperivora 0.0796
123 Cochliobolus lunatus 0.1533 157 Fusarium oxysporum f.sp. radicis-lycopersici 0.1144 191 Phytophthora boehmeriae 0.0794
124 Colletotrichum musae 0.1527 158 Erynia neoaphidis 0.1134 192 Mycosphaerella cruenta 0.0788
125 Diaporthe phaseolorum var. sojae 0.1521 159 Alternaria triticina 0.112 193 Phytophthora cambivora 0.0761
126 Fusarium oxysporum f.sp. lentis 0.1508 160 Fomitopsis pinicola 0.1084 194 Cercospora nicotianae 0.0751
127 Pythium aphanidermatum 0.1502 161 Cercospora sorghi 0.1083 195 Tilletia barclayana 0.0751
128 Peronosclerospora sorghi 0.15 162 Pythium vexans 0.1083 196 Fusarium oxysporum f.sp. phaseoli 0.0748
129 Puccinia arachidis 0.1493 163 Olpidium brassicae 0.1073 197 Apiognomonia erythrostoma 0.0741
130 Physoderma leproides 0.1476 164 Armillaria ostoyae 0.107 198 Pythium arrhenomanes 0.0734
131 Fusarium oxysporum f.sp. conglutinans 0.1471 165 Cryptodiaporthe populea 0.107 199 Tilletia indica 0.073
132 Phialophora cinerescens 0.1468 166 Ascochyta gossypii 0.1062 200 Pythium deliense 0.072
133 Gibberella intricans 0.1456 167 Lecanicillium lecanii 0.1058 201 Gymnosporangium asiaticum 0.0713
134 Phoma tracheiphila 0.1455 168 Rhizoctonia tuliparum 0.1057 202 Diaporthe phaseolorum var. caulivora 0.0703
135 Didymella ligulicola 0.1423 169 Sclerotinia borealis 0.1048 203 Stenocarpella maydis 0.0694
136 Ophiostoma piceae 0.1418 170 Bipolaris sacchari 0.1043 204 Entyloma oryzae 0.0673

CRC10001 Final Report Page 162 of
172
Table 48. The top 200 risk list for plant pathogen species absent from TAS.
Rank Species Name Risk Index Rank Species Name Risk Index Rank Species Name
1 Phytophthora infestans 0.7913 35 Kabatiella caulivora 0.408 69 Entyloma dahliae
2 Gibberella avenacea 0.6782 36 Puccinia helianthi 0.4047 70 Rhizina undulata
3 Cercospora beticola 0.6739 37 Leveillula taurica 0.4019 71 Plasmopara halstedii
4 Pseudoperonospora humuli 0.6635 38 Stemphylium sarciniforme 0.3962 72 Rhabdocline pseudotsugae
5 Alternaria brassicicola 0.654 39 Peronospora destructor 0.3957 73 Lachnella willkommii
6 Cronartium ribicola 0.6498 40 Cronartium flaccidum 0.3911 74 Ceratobasidium cereale
7 Gibberella zeae 0.6291 41 Colletotrichum acutatum 0.3871 75 Ramularia onobrychidis
8 Venturia pirina 0.6272 42 Didymella lycopersici 0.3802 76 Polyscytalum pustulans
9 Albugo candida 0.5983 43 Didymella bryoniae 0.3799 77 Hypoxylon mammatum
10 Ustilago zeae 0.5897 44 Pezicula malicorticis 0.3751 78 Didymella lentis
11 Puccinia asparagi 0.5816 45 Nectria cinnabarina 0.365 79 Cryphonectria parasitica
12 Peronospora hyoscyami f.sp. tabacina 0.576 46 Peronospora manshurica 0.3645 80 Colletotrichum linicola
13 Heterobasidion annosum 0.5593 47 Septoria cannabis 0.3585 81 Blumeriella jaapii
14 Puccinia allii 0.5507 48 Alternaria radicina 0.3555 82 Venturia cerasi
15 Podosphaera aphanis 0.5496 49 Blumeria graminis 0.3506 83 Fomes fomentarius
16 Puccinia triticina 0.5366 50 Gymnosporangium fuscum 0.3489 84 Pleiochaeta setosa
17 Pyrenophora graminea 0.5364 51 Melampsora medusae 0.3483 85 Armillaria ostoyae
18 Pyrenophora tritici-repentis 0.535 52 Lophodermium pinastri 0.3435 86 Ophiostoma piceae
19 Monilinia fructigena 0.5277 53 Chrysomyxa abietis 0.3432 87 Guignardia bidwellii
20 Ceratocystis ulmi 0.5228 54 Tilletia controversa 0.3414 88 Didymascella thujina
21 Podosphaera pannosa 0.522 55 Meria laricis 0.3402 89 Gnomonia comari
22 Gibberella fujikuroi 0.5034 56 Fusarium oxysporum f.sp. lini 0.3372 90 Colletotrichum orbiculare
23 Sporisorium sorghi 0.4985 57 Peronospora farinosa 0.3339 91 Fomitopsis pinicola
24 Podosphaera macularis 0.4942 58 Alternaria porri 0.3306 92 Puccinia carthami
25 Helicobasidium brebissonii 0.491 59 Venturia inaequalis 0.3296 93 Magnaporthe salvinii
26 Urocystis cepulae 0.4858 60 Cladosporium cucumerinum 0.3293 94 Physoderma alfalfae
27 Phytophthora fragariae 0.4839 61 Puccinia sorghi 0.3278 95 Mycosphaerella pyri
28 Pseudoperonospora cubensis 0.4687 62 Synchytrium endobioticum 0.3262 96 Magnaporthe grisea
29 Mycosphaerella linicola 0.445 63 Pyrenophora teres 0.3243 97 Sclerophthora macrospora
30 Drepanopeziza ribis 0.4398 64 Glomerella cingulata 0.3225 98 Pythium graminicola
31 Fusarium oxysporum 0.4332 65 Pyrenophora chaetomioides 0.3204 99 Fusarium oxysporum f.sp. melonis
32 Erysiphe necator 0.4313 66 Aphanomyces euteiches 0.3199 100 Coniella diplodiella
33 Gremmeniella abietina 0.4214 67 Phialophora cinerescens 0.3174 101 Cryptodiaporthe populea
34 Sphacelotheca reiliana 0.4098 68 Phaeolus schweinitzii 0.3173 102 Phragmidium rubi-idaei

CRC10001 Final Report Page 163 of
172
Table 48 (continued).
Rank Species Name Risk Index Rank Species Name Risk Index Rank Species Name
103 Cochliobolus heterostrophus 0.2283 137 Cochliobolus miyabeanus 0.1638 171 Phytophthora medicaginis
104 Sclerotinia borealis 0.2268 138 Mycosphaerella rabiei 0.1636 172 Fusarium sporotrichioides
105 Alternaria japonica 0.2249 139 Myrothecium roridum 0.1629 173 Phytophthora cambivora
106 Peronospora rubi 0.2216 140 Alternaria mali 0.1603 174 Passalora sojina
107 Apiosporina morbosa 0.2206 141 Phaeoisariopsis griseola 0.1571 175 Cochliobolus carbonum
108 Colletotrichum truncatum 0.2202 142 Rosellinia necatrix 0.1568 176 Phoma pinodella
109 Trichoderma harzianum 0.2187 143 Apiognomonia erythrostoma 0.1555 177 Diaporthe vaccinii
110 Didymella rabiei 0.2179 144 Phytophthora porri 0.1543 178 Fusarium oxysporum f.sp. radicis-lycopersici
111 Olpidium brassicae 0.2146 145 Sporisorium cruentum 0.1542 179 Pythium myriotylum
112 Ustilago crameri 0.2137 146 Diaporthe phaseolorum var. sojae 0.154 180 Gibberella intricans
113 Botrytis fabae 0.2124 147 Alternaria helianthi 0.1528 181 Penicillium digitatum
114 Mycosphaerella populorum 0.2095 148 Glomerella graminicola 0.152 182 Botryosphaeria ribis
115 Cronartium comandrae 0.209 149 Stenocarpella maydis 0.1491 183 Septoria glycines
116 Coniothyrium wernsdorffiae 0.2081 150 Pythium arrhenomanes 0.1487 184 Gymnosporangium asiaticum
117 Endocronartium harknessii 0.2049 151 Neotyphodium coenophialum 0.1428 185 Atropellis piniphila
118 Cronartium coleosporioides 0.2008 152 Uromyces ciceris-arietini 0.1413 186 Gibberella pulicaris
119 Phytophthora capsici 0.2004 153 Anisogramma anomala 0.1409 187 Ciborinia camelliae
120 Cronartium comptoniae 0.1961 154 Puccinia purpurea 0.1367 188 Kabatiella zeae
121 Gymnosporangium clavipes 0.195 155 Alternaria longipes 0.1351 189 Pseudopeziza tracheiphila
122 Phytophthora sojae 0.1918 156 Fusarium oxysporum f.sp. niveum 0.1336 190 Fusarium proliferatum
123 Botryotinia squamosa 0.1908 157 Lecanicillium lecanii 0.1336 191 Phomopsis longicolla
124 Cronartium quercuum 0.1904 158 Alternaria linicola 0.1334 192 Mycosphaerella berkeleyi
125 Diaporthe citri 0.1903 159 Diaporthe helianthi 0.132 193 Alternaria citri
126 Sclerospora graminicola 0.1873 160 Phytophthora richardiae 0.1267 194 Inonotus weirii
127 Pseudoperonospora cannabina 0.1826 161 Spilocaea oleaginea 0.1249 195 Pythium aphanidermatum
128 Colletotrichum circinans 0.1823 162 Nattrassia mangiferae 0.1245 196 Fusarium oxysporum f.sp. lentis
129 Ceratocystis fimbriata 0.1796 163 Fusarium oxysporum f.sp. vasinfectum 0.1233 197 Phomopsis asparagi
130 Fusarium oxysporum f.sp. conglutinans 0.1786 164 Phomopsis sclerotioides 0.1226 198 Erysiphe cichoracearum
131 Phaeosphaeria avenaria f.sp. avenaria 0.1749 165 Fusarium oxysporum f.sp. cannabis 0.1216 199 Cryptostroma corticale
132 Botryotinia porri 0.1734 166 Penicillium italicum 0.1183 200 Ceratocystis wageneri
133 Rhizoctonia tuliparum 0.1715 167 Pythium vexans 0.1183 201 Cochliobolus lunatus
134 Erysiphe orontii 0.1709 168 Erynia neoaphidis 0.1176 202 Ustilago scitaminea
135 Ulocladium atrum 0.1695 169 Alternaria alternata 0.1161 203 Gymnosporangium juniperi-virginianae
136 Armillaria mellea 0.1666 170 Aspergillus niger 0.1149 204 Physoderma maydis

CRC10001 Final Report Page 164 of
172
Table 49. The top 200 risk list for plant pathogen species absent from NT.
Rank Species Name Risk Index Rank Species Name Risk Index Rank Species Name Risk Index
1 Glomerella tucumanensis 0.5772 35 Cercospora elaeidis 0.2613 69 Cercospora kikuchii 0.1478
2 Hemileia vastatrix 0.5458 36 Bipolaris sacchari 0.2585 70 Guignardia musae 0.1477
3 Puccinia polysora 0.494 37 Puccinia sorghi 0.2462 71 Marasmius crinis-equi 0.1477
4 Ceratocystis paradoxa 0.4779 38 Alternaria dauci 0.2397 72 Mycosphaerella brassicicola 0.1473
5 Uromyces appendiculatus 0.4769 39 Claviceps fusiformis 0.2395 73 Puccinia graminis 0.1462
6 Mycosphaerella arachidis 0.4705 40 Phaeoramularia angolensis 0.2377 74 Cochliobolus sativus 0.1449
7 Pseudoperonospora cubensis 0.4581 41 Sclerospora graminicola 0.2362 75 Puccinia triticina 0.1413
8 Mycosphaerella henningsii 0.4346 42 Septoria lycopersici 0.2357 76 Claviceps africana 0.1405
9 Sporisorium sorghi 0.433 43 Nectria rigidiuscula 0.2318 77 Bipolaris heveae 0.1379
10 Lasiodiplodia theobromae 0.4197 44 Nattrassia mangiferae 0.2117 78 Phytophthora colocasiae 0.1356
11 Mycosphaerella fijiensis 0.4105 45 Myrothecium roridum 0.2116 79 Botryosphaeria ribis 0.1312
12 Gloeocercospora sorghi 0.4022 46 Ustilago zeae 0.2098 80 Ceratocystis fimbriata 0.1297
13 Phaeoisariopsis griseola 0.3976 47 Ascochyta sorghi 0.2046 81 Fusarium oxysporum f.sp. elaeidis 0.1256
14 Macrophomina phaseolina 0.3944 48 Didymella bryoniae 0.1986 82 Colletotrichum kahawae 0.1255
15 Mycovellosiella fulva 0.3913 49 Trachysphaera fructigena 0.1972 83 Rosellinia bunodes 0.1178
16 Corticium salmonicolor 0.378 50 Phytophthora citrophthora 0.1964 84 Albugo candida 0.1143
17 Ustilago scitaminea 0.3712 51 Colletotrichum capsici 0.1946 85 Puccinia kuehnii 0.1138
18 Gibberella xylarioides 0.3643 52 Plasmopara viticola 0.1945 86 Phytophthora cactorum 0.1115
19 Alternaria porri 0.358 53 Magnaporthe salvinii 0.1834 87 Armillaria heimii 0.1114
20 Glomerella graminicola 0.3555 54 Cercospora nicotianae 0.1829 88 Cochliobolus lunatus 0.1108
21 Phytophthora infestans 0.3429 55 Peronosclerospora sorghi 0.179 89 Fusarium oxysporum 0.1046
22 Sphacelotheca reiliana 0.3402 56 Fusarium oxysporum f.sp. vasinfectum 0.1782 90 Ascochyta gossypii 0.0979
23 Leveillula taurica 0.3321 57 Aspergillus niger 0.1768 91 Puccinia striiformis 0.0958
24 Mycosphaerella cruenta 0.329 58 Thanatephorus cucumeris 0.1738 92 Mycovellosiella koepkei 0.0953
25 Phellinus noxius 0.3207 59 Puccinia melanocephala 0.1722 93 Passalora sojina 0.0945
26 Sporisorium cruentum 0.3087 60 Sarocladium oryzae 0.1686 94 Corticium koleroga 0.0945
27 Cercospora beticola 0.3062 61 Pythium aphanidermatum 0.168 95 Cercospora caribaea 0.0943
28 Colletotrichum gossypii 0.2753 62 Diplocarpon rosae 0.1594 96 Pythium vexans 0.0935
29 Cladosporium musae 0.2734 63 Curvularia 0.1577 97 Nematospora coryli 0.0912
30 Alternaria brassicicola 0.2718 64 Elsino? batatas 0.1569 98 Tilletia barclayana 0.0912
31 Colletotrichum truncatum 0.2697 65 Ganoderma philippii 0.1528 99 Mycosphaerella graminicola 0.0889
32 Colletotrichum musae 0.2687 66 Taphrina deformans 0.1527 100 Asperisporium caricae 0.0862
33 Rigidoporus microporus 0.2645 67 Stenocarpella macrospora 0.1526 101 Didymella lycopersici 0.0852
34 Colletotrichum lindemuthianum 0.2614 68 Physoderma maydis 0.1505 102 Crinipellis perniciosa 0.0851

CRC10001 Final Report Page 165 of
172
Table 49 (continued).
Rank Species Name Risk Index Rank Species Name Risk Index Rank Species Name Risk Index
103 Cryphonectria cubensis 0.0846 137 Puccinia psidii 0.052 171 Pythium irregulare 0.0347
104 Uredo cajani 0.0842 138 Verticillium dahliae 0.052 172 Diaporthe vexans 0.0337
105 Diaporthe phaseolorum var. sojae 0.0827 139 Rhizoctonia oryzae 0.0507 173 Alternaria citri 0.0337
106 Pythium splendens 0.0795 140 Coleosporium ipomoeae 0.0502 174 Colletotrichum circinans 0.0326
107 Mycosphaerella coffeicola 0.0785 141 Bipolaris incurvata 0.0501 175 Fusarium sacchari 0.0323
108 Microcyclus ulei 0.0784 142 Camptomeris leucaenae 0.0499 176 Tilletia tritici 0.0323
109 Alternaria longipes 0.0764 143 Mycosphaerella pini 0.0496 177 Synchytrium endobioticum 0.032
110 Sclerotinia sclerotiorum 0.0757 144 Mycosphaerella holci 0.0488 178 Peronospora farinosa 0.0316
111 Uromyces viciae-fabae 0.0753 145 Rosellinia necatrix 0.0483 179 Fusarium oxysporum f.sp. phaseoli 0.0315
112 Sphaceloma fawcettii var. scabiosa 0.0748 146 Pythium graminicola 0.0473 180 Diaporthe phaseolorum var. meridionalis 0.0313
113 Colletotrichum dematium 0.0746 147 Colletotrichum coccodes 0.047 181 Moniliophthora roreri 0.0311
114 Puccinia helianthi 0.0743 148 Exobasidium vexans 0.0453 182 Cladosporium cucumerinum 0.031
115 Cercospora zeae-maydis 0.074 149 Gibberella stilboides 0.0449 183 Penicillium italicum 0.0303
116 Stenocarpella maydis 0.0728 150 Elsino? ampelina 0.0443 184 Diaporthe phaseolorum var. caulivora 0.03
117 Mycena citricolor 0.0712 151 Ustilago hordei 0.044 185 Monographella nivalis 0.03
118 Dactuliochaeta glycines 0.0667 152 Ganoderma boninense 0.0436 186 Peronospora farinosa f.sp. chenopodii 0.03
119 Marasmiellus scandens 0.0665 153 Claviceps purpurea 0.0435 187 Physoderma alfalfae 0.03
120 Colletotrichum acutatum 0.065 154 Peronospora farinosa f.sp. betae 0.0433 188 Phytophthora fragariae 0.03
121 Rosellinia arcuata 0.0643 155 Phaeosphaeria nodorum 0.0427 189 Puccinia hordei 0.03
122 Alternaria sesami 0.0632 156 Podosphaera leucotricha 0.0426 190 Alternaria japonica 0.0287
123 Didymella pinodes 0.0624 157 Puccinia pittieriana 0.0425 191 Alternaria helianthi 0.0286
124 Gaeumannomyces graminis var. tritici 0.0615 158 Tilletia laevis 0.0411 192 Pythium deliense 0.0286
125 Phomopsis longicolla 0.0606 159 Rhynchosporium secalis 0.041 193 Podosphaera pannosa 0.0285
126 Sphaceloma perseae 0.0602 160 Oncobasidium theobromae 0.0405 194 Phytophthora capsici 0.0277
127 Phakopsora meibomiae 0.0601 161 Gibberella intricans 0.0394 195 Penicillium digitatum 0.0267
128 Spilocaea oleaginea 0.06 162 Monilochaetes infuscans 0.0386 196 Peronospora destructor 0.0267
129 Oidium heveae 0.0599 163 Ascochyta pisi 0.0382 197 Albugo ipomoeae-panduratae 0.0261
130 Monilinia fructicola 0.0589 164 Peronosclerospora sacchari 0.038 198 Pyrenophora chaetomioides 0.0241
131 Peronospora parasitica 0.0576 165 Pythium arrhenomanes 0.0375 199 Fusarium sporotrichioides 0.0236
132 Rosellinia pepo 0.0567 166 Guignardia bidwellii 0.0367 200 Guignardia citricarpa 0.0229
133 Mycosphaerella citri 0.056 167 Urocystis cepulae 0.0367 201 Phoma foveata 0.0226
134 Septoria apiicola 0.0556 168 Elsino? australis 0.0363 202 Rhizopus stolonifer 0.0221
135 Pythium debaryanum 0.0556 169 Phomopsis cocoes 0.0356 203 Fusarium oxysporum f.sp. melonis 0.0207
136 Sphaeropsis tumefaciens 0.0548 170 Balansia oryzae-sativae 0.0353 204 Entyloma dahliae 0.0205

CRC10001 Final Report Page 166 of
172
Table 50. The top 200 risk list for plant pathogen species absent from SA.
Rank Species Name Risk Index Rank Species Name Risk Index Rank Species Name Risk Index
1 Puccinia triticina 0.6779 35 Mycosphaerella pini 0.3474 69 Venturia cerasi 0.2388
2 Ustilago zeae 0.6775 36 Uromyces ciceris-arietini 0.3471 70 Ceratobasidium cereale 0.2388
3 Puccinia allii 0.6355 37 Cochliobolus miyabeanus 0.3461 71 Alternaria longipes 0.2385
4 Sclerotinia sclerotiorum 0.6118 38 Ulocladium atrum 0.3425 72 Spilocaea oleaginea 0.2379
5 Leveillula taurica 0.5778 39 Puccinia purpurea 0.3371 73 Ustilago crameri 0.2369
6 Peronospora destructor 0.5768 40 Podosphaera macularis 0.3337 74 Trichoderma harzianum 0.2345
7 Sphacelotheca reiliana 0.5487 41 Blumeria graminis 0.3268 75 Botrytis fabae 0.2333
8 Gibberella avenacea 0.5423 42 Fusarium oxysporum f.sp. vasinfectum 0.3242 76 Ustilago scitaminea 0.2305
9 Alternaria brassicicola 0.5388 43 Discosphaerina fulvida 0.3232 77 Phragmidium rubi-idaei 0.2299
10 Pleospora betae 0.5293 44 Didymella rabiei 0.317 78 Phaeosphaeria avenaria f.sp. avenaria 0.2212
11 Setosphaeria turcica 0.5255 45 Fusarium oxysporum f.sp. lini 0.3121 79 Verticillium albo-atrum 0.2204
12 Monilinia fructigena 0.5247 46 Guignardia bidwellii 0.3118 80 Cochliobolus heterostrophus 0.2193
13 Pyrenophora graminea 0.513 47 Stemphylium sarciniforme 0.3103 81 Aspergillus niger 0.2179
14 Pyrenophora tritici-repentis 0.5127 48 Phytophthora capsici 0.308 82 Nattrassia mangiferae 0.2158
15 Puccinia sorghi 0.508 49 Cronartium ribicola 0.3053 83 Alternaria dianthicola 0.2156
16 Venturia inaequalis 0.5009 50 Didymella lycopersici 0.3024 84 Blumeriella jaapii 0.2143
17 Peronospora farinosa 0.4841 51 Colletotrichum acutatum 0.2988 85 Pleiochaeta setosa 0.2134
18 Sclerotinia trifoliorum 0.4732 52 Cronartium flaccidum 0.2899 86 Chrysomyxa abietis 0.2108
19 Albugo candida 0.4434 53 Gymnosporangium fuscum 0.2878 87 Pezicula malicorticis 0.2107
20 Nectria galligena 0.4384 54 Phaeolus schweinitzii 0.2794 88 Botryosphaeria ribis 0.2085
21 Pseudoperonospora humuli 0.4295 55 Alternaria citri 0.2792 89 Elsino? fawcettii 0.2077
22 Podosphaera pannosa 0.4239 56 Helminthosporium solani 0.2788 90 Entyloma dahliae 0.2071
23 Magnaporthe grisea 0.4234 57 Ceratocystis ulmi 0.2775 91 Mycosphaerella pyri 0.2034
24 Podosphaera aphanis 0.4213 58 Coniella diplodiella 0.2658 92 Ramularia onobrychidis 0.2027
25 Spilocaea pyracanthae 0.4186 59 Fusarium oxysporum f.sp. melonis 0.265 93 Cryphonectria parasitica 0.1999
26 Monographella nivalis 0.4138 60 Mycosphaerella rabiei 0.264 94 Peronospora viciae 0.1988
27 Cladosporium cucumerinum 0.3898 61 Sporisorium cruentum 0.263 95 Phaeoisariopsis griseola 0.1906
28 Didymella applanata 0.3891 62 Glomerella cingulata 0.2607 96 Glomerella tucumanensis 0.1903
29 Fusarium culmorum 0.3756 63 Peronospora manshurica 0.2596 97 Ceratocystis paradoxa 0.1901
30 Puccinia asparagi 0.367 64 Mycosphaerella berkeleyi 0.2563 98 Sclerospora graminicola 0.1868
31 Magnaporthe salvinii 0.3627 65 Colletotrichum linicola 0.2556 99 Gremmeniella abietina 0.1851
32 Rosellinia necatrix 0.3584 66 Colletotrichum truncatum 0.2465 100 Phaeocryptopus gaeumannii 0.1804
33 Heterobasidion annosum 0.3501 67 Septoria cannabis 0.2413 101 Botrytis anthophila 0.1762
34 Helicobasidium brebissonii 0.3494 68 Fusarium oxysporum f.sp. niveum 0.2397 102 Fusarium sporotrichioides 0.1758

CRC10001 Final Report Page 167 of
172
Table 50 (continued).
Rank Species Name Risk Index Rank Species Name Risk Index Rank Species Name Risk Index
103 Neotyphodium coenophialum 0.1746 137 Ceratocystis fimbriata 0.1312 171 Guignardia citricarpa 0.088
104 Coniothyrium wernsdorffiae 0.1712 138 Didymella fabae 0.1304 172 Hypoxylon mammatum 0.0857
105 Lachnella willkommii 0.1706 139 Glomerella graminicola 0.1293 173 Cronartium quercuum 0.0848
106 Colletotrichum gossypii 0.17 140 Mycocentrospora cladosporioides 0.1291 174 Aspergillus terreus 0.0832
107 Armillaria mellea 0.1687 141 Alternaria mali 0.1289 175 Paecilomyces lilacinus 0.0824
108 Pythium splendens 0.1679 142 Phytophthora palmivora 0.1288 176 Didymascella thujina 0.0815
109 Alternaria japonica 0.1638 143 Monosporascus cannonballus 0.1223 177 Septoria glycines 0.0815
110 Alternaria helianthi 0.1624 144 Fusarium oxysporum f.sp. cannabis 0.1204 178 Fusarium proliferatum 0.0809
111 Synchytrium endobioticum 0.1551 145 Fusarium oxysporum f.sp. cubense 0.1187 179 Phomopsis longicolla 0.0807
112 Erysiphe orontii 0.1549 146 Gnomonia comari 0.1163 180 Phomopsis asparagi 0.0806
113 Meria laricis 0.1545 147 Lasiodiplodia theobromae 0.1163 181 Curvularia 0.0803
114 Pythium myriotylum 0.1535 148 Alternaria sesami 0.1157 182 Phomopsis juniperivora 0.0796
115 Cochliobolus lunatus 0.1533 149 Fusarium oxysporum f.sp. radicis-lycopersici 0.1144 183 Phytophthora boehmeriae 0.0794
116 Phytophthora sojae 0.1531 150 Erynia neoaphidis 0.1134 184 Mycosphaerella cruenta 0.0788
117 Colletotrichum musae 0.1527 151 Alternaria triticina 0.112 185 Phytophthora cambivora 0.0761
118 Diaporthe phaseolorum var. sojae 0.1521 152 Fomitopsis pinicola 0.1084 186 Cercospora nicotianae 0.0751
119 Fusarium oxysporum f.sp. lentis 0.1508 153 Cercospora sorghi 0.1083 187 Tilletia barclayana 0.0751
120 Pythium aphanidermatum 0.1502 154 Olpidium brassicae 0.1073 188 Fusarium oxysporum f.sp. phaseoli 0.0748
121 Peronosclerospora sorghi 0.15 155 Armillaria ostoyae 0.107 189 Apiognomonia erythrostoma 0.0741
122 Puccinia arachidis 0.1493 156 Cryptodiaporthe populea 0.107 190 Pythium arrhenomanes 0.0734
123 Physoderma leproides 0.1476 157 Ascochyta gossypii 0.1062 191 Tilletia indica 0.073
124 Fusarium oxysporum f.sp. conglutinans 0.1471 158 Lecanicillium lecanii 0.1058 192 Pythium deliense 0.072
125 Phialophora cinerescens 0.1468 159 Rhizoctonia tuliparum 0.1057 193 Gymnosporangium asiaticum 0.0713
126 Botryotinia squamosa 0.1461 160 Sclerotinia borealis 0.1048 194 Diaporthe phaseolorum var. caulivora 0.0703
127 Phoma tracheiphila 0.1455 161 Bipolaris sacchari 0.1043 195 Stenocarpella maydis 0.0694
128 Didymella ligulicola 0.1423 162 Diaporthe eres 0.1037 196 Entyloma oryzae 0.0673
129 Ophiostoma piceae 0.1418 163 Rhabdocline pseudotsugae 0.1033 197 Ciborinia camelliae 0.0671
130 Polyscytalum pustulans 0.138 164 Mycosphaerella arachidis 0.1018 198 Nematospora coryli 0.0645
131 Diaporthe helianthi 0.137 165 Peronospora rubi 0.1007 199 Guignardia musae 0.0635
132 Pseudoperonospora cannabina 0.1367 166 Cochliobolus carbonum 0.0995 200 Gibberella pulicaris 0.0632
133 Nectria cinnabarina 0.1351 167 Alternaria alternata 0.0966 201 Aspergillus fumigatus 0.0627
134 Fomes fomentarius 0.135 168 Peronospora farinosa f.sp. chenopodii 0.0963 202 Phakopsora pachyrhizi 0.0626
135 Rhizina undulata 0.1338 169 Passalora sojina 0.0937 203 Cercospora kikuchii 0.0616
136 Physoderma maydis 0.1329 170 Ganoderma boninense 0.0918 204 Sclerotinia minor 0.0612
CRC10001 Final Report Page 168 of
172
Table 51. The top 200 risk list for plant pathogen species absent from WA.
Rank Species Name Risk Index Rank Species Name Risk Index Rank Species Name Risk Index
1 Puccinia striiformis 0.8222 35 Erysiphe necator 0.4034 69 Kabatiella caulivora 0.2728
2 Peronospora farinosa f.sp. betae 0.6907 36 Cladosporium cucumerinum 0.3898 70 Penicillium italicum 0.2693
3 Puccinia triticina 0.6779 37 Didymella applanata 0.3891 71 Colletotrichum circinans 0.267
4 Ustilago zeae 0.6775 38 Didymella bryoniae 0.3885 72 Coniella diplodiella 0.2658
5 Mycovellosiella fulva 0.64 39 Lophodermium pinastri 0.376 73 Fusarium oxysporum f.sp. melonis 0.265
6 Puccinia allii 0.6355 40 Puccinia carthami 0.376 74 Mycosphaerella rabiei 0.264
7 Monilinia laxa 0.5831 41 Puccinia asparagi 0.367 75 Sporisorium cruentum 0.263
8 Gibberella zeae 0.5788 42 Plasmopara halstedii 0.3628 76 Physoderma alfalfae 0.2609
9 Peronospora destructor 0.5768 43 Rosellinia necatrix 0.3584 77 Peronospora manshurica 0.2596
10 Sphacelotheca reiliana 0.5487 44 Heterobasidion annosum 0.3501 78 Drepanopeziza ribis 0.2594
11 Alternaria brassicicola 0.5388 45 Phoma foveata 0.3496 79 Pyrenopeziza brassicae 0.2587
12 Sclerotium cepivorum 0.5332 46 Mycosphaerella pini 0.3474 80 Mycosphaerella berkeleyi 0.2563
13 Pleospora betae 0.5293 47 Uromyces ciceris-arietini 0.3471 81 Colletotrichum linicola 0.2556
14 Setosphaeria turcica 0.5255 48 Puccinia purpurea 0.3371 82 Phytophthora fragariae var. rubi 0.2526
15 Monilinia fructigena 0.5247 49 Podosphaera macularis 0.3337 83 Monilinia fructicola 0.2522
16 Pseudoperonospora cubensis 0.5159 50 Fusarium oxysporum f.sp. cucumerinum 0.3275 84 Myrothecium roridum 0.2503
17 Podosphaera mors-uvae 0.5108 51 Blumeria graminis 0.3268 85 Penicillium digitatum 0.2424
18 Puccinia sorghi 0.508 52 Colletotrichum orbiculare 0.3243 86 Septoria cannabis 0.2413
19 Venturia inaequalis 0.5009 53 Fusarium oxysporum f.sp. vasinfectum 0.3242 87 Melampsora medusae 0.2401
20 Pseudocercosporella herpotrichoides 0.4991 54 Elsinoe veneta 0.3241 88 Fusarium oxysporum f.sp. niveum 0.2397
21 Venturia carpophila 0.4854 55 Didymella rabiei 0.317 89 Venturia cerasi 0.2388
22 Peronospora farinosa 0.4841 56 Fusarium oxysporum f.sp. lini 0.3121 90 Alternaria longipes 0.2385
23 Chalara elegans 0.474 57 Guignardia bidwellii 0.3118 91 Spilocaea oleaginea 0.2379
24 Botrytis aclada 0.47 58 Stemphylium sarciniforme 0.3103 92 Ustilago crameri 0.2369
25 Botrytis tulipae 0.4531 59 Phytophthora capsici 0.308 93 Botrytis fabae 0.2333
26 Diaporthe citri 0.4498 60 Cronartium ribicola 0.3053 94 Puccinia hordei 0.2309
27 Nectria galligena 0.4384 61 Didymella lycopersici 0.3024 95 Phaeosphaeria avenaria f.sp. avenaria 0.2212
28 Phoma medicaginis var. medicaginis 0.4344 62 Phytophthora fragariae 0.2927 96 Verticillium albo-atrum 0.2204
29 Leptosphaeria coniothyrium 0.4322 63 Cronartium flaccidum 0.2899 97 Cochliobolus heterostrophus 0.2193
30 Pseudoperonospora humuli 0.4295 64 Gymnosporangium fuscum 0.2878 98 Aspergillus niger 0.2179
31 Podosphaera pannosa 0.4239 65 Phaeolus schweinitzii 0.2794 99 Nattrassia mangiferae 0.2158
32 Alternaria porri 0.4146 66 Alternaria citri 0.2792 100 Alternaria dianthicola 0.2156
33 Urocystis cepulae 0.4059 67 Helminthosporium solani 0.2788 101 Blumeriella jaapii 0.2143
34 Microdochium panattonianum 0.4035 68 Ceratocystis ulmi 0.2775 102 Alternaria radicina 0.2124
CRC10001 Final Report Page 169 of
172
Table 51 (continued).
Rank Species Name Risk Index Rank Species Name Risk Index Rank Species Name Risk Index
103 Chrysomyxa abietis 0.2108 137 Phoma tracheiphila 0.1455 171 Bipolaris sacchari 0.1043
104 Elsinoe fawcettii 0.2077 138 Didymella ligulicola 0.1423 172 Diaporthe eres 0.1037
105 Entyloma dahliae 0.2071 139 Ophiostoma piceae 0.1418 173 Rhabdocline pseudotsugae 0.1033
106 Mycosphaerella pyri 0.2034 140 Monilochaetes infuscans 0.1416 174 Mycosphaerella arachidis 0.1018
107 Ramularia onobrychidis 0.2027 141 Polyscytalum pustulans 0.138 175 Peronospora rubi 0.1007
108 Cryphonectria parasitica 0.1999 142 Diaporthe helianthi 0.137 176 Cochliobolus carbonum 0.0995
109 Peronospora viciae 0.1988 143 Pseudoperonospora cannabina 0.1367 177 Alternaria alternata 0.0966
110 Phaeoisariopsis griseola 0.1906 144 Nectria cinnabarina 0.1351 178 Peronospora farinosa f.sp. chenopodii 0.0963
111 Glomerella tucumanensis 0.1903 145 Fomes fomentarius 0.135 179 Passalora sojina 0.0937
112 Ceratocystis paradoxa 0.1901 146 Rhizina undulata 0.1338 180 Ganoderma boninense 0.0918
113 Sclerospora graminicola 0.1868 147 Physoderma maydis 0.1329 181 Guignardia citricarpa 0.088
114 Gremmeniella abietina 0.1851 148 Ceratocystis fimbriata 0.1312 182 Gibberella acuminata 0.0858
115 Gloeotinia granigena 0.1844 149 Didymella fabae 0.1304 183 Hypoxylon mammatum 0.0857
116 Phaeocryptopus gaeumannii 0.1804 150 Glomerella graminicola 0.1293 184 Cronartium quercuum 0.0848
117 Botrytis anthophila 0.1762 151 Mycocentrospora cladosporioides 0.1291 185 Paecilomyces lilacinus 0.0824
118 Neotyphodium coenophialum 0.1746 152 Phytophthora palmivora 0.1288 186 Didymascella thujina 0.0815
119 Lachnella willkommii 0.1706 153 Uromyces transversalis 0.1283 187 Septoria glycines 0.0815
120 Armillaria mellea 0.1687 154 Monosporascus cannonballus 0.1223 188 Fusarium proliferatum 0.0809
121 Alternaria japonica 0.1638 155 Pythium graminicola 0.118 189 Phomopsis longicolla 0.0807
122 Alternaria helianthi 0.1624 156 Phytophthora porri 0.1165 190 Phomopsis asparagi 0.0806
123 Synchytrium endobioticum 0.1551 157 Gnomonia comari 0.1163 191 Curvularia 0.0803
124 Erysiphe orontii 0.1549 158 Lasiodiplodia theobromae 0.1163 192 Phomopsis juniperivora 0.0796
125 Meria laricis 0.1545 159 Alternaria sesami 0.1157 193 Mycosphaerella cruenta 0.0788
126 Cochliobolus lunatus 0.1533 160 Erynia neoaphidis 0.1134 194 Phytophthora cambivora 0.0761
127 Phytophthora sojae 0.1531 161 Alternaria triticina 0.112 195 Cercospora nicotianae 0.0751
128 Colletotrichum musae 0.1527 162 Fomitopsis pinicola 0.1084 196 Tilletia barclayana 0.0751
129 Diaporthe phaseolorum var. sojae 0.1521 163 Pythium vexans 0.1083 197 Fusarium oxysporum f.sp. phaseoli 0.0748
130 Fusarium oxysporum f.sp. lentis 0.1508 164 Olpidium brassicae 0.1073 198 Apiognomonia erythrostoma 0.0741
131 Pythium aphanidermatum 0.1502 165 Armillaria ostoyae 0.107 199 Pythium arrhenomanes 0.0734
132 Physoderma leproides 0.1476 166 Cryptodiaporthe populea 0.107 200 Tilletia indica 0.073
133 Fusarium oxysporum f.sp. conglutinans 0.1471 167 Ascochyta gossypii 0.1062 201 Pythium deliense 0.072
134 Phialophora cinerescens 0.1468 168 Lecanicillium lecanii 0.1058 202 Gymnosporangium asiaticum 0.0713
135 Botryotinia squamosa 0.1461 169 Rhizoctonia tuliparum 0.1057 203 Diaporthe phaseolorum var. caulivora 0.0703
136 Gibberella intricans 0.1456 170 Sclerotinia borealis 0.1048 204 Stenocarpella maydis 0.0694

CRC10001 Final Report Page 170 of
172

Table 52. Top 100 risk list of insect pests for the USA generated from a SOM analysis.
rank Insect pest species risk index p/a rank Insect pest species risk index p/a rank Insect pest species risk index p/a
1 Icerya purchasi 0.9839 p 35 Heliothrips haemorrhoidalis 0.7882 p 69 Thrips simplex 0.609 p
2 Saissetia oleae 0.9727 p 36 Parlatoria ziziphi 0.7847 p 70 Spoladea recurvalis 0.6056 p
3 Planococcus citri 0.9702 p 37 Schizaphis graminum 0.7709 p 71 Cadra cautella 0.604 p
4 Myzus persicae 0.963 p 38 Ceratitis capitata 0.7705 p 72 Oryzaephilus surinamensis 0.5997 p
5 Coccus hesperidum 0.9603 p 39 Sitobion avenae 0.7579 p 73 Helicoverpa zea 0.5966 p
6 Aphis spiraecola 0.9518 p 40 Cydia pomonella 0.7568 p 74 Heliothis virescens 0.5959 p
7 Chrysomphalus dictyospermi 0.9418 p 41 Liriomyza trifolii 0.751 p 75 Dysmicoccus brevipes 0.5911 p
8 Lepidosaphes beckii 0.9388 p 42 Taylorilygus pallidulus 0.7476 p 76 Parthenolecanium persicae 0.5889 p
9 Plutella xylostella 0.9002 p 43 Aphis craccivora 0.7365 p 77 Parthenolecanium corni 0.5879 p
10 Bemisia tabaci 0.8976 p 44 Acanthoscelides obtectus 0.7303 p 78 Bemisia tabaci (B biotype) 0.5847 p
11 Brevicoryne brassicae 0.8962 p 45 Rhopalosiphum padi 0.7285 p 79 Metopolophium dirhodum 0.5845 p
12 Pseudococcus longispinus 0.8942 p 46 Gynaikothrips ficorum 0.7114 p 80 Dialeurodes citri 0.5777 p
13 Aphis gossypii 0.8889 p 47 Rhopalosiphum rufiabdominale 0.7089 p 81 Unaspis citri 0.5752 p
14 Eriosoma lanigerum 0.8854 p 48 Hyperomyzus lactucae 0.7046 p 82 Drosophila melanogaster 0.5743 p
15 Saissetia coffeae 0.8836 p 49 Toxoptera citricida 0.7011 p 83 Rhyzopertha dominica 0.5706 p
16 Phthorimaea operculella 0.8828 p 50 Pseudaulacaspis pentagona 0.6914 p 84 Pieris rapae 0.5705 p
17 Thrips tabaci 0.879 p 51 Diaspidiotus perniciosus 0.6896 p 85 Spodoptera exigua 0.5682 p
18 Rhopalosiphum maidis 0.8671 p 52 Etiella zinckenella 0.6867 p 86 Atherigona orientalis 0.568 p
19 Trichoplusia ni 0.863 p 53 Scolytus rugulosus 0.6839 p 87 Pantomorus cervinus 0.5669 p
20 Nezara viridula 0.8586 p 54 Peridroma saucia 0.6815 p 88 Elasmopalpus lignosellus 0.5629 p
21 Delia platura 0.8563 p 55 Mythimna unipuncta 0.6702 p 89 Spodoptera frugiperda 0.5627 p
22 Chrysomphalus aonidum 0.85 p 56 Hemiberlesia rapax 0.6701 p 90 Saccharicoccus sacchari 0.5567 p
23 Hemiberlesia lataniae 0.8394 p 57 Tribolium castaneum 0.6699 p 91 Parasaissetia nigra 0.5565 p
24 Phyllocnistis citrella 0.8285 p 58 Frankliniella schultzei 0.6693 p 92 Parlatoria oleae 0.5507 p
25 Aonidiella aurantii 0.8261 p 59 Frankliniella occidentalis 0.6494 p 93 Lipaphis erysimi 0.5494 p
26 Aspidiotus nerii 0.824 p 60 Orthezia insignis 0.6476 p 94 Aspidiotus destructor 0.546 p
27 Pectinophora gossypiella 0.8228 p 61 Lepidosaphes ulmi 0.6473 p 95 Lepidosaphes gloverii 0.5436 p
28 Toxoptera aurantii 0.8201 p 62 Ceroplastes floridensis 0.6387 p 96 Manduca sexta 0.5429 p
29 Agrotis ipsilon 0.8146 p 63 Viteus vitifoliae 0.6338 p 97 Ferrisia virgata 0.5247 p
30 Aleurothrixus floccosus 0.8132 p 64 Nipaecoccus nipae 0.6312 p 98 Pentalonia nigronervosa 0.5212 p
31 Macrosiphum euphorbiae 0.8122 p 65 Phoracantha semipunctata 0.6266 p 99 Diuraphis noxia 0.5181 p
32 Acyrthosiphon pisum 0.8038 p 66 Ceroplastes rusci 0.6197 p 100 Melanaphis sacchari 0.5134 p
33 Sitophilus zeamais 0.7973 p 67 Parlatoria pergandii 0.6192 p
34 Aphis fabae 0.7915 p 68 Liriomyza huidobrensis 0.6125 p

CRC10001 Final Report Page 172 of
172
Table 53. Comparison of SOM predictions of risk with species present in the NAPIS database.
Pest species SOM risk index State1 NAPIS2 SOM correct3Pest species SOM risk index State1 NAPIS2 SOM correct3
Pest species SOM risk index State1 NAPIS2 SOM correct3
Planococcus citri 0.8973 Florida established 1 Lymantria dispar 0.6634 Connecticut not found 0 Planococcus citri 0.3572 California found 0
Bemisia tabaci 0.8797 Florida found 1 Lymantria dispar 0.6634 Massachusetts not found 0 Rhagoletis completa 0.338 Arizona not found 1
Epilachna varivestis 0.8395 Arizona established 1 Lymantria dispar 0.6634 Michigan not found 0 Diaphorina citri 0.3283 Florida established 0
Epilachna varivestis 0.7984 New York established 1 Lymantria dispar 0.6634 New Jersey not found 0 Cylas formicarius 0.3246 Alabama established 0
Lymantria dispar 0.7953 California being eradicated 1 Lymantria dispar 0.6634 New York not found 0 Cylas formicarius 0.3246 Arkansas not found 1
Oulema melanopus 0.7754 Alabama established 1 Lymantria dispar 0.6634 Ohio not found 0 Cylas formicarius 0.3246 South Carolina not found 1
Oulema melanopus 0.7754 Georgia established 1 Oulema melanopus 0.6398 Maine established 1 Aphis glycines 0.3191 Colorado not found 1
Oulema melanopus 0.7754 Illinois established 1 Oulema melanopus 0.6398 Wisconsin established 1 Aphis glycines 0.3163 Maine established 0
Oulema melanopus 0.7754 Maryland established 1 Popillia japonica 0.6322 Wisconsin established 1 Aphis glycines 0.3163 Wisconsin established 0
Oulema melanopus 0.7754 Missouri established 1 Popillia japonica 0.6322 Maine not found 0 Aphis glycines 0.3118 Maryland established 0
Oulema melanopus 0.7754 North Carolina established 1 Popillia japonica 0.5805 California found 1 Aphis glycines 0.3118 North Carolina found 0
Oulema melanopus 0.7754 South Carolina established 1 Oulema melanopus 0.5719 Colorado established 1 Aphis glycines 0.3118 Tennessee not found 1
Oulema melanopus 0.7754 Tennessee established 1 Oulema melanopus 0.5719 Nebraska not found 0 Diuraphis noxia 0.3024 Arizona established 0
Oulema melanopus 0.7754 Virginia established 1 Oulema melanopus 0.5719 Minnesota established 1 Anthonomus grandis 0.2932 Maryland not found 1
Oulema melanopus 0.7479 California not found 0 Oulema melanopus 0.5719 New Hampshire established 1 Anthonomus grandis 0.2932 South Carolina not found 1
Popillia japonica 0.7434 Arkansas established 1 Oulema melanopus 0.5719 Utah established 1 Anthonomus grandis 0.2932 Virginia not found 1
Popillia japonica 0.7434 Mississippi established 1 Lymantria dispar 0.566 Maine not found 0 Popillia japonica 0.2859 Montana being eradicated 0
Popillia japonica 0.7434 Texas found 1 Lymantria dispar 0.561 Alabama not found 0 Popillia japonica 0.2859 South Dakota found 0
Popillia japonica 0.7434 Alabama established 1 Lymantria dispar 0.561 Arkansas not found 0 Popillia japonica 0.2859 North Dakota not found 1
Popillia japonica 0.7434 Georgia established 1 Lymantria dispar 0.561 Georgia not found 0 Popillia japonica 0.2859 Nevada not found 1
Popillia japonica 0.7434 Illinois established 1 Lymantria dispar 0.561 Missouri not found 0 Popillia japonica 0.2859 Wyoming not found 1
Popillia japonica 0.7434 Maryland established 1 Lymantria dispar 0.561 Mississippi not found 0 Popillia japonica 0.2859 Vermont established 0
Popillia japonica 0.7434 Missouri established 1 Lymantria dispar 0.561 Tennessee not found 0 Lymantria dispar 0.2731 Montana not found 1
Popillia japonica 0.7434 North Carolina established 1 Lymantria dispar 0.561 Texas not found 0 Lymantria dispar 0.2731 North Dakota not found 1
Popillia japonica 0.7434 South Carolina established 1 Lymantria dispar 0.561 Illinois not found 0 Lymantria dispar 0.2731 Nevada not found 1
Popillia japonica 0.7434 Tennessee established 1 Lymantria dispar 0.561 North Carolina not found 0 Lymantria dispar 0.2731 South Dakota not found 1
Popillia japonica 0.7434 Virginia established 1 Lymantria dispar 0.561 South Carolina not found 0 Lymantria dispar 0.2731 Wyoming not found 1
Oulema melanopus 0.7404 Connecticut established 1 Lymantria dispar 0.561 Virginia not found 0 Cerotoma trifurcata 0.2701 California being eradicated 0
Oulema melanopus 0.7404 Massachusetts established 1 Popillia japonica 0.5597 Oregon found 1 Rhyacionia buoliana 0.2552 Montana found 0
Oulema melanopus 0.7404 Michigan established 1 Popillia japonica 0.5597 Washington found 1 Rhyacionia buoliana 0.2552 Nevada found 0
Oulema melanopus 0.7404 New Jersey established 1 Epilachna varivestis 0.5504 Idaho not found 0 Diaprepes abbreviatus 0.2466 Florida found 0
Oulema melanopus 0.7404 New York established 1 Lymantria dispar 0.5461 Arizona not found 0 Pectinophora gossypiella 0.2225 North Carolina not found 1
Oulema melanopus 0.7404 Ohio established 1 Lymantria dispar 0.5461 Kansas not found 0 Pectinophora gossypiella 0.2225 Arkansas not found 1
Oulema melanopus 0.7404 Pennsylvania established 1 Lymantria dispar 0.5461 Oklahoma not found 0 Pectinophora gossypiella 0.2225 Louisiana not found 1
Popillia japonica 0.726 Connecticut established 1 Lymantria dispar 0.5461 Iowa not found 0 Anthonomus grandis 0.2155 Delaware not found 1
Popillia japonica 0.726 Massachusetts established 1 Lymantria dispar 0.5461 Indiana not found 0 Aphis glycines 0.2134 Vermont established 0
Popillia japonica 0.726 Michigan established 1 Lymantria dispar 0.5461 Kentucky not found 0 Agriotes lineatus 0.1941 Washington established 0
Popillia japonica 0.726 New Jersey established 1 Lymantria dispar 0.5461 West Virginia not found 0 Agriotes lineatus 0.1941 Oregon found 0
Popillia japonica 0.726 New York established 1 Popillia japonica 0.5354 Colorado being eradicated 1 Agriotes obscurus 0.1879 Washington established 0
Popillia japonica 0.726 Ohio established 1 Popillia japonica 0.5354 New Mexico being eradicated 1 Agriotes obscurus 0.1879 Oregon found 0
Popillia japonica 0.726 Pennsylvania established 1 Popillia japonica 0.5354 Utah being eradicated 1 Euproctis chrysorrhoea 0.1835 New Hampshire not found 1
Epilachna varivestis 0.723 Minnesota not found 0 Popillia japonica 0.5354 Minnesota established 1 Diuraphis noxia 0.1818 Maryland not found 1
Lymantria dispar 0.7214 Oregon being eradicated 1 Popillia japonica 0.5354 New Hampshire established 1 Lymantria monacha 0.1811 California not found 1
Lymantria dispar 0.7214 Washington being eradicated 1 Popillia japonica 0.5354 Rhode Island established 1 Homalodisca coagulata 0.1721 Arizona being eradicated 0
Oulema melanopus 0.7123 Arizona not found 0 Popillia japonica 0.5354 Nebraska found 1 Homalodisca coagulata 0.1721 Oklahoma found 0
Oulema melanopus 0.7123 Delaware established 1 Aphis craccivora 0.5294 Florida established 1 Homalodisca coagulata 0.1481 California established 0
Oulema melanopus 0.7123 Iowa established 1 Oulema melanopus 0.4893 Idaho established 0 Lymantria dispar 0.1456 Florida not found 1
Oulema melanopus 0.7123 Indiana established 1 Rhyacionia buoliana 0.4386 Indiana established 0 Operophtera brumata 0.1312 Massachusetts established 0
Oulema melanopus 0.7123 Kentucky established 1 Bemisia tabaci 0.4217 Texas not found 1 Operophtera brumata 0.1312 Connecticut found 0
Oulema melanopus 0.7123 West Virginia established 1 Oulema melanopus 0.416 North Dakota not found 1 Operophtera brumata 0.1312 New York not found 1
Oulema melanopus 0.7123 Kansas not found 0 Oulema melanopus 0.416 Montana established 0 Lymantria monacha 0.1245 Oregon not found 1
Popillia japonica 0.7046 Arizona not found 0 Oulema melanopus 0.416 Vermont established 0 Lymantria monacha 0.1245 Washington not found 1
Popillia japonica 0.7046 Oklahoma not found 0 Oulema melanopus 0.416 Wyoming established 0 Monochamus sutor 0.1239 California not found 1
Popillia japonica 0.7046 Delaware established 1 Lymantria dispar 0.4113 Colorado not found 1 Anthonomus grandis 0.1229 New Mexico being eradicated 0
Popillia japonica 0.7046 Iowa established 1 Lymantria dispar 0.4113 Utah not found 1 Pectinophora gossypiella 0.1133 New Mexico established 0
Popillia japonica 0.7046 Indiana established 1 Lymantria dispar 0.4113 Rhode Island not found 1 Spodoptera littoralis 0.1062 Florida not found 1
Popillia japonica 0.7046 Kentucky established 1 Popillia japonica 0.3946 Idaho not found 1 Acrolepiopsis assectella 0.1046 Oregon not found 1
Popillia japonica 0.7046 West Virginia established 1 Lymantria dispar 0.3792 Idaho eradicated 0 Tipula paludosa 0.1011 New York established 0
Popillia japonica 0.7046 Kansas found 1 Maconellicoccus hirsutus 0.3728 Florida established 0 Tipula paludosa 0.1011 Massachusetts not found 1
Phyllocnistis citrella 0.6899 Florida not found 0 Rhyacionia buoliana 0.3632 Idaho established 0 Tipula paludosa 0.1011 New Jersey not found 1
Ceratitis capitata 0.6656 Florida not found 0 Aphis glycines 0.3587 Oklahoma found 0 Tipula paludosa 0.1011 Ohio not found 1
Oulema melanopus 0.6641 Oregon established 1 Aphis glycines 0.3587 Indiana established 0 Tipula paludosa 0.093 Maine not found 1
Oulema melanopus 0.6641 Washington established 1 Aphis glycines 0.3587 Delaware found 0 Anoplophora glabripennis 0.092 Massachusetts being eradicated 0
CRC10001 Final Report Page 173 of
173
Table 53 (continued).
Pest species SOM risk index State1
NAPIS2
SOM correct3
Pest species SOM risk index State1
NAPIS2
SOM correct3
Pest species SOM risk index State1
NAPIS2
SOM correct3
Anoplophora glabripennis 0.092 Connecticut not found 1 Autographa gamma 0.0193 Nevada not found 1 Dendrolimus sibiricus 0.0071 Oregon not found 1
Anoplophora glabripennis 0.092 Michigan not found 1 Autographa gamma 0.0193 South Dakota not found 1 Dendrolimus sibiricus 0.0071 Washington not found 1
Anoplophora glabripennis 0.092 Ohio not found 1 Autographa gamma 0.0193 Vermont not found 1 Anoplophora glabripennis 0.0067 Montana not found 1
Anoplophora glabripennis 0.092 New Jersey not found 1 Autographa gamma 0.0193 Wyoming not found 1 Anoplophora glabripennis 0.0067 Nevada not found 1
Anoplophora glabripennis 0.092 New York not found 1 Ips typographus 0.0188 Montana not found 1 Anoplophora glabripennis 0.0067 Vermont not found 1
Anoplophora glabripennis 0.0884 Georgia not found 1 Ips typographus 0.0188 South Dakota not found 1 Pityogenes chalcographus 0.0067 Maine not found 1
Anoplophora glabripennis 0.0884 Mississippi not found 1 Ips typographus 0.0188 Vermont not found 1 Pityogenes chalcographus 0.0067 Wisconsin not found 1
Anoplophora glabripennis 0.0884 Tennessee not found 1 Autographa gamma 0.0184 Michigan not found 1 Epiphyas postvittana 0.0065 Idaho not found 1
Anoplophora glabripennis 0.0884 Texas not found 1 Ips typographus 0.0183 Connecticut not found 1 Monochamus sutor 0.0065 Maine not found 1
Anoplophora glabripennis 0.0884 Virginia not found 1 Ips typographus 0.0183 Massachusetts not found 1 Trogoderma granarium 0.0064 Oregon not found 1
Anoplophora glabripennis 0.0884 Illinois not found 1 Ips typographus 0.0183 Michigan not found 1 Trogoderma granarium 0.0064 Washington not found 1
Anoplophora glabripennis 0.0883 California not found 1 Ips typographus 0.0183 New York not found 1 Dendrolimus sibiricus 0.0061 Montana not found 1
Bactrocera cucurbitae 0.0879 Florida not found 1 Ips typographus 0.0183 Ohio not found 1 Dendrolimus sibiricus 0.0061 Nevada not found 1
Trogoderma granarium 0.0852 Florida not found 1 Ips typographus 0.0183 Pennsylvania not found 1 Dendrolimus sibiricus 0.0061 Vermont not found 1
Spodoptera litura 0.0785 Florida not found 1 Autographa gamma 0.0181 Maine not found 1 Dendrolimus sibiricus 0.0061 Wyoming not found 1
Agriotes lineatus 0.0747 Michigan not found 1 Autographa gamma 0.0181 Wisconsin not found 1 Lobesia botrana 0.0058 Nevada not found 1
Agriotes lineatus 0.0747 New Jersey not found 1 Lymantria monacha 0.0173 Michigan not found 1 Lobesia botrana 0.0058 Wyoming not found 1
Agriotes lineatus 0.0747 New York not found 1 Acrolepiopsis assectella 0.0146 Massachusetts not found 1 Monochamus saltuarius 0.0058 Pennsylvania not found 1
Agriotes obscurus 0.0736 Michigan not found 1 Acrolepiopsis assectella 0.0146 Michigan not found 1 Ips typographus 0.0054 Florida not found 1
Agriotes obscurus 0.0736 New Jersey not found 1 Acrolepiopsis assectella 0.0146 New York not found 1 Eupoecilia ambiguella 0.0053 Nevada not found 1
Agriotes obscurus 0.0736 New York not found 1 Acrolepiopsis assectella 0.0146 Ohio not found 1 Eupoecilia ambiguella 0.0053 Wyoming not found 1
Epiphyas postvittana 0.0691 Florida not found 1 Ips sexdentatus 0.0139 Connecticut not found 1 Monochamus sutor 0.0052 South Dakota not found 1
Scirtothrips dorsalis 0.0688 Florida established 0 Ips sexdentatus 0.0139 Massachusetts not found 1 Agriotes obscurus 0.0049 Nevada not found 1
Anoplophora glabripennis 0.0687 Oregon not found 1 Ips sexdentatus 0.0139 Michigan not found 1 Agriotes lineatus 0.0049 Nevada not found 1
Anoplophora glabripennis 0.0687 Washington not found 1 Ips sexdentatus 0.0139 Ohio not found 1 Ips typographus 0.0049 Colorado not found 1
Ceratitis capitata 0.0684 California being eradicated 0 Trogoderma granarium 0.0122 California not found 1 Ips typographus 0.0049 Minnesota not found 1
Anoplophora glabripennis 0.0628 Delaware not found 1 Acrolepiopsis assectella 0.012 Maine not found 1 Ips typographus 0.0049 New Hampshire not found 1
Anoplophora glabripennis 0.0628 Indiana not found 1 Acrolepiopsis assectella 0.012 Wisconsin not found 1 Ips typographus 0.0049 Rhode Island not found 1
Anoplophora glabripennis 0.0628 Oklahoma not found 1 Diaprepes abbreviatus 0.0119 California being eradicated 0 Ips typographus 0.0049 Utah not found 1
Anoplophora glabripennis 0.0628 Wisconsin not found 1 Epiphyas postvittana 0.0119 California eradicated 0 Acrolepiopsis assectella 0.0048 Nevada not found 1
Operophtera brumata 0.0619 Rhode Island established 0 Ips sexdentatus 0.0119 Maine not found 1 Acrolepiopsis assectella 0.0048 Vermont not found 1
Agriotes lineatus 0.0609 Maine not found 1 Ips sexdentatus 0.0119 Wisconsin not found 1 Ceratitis capitata 0.0048 Arizona not found 1
Agriotes obscurus 0.0605 Maine not found 1 Monochamus sutor 0.0118 Connecticut not found 1 Maconellicoccus hirsutus 0.0047 Arizona not found 1
Anoplophora chinensis 0.0589 Washington eradicated 0 Monochamus sutor 0.0118 Massachusetts not found 1 Anoplophora chinensis 0.0036 Nevada not found 1
Anoplophora chinensis 0.056 California not found 1 Monochamus sutor 0.0118 Michigan not found 1 Anoplophora chinensis 0.0036 Vermont not found 1
Anoplophora glabripennis 0.0545 Maine not found 1 Monochamus sutor 0.0118 Pennsylvania not found 1 Autographa gamma 0.0036 Colorado not found 1
Anoplophora glabripennis 0.0545 West Virginia not found 1 Anoplophora chinensis 0.0111 Colorado not found 1 Autographa gamma 0.0036 Utah not found 1
Anoplophora chinensis 0.0454 Mississippi not found 1 Anoplophora chinensis 0.0111 New Hampshire not found 1 Ips sexdentatus 0.0029 Montana not found 1
Anoplophora chinensis 0.0454 Texas not found 1 Anoplophora chinensis 0.0111 Utah not found 1 Ips sexdentatus 0.0029 Vermont not found 1
Anoplophora chinensis 0.0454 Georgia not found 1 Pityogenes chalcographus 0.01 Connecticut not found 1 Eupoecilia ambiguella 0.0028 Colorado not found 1
Homalodisca coagulata 0.0452 New Mexico not found 1 Pityogenes chalcographus 0.01 Massachusetts not found 1 Eupoecilia ambiguella 0.0028 New Mexico not found 1
Anoplophora chinensis 0.0434 Michigan not found 1 Pityogenes chalcographus 0.01 Michigan not found 1 Dendrolimus sibiricus 0.0027 Maine not found 1
Anoplophora chinensis 0.0434 New York not found 1 Pityogenes chalcographus 0.01 New Jersey not found 1 Lymantria monacha 0.0024 Utah not found 1
Diaprepes abbreviatus 0.0399 Texas establised 0 Pityogenes chalcographus 0.01 New York not found 1 Dendrolimus sibiricus 0.0021 California not found 1
Phyllocnistis citrella 0.037 California established 0 Pityogenes chalcographus 0.01 Ohio not found 1 Lobesia botrana 0.002 Colorado not found 1
Autographa gamma 0.0342 Idaho not found 1 Pityogenes chalcographus 0.01 Pennsylvania not found 1 Lobesia botrana 0.002 New Mexico not found 1
Anoplophora chinensis 0.0317 Maine not found 1 Ceratitis capitata 0.009 Alabama not found 1 Ceratitis capitata 0.0018 New Mexico not found 1
Anoplophora chinensis 0.0317 Wisconsin not found 1 Ceratitis capitata 0.009 Georgia not found 1 Aeolesthes sarta 0.0016 Vermont not found 1
Anoplophora chinensis 0.0287 Delaware not found 1 Ceratitis capitata 0.009 Louisiana not found 1 Autographa gamma 0.0016 Georgia not found 1
Anoplophora chinensis 0.0287 Indiana not found 1 Ceratitis capitata 0.009 Mississippi not found 1 Autographa gamma 0.0016 Maryland not found 1
Anoplophora chinensis 0.0287 West Virginia not found 1 Ceratitis capitata 0.009 North Carolina not found 1 Autographa gamma 0.0016 Virginia not found 1
Anoplophora glabripennis 0.0238 Colorado not found 1 Ceratitis capitata 0.009 South Carolina not found 1 Dendroctonus micans 0.0016 Mississippi not found 1
Anoplophora glabripennis 0.0238 Minnesota not found 1 Ceratitis capitata 0.009 Texas not found 1 Epiphyas postvittana 0.0016 Maine not found 1
Anoplophora glabripennis 0.0238 New Hampshire not found 1 Maconellicoccus hirsutus 0.0089 Alabama not found 1 Epiphyas postvittana 0.0016 Wisconsin not found 1
Anoplophora glabripennis 0.0238 Utah not found 1 Maconellicoccus hirsutus 0.0089 Georgia not found 1 Pityogenes chalcographus 0.0016 Montana not found 1
Tipula paludosa 0.0226 New Hampshire not found 1 Maconellicoccus hirsutus 0.0089 Mississippi not found 1 Pityogenes chalcographus 0.0016 Vermont not found 1
Ips typographus 0.0217 Maine not found 1 Maconellicoccus hirsutus 0.0089 North Carolina not found 1 Ips typographus 0.0016 Arizona not found 1
Ips typographus 0.0217 Wisconsin not found 1 Maconellicoccus hirsutus 0.0089 South Carolina not found 1 Ips typographus 0.0016 Delaware not found 1
Maconellicoccus hirsutus 0.0212 New York being eradicated 0 Maconellicoccus hirsutus 0.0089 Tennessee not found 1 Ips typographus 0.0016 Indiana not found 1
Maconellicoccus hirsutus 0.0212 New Jersey not found 1 Crocidosema aporema 0.0084 Wisconsin not found 1 Ips typographus 0.0016 Kentucky not found 1
Crocidosema aporema 0.0209 Delaware not found 1 Ips sexdentatus 0.008 Florida not found 1 Ips typographus 0.0016 West Virginia not found 1
Diaprepes abbreviatus 0.0209 Arizona not found 1 Epiphyas postvittana 0.0077 Oregon not found 1 Autographa gamma 0.0015 Delaware not found 1
Autographa gamma 0.0193 North Dakota not found 1 Epiphyas postvittana 0.0077 Washington not found 1 Autographa gamma 0.0015 Oklahoma not found 1

CRC10001 Final Report Page 174 of
174
Table 53 (continued).
Pest species SOM risk index State1
NAPIS2
SOM correct3
Pest species SOM risk index State1
NAPIS2
SOM correct3
Pest species SOM risk index State1
NAPIS2
SOM correct3
Epiphyas postvittana 0.0015 Montana not found 1 Ips sexdentatus 0.0009 Delaware not found 1 Epiphyas postvittana 0.0001 Missouri not found 1
Epiphyas postvittana 0.0015 North Dakota not found 1 Ips sexdentatus 0.0009 Indiana not found 1 Epiphyas postvittana 0.0001 North Carolina not found 1
Epiphyas postvittana 0.0015 Nevada not found 1 Ips sexdentatus 0.0009 Kentucky not found 1 Epiphyas postvittana 0.0001 Oklahoma not found 1
Epiphyas postvittana 0.0015 South Dakota not found 1 Ips sexdentatus 0.0009 West Virginia not found 1 Epiphyas postvittana 0.0001 South Carolina not found 1
Epiphyas postvittana 0.0015 Vermont not found 1 Lobesia botrana 0.0009 Arkansas not found 1 Epiphyas postvittana 0.0001 Texas not found 1
Epiphyas postvittana 0.0015 Wyoming not found 1 Lobesia botrana 0.0009 Maryland not found 1 Epiphyas postvittana 0.0001 Virginia not found 1
Hylobius abietis 0.0015 Tennessee not found 1 Pityogenes chalcographus 0.0009 Arkansas not found 1 Epiphyas postvittana 0.0001 West Virginia not found 1
Lymantria monacha 0.0015 Texas not found 1 Pityogenes chalcographus 0.0009 Georgia not found 1 Trogoderma granarium 0.0001 Alabama not found 1
Trogoderma granarium 0.0015 Nevada not found 1 Pityogenes chalcographus 0.0009 Illinois not found 1 Trogoderma granarium 0.0001 Arkansas not found 1
Trogoderma granarium 0.0015 South Dakota not found 1 Pityogenes chalcographus 0.0009 Maryland not found 1 Trogoderma granarium 0.0001 Arizona not found 1
Trogoderma granarium 0.0015 Wyoming not found 1 Pityogenes chalcographus 0.0009 Missouri not found 1 Trogoderma granarium 0.0001 Colorado not found 1
Ips typographus 0.0015 Alabama not found 1 Pityogenes chalcographus 0.0009 North Carolina not found 1 Trogoderma granarium 0.0001 Georgia not found 1
Ips typographus 0.0015 Arkansas not found 1 Pityogenes chalcographus 0.0009 South Carolina not found 1 Trogoderma granarium 0.0001 Iowa not found 1
Ips typographus 0.0015 Georgia not found 1 Pityogenes chalcographus 0.0009 Texas not found 1 Trogoderma granarium 0.0001 Illinois not found 1
Ips typographus 0.0015 Illinois not found 1 Ceroplastes japonicus 0.0008 Oregon not found 1 Trogoderma granarium 0.0001 Kansas not found 1
Ips typographus 0.0015 Louisiana not found 1 Lobesia botrana 0.0008 Kentucky not found 1 Trogoderma granarium 0.0001 Louisiana not found 1
Ips typographus 0.0015 Maryland not found 1 Lobesia botrana 0.0008 West Virginia not found 1 Trogoderma granarium 0.0001 Minnesota not found 1
Ips typographus 0.0015 Missouri not found 1 Pityogenes chalcographus 0.0007 Minnesota not found 1 Trogoderma granarium 0.0001 Missouri not found 1
Ips typographus 0.0015 Mississippi not found 1 Pityogenes chalcographus 0.0007 New Hampshire not found 1 Trogoderma granarium 0.0001 North Carolina not found 1
Ips typographus 0.0015 North Carolina not found 1 Pityogenes chalcographus 0.0007 Rhode Island not found 1 Trogoderma granarium 0.0001 Nebraska not found 1
Ips typographus 0.0015 South Carolina not found 1 Pityogenes chalcographus 0.0007 Utah not found 1 Trogoderma granarium 0.0001 New Mexico not found 1
Ips typographus 0.0015 Tennessee not found 1 Monochamus sutor 0.0006 Colorado not found 1 Trogoderma granarium 0.0001 Oklahoma not found 1
Ips typographus 0.0015 Texas not found 1 Monochamus sutor 0.0006 New Hampshire not found 1 Trogoderma granarium 0.0001 South Carolina not found 1
Eupoecilia ambiguella 0.0014 Missouri not found 1 Pityogenes chalcographus 0.0006 Delaware not found 1 Trogoderma granarium 0.0001 Texas not found 1
Eupoecilia ambiguella 0.0014 West Virginia not found 1 Pityogenes chalcographus 0.0006 Indiana not found 1 Trogoderma granarium 0.0001 West Virginia not found 1
Maruca vitrata 0.0013 Maine not found 1 Pityogenes chalcographus 0.0006 Kentucky not found 1 Unaspis yanonensis 0.0001 Oregon not found 1
Maruca vitrata 0.0013 Wisconsin not found 1 Pityogenes chalcographus 0.0006 West Virginia not found 1 Xylotrechus quadripes 0.0001 Idaho not found 1
Acrolepiopsis assectella 0.0012 Georgia not found 1 Trogoderma granarium 0.0006 Idaho not found 1 Bactrocera cucurbitae 0 California being eradicated 0
Acrolepiopsis assectella 0.0012 Illinois not found 1 Xylotrechus quadripes 0.0006 Nevada not found 1 Diaphorina citri 0 Louisiana established 0
Acrolepiopsis assectella 0.0012 Tennessee not found 1 Xylotrechus quadripes 0.0006 Vermont not found 1 Diaphorina citri 0 Texas established 0
Ips sexdentatus 0.0012 Minnesota not found 1 Epiphyas postvittana 0.0005 Colorado not found 1 Cryptophlebia leucotreta 0 California found 0
Ips sexdentatus 0.0012 New Hampshire not found 1 Epiphyas postvittana 0.0005 Minnesota not found 1 Diaphorina citri 0 California found 0
Ips sexdentatus 0.0012 Rhode Island not found 1 Epiphyas postvittana 0.0005 Nebraska not found 1 Diaphorina citri 0 Georgia found 0
Ips sexdentatus 0.0012 Utah not found 1 Epiphyas postvittana 0.0005 New Hampshire not found 1 Diaphorina citri 0 South Carolina found 0
Maconellicoccus hirsutus 0.0012 Colorado not found 1 Epiphyas postvittana 0.0005 New Mexico not found 1 Aeolesthes sarta 0 Ohio not found 1
Trogoderma granarium 0.0011 Connecticut being eradicated 0 Epiphyas postvittana 0.0005 Rhode Island not found 1 Anoplophora malasiaca 0 Delaware not found 1
Epiphyas postvittana 0.0011 Connecticut not found 1 Epiphyas postvittana 0.0005 Utah not found 1 Anoplophora malasiaca 0 Mississippi not found 1
Epiphyas postvittana 0.0011 Massachusetts not found 1 Monochamus saltuarius 0.0005 Mississippi not found 1 Anoplophora malasiaca 0 New Hampshire not found 1
Epiphyas postvittana 0.0011 Michigan not found 1 Monochamus saltuarius 0.0004 Oklahoma not found 1 Anoplophora malasiaca 0 Nevada not found 1
Epiphyas postvittana 0.0011 New Jersey not found 1 Ceroplastes destructor 0.0003 Florida not found 1 Anoplophora malasiaca 0 New York not found 1
Epiphyas postvittana 0.0011 Ohio not found 1 Dendrolimus sibiricus 0.0003 Connecticut not found 1 Anoplophora malasiaca 0 Ohio not found 1
Epiphyas postvittana 0.0011 Pennsylvania not found 1 Dendrolimus sibiricus 0.0003 Massachusetts not found 1 Anoplophora malasiaca 0 Utah not found 1
Ips sexdentatus 0.0011 Alabama not found 1 Dendrolimus sibiricus 0.0003 Michigan not found 1 Anoplophora malasiaca 0 Vermont not found 1
Ips sexdentatus 0.0011 Arkansas not found 1 Maruca vitrata 0.0003 Illinois not found 1 Anoplophora malasiaca 0 Wisconsin not found 1
Ips sexdentatus 0.0011 Georgia not found 1 Maruca vitrata 0.0003 Maryland not found 1 Bactrocera cucurbitae 0 Alabama not found 1
Ips sexdentatus 0.0011 Illinois not found 1 Maruca vitrata 0.0003 Mississippi not found 1 Bactrocera cucurbitae 0 Arizona not found 1
Ips sexdentatus 0.0011 Maryland not found 1 Maruca vitrata 0.0003 North Carolina not found 1 Bactrocera cucurbitae 0 Georgia not found 1
Ips sexdentatus 0.0011 Missouri not found 1 Maruca vitrata 0.0003 Tennessee not found 1 Bactrocera cucurbitae 0 Louisiana not found 1
Ips sexdentatus 0.0011 Mississippi not found 1 Maruca vitrata 0.0002 Delaware not found 1 Bactrocera cucurbitae 0 North Carolina not found 1
Ips sexdentatus 0.0011 North Carolina not found 1 Spodoptera littoralis 0.0002 South Dakota not found 1 Bactrocera cucurbitae 0 South Carolina not found 1
Ips sexdentatus 0.0011 South Carolina not found 1 Spodoptera littoralis 0.0002 Wyoming not found 1 Bactrocera cucurbitae 0 Texas not found 1
Ips sexdentatus 0.0011 Tennessee not found 1 Spodoptera litura 0.0002 New Mexico not found 1 Ceroplastes destructor 0 Alabama not found 1
Ips sexdentatus 0.0011 Texas not found 1 Epiphyas postvittana 0.0001 Alabama not found 1 Ceroplastes destructor 0 Arizona not found 1
Lymantria monacha 0.0011 West Virginia not found 1 Epiphyas postvittana 0.0001 Arkansas not found 1 Ceroplastes destructor 0 Louisiana not found 1
Trogoderma granarium 0.0011 Michigan not found 1 Epiphyas postvittana 0.0001 Arizona not found 1 Ceroplastes destructor 0 Oregon not found 1
Trogoderma granarium 0.0011 Ohio not found 1 Epiphyas postvittana 0.0001 Delaware not found 1 Ceroplastes destructor 0 Texas not found 1
Acrolepiopsis assectella 0.001 West Virginia not found 1 Epiphyas postvittana 0.0001 Georgia not found 1 Ceroplastes japonicus 0 Arizona not found 1
Monochamus sutor 0.001 Mississippi not found 1 Epiphyas postvittana 0.0001 Iowa not found 1 Ceroplastes japonicus 0 Texas not found 1
Dendrolimus sibiricus 0.0009 Colorado not found 1 Epiphyas postvittana 0.0001 Illinois not found 1 Chilo suppressalis 0 Georgia not found 1
Dendrolimus sibiricus 0.0009 New Hampshire not found 1 Epiphyas postvittana 0.0001 Indiana not found 1 Chilo suppressalis 0 Mississippi not found 1
Dendrolimus sibiricus 0.0009 Rhode Island not found 1 Epiphyas postvittana 0.0001 Kansas not found 1 Cryptophlebia leucotreta 0 Alabama not found 1
Dendrolimus sibiricus 0.0009 Utah not found 1 Epiphyas postvittana 0.0001 Kentucky not found 1 Cryptophlebia leucotreta 0 Arkansas not found 1
Ips sexdentatus 0.0009 Arizona not found 1 Epiphyas postvittana 0.0001 Maryland not found 1 Cryptophlebia leucotreta 0 Colorado not found 1

CRC10001 Final Report Page 175 of
175
Table 53 (continued).
1 The state list in which the SOM risk index applies to 2 The record of that species in that state as recorded in NAPIS 3 Whether the SOM risk index matches that of NAPIS (assuming a SOM risk index above 0.5 predicts presence and below predicts absence)
Pest species SOM risk index State1 NAPIS2 SOM correct3Pest species SOM risk index State1 NAPIS2 SOM correct3
Pest species SOM risk index State1 NAPIS2 SOM correct3
Cryptophlebia leucotreta 0 Delaware not found 1 Monochamus alternatus 0 Maine not found 1 Spodoptera littoralis 0 Mississippi not found 1
Cryptophlebia leucotreta 0 Georgia not found 1 Monochamus alternatus 0 Michigan not found 1 Spodoptera littoralis 0 North Carolina not found 1
Cryptophlebia leucotreta 0 Iowa not found 1 Monochamus alternatus 0 Mississippi not found 1 Spodoptera littoralis 0 New Jersey not found 1
Cryptophlebia leucotreta 0 Idaho not found 1 Monochamus alternatus 0 Montana not found 1 Spodoptera littoralis 0 Tennessee not found 1
Cryptophlebia leucotreta 0 Missouri not found 1 Monochamus alternatus 0 North Dakota not found 1 Spodoptera littoralis 0 Utah not found 1
Cryptophlebia leucotreta 0 Mississippi not found 1 Monochamus alternatus 0 New Hampshire not found 1 Spodoptera littoralis 0 Virginia not found 1
Cryptophlebia leucotreta 0 North Carolina not found 1 Monochamus alternatus 0 New Jersey not found 1 Spodoptera litura 0 Alabama not found 1
Cryptophlebia leucotreta 0 New Mexico not found 1 Monochamus alternatus 0 New York not found 1 Spodoptera litura 0 Georgia not found 1
Cryptophlebia leucotreta 0 Nevada not found 1 Monochamus alternatus 0 Ohio not found 1 Spodoptera litura 0 Maryland not found 1
Cryptophlebia leucotreta 0 Oklahoma not found 1 Monochamus alternatus 0 Oklahoma not found 1 Spodoptera litura 0 North Carolina not found 1
Cryptophlebia leucotreta 0 South Carolina not found 1 Monochamus alternatus 0 Pennsylvania not found 1 Spodoptera litura 0 Oklahoma not found 1
Cryptophlebia leucotreta 0 Tennessee not found 1 Monochamus alternatus 0 Rhode Island not found 1 Spodoptera litura 0 Tennessee not found 1
Cryptophlebia leucotreta 0 Utah not found 1 Monochamus alternatus 0 Texas not found 1 Spodoptera litura 0 Virginia not found 1
Cryptophlebia leucotreta 0 Vermont not found 1 Monochamus alternatus 0 Utah not found 1 Unaspis yanonensis 0 Alabama not found 1
Cryptophlebia leucotreta 0 Wyoming not found 1 Monochamus alternatus 0 Virginia not found 1 Unaspis yanonensis 0 Georgia not found 1
Dendrolimus sibiricus 0 North Carolina not found 1 Monochamus alternatus 0 Vermont not found 1 Xylotrechus quadripes 0 Connecticut not found 1
Dendrolimus sibiricus 0 South Carolina not found 1 Monochamus alternatus 0 West Virginia not found 1 Xylotrechus quadripes 0 Florida not found 1
Dendrolimus sibiricus 0 Tennessee not found 1 Monochamus alternatus 0 Wisconsin not found 1 Xylotrechus quadripes 0 Illinois not found 1
Dendrolimus sibiricus 0 Virginia not found 1 Pityogenes chalcographus 0 Florida not found 1 Xylotrechus quadripes 0 Indiana not found 1
Diaphorina citri 0 Arizona not found 1 Planococcus lilacinus 0 Oregon not found 1 Xylotrechus quadripes 0 Massachusetts not found 1
Hypothenemus hampei 0 South Carolina not found 1 Scirtothrips dorsalis 0 Mississippi not found 1 Xylotrechus quadripes 0 Michigan not found 1
Monochamus alternatus 0 Arkansas not found 1 Scirtothrips dorsalis 0 South Carolina not found 1 Xylotrechus quadripes 0 Missouri not found 1
Monochamus alternatus 0 California not found 1 Scirtothrips dorsalis 0 Tennessee not found 1 Xylotrechus quadripes 0 New York not found 1
Monochamus alternatus 0 Connecticut not found 1 Scirtothrips dorsalis 0 Texas not found 1 Xylotrechus quadripes 0 Ohio not found 1
Monochamus alternatus 0 Delaware not found 1 Spodoptera littoralis 0 Alabama not found 1 Xylotrechus quadripes 0 Oklahoma not found 1
Monochamus alternatus 0 Florida not found 1 Spodoptera littoralis 0 Arkansas not found 1 Xylotrechus quadripes 0 Rhode Island not found 1
Monochamus alternatus 0 Georgia not found 1 Spodoptera littoralis 0 Colorado not found 1 Xylotrechus quadripes 0 South Carolina not found 1
Monochamus alternatus 0 Illinois not found 1 Spodoptera littoralis 0 Delaware not found 1 Xylotrechus quadripes 0 Texas not found 1
Monochamus alternatus 0 Indiana not found 1 Spodoptera littoralis 0 Georgia not found 1 Xylotrechus quadripes 0 Wisconsin not found 1
Monochamus alternatus 0 Massachusetts not found 1 Spodoptera littoralis 0 Maryland not found 1

9. References
ABS (2008) International Merchandise Imports, Australia, Table 2. Australian Bureau of
Statistics. Publication number 5439.0. http://www.abs.gov.au/AUSSTATS/[email protected]/DetailsPage/5439.0Sep%202008?OpenDocument
Asner, G. P., Hughes, R. F., Vitousek, P. M., Knapp, D. E., Kennedy-Bowdoin, T., Boardman, J., Martin, R. E., Eastwood, M. & Green, R. O. (2008) Invasive plants transform the three-dimensional structure of rain forests. Proceedings of the National Academy of Sciences of the United States of America, 105, 4519-4523.
Biosecurity Australia (2001) Guidelines for Import Risk Analysis, Draft Report, September, Department of Agriculture, Fisheries and Forestry, Canberra, Australia.
Blackburn, T. M., Cassey, P., Duncan, R. P., Evans, K. L. & Gaston, K. J. (2004) Avian extinction and mammalian introductions on oceanic islands. Science, 305, 1955-1958.
Brown, K. A., Spector, S. & Wu, W. (2008) Multi-scale analysis of species introductions: combining landscape and demographic models to improve management decisions about non-native species. Journal of Applied Ecology, 45, 1639-1648.
Bunnell, D. B., Madenjian, C. P., Holuszko, J. D., Adams, J. V. & French, J. R. P. (2009) Expansion of Dreissena into offshore waters of Lake Michigan and potential impacts on fish populations. Journal of Great Lakes Research, 35, 74-80.
Burgman, M. (2005) Risks and Decisions for Conservation and Environmental Mangement. Cambridge University Press, Cambridge.
CABI (2003) Crop Protection Compendium. (ed^(eds. CAB International.
Cook, D.C., Liu, S., Carrasco, L.R., Siddique, A-B. and Paini, D.R. (in press) Estimating the Social Welfare Effects of New Zealand Apple Imports. Australian Journal of Agricultural and Resource Economics.Cook, D.C. (2008) Benefit cost analysis of an import access request. Food Policy, 33, 277–285.
Cook, D.C. (2008) Benefit cost analysis of an import access request. Food Policy, 33, 277–285.
Cook, D.C. and Matheson (2008) An estimate of the potential economic impact of pine pitch canker in Australia. Australian Forestry, 71, 107-112.
Cook, D.C., Thomas, M.B., Cunningham, S.A., Anderson, D.L. & De Barro, P.J. (2007) Predicting the economic impact of an invasive species on an ecosystem service. Ecological Applications, 17, 1832-1840.
Cohen, J. (1960) A coefficient of agreement for nominal scales. Educational and Psychological Measurement, 20, 37-46.
Dalmazzone, S. (2000) Economic factors affecting the vulnerability to biological invasions. The economics of biological invasions (ed^(eds C. Perrings, M. H. Williamson & S. Dalmazzone), pp. 17-30. Edward Elgar, Cheltenham, UK.
Ferrier, S., Manion, G., Elith, J. & Richardson, K. (2005) Using generalized dissimilarity modelling to analyse and predict patterns of beta diversity in regional biodiversity assessment. Diversity and Distributions, 13, 252-264.

CRC10001 Final Report Page 177 of
177
Forrest, B. M., Gardner, J. P. A. & Taylor, M. D. (2009) Internal borders for managing invasive marine species. Journal of Applied Ecology, 46, 46-54.
GATT (2009) Agreement on the Application of Sanitary and Phytosanitary Measures, in The Results of the Uruguay Round of Multilateral Trade Negotiations: The Legal Texts. General Agreement on Tariffs and Trade Secretariat, Geneva.
GenStat (2007) GenStat, 10th edition, version 10.1. Lawes Agricultural Trust.
Germain J.F. & Hodges, G.S. (2007) First report of Aulacaspis yasumatsui (Hemiptera : Diaspididae) in Africa (Ivory Coast), and update on distribution. Florida Entomologist, 90, 755-756.
Hillebrand, H. (2004) On the generality of the latitudinal diversity gradient. American Naturalist, 163, 192-211.
Hodda, M. and D.C. Cook (2009) Economic Impact from Unrestricted Spread of Potato Cyst Nematodes in Australia. Phytopathology, 99, 1387-1393.
Holliday, P. (2001) A dictionary of plant pathology. Cambridge University Press, Cambridge.
Hulme, P. E. (2003) Biological invasions: winning the science battles but losing the conservation war? Oryx, 37, 178-193.
Hulme, P. E. (2009) Trade, transport and trouble: managing invasive species pathways in an era of globalization. Journal of Applied Ecology, 46, 10-18.
Jacobs, M. J. & Macisaac, H. J. (2009) Modelling spread of the invasive macrophyte Cabomba caroliniana. Freshwater Biology, 54, 296-305.
Kearney, M. & Porter, W. (2009) Mechanistic niche modelling: combining physiological and spatial data to predict species' ranges. Ecology Letters, 12, 334-350.
Keller, R.P., Lodge, D.M. & Finnoff, D.C. (2007) Risk assessment for invasive species produces net bioeconomic benefits. Proceedings of the National Academy of Sciences, 104, 203–207
Kier, G., Mutke, J., Dinerstein, E., Ricketts, T.H., Kuper, W., Kreft, H. & Barthlott, W. (2005) Global patterns of plant diversity and floristic knowledge. Journal of Biogeography, 32, 1107-1116.
Kohonen, T. (2001) Self-Organizing Maps, 3rd edn. Springer, Berlin.
Kolar, C. S. & Lodge, D. M. (2001) Progress in invasion biology: predicting invaders. Trends in Ecology & Evolution, 16, 199-204.
Kriticos, D.J., Sutherst, R.W., Brown, J.R., Adkins, S.W. & Maywald, G.F. (2003) Climate change and the potential distribution of an invasive alien plant: Acacia nilotica ssp. indica in Australia. Journal of Applied Ecology, 40, 111–124.
LaDeau, S. L., Kilpatrick, A. M. & Marra, P. P. (2007) West Nile virus emergence and large-scale declines of North American bird populations. Nature, 447, 710-U713.
Lonsdale, W. M. (1999) Global patterns of plant invasions and the concept of invasibility. Ecology, 80, 1522-1536.
Mathworks (2007) MATLAB, version 7.4. The Mathworks, Natick, MA.
CRC10001 Final Report Page 178 of
178
McCullough, D. G., Work, T. T., Cavey, J. F., Liebhold, A. M. & Marshall, D. (2006) Interceptions of nonindigenous plant pests at US ports of entry and border crossings over a 17-year period. Biological Invasions, 8, 611-630.
Paini, D.R., Worner, S.P., Cook, D.C., De Barro, P.J., Thomas, M.B. (2010) Using a self organising map to predict invasive species: sensitivity to data errors and a comparison with expert opinion. Journal of Applied Ecology, in press.
Pimentel, D., Zuniga, R. & Morrison, D. (2005) Update on the environmental and economic costs associated with alien-invasive species in the United States. Ecological Economics, 52, 273-288.
Sax, D. F., Stachowicz, J. J., Brown, J. H., Bruno, J. F., Dawson, M. N., Gaines, S. D., Grosberg, R. K., HastingS, A., Holt, R. D., Mayfield, M. M., O'Connor, M. I. & Rice, W. R. (2007) Ecological and evolutionary insights from species invasions. Trends in Ecology & Evolution, 22, 465-471.
Stephens, A.E.A., Kriticos, D.J., Leriche A (2007) The current and future potential geographical distribution of the oriental fruit fly, Bactrocera dorsalis (Diptera : Tephritidae). Bulletin of Entomological Research, 97, 369-378.
Traveset, A. & Richardson, D. M. (2006) Biological invasions as disruptors of plant reproductive mutualisms. Trends in Ecology & Evolution, 21, 208-216.
USDA (2005) Plant Protection and Quarantine Strategic Plan FY 2005-2009. (ed^(eds, pp. 43. USDA, APHIS, PPQ.
USDA (2007) Pest Prioritization Overview. (ed^(eds. USDA-APHIS-PPQ, Center for Plant Health Science and Technology.
Westphal, M. I., Browne, M., MacKinnon, K. & Noble, I. (2008) The link between international trade and the global distribution of invasive alien species. Biological Invasions, 10, 391-398.
Worner, S. P. & Gevrey, M. (2006) Modelling global insect pest species assemblages to determine risk of invasion. Journal of Applied Ecology, 43, 858-867.
WTO (2005) Sanitary and phytosanitary agreement. (ed^(eds. World Trade Organization, Geneva.