Embed Size (px)
Citation preview
United States Department of Agriculture
National Agricultural Statistics Service New Jersey Field Office
Cooperating with New Jersey Department of Agriculture
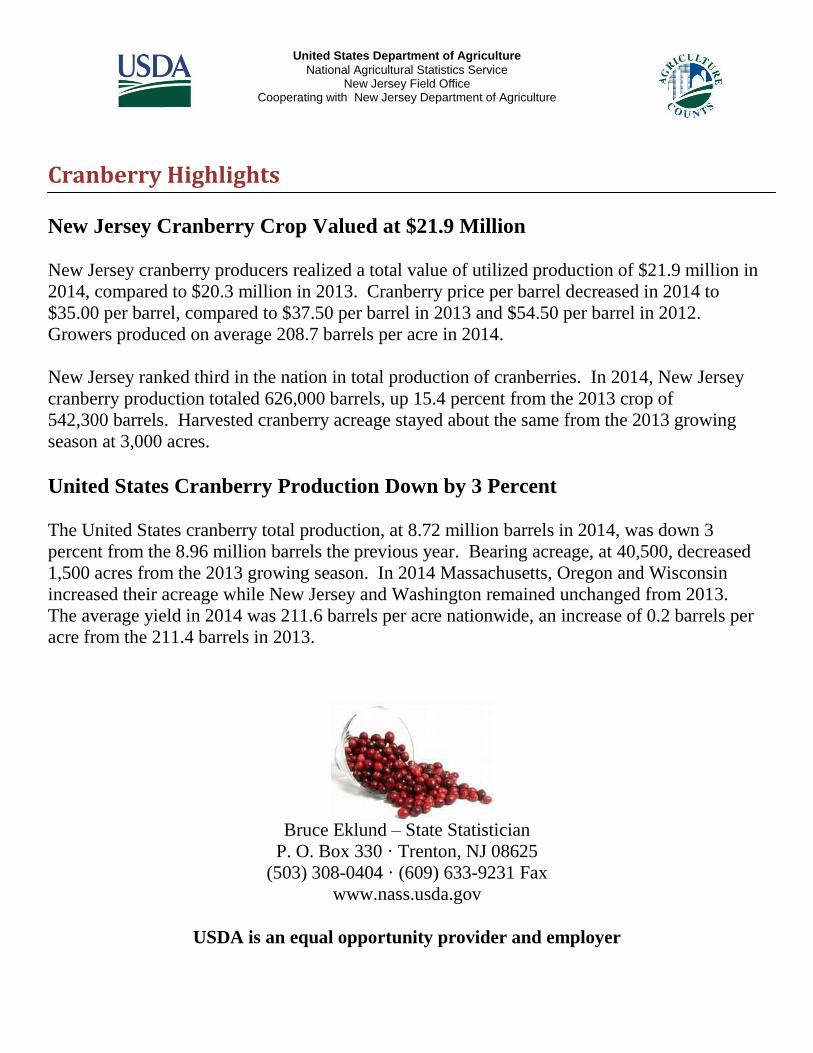
Cranberry Highlights New Jersey Cranberry Crop Valued at $21.9 Million
New Jersey cranberry producers realized a total value of utilized production of $21.9 million in
2014, compared to $20.3 million in 2013. Cranberry price per barrel decreased in 2014 to
$35.00 per barrel, compared to $37.50 per barrel in 2013 and $54.50 per barrel in 2012.
Growers produced on average 208.7 barrels per acre in 2014.
New Jersey ranked third in the nation in total production of cranberries. In 2014, New Jersey
cranberry production totaled 626,000 barrels, up 15.4 percent from the 2013 crop of
542,300 barrels. Harvested cranberry acreage stayed about the same from the 2013 growing
season at 3,000 acres.
United States Cranberry Production Down by 3 Percent
The United States cranberry total production, at 8.72 million barrels in 2014, was down 3
percent from the 8.96 million barrels the previous year. Bearing acreage, at 40,500, decreased
1,500 acres from the 2013 growing season. In 2014 Massachusetts, Oregon and Wisconsin
increased their acreage while New Jersey and Washington remained unchanged from 2013.
The average yield in 2014 was 211.6 barrels per acre nationwide, an increase of 0.2 barrels per
acre from the 211.4 barrels in 2013.
Bruce Eklund – State Statistician
P. O. Box 330 · Trenton, NJ 08625
(503) 308-0404 · (609) 633-9231 Fax
www.nass.usda.gov
USDA is an equal opportunity provider and employer

New Jersey Cranberry Statistics 2014
2
Cranberries: Area Harvested, Yield, Production, Utilization, Price, & Value, 2012
State Area
Harvested
Yield
Per
Acre 1
Production Utilization Price
Per
Barrel 1 2
Value of
Utilized
Production Total Utilized Fresh Processed
acres barrels barrels 4 barrels 4 barrels 4 barrels 4 dollars 1,000 dollars
Massachusetts .......
New Jersey 5 .......
Oregon 5 ...............
Washington ...........
Wisconsin .............
U.S. Total .............
13,000
3,000
2,900
1,700
19,700
40,300
163.3
183.3
139.7
80.6
245.2
199.6
2,123,000
550,000
405,000
137,000
4,830,000
8,045,000
2,123,000
550,000
405,000
137,000
4,830,000
8,045,700
83,000
-
-
41,000
130,000
254,000
2,040,000
550,000
405,000
96,000
4,700,000
7,791,000
47.00
54.40
40.40
63.50
47.80
47.90
99,846
29,920
16,362
8,706
230,672
385,506
See footnote(s) at end of table. --continued
Cranberries: Area Harvested, Yield, Production, Utilization, Price, & Value, 2013
State Area
Harvested
Yield
Per
Acre 1
Production Utilization Price
Per
Barrel 1 2
Value of
Utilized
Production Total Utilized Fresh Processed
acres barrels barrels 4 barrels 4 barrels 4 barrels 4 dollars 1,000 dollars
Massachusetts .......
New Jersey 5 .......
Oregon 5 ...............
Washington ...........
Wisconsin .............
U.S. Total .............
13,200
3,000
3,000
1,700
21,100
42,000
138.5
180.8
130.0
89.4
282.8
211.4
1,852,300
547,500
390,000
152,000
6,015,600
8,957,400
1,828,800
542,300
390,000
152,000
5,967,000
8,880,700
88,800
-
-
40,000
192,600
321,400
1,740,000
542,300
390,000
112,000
5,775,000
8,559,300
31.60
37.50
30.60
43.00
32.00
32.30
57,737
20,336
11,934
6,539
190,679
287,225
See footnote(s) at end of table. --continued
Cranberries: Area Harvested, Yield, Production, Utilization, Price, & Value, 2014
State Area
Harvested
Yield
Per
Acre 1
Production Utilization Price
Per
Barrel 1 2
Value of
Utilized
Production Total Utilized Fresh Processed
acres barrels barrels 4 barrels 4 barrels 4 barrels 4 dollars 1,000 dollars
Massachusetts .......
New Jersey 5 .......
Oregon 5 ...............
Washington ...........
Wisconsin .............
U.S. Total .............
12,400
3,000
3,000
1,700
20,400
40,500
188.9
208.7
140.3
95.3
246.1
211.6
2,417,000
672,000
431,000
162,000
5,035,000
8,717,000
2,342,000
626,000
421,000
162,000
5,020,000
8,571,000
51,000
-
-
52,000
176,000
279,000
2,291,000
626,000
421,000
110,000
4,844,000
8,292,000
34.50
35.00
27.50
43.50
28.90
31.10
80,791
21,910
11,578
7,042
144,852
266,173 1 Yield is based on total population.
2 Production is rounded to the nearest 1,000 barrels.
3 Weighted average of co-op and independent sales,
fresh and processed. Co-op prices represent pool proceeds
less returns for processing non-cranberry products, capital stock dividends, capital stock retains, and other retains. 4 A barrel weighs 100 pounds.
5 Small quantities of fresh cranberries are included in processed to avoid disclosure of individual operations.
Source: Noncitrus Fruits & Nuts Preliminary Summary (January 2015)
USDA, National Agricultural Statistics Service

New Jersey Cranberry Statistics 2014
3
Cranberries: Total Acres Harvested by State & U.S., 2004-2014
Year Massachusetts New Jersey Oregon Washington Wisconsin United States
acres acres acres acres acres acres
2004 .....................
2005 .....................
2006 .....................
2007 .....................
2008 .....................
2009 .....................
2010 .....................
2011 .....................
2012 .....................
2013 .....................
2014 .....................
13,900
13,700
13,500
13,000
13,000
13,000
13,000
13,000
13,000
13,200
12,400
3,100
3,100
3,100
3,100
3,100
3,100
3,100
3,000
3,000
3,000
3,000
2,900
2,700
2,700
2,700
2,700
2,700
2,700
2,800
2,900
3,000
3,000
1,700
1,700
1,700
1,700
1,700
1,700
1,700
1,700
1,700
1,700
1,700
17,400
17,400
17,500
17,600
17,700
18,000
18,000
18,000
19,700
21,100
20,400
39,000
38,600
38,500
38,100
38,200
38,500
38,500
38,500
40,300
42,000
40,500
Massachusetts
31%
New Jersey
8%
Oregon
7% Washington
4%
Wisconsin
50%
2014 Area Harvested Percentage by State
Source: Noncitrus Fruits & Nuts Preliminary Summary (January 2015)
USDA, National Agricultural Statistics Service

New Jersey Cranberry Statistics 2014
4
Cranberries: Yield Per Acre by State & U.S., 2004-2014 1
Year Massachusetts New Jersey Oregon Washington Wisconsin United States
barrels per acre barrels per acre barrels per acre barrels per acre barrels per acre barrels per acre
2004 ....................
2005 ....................
2006 ....................
2007 ....................
2008 ....................
2009 ....................
2010 ....................
2011 ....................
2012 ....................
2013 ....................
2014 ....................
130.1
103.9
139.7
117.1
182.6
139.8
145.5
178.2
163.3
138.5
188.9
129.7
171.9
156.5
171.3
165.2
179.0
181.3
170.0
183.3
180.8
208.7
170.7
163.0
172.2
183.3
148.1
159.3
106.3
128.9
139.7
130.0
140.3
100.0
110.0
67.1
103.5
64.1
94.7
63.6
68.1
80.6
89.4
95.3
189.7
210.3
225.1
217.6
252.5
219.4
220.0
245.0
245.2
282.8
246.1
158.3
161.7
179.0
172.0
205.9
179.6
176.8
200.4
199.6
211.4
211.6 1 Yield is based on total production divided by acres.
2 A barrel weights 100 pounds.
100
115
130
145
160
175
190
205
220
2004 2005 2006 2007 2008 2009 2010 2011 2012 2013 2014
Ba
rrel
s P
er A
cre
U.S. & New Jersey Cranberry Yield 2004-2014
New Jersey
United States
Source: Noncitrus Fruits & Nuts Preliminary Summary (January 2015)
USDA, National Agricultural Statistics Service

New Jersey Cranberry Statistics 2014
5
Cranberries: Total Production by State & U.S., 2004-2014 1
Year Massachusetts New Jersey Oregon Washington Wisconsin United States
barrels barrels barrels barrels barrels barrels
2004 .....................
2005 .....................
2006 .....................
2007 .....................
2008 .....................
2009 .....................
2010 .....................
2011 .....................
2012 .....................
2013 .....................
2014 .....................
1,808,000
1,423,000
1,886,000
1,522,000
2,374,000
1,817,000
1,891,000
2,317,000
2,123,000
1,825,300
2,417,000
402,000
533,000
485,000
531,000
512,000
555,000
562,000
510,000
550,000
547,500
672,000
495,000
440,000
465,000
495,000
400,000
430,000
287,000
361,000
405,000
390,000
431,000
170,000
187,000
114,000
176,000
109,000
161,000
108,200
115,700
137,000
152,000
162,000
3,300,000
3,660,000
3,940,000
3,830,000
4,470,000
3,950,000
3,960,000
4,410,000
4,830,000
6,015,600
5,035,000
6,175,000
6,243,000
6,890,000
6,554,000
7,865,000
6,913,000
6,808,200
7,713,700
8,045,000
8,957,400
8,717,000 1 A barrel weighs 100 pounds.
0
100
200
300
400
500
600
700
800
2004 2005 2006 2007 2008 2009 2010 2011 2012 2013 2014
Th
ou
san
d B
arr
els
New Jersey Total Cranberry Production 2004-2014
Source: Noncitrus Fruits & Nuts Preliminary Summary (January 2015)
USDA, National Agricultural Statistics Service
New Jersey Cranberry Statistics 2014
6
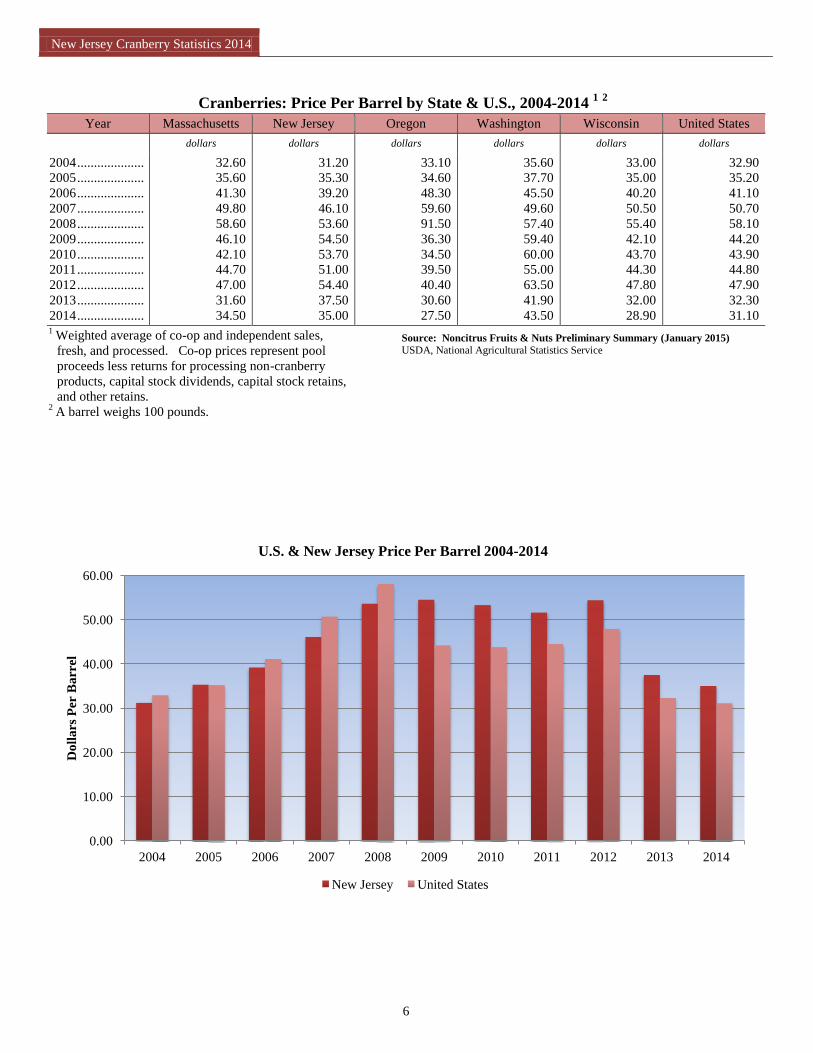
Cranberries: Price Per Barrel by State & U.S., 2004-2014 1 2
Year Massachusetts New Jersey Oregon Washington Wisconsin United States
dollars dollars dollars dollars dollars dollars
2004 ....................
2005 ....................
2006 ....................
2007 ....................
2008 ....................
2009 ....................
2010 ....................
2011 ....................
2012 ....................
2013 ....................
2014 ....................
32.60
35.60
41.30
49.80
58.60
46.10
42.10
44.70
47.00
31.60
34.50
31.20
35.30
39.20
46.10
53.60
54.50
53.70
51.00
54.40
37.50
35.00
33.10
34.60
48.30
59.60
91.50
36.30
34.50
39.50
40.40
30.60
27.50
35.60
37.70
45.50
49.60
57.40
59.40
60.00
55.00
63.50
41.90
43.50
33.00
35.00
40.20
50.50
55.40
42.10
43.70
44.30
47.80
32.00
28.90
32.90
35.20
41.10
50.70
58.10
44.20
43.90
44.80
47.90
32.30
31.10 1 Weighted average of co-op and independent sales,
fresh, and processed. Co-op prices represent pool
proceeds less returns for processing non-cranberry
products, capital stock dividends, capital stock retains,
and other retains. 2 A barrel weighs 100 pounds.
0.00
10.00
20.00
30.00
40.00
50.00
60.00
2004 2005 2006 2007 2008 2009 2010 2011 2012 2013 2014
Do
lla
rs P
er B
arr
el
U.S. & New Jersey Price Per Barrel 2004-2014
New Jersey United States
Source: Noncitrus Fruits & Nuts Preliminary Summary (January 2015)
USDA, National Agricultural Statistics Service

New Jersey Cranberry Statistics 2014
7
Cranberries: Value of Utilized Production by State & U.S., 2004-2014
Year Massachusetts New Jersey Oregon Washington Wisconsin United States
1,000 dollars 1,000 dollars 1,000 dollars 1,000 dollars 1,000 dollars 1,000 dollars
2004 .....................
2005 .....................
2006 .....................
2007 .....................
2008 .....................
2009 .....................
2010 .....................
2011 .....................
2012 .....................
2013 .....................
2014 .....................
59,004
50,708
77,871
75,856
139,220
83,843
79,656
103,574
99,846
57,737
80,791
12,293
18,815
18,816
24,479
27,443
30,248
30,179
26,010
29,920
20,336
21,910
16,364
15,208
22,460
29,502
36,600
15,609
9,902
14,260
16,362
11,934
11,578
6,055
7,046
5,191
8,737
6,259
9,565
6,490
6,361
8,706
6,364
7,042
108,954
128,208
154,550
193,518
247,670
166,404
172,896
195,356
230,672
190,679
144,852
202,670
219,985
278,888
332,092
457,192
305,669
299,123
345,561
385,506
287,050
266,173
2,000
7,000
12,000
17,000
22,000
27,000
32,000
2004 2005 2006 2007 2008 2009 2010 2011 2012 2013 2014
Th
ou
san
d D
oll
ars
New Jersey Value of Utilized Production 2004-2014
Source: Noncitrus Fruits & Nuts Preliminary Summary (January 2015)
USDA, National Agricultural Statistics Service
USDA, National Agricultural Statistics Service
New Jersey Cranberry Statistics 2014
8
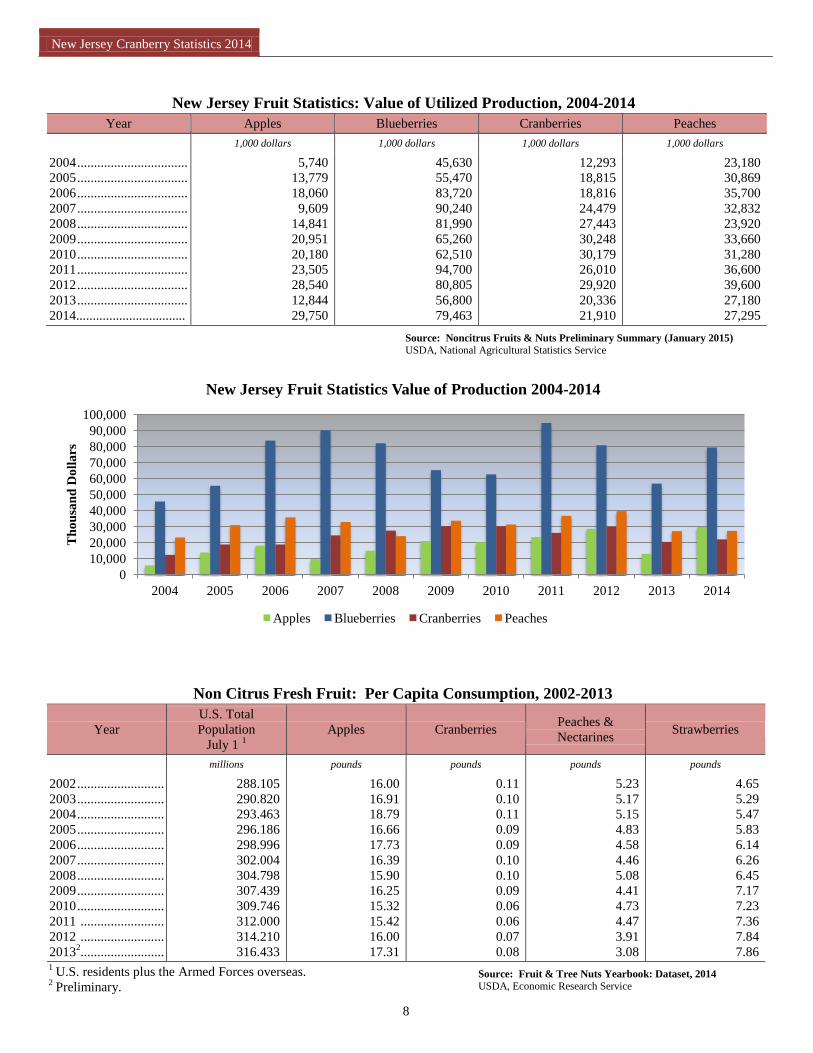
New Jersey Fruit Statistics: Value of Utilized Production, 2004-2014
Year Apples Blueberries Cranberries Peaches
1,000 dollars 1,000 dollars 1,000 dollars 1,000 dollars
2004 .................................
2005 .................................
2006 .................................
2007 .................................
2008 .................................
2009 .................................
2010 .................................
2011 .................................
2012 .................................
2013 .................................
2014.................................
5,740
13,779
18,060
9,609
14,841
20,951
20,180
23,505
28,540
12,844
29,750
45,630
55,470
83,720
90,240
81,990
65,260
62,510
94,700
80,805
56,800
79,463
12,293
18,815
18,816
24,479
27,443
30,248
30,179
26,010
29,920
20,336
21,910
23,180
30,869
35,700
32,832
23,920
33,660
31,280
36,600
39,600
27,180
27,295
Non Citrus Fresh Fruit: Per Capita Consumption, 2002-2013
Year
U.S. Total
Population
July 1 1
Apples Cranberries Peaches &
Nectarines Strawberries
millions pounds pounds pounds pounds
2002 ..........................
2003 ..........................
2004 ..........................
2005 ..........................
2006 ..........................
2007 ..........................
2008 ..........................
2009 ..........................
2010 ..........................
2011 .........................
2012 .........................
20132 .........................
288.105
290.820
293.463
296.186
298.996
302.004
304.798
307.439
309.746
312.000
314.210
316.433
16.00
16.91
18.79
16.66
17.73
16.39
15.90
16.25
15.32
15.42
16.00
17.31
0.11
0.10
0.11
0.09
0.09
0.10
0.10
0.09
0.06
0.06
0.07
0.08
5.23
5.17
5.15
4.83
4.58
4.46
5.08
4.41
4.73
4.47
3.91
3.08
4.65
5.29
5.47
5.83
6.14
6.26
6.45
7.17
7.23
7.36
7.84
7.86 1 U.S. residents plus the Armed Forces overseas.
2 Preliminary.
0
10,000
20,000
30,000
40,000
50,000
60,000
70,000
80,000
90,000
100,000
2004 2005 2006 2007 2008 2009 2010 2011 2012 2013 2014
Th
ou
san
d D
oll
ars
New Jersey Fruit Statistics Value of Production 2004-2014
Apples Blueberries Cranberries Peaches
Source: Noncitrus Fruits & Nuts Preliminary Summary (January 2015)
USDA, National Agricultural Statistics Service
Source: Fruit & Tree Nuts Yearbook: Dataset, 2014
USDA, Economic Research Service
USDA, National Agricultural Statistics Service
New Jersey Cranberry Statistics 2014
9
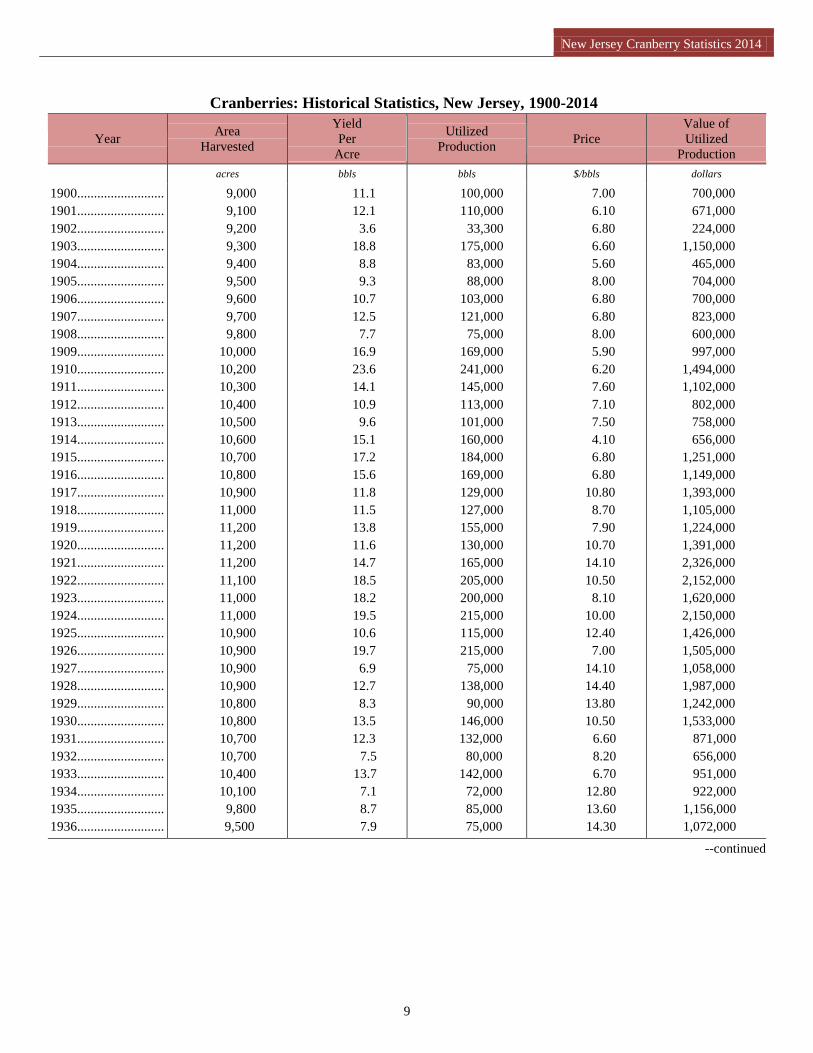
Cranberries: Historical Statistics, New Jersey, 1900-2014
Year Area
Harvested
Yield
Per
Acre
Utilized
Production Price
Value of
Utilized
Production
acres bbls bbls $/bbls dollars
1900 ..........................
1901 ..........................
1902 ..........................
1903 ..........................
1904 ..........................
1905 ..........................
1906 ..........................
1907 ..........................
1908 ..........................
1909 ..........................
1910 ..........................
1911 ..........................
1912 ..........................
1913 ..........................
1914 ..........................
1915 ..........................
1916 ..........................
1917 ..........................
1918 ..........................
1919 ..........................
1920 ..........................
1921 ..........................
1922 ..........................
1923 ..........................
1924 ..........................
1925 ..........................
1926 ..........................
1927 ..........................
1928 ..........................
1929 ..........................
1930 ..........................
1931 ..........................
1932 ..........................
1933 ..........................
1934 ..........................
1935 ..........................
1936 ..........................
9,000
9,100
9,200
9,300
9,400
9,500
9,600
9,700
9,800
10,000
10,200
10,300
10,400
10,500
10,600
10,700
10,800
10,900
11,000
11,200
11,200
11,200
11,100
11,000
11,000
10,900
10,900
10,900
10,900
10,800
10,800
10,700
10,700
10,400
10,100
9,800
9,500
11.1
12.1
3.6
18.8
8.8
9.3
10.7
12.5
7.7
16.9
23.6
14.1
10.9
9.6
15.1
17.2
15.6
11.8
11.5
13.8
11.6
14.7
18.5
18.2
19.5
10.6
19.7
6.9
12.7
8.3
13.5
12.3
7.5
13.7
7.1
8.7
7.9
100,000
110,000
33,300
175,000
83,000
88,000
103,000
121,000
75,000
169,000
241,000
145,000
113,000
101,000
160,000
184,000
169,000
129,000
127,000
155,000
130,000
165,000
205,000
200,000
215,000
115,000
215,000
75,000
138,000
90,000
146,000
132,000
80,000
142,000
72,000
85,000
75,000
7.00
6.10
6.80
6.60
5.60
8.00
6.80
6.80
8.00
5.90
6.20
7.60
7.10
7.50
4.10
6.80
6.80
10.80
8.70
7.90
10.70
14.10
10.50
8.10
10.00
12.40
7.00
14.10
14.40
13.80
10.50
6.60
8.20
6.70
12.80
13.60
14.30
700,000
671,000
224,000
1,150,000
465,000
704,000
700,000
823,000
600,000
997,000
1,494,000
1,102,000
802,000
758,000
656,000
1,251,000
1,149,000
1,393,000
1,105,000
1,224,000
1,391,000
2,326,000
2,152,000
1,620,000
2,150,000
1,426,000
1,505,000
1,058,000
1,987,000
1,242,000
1,533,000
871,000
656,000
951,000
922,000
1,156,000
1,072,000
--continued

New Jersey Cranberry Statistics 2014
10
Cranberries: Historical Statistics, New Jersey, 1900-2014
Year Area
Harvested
Yield
Per
Acre
Utilized
Production Price
Value of
Utilized
Production
acres bbls bbls $/bbls dollars
1937 .........................
1938 .........................
1939 .........................
1940 .........................
1941 .........................
1942 .........................
1943 .........................
1944 .........................
1945 .........................
1946 .........................
1947 .........................
1948 .........................
1949 .........................
1950 .........................
1951 .........................
1952 .........................
1953 .........................
1954 .........................
1955 .........................
1956 .........................
1957 .........................
1958 .........................
1959 .........................
1960 .........................
1961 .........................
1962 .........................
1963 .........................
1964 .........................
1965 .........................
1966 .........................
1967 .........................
1968 .........................
1969 .........................
1970 .........................
1971 .........................
1972 .........................
1973 .........................
9,200
8,800
8,500
8,200
8,000
7,800
7,700
7,600
7,600
7,700
7,800
7,800
7,500
7,000
6,500
5,800
5,000
4,200
3,600
3,000
2,800
2,500
2,800
2,700
3,000
3,000
2,600
3,100
3,000
3,000
3,200
3,300
3,000
3,100
3,100
3,000
3,200
19.0
7.0
10.4
11.0
10.0
12.2
8.1
7.8
6.4
13.1
10.5
8.8
8.9
14.7
11.7
17.9
22.4
20.7
25.0
24.3
27.9
35.6
33.6
31.9
39.3
34.3
25.3
49.4
51.0
45.0
49.1
47.0
53.3
57.7
76.5
19.6
71.3
175,000
62,000
88,000
90,000
80,000
95,000
62,000
59,000
49,000
101,000
82,000
69,000
67,000
103,000
76,000
104,000
112,000
87,000
90,000
73,000
78,000
89,000
90,000
86,000
118,000
102,000
65,800
153,000
153,000
135,000
157,000
155,000
160,000
179,000
175,000
192,000
228,000
9.80
10.70
8.70
11.00
11.00
13.30
16.20
24.20
19.40
32.20
16.90
10.20
6.10
7.20
12.40
16.70
12.80
11.00
8.50
9.20
11.40
11.80
9.00
9.00
8.70
9.90
12.20
14.50
15.70
15.20
14.80
15.20
15.50
10.80
14.60
12.60
13.70
1,715,000
663,000
766,000
990,000
880,000
1,264,000
1,004,000
1,428,000
951,000
3,252,000
1,386,000
704,000
409,000
742,000
942,000
1,737,000
1,434,000
957,000
765,000
672,000
889,000
1,050,000
846,000
774,000
1,027,000
1,020,000
803,000
2,219,000
2,402,000
2,052,000
2,324,000
2,356,000
2,480,000
1,933,000
2,599,000
2,470,000
3,124,000
--continued

New Jersey Cranberry Statistics 2014
11
Cranberries: Historical Statistics, New Jersey, 1900-2014
Year Area
Harvested
Yield
Per
Acre
Utilized
Production Price
Value of
Utilized
Production
acres bbls bbls $/bbls dollars
1974 .........................
1975 .........................
1976 .........................
1977 .........................
1978 .........................
1979 .........................
1980 .........................
1981 .........................
1982 .........................
1983 .........................
1984 .........................
1985 .........................
1986 .........................
1987 .........................
1988 .........................
1989 .........................
1990 .........................
1991 .........................
1992 .........................
1993 .........................
1994 .........................
1995 .........................
1996 .........................
1997 .........................
1998 .........................
1999 .........................
2000 .........................
2001 .........................
2002 .........................
2003 .........................
2004 .........................
2005 .........................
2006 .........................
2007 .........................
2008 .........................
2009 .........................
2010 .........................
2011 .........................
2012 .........................
2013 .........................
2014 .........................
3,200
3,100
3,100
3,000
3,000
3,000
2,900
2,900
3,000
3,100
3,200
3,300
3,300
3,200
3,300
3,200
3,200
3,200
3,300
3,400
3,300
3,500
3,600
3,900
3,900
4,000
3,700
3,100
3,100
3,200
3,100
3,100
3,100
3,100
3,100
3,100
3,100
3,000
3,000
3,000
3,000
78.1
71.3
89.0
52.3
74.3
84.3
84.5
78.6
98.3
75.2
85.6
97.0
98.5
87.5
112.1
91.3
100.9
102.2
144.8
113.5
169.1
129.7
129.7
149.2
133.6
175.0
132.2
182.6
138.7
150.0
129.7
171.9
156.5
171.3
165.2
179.0
181.3
170.0
183.3
180.8
208.7
250,000
221,000
276,000
157,000
223,000
253,000
245,000
228,000
295,000
233,000
274,000
320,000
325,000
280,000
370,000
292,000
323,000
327,000
478,000
386,000
558,000
454,000
467,000
582,000
521,000
700,000
469,000
412,000
430,000
480,000
394,000
533,000
480,000
531,000
512,000
555,000
562,000
510,000
550,000
542,300
626,000
10.60
13.30
13.50
18.80
21.70
26.90
33.20
41.60
40.00
44.60
47.00
46.90
45.40
45.10
45.10
41.00
45.00
47.70
48.80
47.20
46.60
50.00
61.80
56.60
26.30
10.10
17.90
23.10
31.90
31.90
31.20
35.30
39.20
46.10
53.60
54.50
53.70
51.00
54.40
37.50
35.00
2,650,000
2,939,000
3,726,000
2,952,000
4,839,000
6,806,000
8,134,000
9,485,000
11,800,000
10,392,000
12,878,000
15,008,000
14,755,000
12,628,000
16,687,000
11,972,000
14,535,000
15,598,000
23,326,000
18,219,000
26,003,000
22,700,000
28,861,000
32,941,000
13,702,000
7,070,000
8,395,000
9,517,000
13,717,000
15,312,000
12,293,000
18,815,000
18,816,000
24,479,000
27,443,000
30,248,000
30,179,000
26,010,000
29,920,000
20,336,000
21,910,000
Source: Noncitrus Fruits & Nuts Preliminary Summary (January 2015)
USDA, National Agricultural Statistics Service

New Jersey Cranberry Statistics 2014
12
e ensure the confidentiality of all individual reports. No person (outside of Agricultural Statistics Service
personnel), organization, or other local, state, or federal government agency has access to any report an
individual submits to us. Individual reports are used only in combination with other reports and are summarized
to develop county, state, and federal cranberry production estimates.
The publication and dissemination of agricultural statistics are possible only through the support and
cooperation of the agricultural industry. The New Jersey Agricultural Statistics Service would like to thank
those who responded and furnished information for the cranberry estimation program.
Who We Are...
The mission of USDA’s National Agricultural Statistics Service (NASS) is to provide timely, accurate, and
useful statistics in service to United States agriculture. Statistics are based on data collected from growers and
agri-businesses through annual, quarterly, monthly, and weekly surveys and the Census of Agriculture.
Nationwide: About 400 national reports are issued annually covering about 120 crop and 45 livestock items in
the major-producing states along with economic and demographic information. Each report is published
according to a pre-set calendar of release dates. Strict security ensures that no one gains premature access to the
information. The Census of Agriculture is conducted every five years to generate statistics for ALL agricultural
commodities at the county, state, and national levels. The five-year program also includes special studies like
the Census of Horticulture and Aquaculture. Census products and services are available from all field offices.
New Jersey: The New Jersey field office in Trenton along with the regional office in Harrisburg, PA endeavor
to serve New Jersey Agriculture to meet data needs. We partner with New Jersey producers as good information
is an important component of good decisions.
W
Fruits and Berries: Usual Full Bloom & Harvesting Dates
Crop Apr May June July Aug Sept Oct Nov
Apples
Blueberries
Cranberries .
Grapes
Peaches
Strawberries
Begins Most Active Ends
Planting Harvest