Embed Size (px)
Citation preview
MOODY’S ANALYTICS COVID-19 AND THE CONVERGENCE OF RETAIL AND INDUSTRIAL 1
Real Estate Solutionsby Moody’s Analytics
COVID-19 and the Convergence of Retail and Industrial The Opportunities, Constraints, and Economic Realities of Repurposing Introduction
In early August, news broke that Simon Property Group—the largest owner and operator of malls in the US—was in talks with Amazon, with the objective of repurposing some of the space formerly occupied by beleaguered retail tenants into distribution and fulfillment centers.1 Amazon had already been converting some sites of “failed malls” in Northeastern Ohio2 into fulfillment centers. The e-commerce giant continues to perform well amidst the COVID-19 crisis, doubling its profits year-over-year to $5.2 billion in the second quarter despite the worst economic contraction ever experienced by the US.3
In this paper we will discuss the economics of repurposing real estate for other uses, given the widespread structural changes that the COVID-19 crisis has prompted. We will focus on the convergence between retail and industrial, but also, given the systemic nature of this pandemic, we will touch on how the use and structure of other property types are likely to evolve as well.
1 https://www.wsj.com/articles/amazon-and-giant-mall-operator-look-at-turning-sears-j-c-penney-stores-into-fulfillment-centers-
11596992863 2 https://www.wsj.com/video/why-amazon-is-gobbling-up-failed-malls/FC3559FE-945E-447C-8837-151C31D69127.html 3 https://fortune.com/2020/07/30/amazon-q2-earnings-2020-prime-delivery-coronavirus-pandemic/
ANALYSIS AUGUST 27, 2020
Authors Victor Calanog PhD David Caputo Keegan Kelly
ABSTRACT | EXECUTIVE SUMMARY The COVID-19 pandemic has prompted a number of retail bankruptcies, even as demand for warehouse/distribution space appears to be increasing. There is much news about repurposing fallow retail space for industrial use, but not all locations—or space configurations—are good candidates for the changing supply chain logistics. We discuss which locations are more ideal, and why, using three case studies of businesses that filed for bankruptcy and which lease retail locations across the country.
Contact Us Americas +1.201.901.1932 [email protected]
MOODY’S ANALYTICS COVID-19 AND THE CONVERGENCE OF RETAIL AND INDUSTRIAL 2
Table of Contents
Introduction 1
The Nature of Real Estate as a “Fixed Asset” 3
The Rise of E-Commerce and the Effect of COVID-19 3
So Why Not Simply Tear Down Retail Space and Build Warehouses? 4
Enter COVID-19—and Repurposing 5
Not Every Retail Location Is Ideal for Repurposing 5
JCPenney 5
Sears 6
Cross-Sector Analysis is Key 8
Gold’s Gym 9
Conclusions: Supply Chain Logistics Will Be the Ultimate Driver 10
MOODY’S ANALYTICS COVID-19 AND THE CONVERGENCE OF RETAIL AND INDUSTRIAL 3
The Nature of Real Estate as a “Fixed Asset”
Real estate has traditionally been regarded as somewhat immutable—even accounting terminology classifies it as a “fixed asset,” along with land. The evolution of zoning and safety laws have also put institutional boundaries on where commercial properties can be located and how they can be used. Single-use or Euclidean zoning limits the type of properties that can be built in certain places around towns and municipalities, originating from complaints about pollution from industrial buildings and concern about urban sprawl.4 As we observe later in this paper, municipal taxation issues stemming from single-use zoning can constrain even the most ambitious attempts at repurposing.
The physical nature itself of commercial real estate contributes to this “fixed” nature: retail and office properties are large structures with complex designs that are costly to modify or tear down. Most real estate recessions are therefore prolonged by “effective oversupply—as demand shrinks, supply does not shrink as much. And while construction or supply growth can be delayed, existing inventory almost never gets taken off the market. In response, equilibrium performance metrics like rents and vacancies take longer to recover.
The evolutionary forces of structural change, however, have been compelling owners and operators of commercial real estate to adapt.
The Rise of E-Commerce and the Effect of COVID-19
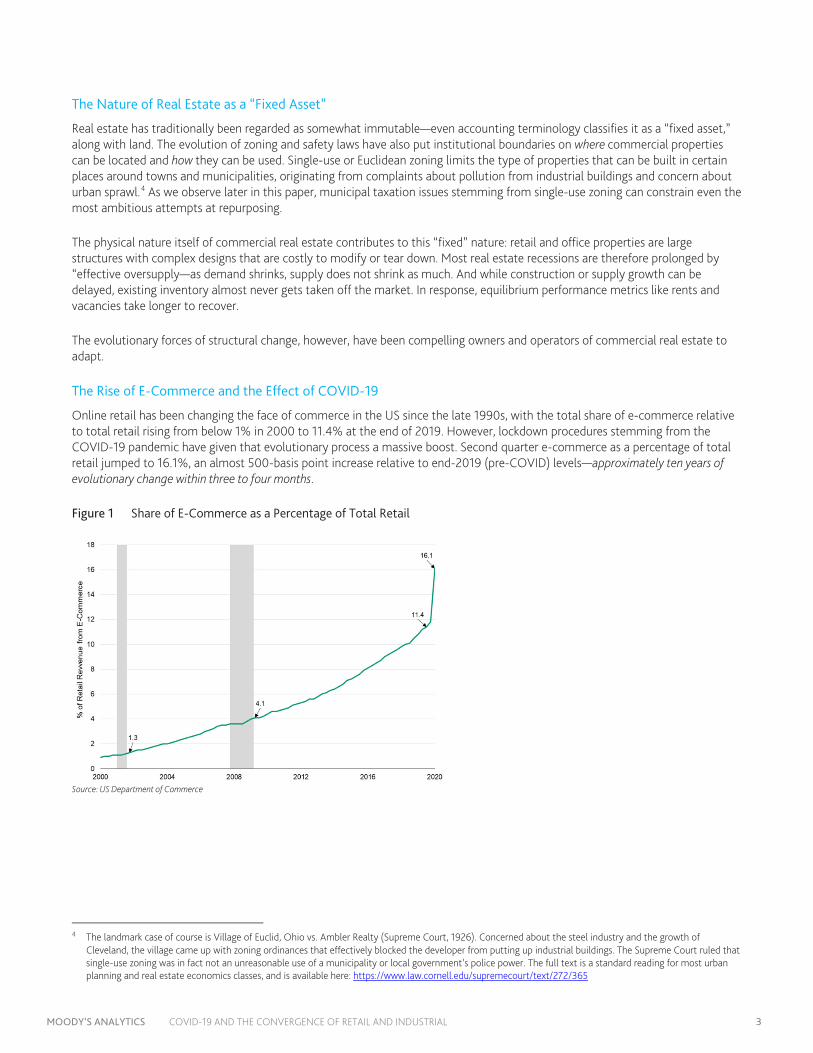
Online retail has been changing the face of commerce in the US since the late 1990s, with the total share of e-commerce relative to total retail rising from below 1% in 2000 to 11.4% at the end of 2019. However, lockdown procedures stemming from the COVID-19 pandemic have given that evolutionary process a massive boost. Second quarter e-commerce as a percentage of total retail jumped to 16.1%, an almost 500-basis point increase relative to end-2019 (pre-COVID) levels—approximately ten years of evolutionary change within three to four months.
Figure 1 Share of E-Commerce as a Percentage of Total Retail
Source: US Department of Commerce
4 The landmark case of course is Village of Euclid, Ohio vs. Ambler Realty (Supreme Court, 1926). Concerned about the steel industry and the growth of
Cleveland, the village came up with zoning ordinances that effectively blocked the developer from putting up industrial buildings. The Supreme Court ruled that single-use zoning was in fact not an unreasonable use of a municipality or local government’s police power. The full text is a standard reading for most urban planning and real estate economics classes, and is available here: https://www.law.cornell.edu/supremecourt/text/272/365

MOODY’S ANALYTICS COVID-19 AND THE CONVERGENCE OF RETAIL AND INDUSTRIAL 4
In a recent paper, we discussed the structural reasons why the industrial warehouse/distribution sector was likely to benefit from the rise of e-commerce.5 An online retailer needs approximately three times as much warehouse and distribution space as a brick-and-mortar retailer to generate the same kind of revenues, according to research from Prologis.6 Moody’s Analytics REIS forecasts show that property types have begun to adapt, in terms of the amount of product that developers in each sector expect to bring to market in 2020.
Figure 2 Pre- and Post-COVID Expected Inventory Growth (2020)
PROPERTY TYPE CHANGE IN 2020 EXPECTED INVENTORY PRE-VERSUS POST-COVID Apartment -15.6% Office -10.0% Retail -15.7% Industrial 3.6% Source: Moody’s Analytics REIS
As Figure 2 shows, apartment, office, and retail development has slowed by anywhere from 10.0 to 15.7%, reflecting millions of square feet (SF) in projects delayed or cancelled this year. For industrial warehouse/distribution, however, we’ve identified over 4 million SF of new space slated for construction and completion this year. Existing supply might be relatively fixed, but clearly market participants are taking bets on which property types ought to back off in terms of new product coming to market—and which one should bring even more buildings online, despite the uncertainties of the pandemic.
So Why Not Simply Tear Down Retail Space and Build Warehouses?
There are two fundamental reasons why complete demolitions are prohibitive. First, a complete tear-down will add anywhere from $4 to $8 per SF (PSF) in project costs, not including extra time spent for permitting and execution.7 Once the land is cleared, developers will then need to incur building costs, which vary widely by location. As of the second quarter of 20208, warehouse/distribution space rents, on average, for $5.68 PSF. The tear-down option is therefore not economically viable for most developers of warehouse/distribution properties.
Euclidean or single-use zoning, discussed in prior sections, also serves as an institutional constraint. One cannot simply build industrial buildings in areas zoned for commercial use. Often, that requires rezoning areas—a long and tedious process with a low probability of success. State and local governments typically tax industrial properties at anywhere from half to two-thirds the rate of commercial properties, so municipalities have little incentive to rezone areas from commercial to industrial use, as they will collect less tax revenues.
Figure 3 Comparison of Commercial vs. Industrial Tax Rates (Select States)
TAX RATES
STATE COMMERCIAL INDUSTRIAL Michigan 4.24% 2.73% New York 3.90% 2.34% Connecticut 3.81% 2.09% Illinois 3.78% 2.27% Rhode Island 3.68% 1.93% Source: Lincoln Property Institute9
5 “Why Industrial (Warehouse) Is Likely to Fare Better.” Research paper from Moody’s Analytics REIS, published on June 17, 2020. Available upon request. 6 https://www.prologis.com/about/logistics-industry-research/e-commerce-and-new-demand-model-logistics-real-estate 7 See Diven and Taylor, Demolition Planning (American Institute of Architects, 2006) for cost estimates and other implementation issues. 8 For the top 100 industrial markets that Moody’s Analytics REIS covers, warehouse/distribution asking rents range from $2.78 PSF to $18.15 PSF as of the second
quarter of 2020. 9 “50-State Property Tax Comparison Study – For Taxes Paid in 2017.” Lincoln Property Institute, April 2018. Available here:
https://www.lincolninst.edu/sites/default/files/pubfiles/50-state-property-tax-comparison-for-2017-full_1.pdf
MOODY’S ANALYTICS COVID-19 AND THE CONVERGENCE OF RETAIL AND INDUSTRIAL 5
Enter COVID-19—and Repurposing
As of mid-August, 30 retailers and restaurant chains have filed for bankruptcy in 2020.10 That is almost twice the number from 2019, signifying how quickly and severely the pandemic-induced economic contraction has hit brick-and-mortar establishments.11 Several of these retailers occupy large amounts of space as anchor tenants in major malls. Simon’s public filings show that their malls have 63 JCPenney stores and 11 Sears (both retailers have filed for bankruptcy) and the space they occupy may therefore be the subject of discussions with Amazon. This would allow Simon and Amazon to accomplish three things: first, Amazon won’t need to incur tear-down costs for their space needs. Second, neither business will need to face the uphill battle of rezoning commercial for industrial use. Amazon will lease retail space from Simon but will negotiate for much lower rents PSF, given prevailing warehouse/distribution rents. And the municipalities will still tax the Simon property at commercial rates, not industrial rates.
Finally, while Simon is likely to face lower rental income as a result of Amazon’s bargaining power, the alternative option—large blocks of space vacated by bankrupt anchor tenants—is even less palatable. “In general, space leased to fulfillment centers fetches low rent levels relative to other tenants in malls, like restaurants,” said Christian Henkel, who leads advisory services for Moody’s Analytics REIS. “But in tough situations like today, where the landlord is facing lower rental income versus zero rental income, the choice seems clear.”
Not Every Retail Location Is Ideal for Repurposing
Not all retail locations occupied by beleaguered brick-and-mortar tenants are good candidates for repurposing into industrial space. So where and why will repurposing efforts converting retail for industrial use take place? Which markets will these evolutionary changes affect in a greater (or lesser) way? For the remainder of this paper, we will use case studies of retail brick-and-mortar tenants that have filed for Chapter 11, and discuss why certain spaces occupied by beleaguered retail tenants are more viable candidates for repurposing than others.
JCPenney
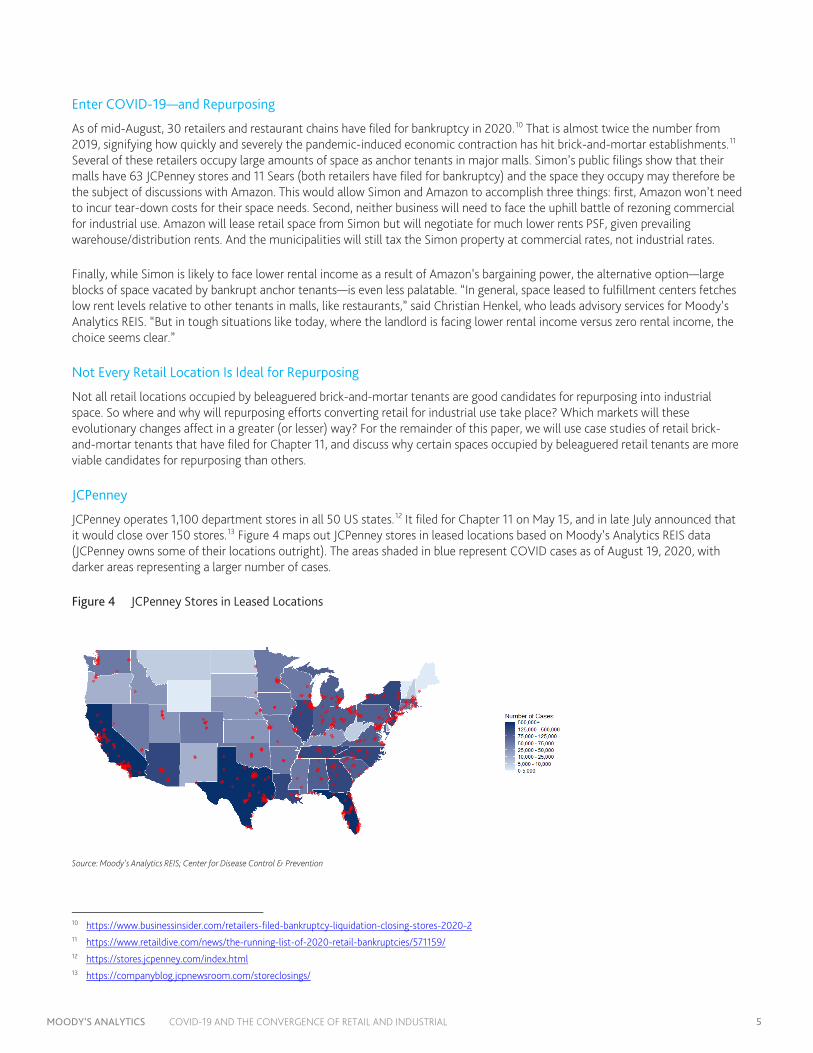
JCPenney operates 1,100 department stores in all 50 US states.12 It filed for Chapter 11 on May 15, and in late July announced that it would close over 150 stores.13 Figure 4 maps out JCPenney stores in leased locations based on Moody’s Analytics REIS data (JCPenney owns some of their locations outright). The areas shaded in blue represent COVID cases as of August 19, 2020, with darker areas representing a larger number of cases.
Figure 4 JCPenney Stores in Leased Locations
Source: Moody’s Analytics REIS; Center for Disease Control & Prevention
10 https://www.businessinsider.com/retailers-filed-bankruptcy-liquidation-closing-stores-2020-2 11 https://www.retaildive.com/news/the-running-list-of-2020-retail-bankruptcies/571159/ 12 https://stores.jcpenney.com/index.html 13 https://companyblog.jcpnewsroom.com/storeclosings/

MOODY’S ANALYTICS COVID-19 AND THE CONVERGENCE OF RETAIL AND INDUSTRIAL 6
A full 74.2% of the space that JCPenney leases is in regional malls, as opposed to other property types like power centers and neighborhood and community centers. In terms of repurposing space occupied by retail tenants to industrial fulfillment centers, malls make economic sense because of two main factors:
1. Regional malls are generally larger (anywhere from 750,000 SF and above in terms of size, versus neighborhood centers that average 150,000 SF)—online retailers need more space for their business.
2. Most malls tend to be located near major highway exits for easy ingress and egress of out-of-town customers. Delivery trucks will find that kind of infrastructure useful for fulfillment objectives like stocking and last-mile service promises. By contrast, neighborhood and community centers are often located deeper within suburban areas, serving primarily local customers.
Figure 5 lists the top five submarkets ranked by the percentage of space occupied by JCPenney in specific neighborhoods. All of these pertain to regional malls in Moody’s Analytics REIS retail submarkets. Many are smaller regional malls that may not meet an online retailer like Amazon’s needs for scale, given their target populations. There is more of an incentive for Amazon to discuss portfolios of properties to repurpose—hence its conversations with Simon, the largest mall owner and operator in the country. But it is still important to note which geographic areas might go through a relatively more significant change because a larger proportion of its retail space may be converted for industrial use.
Figure 5 Concentration Risk by Submarket: JCPenney
MSA / SUBMARKET STATE % OF SUBMARKET OCCUPIED Birmingham / West AL 37.1% San Jose / West County CA 30.8% Central New Jersey / Southeast Middlesex NJ 29.3% Little Rock / Central-North Little Rock AR 23.5% San Antonio / South TX 23.2% Source: Moody’s Analytics REIS
Sears
Sears is an even older institution, having been founded in 1893 (JCPenney was founded in 1902). In 1896, a hundred years before the term “disruption” was popularized by Clayton Christensen14 in the late 1990s, Sears “disrupted” the mail order catalogue business–itself one of the earliest forms of “doing commerce outside of brick-and-mortar stores”— by deliberately producing a catalogue that was smaller than the one Montgomery Ward had begun producing in 1872. Customers typically stacked these catalogues on top of each other in their homes, and because the smaller ones ended up on top, the Sears catalog would get the first pass, much like companies today pay to emerge at or near the top of search engine queries.15
Sears filed for bankruptcy in late 2018,16 but has recently been in the news because several of its stores have reopened and remain a target for repurposing. On July 16, it reopened stores that had closed due to COVID-19, and it has instituted policies aimed at assuring customers that it is safe to shop in their locations.17
Sears is an interesting case study to illustrate how Chapter 11 bankruptcy filings do not automatically lead to liquidation and widespread store closures. Sears still operates about 500 stores around the country—although that number is down significantly from approximately 3,500 in 2010 (perhaps not coincidentally, the last year that it posted profits).18
14 See Christensen Clayton, The Innovator’s Dilemma: When New Technologies Cause Great Firms to Fail. Harvard Business School Publishing, 1997. 15 https://www.bbc.co.uk/programmes/w3csz2w7 16 https://www.nytimes.com/2018/10/14/business/sears-bankruptcy-filing-chapter-11.html 17 https://www.sears.com/en_us/dap/transformco-Coronavirus-2019-response.html 18 https://www.cnbc.com/2018/10/15/sears-is-closing-another-142-stores-heres-a-map-of-the-locations-it-has-left.html

MOODY’S ANALYTICS COVID-19 AND THE CONVERGENCE OF RETAIL AND INDUSTRIAL 7
Figure 6 Sears Stores in Leased Locations
Source: Sears; Moody’s Analytics REIS; Center for Disease Control & Prevention
Much like JCPenney, the majority (62.1%) of Sears stores are located in regional malls. Depending on the submarket, they may take up to a quarter or a third of the space.
Figure 7 Concentration Risk by Submarket: Sears
MSA / SUBMARKET STATE % OF SUBMARKET OCCUPIED San Jose / West County CA 35.5% Baltimore / Central Hartford County MD 32.1% Memphis / South Memphis-Airport TN 28.9% Omaha / Central City NE 27.9% Long Island / North Hempstead NY 25.6% Source: Moody’s Analytics REIS
An interesting pattern emerges: the West County submarket of San Jose appears in both rankings of geographic concentration for both JCPenney and Sears. This neighborhood is relatively small, with about 4.5 million SF of neighborhood and community center space—less than half of inventory for the neighboring South County submarket (the largest in the San Jose metro). At first glance, vacant retail space in this area offered at a substantial discount may be attractive for conversion purposes, particularly if the online retailer wishes to use the facility as a “last mile” or “last touch” outpost. Considering this geographic area’s proximity to Palo Alto and Mountain View (where Google’s headquarters is located) there certainly appears to be implicit demand.
MOODY’S ANALYTICS COVID-19 AND THE CONVERGENCE OF RETAIL AND INDUSTRIAL 8
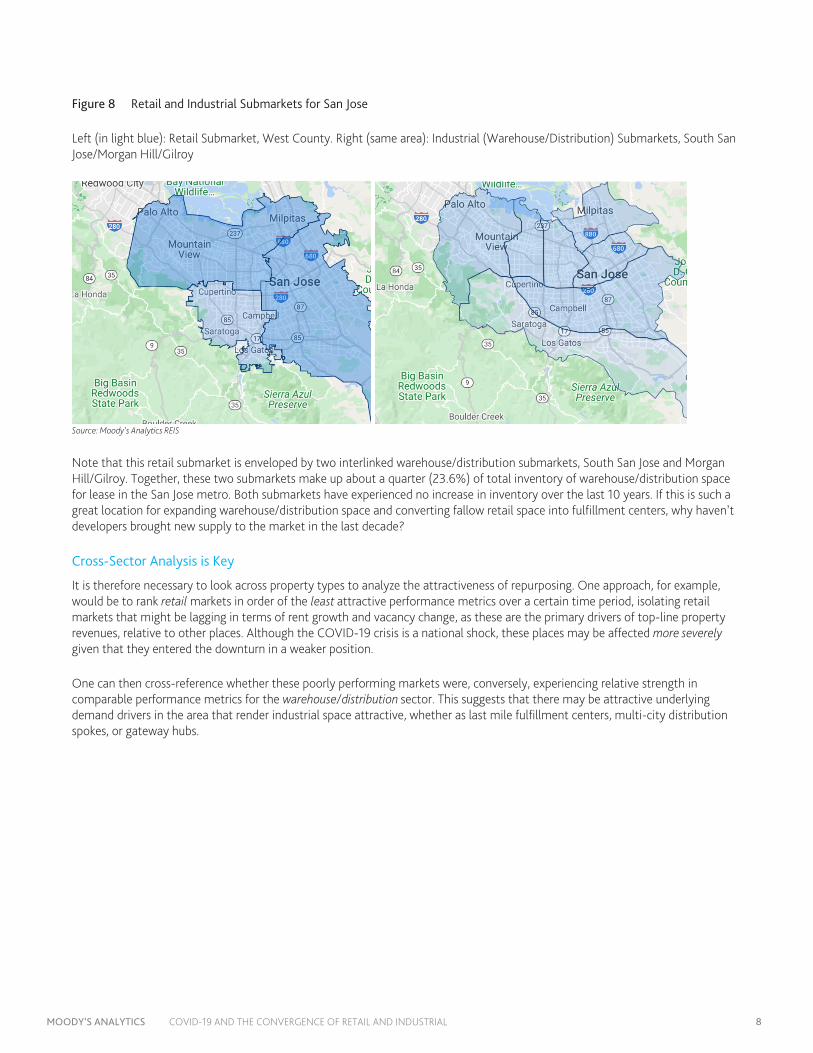
Figure 8 Retail and Industrial Submarkets for San Jose
Left (in light blue): Retail Submarket, West County. Right (same area): Industrial (Warehouse/Distribution) Submarkets, South San Jose/Morgan Hill/Gilroy
Source: Moody’s Analytics REIS
Note that this retail submarket is enveloped by two interlinked warehouse/distribution submarkets, South San Jose and Morgan Hill/Gilroy. Together, these two submarkets make up about a quarter (23.6%) of total inventory of warehouse/distribution space for lease in the San Jose metro. Both submarkets have experienced no increase in inventory over the last 10 years. If this is such a great location for expanding warehouse/distribution space and converting fallow retail space into fulfillment centers, why haven’t developers brought new supply to the market in the last decade?
Cross-Sector Analysis is Key
It is therefore necessary to look across property types to analyze the attractiveness of repurposing. One approach, for example, would be to rank retail markets in order of the least attractive performance metrics over a certain time period, isolating retail markets that might be lagging in terms of rent growth and vacancy change, as these are the primary drivers of top-line property revenues, relative to other places. Although the COVID-19 crisis is a national shock, these places may be affected more severely given that they entered the downturn in a weaker position.
One can then cross-reference whether these poorly performing markets were, conversely, experiencing relative strength in comparable performance metrics for the warehouse/distribution sector. This suggests that there may be attractive underlying demand drivers in the area that render industrial space attractive, whether as last mile fulfillment centers, multi-city distribution spokes, or gateway hubs.

MOODY’S ANALYTICS COVID-19 AND THE CONVERGENCE OF RETAIL AND INDUSTRIAL 9
In Figure 9 we calculate the change in effective revenues PSF (effective rents per square foot multiplied by the occupancy rate) for both retail and industrial sectors over the five-year period from 2014 to 2019 (“pre-COVID”). The five markets shown had retail sectors that performed relatively poorly—note how they are ranked near the bottom across Moody’s Analytics REIS’s top 80 retail markets. Conversely, these same markets had industrial sectors that performed relatively well (ranked by effective revenue growth from 2014-2019 in the top 40 or higher, across 107 industrial markets).
Figure 9 Cross-Sector Performance Comparisons
MSA RETAIL EFFECTIVE REVENUE
CHANGE (2014-2019) RETAIL RANK
(OUT OF 80 MARKETS) INDUSTRIAL EFFECTIVE
REVENUE CHANGE (2014-2019)
INDUSTRIAL RANK (OUT OF 107
MARKETS)
INDUSTRIAL INVENTORY CHANGE
(2014-2019) Central New Jersey 1.6% 78 20.4% 15 11.5% Northern New Jersey 2.0% 75 19.3% 19 3.1% Long Island 3.3% 69 13.8% 35 0.3% Memphis 3.4% 68 13.1% 40 7.1% Detroit 4.2% 64 17.6% 25 2.2% US Average 8.6% 17.7% 9.7% Source: Moody’s Analytics REIS
Even for this analysis one needs to be nuanced. Central New Jersey and Northern New Jersey are both near the top of the list for warehouse/distribution performance metrics, but inventory growth in Northern New Jersey is less than a third that of Central New Jersey, likely because of increasing land and building costs as one approaches the vicinity of New York City. Long Island retail has not been performing well—but neither are developers in a rush to build new warehouse space in the area, with inventory growing by only 0.3%. The same assessment applies to Detroit.
The two markets that stand out in this quick analysis are Central New Jersey and Memphis, given their lagging retail performance, comparably strong industrial performance, and a record of developers favoring both areas. The next step would be to analyze submarkets within these markets and check for variables like proximity to highways, potential saturation from overbuilding (have developers built too much?) and site-specific variables. But that is beyond the scope of this paper.
For now, let us turn to the case of another type of retail tenant that (a) has significant presence across the country (several hundred locations); (b) filed for bankruptcy because of the COVID-19 crisis, and; (c) faces an uncertain future given its business model. And yet, despite all these considerations – these retail tenants likely occupy retail space that is not a good candidate for repurposing into industrial use.
Gold’s Gym
Gold’s Gym was founded in Venice Beach, California in 1965 and rode the wave of the “golden age” of bodybuilding in the 1970s that launched the career of Arnold Schwarzenegger, who served as California’s governor from 2003 to 2011. Over the next three decades it rode the rise of the fitness wave in the US. However, Gold’s Gym filed for Chapter 11 bankruptcy protection in early May, stating that “no single factor has caused more harm to our business than the current COVID-19 global pandemic.”19
Gold’s Gym runs about 400 locations in the US, spread across many states. From the point of view of reopening, the heat map in Figure 10 suggests caution, given that a large proportion of Gold’s Gym locations are in states with still-high COVID-19 prevalence. For example, although Gold’s Gym locations in leased retail stores are spread across 27 states, California, Texas, and Florida locations account for 38.8% of the total figure.
19 https://www.goldsgym.com/blog/restructure-official-company-statement/

MOODY’S ANALYTICS COVID-19 AND THE CONVERGENCE OF RETAIL AND INDUSTRIAL 10
Figure 10 Gold’s Gym Locations in Retail Properties
Source: Gold’s Gym; Moody’s Analytics REIS; Center for Disease Control & Prevention
The central business model of gyms is based on the premise that subscribers will pay for the experience of working out and attending classes in physical locations. This model has been thrown into disarray by the pandemic. But there are two fundamental differences between retail locations occupied by a gym like Gold’s and those occupied by JCPenney and Sears.
1. Gyms tend to serve local populations, frequented by residents in the neighborhood. As such, 75% of retail space leased by Gold’s Gym is located in neighborhood and community centers—not in regional malls.
2. The average space occupied by a gym like Gold’s (30,000 SF) is much smaller than that occupied by JCPenney (143,200 SF) and Sears (152,600 SF) locations.
It is therefore less likely that space occupied by a retail tenant like Gold’s Gym would be attractive for conversion into fulfillment centers for industrial use. As discussed earlier, neighborhood and community centers tend to be located deeper within suburban communities, rendering them less attractive for easy ingress and egress of large delivery trucks as well as further from urban concentrations of end customers.20 In any case, Gold’s Gym does not look like it will cease operations, as German fitness chain RSG acquired it for $100 million during a bankruptcy auction in mid-July.21 We discuss the example of Gold’s Gym in this paper to reinforce one central point: Just because retail space has gone vacant does not automatically make it a good candidate for repurposing for industrial space.
Conclusions: Supply Chain Logistics Will Be the Ultimate Driver
This paper provided evidence that there will be increased demand for warehouse/distribution space in the future, kicked into overdrive by the COVID-19 crisis and already manifesting in pre-COVID versus second quarter 2020 construction figures. The complete tear-down and rebuild route poses financial and institutional constraints that render it an unattractive option for both developers and operators of warehouse/distribution space, and for online retailers that might consider owning and operating their own buildings rather than leasing.
The talk therefore is of repurposing existing retail space that may be vacated by brick-and-mortar stores whose business models have been disrupted significantly. However, just because retail space has gone vacant or remained fallow does not mean that it is automatically a good candidate for repurposing into industrial space. The ultimate driver of whether and how retail space will be repurposed is supply chain logistics. There are two major, intertwined issues to consider here.
20 There is, of course, an ongoing discussion of whether urban areas that were the traditional target markets of “last mile distribution centers” might lose their appeal to households because of the pandemic. We speculate on population movements and the possible effect on urban centers in papers on multifamily and office, available upon request. “Idiosyncratic Shocks and Multifamily Housing: Covid-19 and What We Can Learn from Earthquakes, Hurricanes, and Terrorism” (March 26, 2020) and “COVID-19 Will Force the Office Sector to Evolve (Further): Transformation and Impact Will Vary By Industry and Geography” (May 4, 2020).
21 https://www.wsj.com/articles/german-fitness-chain-rsg-wins-golds-gym-bankruptcy-auction-11594752200

MOODY’S ANALYTICS COVID-19 AND THE CONVERGENCE OF RETAIL AND INDUSTRIAL 11
1. Will Retail Space Be Repurposed? Form (and Space Needs) Follows Function. What exactly will the space be used for? Will the facility be used as “last touch” (the last stop before a product is delivered to the end user) or “in city” (within or close to urban locations with levels of demand that justify the operation of a fulfillment center)? In these cases the space required may be less large, between 100,000 to 150,000 SF on average.
Will the facility be used to service multiple markets (“multi-market”) or for gateway hubs (“gateway”) that receive and forward goods from other centers or from abroad to other distribution centers? For these, with average space needs of between 300,000 to 400,000 SF for multi-market and gateway use, only the largest JCPenney and Sears locations will suffice.22 Space typically occupied by Gold’s Gym facilities, located in neighborhood and community centers that are typically in suburban residential locations, are likely too small or not close enough to ports, highway systems, or urban areas to justify repurposing.
2. Will Retail Space be Repurposed for Industrial Use? Or for Other Uses? If the economics justify retail space repurposing, the overall ecology of the location will still determine its final use. For example, the entire push for last mile fulfillment centers is driven by the need to locate much closer to a critical mass of the end customer base, usually in dense urban areas. As online retailers use faster delivery times as a competitive edge, narrowing the distance between source and destination is key. So why is it “last mile” and not “last half mile” or “zero miles”? Because occupancy costs and negative externalities like congestion rise significantly within cities: there is a trade-off between warehousing space costs and proximity to customers.
Therefore, even if retail tenants give up major blocks of space within cities, these spaces may be repurposed for other uses—but it might not be for industrial. Amazon purchased the Lord & Taylor building, located in the heart of midtown Manhattan, from WeWork for $1.15 billion in late March 202023 but chose not to repurpose that space as a fulfillment center. It would be challenging to drive 18-wheeler transport and delivery trucks between Fifth and Sixth Avenues and 38th and 39th Streets! Instead, the firm announced that it would use the Lord & Taylor’s flagship store space as office space for approximately 2,000 workers.24 In a rebuke to overly pessimistic attitudes about the future of the office sector given remote working, Amazon believes that that specific retail space is best used for its office workers.
Location-specific factors along with intended use will therefore be the final determinants of whether specific blocks of fallow retail space will be repurposed for industrial use, given particular firms’ strategies.
A full discussion of how supply chain logistics have evolved in response to e-commerce, and how they are likely to change because of the global pandemic, is beyond the scope of this paper. Moody’s Analytics REIS will continue to survey both the retail and industrial sectors, and monitor the state of repurposing—carefully identifying which properties (or parts of them) have been converted for uses other than what they were traditionally leased for—as we make our way through the COVID-19 crisis. Moody's Analytics REIS projects that approximately 135 million SF of vacant space may become available in regional malls over the next five years. Not all of this space will be a good candidate for repurposing, for the reasons discussed in this paper, but forecasted demand for warehouse/distribution space far outstrips this figure, with almost 400 million SF of warehouse/distribution space projected to come online through 2024. The repurposing discussion is therefore likely to remain an important topic for the commercial real estate space over the next decade.
22 See Exhibit 10 in this piece for average sizes of space devoted for “last touch,” “in city,” “multi-market,” and “gateway” uses:
https://www.prologis.com/about/logistics-industry-research/the-modern-supply-chain 23 https://therealdeal.com/2020/03/12/amazon-buying-lord-taylor-building-for-1-1b/ 24 https://commercialobserver.com/2020/08/what-amazons-lord-taylor-move-means-for-nyc-and-office-work/

MOODY’S ANALYTICS COVID-19 AND THE CONVERGENCE OF RETAIL AND INDUSTRIAL BX1508
© 2020 Moody’s Corporation, Moody’s Investors Service, Inc., Moody’s Analytics, Inc. and/or their licensors and affiliates (collectively, “MOODY’S”). All rights reserved.
CREDIT RATINGS ISSUED BY MOODY'S INVESTORS SERVICE, INC. AND/OR ITS CREDIT RATINGS AFFILIATES ARE MOODY’S CURRENT OPINIONS OF THE RELATIVE FUTURE CREDIT RISK OF ENTITIES, CREDIT COMMITMENTS, OR DEBT OR DEBT-LIKE SECURITIES, AND MATERIALS, PRODUCTS, SERVICES AND INFORMATION PUBLISHED BY MOODY’S (COLLECTIVELY, “PUBLICATIONS”) MAY INCLUDE SUCH CURRENT OPINIONS. MOODY’S INVESTORS SERVICE DEFINES CREDIT RISK AS THE RISK THAT AN ENTITY MAY NOT MEET ITS CONTRACTUAL FINANCIAL OBLIGATIONS AS THEY COME DUE AND ANY ESTIMATED FINANCIAL LOSS IN THE EVENT OF DEFAULT OR IMPAIRMENT. SEE MOODY’S RATING SYMBOLS AND DEFINITIONS PUBLICATION FOR INFORMATION ON THE TYPES OF CONTRACTUAL FINANCIAL OBLIGATIONS ADDRESSED BY MOODY’S INVESTORS SERVICE CREDIT RATINGS. CREDIT RATINGS DO NOT ADDRESS ANY OTHER RISK, INCLUDING BUT NOT LIMITED TO: LIQUIDITY RISK, MARKET VALUE RISK, OR PRICE VOLATILITY. CREDIT RATINGS, NON-CREDIT ASSESSMENTS (“ASSESSMENTS”), AND OTHER OPINIONS INCLUDED IN MOODY’S PUBLICATIONS ARE NOT STATEMENTS OF CURRENT OR HISTORICAL FACT. MOODY’S PUBLICATIONS MAY ALSO INCLUDE QUANTITATIVE MODEL-BASED ESTIMATES OF CREDIT RISK AND RELATED OPINIONS OR COMMENTARY PUBLISHED BY MOODY’S ANALYTICS, INC. AND/OR ITS AFFILIATES. MOODY’S CREDIT RATINGS, ASSESSMENTS, OTHER OPINIONS AND PUBLICATIONS DO NOT CONSTITUTE OR PROVIDE INVESTMENT OR FINANCIAL ADVICE, AND MOODY’S CREDIT RATINGS, ASSESSMENTS, OTHER OPINIONS AND PUBLICATIONS ARE NOT AND DO NOT PROVIDE RECOMMENDATIONS TO PURCHASE, SELL, OR HOLD PARTICULAR SECURITIES. MOODY’S CREDIT RATINGS, ASSESSMENTS, OTHER OPINIONS AND PUBLICATIONS DO NOT COMMENT ON THE SUITABILITY OF AN INVESTMENT FOR ANY PARTICULAR INVESTOR. MOODY’S ISSUES ITS CREDIT RATINGS, ASSESSMENTS AND OTHER OPINIONS AND PUBLISHES ITS PUBLICATIONS WITH THE EXPECTATION AND UNDERSTANDING THAT EACH INVESTOR WILL, WITH DUE CARE, MAKE ITS OWN STUDY AND EVALUATION OF EACH SECURITY THAT IS UNDER CONSIDERATION FOR PURCHASE, HOLDING, OR SALE.
MOODY’S CREDIT RATINGS, ASSESSMENTS, OTHER OPINIONS, AND PUBLICATIONS ARE NOT INTENDED FOR USE BY RETAIL INVESTORS AND IT WOULD BE RECKLESS AND INAPPROPRIATE FOR RETAIL INVESTORS TO USE MOODY’S CREDIT RATINGS, ASSESSMENTS, OTHER OPINIONS OR PUBLICATIONS WHEN MAKING AN INVESTMENT DECISION. IF IN DOUBT YOU SHOULD CONTACT YOUR FINANCIAL OR OTHER PROFESSIONAL ADVISER.
ALL INFORMATION CONTAINED HEREIN IS PROTECTED BY LAW, INCLUDING BUT NOT LIMITED TO, COPYRIGHT LAW, AND NONE OF SUCH INFORMATION MAY BE COPIED OR OTHERWISE REPRODUCED, REPACKAGED, FURTHER TRANSMITTED, TRANSFERRED, DISSEMINATED, REDISTRIBUTED OR RESOLD, OR STORED FOR SUBSEQUENT USE FOR ANY SUCH PURPOSE, IN WHOLE OR IN PART, IN ANY FORM OR MANNER OR BY ANY MEANS WHATSOEVER, BY ANY PERSON WITHOUT MOODY’S PRIOR WRITTEN CONSENT.
MOODY’S CREDIT RATINGS, ASSESSMENTS, OTHER OPINIONS AND PUBLICATIONS ARE NOT INTENDED FOR USE BY ANY PERSON AS A BENCHMARK AS THAT TERM IS DEFINED FOR REGULATORY PURPOSES AND MUST NOT BE USED IN ANY WAY THAT COULD RESULT IN THEM BEING CONSIDERED A BENCHMARK.
All information contained herein is obtained by MOODY’S from sources believed by it to be accurate and reliable. Because of the possibility of human or mechanical error as well as other factors, however, all information contained herein is provided “AS IS” without warranty of any kind. MOODY'S adopts all necessary measures so that the information it uses in assigning a credit rating is of sufficient quality and from sources MOODY'S considers to be reliable including, when appropriate, independent third-party sources. However, MOODY’S is not an auditor and cannot in every instance independently verify or validate information received in the rating process or in preparing its Publications.
To the extent permitted by law, MOODY’S and its directors, officers, employees, agents, representatives, licensors and suppliers disclaim liability to any person or entity for any indirect, special, consequential, or incidental losses or damages whatsoever arising from or in connection with the information contained herein or the use of or inability to use any such information, even if MOODY’S or any of its directors, officers, employees, agents, representatives, licensors or suppliers is advised in advance of the possibility of such losses or damages, including but not limited to: (a) any loss of present or prospective profits or (b) any loss or damage arising where the relevant financial instrument is not the subject of a particular credit rating assigned by MOODY’S.
To the extent permitted by law, MOODY’S and its directors, officers, employees, agents, representatives, licensors and suppliers disclaim liability for any direct or compensatory losses or damages caused to any person or entity, including but not limited to by any negligence (but excluding fraud, willful misconduct or any other type of liability that, for the avoidance of doubt, by law cannot be excluded) on the part of, or any contingency within or beyond the control of, MOODY’S or any of its directors, officers, employees, agents, representatives, licensors or suppliers, arising from or in connection with the information contained herein or the use of or inability to use any such information.
NO WARRANTY, EXPRESS OR IMPLIED, AS TO THE ACCURACY, TIMELINESS, COMPLETENESS, MERCHANTABILITY OR FITNESS FOR ANY PARTICULAR PURPOSE OF ANY CREDIT RATING, ASSESSMENT, OTHER OPINION OR INFORMATION IS GIVEN OR MADE BY MOODY’S IN ANY FORM OR MANNER WHATSOEVER.
Moody’s Investors Service, Inc., a wholly-owned credit rating agency subsidiary of Moody’s Corporation (“MCO”), hereby discloses that most issuers of debt securities (including corporate and municipal bonds, debentures, notes and commercial paper) and preferred stock rated by Moody’s Investors Service, Inc. have, prior to assignment of any credit rating, agreed to pay to Moody’s Investors Service, Inc. for credit ratings opinions and services rendered by it fees ranging from $1,000 to approximately $2,700,000. MCO and Moody’s investors Service also maintain policies and procedures to address the independence of Moody’s Investors Service credit ratings and credit rating processes. Information regarding certain affiliations that may exist between directors of MCO and rated entities, and between entities who hold credit ratings from Moody’s Investors Service and have also publicly reported to the SEC an ownership interest in MCO of more than 5%, is posted annually at www.moodys.com under the heading “Investor Relations — Corporate Governance — Director and Shareholder Affiliation Policy.”
Additional terms for Australia only: Any publication into Australia of this document is pursuant to the Australian Financial Services License of MOODY’S affiliate, Moody’s Investors Service Pty Limited ABN 61 003 399 657AFSL 336969 and/or Moody’s Analytics Australia Pty Ltd ABN 94 105 136 972 AFSL 383569 (as applicable). This document is intended to be provided only to “wholesale clients” within the meaning of section 761G of the Corporations Act 2001. By continuing to access this document from within Australia, you represent to MOODY’S that you are, or are accessing the document as a representative of, a “wholesale client” and that neither you nor the entity you represent will directly or indirectly disseminate this document or its contents to “retail clients” within the meaning of section 761G of the Corporations Act 2001. MOODY’S credit rating is an opinion as to the creditworthiness of a debt obligation of the issuer, not on the equity securities of the issuer or any form of security that is available to retail investors.
Additional terms for Japan only: Moody's Japan K.K. (“MJKK”) is a wholly-owned credit rating agency subsidiary of Moody's Group Japan G.K., which is wholly-owned by Moody’s Overseas Holdings Inc., a wholly-owned subsidiary of MCO. Moody’s SF Japan K.K. (“MSFJ”) is a wholly-owned credit rating agency subsidiary of MJKK. MSFJ is not a Nationally Recognized Statistical Rating Organization (“NRSRO”). Therefore, credit ratings assigned by MSFJ are Non-NRSRO Credit Ratings. Non-NRSRO Credit Ratings are assigned by an entity that is not a NRSRO and, consequently, the rated obligation will not qualify for certain types of treatment under U.S. laws. MJKK and MSFJ are credit rating agencies registered with the Japan Financial Services Agency and their registration numbers are FSA Commissioner (Ratings) No. 2 and 3 respectively.
MJKK or MSFJ (as applicable) hereby disclose that most issuers of debt securities (including corporate and municipal bonds, debentures, notes and commercial paper) and preferred stock rated by MJKK or MSFJ (as applicable) have, prior to assignment of any credit rating, agreed to pay to MJKK or MSFJ (as applicable) for credit ratings opinions and services rendered by it fees ranging from JPY125,000 to approximately JPY250,000,000.
MJKK and MSFJ also maintain policies and procedures to address Japanese regulatory requirements.