Embed Size (px)
Citation preview

RESEARCH Open Access
Coverage and equity in reproductive andmaternal health interventions in Brazil:impressive progress following theimplementation of the Unified HealthSystemGiovanny V. A. França†, María Clara Restrepo-Méndez†, Maria Fátima S. Maia, Cesar G. Victoraand Aluísio J. D. Barros*
Abstract
Background: The Brazilian SUS (Unified Health System) was created in 1988 within the new constitution, based onthe premises of being universal, comprehensive, and equitable. The SUS offers free health care, independent ofcontribution or affiliation. Since then, great efforts and increasing investments have been made for the system toachieve its goals. We assessed how coverage and equity in selected reproductive and maternal interventionsprogressed in Brazil from 1986 to 2013.
Methods: We reanalysed data from four national health surveys carried out in Brazil in 1986, 1996, 2006 and 2013.We estimated coverage for six interventions [use of modern contraceptives; antenatal care (ANC) 1+ visits by anyprovider; ANC 4+ visits by any provider; first ANC visit during the first trimester of pregnancy; institutional delivery;and Caesarean sections] using standard international definitions, and stratified results by wealth quintile, urban orrural residence and country regions. We also calculated two inequality indicators: the slope index of inequality (SII)and the concentration index (CIX).
Results: All indicators showed steady increases in coverage over time. ANC 1+ and 4+ and institutional deliveryreached coverage above 90 % in 2013. Prevalence of use of modern contraceptives was 83 % in 2013, indicatingnearly universal satisfaction of need for contraception. On a less positive note, the proportion of C-sections has alsogrown continuously, reaching 55 % in 2013. There were marked reductions in wealth inequalities for all preventiveinterventions. Inequalities were significantly reduced for all indicators except for the C-section rate (p = 0.06),particularly in absolute terms (SII).
Conclusions: Despite the difficulties faced in the implementation of SUS, coverage of essential interventionsincreased and equity has improved dramatically, due in most cases to marked increase in coverage among thepoorest 40 %. An increase in unnecessary Caesarean sections was also observed during the period. Furtherevaluation on the quality of healthcare provided is needed.
Keywords: Maternal health, Health inequalities, Socioeconomic factors, Brazil
* Correspondence: [email protected]†Equal contributorsInternational Center for Equity in Health, Federal University of Pelotas, RuaMarechal Deodoro, 1160 3° Piso, 96020-220 Pelotas, RS, Brazil
© The Author(s). 2016 Open Access This article is distributed under the terms of the Creative Commons Attribution 4.0International License (http://creativecommons.org/licenses/by/4.0/), which permits unrestricted use, distribution, andreproduction in any medium, provided you give appropriate credit to the original author(s) and the source, provide a link tothe Creative Commons license, and indicate if changes were made. The Creative Commons Public Domain Dedication waiver(http://creativecommons.org/publicdomain/zero/1.0/) applies to the data made available in this article, unless otherwise stated.
França et al. International Journal for Equity in Health (2016) 15:149 DOI 10.1186/s12939-016-0445-2

BackgroundSocial inequalities are still a major problem in LatinAmerica in spite of recent economic growth [1, 2].Health inequalities are also a leading health problemin the region [1–3]. In response to these challenges,substantial increases in public funding for social pro-grammes and the adoption of relevant policies andstrategic health-related initiatives took place in the re-gion over the past few decades [3, 4]. Brazil providesan example of a distinct approach to health-systemreform, combining poverty reduction strategies withthe expansion of comprehensive primary health careservices [5, 6]. Hence, lessons from the Brazilianexperience are relevant for countries advancing inuniversal health coverage.The health sector reform in Brazil is unique because it
was driven by civil society rather than by governments,political parties, or international organizations [5, 7]. Itwas designed by militants of the so-called SanitaryMovement nearly a decade before health care was incor-porated in the 1998 Constitution as a citizen’s right andState’s duty [7–9]. In the 1990’s health sector reform wasinstitutionalised with the creation of a national UnifiedHealth System (SUS, Sistema Único de Saúde), based onthe principles of universality, equity, integrality andsocial participation [5, 8].Since then, the SUS became a driving force for
equalizing access to services by offering free andcomprehensive health care for all, independent ofcontribution or affiliation [5, 9]. Other advances dur-ing the past 20 years included investments in humanresources, primary care, science and technology,decentralization, widespread social participation, andgrowing public awareness of a right to health care.Among the many programs and policies put in placesince the inception of SUS, two are of major import-ance. First, the Family Health Program changed thestructure of traditional primary health care centres,adding community health workers and defining catch-ment areas for facilities. The program was targeted atthe poorest, under-served urban neighbourhoods andrural areas [10]. Later, the Programa Bolsa Família, aconditional cash transfer program, unified several so-cial benefit initiatives in one large program designedto provide extra cash to the poorest families in thecountry, conditional on use of health services by chil-dren and on regular school attendance. The programwas successful in reducing income inequality [11],contributing to a significant decrease in childhoodmortality, especially from poverty-related causes suchas malnutrition and diarrhea [12]. In parallel, thecountry went through a period of rapid economicchanges, with the control of hyperinflation in 1994,and strong economic growth between 2004 and 2011.
Despite criticisms regarding underfunding and poormanagement of the SUS, as well as of the unequal distri-bution of power and resources, [8] there is mountingevidence that health inequalities in Brazil have beensteadily declining [5]. Since 1990’s, Brazil has increasedintervention coverage in maternal and child interven-tions, reduced inequalities in terms of under-5 mortalityand practically eliminated inequalities in stunting [2].However, it is worth noting that most of this evidence isbased on the Brazilian household survey conducted in2006, and therefore, no reliable population-based dataon maternal and child health has been available for thelast 9 years. In this article, we describe how coverageand inequalities in reproductive and maternal healthinterventions evolved over time, based on the analysesof four national household surveys carried out from1986 to 2013, covering a period of nearly three decades.
MethodsStudy design and data sourcesThe International Centre for Equity in Health (ICEH,www.equidade.org) monitors equity in health andnutrition by reanalysing population-based surveys,especially the Demographic and Health Surveys(DHS) and Multiple Indicator Cluster Surveys(MICS). Our analyses relied on data from the follow-ing national surveys carried out in Brazil: Demo-graphic Health Surveys – 1986 [13] and 1996 [14];Pesquisa Nacional de Demografia e Saúde (PNDS), asurvey similar to DHS carried out in 2006, fundedby the Ministry of Health [15]; and the NationalHealth Survey (PNS) carried out in 2013 by theBrazilian Statistics Office (IBGE) and the OswaldoCruz Foundation [16].
Selection of indicatorsOut of a set of 80 reproductive, maternal, newborn andchild health (RMNCH) indicators routinely calculated bythe ICEH, data were available for six reproductive andmaternal interventions for at least three out of the foursurveys under study. We applied the following definitions:
� Use of modern contraceptives: percentage of womenage 15–49 years currently married or in union whoare using (or whose partner is using) a moderncontraceptive method;
� Antenatal care 1+ visits (ANC 1+): percentage ofwomen aged 15–49 with a live birth in the surveyreference period who had one or more ANC-relatedvisits during pregnancy, by any provider;
� Antenatal care 4+ visits (ANC 4+): percentage ofwomen aged 15–49 with a live birth in the surveyreference period who had four or more ANC-relatedvisits during pregnancy, by any provider;
França et al. International Journal for Equity in Health (2016) 15:149 Page 2 of 12

� First ANC visit during the first trimester ofpregnancy: percentage of women aged 15–49 with alive birth in the survey reference period whounderwent the first prenatal visit during the firsttrimester of pregnancy;
� Institutional delivery: percentage of live births whichtook place in a health facility;
� C-sections rate: percentage of live births deliveredby Caesarean section.
Survey reference periods included births in the past5 years in the first three surveys, and in the past 2 yearsfor the 2013 survey.
Data analysesAll analyses were carried out in Stata (StataCorp. 2013.Stata Statistical Software: Release 13. College Station,TX: StataCorp LP), taking into account the surveydesign, including sampling weights and clustering. Allpoint estimates of coverage and inequality indices werecalculated with standard errors, based on the original
data sets. Indicators were disaggregated by householdwealth quintiles based on asset indices, urban and ruralresidence and country region. Asset indices [17] werecalculated by the DHS team for the 1996 survey; for theother three surveys, we used similar methods to deriveasset indices using principal component analyses basedon household goods, characteristics of the house andavailable infrastructure, such as types of water accessand sanitation facilities. Asset indices were grouped intoquintiles, with Q1 representing the poorest and Q5 thewealthiest 20 % of households.
Measures of inequalitiesWe calculated two inequality indicators that take thewhole distribution of wealth into account: the slopeindex of inequality (SII) and the concentration index(CIX). The SII expresses the absolute difference in per-centage points between the projected coverage for thetop and the bottom of the wealth distribution, [18] usinga logistic regression model. The CIX is based on conceptsimilar to the Gini index for income concentration,
Fig. 1 National coverage of six reproductive and maternal interventions, Brazil, from 1986 to 2013. Source: Brazil DHS 1986, DHS 1996, PNDS 2006,PNS 2013
França et al. International Journal for Equity in Health (2016) 15:149 Page 3 of 12

being expressed on a scale from −100 to +100, with zerorepresenting equal distribution of the attribute acrossthe wealth scale. Positive CIX values represent a pro-richdistribution, usually observed for health coverage indica-tors. The SII expresses absolute inequality, whereas theCIX expresses relative inequality [18, 19].
Time trendsVariance-weighted least squares regression was used toestimate the average absolute annual change in coverageand in inequality measures taking into account the timeintervals between surveys, allowing tests of the statisticalsignificance of the observed trends. Survey year was usedas the independent variable in the time trend analyses.Annual changes were estimated at the national level, forthe poorest (Q1) and richest (Q5) quintiles, and for CIXand SII. Absolute changes are expressed in percentagepoints per year. Results were omitted when the un-weighted number of observations in a specific subgroupwas less than 25.
EthicsWe used publicly available data from national surveysin our analyses. Ethical clearance was obtained by theinstitutions that carried out the surveys. Furtherinformation about the surveys and ethics can befound in their respective websites [20–23]. The PNSproject was approved by the National Commission ofEthics in Research (CONEP) in June 2013, RegulationNo. 328.159.
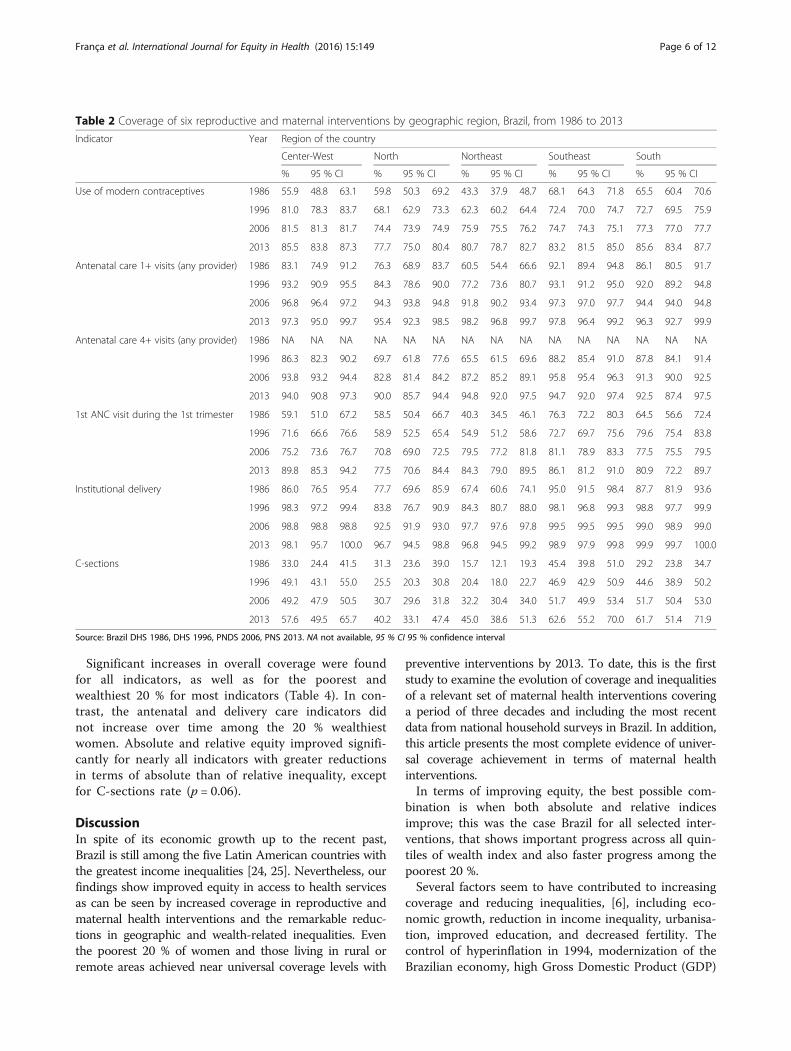
ResultsWe were able to calculate the selected indicators forall surveys, except for ANC 4+ visits in the 1986 sur-vey in which the number of visits was not recorded.Figure 1 shows the national coverage of the six inter-ventions (Table 1). All indicators showed steadyincrease in coverage over the years. ANC 1+ and 4+and institutional delivery reached coverage above90 % in 2013. Prevalence of use of modern contracep-tives was 83 % in 2013, what corresponds to 95 % of
Table 1 Coverage of six reproductive and maternal interventions by geographic region, Brazil, from 1986 to 2013
Indicator Year National Area of residence
Urban Rural
% 95 % CI % 95 % CI % 95 % CI
Use of modern contraceptives 1986 56.6 53.6 59.6 63.6 60.9 66.3 43.3 37.1 49.4
1996 70.3 68.9 71.7 72.6 71.2 74.1 61.2 57.8 64.6
2006 75.9 75.8 76.0 76.0 75.9 76.2 75.5 75.1 75.9
2013 82.6 81.6 83.6 83.0 81.9 84.0 80.3 77.6 82.9
Antenatal care 1+ visits (any provider) 1986 78.7 75.7 81.8 88.2 85.5 91.0 56.8 50.9 62.7
1996 87.5 85.9 89.1 92.0 90.7 93.2 72.0 66.9 77.0
2006 95.2 95.0 95.4 96.4 96.3 96.6 89.5 86.4 92.6
2013 97.4 96.5 98.4 97.4 96.3 98.5 97.5 95.7 99.3
Antenatal care 4+ visits (any provider) 1986 NA NA NA NA NA NA NA NA NA
1996 79.9 77.9 82.0 86.0 84.2 87.8 59.1 53.2 65.1
2006 91.7 91.4 92.0 93.5 93.3 93.7 83.4 80.1 86.8
2013 93.9 92.3 95.5 94.5 92.9 96.1 90.6 85.3 95.9
1st ANC visit during the 1st trimester 1986 59.1 55.8 62.5 69.2 65.7 72.8 35.9 31.0 40.7
1996 67.4 65.4 69.5 72.7 70.8 74.7 49.3 44.4 54.1
2006 78.9 78.2 79.6 79.6 78.7 80.4 75.8 74.1 77.5
2013 84.3 81.4 87.1 85.3 82.3 88.4 78.6 70.6 86.6
Institutional delivery 1986 81.2 77.7 84.8 92.0 89.8 94.2 59.8 53.4 66.1
1996 92.7 91.1 94.3 96.9 96.0 97.8 79.6 74.4 84.7
2006 98.1 98.1 98.2 98.7 98.7 98.7 95.8 95.6 96.1
2013 98.1 97.3 99.0 99.2 98.7 99.8 92.4 88.1 96.7
C-sections 1986 29.2 26.3 32.0 36.2 33.1 39.4 15.1 11.4 18.8
1996 36.4 34.2 38.7 41.8 39.2 44.3 20.1 16.3 23.9
2006 43.8 43.3 44.3 45.9 45.3 46.5 35.2 32.6 37.9
2013 54.7 50.7 58.7 58.2 53.8 62.6 36.0 28.0 44.0
Source: Brazil DHS 1986, DHS 1996, PNDS 2006, PNS 2013. NA not available, 95 % CI 95 % confidence interval
França et al. International Journal for Equity in Health (2016) 15:149 Page 4 of 12
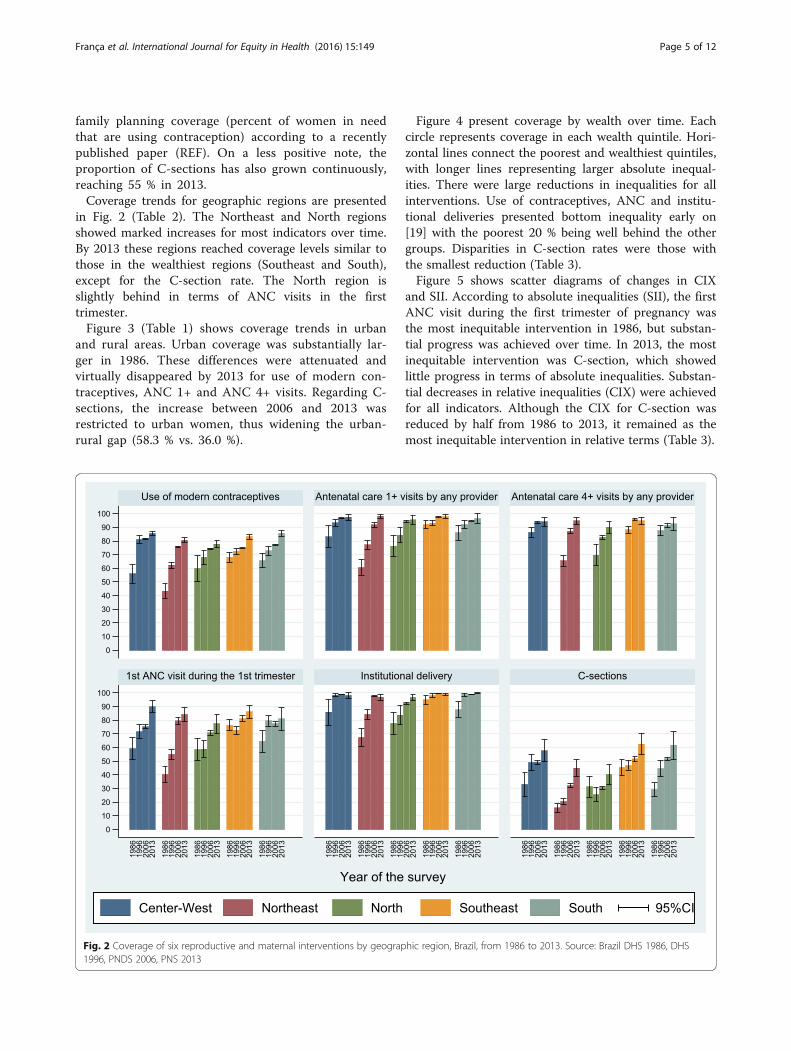
family planning coverage (percent of women in needthat are using contraception) according to a recentlypublished paper (REF). On a less positive note, theproportion of C-sections has also grown continuously,reaching 55 % in 2013.Coverage trends for geographic regions are presented
in Fig. 2 (Table 2). The Northeast and North regionsshowed marked increases for most indicators over time.By 2013 these regions reached coverage levels similar tothose in the wealthiest regions (Southeast and South),except for the C-section rate. The North region isslightly behind in terms of ANC visits in the firsttrimester.Figure 3 (Table 1) shows coverage trends in urban
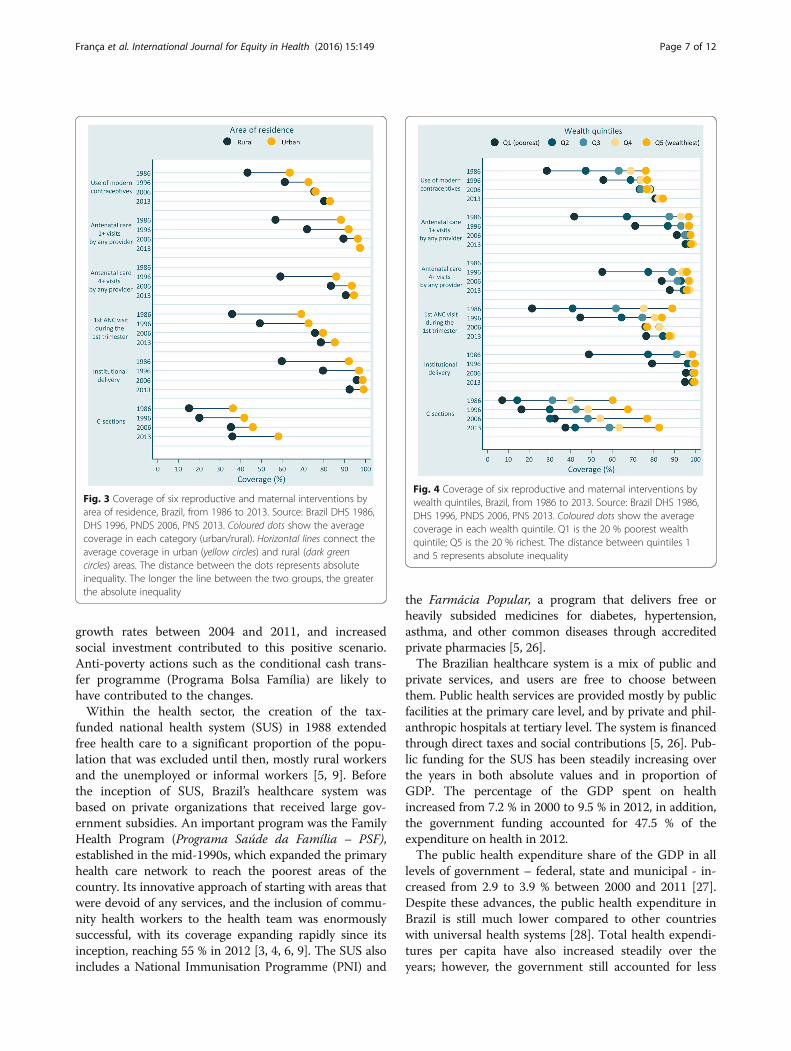
and rural areas. Urban coverage was substantially lar-ger in 1986. These differences were attenuated andvirtually disappeared by 2013 for use of modern con-traceptives, ANC 1+ and ANC 4+ visits. Regarding C-sections, the increase between 2006 and 2013 wasrestricted to urban women, thus widening the urban-rural gap (58.3 % vs. 36.0 %).
Figure 4 present coverage by wealth over time. Eachcircle represents coverage in each wealth quintile. Hori-zontal lines connect the poorest and wealthiest quintiles,with longer lines representing larger absolute inequal-ities. There were large reductions in inequalities for allinterventions. Use of contraceptives, ANC and institu-tional deliveries presented bottom inequality early on[19] with the poorest 20 % being well behind the othergroups. Disparities in C-section rates were those withthe smallest reduction (Table 3).Figure 5 shows scatter diagrams of changes in CIX
and SII. According to absolute inequalities (SII), the firstANC visit during the first trimester of pregnancy wasthe most inequitable intervention in 1986, but substan-tial progress was achieved over time. In 2013, the mostinequitable intervention was C-section, which showedlittle progress in terms of absolute inequalities. Substan-tial decreases in relative inequalities (CIX) were achievedfor all indicators. Although the CIX for C-section wasreduced by half from 1986 to 2013, it remained as themost inequitable intervention in relative terms (Table 3).
Fig. 2 Coverage of six reproductive and maternal interventions by geographic region, Brazil, from 1986 to 2013. Source: Brazil DHS 1986, DHS1996, PNDS 2006, PNS 2013
França et al. International Journal for Equity in Health (2016) 15:149 Page 5 of 12
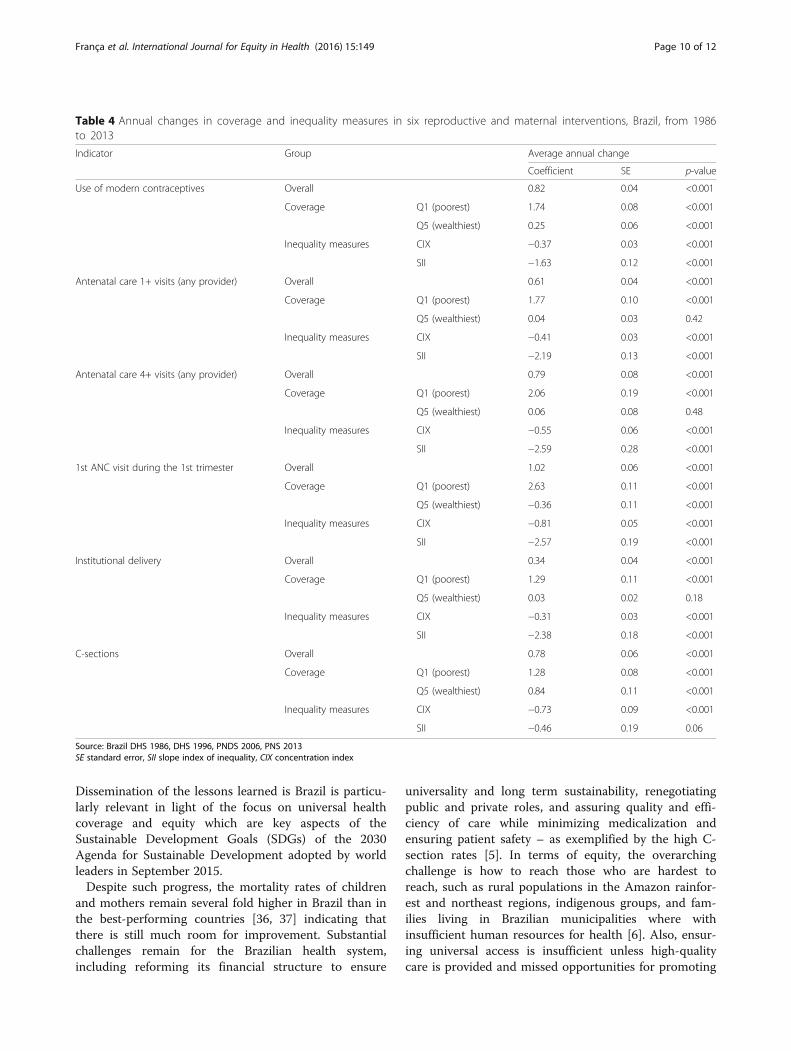
Significant increases in overall coverage were foundfor all indicators, as well as for the poorest andwealthiest 20 % for most indicators (Table 4). In con-trast, the antenatal and delivery care indicators didnot increase over time among the 20 % wealthiestwomen. Absolute and relative equity improved signifi-cantly for nearly all indicators with greater reductionsin terms of absolute than of relative inequality, exceptfor C-sections rate (p = 0.06).
DiscussionIn spite of its economic growth up to the recent past,Brazil is still among the five Latin American countries withthe greatest income inequalities [24, 25]. Nevertheless, ourfindings show improved equity in access to health servicesas can be seen by increased coverage in reproductive andmaternal health interventions and the remarkable reduc-tions in geographic and wealth-related inequalities. Eventhe poorest 20 % of women and those living in rural orremote areas achieved near universal coverage levels with
preventive interventions by 2013. To date, this is the firststudy to examine the evolution of coverage and inequalitiesof a relevant set of maternal health interventions coveringa period of three decades and including the most recentdata from national household surveys in Brazil. In addition,this article presents the most complete evidence of univer-sal coverage achievement in terms of maternal healthinterventions.In terms of improving equity, the best possible com-
bination is when both absolute and relative indicesimprove; this was the case Brazil for all selected inter-ventions, that shows important progress across all quin-tiles of wealth index and also faster progress among thepoorest 20 %.Several factors seem to have contributed to increasing
coverage and reducing inequalities, [6], including eco-nomic growth, reduction in income inequality, urbanisa-tion, improved education, and decreased fertility. Thecontrol of hyperinflation in 1994, modernization of theBrazilian economy, high Gross Domestic Product (GDP)
Table 2 Coverage of six reproductive and maternal interventions by geographic region, Brazil, from 1986 to 2013
Indicator Year Region of the country
Center-West North Northeast Southeast South
% 95 % CI % 95 % CI % 95 % CI % 95 % CI % 95 % CI
Use of modern contraceptives 1986 55.9 48.8 63.1 59.8 50.3 69.2 43.3 37.9 48.7 68.1 64.3 71.8 65.5 60.4 70.6
1996 81.0 78.3 83.7 68.1 62.9 73.3 62.3 60.2 64.4 72.4 70.0 74.7 72.7 69.5 75.9
2006 81.5 81.3 81.7 74.4 73.9 74.9 75.9 75.5 76.2 74.7 74.3 75.1 77.3 77.0 77.7
2013 85.5 83.8 87.3 77.7 75.0 80.4 80.7 78.7 82.7 83.2 81.5 85.0 85.6 83.4 87.7
Antenatal care 1+ visits (any provider) 1986 83.1 74.9 91.2 76.3 68.9 83.7 60.5 54.4 66.6 92.1 89.4 94.8 86.1 80.5 91.7
1996 93.2 90.9 95.5 84.3 78.6 90.0 77.2 73.6 80.7 93.1 91.2 95.0 92.0 89.2 94.8
2006 96.8 96.4 97.2 94.3 93.8 94.8 91.8 90.2 93.4 97.3 97.0 97.7 94.4 94.0 94.8
2013 97.3 95.0 99.7 95.4 92.3 98.5 98.2 96.8 99.7 97.8 96.4 99.2 96.3 92.7 99.9
Antenatal care 4+ visits (any provider) 1986 NA NA NA NA NA NA NA NA NA NA NA NA NA NA NA
1996 86.3 82.3 90.2 69.7 61.8 77.6 65.5 61.5 69.6 88.2 85.4 91.0 87.8 84.1 91.4
2006 93.8 93.2 94.4 82.8 81.4 84.2 87.2 85.2 89.1 95.8 95.4 96.3 91.3 90.0 92.5
2013 94.0 90.8 97.3 90.0 85.7 94.4 94.8 92.0 97.5 94.7 92.0 97.4 92.5 87.4 97.5
1st ANC visit during the 1st trimester 1986 59.1 51.0 67.2 58.5 50.4 66.7 40.3 34.5 46.1 76.3 72.2 80.3 64.5 56.6 72.4
1996 71.6 66.6 76.6 58.9 52.5 65.4 54.9 51.2 58.6 72.7 69.7 75.6 79.6 75.4 83.8
2006 75.2 73.6 76.7 70.8 69.0 72.5 79.5 77.2 81.8 81.1 78.9 83.3 77.5 75.5 79.5
2013 89.8 85.3 94.2 77.5 70.6 84.4 84.3 79.0 89.5 86.1 81.2 91.0 80.9 72.2 89.7
Institutional delivery 1986 86.0 76.5 95.4 77.7 69.6 85.9 67.4 60.6 74.1 95.0 91.5 98.4 87.7 81.9 93.6
1996 98.3 97.2 99.4 83.8 76.7 90.9 84.3 80.7 88.0 98.1 96.8 99.3 98.8 97.7 99.9
2006 98.8 98.8 98.8 92.5 91.9 93.0 97.7 97.6 97.8 99.5 99.5 99.5 99.0 98.9 99.0
2013 98.1 95.7 100.0 96.7 94.5 98.8 96.8 94.5 99.2 98.9 97.9 99.8 99.9 99.7 100.0
C-sections 1986 33.0 24.4 41.5 31.3 23.6 39.0 15.7 12.1 19.3 45.4 39.8 51.0 29.2 23.8 34.7
1996 49.1 43.1 55.0 25.5 20.3 30.8 20.4 18.0 22.7 46.9 42.9 50.9 44.6 38.9 50.2
2006 49.2 47.9 50.5 30.7 29.6 31.8 32.2 30.4 34.0 51.7 49.9 53.4 51.7 50.4 53.0
2013 57.6 49.5 65.7 40.2 33.1 47.4 45.0 38.6 51.3 62.6 55.2 70.0 61.7 51.4 71.9
Source: Brazil DHS 1986, DHS 1996, PNDS 2006, PNS 2013. NA not available, 95 % CI 95 % confidence interval
França et al. International Journal for Equity in Health (2016) 15:149 Page 6 of 12
growth rates between 2004 and 2011, and increasedsocial investment contributed to this positive scenario.Anti-poverty actions such as the conditional cash trans-fer programme (Programa Bolsa Família) are likely tohave contributed to the changes.Within the health sector, the creation of the tax-
funded national health system (SUS) in 1988 extendedfree health care to a significant proportion of the popu-lation that was excluded until then, mostly rural workersand the unemployed or informal workers [5, 9]. Beforethe inception of SUS, Brazil’s healthcare system wasbased on private organizations that received large gov-ernment subsidies. An important program was the FamilyHealth Program (Programa Saúde da Família – PSF),established in the mid-1990s, which expanded the primaryhealth care network to reach the poorest areas of thecountry. Its innovative approach of starting with areas thatwere devoid of any services, and the inclusion of commu-nity health workers to the health team was enormouslysuccessful, with its coverage expanding rapidly since itsinception, reaching 55 % in 2012 [3, 4, 6, 9]. The SUS alsoincludes a National Immunisation Programme (PNI) and
the Farmácia Popular, a program that delivers free orheavily subsided medicines for diabetes, hypertension,asthma, and other common diseases through accreditedprivate pharmacies [5, 26].The Brazilian healthcare system is a mix of public and
private services, and users are free to choose betweenthem. Public health services are provided mostly by publicfacilities at the primary care level, and by private and phil-anthropic hospitals at tertiary level. The system is financedthrough direct taxes and social contributions [5, 26]. Pub-lic funding for the SUS has been steadily increasing overthe years in both absolute values and in proportion ofGDP. The percentage of the GDP spent on healthincreased from 7.2 % in 2000 to 9.5 % in 2012, in addition,the government funding accounted for 47.5 % of theexpenditure on health in 2012.The public health expenditure share of the GDP in all
levels of government – federal, state and municipal - in-creased from 2.9 to 3.9 % between 2000 and 2011 [27].Despite these advances, the public health expenditure inBrazil is still much lower compared to other countrieswith universal health systems [28]. Total health expendi-tures per capita have also increased steadily over theyears; however, the government still accounted for less
Fig. 4 Coverage of six reproductive and maternal interventions bywealth quintiles, Brazil, from 1986 to 2013. Source: Brazil DHS 1986,DHS 1996, PNDS 2006, PNS 2013. Coloured dots show the averagecoverage in each wealth quintile. Q1 is the 20 % poorest wealthquintile; Q5 is the 20 % richest. The distance between quintiles 1and 5 represents absolute inequality
Fig. 3 Coverage of six reproductive and maternal interventions byarea of residence, Brazil, from 1986 to 2013. Source: Brazil DHS 1986,DHS 1996, PNDS 2006, PNS 2013. Coloured dots show the averagecoverage in each category (urban/rural). Horizontal lines connect theaverage coverage in urban (yellow circles) and rural (dark greencircles) areas. The distance between the dots represents absoluteinequality. The longer the line between the two groups, the greaterthe absolute inequality
França et al. International Journal for Equity in Health (2016) 15:149 Page 7 of 12

Table
3Coverageof
sixreprod
uctiveandmaternalinterventions
bywealth
quintiles
andmagnitude
ofineq
ualities,Brazil,fro
m1986
to2013
Indicator
Year
Wealth
quintiles
Ineq
ualitymeasures
Q1(poo
rest)
Q2
Q3
Q4
Q5(20%
riche
st)
CIX
SII
%IC95
%%
IC95
%%
IC95
%%
IC95
%%
IC95
%%
IC95
%%
IC95
%
Use
ofmod
erncontraceptives
1986
28.5
23.3
33.8
47.3
41.6
53.0
63.2
59.1
67.4
69.0
64.7
73.3
76.2
72.9
79.5
17.1
54.0
59.1
55.6
50.1
63.1
1996
55.8
52.8
58.7
68.9
66.2
71.7
73.6
71.0
76.3
73.8
71.2
76.5
76.8
74.1
79.5
5.3
69.2
71.3
22.3
65.9
74.7
2006
73.2
72.9
73.6
78.4
78.0
78.8
73.9
73.3
74.4
77.8
77.2
78.4
76.6
75.9
77.3
1.0
74.8
77.1
3.2
70.5
81.4
2013
80.9
78.8
83.0
82.3
80.1
84.5
82.3
79.9
84.8
82.3
79.9
84.6
84.6
82.6
86.5
0.8
81.9
83.3
3.9
79.3
85.9
Anten
atalcare
1+visits(any
provider)
1986
41.7
35.9
47.5
67.2
62.3
72.1
87.6
84.4
90.8
93.1
90.3
96.0
97.0
95.5
98.5
13.5
76.9
80.5
64.4
72.5
84.9
1996
71.1
67.2
75.1
86.9
84.2
89.5
93.2
91.1
95.3
96.5
94.5
98.5
97.0
95.5
98.6
6.7
86.4
88.6
36.6
81.4
93.5
2006
91.1
89.6
92.7
96.2
96.0
96.5
95.1
93.6
96.5
97.9
97.7
98.1
97.7
97.5
98.0
1.5
94.0
96.4
8.2
87.4
100.0
2013
95.4
92.9
97.8
97.2
94.5
99.9
98.6
97.5
99.7
99.0
97.7
100.0
98.0
96.5
99.6
0.7
96.8
98.0
4.5
93.2
100.0
Anten
atalcare
4+visits(any
provider)
1986
NA
NA
NA
NA
NA
NA
NA
NA
NA
NA
NA
NA
NA
NA
NA
NA
NA
NA
NA
NA
NA
1996
55.3
50.9
59.7
77.4
74.0
80.9
88.8
86.3
91.4
93.7
91.3
96.2
96.0
94.3
97.7
11.4
78.5
81.4
54.0
74.2
85.7
2006
83.8
81.8
85.9
93.1
92.5
93.8
91.5
89.8
93.2
97.5
97.3
97.7
96.9
96.5
97.3
3.1
90.1
93.2
17.0
82.5
100.0
2013
87.7
83.2
92.3
94.5
91.2
97.7
97.1
95.5
98.8
97.4
94.9
99.8
95.9
92.7
99.0
2.0
92.6
95.1
12.4
86.1
100.0
1stANCvisitdu
ringthe1sttrim
ester
1986
21.4
16.2
26.6
41.0
35.4
46.7
61.9
57.9
65.9
75.2
70.2
80.2
88.9
85.8
92.1
23.2
57.0
61.2
74.1
54.3
63.9
1996
44.7
41.0
48.4
64.5
60.9
68.2
74.6
70.8
78.3
80.6
77.0
84.1
83.9
80.2
87.7
12.6
65.9
69.0
48.9
61.9
73.0
2006
76.0
74.4
77.7
76.5
73.6
79.4
82.7
80.6
84.9
82.8
80.5
85.1
76.9
72.6
81.1
1.7
76.6
81.2
6.3
67.9
90.0
2013
76.4
70.0
82.9
84.6
79.5
89.7
87.9
82.5
93.4
88.6
83.1
94.1
87.6
80.4
94.8
3.1
81.9
86.6
15.4
72.9
95.6
Institu
tionald
elivery
1986
48.8
41.1
56.4
77.4
73.1
81.6
91.2
88.1
94.2
97.0
95.2
98.8
98.8
97.7
99.8
12.6
79.0
83.5
64.2
72.6
89.9
1996
79.3
75.2
83.4
96.3
94.9
97.7
98.9
98.2
99.6
99.2
98.4
99.9
100.0
5.3
91.5
93.9
41.7
83.7
100.0
2006
95.6
95.4
95.7
98.7
98.6
98.7
99.1
99.1
99.2
99.5
99.4
99.5
99.7
99.7
99.7
1.0
97.7
98.6
5.6
95.3
100.0
2013
95.1
92.4
97.8
98.6
97.0
100.0
99.4
98.7
100.0
99.7
99.2
100.0
99.4
98.6
100.0
1.1
97.5
98.8
7.8
92.0
100.0
C-sectio
n1986
7.1
4.3
10.0
14.3
10.9
17.6
31.3
26.9
35.8
40.0
34.1
45.9
60.4
55.9
64.8
36.3
25.7
32.6
61.2
23.5
34.8
1996
16.3
13.9
18.8
30.0
26.6
33.4
42.6
38.5
46.7
48.5
44.1
53.0
67.7
63.0
72.4
27.9
34.1
38.8
57.2
31.7
41.2
2006
32.5
30.5
34.4
30.1
28.8
31.3
48.4
46.4
50.5
54.3
51.5
57.1
76.9
74.3
79.4
18.8
39.8
47.9
45.2
34.4
53.2
2013
37.5
31.3
43.7
42.2
34.6
49.9
58.7
50.2
67.3
63.3
52.7
73.9
82.6
76.3
89.0
17.2
51.1
58.3
53.5
44.6
64.8
Source:B
razilD
HS19
86,D
HS19
96,P
NDS20
06,P
NS20
13.N
Ano
tavailable,
95%
CI95
%confiden
ceinterval
França et al. International Journal for Equity in Health (2016) 15:149 Page 8 of 12

than 50 % of total health expenditure by 2012 [29]. Theremainder results from a combination of out-of-pocketand private insurance spending, which is among thehighest levels of private spending on health in LatinAmerica [30].Additional evidence shows that out-of-pocket spend-
ing as a proportion of total spending varies littlebetween the poorest and wealthiest classes [5, 31]. Forinstance, the catastrophic health expenditure (10 % ormore of capacity to pay based on household consump-tion) was 18.4 % from the poorest and 17.7 % for thewealthiest in 2008–2009 [32]. However, rich and poorspend these funds in different ways. Among the latter,out-of-pocket expenditures are mostly due to purchasingmedicines, whereas the richest spend most on privatehealth insurance [5, 31].Our results on C-section rates confirm the disturb-
ing trends documented by the nationwide informationsystem (DATASUS) [33]. Among the wealthiest quin-tile the proportion of C-sections was above 80 % in2013. These rates are unacceptable high consideringthose recommended by WHO despite several effortsto encourage vaginal deliveries and limit C-sections:payment of delivery analgesia for SUS patients (1998),the Pact for C-section Rate Reduction between theBrazilian Ministry of Health and state health depart-ments (2000), enforcement of a ceiling of 27 % C-section rate for states that did not sign the Pact(2002), and a national mass campaign, “Humanization
of Normal Childbirth and Reduction of UnnecessaryCesareans” (2006) [34]. In Brazil, obstetricians assistalmost all deliveries regardless of financing or budget con-straints, and their convenience may play an important rolein the decision about the type of delivery. There is wide-spread evidence that doctors’ attitudes during the prenataland peri-delivery period may increase the likelihood of aC-section [34]. Unless strong and immediate action istaken, Brazil is at risk of reaching universal coverage foran intervention which is estimated to be necessary at mostfor 15 % of all deliveries [35].A main limitation of our analyses is that some of the
surveys failed to employ internationally-standardizedquestionnaires, so it was not possible to estimate keyRMNCH indicators, nor to assess time trends for morethan a few indicators. Standardized surveys, carried outevery 3–5 years, are essential for monitoring progressand identifying trends in inequalities. It is worth notingthat other relevant dimensions of social inequalities inintervention coverage were not assessed, including thoseassociated with women’s schooling or ethnic group.
ConclusionsIn summary, there was enormous progress from 1986 to2013 for key interventions in reproductive and maternalhealth, both in terms of coverage and inequality. Dispar-ities in C-section rates remain, but these are due toexceedingly high rates of unnecessary procedures amongthe rich, rather than low rates among the poor.
Fig. 5 Scatter diagrams of concentration index and slope index of inequality for six reproductive and maternal interventions, Brazil, from 1986 to2013. Source: Brazil DHS 1986, DHS 1996, PNDS 2006, PNS 2013
França et al. International Journal for Equity in Health (2016) 15:149 Page 9 of 12
Dissemination of the lessons learned is Brazil is particu-larly relevant in light of the focus on universal healthcoverage and equity which are key aspects of theSustainable Development Goals (SDGs) of the 2030Agenda for Sustainable Development adopted by worldleaders in September 2015.Despite such progress, the mortality rates of children
and mothers remain several fold higher in Brazil than inthe best-performing countries [36, 37] indicating thatthere is still much room for improvement. Substantialchallenges remain for the Brazilian health system,including reforming its financial structure to ensure
universality and long term sustainability, renegotiatingpublic and private roles, and assuring quality and effi-ciency of care while minimizing medicalization andensuring patient safety – as exemplified by the high C-section rates [5]. In terms of equity, the overarchingchallenge is how to reach those who are hardest toreach, such as rural populations in the Amazon rainfor-est and northeast regions, indigenous groups, and fam-ilies living in Brazilian municipalities where withinsufficient human resources for health [6]. Also, ensur-ing universal access is insufficient unless high-qualitycare is provided and missed opportunities for promoting
Table 4 Annual changes in coverage and inequality measures in six reproductive and maternal interventions, Brazil, from 1986to 2013
Indicator Group Average annual change
Coefficient SE p-value
Use of modern contraceptives Overall 0.82 0.04 <0.001
Coverage Q1 (poorest) 1.74 0.08 <0.001
Q5 (wealthiest) 0.25 0.06 <0.001
Inequality measures CIX −0.37 0.03 <0.001
SII −1.63 0.12 <0.001
Antenatal care 1+ visits (any provider) Overall 0.61 0.04 <0.001
Coverage Q1 (poorest) 1.77 0.10 <0.001
Q5 (wealthiest) 0.04 0.03 0.42
Inequality measures CIX −0.41 0.03 <0.001
SII −2.19 0.13 <0.001
Antenatal care 4+ visits (any provider) Overall 0.79 0.08 <0.001
Coverage Q1 (poorest) 2.06 0.19 <0.001
Q5 (wealthiest) 0.06 0.08 0.48
Inequality measures CIX −0.55 0.06 <0.001
SII −2.59 0.28 <0.001
1st ANC visit during the 1st trimester Overall 1.02 0.06 <0.001
Coverage Q1 (poorest) 2.63 0.11 <0.001
Q5 (wealthiest) −0.36 0.11 <0.001
Inequality measures CIX −0.81 0.05 <0.001
SII −2.57 0.19 <0.001
Institutional delivery Overall 0.34 0.04 <0.001
Coverage Q1 (poorest) 1.29 0.11 <0.001
Q5 (wealthiest) 0.03 0.02 0.18
Inequality measures CIX −0.31 0.03 <0.001
SII −2.38 0.18 <0.001
C-sections Overall 0.78 0.06 <0.001
Coverage Q1 (poorest) 1.28 0.08 <0.001
Q5 (wealthiest) 0.84 0.11 <0.001
Inequality measures CIX −0.73 0.09 <0.001
SII −0.46 0.19 0.06
Source: Brazil DHS 1986, DHS 1996, PNDS 2006, PNS 2013SE standard error, SII slope index of inequality, CIX concentration index
França et al. International Journal for Equity in Health (2016) 15:149 Page 10 of 12

other interventions is assured [5, 38, 39]. We hope thatour findings will inform policy debates on strategies toachieve universal coverage and to reduce health inequal-ities in other low- and middle-income countries, andshowcase the importance of tracking progress by regu-larly collecting data.
FundingThis article was made possible with funds from the Wellcome Trust [GrantNumber: 101815/Z/13/Z]; Bill & Melinda Gates Foundation; AssociaçãoBrasileira de Saúde Coletiva (ABRASCO); Ministry of Health of Brazil. Thefunders had no role in the writing of this article.
Availability of data and materialsData supporting our findings can be found in the following links:
� DHS surveys (1986 and 1996): http://dhsprogram.com/� Pesquisa Nacional de Demografia e Saúde - 2006: http://
bvsms.saude.gov.br/bvs/pnds/index.php� Pesquisa Nacional de Saúde - 2013: http://www.ibge.gov.br/home/
estatistica/populacao/pns/2013/
Authors’ contributionsAll authors participated in the preparation of the manuscript and approvedits final version for submission. AJDB and CGV conceived the researchquestion. GVAF and MCRM contributed equally by conducting the analysesand writing the manuscript. FM conducted the review of the literature andassisted with the editing of the paper. CGV and AJDB supervised the analysisand interpretation of the findings as well as the writing of the paper.
Competing interestsThe authors declare that they have no competing interests.
Consent for publicationNot applicable.
Ethics approval and consent to participateWe only used publicly available data from national surveys in our analyses,so that ethical clearance was the sole responsibility of the institutions thatcarried out the surveys. Further information about the surveys and ethics canbe found in their respective websites. The PNS project was approved by theNational Commission of Ethics in Research (CONEP) in June 2013, RegulationNo. 328.159.
Received: 30 April 2016 Accepted: 12 September 2016
References1. Pan American Health Organization. Health in the Americas: 2012 Edition.
Regional outlook and country profiles. Washington: PAHO; 2012.2. Restrepo-Mendez MC, Barros AJ, Requejo J, Duran P, Serpa LA, Franca GV,
Wehrmeister FC, Victora CG. Progress in reducing inequalities inreproductive, maternal, newborn’, and child health in Latin America and theCaribbean: an unfinished agenda. Rev Panam Salud Publica. 2015;38:9–16.
3. de Andrade LO, Pellegrini Filho A, Solar O, Rigoli F, de Salazar LM, SerratePC, Ribeiro KG, Koller TS, Cruz FN, Atun R. Social determinants of health,universal health coverage, and sustainable development: case studies fromLatin American countries. Lancet. 2015;385:1343–51.
4. Atun R, de Andrade LO, Almeida G, Cotlear D, Dmytraczenko T, Frenz P,Garcia P, Gomez-Dantes O, Knaul FM, Muntaner C, et al. Health-systemreform and universal health coverage in Latin America. Lancet.2015;385:1230–47.
5. Paim J, Travassos C, Almeida C, Bahia L, Macinko J. The Brazilian healthsystem: history, advances, and challenges. Lancet. 2011;377:1778–97.
6. Victora CG, Aquino E, do Carmo Leal M, Monteiro CA, Barros FC, SzwarcwaldCL. Maternal and child health in Brazil: progress and challenges. Lancet.2011;377:1863–76.
7. Fleury S. Brazilian sanitary reform: dilemmas between the instituing and theinstitutionalized. Cien Saude Colet. 2009;14:743–52.
8. Fleury S. Brazil’s health-care reform: social movements and civil society.Lancet. 2011;377:1724–5.
9. Paim JS. The Citizen Constitution and the 25th anniversary of the BrazilianUnified National Health System (SUS). Cad Saude Publica. 2013;29:1927–36.
10. Barros AJD, Victora CG, Cesar JA, Neumann NA, Bertoldi AD. Brazil: AreHealth and Nutrition Programs Reaching the Neediest? In: Gwatkin DR,Wagstaff A, Yazbeck AS, editors. Reaching the poor with Health, Nutrition,and Population Services - What Works, What Doesn’t, and Why. Washington:The World Bank; 2005.
11. Sánchez-Ancochea D, Mattei L. Bolsa Família, poverty and inequality:Political and economic effects in the short and long run. Global Soc Policy.2011;11:299.
12. Rasella D, Aquino R, Santos CA, Paes-Sousa R, Barreto ML. Effect of aconditional cash transfer programme on childhood mortality: a nationwideanalysis of Brazilian municipalities. Lancet. 2013;382:57–64.
13. Brasil. Sociedade Civil Bem-Estar Familiar no Brasil (BEMFAM)/Instituto paraDesenvolvimento de Recursos (IRD). Pesquisa Nacional sobre SaúdeMaterno-Infantil e Planejamento Familiar - PNSMIPF - Brasil, 1986.Rio de Janeiro: BENFAM; 1987.
14. Brasil. Sociedade Civil Bem-Estar Familiar no Brasil (BEMFAM). PesquisaNacional Sobre Demografia e Saúde - 1996. Rio de Janeiro: BEMFAM; 1997.
15. Brasil. Ministério da Saúde. PNDS 2006 - Pesquisa Nacional de Demografia eSaúde da Criança e da Mulher. Brasília/DF: Ministério da Saúde; 2008.
16. Instituto Brasileiro de Geografia e Estatística - IBGE. Pesquisa Nacional deSaúde - 2013. Rio de Janeiro: IBGE; 2014.
17. Rutstein SO, Johnson K. The DHS wealth index. DHS comparative reports.Calverton: ORC Macro; 2004.
18. Harper S, Lynch J. Methods for measuring cancer disparities: Using datarelevant to healthy people 2010: cancer related objectives. Bethesda:National Cancer Institute; 2005.
19. Barros AJ, Victora CG. Measuring coverage in MNCH: determining andinterpreting inequalities in coverage of maternal, newborn, and child healthinterventions. PLoS Med. 2013;10:e1001390.
20. Brazil: Standard DHS, 1986 [http://dhsprogram.com/what-we-do/survey/survey-display-2.cfm]
21. Brazil: Standard DHS, 1996 [http://dhsprogram.com/what-we-do/survey/survey-display-85.cfm]
22. PNDS - Pesquisa Nacional de Demografia e Saúde (2006) [http://bvsms.saude.gov.br/bvs/pnds/index.php]
23. Pesquisa Nacional de Saúde 2013 [http://www.ibge.gov.br/home/estatistica/populacao/pns/2013/]
24. United Nations Development Programme (UNDP). The 2015 HumanDevelopment Report: Work for Human Development. New York: UNDP;2015.
25. International Labour Organization (ILO). Global Wage Report 2014/15:Wages and income inequality. Geneva: ILO; 2015.
26. Marten R, McIntyre D, Travassos C, Shishkin S, Longde W, Reddy S, Vega J.An assessment of progress towards universal health coverage in Brazil,Russia, India, China, and South Africa (BRICS). Lancet. 2014;384:2164–71.
27. Piola SF, Paiva ABD, Sá EBD, Servo LMS. Financiamento público da saúde:uma história à procura de rumo. Rio de Janeiro: Instituto de PesquisaEconômica Aplicada; 2013.
28. World Health Organization. World health statistics 2014. Geneva: WHO;2014.
29. The World Bank. Health expenditure, total (% of GDP) [http://data.worldbank.org/indicator/SH.XPD.TOTL.ZS]
30. Sunil AR, Cavagnero E, Class D, Ferl K. Brazil - Health financing profile.Washington: World Bank Group; 2014.
31. Barros AJ, Bastos JL, Damaso AH. Catastrophic spending on health care inBrazil: private health insurance does not seem to be the solution. CadSaude Publica. 2011;27 Suppl 2:S254–62.
32. Boing AC, Bertoldi AD, Barros AJ, Posenato LG, Peres KG. Socioeconomicinequality in catastrophic health expenditure in Brazil. Rev Saude Publica.2014;48:632–41.
33. Barros FC, Matijasevich A, Maranhao AG, Escalante JJ, Rabello Neto DL,Fernandes RM, Vilella ME, Matos AC, Albuquerque C, Leon RG, Victora CG.Cesarean sections in Brazil: will they ever stop increasing? Rev Panam SaludPublica. 2015;38:217–25.
34. Barros AJ, Santos IS, Matijasevich A, Domingues MR, Silveira M, Barros FC,Victora CG. Patterns of deliveries in a Brazilian birth cohort: almost universalcesarean sections for the better-off. Rev Saude Publica. 2011;45:635–43.
França et al. International Journal for Equity in Health (2016) 15:149 Page 11 of 12

35. World Health Organization. WHO statement on caesarean section rates.Geneva: WHO; 2015.
36. United Nations Children’s Fund (UNICEF). The state of the world’s children2014 in numbers. Revealing disparities, advancing children’s rights. NewYork: UNICEF; 2014.
37. WHO. UNICEF. UNFPA. World Bank Group. The United Nations PopulationDivision. Trends in maternal mortality: 1990 to 2015: estimates by WHO,UNICEF, UNFPA, World Bank Group and the United Nations PopulationDivision. Geneva: WHO; 2015.
38. UNICEF and World Health Organization. Countdown to 2015: A Decade ofTracking Progress for Maternal, Newborn and Child Survival - The 2015Report. Geneva: WHO; 2015.
39. World Health Organization. Quality of care : a process for making strategicchoices in health systems. Geneva: WHO; 2006.
• We accept pre-submission inquiries
• Our selector tool helps you to find the most relevant journal
• We provide round the clock customer support
• Convenient online submission
• Thorough peer review
• Inclusion in PubMed and all major indexing services
• Maximum visibility for your research
Submit your manuscript atwww.biomedcentral.com/submit
Submit your next manuscript to BioMed Central and we will help you at every step:
França et al. International Journal for Equity in Health (2016) 15:149 Page 12 of 12