Embed Size (px)
Citation preview

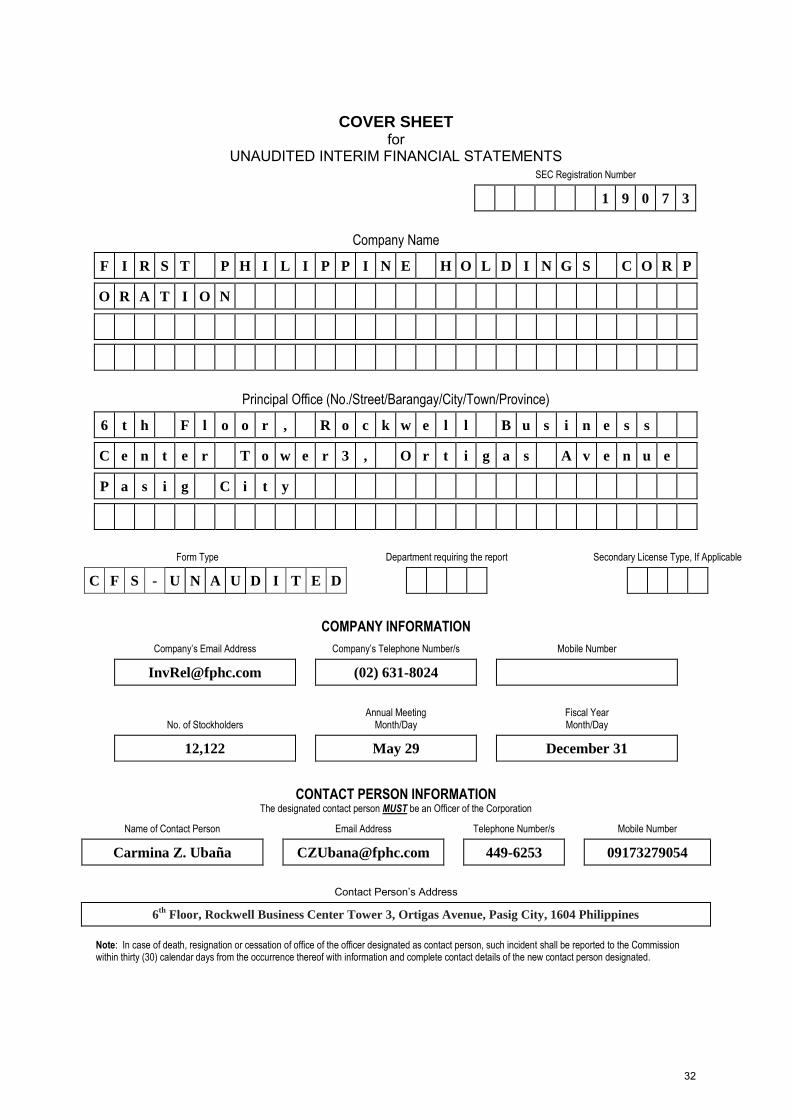
COVER SHEET
SEC Registration Number 1 9 0 7 3
Company Name
F I R S T P H I L I P P I N E H O L D I N G S C O R P
O R A T I O N
Principal Office (No./Street/Barangay/City/Town/Province)
6 t h F l o o r , R o c k w e l l B u s i n e s s
C e n t e r T o w e r 3 , O r t i g a s A v e n u e ,
P a s i g C i t y
Form Ty pe Department requiring the report Secondary License Ty pe, If Applicable
1 7 - Q
COMPANY INFORMATION Company ’s Email Address Company ’s Telephone Number/s Mobile Number
[email protected] (02) 631-8024
No. of Stockholders
Annual Meeting Month/Day
Fiscal Year Month/Day
12,122 May 29 December 31
CONTACT PERSON INFORMATION The designated contact person MUST be an Officer of the Corporation
Name of Contact Person Email Address Telephone Number/s Mobile Number
Carmina Z. Ubaña [email protected] 449-6253 09173279054
Contact Person’s Address
6th Floor, Rockwell Business Center Tower 3, Ortigas Avenue, Pasig City, 1604 Philippines Note: In case of death, resignation or cessation of office of the officer designated as contact person, such incident shall be reported to the Commission w ithin thirty (30) calendar days from the occurrence thereof with information and complete contact details of the new contact person designated.

SECURITIES AND EXCHANGE COMMISSION
SEC FORM 17-Q
QUARTERLY REPORT PURSUANT TO SECTION 17 OF THE SECURITIES REGULATION CODE AND SRC RULE 17(2)(b) THEREUNDER
1. For the quarterly period ended: June 30, 2017
2. Commission identification number: 19073
3. BIR Tax Identification No.: 000-288-698-000
4. Exact name of issuer as specified in its charter:
FIRST PHILIPPINE HOLDINGS CORPORATION
5. Province, country or other jurisdiction of incorporation or organization: Metro Manila, Philippines
6. Industry Classification Code: (SEC Use Only)
7. Address of issuer's principal office: Postal Code: 6th Floor, Rockwell Business Center Tower 3, 1604 Ortigas Avenue, Pasig City
8. Issuer's telephone number, including area code: (632) 555-8000
9. Former name, former address and former fiscal year, if changed since last report:N/A
10. Securities registered pursuant to Sections 8 and 12 of the Code, or Sections 4 and 8 of the RSA
Title of each Class Number of shares of common stocks outstanding and amount of debt outstanding
Common Shares 554,206,569 Preferred Shares 3,600,000
11. Are any or all of the securities listed on a Stock Exchange?
Yes [ X ] No [ ]
If yes, state the name of such Stock Exchange and the class/es of securities listed therein:
The registrant's common and preferred shares are being traded at the Philippine Stock Exchange.
1
12. Indicate by check mark whether the registrant:
(a) has filed all reports required to be filed by Section 17 of the Code and SRC Rule 17 thereunder or Sections 11 of the RSA and RSA Rule 11(a)-1 thereunder, and Sections 26 and 141 of the Corporation Code of the Philippines, during the preceding twelve (12) months (or for such shorter period the registrant was required to file such reports) Yes [ X ] No [ ] (b) has been subject to such filing requirements for the past ninety (90) days.
Yes [ X ] No [ ]
2
PART I--FINANCIAL INFORMATION Financial Statements The unaudited interim condensed consolidated financial statements of the registrant are incorporated herein by reference to the enclosed document. They are prepared in compliance with the Philippine Financial Reporting Standards (PFRS) specific to Philippine Accounting Standard (PAS) 34, Interim Financial Reporting , as issued by the Financial Reporting Standards Council and adopted by the Philippine SEC and hence do not include all of the information required in the December 31, 2016 annual audited consolidated financial statements. See Exhibit A. References to PFRS standards include the application of PAS, Philippine Financial Reporting Standards (PFRS), and Philippine Interpretations of the International Financial Reporting Interpretations Committee (IFRIC). Earnings per share is presented on the face of unaudited interim consolidated statements of income for the period ended June 30, 2017 and 2016. The accompanying notes to financial statements describe the basis of computation thereof. The unaudited interim condensed consolidated financial statements followed the same accounting policies and methods of computations as used in the December 31, 2016 annual consolidated financial statements under Summary of Significant Accounting Policies. The nature and amount of items affecting assets, liabilities, equity, net income, or cash flows that are unusual because of their nature, size or incidents are described in Item 2, Management’s Discussion and Analysis or Plan of Operation. Issuances, repurchases, and repayments of debt and equity securities, if any, are described in Item 2, Other Financial Information. Cases relating to the recovery of certain PCIB Shares FPH was allowed by the Supreme Court in FPH vs. Sandiganbayan, G.R. No. 88345 to intervene and litigate its claim of ownership over 6,299,177 sequestered PCIBank shares of stock in the case of the Republic of the 1
Philippines (“Republic”) vs. Benjamin Romualdez, et al., Civil Case No. 0035, which is pending before the Sandiganbayan. FPH anchors its claim on, among other facts, the nullity or voidability of the contract transferring the shares from itself to Romualdez, et al. The Sandiganbayan, however, dismissed FPH’s Second Complaint-in-Intervention, as well as FPH’s subsequent motions for reconsideration/petitions. FPH filed a Petition for Review in the Supreme Court as to said dismissal, which is currently pending before the Supreme Court. In a related case, the Presidential Commission on Good Government and FPH separately filed petitions for review before the Supreme Court for the dismissal of the Republic’s Third Amended Complaint as to TMEE. The petitions and FPH’s subsequent Motion for Reconsideration were denied. Meanwhile, FPH continues to pursue its interest in the Sandiganbayan against the other defendants. In the Sandiganbayan case, the Republic filed a Partial Compliance with Motion for Production and Inspection dated 30 April 2014, which was denied. The Republic’s Motion for Reconsideration thereon was denied. FPH filed a Petition for Certiorari dated 20 January 2016 with the Supreme Court assailing the Sandiganbayan’s denial. The Petition remains pending.
1 BDO is the successor of PCIBank.
3

Tax Cases
Several companies within the Group received Final Assessment Notices (FAN)/Final Decision on Disputed Assessment (FDDA) from the BIR Large Taxpayers Service (LTS) for the taxable year 2009 amounting to ₱2.0 billion for alleged deficiency taxes. Alleged interest and penalties indicated in the FANs/FDDAs amounted to ₱1.86 billion. The companies duly protested on factual, due process and legal grounds, including prescription of some assessments and have filed Petitions for Review with the CTA questioning the validity of the assessment on the same foregoing grounds following the inaction by the BIR on their protest. The management of the companies, based on consultation with their legal counsels, believes that the final settlement of the cases, if any, would not adversely affect the companies’ financial positions or results of operations Other legal proceedings West Tower Condominium Corporation, et al. vs. First Philippine Industrial Corporation, et al. G.R. No. 194239, Supreme Court of the Philippines On November 15, 2010, a Petition for the Issuance of a Writ of Kalikasan was filed before the SC by the West Tower Condominium Corporation, et al., against respondents First Philippine Industrial Corporation (FPIC), the Company, their respective boards of directors and officers, and John Does and Richard Roes. The petition was filed in connection with the accidental oil leak from a segment of FPIC’s white oil pipeline located in Bangkal, Makati City and which seeped into the basement of the West Tower Condominium building. The petition was brought by the West Tower Condominium Corporation purportedly on behalf of its unit owners and in representation of the inhabitants of Barangay Bangkal, Makati City. The petitioners sought the issuance of a Writ of Kalikasan. On November 19, 2010, the SC issued a Writ of Kalikasan with Temporary Environmental Protection (TEPO). First Gen and its impleaded directors and officers filed a verified Return in November 2010 and a Compliance in January 2011 which the SC took note of. In January 2011, FPIC asked the SC to temporarily lift the Writ for the conduct of a pressure-controlled leak test. On November 22, 2011, the SC issued a Resolution ordering the temporary lifting of the TEPO for 48 hours. The SC issued an order to remand the case to the Court of Appeals. On December 21, 2012, the Court of Appeals rendered its Report and Recommendation. Petitioners filed a Motion for Partial Reconsideration in January 2013 and prayed, among others, that the Department of Science and Technology (DOST) be tasked to chair the monitoring of FPIC’s compliance with the directives of the court. In a Compliance dated January 25, 2013, FPIC submitted to the SC a Certification signed by the DOE stating that the black oil pipeline is safe for commercial operation. In a Compliance dated January 25, 2013, FPIC submitted to the SC a Certification signed by the DOE stating that the black oil pipeline is safe for commercial operation. In a Resolution dated July 30, 2013, the SC adopted the CA’s recommendation that FPIC secure a DOE certification stating that the pipeline is already safe for commercial operation before the white oil pipeline may resume its operations. On October 25, 2013, the DOE issued a certification that the white oil pipeline is safe to return to commercial operations. FPIC submitted the certification to the SC on October 29, 2013. On June 16, 2015, the SC issued another resolution recognizing the powers of the DOE to oversee the operation of the pipelines. The resolution also stated that the DOE is fully authorized by law to issue an order for the return to commercial operations of the pipeline following the conduct of integrity tests. Petitioners have filed several motions urging the SC to reconsider this resolution. As of June 30, 2017, the final resolution of the Writ remains pending with the SC. In the meantime, FPIC has been coordinating with the DOE for the issuance of said order.
4
West Tower Condominium Corporation, et al. vs. First Philippine Industrial Corporation, et al. Civil Case No. 11-256, Regional Trial Court, Makati Branch 58 On March 24, 2011, a civil case for damages was filed by the West Tower Condominium Corporation and some residents of the West Tower Condominium against FPIC, the FPIC directors and officers, First Gen, Pilipinas Shell Petroleum Corporation, and Chevron Philippines, Inc. before the Makati City RTC. In their complaint, the Plaintiffs alleged that FPIC, its directors and officers, and First Gen violated Republic Act No. 6969 (Toxic Substances and Hazardous and Nuclear Wastes Control Act of 1990), RA 8749 (Philippine Clean Air Act of 1999) and Its Implementing Rules and Regulations, and RA 9275 (Philippine Clean Water Act of 2004). The complaint sought payment by the Defendants of actual damages comprising incurred rentals for alternative dwellings, incurred additional transportation and gasoline expenses and deprived rental income; recompense for diminished or lost property values to enable the buying of new homes; incurred expenses in dealing with the emergency; moral damages; exemplary damages; a medical fund; and attorney’s fees. First Gen filed its Answer in May 2011, in which it was argued that the case is not an environmental case under the Rules of Procedure for Environmental Cases, but an ordinary civil case for damages under the Rules of Court for which the appropriate filing fees should be paid before the court can acquire jurisdiction thereof. In an Order dated August 22, 2011, Makati City RTC (Branch 158) Judge Eugene Paras ruled that the complaint is an ordinary civil action for damages and that the Plaintiff should pay the appropriate filing fees in accordance with the Rules of Court within 10 days from receipt of the Order. The other individual plaintiffs were ordered dropped as parties in the case. The Plaintiffs filed a Motion to Inhibit Judge Paras as well as a Motion for Reconsideration of the Order. In an Order dated October 17, 2011, the court reiterated that it has no jurisdiction over the case and ordered the referral of the case to the Executive Judge for re-raffle. In an Order dated December 1, 2011, Judge Elpidio Calis of the Makati City RTC (Branch 133) declared that the records of the case have been transferred to his court. In an Order dated March 29, 2012, Judge Calis denied the plaintiffs’ Motion for Reconsideration for lack of merit, and ordered the plaintiffs to pay the appropriate filing fees within ten (10) days from receipt of the Order, with a warning that non-compliance will constrain the court to dismiss the case for lack of jurisdiction. Instead of paying the filing fees, the plaintiffs filed a Petition for Certiorari with the CA to nullify the order of Branch 133. In a resolution dated June 30, 2014, the CA denied the petition of West Tower and affirmed the trial court’s recognition of the case as being an ordinary action for damages. The CA, however, also ruled that the individual residents who joined West Tked for the counsel of First Gen. Complainant then filed with the Department of Justice (DOJ) a petition for change of venue, which petition was granted by way of Department Order No. 63 dated January 18, 2012, which designated Manila Senior Assistant City Prosecutor Raymunda Apolo as special investigating prosecutor for the case. In an Order dated February 3, 2012, Makati City Prosecutor Aspi ordered the consolidation of the case with another case entitled Anthony M. Mabasa et al. vs. Roberto B. Dimayuga et al. for violation of Article 183 of the Revised Penal Code. The Order stated that the consolidation is being made upon the recommendation of Makati City Assistant Prosecutor Ma. Agnes Alibanto. On February 17, 2012, Respondent-Directors of First Gen filed a Motion for Reconsideration of the Order dated January 18, 2012 which granted Complainant’s petition for a change of venue. As of June 30, 2017, the case remains pending. There have been no updates on the West Tower cases since the filing of the SEC Form 17-A. Arbitration Proceedings First PV and First Philec Nexolon Corporation (FPNC) The Parent Company’s (or “FPH”) subsidiaries, First PV Ventures Corporation (First PV) and First Philec Nexolon Corporation (FPNC) initiated arbitration proceedings against Nexolon Co Ltd (Nexolon) with the International Court of Arbitration of the International Chamber of Commerce (“ICC”) in 2012 on the basis of Nexolon’s breaches of the Supply Agreement. The arbitral tribunal rendered the final award in October 2014
5

which required Nexolon to pay damages and pre-award interest to FPNC in the amount of $24.8 million and a put option price to First PV in the amount of ₱2.09 billion (FPNC and First PV are referred to as the “Companies”) . To date, no payments have been received on the award from Nexolon which is reported to be in rehabilitation proceedings. The companies have filed their appropriate claims in Korean rehabilitation courts. At the same time, to mitigate its losses, FPNC is searching for ways to realize value from its remaining assets. First Philippine Electric Corporation and FPSC Also in 2012, First Philippine Electric Corporation (First Philec) and First Philec Solar Corporation (FPSC) initiated arbitration proceedings against SunPower Philippines Manufacturing Limited (SPML) with the ICC. In January 2015, a partial award was granted by the arbitral tribunal in favor of First Philec and FPSC which required SPML to pay FPSC a net sum of $25.2 million as compensation for wafers not taken by SPML and unpaid services, and First Philec the price of $30.30 million as payment for First Philec’s shares in FPSC. In July 2015, First Philec and FPSC received a Second Partial Award from the ICC where SPML was ordered to purchase First Philec's shares in FPSC for the price of US$23.2 million by August 13, 2015 and within 14 days of the completion of the share transfer, to pay FPSC the net sum of US$25.2 million. However, SPML has filed several applications with the Hong Kong and Philippine courts which First Philec and FPSC have responded to. In July 2016, First Philec and FPSC have settled their disputes with SPML and together with SPML filed the appropriate Consent Order, motions or manifestation and shall do all such things as are reasonably necessary in order to discontinue, terminate or dismiss (as the case may be) all the legal proceedings that are pending between them in Hong Kong and in the Philippines. Under the terms of their settlement, SPML has paid FPSC USD 25,239,860 (which is equal to the full amount that SPML was ordered to pay FPSC in the arbitration) and First Philec USD 25,260,140, and has transferred all of SPML's shares of stock in FPSC to First Philec. Significant Transactions of the Parent On July 7, 2016, the Board approved the extension of FPH’ common shares buy-back program from July 2016 to July 2018 for up to ₱6 billion, out of which, a total of ₱3.345 billion worth of shares has been purchased. The original program was approved in July 2010 and has been extended twice previously. On February 16, 2017, FPH purchased 149,999 common shares and 1 founder’s share in Asian Eye Institute (“AEI”) for a total consideration of ₱19,500,000. After the appropriate clearances and documentation for the transaction, FPH will own 50.57% of AEI, making the latter its subsidiary. As of June 30, 2017, FPH owns 62.39% of AEI. On April 7, 2017, the Board approved the Audited Financial Statements for the calendar year ended December 31, 2016. FPH’s most recent dividend declarations are presented below:
Declaration Date Record Date Payment date Amount
Common Shares May 4, 2017 May 19, 2017 June 2, 2017 ₱ 1.00 per share
Preferred Shares May 4, 2017 May 19, 2017 June 2, 2017 ₱ 13.75 per share
Common Shares November 3, 2016 November 18, 2016 December 2, 2016 ₱ 1.00 per share
Preferred Shares November 3, 2016 November 18, 2016 December 2, 2016 ₱ 13.75 per share
Certain subsidiaries and associates have contingent liabilities with respect to claims, lawsuits and tax assessments. The respective management of the subsidiaries and associates, after consultations with outside counsels, believes that the final resolution of these issues will not materially affect their respective financial position and results of operations.
6

There is no seasonality or cyclicality of interim operations during the period. Except for First Gen’s subsidiaries, particularly FG Hydro’s and FG Bukidnon’s sale of electricity coming from hydroelectric power/operations, as well as First Gen’s merchant plants, seasonality or cyclicality of interim operations is not applicable to the Group’s type of business. The Group’s other operating segments are also not subject to seasonality or cyclicality. There are no material changes in contingent liabilities or contingent assets since the last annual balance sheet date.
7

Item 2. Management’s Discussion and Analysis or Plan of Operation
The following management’s discussion and analysis of the FPH Group’s (the Group) financial condition and results of operations for the periods ended June 30, 2017 and 2016 should be read in conjunction with the accompanying unaudited interim condensed consolidated financial statements and the related notes as at June 30, 2017 and the audited consolidated financial statements as at December 31, 2016. This discussion includes forward-looking statements, which may include statements regarding future results of operations, financial condition or business prospects, which are subject to significant risks, uncertainties and other factors and are based on the Group’s current expectations, some of which are beyond the Group’s control and are difficult to predict. These statements involve risks and uncertainties and our actual results may differ materially from those anticipated in these forward-looking statements. FINANCIAL HIGHLIGHTS……………………………………………………………… … …iiii The financial highlights and analysis of account movements for the comparative periods are in Philippine pesos (unless specifically indicated), which is the Group’s functional currency. The financial statements of the consolidated subsidiaries and associates with functional currency other than the Philippine peso such as the First Gen group are translated to Philippine peso as follows:
● Assets and liabilities using the spot rate of exchange prevailing at financial reporting date; ● Components of equity using historical exchange rates; and ● Income and expenses using the monthly weighted average exchange rate.
The table below summarizes the relevant exchange rates used throughout the comparative periods:
Translation Basis June 30, 2017 Dec. 31, 2016 June 30, 2016 Dec. 31, 2015
End of period spot rate 1 US$ to Php 50.470 49.720 47.060 47.060 Average exchange rate to 1 US$ to Php 49.919 47.288 47.028 45.300
Whenever necessary, the impact of exchange rate movements are separately discussed in order to properly explain the movement in account balances in conjunction with business results and transactions. Consolidated Statements of Income (Unaudited) For the six months ended June 30, 2017 vs. June 30, 2016 (As restated) Revenues
The Group’s consolidated revenues for the period ended June 30, 2017 increased by ₱7.3 billion to ₱51.5 billion, a 17% jump from last year’s ₱44.1 billion mainly on account of the following: ● Sale of electricity was up by ₱4.9 billion or 13% driven by (1) the incremental revenues of San
Gabriel and Avion power plants; (2) higher sales volume and higher average tariff from EDC's Unified Leyte and higher average tariff of its Bacman Units; and (3) higher contributions from Santa Rita and San Lorenzo power plants on account of higher average gas prices for the period.
● Sale of real estate almost doubled from ₱2.9 billion to ₱5.7 billion primarily due to Rockwell Land’s stronger revenues from condominium projects, complemented by FPIP’s higher industrial land sales for the period.
8
● Revenues from sale of merchandise also posted favorable variance (17% increase from ₱892 million to ₱1.0 billion) mainly due to increased sales volume of distribution, padmounted and ventilated transformers of First Philec’s Electrical Utilities (EU) Sector.
These increases were partly offset by lower revenues reported by the construction and energy services group, which decreased by ₱475 million or 19%, from ₱2.5 billion to ₱2.0 billion mainly due to the lower completion value recognized on third party construction projects this year. Net Income
Despite the increase in the Group’s revenues, consolidated net income decreased by ₱2.0 billion or 25% (from ₱8.0 billion to ₱6.0 billion) primarily because of the one-off losses related to the debt prepayments of FGPC and EDC totalling ₱1.0 billion and the absence of the ₱1.3 billion liquidated damages received last year for the delay in completion of the San Gabriel plant. This was aggravated by the ₱309 million unfavorable forex movement during the period. Excluding forex and other non-recurring items, consolidated recurring net income increased by ₱1.0 billion or 14% (from ₱6.7 billion to ₱7.7 billion) following higher operating profits from the energy, real estate and manufacturing businesses. Net Income Attributable to Equity Holders of the Parent
Net income attributable to equity holders of the Parent decreased by ₱1.0 billion or 28% (from ₱3.5 billion to ₱2.5 billion) largely on account of the Parent’s share in one-off losses on debt prepayment, the absence of liquidated damages received last year, and the unfavorable forex movements during the period. Excluding forex and other non-recurring items, earnings attributable to equity holders of the Parent increased by ₱626 million or 23% from ₱2.7 billion to ₱3.3 billion (see Notes to Financial Statements). Detailed discussions of the changes in the Consolidated Statements of Income are presented in the succeeding sections of this report. Consolidated Statements of Financial Position June 30, 2017 (Unaudited) vs. December 31, 2016 (Audited) Assets
Total assets of the Group increased by ₱14.3 billion or 4% (from ₱347.3 billion to ₱361.6 billion) as a result of the following major movements: ● Cash and cash equivalents and short-term investments increased by a net amount of ₱15.4 billion
or 42% (from ₱37.0 billion to ₱52.4 billion) mainly representing the cash generated from the Group’s operating activities during the first six months (see Consolidated Statements of Cash Flows) and the proceeds from the new loans availed by FGPC, EDC and Rockwell.
● Other noncurrent assets increased by ₱3.3 billion or 17% (from ₱19.2 billion to ₱22.5 billion)
mainly due to the reclassification of FNPC’s and PMPC’s Input VAT from current to noncurrent following its commercial operations in late 2016. Consequently, the reclassification caused a ₱2.6 billion or 18% reduction in the “Other current assets” account at period-end.
The above increases were partially offset by the decline in property, plant and equipment due to normal depreciation and the decline in inventories following FGPC's and FGP's consumption of liquid fuel during the Malampaya Outage in the first half of 2017.
9

Liabilities and Equity
Total liabilities of the Group grew by ₱10.6 billion or 5% (from ₱206.2 billion to ₱216.9 billion) primarily due to the following movements:
● Long-term debts (including current portion) increased by ₱9.8 billion or 6% (from ₱162.7 billion
to ₱172.5 billion) primarily due to the new loans obtained by FGPC, EDC and Rockwell Land. ● Other noncurrent liabilities increased by ₱1.0 billion or 62% (from ₱1.7 billion to ₱2.7 billion)
reflecting the increase in Rockwell Land’s retention payable to contractors. Total equity increased by ₱3.7 billion or 3% (from ₱141.0 billion to ₱144.7 billion) mainly due to the net income for the current period offset by the (a) unrealized fair value losses on the Group’s Meralco shares following the decrease in its share price (from ₱265 per share at December 31, 2016 to ₱260.8 per share at June 30, 2017), (b) cash dividends declared during the period, and (c) forex losses following unfavorable forex movements. Detailed discussions of the significant account movements in the Consolidated Statements of Financial Position are presented in the succeeding sections of this report.
10
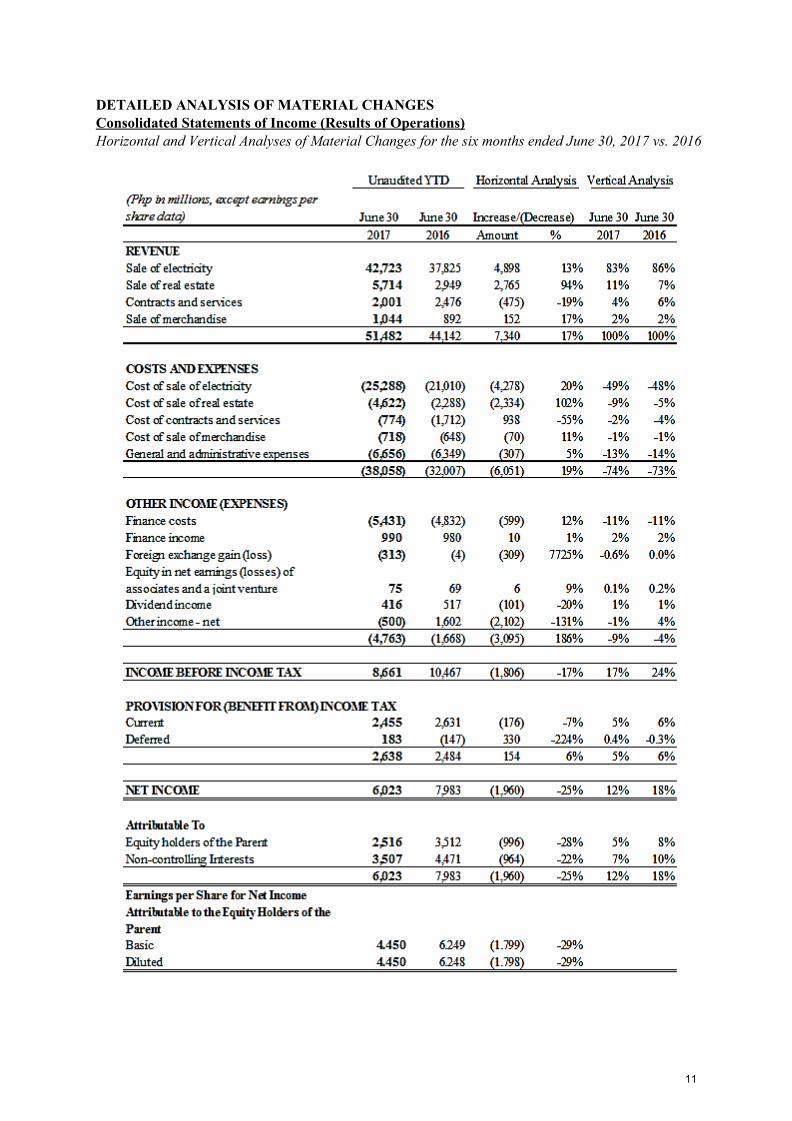
DETAILED ANALYSIS OF MATERIAL CHANGES Consolidated Statements of Income (Results of Operations) Horizontal and Vertical Analyses of Material Changes for the six months ended June 30, 2017 vs. 2016
11
Revenues
The Group’s consolidated revenues for the six months ended June 30, 2017 totaled ₱51.5 billion, higher by ₱7.3 billion or 17% compared to the previous period. The significant movements in the Group’s revenues consist of: Sale of electricity – increased by ₱4.9 billion or 13% (from ₱37.8 billion to ₱42.7 billion) and accounted for 83% and 86% of total revenues for 2017 and 2016, respectively. The increase was driven by (1) the incremental revenues of San Gabriel and Avion power plants that started commercial operations in the 4th quarter of 2016; (2) higher sales volume and higher average tariff from EDC's Unified Leyte and higher average tariff of its Bacman Units; and (3) higher contributions from Santa Rita and San Lorenzo power plants due to higher average gas prices - an average of $7.4/MMBtu in the first half of 2017 compared to an average of $6.6/MMBtu in the same period last year. Sale of real estate – almost doubled from ₱2.9 billion to ₱5.7 billion and accounted for 11% and 7% of total revenues for 2017 and 2016, respectively. The increase was largely attributable to Rockwell Land’s higher sales of Proscenium and Vantage projects, complemented by higher construction completion of the Proscenium projects. This was supplemented by FPIP and FIT’s higher combined industrial land sales for the period (7.3 hectares in 2017 vs. 1.0 hectare in 2016). Contracts and services – was lower by ₱475 million or 19% (from ₱2.5 billion to ₱2.0 billion) and accounted for 4% and 6% of total revenues for 2017 and 2016, respectively. The decline resulted mainly from First Balfour’s lower completion value recognized on ongoing construction projects and the tapering of earnings from last year’s major revenue drivers - NLEX, Yazaki-Torres and E-PLDT projects. Sale of merchandise – increased by ₱152 million or 17% (from ₱892 million to ₱1.0 billion) and accounted for 2% of total revenues for both periods. This was mainly driven by the increase in sales volume of distribution, padmounted and ventilated transformers for the period, coupled with deliveries of carry-over orders from last year and improved material availability for the period. Costs and expenses Consolidated cost and expenses increased by ₱6.1 billion or 19% (from ₱32.0 billion to ₱38.1 billion) and accounted for 74% and 73% of total revenues for 2017 and 2016, respectively. Details of cost and expenses line items as well as significant changes for the comparative periods are discussed as follows: Cost of sale of electricity – increased by ₱4.3 billion or 20% (from ₱21.0 billion to ₱25.3 billion) and accounted for 49% and 48% of revenues for 2017 and 2016, respectively. The movement mainly reflects the incremental operating costs of the new gas plants, San Gabriel and Avion. Fuel costs for Santa Rita and San Lorenzo plants also increased because of higher average gas prices (an average of $7.4/MMBtu in the first half of 2017 compared to an average of $6.6/MMBtu in the first half of 2016) as well as the use of liquid fuel during the period. Cost of real estate sold – increased by ₱2.3 billion or 102% (from ₱2.3 billion to ₱4.6 billion) and accounted for 9% and 5% of total revenues for 2017 and 2016, respectively. The upward movement primarily reflects higher percentage of completion and cost ratios for Rockwell Land’s Proscenium projects as well as FPIP’s higher volume and cost of land sold for the period.
12
Cost of contracts and services – decreased by ₱938 million or 55% (from ₱1.7 billion to ₱774 million) and accounted for 2% and 4% of total revenues for 2017 and 2016, respectively. The decrease followed the lower contract values and lower costs incurred for construction projects during the period. General and administrative expenses – increased by ₱307 million or 5% (from ₱6.3 billion to ₱6.6 billion) and accounted for 13% and 14% of total revenues for 2017 and 2016, respectively. This was largely driven by higher manpower costs, business taxes, depreciation and insurance expenses incurred by the Group. Finance costs Finance costs increased by ₱599 million or 12% (from ₱4.8 billion to ₱5.4 billion) and accounted for 11% of total revenues for both 2017 and 2016, primarily due to new loans availed by the Group in 2017. Foreign exchange gain (loss) - net
Foreign exchange losses increased by ₱309 million (from ₱4 million to ₱313 million) because of the Philippine peso depreciation from December 2016 to June 2017 compared to the steady rates during the December 2015 to June 2016 period (refer to foreign exchange table above). Equity in net earnings of associates and a joint venture
Equity in net earnings of associates and a joint venture increased by ₱6 million or 9% (from ₱69 million to ₱75 million) and accounted for 0.1% and 0.2% for 2017 and 2016, respectively. This is brought about by the ramp up in occupancy rates of the Rockwell Business Center. Dividend income
Dividend income decreased by ₱101 million or 20% (from ₱517 million to ₱416 million) and accounted for 1% of total revenues for both periods. This was largely due to lower dividends received from Meralco during the period (₱9.30 per share in 2017 vs. ₱11.60 per share in 2016). Other income (charges) - net
This account reversed by ₱2.1 billion or 131% from last year’s ₱1.6 billion gain to this year’s ₱500 million loss, accounting for -1% and 4% of total revenues for 2017 and 2016, respectively. This was mainly caused by the non-recurring loss totalling to ₱1.0 billion related to debt prepayment, which comprise of unamortized debt issuance cost write-off ($2.0 million) and interest rate swap termination costs ($11.0 million) for FGPC and the $8.0 million premium that EDC paid for the partial redemption of its Dollar-denominated bonds, compared to the ₱1.3 billion non-recurring gain on liquidated damages received last year for the delayed completion of the San Gabriel plant. Income before income tax As a result of the foregoing, income before income tax for the period decreased by ₱1.8 billion or 17% (from ₱10.5 billion to ₱8.7 billion) compared to last year. Provision for income tax Provision for income tax went up by ₱154 million or 6% (from ₱2.5 billion to ₱2.6 billion) and accounted for 5% and 6% of total revenues for 2017 and 2016, respectively. The movement was
13
largely attributable to the reversal of the ₱147 million benefit from deferred taxes in 2016 to a provision of ₱183 million in 2017, reflecting the impact of unfavorable forex movements in First Gen’s U.S. Dollar denominated books.
Net income Despite the Group’s improvement in recurring earnings for the period, consolidated net income declined by ₱2.0 billion or 25% (from ₱8.0 billion to ₱6.0 billion) primarily due to this year’s one-off losses and the absence of non-recurring gains booked last year, as discussed above. Net Income Attributable to Equity Holders of the Parent
Net income attributable to equity holders of the Parent decreased by ₱996 million or 28% (from ₱3.5 billion to ₱2.5 billion), reflecting the offsetting effect of the growth in recurring earnings, one-off losses related to loan pre-terminations, absence of last year’s gain on liquidated damages and unfavorable movement in forex rates for the period. On a recurring net income basis, earnings attributable to equity holders of the Parent increased by ₱626 million or 23% (from ₱2.7 billion to ₱3.3 billion) due to the favorable operating results of the Group’s energy, real estate and manufacturing businesses. Net income attributable to non-controlling interests Net income attributable to non-controlling interest also decreased by ₱964 million or 22% (from ₱4.5 billion to ₱3.5 billion) mainly due to the lower net income of the First Gen group for the period. The significant portion of this account pertains to the share of non-controlling stockholders of First Gen, EDC, Rockwell and FPIP to the consolidated net income. Earnings per share (EPS) Basic and diluted EPS for the period amounted to ₱4.450. Last year’s basic EPS and diluted EPS were ₱6.249 and ₱6.248, respectively. The decrease was mainly due to the decline in net income attributable to equity holders of the Parent for the period.
14
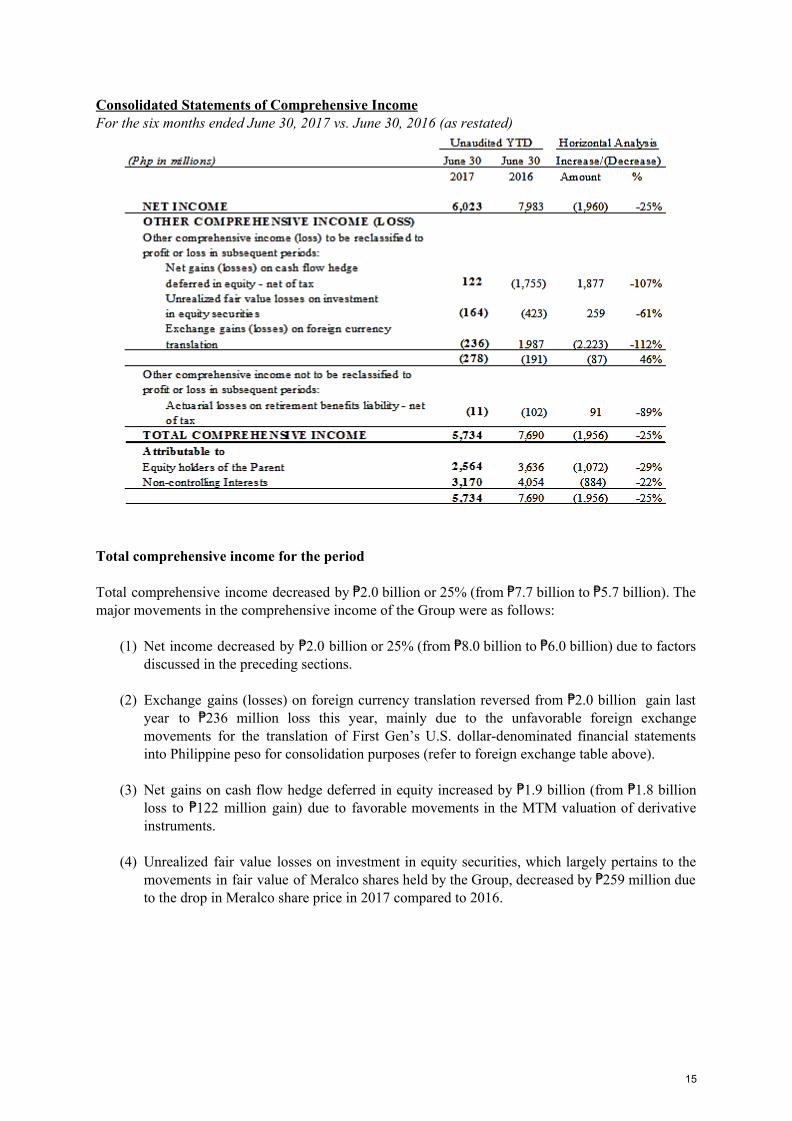
Consolidated Statements of Comprehensive Income For the six months ended June 30, 2017 vs. June 30, 2016 (as restated)
Total comprehensive income for the period Total comprehensive income decreased by ₱2.0 billion or 25% (from ₱7.7 billion to ₱5.7 billion). The major movements in the comprehensive income of the Group were as follows:
(1) Net income decreased by ₱2.0 billion or 25% (from ₱8.0 billion to ₱6.0 billion) due to factors discussed in the preceding sections.
(2) Exchange gains (losses) on foreign currency translation reversed from ₱2.0 billion gain last
year to ₱236 million loss this year, mainly due to the unfavorable foreign exchange movements for the translation of First Gen’s U.S. dollar-denominated financial statements into Philippine peso for consolidation purposes (refer to foreign exchange table above).
(3) Net gains on cash flow hedge deferred in equity increased by ₱1.9 billion (from ₱1.8 billion
loss to ₱122 million gain) due to favorable movements in the MTM valuation of derivative instruments.
(4) Unrealized fair value losses on investment in equity securities, which largely pertains to the
movements in fair value of Meralco shares held by the Group, decreased by ₱259 million due to the drop in Meralco share price in 2017 compared to 2016.
15

Total comprehensive income for the period attributable to equity holders of the Parent Total comprehensive income attributable to equity holders of the Parent decreased by ₱1.0 billion or 29% (from ₱3.6 billion to ₱2.6 billion) mainly due to lower current year net income. Total comprehensive income for the period attributable to non-controlling interests Total comprehensive income attributable to non-controlling interests declined by ₱884 million or 22% (from ₱4.1 billion to ₱3.2 billion) primarily due to the decline in NCI’s share in net income for the period. (Continued next page)
16
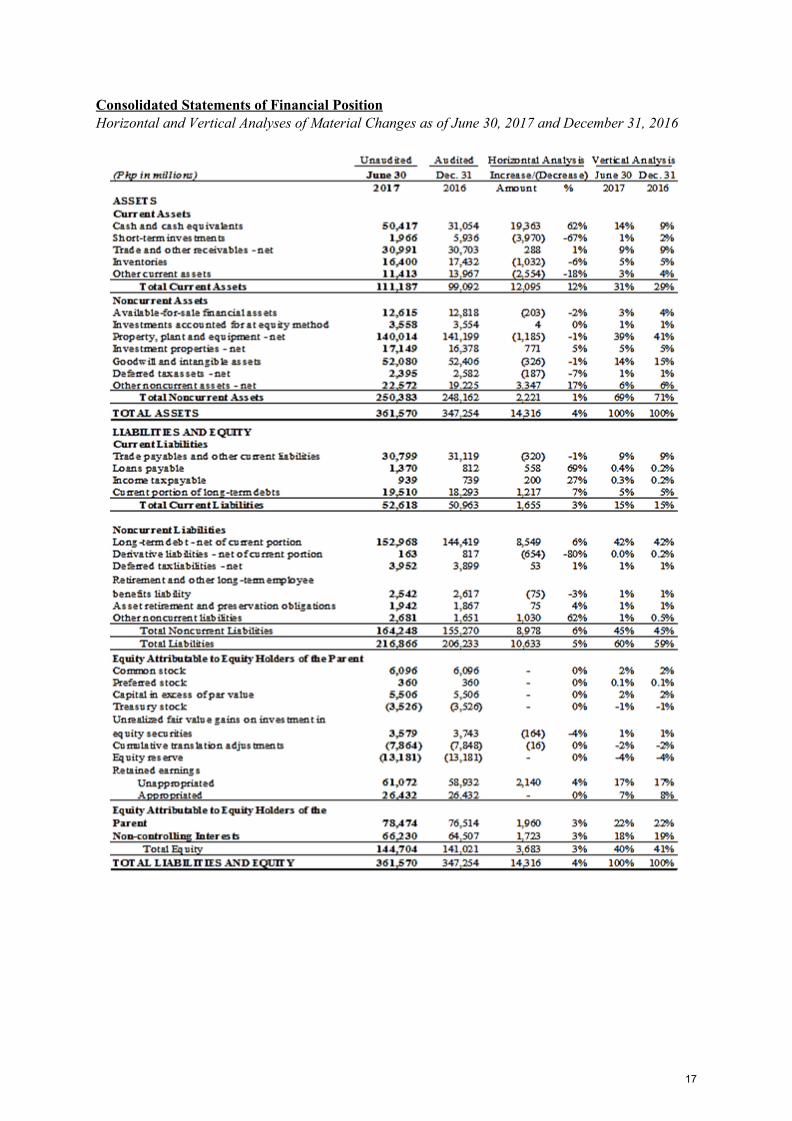
Consolidated Statements of Financial Position Horizontal and Vertical Analyses of Material Changes as of June 30, 2017 and December 31, 2016
17
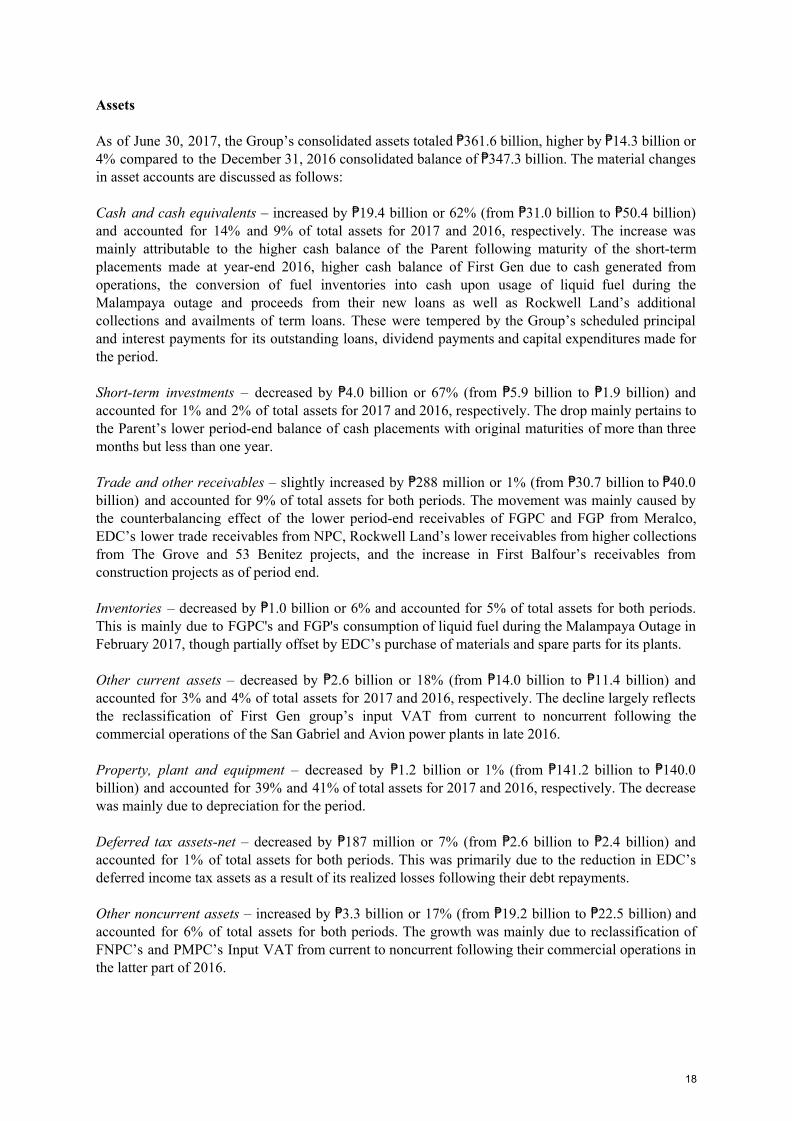
Assets As of June 30, 2017, the Group’s consolidated assets totaled ₱361.6 billion, higher by ₱14.3 billion or 4% compared to the December 31, 2016 consolidated balance of ₱347.3 billion. The material changes in asset accounts are discussed as follows: Cash and cash equivalents – increased by ₱19.4 billion or 62% (from ₱31.0 billion to ₱50.4 billion) and accounted for 14% and 9% of total assets for 2017 and 2016, respectively. The increase was mainly attributable to the higher cash balance of the Parent following maturity of the short-term placements made at year-end 2016, higher cash balance of First Gen due to cash generated from operations, the conversion of fuel inventories into cash upon usage of liquid fuel during the Malampaya outage and proceeds from their new loans as well as Rockwell Land’s additional collections and availments of term loans. These were tempered by the Group’s scheduled principal and interest payments for its outstanding loans, dividend payments and capital expenditures made for the period. Short-term investments – decreased by ₱4.0 billion or 67% (from ₱5.9 billion to ₱1.9 billion) and accounted for 1% and 2% of total assets for 2017 and 2016, respectively. The drop mainly pertains to the Parent’s lower period-end balance of cash placements with original maturities of more than three months but less than one year. Trade and other receivables – slightly increased by ₱288 million or 1% (from ₱30.7 billion to ₱40.0 billion) and accounted for 9% of total assets for both periods. The movement was mainly caused by the counterbalancing effect of the lower period-end receivables of FGPC and FGP from Meralco, EDC’s lower trade receivables from NPC, Rockwell Land’s lower receivables from higher collections from The Grove and 53 Benitez projects, and the increase in First Balfour’s receivables from construction projects as of period end. Inventories – decreased by ₱1.0 billion or 6% and accounted for 5% of total assets for both periods. This is mainly due to FGPC's and FGP's consumption of liquid fuel during the Malampaya Outage in February 2017, though partially offset by EDC’s purchase of materials and spare parts for its plants. Other current assets – decreased by ₱2.6 billion or 18% (from ₱14.0 billion to ₱11.4 billion) and accounted for 3% and 4% of total assets for 2017 and 2016, respectively. The decline largely reflects the reclassification of First Gen group’s input VAT from current to noncurrent following the commercial operations of the San Gabriel and Avion power plants in late 2016. Property, plant and equipment – decreased by ₱1.2 billion or 1% (from ₱141.2 billion to ₱140.0 billion) and accounted for 39% and 41% of total assets for 2017 and 2016, respectively. The decrease was mainly due to depreciation for the period. Deferred tax assets-net – decreased by ₱187 million or 7% (from ₱2.6 billion to ₱2.4 billion) and accounted for 1% of total assets for both periods. This was primarily due to the reduction in EDC’s deferred income tax assets as a result of its realized losses following their debt repayments. Other noncurrent assets – increased by ₱3.3 billion or 17% (from ₱19.2 billion to ₱22.5 billion) and accounted for 6% of total assets for both periods. The growth was mainly due to reclassification of FNPC’s and PMPC’s Input VAT from current to noncurrent following their commercial operations in the latter part of 2016.
18
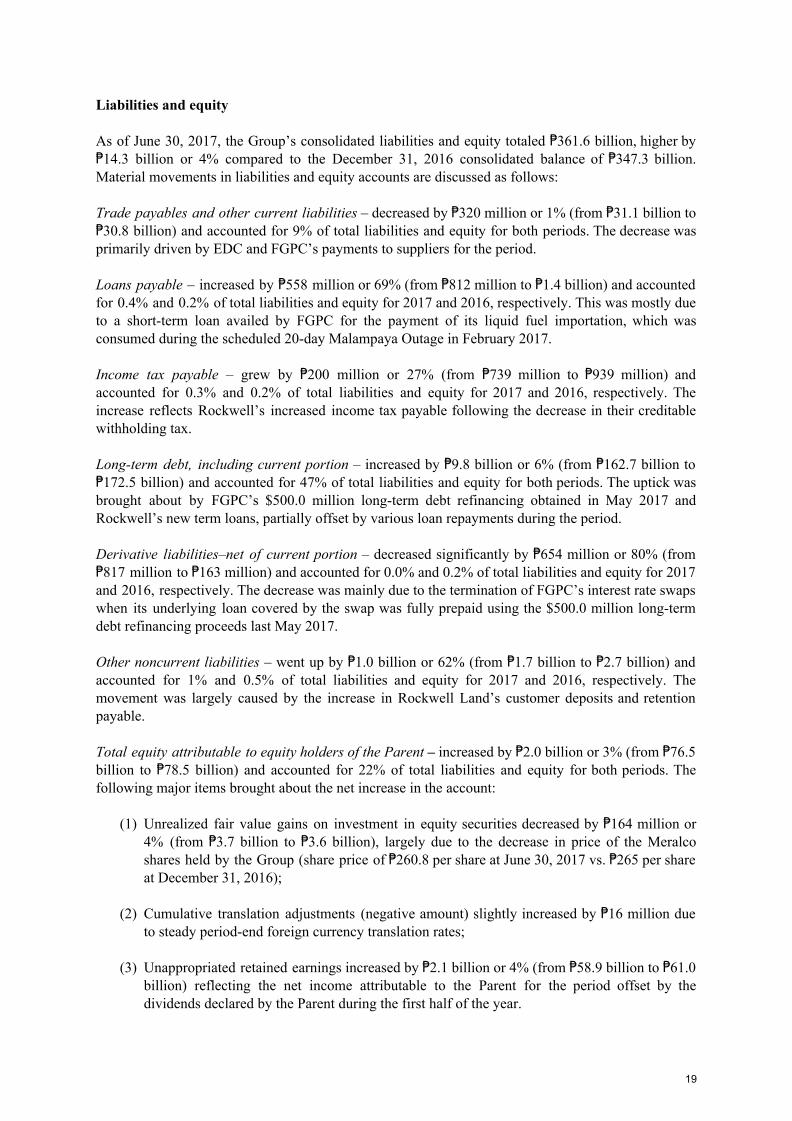
Liabilities and equity As of June 30, 2017, the Group’s consolidated liabilities and equity totaled ₱361.6 billion, higher by ₱14.3 billion or 4% compared to the December 31, 2016 consolidated balance of ₱347.3 billion. Material movements in liabilities and equity accounts are discussed as follows: Trade payables and other current liabilities – decreased by ₱320 million or 1% (from ₱31.1 billion to ₱30.8 billion) and accounted for 9% of total liabilities and equity for both periods. The decrease was primarily driven by EDC and FGPC’s payments to suppliers for the period. Loans payable – increased by ₱558 million or 69% (from ₱812 million to ₱1.4 billion) and accounted for 0.4% and 0.2% of total liabilities and equity for 2017 and 2016, respectively. This was mostly due to a short-term loan availed by FGPC for the payment of its liquid fuel importation, which was consumed during the scheduled 20-day Malampaya Outage in February 2017. Income tax payable – grew by ₱200 million or 27% (from ₱739 million to ₱939 million) and accounted for 0.3% and 0.2% of total liabilities and equity for 2017 and 2016, respectively. The increase reflects Rockwell’s increased income tax payable following the decrease in their creditable withholding tax. Long-term debt, including current portion – increased by ₱9.8 billion or 6% (from ₱162.7 billion to ₱172.5 billion) and accounted for 47% of total liabilities and equity for both periods. The uptick was brought about by FGPC’s $500.0 million long-term debt refinancing obtained in May 2017 and Rockwell’s new term loans, partially offset by various loan repayments during the period. Derivative liabilities–net of current portion – decreased significantly by ₱654 million or 80% (from ₱817 million to ₱163 million) and accounted for 0.0% and 0.2% of total liabilities and equity for 2017 and 2016, respectively. The decrease was mainly due to the termination of FGPC’s interest rate swaps when its underlying loan covered by the swap was fully prepaid using the $500.0 million long-term debt refinancing proceeds last May 2017. Other noncurrent liabilities – went up by ₱1.0 billion or 62% (from ₱1.7 billion to ₱2.7 billion) and accounted for 1% and 0.5% of total liabilities and equity for 2017 and 2016, respectively. The movement was largely caused by the increase in Rockwell Land’s customer deposits and retention payable. Total equity attributable to equity holders of the Parent – increased by ₱2.0 billion or 3% (from ₱76.5 billion to ₱78.5 billion) and accounted for 22% of total liabilities and equity for both periods. The following major items brought about the net increase in the account:
(1) Unrealized fair value gains on investment in equity securities decreased by ₱164 million or 4% (from ₱3.7 billion to ₱3.6 billion), largely due to the decrease in price of the Meralco shares held by the Group (share price of ₱260.8 per share at June 30, 2017 vs. ₱265 per share at December 31, 2016);
(2) Cumulative translation adjustments (negative amount) slightly increased by ₱16 million due
to steady period-end foreign currency translation rates;
(3) Unappropriated retained earnings increased by ₱2.1 billion or 4% (from ₱58.9 billion to ₱61.0 billion) reflecting the net income attributable to the Parent for the period offset by the dividends declared by the Parent during the first half of the year.
19

Non-controlling interests – increased by ₱1.7 billion or 3% (from ₱64.5 billion to ₱66.2 billion) and accounted for 18% and 19% of total liabilities and equity for 2017 and 2016, respectively. Non-controlling interests represent the portion of net assets not held by the Group, particularly in First Gen and EDC, Rockwell Land, FPIP, and FPIC. The increase was mainly due to non-controlling interests’ share in the Group’s net earnings and other comprehensive income, partly offset by dividends declared to minority stockholders during the period.
* * * * *
20

KEY PERFORMANCE INDICATORS
The following are the key performance indicators of the Group:
Performance Indicator June 30
2017
2016 (As restated)
Return on Average Shareholder's Equity (%)*- annualized 5.68 8.46
Interest Coverage Ratio 2.59 3.17
Diluted Earnings per Share ₱4.450 ₱6.248 Annualized return on average equity declined from 8.46% in 2016 to 5.68% this year due to the decrease in annualized net income attributable to Parent by ₱1.99 billion or 28.36% (from ₱7.02 billion to ₱5.03 billion). Interest coverage ratio also declined from 3.17:1 in 2016 to 2.59:1 this year due to the ₱1.21 billion or 7.89% drop in consolidated earnings before interest expense and taxes (from ₱15.30 billion to ₱14.10 billion) aggravated by the increase in finance cost by ₱599.00 million or 12.40% (from ₱4.83 billion to ₱5.43 billion). Earnings per common share (diluted) slid from ₱6.248 to ₱4.450 or 28.78% as the decline in consolidated net income attributable to equity holders of the Parent resulted into lower net earnings available to common shareholders for the current period.
Performance Indicator June 30 December 31
2017 2016
Asset to Equity Ratio 2.50 2.46
Debt to Equity Ratio 1.19 1.15
Current Ratio 2.11 1.94
Quick Ratio 1.58 1.33
Book Value per Common Share* ₱161.983 ₱158.417
The ratio of total assets to total equity slightly increased from 2.46:1 in 2016 to 2.50:1 this year mainly due to the growth in total assets by ₱14.32 billion or 4.12%, partially offset by ₱3.68 billion or 2.61% increase in stockholder’s equity. The ₱14.32 billion jump in total assets (from ₱347.25 billion in December 2016 to ₱361.57 billion in June 2017) was mainly brought by the ₱15.39 billion or 41.61% net increase in cash and cash equivalents and short-term investments (from ₱36.99 billion in December 2016 to ₱52.38 billion in June 2017) . The growth was mainly on account of the proceeds from the new loans availed by FGPC, EDC and Rockwell supplemented by the cash generated from the Group’s operating activities during the first six months. This was however partly reduced by the
21
Group’s scheduled principal and interest payments, dividend payments and capital expenditures during the first half of the year.. The debt to equity also ratio inched higher from 1.15:1 in 2016 to 1.19:1 in 2017 primarily due to the increase in the Group’s total debt by ₱9.77 billion or 6.00% (from ₱162.71 billion in December 2016 to ₱172.48 billion in June 2017). This mainly resulted from the $500.0 million long-term debt refinancing obtained by FGPC partially offset by the loan repayments made by the Group during the period. Current ratio posted an upward movement from 1.94:1 in 2016 to 2.11:1 this year primarily due to the ₱12.10 billion or 12.21% increase in the balance of current assets (from ₱99.09 billion in December 2016 to ₱111.19 billion in June 2017). This increment in current assets was driven by the higher ending cash balance of the Group. For the same reason, quick ratio also increased from 1.33:1 at December 2016 to 1.58:1 at June 2017. Book value per common share grew from ₱158.417 in 2016 to ₱161.983 this year. The increase was brought about by the ₱1.98 billion or 2.25% increase in equity attributable to equity holders of the Parent (from ₱87.80 billion in December 2016 to ₱89.77 billion in June 2017) for the current period, which mostly reflects the net income generated during the period. Outstanding shares stood at 554,207 thousand for both reporting periods.
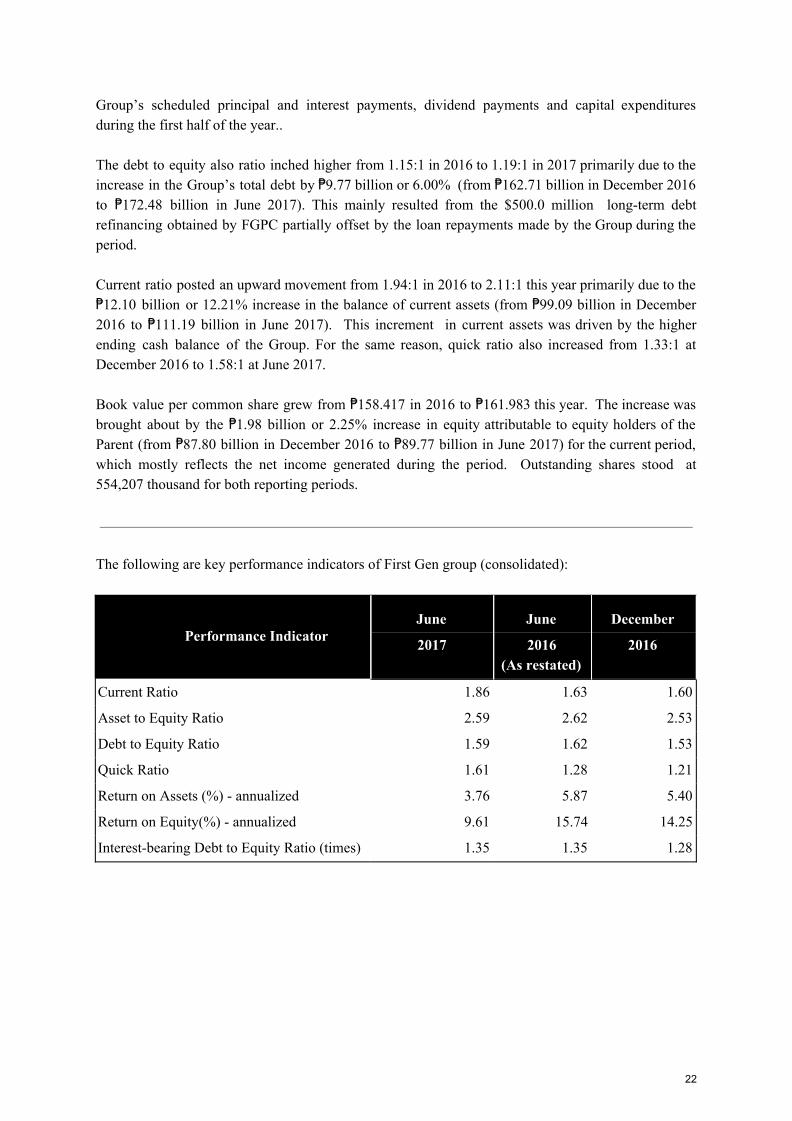
The following are key performance indicators of First Gen group (consolidated):
Performance Indicator June June December
2017
2016 (As restated)
2016
Current Ratio 1.86 1.63 1.60
Asset to Equity Ratio 2.59 2.62 2.53
Debt to Equity Ratio 1.59 1.62 1.53
Quick Ratio 1.61 1.28 1.21
Return on Assets (%) - annualized 3.76 5.87 5.40
Return on Equity(%) - annualized 9.61 15.74 14.25
Interest-bearing Debt to Equity Ratio (times) 1.35 1.35 1.28
22
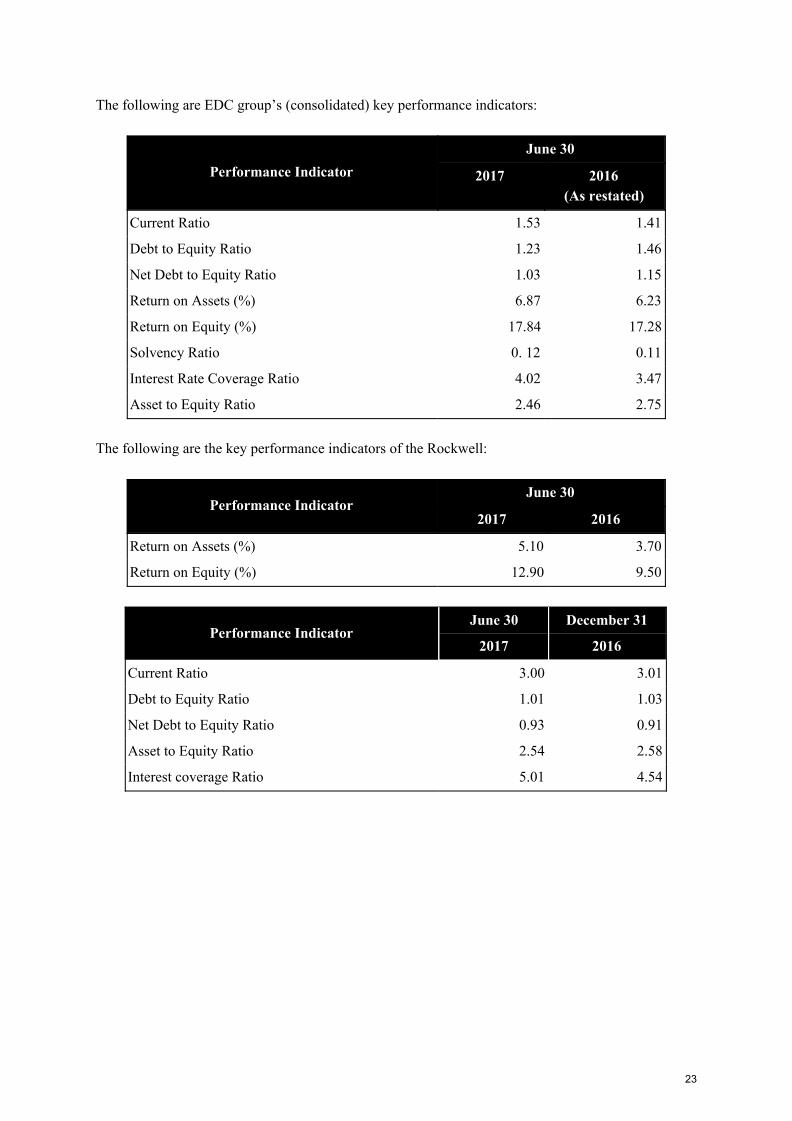
The following are EDC group’s (consolidated) key performance indicators:
Performance Indicator June 30
2017
2016 (As restated)
Current Ratio 1.53 1.41
Debt to Equity Ratio 1.23 1.46
Net Debt to Equity Ratio 1.03 1.15
Return on Assets (%) 6.87 6.23
Return on Equity (%) 17.84 17.28
Solvency Ratio 0. 12 0.11
Interest Rate Coverage Ratio 4.02 3.47
Asset to Equity Ratio 2.46 2.75 The following are the key performance indicators of the Rockwell:
Performance Indicator June 30
2017 2016
Return on Assets (%) 5.10 3.70
Return on Equity (%) 12.90 9.50
Performance Indicator June 30 December 31
2017 2016
Current Ratio 3.00 3.01
Debt to Equity Ratio 1.01 1.03
Net Debt to Equity Ratio 0.93 0.91
Asset to Equity Ratio 2.54 2.58
Interest coverage Ratio 5.01 4.54
23
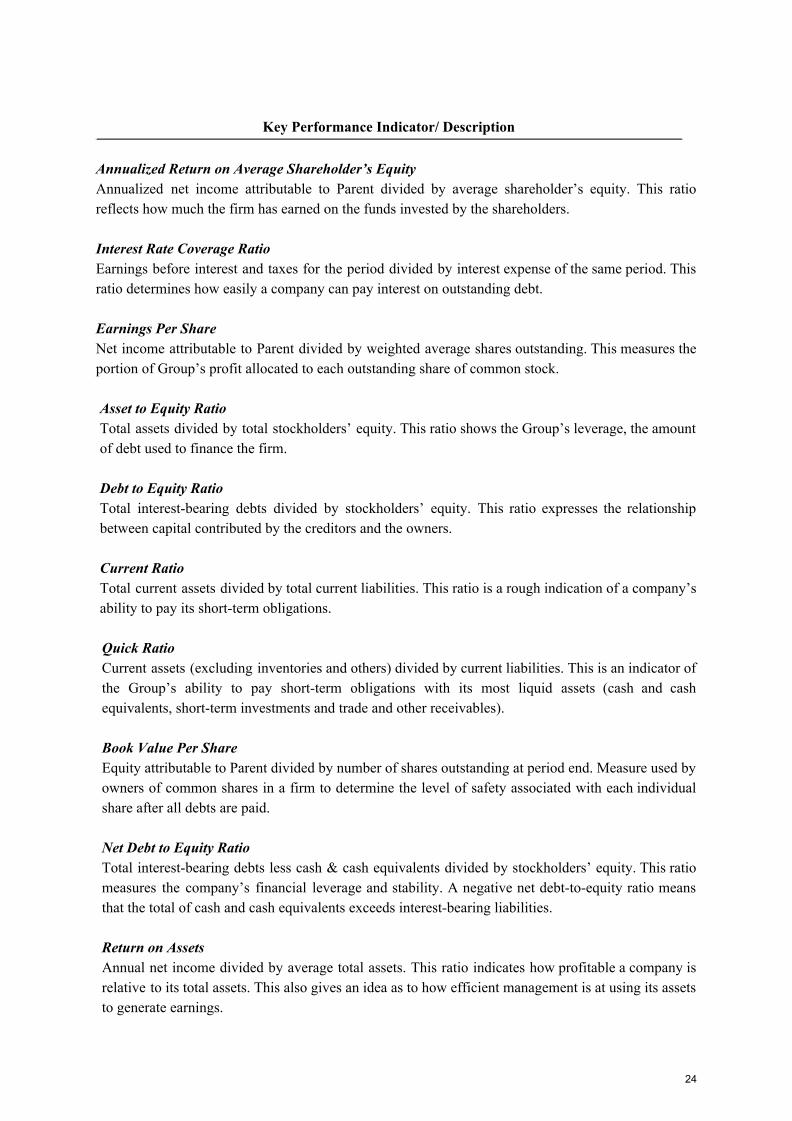
Key Performance Indicator/ Description
Annualized Return on Average Shareholder’s Equity Annualized net income attributable to Parent divided by average shareholder’s equity. This ratio reflects how much the firm has earned on the funds invested by the shareholders. Interest Rate Coverage Ratio Earnings before interest and taxes for the period divided by interest expense of the same period. This ratio determines how easily a company can pay interest on outstanding debt. Earnings Per Share Net income attributable to Parent divided by weighted average shares outstanding. This measures the portion of Group’s profit allocated to each outstanding share of common stock. Asset to Equity Ratio Total assets divided by total stockholders’ equity. This ratio shows the Group’s leverage, the amount of debt used to finance the firm. Debt to Equity Ratio Total interest-bearing debts divided by stockholders’ equity. This ratio expresses the relationship between capital contributed by the creditors and the owners. Current Ratio Total current assets divided by total current liabilities. This ratio is a rough indication of a company’s ability to pay its short-term obligations. Quick Ratio Current assets (excluding inventories and others) divided by current liabilities. This is an indicator of the Group’s ability to pay short-term obligations with its most liquid assets (cash and cash equivalents, short-term investments and trade and other receivables). Book Value Per Share Equity attributable to Parent divided by number of shares outstanding at period end. Measure used by owners of common shares in a firm to determine the level of safety associated with each individual share after all debts are paid. Net Debt to Equity Ratio Total interest-bearing debts less cash & cash equivalents divided by stockholders’ equity. This ratio measures the company’s financial leverage and stability. A negative net debt-to-equity ratio means that the total of cash and cash equivalents exceeds interest-bearing liabilities. Return on Assets Annual net income divided by average total assets. This ratio indicates how profitable a company is relative to its total assets. This also gives an idea as to how efficient management is at using its assets to generate earnings.
24

Return on Equity Annual net income divided by average total stockholders’ equity. This ratio reveals how much profit a company earned in comparison to the total amount of shareholder equity found on the balance sheet. Interest Rate Coverage Ratio Earnings before interest and taxes of one period divided by interest expense of the same period. This ratio determines how easily a company can pay interest on outstanding debt. Asset-to-Equity Ratio Total assets divided by total stockholders’ equity. This ratio shows a company’s leverage, the amount of debt used to finance the firm. Solvency Ratio Net income excluding depreciation and non-cash provisions divided by total debt obligations. This ratio gauges a company’s ability to meet its long-term obligations. Interest-bearing Debt to Equity Ratio (times) Calculated by dividing total interest-bearing debt over total equity. This ratio measures the percentage of funds provided by the lenders/creditors. * - Equity pertains to equity attributable to equity holders of the parent and excludes cumulative translation adjustments, share in other comprehensive income, effect of equity transaction of subsidiaries and excess of acquisition cost over carrying value of minority interest.
* * * * *
25
Other Financial Information (i) Any known trends, demands, commitments, events or uncertainties that will have a material impact on the
issuer’s liquidity. There are no known trends, demands, commitments, events or uncertainties that will have a material impact
on liquidity except as otherwise disclosed or discussed herein. (ii) Any event that will trigger direct or contingent financial obligation that is material to the company, including
any default or acceleration of an obligation. The registrant’s current financing arrangements include standard provisions relating to events of default.
Any breach of the loan covenants or material adverse change may result in an event of default. The company is in compliance with its loan covenants during the reporting period.
(iii) All material off-balance sheet transactions, arrangements, obligations (including contingent obligations),
and other relationships of the company with unconsolidated entities or other persons created during the reporting period.
The company did not enter into any material off-balance sheet transactions, arrangements, obligations
(including contingent obligations), and other relationships with unconsolidated entities or other persons during the reporting period.
(iv) Any material commitment for capital expenditures, the general purpose of such commitments, and the
expected sources of funds for such expenditures should be described. There are no material commitments for capital expenditures except as otherwise disclosed or discussed
herein. (v) Any known trends, events or uncertainties that have had or that are reasonably expected to have a material
impact on net sales or revenues or income from continuing operations. There are no known trends, events or uncertainties that have had or that are reasonably expected to have a
material impact on net sales or revenues or income from continuing operations except as otherwise disclosed or discussed herein.
(vi) Any significant elements of income or loss that did not arise from the registrant’s continuing operations. During the period, there are no significant elements of income or loss that did not arise from the registrant’s
continuing operations. PART II--OTHER INFORMATION The Company has no other information that needs to be disclosed other than disclosures made under SEC Form 17-C or as discussed herein.
26

46.47%V&E
52.5% V&E
79.3%V
56.6%E
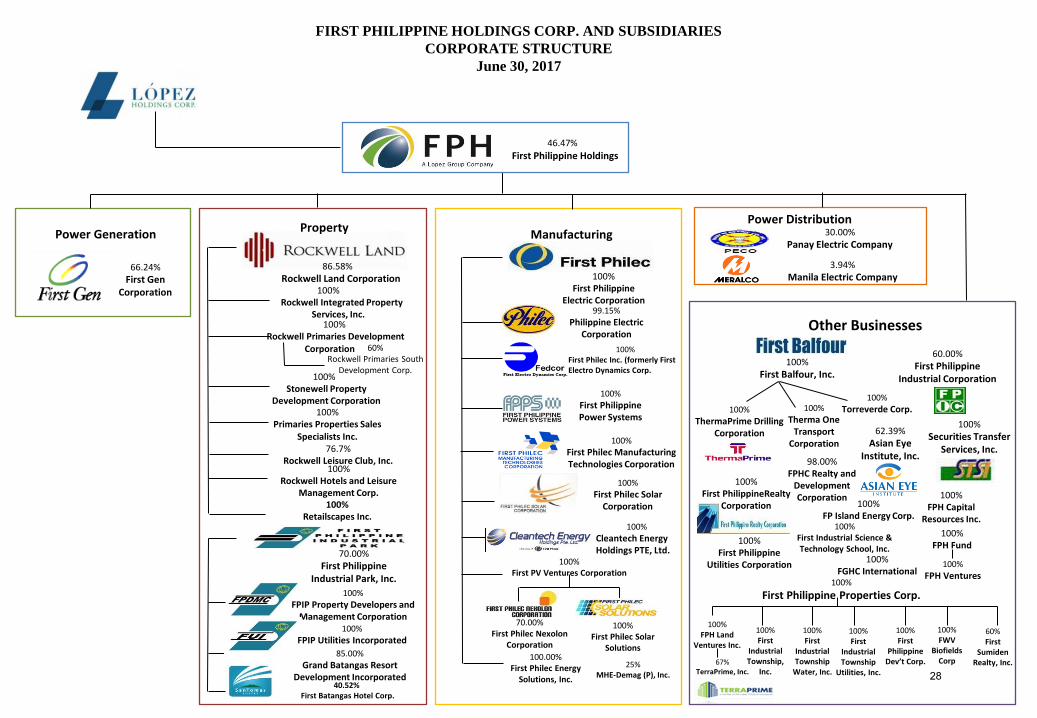
FIRST PHILIPPINE HOLDINGS CORPORATION AND SUBSIDIARIES
CORPORATE STRUCTURE
June 30, 2017
27
FIRST PHILIPPINE HOLDINGS CORP. AND SUBSIDIARIES
CORPORATE STRUCTURE
June 30, 2017
100%
Therma One Transport
Corporation
46.47%
First Philippine Holdings
66.24% First Gen
Corporation
86.58% Rockwell Land Corporation
70.00% First Philippine
Industrial Park, Inc.
100% First Philippine
Electric Corporation
100%
First Philec Solar Corporation
99.15%
Philippine Electric Corporation
100% First Balfour, Inc.
60.00% First Philippine
Industrial Corporation
100% Securities Transfer
Services, Inc.
67% TerraPrime, Inc.
100%
ThermaPrime Drilling Corporation
Power Generation Property
Manufacturing 30.00% Panay Electric Company
Power Distribution
Other Businesses
100%
First Philec Manufacturing Technologies Corporation
100% First Philec Inc. (formerly First Electro Dynamics Corp.
100%
First Philippine Power Systems
100% First PV Ventures Corporation
70.00% First Philec Nexolon
Corporation
100% First Philec Solar
Solutions
100% FPH Fund
100%
FPH Ventures
100% FGHC International
100% First Philippine
Utilities Corporation
100% First PhilippineRealty
Corporation
98.00% FPHC Realty and
Development Corporation 100%
FPH Capital Resources Inc.
100% Rockwell Integrated Property
Services, Inc. 100%
Rockwell Primaries Development Corporation
100% Stonewell Property
Development Corporation
100%
Cleantech Energy Holdings PTE, Ltd.
100% Primaries Properties Sales
Specialists Inc.
100%
First Philippine Properties Corp.
100% First
Philippine Dev’t Corp.
76.7% Rockwell Leisure Club, Inc.
100% Rockwell Hotels and Leisure
Management Corp.
100% FPH Land
Ventures Inc.
100%
FPIP Property Developers and Management Corporation
100%
FPIP Utilities Incorporated
85.00%
Grand Batangas Resort Development Incorporated
40.52% First Batangas Hotel Corp.
25% MHE-Demag (P), Inc.
100% FWV
Biofields Corp
60% First
Sumiden Realty, Inc.
100% First
Industrial Township,
Inc.
100% First
Industrial Township
Water, Inc.
100% First
Industrial Township
Utilities, Inc.
100% Retailscapes Inc.
60% Rockwell Primaries South
Development Corp.
3.94% Manila Electric Company
100.00% First Philec Energy
Solutions, Inc.
100%
Torreverde Corp.
100% First Industrial Science & Technology School, Inc.
62.39% Asian Eye
Institute, Inc.
100% FP Island Energy Corp.
28
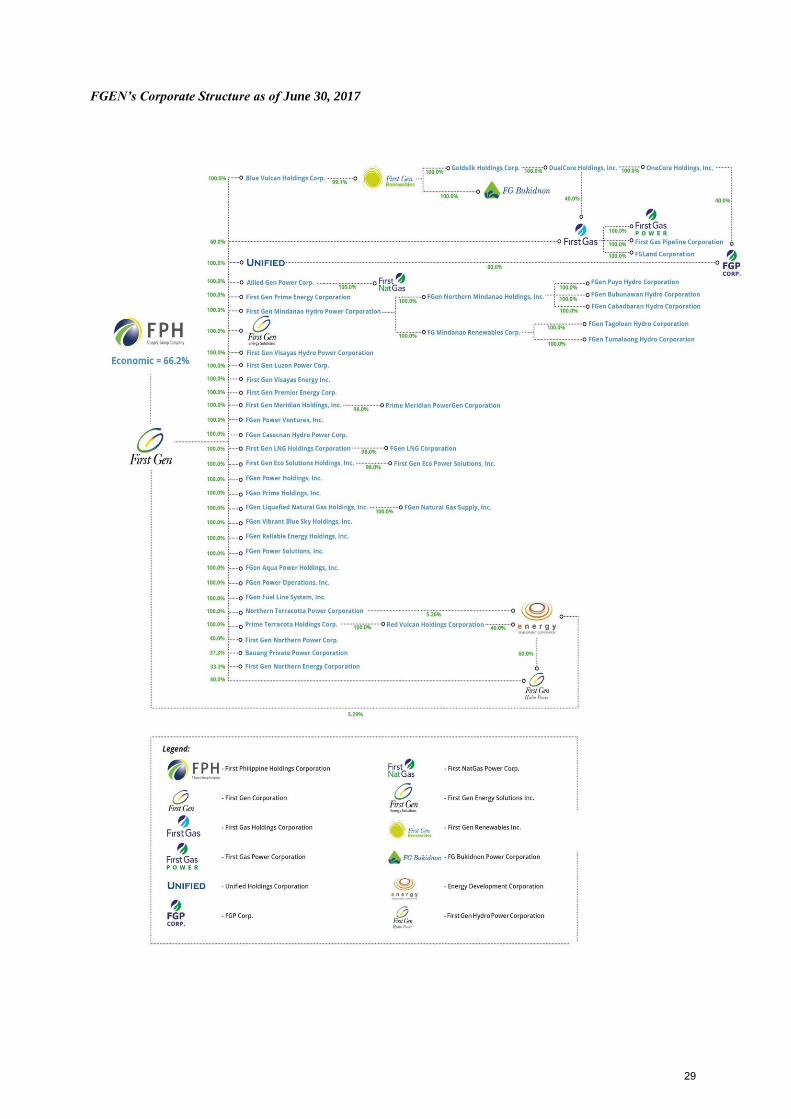
FGEN’s Corporate Structure as of June 30, 2017
29
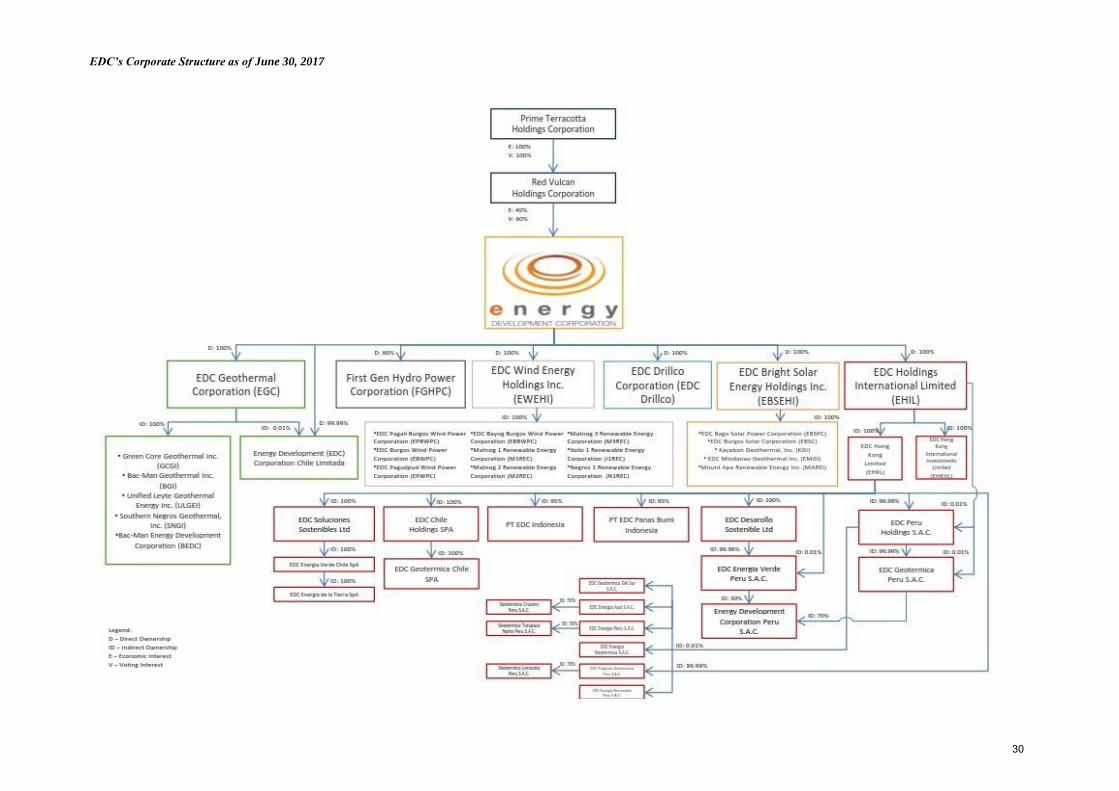
EDC’s Corporate Structure as of June 30, 2017
30

EXHIBIT “A”
33
COVER SHEET
for UNAUDITED INTERIM FINANCIAL STATEMENTS
SEC Registration Number
1 9 0 7 3
Company Name
F I R S T P H I L I P P I N E H O L D I N G S C O R P
O R A T I O N
Principal Office (No./Street/Barangay/City/Town/Province)
6 t h F l o o r , R o c k w e l l B u s i n e s s
C e n t e r T o w e r 3 , O r t i g a s A v e n u e
P a s i g C i t y
Form Type Department requiring the report Secondary License Type, If Applicable
C F S - U N A U D I T E D
COMPANY INFORMATION
Company’s Email Address Company’s Telephone Number/s Mobile Number
[email protected] (02) 631-8024
No. of Stockholders
Annual Meeting Month/Day
Fiscal Year Month/Day
12,122 May 29 December 31
CONTACT PERSON INFORMATION The designated contact person MUST be an Officer of the Corporation
Name of Contact Person Email Address Telephone Number/s Mobile Number
Carmina Z. Ubaña [email protected] 449-6253 09173279054
Contact Person’s Address
6th
Floor, Rockwell Business Center Tower 3, Ortigas Avenue, Pasig City, 1604 Philippines
Note: In case of death, resignation or cessation of office of the officer designated as contact person, such incident shall be reported to the Commission within thirty (30) calendar days from the occurrence thereof with information and complete contact details of the new contact person designated.
32

First Philippine Holdings Corporation and Subsidiaries
Unaudited Consolidated Financial Statements
June 30, 2017 and 2016 (With Comparative Audited Figures as at December 31, 2016)
34
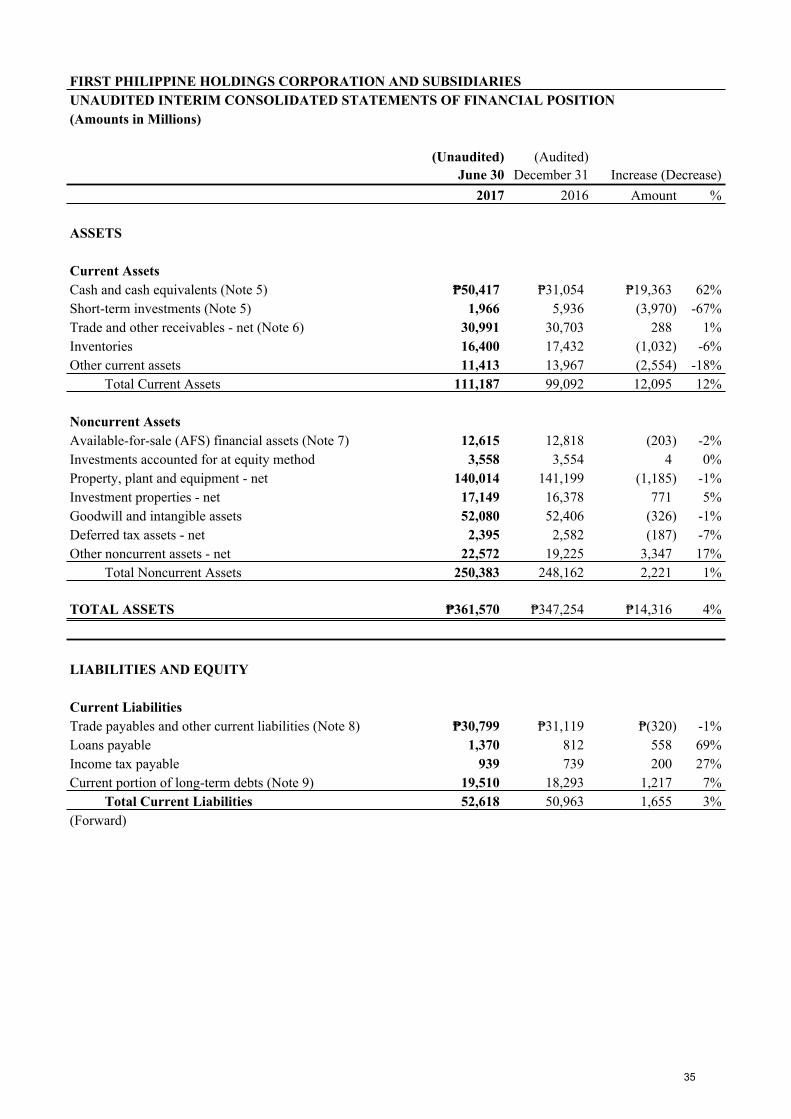
FIRST PHILIPPINE HOLDINGS CORPORATION AND SUBSIDIARIESUNAUDITED INTERIM CONSOLIDATED STATEMENTS OF FINANCIAL POSITION(Amounts in Millions)
(Unaudited) (Audited)June 30 December 31 Increase (Decrease)
2017 2016 Amount %
ASSETS
Current AssetsCash and cash equivalents (Note 5) ₱50,417) ₱31,054) ₱19,363) 62%Short-term investments (Note 5) ( 1,966) ( 5,936) ( (3,970) -67%Trade and other receivables - net (Note 6) ( 30,991) ( 30,703) ( 288) 1%Inventories ( 16,400) ( 17,432) ( (1,032) -6%Other current assets ( 11,413) ( 13,967) ( (2,554) -18% Total Current Assets ( 111,187) ( 99,092) ( 12,095) 12%
Noncurrent AssetsAvailable-for-sale (AFS) financial assets (Note 7) ( 12,615) ( 12,818) ( (203) -2%Investments accounted for at equity method ( 3,558) ( 3,554) ( 4) 0%Property, plant and equipment - net ( 140,014) ( 141,199) ( (1,185) -1%Investment properties - net ( 17,149) ( 16,378) ( 771) 5%Goodwill and intangible assets ( 52,080) ( 52,406) ( (326) -1%Deferred tax assets - net ( 2,395) ( 2,582) ( (187) -7%Other noncurrent assets - net ( 22,572) ( 19,225) ( 3,347) 17% Total Noncurrent Assets ( 250,383) ( 248,162) ( 2,221) 1%
TOTAL ASSETS ₱361,570) ₱347,254) ₱14,316) 4%
LIABILITIES AND EQUITY
Current LiabilitiesTrade payables and other current liabilities (Note 8) ₱30,799) ₱31,119) ₱(320) -1%Loans payable ( 1,370) ( 812) ( 558) 69%Income tax payable ( 939) ( 739) ( 200) 27%Current portion of long-term debts (Note 9) ( 19,510) ( 18,293) ( 1,217) 7% Total Current Liabilities ( 52,618) ( 50,963) ( 1,655) 3%(Forward)
35
(Unaudited) (Audited)June 30 December 31 Increase (Decrease)
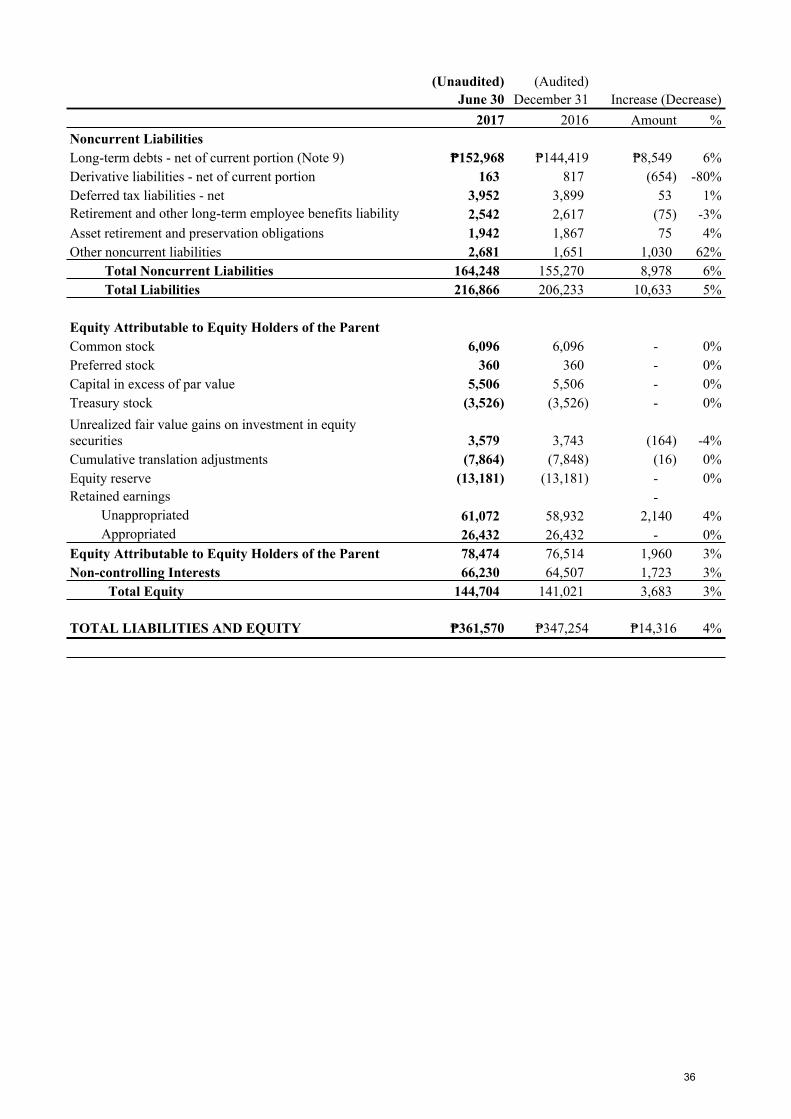
2017 2016 Amount %Noncurrent LiabilitiesLong-term debts - net of current portion (Note 9) ₱152,968 ₱144,419 ₱8,549) 6%Derivative liabilities - net of current portion ( 163) ( 817) ( (654) -80%Deferred tax liabilities - net ( 3,952) ( 3,899) ( 53) 1%Retirement and other long-term employee benefits liability ( 2,542) ( 2,617) ( (75) -3%Asset retirement and preservation obligations ( 1,942) ( 1,867) ( 75) 4%Other noncurrent liabilities ( 2,681) ( 1,651) ( 1,030) 62% Total Noncurrent Liabilities ( 164,248) ( 155,270) ( 8,978) 6% Total Liabilities ( 216,866) ( 206,233) ( 10,633) 5%
Equity Attributable to Equity Holders of the ParentCommon stock ( 6,096) ( 6,096) ( - ) 0%Preferred stock ( 360) ( 360) ( - ) 0%Capital in excess of par value ( 5,506) ( 5,506) ( - ) 0%Treasury stock ( (3,526) ( (3,526) ( - ) 0%Unrealized fair value gains on investment in equity securities ( 3,579) ( 3,743) ( (164) -4%Cumulative translation adjustments ( (7,864) ( (7,848) ( (16) 0%Equity reserve ( (13,181) ( (13,181) ( - ) 0%Retained earnings ( - ) Unappropriated ( 61,072) ( 58,932) ( 2,140) 4% Appropriated ( 26,432) ( 26,432) ( - ) 0%Equity Attributable to Equity Holders of the Parent ( 78,474) ( 76,514) ( 1,960) 3%Non-controlling Interests ( 66,230) ( 64,507) ( 1,723) 3% Total Equity ( 144,704) ( 141,021) ( 3,683) 3%
TOTAL LIABILITIES AND EQUITY ₱361,570 ₱347,254 ₱14,316 4%
36
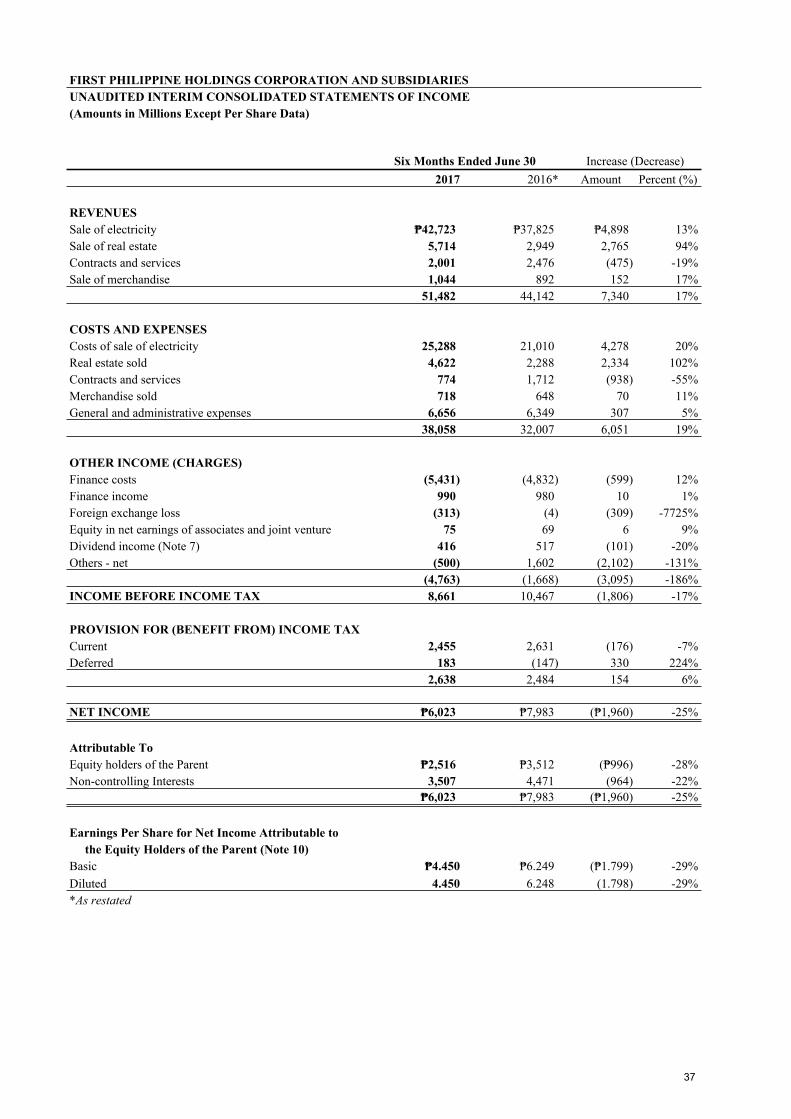
FIRST PHILIPPINE HOLDINGS CORPORATION AND SUBSIDIARIESUNAUDITED INTERIM CONSOLIDATED STATEMENTS OF INCOME(Amounts in Millions Except Per Share Data)
Six Months Ended June 30 Increase (Decrease)2017 2016* Amount Percent (%)
REVENUESSale of electricity ₱42,723) ₱37,825) ₱4,898) 13%Sale of real estate ( 5,714) ( 2,949) ( 2,765) 94%Contracts and services ( 2,001) ( 2,476) ( (475) -19%Sale of merchandise ( 1,044) ( 892) ( 152) 17%
( 51,482) ( 44,142) ( 7,340) 17%
COSTS AND EXPENSESCosts of sale of electricity ( 25,288) ( 21,010) ( 4,278) 20%Real estate sold ( 4,622) ( 2,288) ( 2,334) 102%Contracts and services ( 774) ( 1,712) ( (938) -55%Merchandise sold ( 718) ( 648) ( 70) 11%General and administrative expenses ( 6,656) ( 6,349) ( 307) 5%
( 38,058) ( 32,007) ( 6,051) 19%
OTHER INCOME (CHARGES)Finance costs ( (5,431) ( (4,832) ( (599) 12%Finance income ( 990) ( 980) ( 10) 1%Foreign exchange loss ( (313) ( (4) ( (309) -7725%Equity in net earnings of associates and joint venture ( 75) ( 69) ( 6) 9%Dividend income (Note 7) ( 416) ( 517) ( (101) -20%Others - net ( (500) ( 1,602) ( (2,102) -131%
( (4,763) ( (1,668) ( (3,095) -186%INCOME BEFORE INCOME TAX ( 8,661) ( 10,467) ( (1,806) -17%
PROVISION FOR (BENEFIT FROM) INCOME TAX Current ( 2,455) ( 2,631) ( (176) -7%Deferred ( 183) ( (147) ( 330) 224%
( 2,638) ( 2,484) ( 154) 6%
NET INCOME ₱6,023) ₱7,983) (₱1,960) -25%
Attributable ToEquity holders of the Parent ₱2,516) ₱3,512) (₱996) -28%Non-controlling Interests ( 3,507) ( 4,471) ( (964) -22%
₱6,023) ₱7,983) (₱1,960) -25%
Earnings Per Share for Net Income Attributable to the Equity Holders of the Parent (Note 10)Basic ₱4.450 ₱6.249) (₱1.799) -29%Diluted 4.450 ( 6.248) ( (1.798) -29%*As restated
37
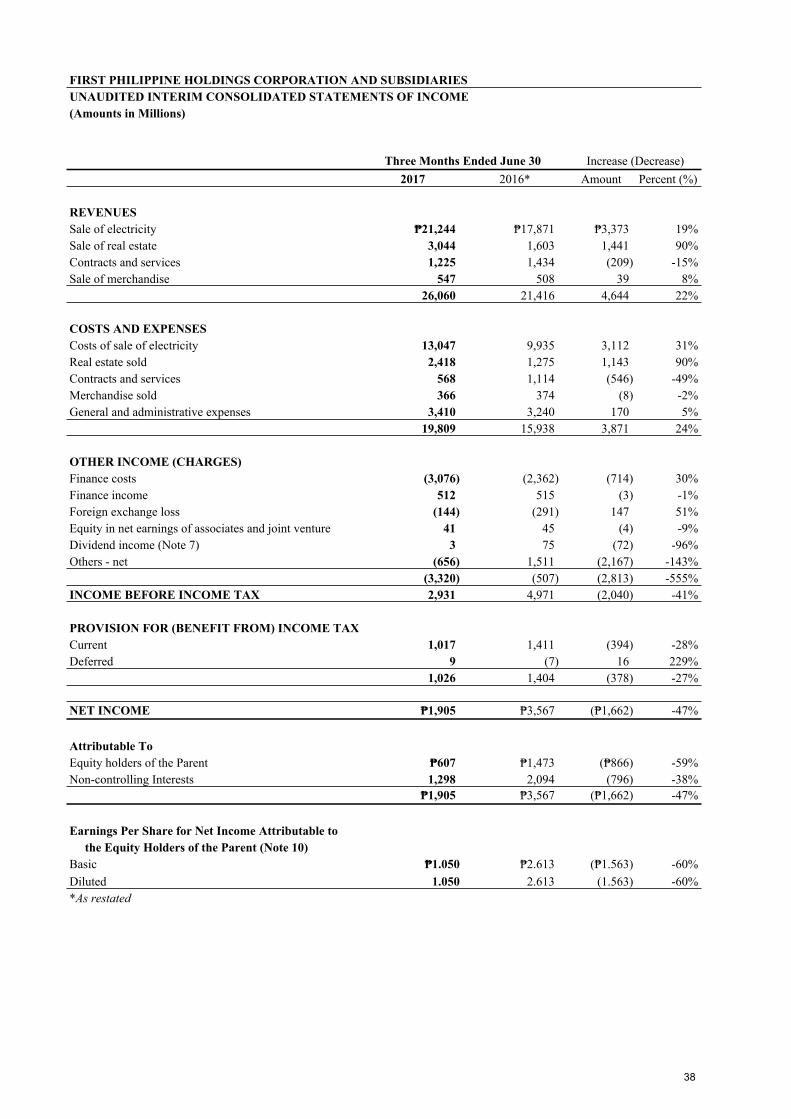
FIRST PHILIPPINE HOLDINGS CORPORATION AND SUBSIDIARIESUNAUDITED INTERIM CONSOLIDATED STATEMENTS OF INCOME(Amounts in Millions)
Three Months Ended June 30 Increase (Decrease)2017 2016* Amount Percent (%)
REVENUESSale of electricity ₱21,244) ₱17,871) ₱3,373) 19%Sale of real estate ( 3,044) ( ( 1,603) ( 1,441) 90%Contracts and services ( 1,225) ( ( 1,434) ( (209) -15%Sale of merchandise ( 547) ( ( 508) ( 39) 8%
( 26,060) ( 21,416) ( 4,644) 22%
COSTS AND EXPENSESCosts of sale of electricity ( 13,047) ( ( 9,935) ( 3,112) 31%Real estate sold ( 2,418) ( ( 1,275) ( 1,143) 90%Contracts and services ( 568) ( ( 1,114) ( (546) -49%Merchandise sold ( 366) ( ( 374) ( (8) -2%General and administrative expenses ( 3,410) ( ( 3,240) ( 170) 5%
( 19,809) ( 15,938) ( 3,871) 24%
OTHER INCOME (CHARGES)Finance costs ( (3,076) ( ( (2,362) ( (714) 30%Finance income ( 512) ( ( 515) ( (3) -1%Foreign exchange loss ( (144) ( ( (291) ( 147) 51%Equity in net earnings of associates and joint venture ( 41) ( ( 45) ( (4) -9%Dividend income (Note 7) ( 3) ( ( 75) ( (72) -96%Others - net ( (656) ( ( 1,511) ( (2,167) -143%
( (3,320) ( (507) ( (2,813) -555%INCOME BEFORE INCOME TAX ( 2,931) ( 4,971) ( (2,040) -41%
PROVISION FOR (BENEFIT FROM) INCOME TAX Current ( 1,017) ( ( 1,411) ( (394) -28%Deferred ( 9) ( ( (7) ( 16) 229%
( 1,026) ( 1,404) ( (378) -27%
NET INCOME ₱1,905) ₱3,567) (₱1,662) -47%
Attributable ToEquity holders of the Parent ₱607) ( ₱1,473) (₱866) -59%Non-controlling Interests ( 1,298) ( ( 2,094) ( (796) -38%
₱1,905) ₱3,567) (₱1,662) -47%
Earnings Per Share for Net Income Attributable to the Equity Holders of the Parent (Note 10)Basic ₱1.050 ₱2.613) (₱1.563) -60%Diluted 1.050 ( 2.613) ( (1.563) -60%*As restated
38

FIRST PHILIPPINE HOLDINGS CORPORATION AND SUBSIDIARIESUNAUDITED INTERIM CONSOLIDATED STATEMENTS OF COMPREHENSIVE INCOME(Amounts in Millions)
(Unaudited)Six Months Ended June 30 Increase/(Decrease)
2017 2016* Amount Percent (%)
NET INCOME ₱6,023) ₱7,983) ₱(1,960) -25%
OTHER COMPREHENSIVE INCOME (LOSS)Other comprehensive income (loss) to be reclassified to profit or loss in subsequent periods: Net gains (losses) on cash flow hedge deferred in equity - net of tax (122) (1,755) (1,877) -107% Unrealized losses on investment in equity securities (164) ( (423) (259) -61% Exchange gains (losses) on foreign currency translation (236) (1,987) (2,223) -112%
(278) (191) (87) 46%Other comprehensive loss not to be reclassified to profit or loss in subsequent periods: Actuarial losses on retirement benefit asset/liability ( (11) ( (102) (91) -89%TOTAL COMPREHENSIVE INCOME FOR THE PERIOD ₱5,734) ₱7,690) ₱(1,956) -25%
Attributable ToEquity holders of the Parent ₱2,564) ₱3,636) ₱(1,072) -29%Non-controlling Interests (3,170) (4,054) (884) -22%
₱5,734) ₱7,690) ₱(1,956) -25%*As restated
39

FIRST PHILIPPINE HOLDINGS CORPORATION AND SUBSIDIARIESUNAUDITED INTERIM CONSOLIDATED STATEMENTS OF CHANGES IN EQUITY(Amounts in Millions)
As of the period ended June 30, 2017 (Unaudited) Attributable to Equity Holders of the Parent
Common Stock
Preferred Stock
Capital in Excess of Par Value
Treasury Stock
Unrealized Fair Value Gain (Loss) on
Investment in Equity Securities
Cumulative Translation Adjustments
Equity Reserve
Unappropriated Retained Earnings
Appropriated Retained Earnings
Total Non- controlling Interests
Total Equity
Balance at December 31, 2016 ₱6,096) ₱360) ₱5,506) (₱3,526) ₱3,743) (₱7,848) (₱13,181) ₱58,932) ₱26,432) ₱76,514) ₱64,507) ₱141,021) Net income ( - ) ( - ) ( - ) ( - ) ( - ) ( - ) ( - ) ( 2,516) ( - ) ( 2,516) ( 3,507) ( 6,023) Other comprehensive income (loss) ( - ) ( - ) ( - ) ( - ) ( (164) ( (16) ( - ) ( 228) ( - ) ( 48) ( (337) ( (289) Total comprehensive income (loss) ( - ) ( - ) ( - ) ( - ) ( (164) ( (16) ( - ) ( 2,744) ( - ) ( 2,564) ( 3,170) ( 5,734) Issuances of shares ( - ) ( - ) ( - ) ( - ) ( - ) ( - ) ( - ) ( - ) ( - ) ( - ) ( - ) ( - ) Cash dividends ( - ) ( - ) ( - ) ( - ) ( - ) ( - ) ( - ) ( (604) ( - ) ( (604) ( - ) ( (604) Dividends of subsidiaries ( - ) ( - ) ( - ) ( - ) ( - ) ( - ) ( - ) ( - ) ( - ) ( - ) ( (1,447) ( (1,447) Acquisition of non-controlling interests ( - ) ( - ) ( - ) ( - ) ( - ) ( - ) ( - ) ( - ) ( - ) ( - ) ( - ) ( - ) Balance at June 30, 2017 ₱6,096) ₱360) ₱5,506) (₱3,526) ₱3,579) (₱7,864) (₱13,181) ₱61,072) ₱26,432) ₱78,474) ₱66,230) ₱144,704)
As of the year ended December 31, 2016 (Audited) Attributable to Equity Holders of the Parent
Common Stock
Preferred Stock
Capital in Excess of Par Value
Treasury Stock
Unrealized Fair Value Gain (Loss) on
Investment in Equity Securities
Cumulative Translation Adjustments
Equity Reserve
Unappropriated Retained Earnings
Appropriated Retained Earnings
Total Non- controlling Interests
Total Equity
Balance at January 1, 2016 ₱6,093) ₱360) ₱5,494) (₱3,345) ₱6,170) (₱8,402) (₱12,951) ₱49,965) ₱26,432) ₱69,816) ₱57,639) ₱127,455) Net income ( - ) ( - ) ( - ) ( - ) ( - ) ( - ) ( - ) ( 9,933) ( - ) ( 9,933) ( 8,605) ( 18,538) Other comprehensive income (loss) ( - ) ( - ) ( - ) ( - ) ( (2,427) ( 554) ( - ) ( 241) ( - ) ( (1,632) ( (158) ( (1,790) Total comprehensive income (loss) ( - ) ( - ) ( - ) ( - ) ( (2,427) ( 554) ( - ) ( 10,174) ( - ) ( 8,301) ( 8,447) ( 16,748) Issuances of shares ( 3) ( - ) ( 12) ( - ) ( - ) ( - ) ( - ) ( - ) ( - ) ( 15) ( - ) ( 15) Cash dividends ( - ) ( - ) ( - ) ( - ) ( - ) ( - ) ( - ) ( (1,207) ( - ) ( (1,207) ( (1,481) ( (2,688) Redemption of shares ( - ) ( - ) ( - ) ( (181) ( - ) ( - ) ( - ) ( - ) ( - ) ( (181) ( (328) ( (509) Acquisition of non-controlling interests ( - ) ( - ) ( - ) ( - ) ( - ) ( - ) ( (230) ( - ) ( - ) ( (230) ( 230) ( - ) Balance at December 31, 2016 ₱6,096) ₱360) ₱5,506) (₱3,526) ₱3,743) (₱7,848) (₱13,181) ₱58,932) ₱26,432) ₱76,514) ₱64,507) ₱141,021)
40

FIRST PHILIPPINE HOLDINGS CORPORATION AND SUBSIDIARIESUNAUDITED INTERIM CONSOLIDATED STATEMENTS OF CHANGES IN EQUITY(Amounts in Millions)
As of the period ended June 30, 2017 (Unaudited) Attributable to Equity Holders of the Parent
Common Stock
Preferred Stock
Capital in Excess of Par Value
Treasury Stock
Unrealized Fair Value Gain (Loss) on
Investment in Equity Securities
Cumulative Translation Adjustments
Equity Reserve
Unappropriated Retained Earnings
Appropriated Retained Earnings
Total Non- controlling Interests
Total Equity
Balance at December 31, 2016 ₱6,096) ₱360) ₱5,506) (₱3,526) ₱3,743) (₱7,848) (₱13,181) ₱58,932) ₱26,432) ₱76,514) ₱64,507) ₱141,021) Net income ( - ) ( - ) ( - ) ( - ) ( - ) ( - ) ( - ) ( 2,516) ( - ) ( 2,516) ( 3,507) ( 6,023) Other comprehensive income (loss) ( - ) ( - ) ( - ) ( - ) ( (164) ( (16) ( - ) ( 228) ( - ) ( 48) ( (337) ( (289) Total comprehensive income (loss) ( - ) ( - ) ( - ) ( - ) ( (164) ( (16) ( - ) ( 2,744) ( - ) ( 2,564) ( 3,170) ( 5,734) Issuances of shares ( - ) ( - ) ( - ) ( - ) ( - ) ( - ) ( - ) ( - ) ( - ) ( - ) ( - ) ( - ) Cash dividends ( - ) ( - ) ( - ) ( - ) ( - ) ( - ) ( - ) ( (604) ( - ) ( (604) ( - ) ( (604) Dividends of subsidiaries ( - ) ( - ) ( - ) ( - ) ( - ) ( - ) ( - ) ( - ) ( - ) ( - ) ( (1,447) ( (1,447) Acquisition of non-controlling interests ( - ) ( - ) ( - ) ( - ) ( - ) ( - ) ( - ) ( - ) ( - ) ( - ) ( - ) ( - ) Balance at June 30, 2017 ₱6,096) ₱360) ₱5,506) (₱3,526) ₱3,579) (₱7,864) (₱13,181) ₱61,072) ₱26,432) ₱78,474) ₱66,230) ₱144,704)
As of the period ended June 30, 2016 (Unaudited) Attributable to Equity Holders of the Parent
Common Stock
Preferred Stock
Capital in Excess of Par Value
Treasury Stock
Unrealized Fair Value Gain (Loss) on
Investment in Equity Securities
Cumulative Translation Adjustments
Equity Reserve
Unappropriated Retained Earnings
Appropriated Retained Earnings
Total Non- controlling Interests
Total Equity
Balance at December 31, 2015 ₱6,093) ₱360) ₱5,494) (₱3,345) ₱6,170) (₱8,402) (₱12,951) ₱49,965) ₱26,432) ₱69,816) ₱57,639) ₱127,455) Net income ( - ) ( - ) ( - ) ( - ) ( - ) ( - ) ( - ) ( 3,512) ( - ) ( 3,512) ( 4,471) ( 7,983) Other comprehensive income (loss) ( - ) ( - ) ( - ) ( - ) ( (430) ( 506) ( - ) ( 48) ( - ) ( 124) ( (417) ( (293) Total comprehensive income (loss) ( - ) ( - ) ( - ) ( - ) ( (430) ( 506) ( - ) ( 3,560) ( - ) ( 3,636) ( 4,054) ( 7,690) Issuances of shares ( 3) ( - ) ( 12) ( - ) ( - ) ( - ) ( - ) ( - ) ( - ) ( 15) ( - ) ( 15) Cash dividends ( - ) ( - ) ( - ) ( - ) ( - ) ( - ) ( - ) ( (603) ( - ) ( (603) ( (1,297) ( (1,900) Acquisition of non-controlling interests ( - ) ( - ) ( - ) ( - ) ( - ) ( - ) ( (242) ( - ) ( - ) ( (242) ( - ) ( (242) Balance at June 30, 2016 ₱6,096) ₱360) ₱5,506) (₱3,345) ₱5,740) (₱7,896) (₱13,193) ₱52,922) ₱26,432) ₱72,622) ₱60,396) ₱133,018)
41

FIRST PHILIPPINE HOLDINGS CORPORATION AND SUBSIDIARIESUNAUDITED INTERIM CONSOLIDATED STATEMENTS OF CASH FLOWS(Amounts in Millions)
(Unaudited) Six Months Ended June 30
2017 2016*
CASH FLOWS FROM OPERATING ACTIVITIESIncome before income tax 8,661 ₱10,467)Adjustments for:
Finance costs 5,431 ( 4,832) Depreciation and amortization 5,871 ( 5,073) Finance income (990) ( (980)Dividend income (416) ( (517)Retirement benefit expense 114 ( 95) Equity in net earnings of associates and a joint venture (75) ( (69)Provision for (reversal of) impairment of spare parts and supplies inventory 35 ( (10) Mark-to-market gain on financial assets at FVPL (19) ( (49)Mark-to-market gain on derivatives ( - ) ( (52) Loss on direct write-off of Input VAT claims 44 ( 36) Unrealized foreign exchange loss - net 313 ( 4)
Operating income before working capital changes 18,968 ( 18,830) Decrease (increase) in:
Trade and other receivables (288) ( 995) Inventories 1,032 ( (976) Other current assets 2,573 ( (413)
Decrease in trade payable and other current liabilities (320) ( (2,030)Cash generated from operations 21,965 ( 16,407) Interest received 253 ( 292) Unrealized loss on AFS financial assets 164 ( 423) Income tax paid (2,210) ( (2,332) Net cash from operating activities 20,172 ( 14,790)
CASH FLOWS FROM INVESTING ACTIVITIESAdditions to:
Property, plant and equipment and investment properties (4,052) ( (6,415) Financial assets at FVPL (745) ( (1,104)Exploration and evaluation assets 17 ( (25) AFS financial assets (745) ( (100)Intangibles (12) ( 48)
(Forward)
(Unaudited) Six Months Ended June 30
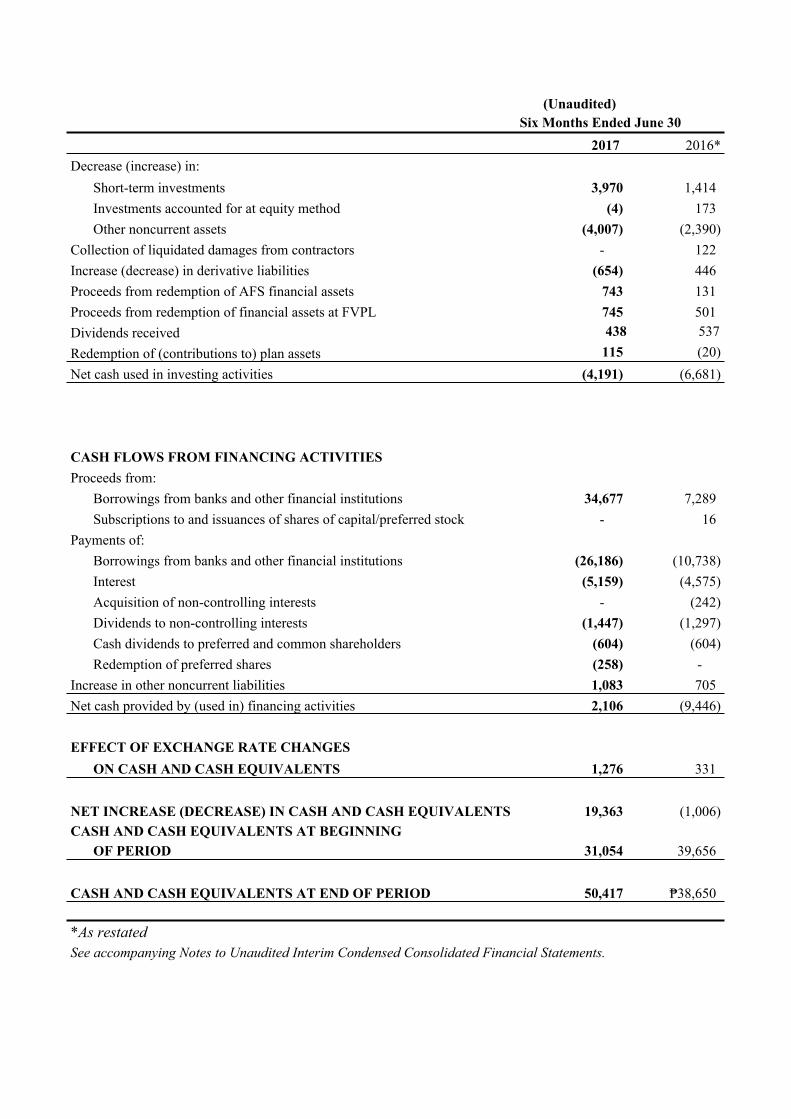
2017 2016*Decrease (increase) in:
Short-term investments 3,970 ( 1,414) Investments accounted for at equity method (4) ( 173) Other noncurrent assets (4,007) ( (2,390)
Collection of liquidated damages from contractors ( - ) ( 122) Increase (decrease) in derivative liabilities (654) ( 446) Proceeds from redemption of AFS financial assets 743 ( 131) Proceeds from redemption of financial assets at FVPL 745 ( 501) Dividends received Redemption of (contributions to) plan assets
438 ( 537)115 ( (20)
Net cash used in investing activities (4,191) ( (6,681)
CASH FLOWS FROM FINANCING ACTIVITIESProceeds from:
Borrowings from banks and other financial institutions 34,677 ( 7,289) Subscriptions to and issuances of shares of capital/preferred stock ( - ) ( 16)
Payments of:Borrowings from banks and other financial institutions (26,186) ( (10,738) Interest (5,159) ( (4,575) Acquisition of non-controlling interests ( - ) ( (242) Dividends to non-controlling interests ( (1,447) ( (1,297) Cash dividends to preferred and common shareholders (604) ( (604)Redemption of preferred shares (258) ( - )
Increase in other noncurrent liabilities 1,083 ( 705) Net cash provided by (used in) financing activities 2,106 ( (9,446)
EFFECT OF EXCHANGE RATE CHANGESON CASH AND CASH EQUIVALENTS 1,276 ( 331)
NET INCREASE (DECREASE) IN CASH AND CASH EQUIVALENTS 19,363 ( (1,006) CASH AND CASH EQUIVALENTS AT BEGINNING
OF PERIOD 31,054 ( 39,656)
CASH AND CASH EQUIVALENTS AT END OF PERIOD 50,417 ₱38,650)
*As restatedSee accompanying Notes to Unaudited Interim Condensed Consolidated Financial Statements.
FIRST PHILIPPINE HOLDINGS CORPORATION AND SUBSIDIARIES SELECTED NOTES TO UNAUDITED INTERIM CONDENSED CONSOLIDATED FINANCIAL STATEMENTS
1. Corporate Information
First Philippine Holdings Corporation (FPH or the Parent Company) was incorporated and registered with the Philippine Securities and Exchange Commission (SEC) on June 30, 1961. On June 29, 2007, the Philippine SEC approved the extension of the Parent Company’s corporate life for another 50 years from June 30, 2011. FPH and its subsidiaries (collectively referred to as the Group) is engaged primarily in, but not limited to, power generation, real estate development, manufacturing, construction, financing and other service industries.
FPH is 46.47%-owned by Lopez Holdings Corporation (Lopez Holdings), a publicly-listed Philippine-based entity, as at June 30, 2017 and December 31, 2016. Majority of Lopez Holdings is owned by Lopez, Inc., a Philippine entity and the ultimate Parent Company.
The registered office address of FPH is at 6th Floor, Rockwell Business Center Tower 3, Ortigas Avenue, Pasig City.
2. Summary of Significant Accounting Policies
Basis of Preparation The unaudited interim condensed consolidated financial statements of the Group as of June 30, 2017, and for the six-month periods ended June 30, 2017 and 2016 have been prepared on a historical cost basis, except for derivative financial instruments, financial assets at FVPL and AFS financial assets that have been measured at fair value.
Statement of Compliance The unaudited interim condensed consolidated financial statements of the Group have been prepared in accordance with PFRS’ Philippine Accounting Standards (PAS) 34, Interim Financial Reporting. Accordingly, the unaudited interim condensed consolidated financial statements do not include all of the information and footnotes required in the annual consolidated financial statements, and should be read in conjunction with FPH’s annual consolidated financial statements as at and for the year ended December 31, 2016.
Basis of Consolidation The unaudited interim condensed consolidated financial statements comprise the financial statements of the FPH and its subsidiaries. Control is achieved when FPH is exposed, or has rights, to variable returns from its involvement with the investee and has the ability to affect those returns through its power over the investee.
Specifically, FPH controls an investee if and only if FPH has:
42
● Power over an investee (i.e. existing rights that give it the current ability to direct the relevant activities of the investee)
● Exposure, or rights, to variable returns from its involvement with the investee; and ● The ability to use its power over the investee to affect its returns.
Generally, there is a presumption that a majority of voting rights result in control. To support the presumption and when the Group has less than a majority of the voting rights of an investee, the Group considers all relevant facts and circumstances in assessing whether it has power over the investee, including:
● the contractual arrangements with the other vote holders of the investee ● rights arising from other contractual arrangements ● the Group’s voting rights and potential voting rights
The Group reassesses whether or not it controls an investee if facts and circumstances indicate that there are changes to one or more of the three elements of control. Consolidation of a subsidiary begins when the Group obtains control over the subsidiary and ceases when the Group loses control over the subsidiary. Assets, liabilities, income and expenses of a subsidiary acquired or disposed of during the period are included in the unaudited interim consolidated statements of income from the date the Group gains control until the date when the Group ceases to control the subsidiary.
Profit or loss and each component of other comprehensive income are attributed to the owners of FPH and to the non-controlling interests even if this results in the non-controlling interests having a deficit balance. When necessary, adjustments are made to the financial statements of subsidiaries to bring their accounting policies in line with the Group’s accounting policies. All intra-group asset, liabilities, income, expenses and cash flows relating to transactions between members of the Group are eliminated in full on consolidation.
A change in the ownership interest of a subsidiary, without a loss of control, is accounted for as an equity transaction. Any excess or deficit of consideration paid over the carrying amount of the non-controlling interest is recognized as part of “Equity reserve” account in the equity attributable to the equity holders of the Parent.
If the Group loses control over a subsidiary, it derecognizes the related assets (including goodwill), liabilities, non-controlling interest and other components of equity while any resultant gain or loss is recognized in profit or loss. Any movement retained is recognized at fair value. Significant Changes in Accounting Policies and Disclosures The accounting policies adopted in the preparation of the unaudited interim condensed consolidated financial statements are consistent with those followed in the preparation of the annual consolidated financial statements as of and for the year ended December 31, 2016, except for the adoption of the following amended accounting standards that became effective beginning January 1, 2017. The nature and the effect of these changes are disclosed below. Although these amendments apply for the first time in 2017, they do not have a material impact on the unaudited interim
43
condensed consolidated financial statements of the Group. The nature and the impact of each amendment are described below: ● Amendments to PAS 7, Statement of Cash Flows, Disclosure Initiative
The amendments to PAS 7 require an entity to provide disclosures that enable users of financial statements to evaluate changes in liabilities arising from financing activities, including both changes arising from cash flows and non-cash changes (such as foreign exchange gains or losses). On initial application of the amendments, entities are not required to provide comparative information for preceding periods. The Group is not required to provide additional disclosures in its unaudited interim condensed consolidated financial statements, but will disclose additional information in its annual consolidated financial statements for the year ended December 31, 2017. ● Amendments to PAS 12, Income Taxes, Recognition of Deferred Tax Assets for Unrealized
Losses
The amendments clarify that an entity needs to consider whether tax law restricts the sources of taxable profits against which it may make deductions on the reversal of that deductible temporary difference. Furthermore, the amendments provide guidance on how an entity should determine future taxable profits and explain the circumstances in which taxable profit may include the recovery of some assets for more than their carrying amount. Entities are required to apply the amendments retrospectively. However, on initial application of the amendments, the change in the opening equity of the earliest comparative period may be recognized in opening retained earnings (or in another component of equity, as appropriate), without allocating the change between opening retained earnings and other components of equity. Entities applying this relief must disclose that fact. The Group applied the amendments retrospectively. However, the application has no effect on the Group’s financial position and performance as it has no deductible temporary differences or assets that are in the scope of the amendments. Annual Improvements Cycle - 2014-2016 ● Amendments to PFRS 12, Disclosure of Interests in Other Entities: Clarification of the scope
of disclosure requirements in PFRS 12 The amendments clarify that the disclosure requirements in PFRS 12, other than those in paragraphs B10-B16, apply to an entity’s interest in a subsidiary, a joint venture or an associate (or a portion of its interest in a joint venture or an associate) that is classified (or included in a disposal group that is classified) as held for sale. The Group has adopted the amendments retrospectively but will not have any impact given that the Parent Company has no interest in a subsidiary, joint venture, or an associate that is classified as held for sale.
44
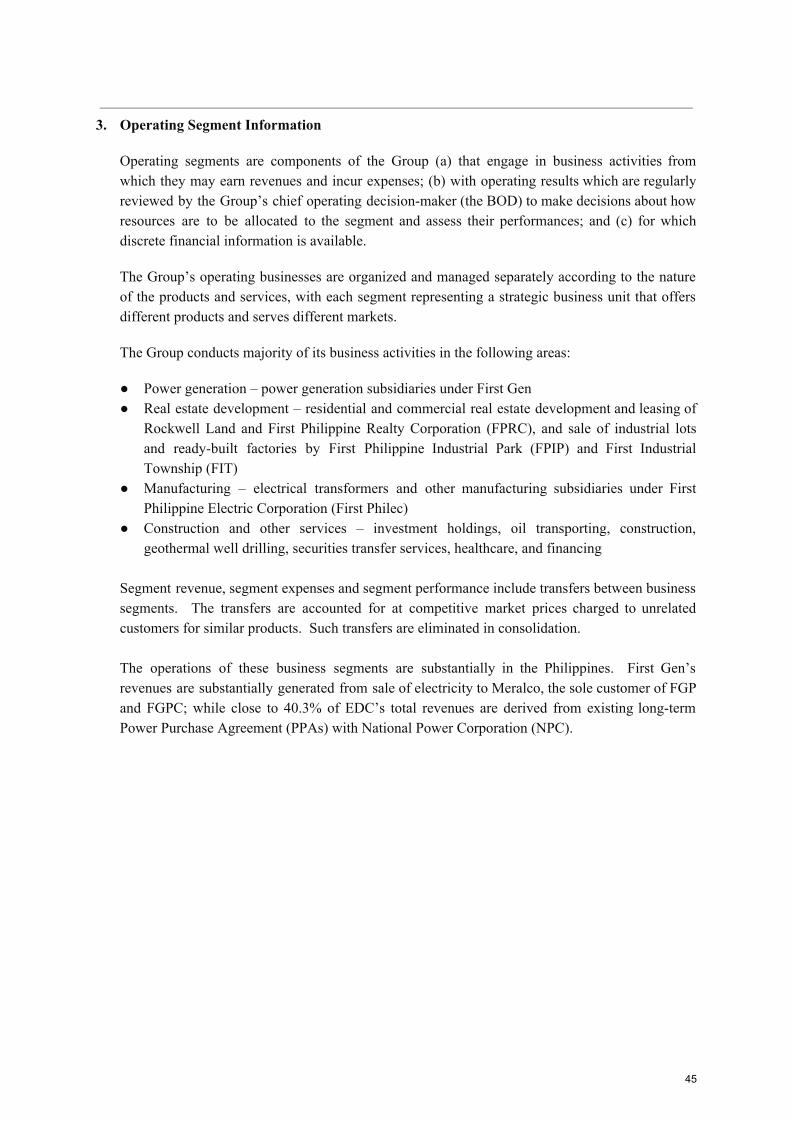
3. Operating Segment Information
Operating segments are components of the Group (a) that engage in business activities from which they may earn revenues and incur expenses; (b) with operating results which are regularly reviewed by the Group’s chief operating decision-maker (the BOD) to make decisions about how resources are to be allocated to the segment and assess their performances; and (c) for which discrete financial information is available.
The Group’s operating businesses are organized and managed separately according to the nature of the products and services, with each segment representing a strategic business unit that offers different products and serves different markets.
The Group conducts majority of its business activities in the following areas:
● Power generation – power generation subsidiaries under First Gen ● Real estate development – residential and commercial real estate development and leasing of
Rockwell Land and First Philippine Realty Corporation (FPRC), and sale of industrial lots and ready-built factories by First Philippine Industrial Park (FPIP) and First Industrial Township (FIT)
● Manufacturing – electrical transformers and other manufacturing subsidiaries under First Philippine Electric Corporation (First Philec)
● Construction and other services – investment holdings, oil transporting, construction, geothermal well drilling, securities transfer services, healthcare, and financing
Segment revenue, segment expenses and segment performance include transfers between business segments. The transfers are accounted for at competitive market prices charged to unrelated customers for similar products. Such transfers are eliminated in consolidation. The operations of these business segments are substantially in the Philippines. First Gen’s revenues are substantially generated from sale of electricity to Meralco, the sole customer of FGP and FGPC; while close to 40.3% of EDC’s total revenues are derived from existing long-term Power Purchase Agreement (PPAs) with National Power Corporation (NPC).
45
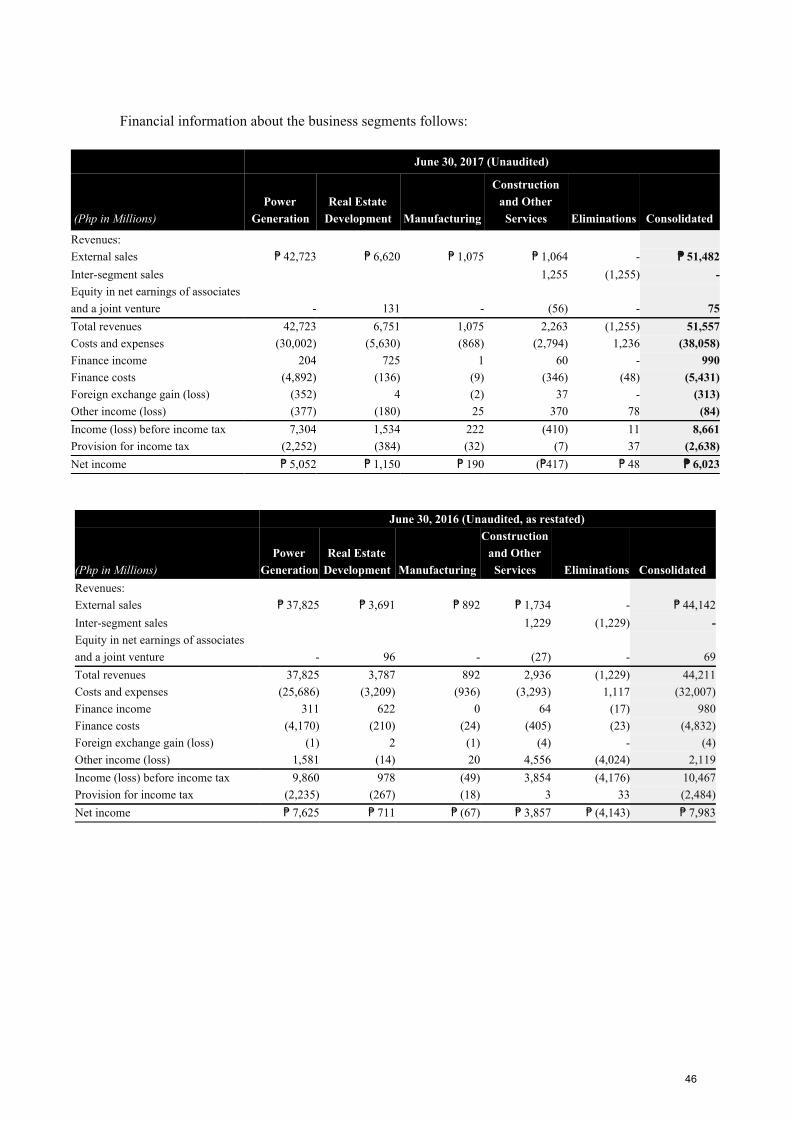
Financial information about the business segments follows:
June 30, 2017 (Unaudited)
(Php in Millions) Power
Generation Real Estate
Development Manufacturing
Construction and Other Services Eliminations Consolidated
Revenues: External sales ₱ 42,723 ₱ 6,620 ₱ 1,075 ₱ 1,064 - ₱ 51,482Inter-segment sales 1,255 (1,255) -Equity in net earnings of associates and a joint venture - 131 - (56) - 75Total revenues 42,723 6,751 1,075 2,263 (1,255) 51,557Costs and expenses (30,002) (5,630) (868) (2,794) 1,236 (38,058)Finance income 204 725 1 60 - 990Finance costs (4,892) (136) (9) (346) (48) (5,431)Foreign exchange gain (loss) (352) 4 (2) 37 - (313)Other income (loss) (377) (180) 25 370 78 (84)Income (loss) before income tax 7,304 1,534 222 (410) 11 8,661Provision for income tax (2,252) (384) (32) (7) 37 (2,638)Net income ₱ 5,052 ₱ 1,150 ₱ 190 (₱417) ₱ 48 ₱ 6,023
June 30, 2016 (Unaudited, as restated)
(Php in Millions) Power
Generation Real Estate
Development Manufacturing
Construction and Other Services Eliminations Consolidated
Revenues: External sales ₱ 37,825 ₱ 3,691 ₱ 892 ₱ 1,734 - ₱ 44,142Inter-segment sales 1,229 (1,229) -Equity in net earnings of associates and a joint venture - 96 - (27) - 69Total revenues 37,825 3,787 892 2,936 (1,229) 44,211Costs and expenses (25,686) (3,209) (936) (3,293) 1,117 (32,007)Finance income 311 622 0 64 (17) 980Finance costs (4,170) (210) (24) (405) (23) (4,832)Foreign exchange gain (loss) (1) 2 (1) (4) - (4)Other income (loss) 1,581 (14) 20 4,556 (4,024) 2,119Income (loss) before income tax 9,860 978 (49) 3,854 (4,176) 10,467Provision for income tax (2,235) (267) (18) 3 33 (2,484)Net income ₱ 7,625 ₱ 711 ₱ (67) ₱ 3,857 ₱ (4,143) ₱ 7,983
46
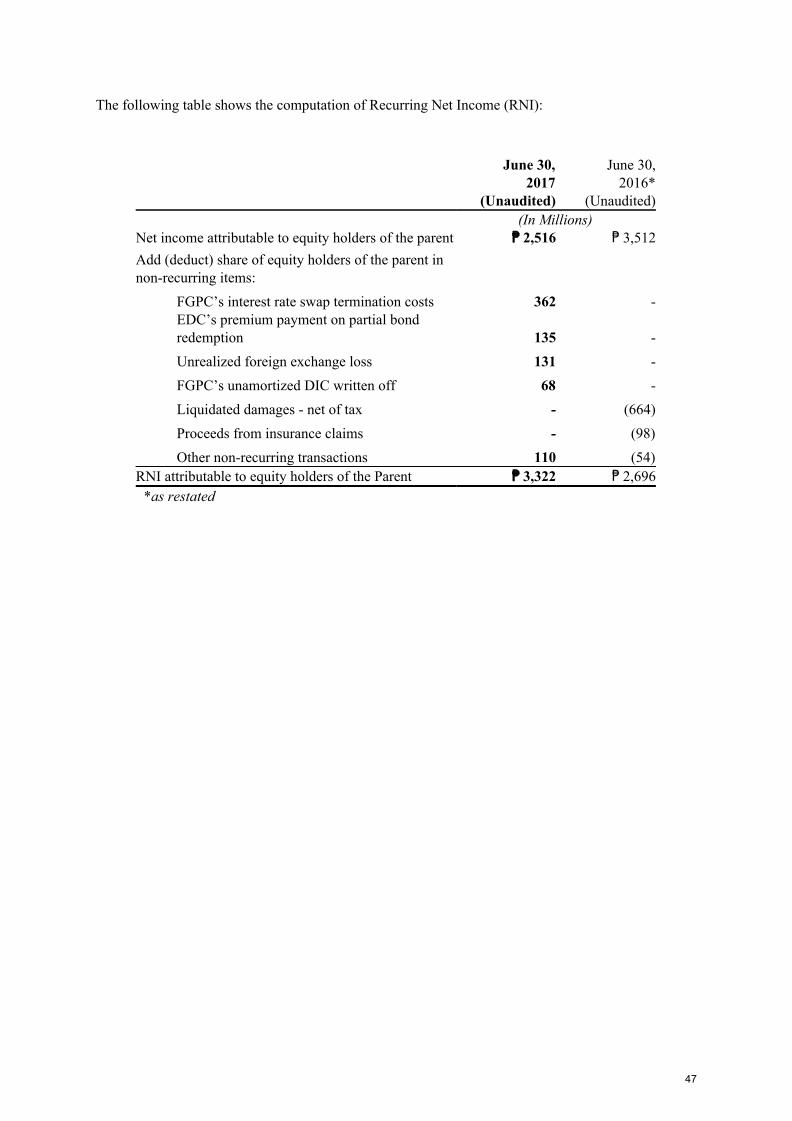
The following table shows the computation of Recurring Net Income (RNI):
June 30, 2017
(Unaudited)
June 30,2016*
(Unaudited) (In Millions) Net income attributable to equity holders of the parent ₱ 2,516 ₱ 3,512Add (deduct) share of equity holders of the parent in non-recurring items: FGPC’s interest rate swap termination costs 362 -
EDC’s premium payment on partial bond redemption 135 -
Unrealized foreign exchange loss 131 - FGPC’s unamortized DIC written off 68 - Liquidated damages - net of tax - (664) Proceeds from insurance claims - (98) Other non-recurring transactions 110 (54) RNI attributable to equity holders of the Parent ₱ 3,322 ₱ 2,696
*as restated
47

4. Subsidiaries, Significant Acquisitions and Discontinued Operations
The accompanying unaudited interim condensed consolidated financial statements comprise the financial statements of FPH and the following subsidiaries. All subsidiaries, except for FGHC International Limited (FGHC International), FPH Fund Corporation (FPH Fund), FPH Ventures Corporation (FPH Ventures), Bluespark Management Limited (Bluespark) [formerly Lisbon Star Management Limited] and certain subsidiaries of Energy Development Corporation (EDC), are incorporated in the Philippines. FGHC International, FPH Fund and FPH Ventures are registered in the Cayman Islands. Bluespark was incorporated in British Virgin Islands (BVI) until the effectivity of its merger with FGRI in June 2014, while certain subsidiaries of EDC are incorporated in BVI, Hong Kong, Peru, Chile and Indonesia.
Details of the Group’s subsidiaries as at June 30, 2017 and December 31, 2016 are set out below.
June 30, 2017 (Unaudited)
December 31, 2016 (Audited)
Place of incorporation Percentage of ownership held by the Group Subsidiaries and operation Direct Indirect Direct Indirect Power Generation First Gen Corporation (First Gen) Philippines 66.24 – 66.24 – First Gen Renewables, Inc. Philippines – 100.00 – 100.00 FG Bukidnon Power Corp. (FG Bukidnon) Philippines – 100.00 – 100.00 Unified Holdings Corporation (Unified) Philippines – 100.00 – 100.00 FGP Corp. (FGP) 5 Philippines – 100.00 – 100.00 AlliedGen Power Corporation Philippines – 100.00 – 100.00 First NatGas Power Corporation (FNPC) Philippines – 100.00 – 100.00 First Gen Luzon Power Corporation. Philippines – 100.00 – 100.00 First Gen Visayas Hydro Power Corporation (FG Visayas) Philippines – 100.00 – 100.00 First Gen Mindanao Hydro Power Corporation (FG Mindanao) Philippines – 100.00 – 100.00 FGen Northern Mindanao Holdings, Inc. (FNMHI) Philippines – 100.00 – 100.00 FGen Bubunawan Hydro Corporation (FG Bubunawan) Philippines – 100.00 – 100.00 FGen Cabadbaran Hydro Corporation (FG Cabadbaran) Philippines – 100.00 – 100.00 FGen Puyo Hydro Corporation (FG Puyo) Philippines – 100.00 – 100.00 FG Mindanao Renewables Corp. (FMRC) Philippines – 100.00 – 100.00 FGen Tagoloan Hydro Corporation (FG Tagoloan) Philippines – 100.00 – 100.00 FGen Tumalaong Hydro Corporation (FG Tumalaong) Philippines – 100.00 – 100.00 First Gen Ecopower Solutions, Inc. (formerly First Gen Geothermal Power Corporation) Philippines – 100.00 – 100.00 First Gen Energy Solutions, Inc. (FGES) Philippines – 100.00 – 100.00 First Gen Premier Energy Corporation Philippines – 100.00 – 100.00 First Gen Prime Energy Corporation Philippines – 100.00 – 100.00
48

First Gen Visayas Energy Corporation Philippines – 100.00 – 100.00 Northern Terracotta Power Corporation (Northern Terracotta) Philippines – 100.00 – 100.00 Blue Vulcan Holdings Corporation Philippines – 100.00 – 100.00 Prime Meridian Powergen Corporation (PMPC) Philippines – 100.00 – 100.00 Goldsilk Holdings Corporation (Goldsilk) [formerly Lisbon Star Philippines Holdings, Inc.] Philippines – 100.00 – 100.00 Dualcore Holdings, Inc. (Dualcore) [formerly BG Consolidated Holdings (Philippines), Inc.] Philippines – 100.00 – 100.00 Onecore Holdings, Inc. (Onecore) [formerly BG Philippines Holdings, Inc.] Philippines – 100.00 – 100.00 First Gas Holdings Corporation (FGHC) Philippines – 100.00 – 100.00 First Gas Power Corporation (FGPC) Philippines – 100.00 – 100.00 First Gas Pipeline Corporation Philippines – 100.00 – 100.00 FG Land Corporation Philippines – 100.00 – 100.00 FGEN LNG Corporation (FGEN LNG) Philippines – 100.00 – 100.00 First Gen LNG Holdings Corporation (LNG Holdings) Philippines – 100.00 – 100.00 First Gen Meridian Holdings, Inc. (FGEN Meridian) Philippines – 100.00 – 100.00 FGen Northern Power Corp. (FGEN Northern Power) Philippines – 100.00 – 100.00 FGen Power Ventures, Inc. (FGEN Power Ventures) Philippines – 100.00 – 100.00 FGen Casecnan Hydro Power Corp. (FGEN Casecnan) Philippines – 100.00 – 100.00 FGen Power Holdings, Inc. (Power Holdings) Philippines – 100.00 – 100.00 FGen Prime Holdings, Inc. (Prime Holdings) Philippines – 100.00 – 100.00 FGen Eco Solutions Holdings, Inc. (FGESHI) Philippines – 100.00 – 100.00 FGen Liquefied Natural Gas Holdings, Inc. (Liquefied Holdings) Philippines – 100.00 – 100.00 FGen Reliable Energy Holdings, Inc. (FG Reliable Energy) Philippines – 100.00 – 100.00 FGen Power Solutions, Inc. (FG Power Solutions) Philippines – 100.00 – 100.00 FGen Vibrant Blue Sky Holdings, Inc. (FGVBSHI) Philippines – 100.00 – 100.00 FGen Aqua Power Holdings, Inc. (Aqua Power) Philippines – 100.00 – 100.00 First Gen Hydro Power Corporation (FG Hydro) Philippines – 100.00 – 100.00 FGen Natural Gas Supply, Inc. (FGen NatGas Supply) Philippines – 100.00 – 100.00 FGen Power Operations, Inc. (FPOI) Philippines – 100.00 – 100.00 FGen Fuel Line Systems, Inc. (FGen Fuel Line) Philippines – 100.00 – 100.00 Prime Terracota Holdings Corporation (Prime Terracota) Philippines – 100.00 – 100.00 Red Vulcan Holdings Corporation (Red Vulcan) Philippines – 100.00 – 100.00 Energy Development Corporation (EDC) Philippines – 60.00 – 60.00 EDC Drillco Corporation Philippines – 100.00 – 100.00 EDC Geothermal Corp. (EGC) Philippines – 100.00 – 100.00 Green Core Geothermal Inc. (GCGI) Philippines – 100.00 – 100.00 Bac-Man Geothermal Inc. (BGI) Philippines – 100.00 – 100.00 Unified Leyte Geothermal Energy Inc. (ULGEI) Philippines – 100.00 – 100.00 Southern Negros Geothermal, Inc. (SNGI) Philippines – 100.00 – 100.00 EDC Mindanao Geothermal, Inc. (EMGI) Philippines – 100.00 – 100.00 Bac-Man Energy Development Corporation (BEDC) Philippines – 100.00 – 100.00
49

Kayabon Geothermal Inc. (KGI) Philippines – 100.00 – 100.00 Mount Apo Renewable, Inc. (MAREI) Philippines – 100.00 – 100.00 EDC Wind Energy Holdings, Inc. (EWEHI) Philippines – 100.00 – 100.00 EDC Burgos Wind Power Corporation (EBWPC) Philippines – 100.00 – 100.00 EDC Pagudpud Wind Power Corporation (EPWPC) Philippines – 100.00 – 100.00 EDC Bayog Burgos Power Corporation (EBBPC) Philippines – 60.00 – 60.00 EDC Pagali Burgos Wind Power Corporation (EPBWPC) Philippines – 60.00 – 60.00 Matnog 1 Renewable Energy Corporation Philippines – 60.00 – 60.00 Matnog 2 Renewable Energy Corporation Philippines – 60.00 – 60.00 Matnog 3 Renewable Energy Corporation Philippines – 60.00 – 60.00 Iloilo 1 Renewable Energy Corporation Philippines – 60.00 – 60.00 Negros 1 Renewable Energy Corporation Philippines – 60.00 – 60.00 EDC Corporation Chile Limitada Santiago, Chile – 100.00 – 100.00 EDC Holdings International Limited (EHIL) EDC Hong Kong Limited (EDC HKL) Hongkong – 100.00 – 100.00 Energy Development Corporation Hong Kong International Investments Limited Hongkong – 100.00 – 100.00 EDC Chile Holdings SpA Santiago, Chile – 100.00 – 100.00 EDC Geotermica Chile SpA Santiago, Chile – 100.00 – 100.00 EDC Peru Holdings S.A.C Lima, Peru – 100.00 – 100.00 EDC Geotermica Peru S.A.C Lima, Peru – 100.00 – 100.00 EDC Peru S. A. C. Lima, Peru – 70.00 – 70.00 EDC Geotermica Del Sur S.A.C. Lima, Peru – 100.00 – 100.00 EDC Energia Azul S.A.C. Lima, Peru – 100.00 – 100.00 Geothermica Crucero Peru S.A.C. Lima, Peru – 42.00 – 42.00 EDC Energía Perú S.A.C. Lima, Peru – 100.00 – 100.00 Geothermica Tutupaca Norte Peru S.A.C. Lima, Peru – 42.00 – 42.00 EDC Energía Geotérmica S.A.C. Lima, Peru – 100.00 – 100.00 EDC Progreso Geotérmico Perú S.A.C. Lima, Peru – 100.00 – 100.00 Geothermica Loriscota Peru S.A.C. Lima, Peru – 42.00 – 42.00 EDC Energía Renovable Perú S.A.C. Lima, Peru – 100.00 – 100.00 PT EDC Indonesia Jakarta Pusat, Indonesia – 100.00 – 100.00 PT EDC Panas Bumi Indonesia Jakarta Pusat, Indonesia – 100.00 – 100.00 EDC Soluciones Sostenibles Ltd British Virgin Islands – 60.00 60.00 EDC Energia Verde Chile SpA British Virgin Islands – 60.00 _ 60.00 EDC Energia de la Tierra SpA British Virgin Islands – 60.00 60.00 EDC Desarollo Sostenible Ltd British Virgin Islands – 60.00 _ 60.00 EDC Energia Verde Peru SAC British Virgin Islands – 60.00 60.00 EDC Bright Solar Energy Holdings, Inc. (EBSEHI) Philippines – 60.00 _ 60.00 EDC Bago Solar Power Corporation (EBSPC) Philippines – 60.00 60.00 EDC Burgos Solar Corporation (EBSC) Philippines – 60.00 _ 60.00 First Gen Hydro Power Corporation (FG Hydro) Philippines – 60.00 60.0
50
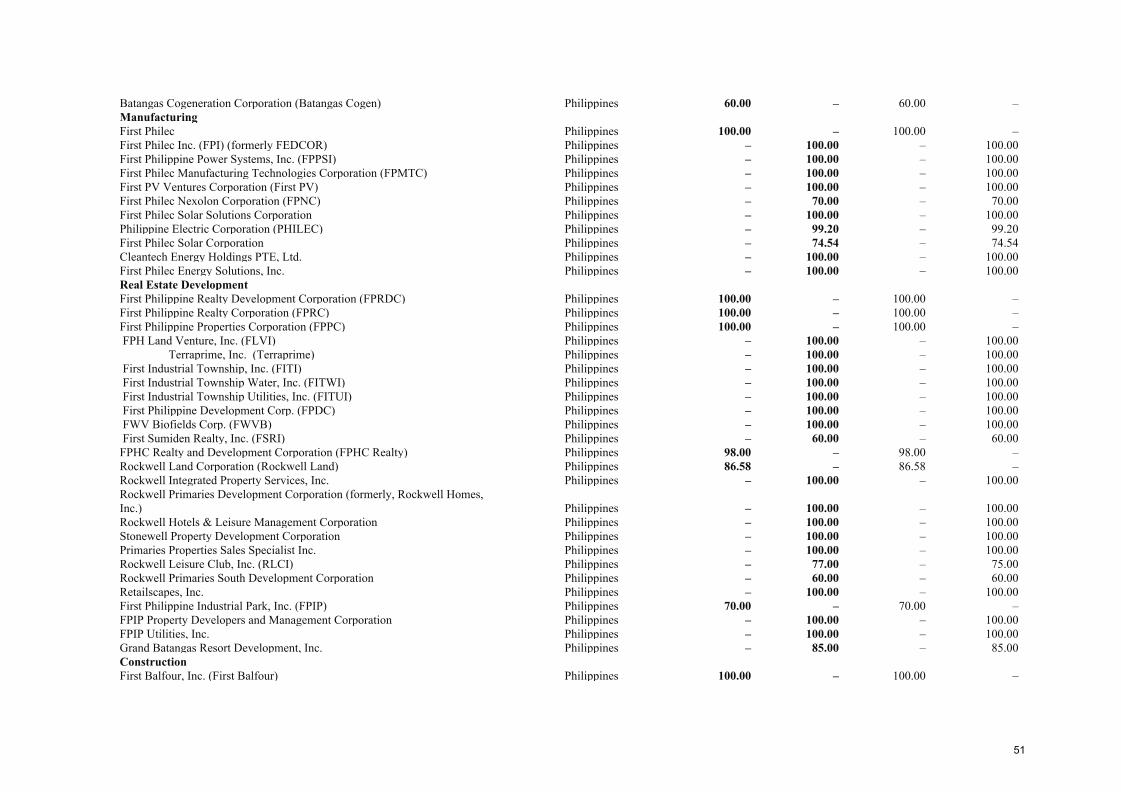
Batangas Cogeneration Corporation (Batangas Cogen) Philippines 60.00 – 60.00 – Manufacturing First Philec Philippines 100.00 – 100.00 – First Philec Inc. (FPI) (formerly FEDCOR) Philippines – 100.00 – 100.00 First Philippine Power Systems, Inc. (FPPSI) Philippines – 100.00 – 100.00 First Philec Manufacturing Technologies Corporation (FPMTC) Philippines – 100.00 – 100.00 First PV Ventures Corporation (First PV) Philippines – 100.00 – 100.00 First Philec Nexolon Corporation (FPNC) Philippines – 70.00 – 70.00 First Philec Solar Solutions Corporation Philippines – 100.00 – 100.00 Philippine Electric Corporation (PHILEC) Philippines – 99.20 – 99.20 First Philec Solar Corporation Philippines – 74.54 – 74.54 Cleantech Energy Holdings PTE, Ltd. Philippines – 100.00 – 100.00 First Philec Energy Solutions, Inc. Philippines – 100.00 – 100.00 Real Estate Development First Philippine Realty Development Corporation (FPRDC) Philippines 100.00 – 100.00 – First Philippine Realty Corporation (FPRC) Philippines 100.00 – 100.00 – First Philippine Properties Corporation (FPPC) Philippines 100.00 – 100.00 – FPH Land Venture, Inc. (FLVI) Philippines – 100.00 – 100.00
Terraprime, Inc. (Terraprime) Philippines – 100.00 – 100.00 First Industrial Township, Inc. (FITI) Philippines – 100.00 – 100.00 First Industrial Township Water, Inc. (FITWI) Philippines – 100.00 – 100.00 First Industrial Township Utilities, Inc. (FITUI) Philippines – 100.00 – 100.00 First Philippine Development Corp. (FPDC) Philippines – 100.00 – 100.00 FWV Biofields Corp. (FWVB) Philippines – 100.00 – 100.00 First Sumiden Realty, Inc. (FSRI) Philippines – 60.00 – 60.00 FPHC Realty and Development Corporation (FPHC Realty) Philippines 98.00 – 98.00 – Rockwell Land Corporation (Rockwell Land) Philippines 86.58 – 86.58 – Rockwell Integrated Property Services, Inc. Philippines – 100.00 – 100.00 Rockwell Primaries Development Corporation (formerly, Rockwell Homes, Inc.) Philippines – 100.00 – 100.00 Rockwell Hotels & Leisure Management Corporation Philippines – 100.00 – 100.00 Stonewell Property Development Corporation Philippines – 100.00 – 100.00 Primaries Properties Sales Specialist Inc. Philippines – 100.00 – 100.00 Rockwell Leisure Club, Inc. (RLCI) Philippines – 77.00 – 75.00 Rockwell Primaries South Development Corporation Philippines – 60.00 – 60.00 Retailscapes, Inc. Philippines – 100.00 – 100.00 First Philippine Industrial Park, Inc. (FPIP) Philippines 70.00 – 70.00 – FPIP Property Developers and Management Corporation Philippines – 100.00 – 100.00 FPIP Utilities, Inc. Philippines – 100.00 – 100.00 Grand Batangas Resort Development, Inc. Philippines – 85.00 – 85.00 Construction First Balfour, Inc. (First Balfour) Philippines 100.00 – 100.00 –
51
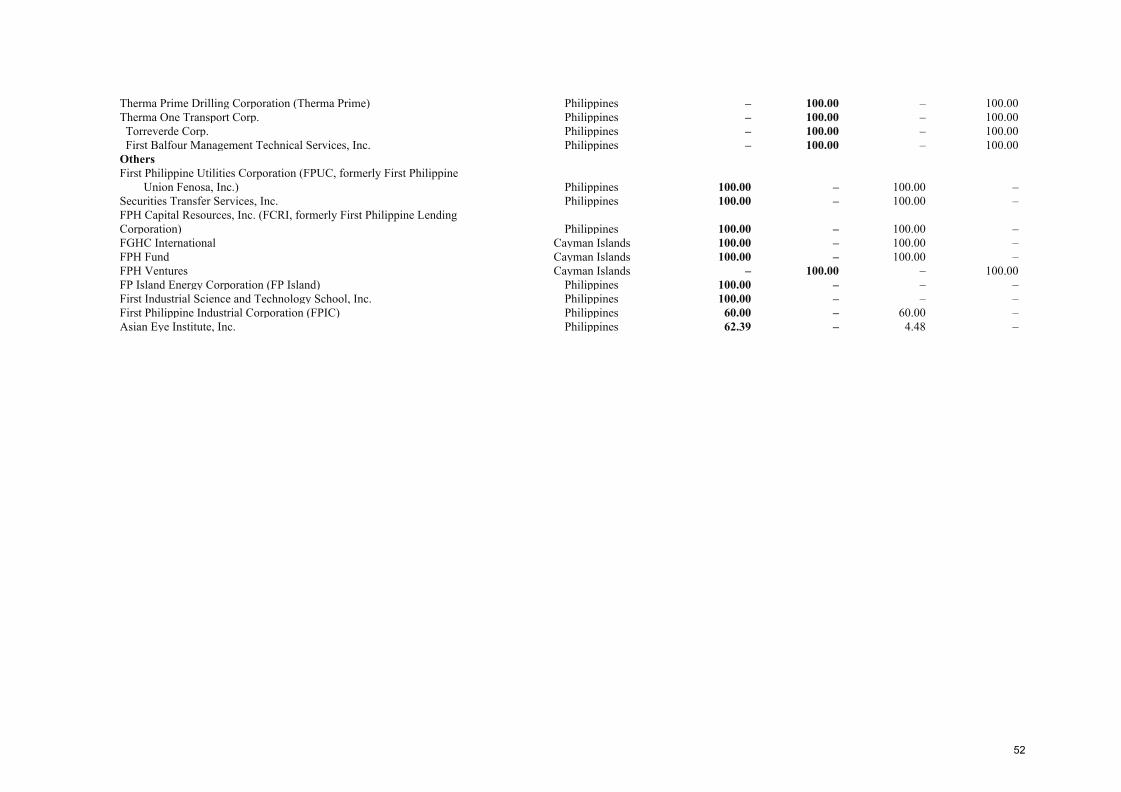
Therma Prime Drilling Corporation (Therma Prime) Philippines – 100.00 – 100.00 Therma One Transport Corp. Philippines – 100.00 – 100.00 Torreverde Corp. Philippines – 100.00 – 100.00 First Balfour Management Technical Services, Inc. Philippines – 100.00 – 100.00 Others First Philippine Utilities Corporation (FPUC, formerly First Philippine Union Fenosa, Inc.) Philippines 100.00 – 100.00 – Securities Transfer Services, Inc. Philippines 100.00 – 100.00 – FPH Capital Resources, Inc. (FCRI, formerly First Philippine Lending Corporation) Philippines 100.00 – 100.00 – FGHC International Cayman Islands 100.00 – 100.00 – FPH Fund Cayman Islands 100.00 – 100.00 – FPH Ventures Cayman Islands – 100.00 – 100.00 FP Island Energy Corporation (FP Island) Philippines 100.00 – – – First Industrial Science and Technology School, Inc. Philippines 100.00 – – – First Philippine Industrial Corporation (FPIC) Philippines 60.00 – 60.00 – Asian Eye Institute, Inc. Philippines 62.39 – 4.48 –
52
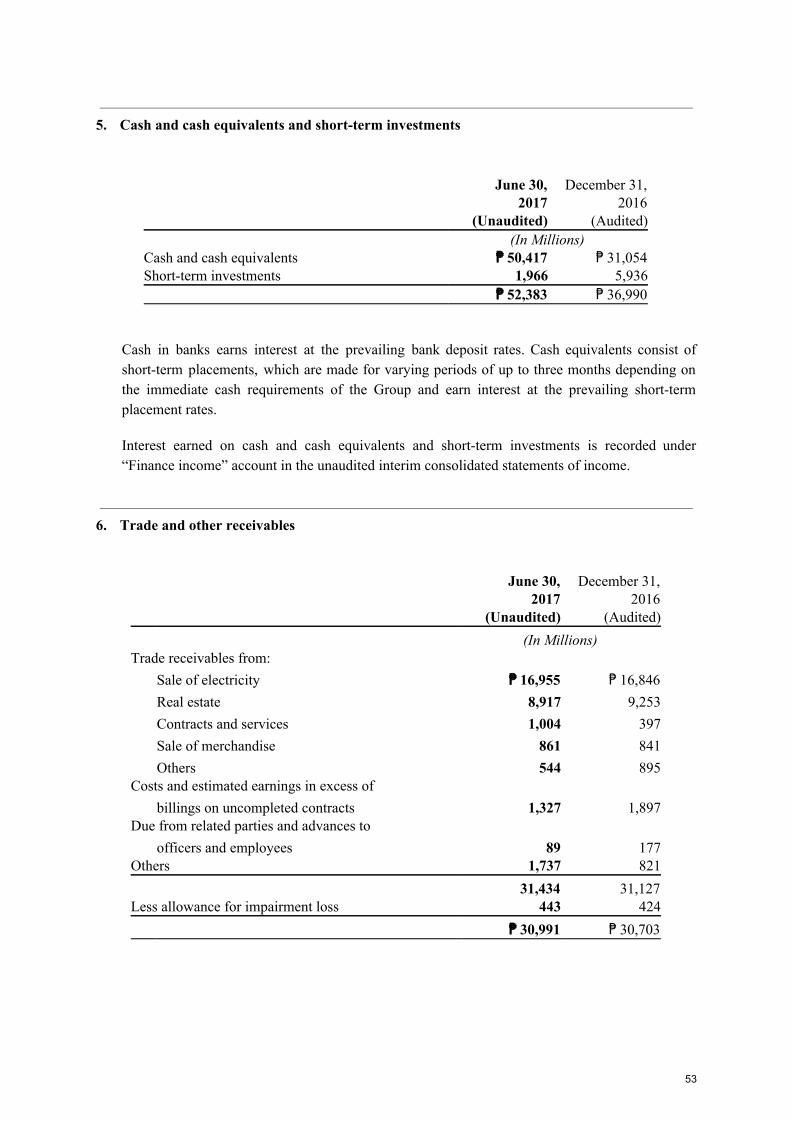
5. Cash and cash equivalents and short-term investments
June 30, 2017
(Unaudited)
December 31, 2016
(Audited) (In Millions) Cash and cash equivalents ₱ 50,417 ₱ 31,054 Short-term investments 1,966 5,936 ₱ 52,383 ₱ 36,990
Cash in banks earns interest at the prevailing bank deposit rates. Cash equivalents consist of short-term placements, which are made for varying periods of up to three months depending on the immediate cash requirements of the Group and earn interest at the prevailing short-term placement rates.
Interest earned on cash and cash equivalents and short-term investments is recorded under “Finance income” account in the unaudited interim consolidated statements of income.
6. Trade and other receivables
June 30, 2017
(Unaudited)
December 31, 2016
(Audited) (In Millions) Trade receivables from: Sale of electricity ₱ 16,955 ₱ 16,846 Real estate 8,917 9,253 Contracts and services 1,004 397 Sale of merchandise 861 841 Others 544 895Costs and estimated earnings in excess of
1,327 1,897 billings on uncompleted contracts Due from related parties and advances to
89 177 officers and employees Others 1,737 821 31,434 31,127 Less allowance for impairment loss 443 424 ₱ 30,991 ₱ 30,703
53
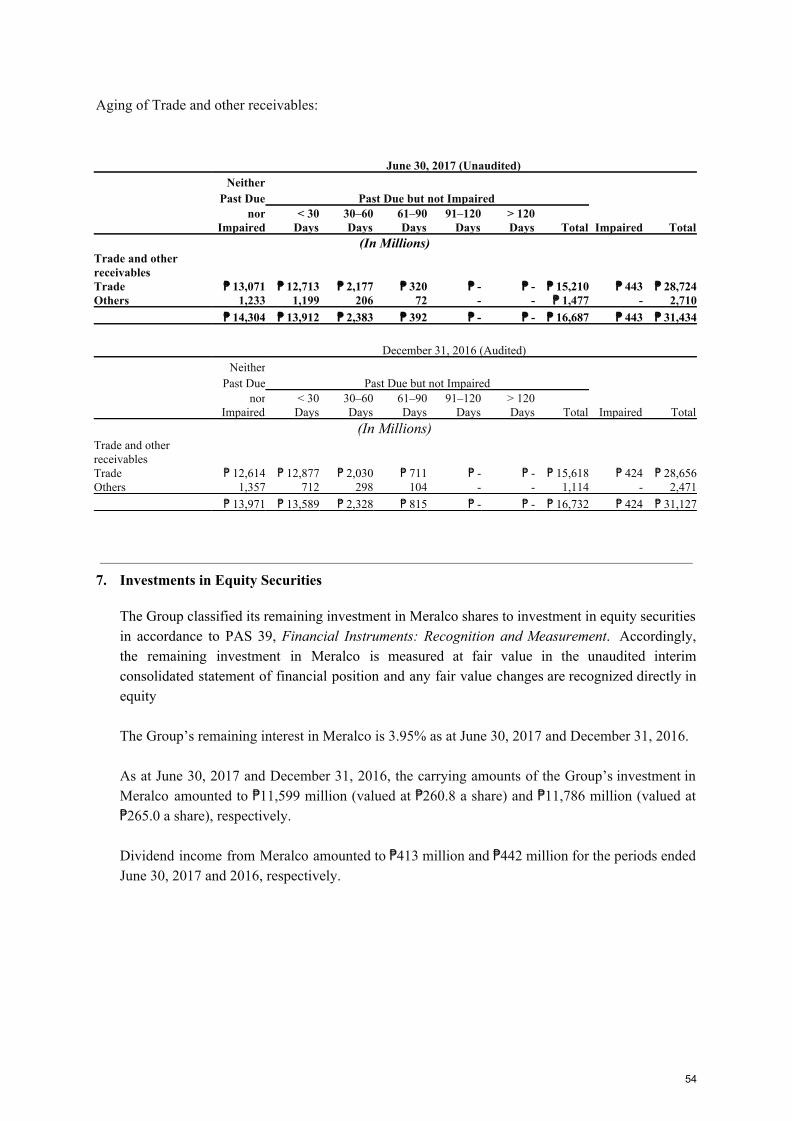
Aging of Trade and other receivables:
June 30, 2017 (Unaudited) Neither
Past Due Past Due but not Impaired nor
Impaired< 30
Days 30–60Days
61–90Days
91–120Days
> 120Days Total Impaired Total
(In Millions) Trade and other receivables Trade ₱ 13,071 ₱ 12,713 ₱ 2,177 ₱ 320 ₱ - ₱ - ₱ 15,210 ₱ 443 ₱ 28,724Others 1,233 1,199 206 72 - - ₱ 1,477 - 2,710
₱ 14,304 ₱ 13,912 ₱ 2,383 ₱ 392 ₱ - ₱ - ₱ 16,687 ₱ 443 ₱ 31,434
December 31, 2016 (Audited) Neither
Past Due Past Due but not Impaired nor
Impaired < 30
Days30–60Days
61–90Days
91–120Days
> 120Days Total Impaired Total
(In Millions) Trade and other receivables Trade ₱ 12,614 ₱ 12,877 ₱ 2,030 ₱ 711 ₱ - ₱ - ₱ 15,618 ₱ 424 ₱ 28,656Others 1,357 712 298 104 - - 1,114 - 2,471
₱ 13,971 ₱ 13,589 ₱ 2,328 ₱ 815 ₱ - ₱ - ₱ 16,732 ₱ 424 ₱ 31,127
7. Investments in Equity Securities
The Group classified its remaining investment in Meralco shares to investment in equity securities in accordance to PAS 39, Financial Instruments: Recognition and Measurement. Accordingly, the remaining investment in Meralco is measured at fair value in the unaudited interim consolidated statement of financial position and any fair value changes are recognized directly in equity The Group’s remaining interest in Meralco is 3.95% as at June 30, 2017 and December 31, 2016. As at June 30, 2017 and December 31, 2016, the carrying amounts of the Group’s investment in Meralco amounted to ₱11,599 million (valued at ₱260.8 a share) and ₱11,786 million (valued at ₱265.0 a share), respectively. Dividend income from Meralco amounted to ₱413 million and ₱442 million for the periods ended June 30, 2017 and 2016, respectively.
54

8. Trade Payable and Other Current Liabilities
June 30, 2017
(Unaudited)
December 31, 2016
(Audited) (In Millions) First Gen Corporation and subsidiaries ₱ 18,364 ₱ 17,952 Rockwell Land Corporation and subsidiaries 6,012 7,086First Balfour, Inc. and subsidiaries 2,672 2,662FPH Parent 1,379 1,265First Philippine Electric Corporation and Subsidiaries 1,381 1,577First Philippine Industrial Park and subsidiaries 413 128First Philippine Industrial Corporation 175 175First Philippine Properties Corporation and subsidiaries 348 236First Philippine Capital Resources, Inc. 3 4 First Philippine Realty Corporation 23 31Securities Transfer Services, Inc. 4 3 Asian Eye Institute, Inc 25 - ₱ 30,799 ₱ 31,119
9. Long-term Debts
June 30, 2017
(Unaudited)December 31, 2016
(Audited) Current Long-term Current Long-term (In Millions) Power Generation ₱ 15,558 ₱ 127,893 ₱ 14,383 ₱ 118,774Real Estate Development 2,010 14,930 1,712 14,278 FPH Parent 1,548 9,209 1,538 9,988Construction and Other Services 314 781 632 1,172Manufacturing 80 155 28 207 ₱ 19,510 ₱ 152,968 ₱ 18,293 ₱ 144,419
55
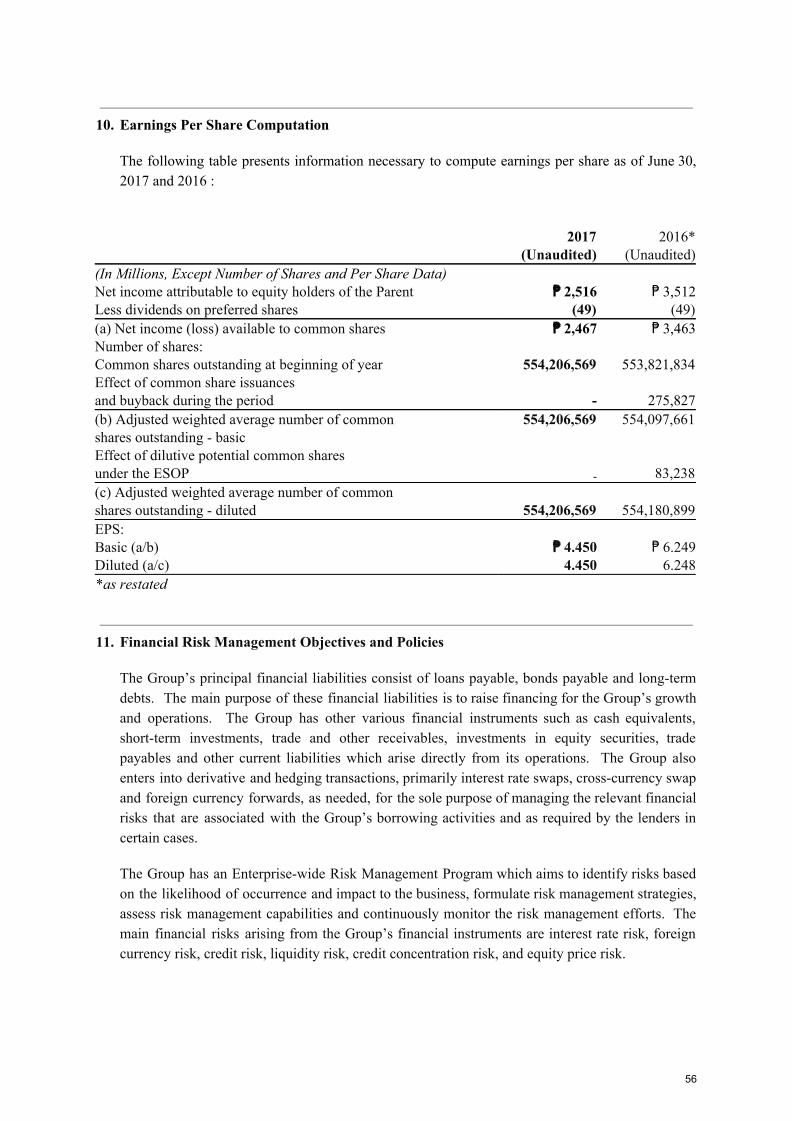
10. Earnings Per Share Computation
The following table presents information necessary to compute earnings per share as of June 30, 2017 and 2016 :
2017
(Unaudited)2016*
(Unaudited)(In Millions, Except Number of Shares and Per Share Data) Net income attributable to equity holders of the Parent ₱ 2,516 ₱ 3,512Less dividends on preferred shares (49) (49) (a) Net income (loss) available to common shares ₱ 2,467 ₱ 3,463Number of shares: Common shares outstanding at beginning of year 554,206,569 553,821,834 Effect of common share issuances
- 275,827and buyback during the period (b) Adjusted weighted average number of common 554,206,569 554,097,661 shares outstanding - basic Effect of dilutive potential common shares
- 83,238 under the ESOP (c) Adjusted weighted average number of common
554,206,569 554,180,899 shares outstanding - diluted EPS: Basic (a/b) ₱ 4.450 ₱ 6.249Diluted (a/c) 4.450 6.248*as restated
11. Financial Risk Management Objectives and Policies
The Group’s principal financial liabilities consist of loans payable, bonds payable and long-term debts. The main purpose of these financial liabilities is to raise financing for the Group’s growth and operations. The Group has other various financial instruments such as cash equivalents, short-term investments, trade and other receivables, investments in equity securities, trade payables and other current liabilities which arise directly from its operations. The Group also enters into derivative and hedging transactions, primarily interest rate swaps, cross-currency swap and foreign currency forwards, as needed, for the sole purpose of managing the relevant financial risks that are associated with the Group’s borrowing activities and as required by the lenders in certain cases.
The Group has an Enterprise-wide Risk Management Program which aims to identify risks based on the likelihood of occurrence and impact to the business, formulate risk management strategies, assess risk management capabilities and continuously monitor the risk management efforts. The main financial risks arising from the Group’s financial instruments are interest rate risk, foreign currency risk, credit risk, liquidity risk, credit concentration risk, and equity price risk.
56
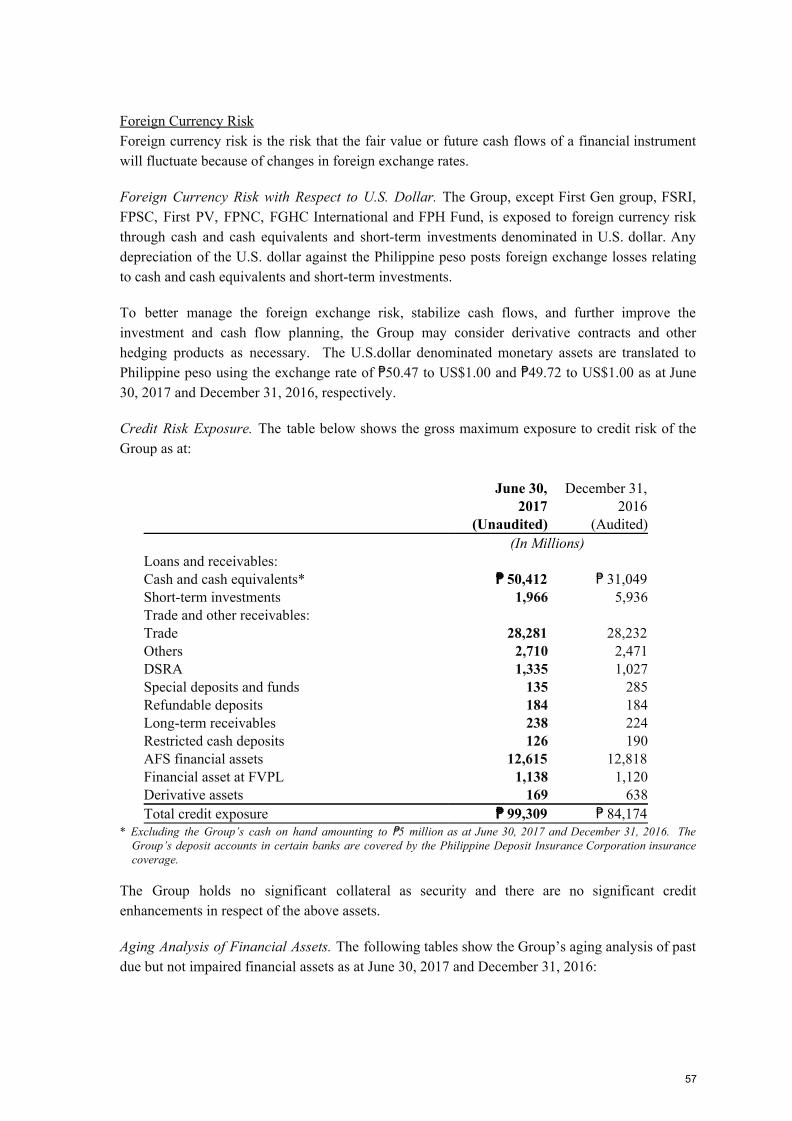
Foreign Currency Risk Foreign currency risk is the risk that the fair value or future cash flows of a financial instrument will fluctuate because of changes in foreign exchange rates.
Foreign Currency Risk with Respect to U.S. Dollar. The Group, except First Gen group, FSRI, FPSC, First PV, FPNC, FGHC International and FPH Fund, is exposed to foreign currency risk through cash and cash equivalents and short-term investments denominated in U.S. dollar. Any depreciation of the U.S. dollar against the Philippine peso posts foreign exchange losses relating to cash and cash equivalents and short-term investments.
To better manage the foreign exchange risk, stabilize cash flows, and further improve the investment and cash flow planning, the Group may consider derivative contracts and other hedging products as necessary. The U.S.dollar denominated monetary assets are translated to Philippine peso using the exchange rate of ₱50.47 to US$1.00 and ₱49.72 to US$1.00 as at June 30, 2017 and December 31, 2016, respectively.
Credit Risk Exposure. The table below shows the gross maximum exposure to credit risk of the Group as at:
June 30, 2017
(Unaudited)
December 31, 2016
(Audited) (In Millions) Loans and receivables: Cash and cash equivalents* ₱ 50,412 ₱ 31,049 Short-term investments 1,966 5,936Trade and other receivables: Trade 28,281 28,232 Others 2,710 2,471DSRA 1,335 1,027Special deposits and funds 135 285Refundable deposits 184 184Long-term receivables 238 224Restricted cash deposits 126 190AFS financial assets 12,615 12,818 Financial asset at FVPL 1,138 1,120Derivative assets 169 638Total credit exposure ₱ 99,309 ₱ 84,174
* Excluding the Group’s cash on hand amounting to ₱5 million as at June 30, 2017 and December 31, 2016. The Group’s deposit accounts in certain banks are covered by the Philippine Deposit Insurance Corporation insurance coverage.
The Group holds no significant collateral as security and there are no significant credit enhancements in respect of the above assets.
Aging Analysis of Financial Assets. The following tables show the Group’s aging analysis of past due but not impaired financial assets as at June 30, 2017 and December 31, 2016:
57
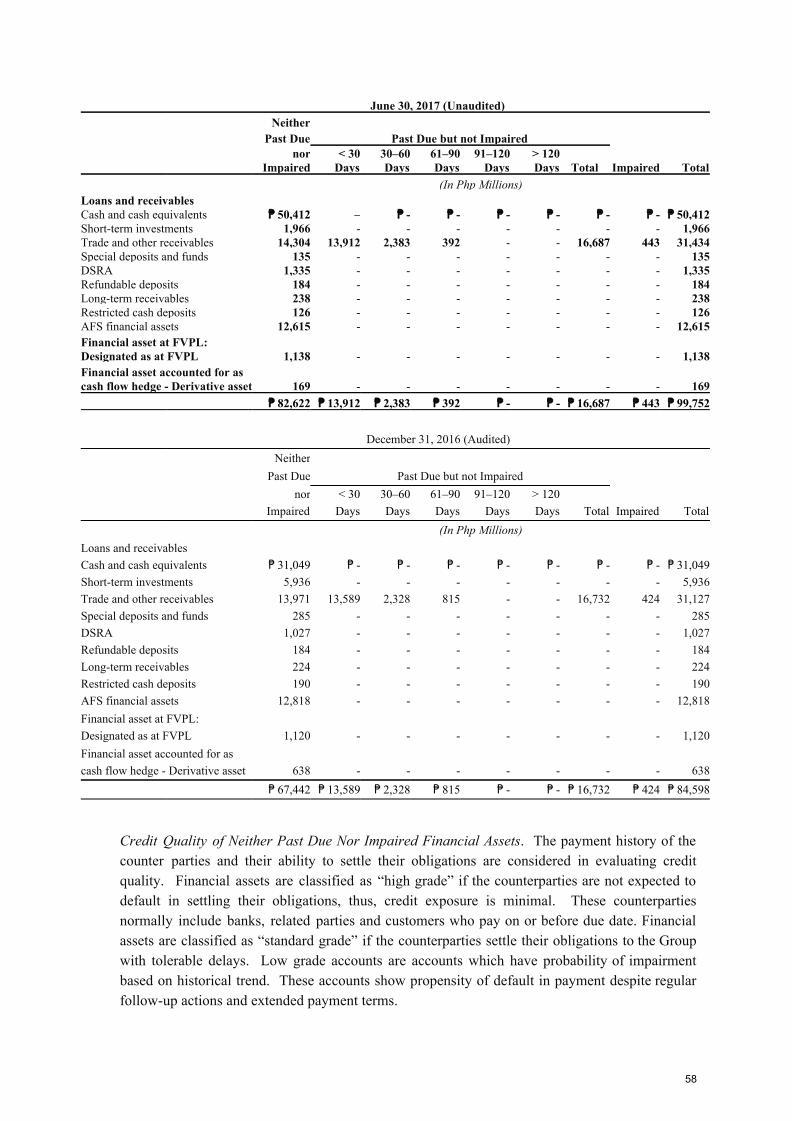
June 30, 2017 (Unaudited) Neither Past Due Past Due but not Impaired
nor
Impaired< 30
Days 30–60Days
61–90Days
91–120Days
> 120Days Total Impaired Total
(In Php Millions) Loans and receivables Cash and cash equivalents ₱ 50,412 – ₱ - ₱ - ₱ - ₱ - ₱ - ₱ - ₱ 50,412Short-term investments 1,966 - - - - - - - 1,966Trade and other receivables 14,304 13,912 2,383 392 - - 16,687 443 31,434Special deposits and funds 135 - - - - - - - 135DSRA 1,335 - - - - - - - 1,335Refundable deposits 184 - - - - - - - 184Long-term receivables 238 - - - - - - - 238Restricted cash deposits 126 - - - - - - - 126AFS financial assets 12,615 - - - - - - - 12,615Financial asset at FVPL: Designated as at FVPL 1,138 - - - - - - - 1,138Financial asset accounted for as cash flow hedge - Derivative asset 169 - - - - - - - 169
₱ 82,622 ₱ 13,912 ₱ 2,383 ₱ 392 ₱ - ₱ - ₱ 16,687 ₱ 443 ₱ 99,752
December 31, 2016 (Audited) Neither Past Due Past Due but not Impaired
nor
Impaired < 30
Days30–60Days
61–90Days
91–120Days
> 120Days Total Impaired Total
(In Php Millions) Loans and receivables Cash and cash equivalents ₱ 31,049 ₱ - ₱ - ₱ - ₱ - ₱ - ₱ - ₱ - ₱ 31,049Short-term investments 5,936 - - - - - - - 5,936Trade and other receivables 13,971 13,589 2,328 815 - - 16,732 424 31,127Special deposits and funds 285 - - - - - - - 285DSRA 1,027 - - - - - - - 1,027Refundable deposits 184 - - - - - - - 184Long-term receivables 224 - - - - - - - 224Restricted cash deposits 190 - - - - - - - 190AFS financial assets 12,818 - - - - - - - 12,818Financial asset at FVPL: Designated as at FVPL 1,120 - - - - - - - 1,120Financial asset accounted for as cash flow hedge - Derivative asset 638 - - - - - - - 638
₱ 67,442 ₱ 13,589 ₱ 2,328 ₱ 815 ₱ - ₱ - ₱ 16,732 ₱ 424 ₱ 84,598
Credit Quality of Neither Past Due Nor Impaired Financial Assets. The payment history of the counter parties and their ability to settle their obligations are considered in evaluating credit quality. Financial assets are classified as “high grade” if the counterparties are not expected to default in settling their obligations, thus, credit exposure is minimal. These counterparties normally include banks, related parties and customers who pay on or before due date. Financial assets are classified as “standard grade” if the counterparties settle their obligations to the Group with tolerable delays. Low grade accounts are accounts which have probability of impairment based on historical trend. These accounts show propensity of default in payment despite regular follow-up actions and extended payment terms.
58
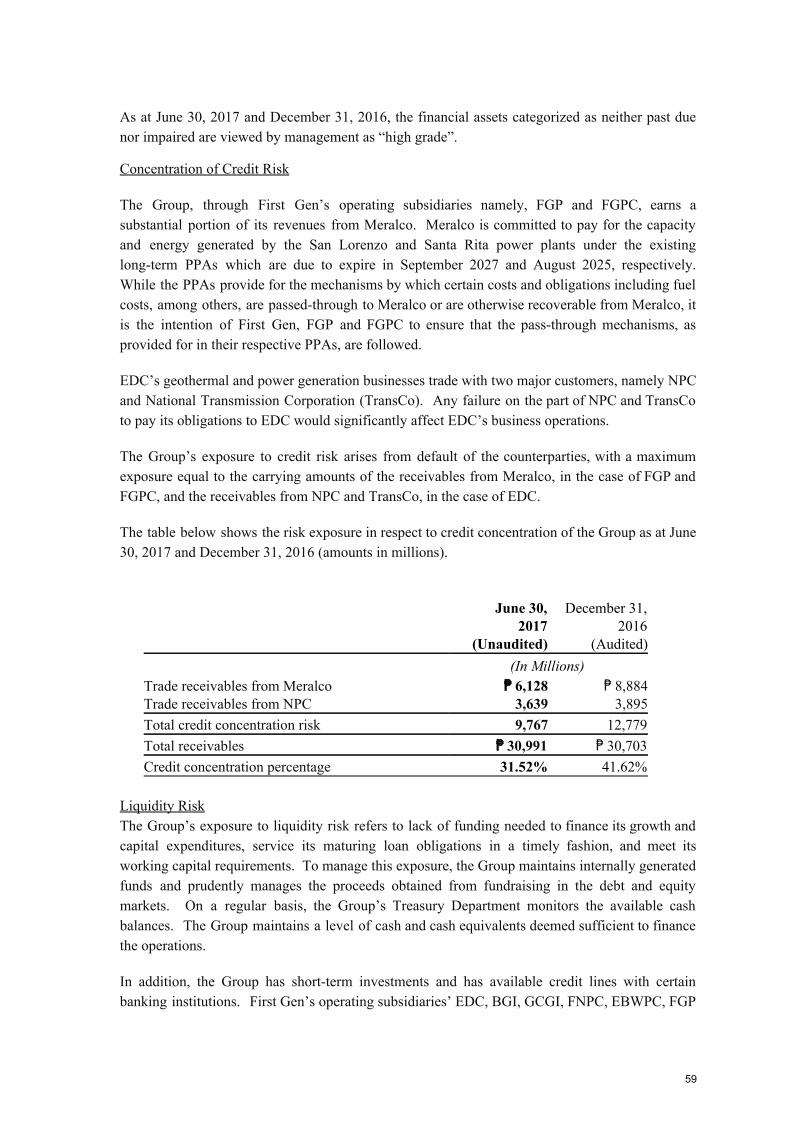
As at June 30, 2017 and December 31, 2016, the financial assets categorized as neither past due nor impaired are viewed by management as “high grade”.
Concentration of Credit Risk
The Group, through First Gen’s operating subsidiaries namely, FGP and FGPC, earns a substantial portion of its revenues from Meralco. Meralco is committed to pay for the capacity and energy generated by the San Lorenzo and Santa Rita power plants under the existing long-term PPAs which are due to expire in September 2027 and August 2025, respectively. While the PPAs provide for the mechanisms by which certain costs and obligations including fuel costs, among others, are passed-through to Meralco or are otherwise recoverable from Meralco, it is the intention of First Gen, FGP and FGPC to ensure that the pass-through mechanisms, as provided for in their respective PPAs, are followed.
EDC’s geothermal and power generation businesses trade with two major customers, namely NPC and National Transmission Corporation (TransCo). Any failure on the part of NPC and TransCo to pay its obligations to EDC would significantly affect EDC’s business operations.
The Group’s exposure to credit risk arises from default of the counterparties, with a maximum exposure equal to the carrying amounts of the receivables from Meralco, in the case of FGP and FGPC, and the receivables from NPC and TransCo, in the case of EDC.
The table below shows the risk exposure in respect to credit concentration of the Group as at June 30, 2017 and December 31, 2016 (amounts in millions).
June 30, 2017
(Unaudited)
December 31, 2016
(Audited) (In Millions) Trade receivables from Meralco ₱ 6,128 ₱ 8,884Trade receivables from NPC 3,639 3,895Total credit concentration risk 9,767 12,779 Total receivables ₱ 30,991 ₱ 30,703 Credit concentration percentage 31.52% 41.62%
Liquidity Risk The Group’s exposure to liquidity risk refers to lack of funding needed to finance its growth and capital expenditures, service its maturing loan obligations in a timely fashion, and meet its working capital requirements. To manage this exposure, the Group maintains internally generated funds and prudently manages the proceeds obtained from fundraising in the debt and equity markets. On a regular basis, the Group’s Treasury Department monitors the available cash balances. The Group maintains a level of cash and cash equivalents deemed sufficient to finance the operations.
In addition, the Group has short-term investments and has available credit lines with certain banking institutions. First Gen’s operating subsidiaries’ EDC, BGI, GCGI, FNPC, EBWPC, FGP
59
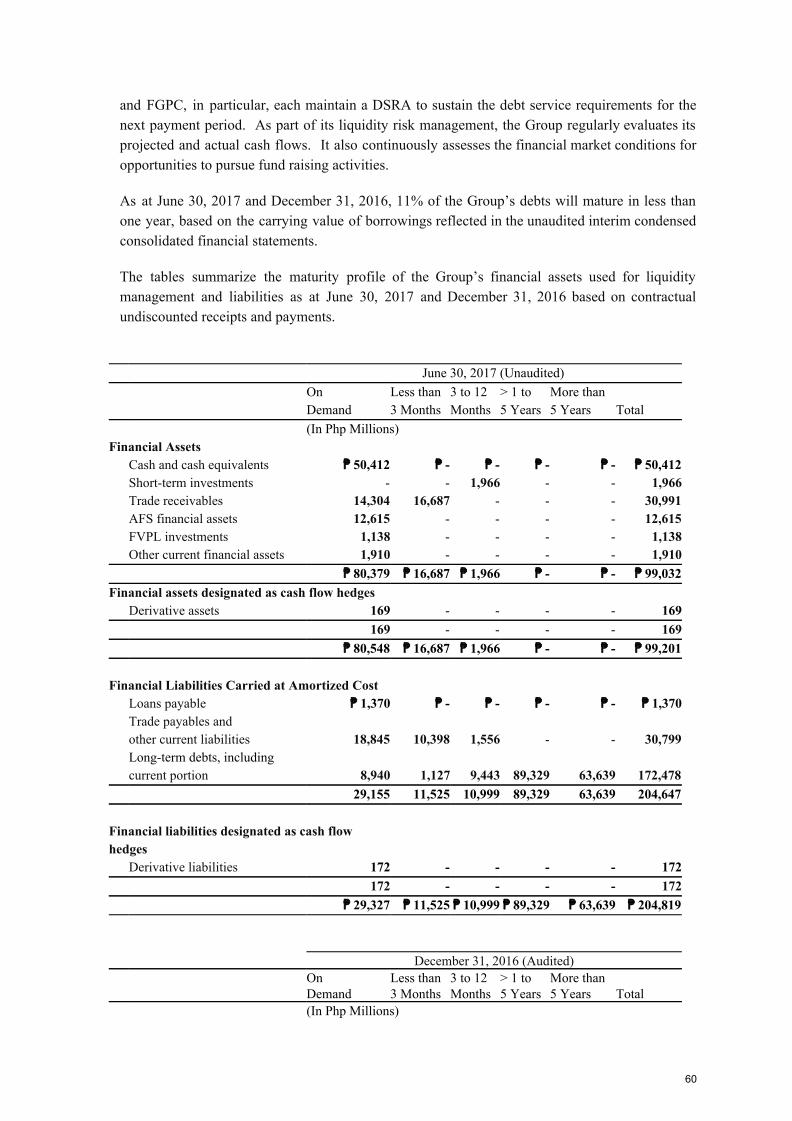
and FGPC, in particular, each maintain a DSRA to sustain the debt service requirements for the next payment period. As part of its liquidity risk management, the Group regularly evaluates its projected and actual cash flows. It also continuously assesses the financial market conditions for opportunities to pursue fund raising activities.
As at June 30, 2017 and December 31, 2016, 11% of the Group’s debts will mature in less than one year, based on the carrying value of borrowings reflected in the unaudited interim condensed consolidated financial statements.
The tables summarize the maturity profile of the Group’s financial assets used for liquidity management and liabilities as at June 30, 2017 and December 31, 2016 based on contractual undiscounted receipts and payments.
June 30, 2017 (Unaudited)
On Demand
Less than 3 Months
3 to 12 Months
> 1 to 5 Years
More than 5 Years Total
(In Php Millions) Financial Assets
Cash and cash equivalents ₱ 50,412 ₱ - ₱ - ₱ - ₱ - ₱ 50,412Short-term investments - - 1,966 - - 1,966Trade receivables 14,304 16,687 - - - 30,991AFS financial assets 12,615 - - - - 12,615FVPL investments 1,138 - - - - 1,138Other current financial assets 1,910 - - - - 1,910
₱ 80,379 ₱ 16,687 ₱ 1,966 ₱ - ₱ - ₱ 99,032Financial assets designated as cash flow hedges
Derivative assets 169 - - - - 169169 - - - - 169
₱ 80,548 ₱ 16,687 ₱ 1,966 ₱ - ₱ - ₱ 99,201
Financial Liabilities Carried at Amortized Cost Loans payable ₱ 1,370 ₱ - ₱ - ₱ - ₱ - ₱ 1,370Trade payables and other current liabilities 18,845 10,398 1,556 - - 30,799Long-term debts, including current portion 8,940 1,127 9,443 89,329 63,639 172,478
29,155 11,525 10,999 89,329 63,639 204,647
Financial liabilities designated as cash flow hedges
Derivative liabilities 172 - - - - 172172 - - - - 172
₱ 29,327 ₱ 11,525 ₱ 10,999 ₱ 89,329 ₱ 63,639 ₱ 204,819
December 31, 2016 (Audited)
On Demand
Less than 3 Months
3 to 12 Months
> 1 to 5 Years
More than 5 Years Total
(In Php Millions)
60

Financial Assets Cash and cash equivalents ₱ 31,049 ₱ - ₱ - ₱ - ₱ - ₱ 31,049Short-term investments - - 5,936 - - 5,936Trade receivables 26,660 1,959 2,084 - - 30,703AFS financial assets 12,818 - - - - 12,818FVPL investments 1,120 - - - - 1,120Other current financial assets 1,871 - - - - 1,871Other noncurrent financial assets - - 677 - - 677
73,518 1,959 8,697 - - 84,174Financial assets designated as cash flow hedges
Derivative contract receipts - - 92 239 - 331Derivative contract payments - - (54) (106) - (160)
- - 38 133 - 171₱ 73,518 ₱ 1,959 ₱ 8,735 ₱ 133 ₱ - ₱ 84,345
Financial Liabilities Carried at Amortized Cost
Loans payable ₱ 812 ₱ - ₱ - ₱ - ₱ - ₱ 812Trade payables and other current liabilities 19,041 10,506 1,572 - - 31,119Long-term debts, including current portion 18,293 2,306 19,324 71,705 51,084 162,712
₱ 38,146 ₱ 12,812 ₱ 20,896 ₱ 71,705 ₱ 51,084 ₱ 194,643 Financial liabilities designated as cash flow hedges
Derivative contract receipts - - (141) (439) - (580)Derivative contract payments - - 453 888 - 1,341
- - 312 449 - 761 ₱ 38,146 ₱ 12,812 ₱ 21,208 ₱ 72,154 ₱ 51,084 ₱ 195,404
Equity Price Risk The Group’s quoted equity securities are susceptible to market price risk arising from uncertainties about future values of the investment in equity securities. The Group manages the equity price risk through diversification and by placing limits on individual and total equity instruments. The Group’s BOD reviews and approves all equity investment decisions.
The following table demonstrates the sensitivity to a reasonably possible change in share price, with all other variables held constant:
Change in
Equity Price* Effect on
Equity Investment in equity securities June 30, 2017 9% ₱1,004 (9%) (1,044) December 31, 2016 11% ₱1,296 (11%) (1,296)* The sensitivity analysis includes the Company’s quoted equity securities with amounts adjusted by the specific beta for these investments as of reporting date.
Capital Management The primary objective of the Group’s capital management is to ensure that it maintains a strong credit rating and healthy capital ratios in order to support its business, comply with its financial loan covenants and maximize shareholder value.
61

The Group manages its capital structure and makes adjustments to it, in light of changes in business and economic conditions. To maintain or adjust the capital structure, the Group may adjust the dividend payment to shareholders, return capital to shareholders or issue new shares. No changes were made in the objectives, policies or processes during the periods ended June 30, 2017 and December 31, 2016.
The Group monitors capital using a debt-to-equity ratio, which is total debt divided by total equity. The Group’s practice is to keep the debt-to-equity ratio not more than 2.50:1.
June 30, 2017
(Unaudited)
December 31, 2016
(Audited) (In Php Millions) Long-term debts (current and noncurrent portions) ₱ 172,478 ₱ 162,712 Equity attributable to equity holders of the Parent 78,474 76,514 Non-controlling interests 66,230 64,507 Total equity ₱ 144,704 ₱ 141,021Debt-to-equity ratio 1.19:1 1.15:1
The Parent Company and certain of its subsidiaries are obligated to perform certain covenants with respect to maintaining specified debt-to-equity and minimum debt-service-coverage ratios, as set forth in their respective agreements with the creditors.
12. Financial Instruments
Set out below is a comparison by category of carrying amounts and fair values of all of the Group’s financial instruments in the unaudited interim condensed consolidated financial statements as at June 30, 2017 and December 31, 2016.
June 30, 2017
(Unaudited)December 31, 2016
(Audited)
Carrying
Value Fair Value Carrying
Value Fair Value (In Php Millions) Financial Assets Financial assets accounted for as cash flow
hedges - Derivative assets ₱ 169 ₱ 169 ₱ 638 ₱ 638Financial assets designated at FVPL 1,138 1,138 1,120 1,120Loans and receivables Cash and cash equivalents 50,412 50,412 31,049 31,049 Short-term investments 1,966 1,966 5,936 5,936 Trade and other receivables 30,991 30,991 30,703 30,703 Special deposits and funds 135 135 285 285 DSRA 1,335 1,335 1,027 1,027 Refundable deposits 184 184 184 184 Long-term receivables 238 238 224 224 Restricted cash deposits 126 126 190 190
62
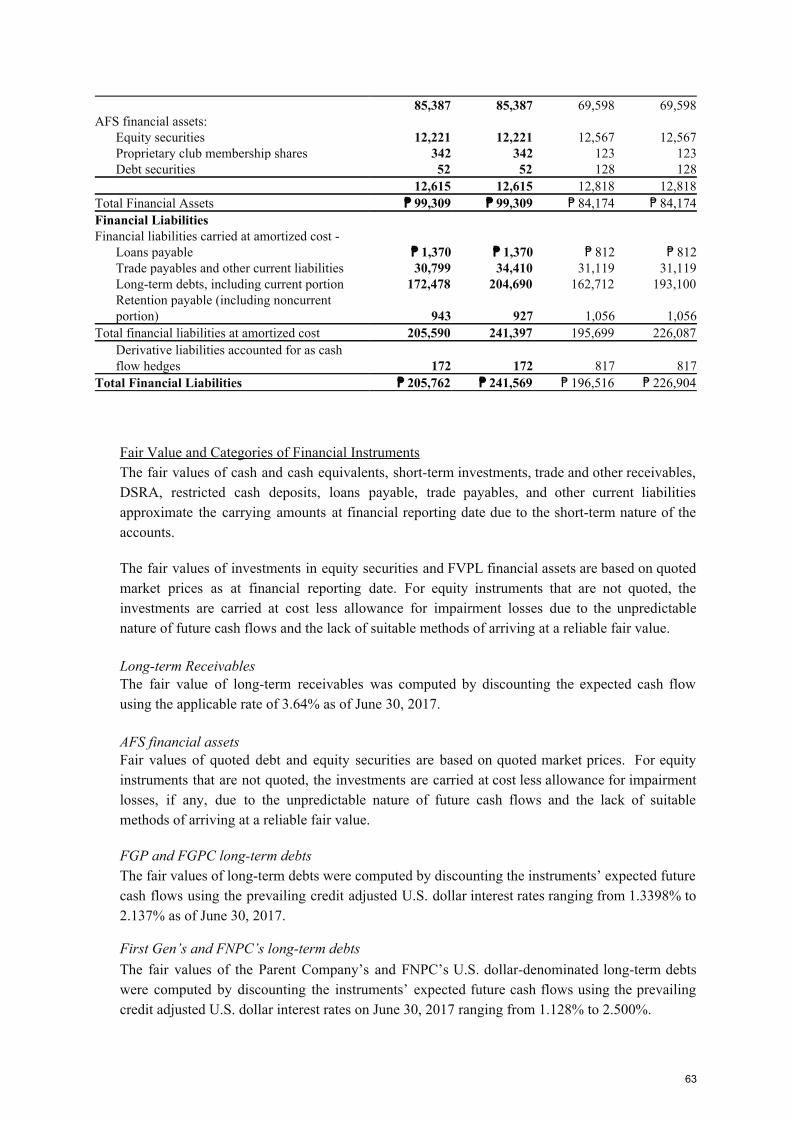
85,387 85,387 69,598 69,598AFS financial assets: Equity securities 12,221 12,221 12,567 12,567 Proprietary club membership shares 342 342 123 123 Debt securities 52 52 128 128 12,615 12,615 12,818 12,818Total Financial Assets ₱ 99,309 ₱ 99,309 ₱ 84,174 ₱ 84,174Financial Liabilities Financial liabilities carried at amortized cost - Loans payable ₱ 1,370 ₱ 1,370 ₱ 812 ₱ 812 Trade payables and other current liabilities 30,799 34,410 31,119 31,119 Long-term debts, including current portion 172,478 204,690 162,712 193,100
Retention payable (including noncurrent portion) 943 927 1,056 1,056
Total financial liabilities at amortized cost 205,590 241,397 195,699 226,087
Derivative liabilities accounted for as cash flow hedges 172 172 817 817
Total Financial Liabilities ₱ 205,762 ₱ 241,569 ₱ 196,516 ₱ 226,904
Fair Value and Categories of Financial Instruments The fair values of cash and cash equivalents, short-term investments, trade and other receivables, DSRA, restricted cash deposits, loans payable, trade payables, and other current liabilities approximate the carrying amounts at financial reporting date due to the short-term nature of the accounts.
The fair values of investments in equity securities and FVPL financial assets are based on quoted market prices as at financial reporting date. For equity instruments that are not quoted, the investments are carried at cost less allowance for impairment losses due to the unpredictable nature of future cash flows and the lack of suitable methods of arriving at a reliable fair value. Long-term Receivables The fair value of long-term receivables was computed by discounting the expected cash flow using the applicable rate of 3.64% as of June 30, 2017. AFS financial assets Fair values of quoted debt and equity securities are based on quoted market prices. For equity instruments that are not quoted, the investments are carried at cost less allowance for impairment losses, if any, due to the unpredictable nature of future cash flows and the lack of suitable methods of arriving at a reliable fair value.
FGP and FGPC long-term debts The fair values of long-term debts were computed by discounting the instruments’ expected future cash flows using the prevailing credit adjusted U.S. dollar interest rates ranging from 1.3398% to 2.137% as of June 30, 2017.
First Gen’s and FNPC’s long-term debts The fair values of the Parent Company’s and FNPC’s U.S. dollar-denominated long-term debts were computed by discounting the instruments’ expected future cash flows using the prevailing credit adjusted U.S. dollar interest rates on June 30, 2017 ranging from 1.128% to 2.500%.
63
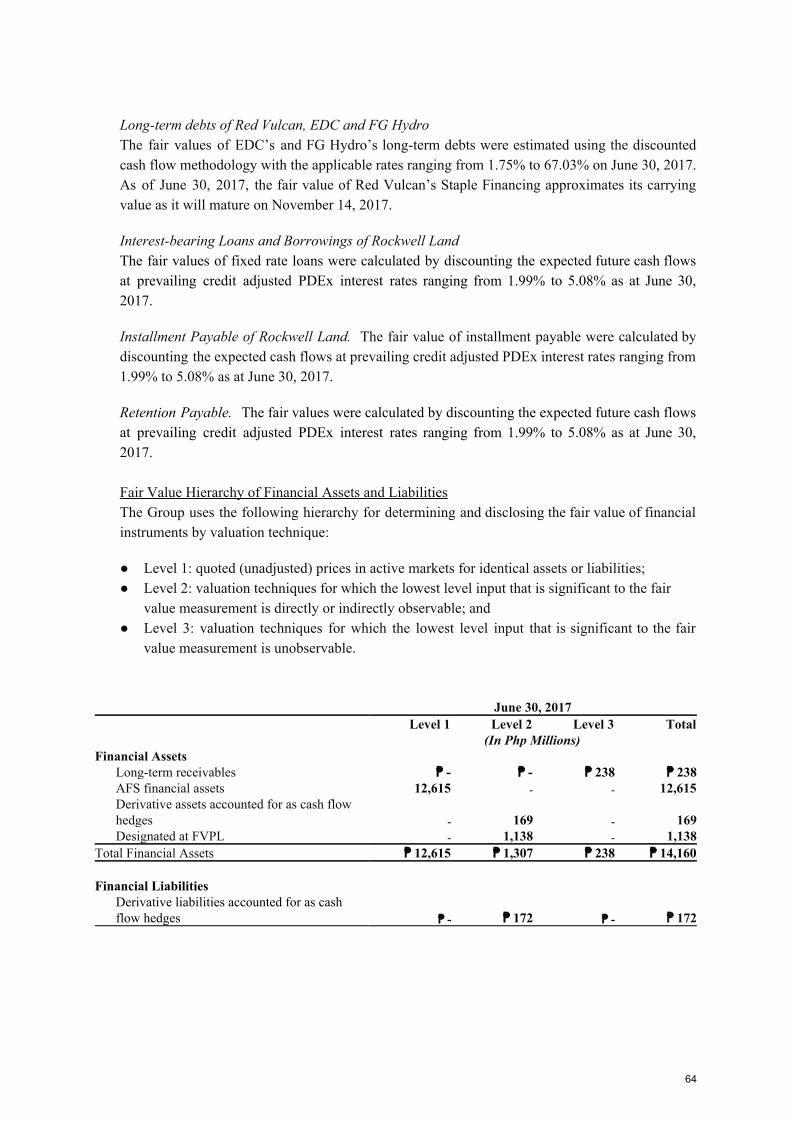
Long-term debts of Red Vulcan, EDC and FG Hydro The fair values of EDC’s and FG Hydro’s long-term debts were estimated using the discounted cash flow methodology with the applicable rates ranging from 1.75% to 67.03% on June 30, 2017. As of June 30, 2017, the fair value of Red Vulcan’s Staple Financing approximates its carrying value as it will mature on November 14, 2017.
Interest-bearing Loans and Borrowings of Rockwell Land The fair values of fixed rate loans were calculated by discounting the expected future cash flows at prevailing credit adjusted PDEx interest rates ranging from 1.99% to 5.08% as at June 30, 2017.
Installment Payable of Rockwell Land. The fair value of installment payable were calculated by discounting the expected cash flows at prevailing credit adjusted PDEx interest rates ranging from 1.99% to 5.08% as at June 30, 2017.
Retention Payable. The fair values were calculated by discounting the expected future cash flows at prevailing credit adjusted PDEx interest rates ranging from 1.99% to 5.08% as at June 30, 2017. Fair Value Hierarchy of Financial Assets and Liabilities The Group uses the following hierarchy for determining and disclosing the fair value of financial instruments by valuation technique:
● Level 1: quoted (unadjusted) prices in active markets for identical assets or liabilities; ● Level 2: valuation techniques for which the lowest level input that is significant to the fair
value measurement is directly or indirectly observable; and ● Level 3: valuation techniques for which the lowest level input that is significant to the fair
value measurement is unobservable. June 30, 2017 Level 1 Level 2 Level 3 Total (In Php Millions) Financial Assets Long-term receivables ₱ - ₱ - ₱ 238 ₱ 238 AFS financial assets 12,615 - - 12,615
Derivative assets accounted for as cash flow hedges - 169 - 169
Designated at FVPL - 1,138 - 1,138Total Financial Assets ₱ 12,615 ₱ 1,307 ₱ 238 ₱ 14,160 Financial Liabilities
Derivative liabilities accounted for as cash flow hedges ₱ - ₱ 172 ₱ - ₱ 172
64
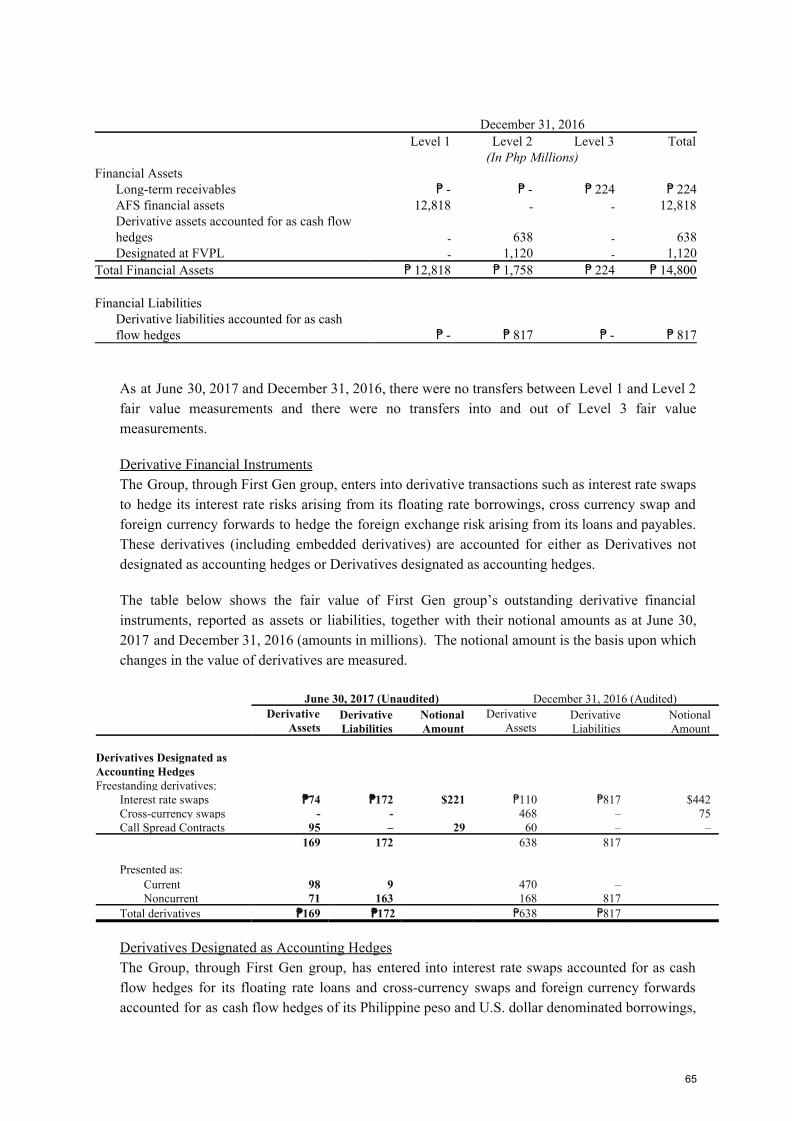
December 31, 2016 Level 1 Level 2 Level 3 Total (In Php Millions) Financial Assets Long-term receivables ₱ - ₱ - ₱ 224 ₱ 224 AFS financial assets 12,818 - - 12,818
Derivative assets accounted for as cash flow hedges - 638 - 638
Designated at FVPL - 1,120 - 1,120Total Financial Assets ₱ 12,818 ₱ 1,758 ₱ 224 ₱ 14,800 Financial Liabilities
Derivative liabilities accounted for as cash flow hedges ₱ - ₱ 817 ₱ - ₱ 817
As at June 30, 2017 and December 31, 2016, there were no transfers between Level 1 and Level 2 fair value measurements and there were no transfers into and out of Level 3 fair value measurements.
Derivative Financial Instruments The Group, through First Gen group, enters into derivative transactions such as interest rate swaps to hedge its interest rate risks arising from its floating rate borrowings, cross currency swap and foreign currency forwards to hedge the foreign exchange risk arising from its loans and payables. These derivatives (including embedded derivatives) are accounted for either as Derivatives not designated as accounting hedges or Derivatives designated as accounting hedges.
The table below shows the fair value of First Gen group’s outstanding derivative financial instruments, reported as assets or liabilities, together with their notional amounts as at June 30, 2017 and December 31, 2016 (amounts in millions). The notional amount is the basis upon which changes in the value of derivatives are measured. June 30, 2017 (Unaudited) December 31, 2016 (Audited)
Derivative
Assets Derivative Liabilities
Notional Amount
Derivative Assets
Derivative Liabilities
Notional Amount
Derivatives Designated as Accounting Hedges Freestanding derivatives:
Interest rate swaps ₱74 ₱172 $221 ₱110 ₱817 $442 Cross-currency swaps - - 468 – 75 Call Spread Contracts 95 – 29 60 – – 169 172 638 817
Presented as: Current 98 9 470 – Noncurrent 71 163 168 817 Total derivatives ₱169 ₱172 ₱638 ₱817
Derivatives Designated as Accounting Hedges The Group, through First Gen group, has entered into interest rate swaps accounted for as cash flow hedges for its floating rate loans and cross-currency swaps and foreign currency forwards accounted for as cash flow hedges of its Philippine peso and U.S. dollar denominated borrowings,
65
respectively. Under a cash flow hedge, the effective portion of changes in fair value of the hedging instrument is recognized as cumulative translation adjustments in other comprehensive income (loss) until the hedged item affects earnings. Interest Rate Swaps – FGPC. On November 14, 2008, FGPC entered into 8 interest rate swap agreements with the following hedge providers namely: Société Générale (Singapore Branch), Bayerische Hypo-und Vereinsbank AG (Hong Kong Branch), Calyon and Standard Chartered Bank. On the same date, FGPC designated the interest rate swaps as hedges of the cash flow variability in the Covered and Uncovered Facilities, attributable to the movements in the 6-month U.S. LIBOR.
Under the four interest rate swap agreements that hedge 100% of the Covered Facility, FGPC pays a fixed rate of 4.4025% and receives a 6-month U.S. LIBOR on the aggregate amortizing notional amount of $312.0 million, simultaneous with the interest payments every May and November on the hedged loan. The notional amounts of the interest rate swaps are amortizing based on the repayment schedule of the hedged loan. The interest rate swap agreements have a term of 12 ½ years and will mature on May 10, 2021 (coinciding with the maturity of the hedged loan).
Under the four interest rate swap agreements that hedge 75% of the Uncovered Facility, FGPC pays a fixed rate of 4.0625% and receives a 6-month U.S. LIBOR on the aggregate amortizing notional amount of $141.0 million, simultaneous with the interest payments every May and November on the hedged loan. The notional amounts of the interest rate swaps are amortizing based on the repayment schedule of the hedged loan. The interest rate swaps have a term of 8 ½ years and will mature on May 10, 2017 (coinciding with the maturity of the hedged loan). On May 19, 2017, FGPC terminated the interest rate swap agreement in the amount of $13.4 million. As the hedge loan was terminated, the fair value changes of interest rate swap that was deferred to “Cumulative translation adjustments” account in the unaudited interim consolidated statement of financial position amounting to ₱668.9 million ($13.4 million) as of the termination date was taken in the“Finance costs” account in the unaudited interim consolidated statements of income.
As at June 30, 2017 and December 31, 2016, the aggregate negative fair values of the interest rate swaps that were deferred to “Cumulative translation adjustments” account in the unaudited interim consolidated statements of financial position amounted to nil and ₱502.2 million, net of related deferred tax effect of ₱213.8 million ($10.1 million, net of related deferred tax effect of $4.3 million), respectively. Interest Rate Swaps – FGP In April 2013, FGP entered into two interest rate swap agreements with ING Bank and Standard Chartered Bank to hedge its floating rate exposure on $80.0 million of its $420.0 million term loan facility. Under the interest rate swap agreements, FGP pays a fixed rate of 1.425% and receives a floating rate of U.S. LIBOR, on a semi-annual basis, simultaneous with the interest payments every June and December on the hedged loan.
In May 2013, FGP entered into another interest rate swap agreement with RCBC to hedge its floating rate exposure on another $20.0 million of the $420.0 million term loan facility. Under the
66
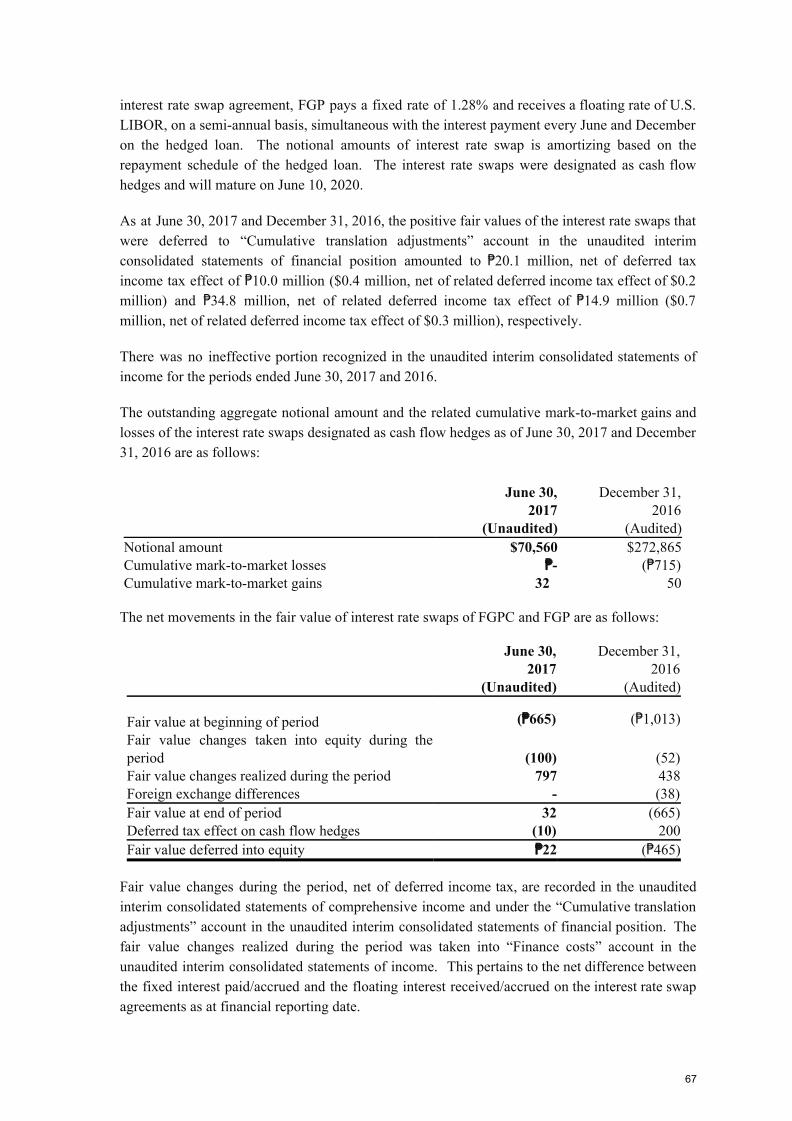
interest rate swap agreement, FGP pays a fixed rate of 1.28% and receives a floating rate of U.S. LIBOR, on a semi-annual basis, simultaneous with the interest payment every June and December on the hedged loan. The notional amounts of interest rate swap is amortizing based on the repayment schedule of the hedged loan. The interest rate swaps were designated as cash flow hedges and will mature on June 10, 2020.
As at June 30, 2017 and December 31, 2016, the positive fair values of the interest rate swaps that were deferred to “Cumulative translation adjustments” account in the unaudited interim consolidated statements of financial position amounted to ₱20.1 million, net of deferred tax income tax effect of ₱10.0 million ($0.4 million, net of related deferred income tax effect of $0.2 million) and ₱34.8 million, net of related deferred income tax effect of ₱14.9 million ($0.7 million, net of related deferred income tax effect of $0.3 million), respectively.
There was no ineffective portion recognized in the unaudited interim consolidated statements of income for the periods ended June 30, 2017 and 2016.
The outstanding aggregate notional amount and the related cumulative mark-to-market gains and losses of the interest rate swaps designated as cash flow hedges as of June 30, 2017 and December 31, 2016 are as follows:
June 30, 2017
(Unaudited)
December 31, 2016
(Audited)Notional amount $70,560 $272,865Cumulative mark-to-market losses ₱- (₱715) Cumulative mark-to-market gains 32 50
The net movements in the fair value of interest rate swaps of FGPC and FGP are as follows:
June 30, 2017
(Unaudited)
December 31, 2016
(Audited)
Fair value at beginning of period (₱665) (₱1,013)Fair value changes taken into equity during the period (100) (52) Fair value changes realized during the period 797 438Foreign exchange differences - (38) Fair value at end of period 32 (665) Deferred tax effect on cash flow hedges (10) 200Fair value deferred into equity ₱22 (₱465)
Fair value changes during the period, net of deferred income tax, are recorded in the unaudited interim consolidated statements of comprehensive income and under the “Cumulative translation adjustments” account in the unaudited interim consolidated statements of financial position. The fair value changes realized during the period was taken into “Finance costs” account in the unaudited interim consolidated statements of income. This pertains to the net difference between the fixed interest paid/accrued and the floating interest received/accrued on the interest rate swap agreements as at financial reporting date.
67

For the six months ended June 30, 2017 and 2016, fair value changes taken to the unaudited interim consolidated statements of income amounted to ₱808.5 million ($16.0 million) and ₱257.4 million ($5.1 million), respectively.
Cross Currency Swaps - EDC In 2014 and 2012, EDC entered into 6 and an additional 6 non-deliverable cross-currency swap (NDCCS) agreements with an aggregate notional amount of ₱2,907 million ($65.0 million) and ₱1,998 million ($45.0 million), respectively, to partially hedge the foreign currency and interest rate risks on its Refinanced Syndicated Term Loan that is benchmarked against U.S. LIBOR and with flexible interest reset feature that allows EDC to select what interest reset frequency to apply (i.e., monthly, quarterly, or semi-annually). As it is EDC’s intention to reprice the interest rate on the hedged loan quarterly, EDC utilizes NDCCS with quarterly interest payments and receipts.
Under the NDCCS agreements, EDC receives floating US$ interest based on 3-month US LIBOR plus 175 basis points and pays fixed peso interest. On specified dates, EDC also receives specified U.S. dollar amounts in exchange for specified peso amounts based on the agreed swap rates. These U.S. dollar receipts correspond with the expected interest and fixed principal amounts due on the hedged loan. Effectively, the 12 NDCCS converted 62.86% of the hedged loan into a fixed rate peso loan.
Pertinent details of the NDCCS are as follows:
Notional amount
(in millions)
Trade Date
Effective Date
Maturity Date Swap rate Fixed rate
Variable rate
$15.00 03/26/12 03/27/12 06/17/17 ₱43.05 4.87% 3-month LIBOR + 175 bps
$10.00 04/18/12 06/27/12 06/17/17 42.60 4.92% - do - $10.00 05/03/12 06/27/12 06/17/17 42.10 4.76% - do - $10.00 06/15/12 06/27/12 06/17/17 42.10 4.73% - do - $10.00 07/17/12 09/27/12 06/17/17 41.25 4.58% - do - $10.00 10/29/12 12/27/12 06/17/17 41.19 3.44% - do - $7.50 05/14/14 06/27/14 06/17/17 43.60 3.80% - do - $7.50 05/14/14 06/27/14 06/17/17 43.57 3.80% - do - $7.50 06/09/14 06/27/14 06/17/17 43.55 3.60% - do - $7.50 06/09/14 06/27/14 06/17/17 43.55 3.60% - do - $7.50 07/10/14 9/27/14 06/17/17 43.29 3.50% - do - $7.50 07/09/14 9/27/14 06/17/17 43.37 3.68% - do -
The maturity date of the 12 NDCCS coincides with the maturity date of the hedged loan. As of June 30, 2017, all NDCCS were settled.
As of June 30, 2017 and December 31, 2016, the outstanding aggregate notional amount of EDC’s NDCCS amounted to nil and ₱3,501 million ($75.0 million), respectively. The aggregate fair value changes on these NDCCS amounting to nil and ₱14 million ($0.3 million) gain, were recognized under “Cumulative translation adjustments” account in the unaudited interim consolidated statements of financial position as of June 30, 2017 and December 31, 2016, respectively.
68
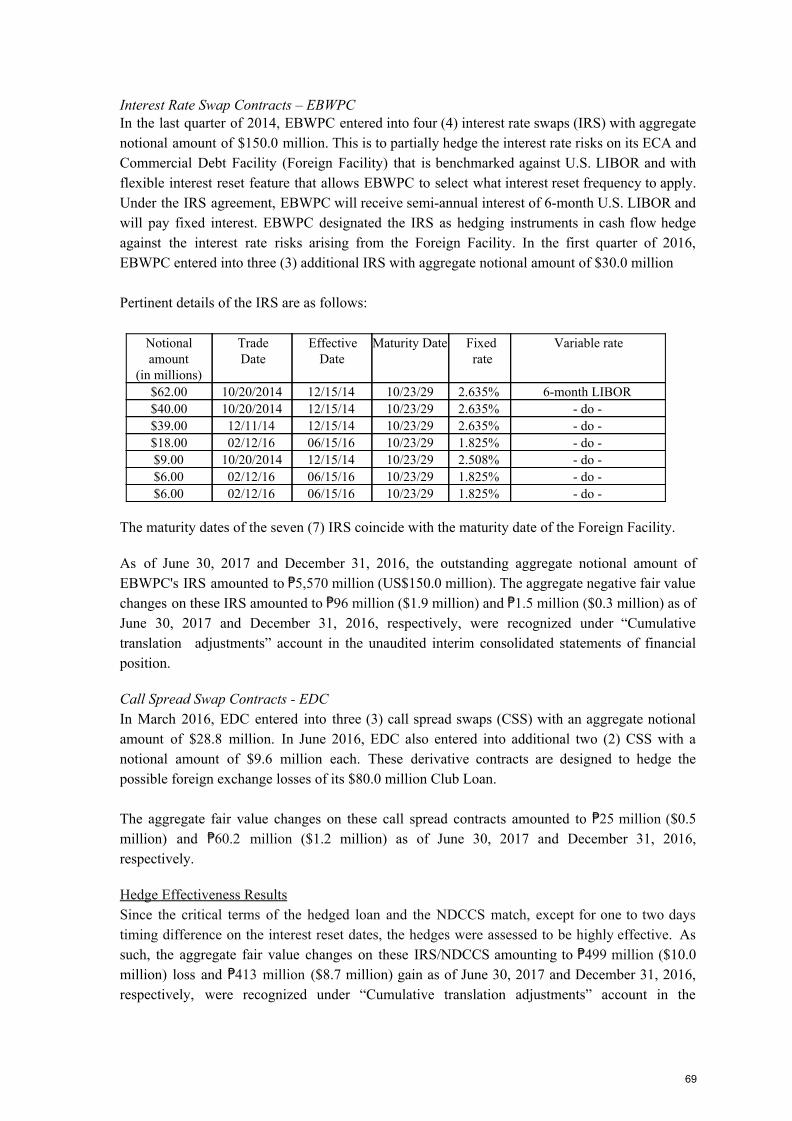
Interest Rate Swap Contracts – EBWPC In the last quarter of 2014, EBWPC entered into four (4) interest rate swaps (IRS) with aggregate notional amount of $150.0 million. This is to partially hedge the interest rate risks on its ECA and Commercial Debt Facility (Foreign Facility) that is benchmarked against U.S. LIBOR and with flexible interest reset feature that allows EBWPC to select what interest reset frequency to apply. Under the IRS agreement, EBWPC will receive semi-annual interest of 6-month U.S. LIBOR and will pay fixed interest. EBWPC designated the IRS as hedging instruments in cash flow hedge against the interest rate risks arising from the Foreign Facility. In the first quarter of 2016, EBWPC entered into three (3) additional IRS with aggregate notional amount of $30.0 million Pertinent details of the IRS are as follows:
Notional amount
(in millions)
Trade Date
Effective Date
Maturity Date Fixed rate
Variable rate
$62.00 10/20/2014 12/15/14 10/23/29 2.635% 6-month LIBOR $40.00 10/20/2014 12/15/14 10/23/29 2.635% - do - $39.00 12/11/14 12/15/14 10/23/29 2.635% - do - $18.00 02/12/16 06/15/16 10/23/29 1.825% - do - $9.00 10/20/2014 12/15/14 10/23/29 2.508% - do - $6.00 02/12/16 06/15/16 10/23/29 1.825% - do - $6.00 02/12/16 06/15/16 10/23/29 1.825% - do -
The maturity dates of the seven (7) IRS coincide with the maturity date of the Foreign Facility.
As of June 30, 2017 and December 31, 2016, the outstanding aggregate notional amount of EBWPC's IRS amounted to ₱5,570 million (US$150.0 million). The aggregate negative fair value changes on these IRS amounted to ₱96 million ($1.9 million) and ₱1.5 million ($0.3 million) as of June 30, 2017 and December 31, 2016, respectively, were recognized under “Cumulative translation adjustments” account in the unaudited interim consolidated statements of financial position.
Call Spread Swap Contracts - EDC In March 2016, EDC entered into three (3) call spread swaps (CSS) with an aggregate notional amount of $28.8 million. In June 2016, EDC also entered into additional two (2) CSS with a notional amount of $9.6 million each. These derivative contracts are designed to hedge the possible foreign exchange losses of its $80.0 million Club Loan. The aggregate fair value changes on these call spread contracts amounted to ₱25 million ($0.5 million) and ₱60.2 million ($1.2 million) as of June 30, 2017 and December 31, 2016, respectively.
Hedge Effectiveness Results Since the critical terms of the hedged loan and the NDCCS match, except for one to two days timing difference on the interest reset dates, the hedges were assessed to be highly effective. As such, the aggregate fair value changes on these IRS/NDCCS amounting to ₱499 million ($10.0 million) loss and ₱413 million ($8.7 million) gain as of June 30, 2017 and December 31, 2016, respectively, were recognized under “Cumulative translation adjustments” account in the
69

unaudited interim consolidated statements of financial position. No ineffective portion was recognized in the unaudited interim consolidated statements of income for the six months ended June 30, 2017 and 2016.
As at June 30, 2017 and December 31, 2016, the net movement of changes made to “Cumulative translation adjustment” account for EDC’s cash flow hedges are as follows:
June 30, 2017
(Unaudited)
December 31, 2016
(Audited)Balances at beginning of period (₱25) (₱186) Fair value change taken into equity during the period (499) 413Fair value change realized during the period 394 (252) (130) (25) Deferred tax effect on cash flow hedges 7 11Balances at end of period (₱123) (₱14)
13. Event After the Financial Reporting Period
Rockwell Land Corporation On July 14, 2017, Rockwell Land has signed a Joint Venture agreement with Mitsui Fudosan Co., Ltd. ("Mitsui Fudosan") of Japan, to develop the residential component of its project in Quezon City called the Arton by Rockwell. Mitsui Fudosan will have a 20% equity stake in the Php 8.68 project. However, the consummation and implementation of the transaction shall be subject to the necessary regulatory approvals including the Philippine Competition Commission (PCC). The Mitsui Fudosan Group, is focused on developing, leasing, selling, and managing a diverse portfolio in various asset categories including retail, office, residence, hotel, and logistics. With overseas business as one of its growth areas, it currently has residential projects in the US, UK, Taiwan, China, Malaysia, Singapore, Thailand, and Indonesia and is still expanding its development projects in Asia. FGEN On August 3, 2017 First Gen Corporation (“First Gen”) entered into an Implementation Agreement with Philippines Renewable Energy Holdings Corporation (“PREHC”) and First Gen’s wholly-owned subsidiaries, Red Vulcan Holdings Corporation (“Red Vulcan”) and Northern Terracotta Power Corp. (“NTPC”). Under the Implementation Agreement, PREHC will conduct a voluntary tender offer for a minimum of 6.6 billion common shares and up to a maximum of 8.9 billion common shares of Energy Development Corporation (“EDC”) (representing approximately up to 31.7% of the total outstanding voting shares of EDC) from the shareholders of EDC, at a price of ₱7.25 per share. First Gen and NTPC, which own approximately 992 million and 986 million common shares,
70
respectively, will tender their shares to PREHC, subject to scale-back provisions under applicable regulations. Red Vulcan will not participate in the tender offer process and will retain its existing common shares and voting preferred shares, which correspond to a 60.0% voting stake in EDC. EDC On July 6, 2017, EDC’s power plants in Leyte Geothermal Project tripped following the magnitude 6.5 earthquake. As of August 11, 2017, EDC is still assessing the full extent of the damage. On August 3, 2017, EDC received a notice from PREHC that it filed a Tender Offer Report with the Philippine SEC launching a voluntary tender offer to acquire a minimum of 6.6 billion common shares up to a maximum of 8.9 billion common shares, representing up to 31.7% of the total outstanding voting shares of EDC at a price of ₱7.25 per share, a premium of 22.3% over the 30-day volume weighted average price.
71