Embed Size (px)
Citation preview
Course # SOSC 1750 9.0 Course # SOSC 1750 9.0 Urban Economies: Comparing Canada & the Third Urban Economies: Comparing Canada & the Third
WorldWorld
Comparing:Comparing:
1.1. Developing Countries (e.g.)Developing Countries (e.g.)India (S. Asia)India (S. Asia)Mexico (Latin America)Mexico (Latin America)
2.2. Advanced Industrial CountriesAdvanced Industrial CountriesCanadaCanada
Lecture: Mondays 12.30–2.30: TEL 1016• Attendance
• Ten-minute break
• Appointments
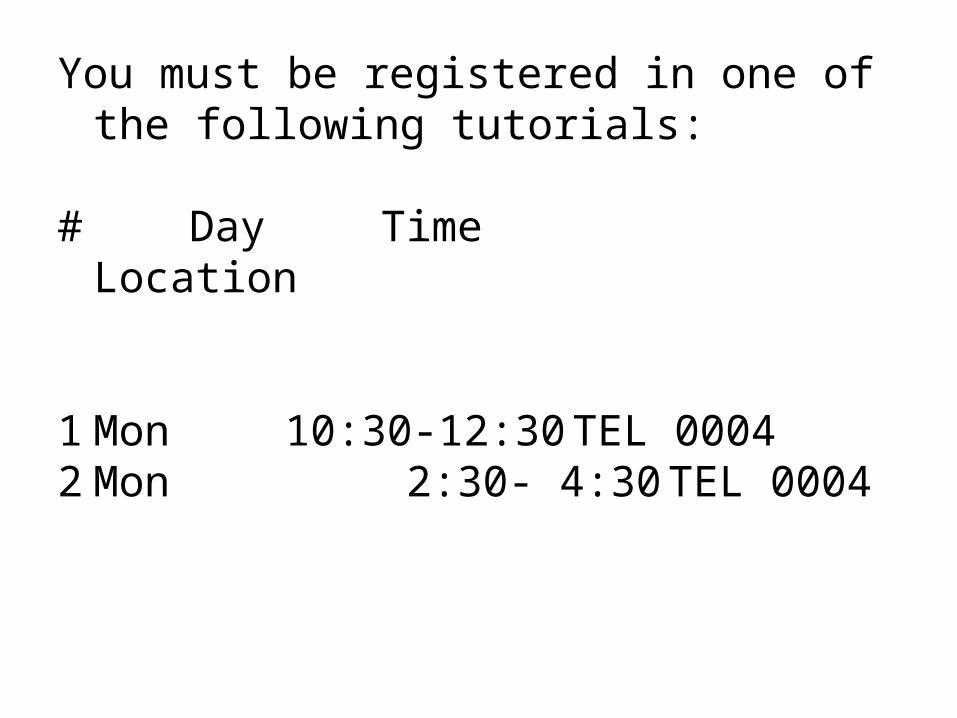
You must be registered in one of the following tutorials:
# Day Time Location
1 Mon 10:30-12:30 TEL 00042 Mon 2:30- 4:30 TEL 0004
Tutorial requirements:
• Attendance
• Preparation
• Participation
• Appointments
Assignments: Term I
I. Mid-term tests
in Lecture hall TEL 0004
weight
1. Mon. Oct 20 MCQ on ‘The End of Poverty’ (DVD) & Youtube videos on Poverty
10%2. Mon. Nov 24 Quiz on lectures & Term 1 readings
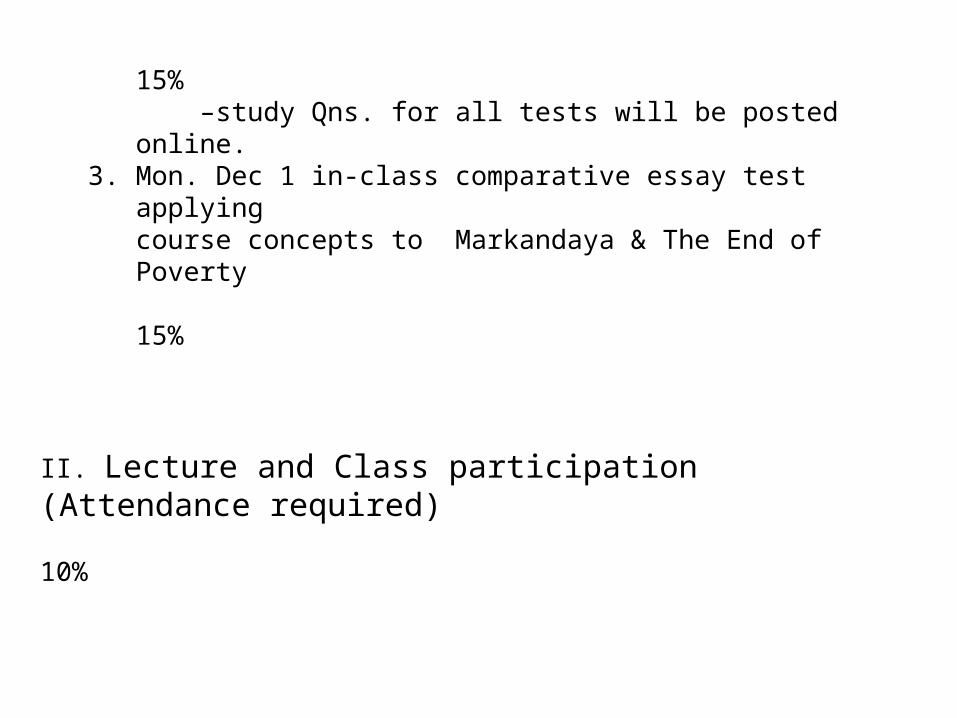
15% –study Qns. for all tests will be posted online.
3. Mon. Dec 1 in-class comparative essay test applying course concepts to Markandaya & The End of Poverty
15%
II. Lecture and Class participation (Attendance required)
10%
Mid-term Total
50%
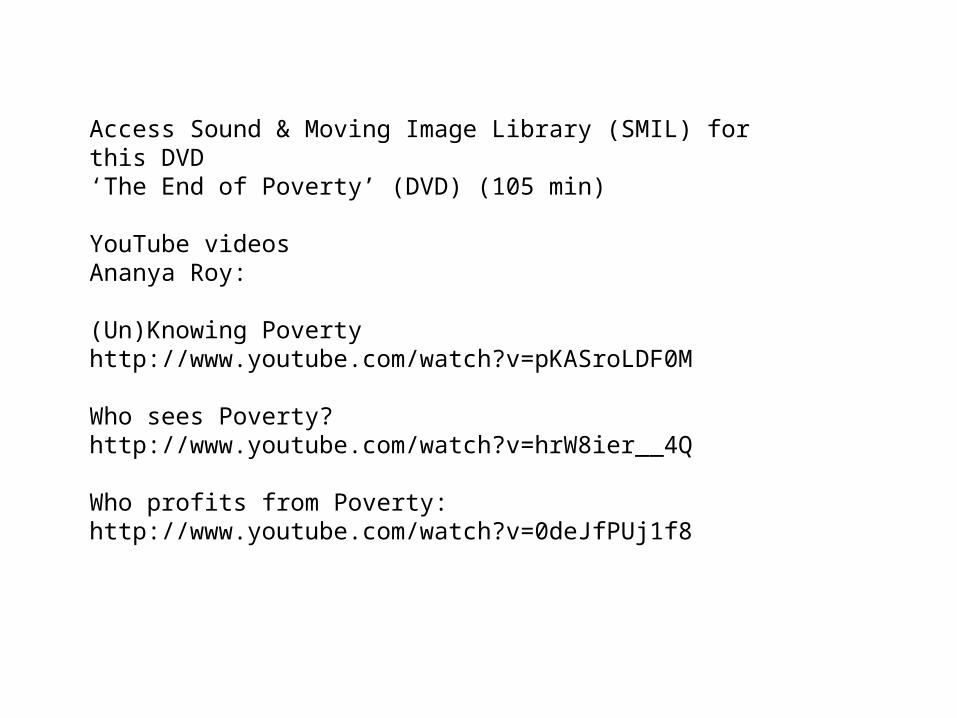
Access Sound & Moving Image Library (SMIL) for this DVD‘The End of Poverty’ (DVD) (105 min)
YouTube videosAnanya Roy:
(Un)Knowing Povertyhttp://www.youtube.com/watch?v=pKASroLDF0M
Who sees Poverty?http://www.youtube.com/watch?v=hrW8ier__4Q
Who profits from Poverty: http://www.youtube.com/watch?v=0deJfPUj1f8
Term I Required readings:Markandaya, Kamala. (1954). Nectar in a Sieve. New York: Signet.
Cinema Libre Studio (2010). The End of Poverty? Think Again.
A Course Kit 2014-15 (available for purchase in York U Book Store)Priced $26
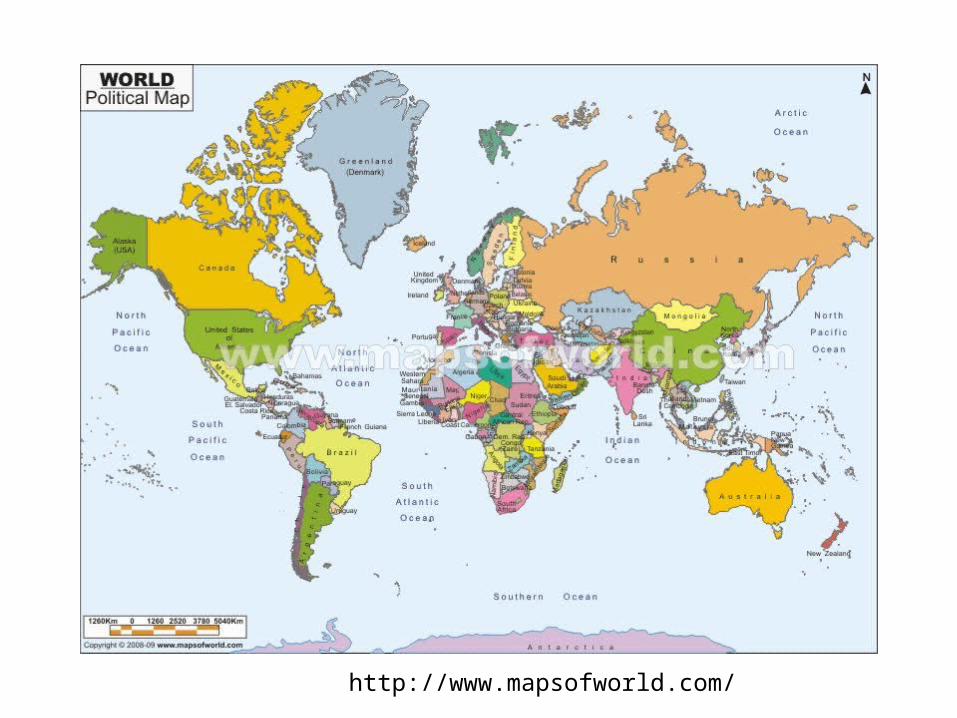
http://www.mapsofworld.com/
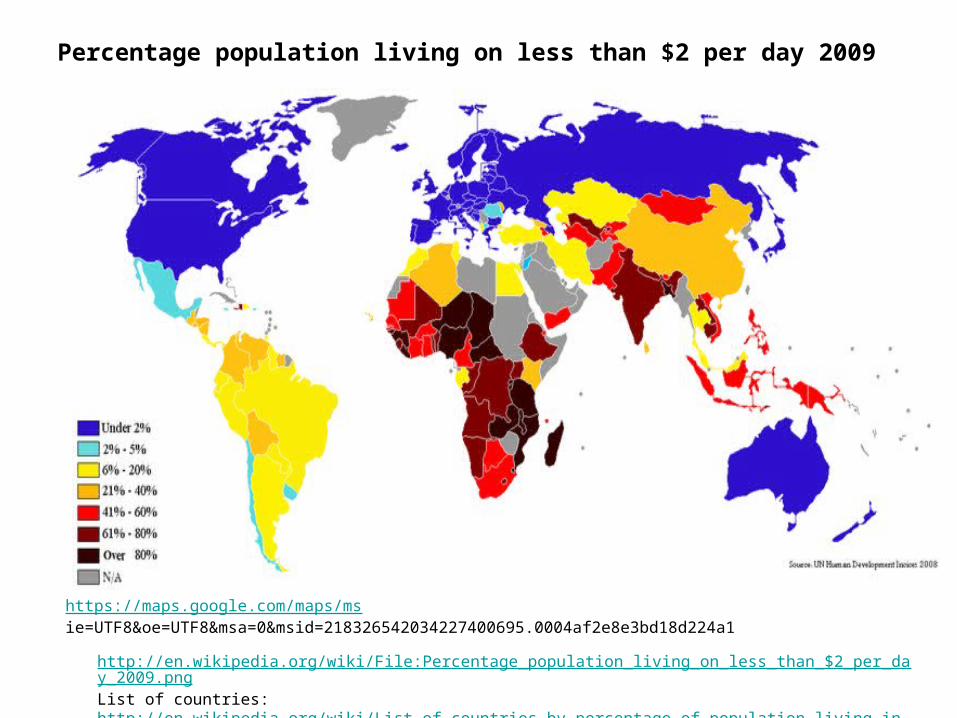
Percentage population living on less than $2 per day 2009
http://en.wikipedia.org/wiki/File:Percentage_population_living_on_less_than_$2_per_day_2009.pngList of countries: http://en.wikipedia.org/wiki/List_of_countries_by_percentage_of_population_living_in_poverty
https://maps.google.com/maps/ms ie=UTF8&oe=UTF8&msa=0&msid=218326542034227400695.0004af2e8e3bd18d224a1
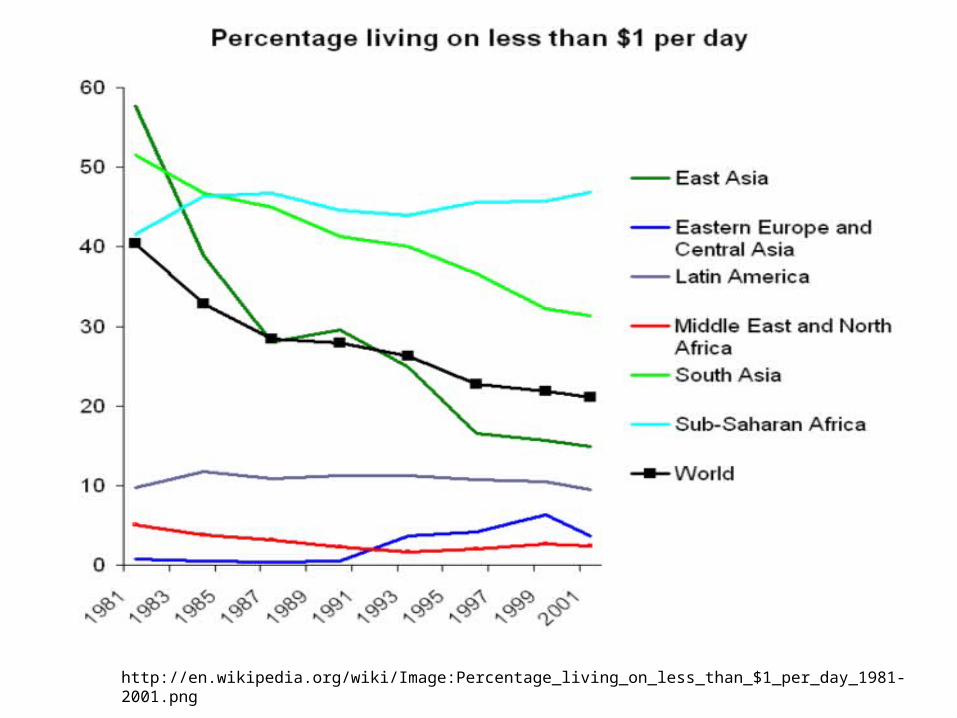
http://en.wikipedia.org/wiki/Image:Percentage_living_on_less_than_$1_per_day_1981-2001.png
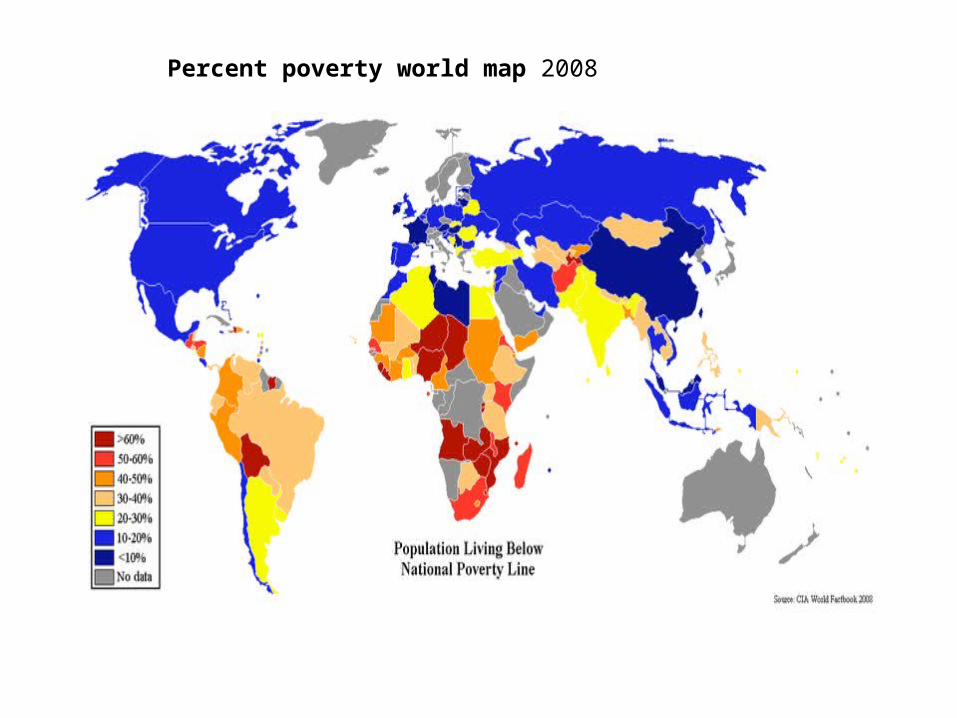
Percent poverty world map 2008
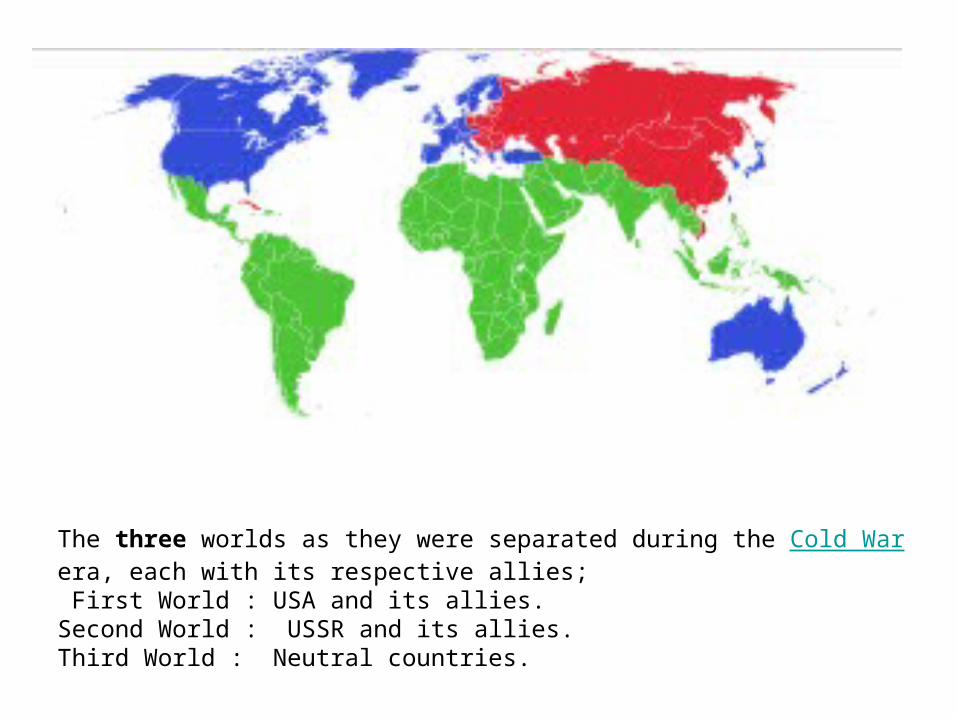
The three worlds as they were separated during the Cold War era, each with its respective allies; First World : USA and its allies. Second World : USSR and its allies. Third World : Neutral countries.
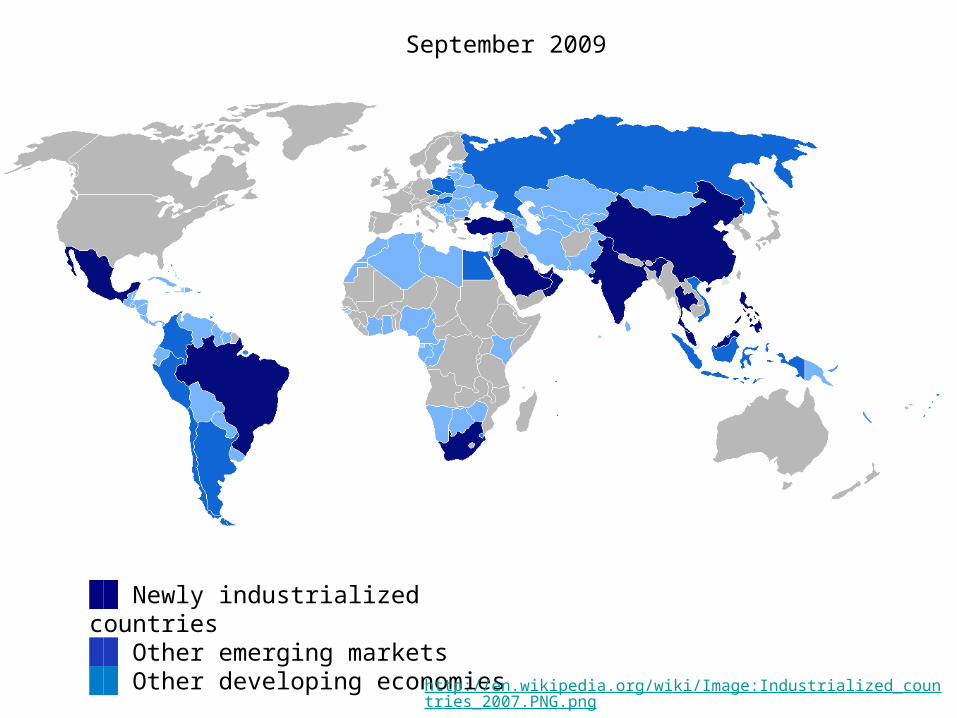
██ Newly industrialized countries██ Other emerging markets██ Other developing economies
September 2009
http://en.wikipedia.org/wiki/Image:Industrialized_countries_2007.PNG.png
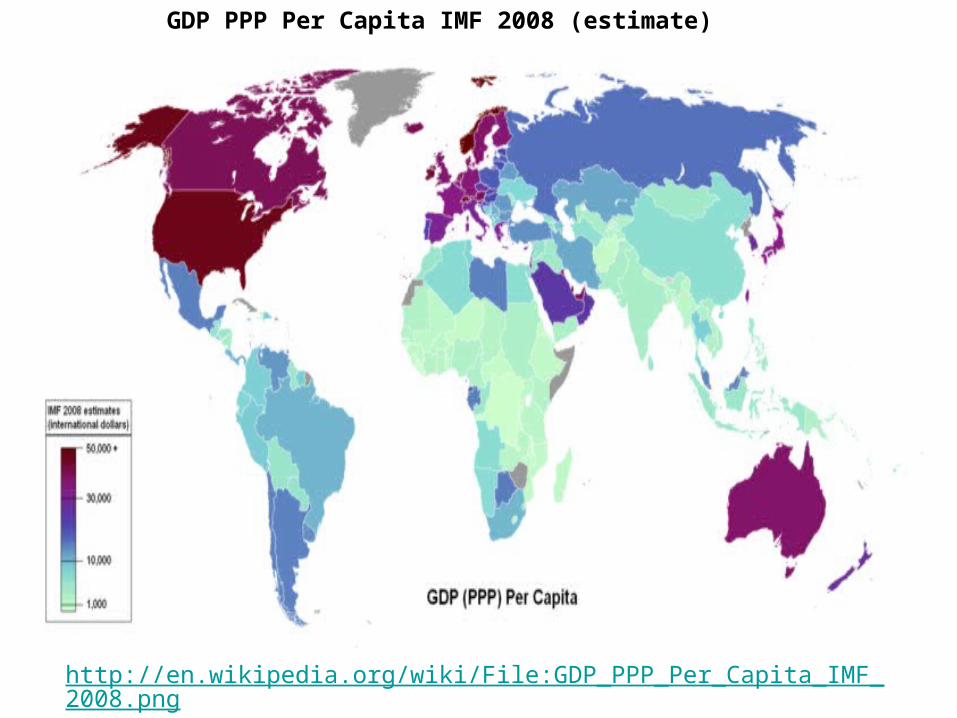
GDP PPP Per Capita IMF 2008 (estimate)
http://en.wikipedia.org/wiki/File:GDP_PPP_Per_Capita_IMF_2008.png
Which countries have lowest/highest national inequality?
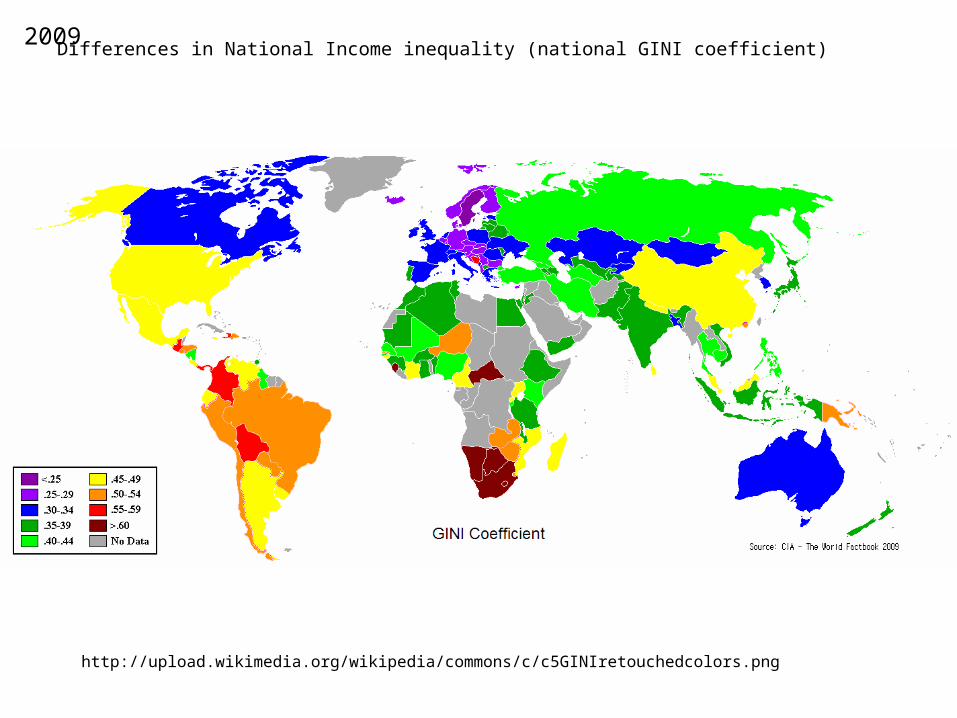
2009
0 is perfect equality & 1 is perfect inequality
http://upload.wikimedia.org/wikipedia/commons/c/c5GINIretouchedcolors.png
Differences in National Income inequality (national GINI coefficient)
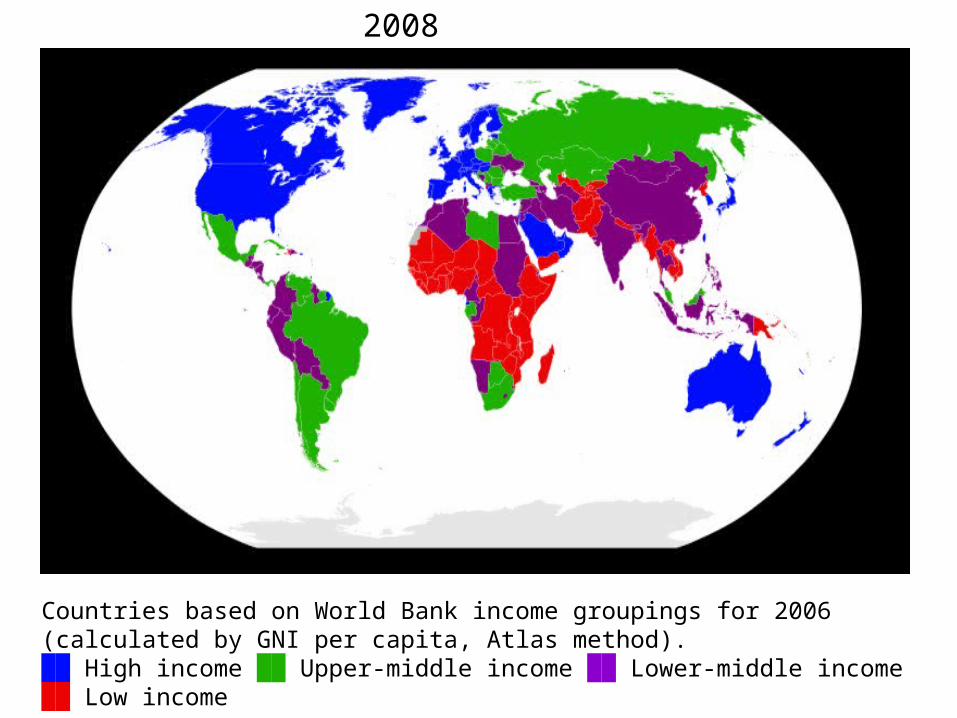
Countries based on World Bank income groupings for 2006 (calculated by GNI per capita, Atlas method).██ High income ██ Upper-middle income ██ Lower-middle income ██ Low income
2008
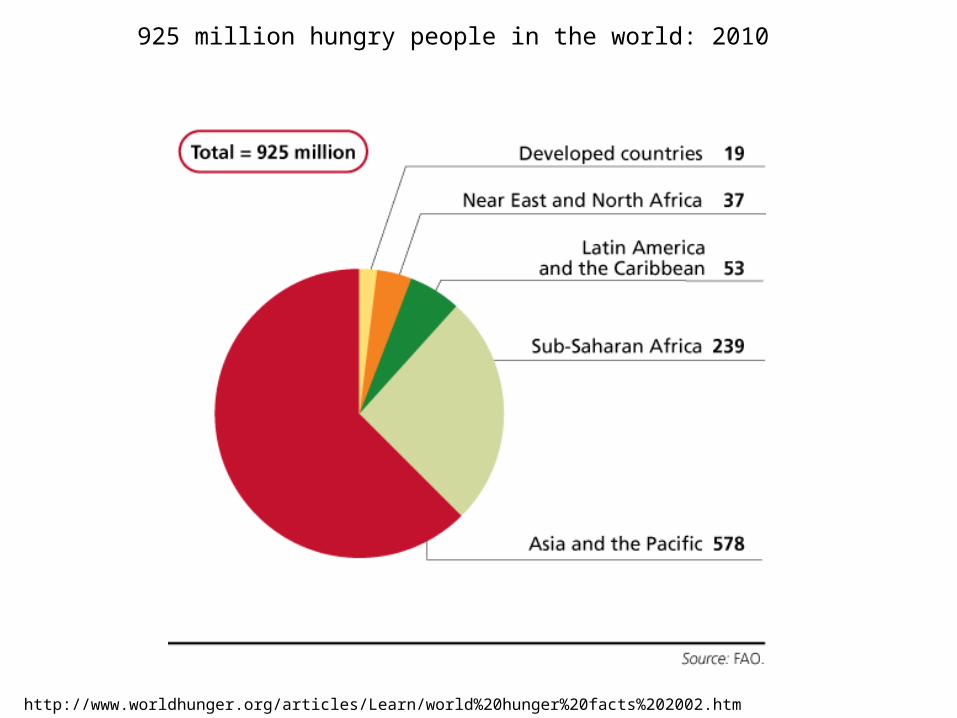
http://www.worldhunger.org/articles/Learn/world%20hunger%20facts%202002.htm
925 million hungry people in the world: 2010
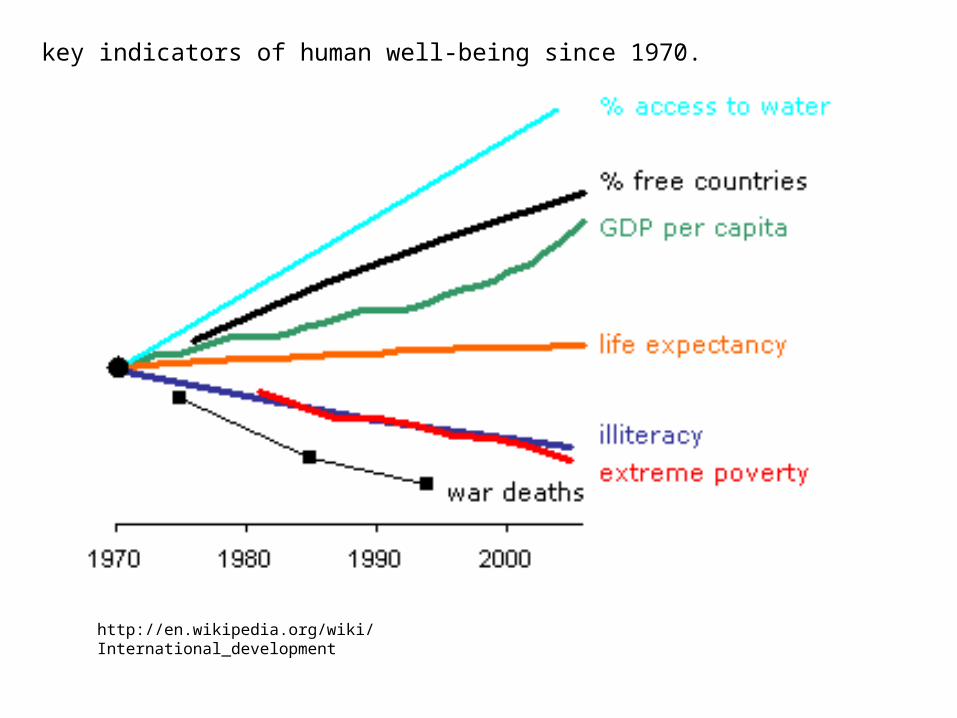
http://en.wikipedia.org/wiki/International_development
key indicators of human well-being since 1970.
What are the characteristics of the Third World?
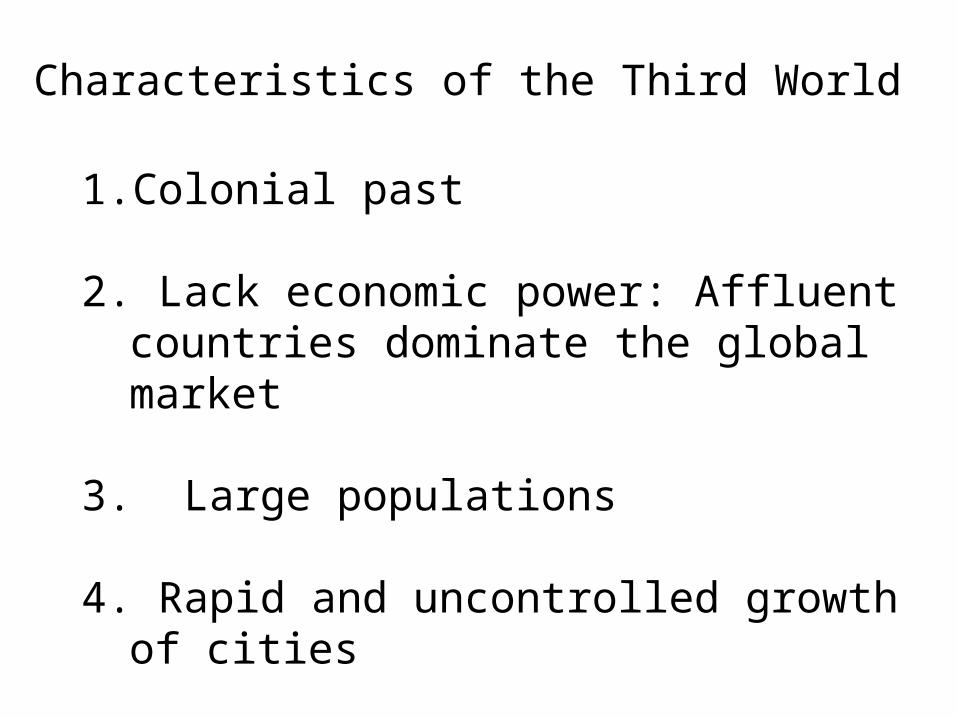
Characteristics of the Third World
1. Colonial past
2. Lack economic power: Affluent countries dominate the global market
3. Large populations
4. Rapid and uncontrolled growth of cities
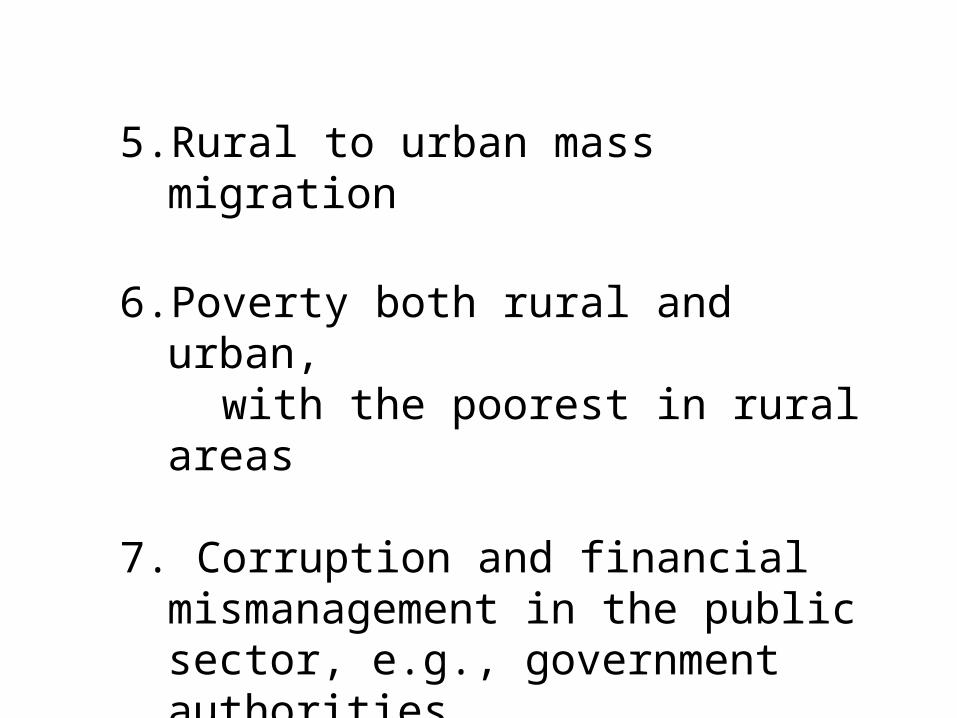
5. Rural to urban mass migration
6. Poverty both rural and urban, with the poorest in rural areas
7. Corruption and financial mismanagement in the public sector, e.g., government authorities