Embed Size (px)
Citation preview

Country profile – Ethiopia
Version 2016

Recommended citation: FAO. 2016. AQUASTAT Country Profile – Ethiopia.
Food and Agriculture Organization of the United Nations (FAO). Rome, Italy
The designations employed and the presentation of material in this information product do not imply the expression of any opinion whatsoever on the part of the Food and Agriculture Organization of the United Nations (FAO) concerning the legal or development status of any country, territory, city or area or of its authorities, or concerning the delimitation of its frontiers or boundaries. The mention of specific companies or products of manufacturers, whether or not these have been patented, does not imply that these have been endorsed or recommended by FAO in preference to others of a similar nature that are not mentioned. The views expressed in this information product are those of the author(s) and do not necessarily reflect the views or policies of FAO. FAO encourages the use, reproduction and dissemination of material in this information product. Except where otherwise indicated, material may be copied, downloaded and printed for private study, research and teaching purposes, or for use in non-commercial products or services, provided that appropriate acknowledgement of FAO as the source and copyright holder is given and that FAO’s endorsement of users’ views, products or services is not implied in any way. All requests for translation and adaptation rights, and for resale and other commercial use rights should be made via www.fao.org/contact-us/licencerequest or addressed to [email protected]. FAO information products are available on the FAO website (www.fao.org/ publications) and can be purchased through [email protected]. © FAO 2016


1
Ethiopia
GEOGRAPHY, CLIMATE AND POPULATION
Geography
Ethiopia, with a total area of 1.1 million km2, lies in the northeastern part of the Horn of Africa. The
country is landlocked, sharing frontiers with Eritrea to the north and northeast, Djibouti to the east,
Somalia to the east and southeast, Kenya to the south, and South Sudan and Sudan to the west. Ethiopia’s
topographical diversity encompasses high mountains and flat-topped plateaux, surrounded by lowlands,
and dissected by deep gorges with rivers and rolling plains with altitudes ranging from 110 m below sea
level at the Denakil Depression in the northeast to over 4 600 m above sea level in the Simien Mountains
in the north. The Great East African Rift Valley divides the country.
It is estimated that 16 million ha is cultivated and 20 million ha are permanent pastures (Table 1). Water
bodies cover around 744 400 ha (IUCN, 2010), forest and woodland about 4 million ha and 29 million
ha respectively, while over 26 million ha are protected (EPA and UNEP, 2008).
TABLE 1 Basic statistics and population
Physical areas:
Area of the country 2013 110 430 000 ha
Agricultural land (permanent meadows and pasture + cultivated land) 2013 36 259 000 ha
As % of the total area of the country 2013 33 %
Permanent meadows and pasture 2013 20 000 000 ha
Cultivated area (arable land + area under permanent crops) 2013 16 259 000 ha
- As % of the total area of the country 2013 15 %
- Arable land (temp. crops + temp. fallow + temp. meadows) 2013 15 119 000 ha
- Area under permanent crops 2013 1 140 000 ha
Population:
Total population 2015 99 391 000 inhabitants
- Of which rural 2015 81 %
Population density 2015 90 inhabitants/km2
Economy and development:
Gross Domestic Product (GDP) (current US$) 2014 54 798 million US$/year
Value added in agriculture (% of GDP) 2014 42 %
GDP per capita 2014 551 US$/year
Human Development Index (highest = 1) 2014 0.442 -
Gender Inequality Index (equality = 0, inequality = 1) 2014 0.558 -
Access to improved drinking water sources:
Total population 2015 57.3 %
Urban population 2015 93.1 %
Rural population 2015 48.6 %
2 Irrigation in Africa in figures - AQUASTAT Survey - 2016
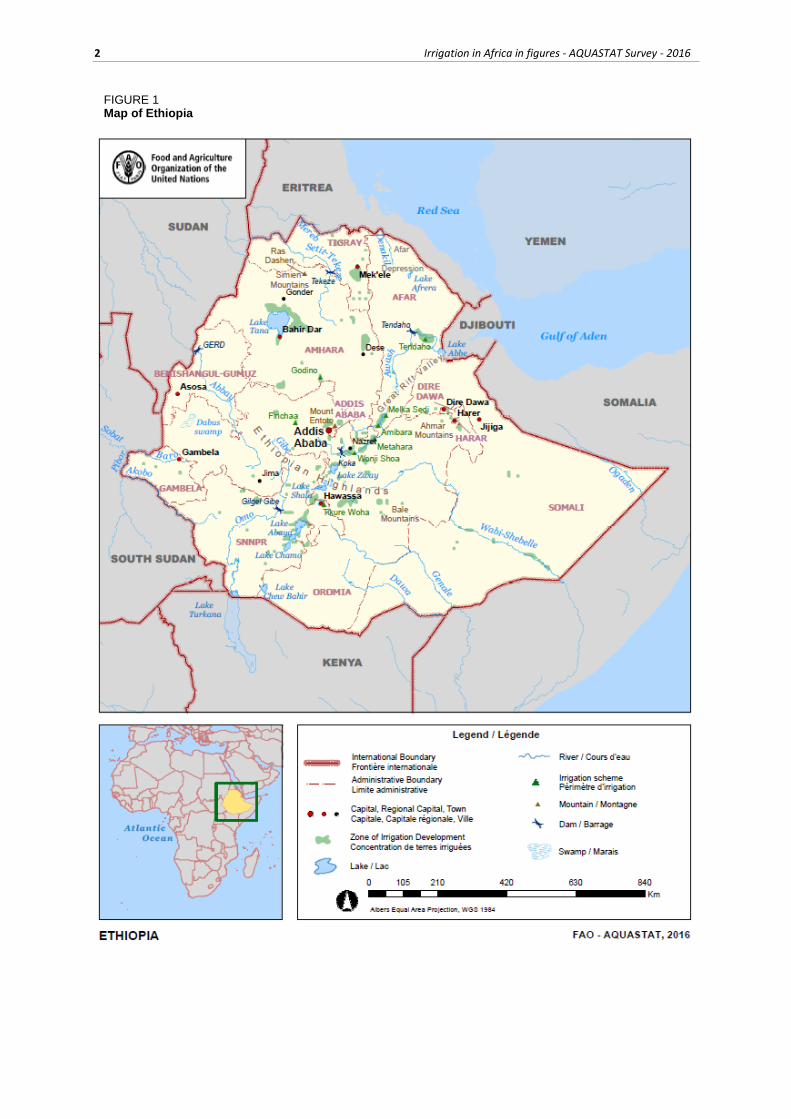
FIGURE 1 Map of Ethiopia

Ethiopia 3
Climate
Ethiopia has a tropical monsoon climate with wide topographic-induced variation. Three climatic zones
can be distinguished: a cool zone consisting of the central parts of the western and eastern section of the
high plateaus, a temperate zone between 1 500 m and 2 400 m above sea level, and the hot lowlands
below 1 500 m. Mean annual temperature varies from less than 7-12ºC in the cool zone to over 25ºC in
the hot lowlands. Mean annual potential evapotranspiration varies between 1 700-2 600 mm in arid and
semi-arid areas and 1 600-2 100 mm in dry sub-humid areas. Average annual rainfall for the country is
848 mm due to its proximity to the equator and high altitude, varying from about 2 000 mm in some
pocket areas in southwest Ethiopia to less than 100 mm in the Afar Lowlands in the northeast. Rainfall
in Ethiopia is highly erratic, resulting in a very high risk of intra-seasonal dry spells and annual droughts,
of which the 1973-74, 1983-84, 1987-88, 1990-91, 1993-94 and 2015-16 are the major ones in the last
decades. The drought in 2015-16 is even considered to be the worst drought for over 30 years.
Considering the water balance and the length of the growing period, Ethiopia can be divided into three
major agroclimatic zones:
Areas without a significant growing period, with little or no rainfall (eastern, northeastern,
southeastern, southern and northern lowlands);
Areas with a single growing period and one rainy season from February/March to
October/November, covering the western half of the country, with the duration of the wet period
decreasing from south to north;
Areas with a double growing period and two rainy seasons (Meher and Belg) which are of two
types: i) in the east of the country: there are a small rainfall peak in April and a major one in
August; ii) most of the lowlands of the south and southeast have two distinct wet periods,
February-April and June-September, interrupted by two clear-cut dry periods. The peak rainfall
months are April and September.
Population
The total population of the country is estimated at 99 million (2015), of which 81 percent is rural
(Table 1). The annual population growth rate is 2.6 percent over the period 2005-2015 and the average
population density is 90 inhabitants/km², but varies from 7 inhabitants per km2 in Afar in the northeast
to 114 inhabitants per km2 in Southern Region in the southwest of the country. The urban population is
growing rapidly as a result of both population increase and high rural-urban migration.
In 2014, the Human Development Index ranks Ethiopia 174 among 188 countries and the Gender
Inequality Index ranks it 129 among 152 countries for which data are available. Life expectancy in
Ethiopia is 64 years and the under-five mortality is 62 per 1000 births in 2014, both progressing from
51 years and over 150 per 1000 at the end of the 1990s. Around 80 percent of the children in 2010 are
enrolled in primary education, thus almost doubling the 2000 rate, and with a reduced gap between boys
(82 percent) and girls (78 percent) compared to that period (50 percent of boys against 39 percent of
girls). Adult literacy is 39 percent for the 2005-2012 period (UNDP, 2016), with a gap between female
literacy (29 percent) and male literacy (49 percent). Poverty is still widely spread as it concerns almost
a third of the population (30 percent) and is more concentrated in rural areas. In 2015, 93 percent of the
urban and 49 percent of the rural population were using improved drinking water sources, that is 57
percent of the total population This represents a major improvement since 2002 when only 33 percent
of the population had access to an improved drinking water source (JMP, 2015). Sanitation coverage
also increased from 10 percent in 2001 to 28 percent in 2015 and almost no difference in coverage
between rural and urban areas.

4 Irrigation in Africa in figures - AQUASTAT Survey - 2016
ECONOMY, AGRICULTURE AND FOOD SECURITY
The Ethiopian economy is mostly based on agriculture, with industry and services slightly increasing
recently. The country’s Gross Domestic Product (GDP) is US$54 798 million in 2014 with an annual
growth of around 10 percent since 2004, placing Ethiopia among the fastest growing non-oil producing
economies in Africa. Agriculture accounts for 42 percent of GDP in 2014 and about 85 percent of
exports earnings in 2010. It also employs 83 percent of the active population (MoA, 2011). Agriculture
is primarily rainfed and thus highly dependent on rainfall. Smallholders dominate the sector and the land
holding is increasingly fragmented. In 2015, there were 15.6 million agricultural households with an
average farm size of 0.95 ha (CSA, 2015). It however benefits from a liberalized economy since the
1990s. The Ethiopian livestock is also significant with over 50 million cattle, 50 million poultry, 20
million sheep and 20 million goats in 2015 (CSA, 2015).
The main agricultural exports are coffee, oil seeds, cereals, cotton, sugarcane, khat, spices, natural gum,
incense and cut flowers among others. Coffee is the largest export commodity responsible for a third of
the agricultural exports earnings. Ethiopia is the largest African coffee producer and the country where
coffee is believed to have been discovered in the eponym Kaffa region. Wheat, palm oil and raw sugar
are the main agricultural imports of the country.
The following five main agricultural production systems can be distinguished in the country:
The highland mixed farming system (1 500 m above sea level) is practiced in most regions of
the south and southwest with prolonged humid periods
The lowland mixed agricultural production system (below 1 500 m) is practiced in low-lying
plains, valleys and mountain foothills, which include the northern parts of the Awash and the
rift valley
The pastoral complex supports the livelihood of only 10 percent of the total population living
in the Afar and Somali regions and the Borena zone
Shifting cultivation is practiced in the southern and western part of the country
Commercial agriculture is a farming system that has only emerged very recently
Food insecurity, as a result of frequent drought among other reasons, is very high. The prevalence of
undernourishment is still significant with 35 percent in 2014, but improved a lot falling from 55 percent
in 2002 (FAO, 2015). About 10 percent of the households are considered food insecure and partly rely
on food aid even without dry spell (ODI, 2015).
WATER RESOURCES
Ethiopia is endowed with a substantial amount of water resources but very high hydrological variability.
The surface water resource potential is impressive, but little developed. The country possesses twelve
major river basins, which form four major drainage systems (Table 2):
The Nile basin (including Abbay or Blue Nile, Baro-Akobo, Setit-Tekeze/Atbara and Mereb)
covers 33 percent of the country and drains the northern and central parts westwards;
The Rift Valley (including Awash, Denakil, Omo-Gibe and Central Lakes) covers 28 percent
of the country and consists of a group of independent interior basins extending from Djibouti
in the north to the United Republic of Tanzania in the south, with nearly half of its total area
being located in Ethiopia;
The Shebelli-Juba basin (including Wabi-Shebelle and Genale-Dawa) covers 33 percent of the
country and drains the southeastern mountains towards Somalia and the Indian Ocean;
The North-East Coast (including the Ogaden and Gulf of Aden basins) covers 6 percent of the
country.

Ethiopia 5
All river basins except the Nile basin face water shortages (EU, 2011). Most of the rivers in Ethiopia
are seasonal and there are almost no perennial rivers below 1 500 m altitude. About 70 percent of the
total runoff takes place during the period June-September. Dry season flow originates from springs
which provide base flows for small-scale irrigation.
Table 2 presents the internal runoff in each basin. Due to evaporative losses, not all flow reaches
adjoining countries. For example, out of the 17 960 million m3/year of the Omo-Gibe in the Rift valley
only 10 000 million m3/year arrive at the border with Kenya. Also, out of the 23 600 million m3/year of
the Baro-Akobo in the Nile basin, only 13 000 million m3/year are seen at the border with South Sudan.
TABLE 2 Area and annual runoff by river basin (Source: EPA and UNEP, 2008)
Major drainage system
River basin Area (ha) As % of total
area Annual runoff (million m3/yr)
As % of total runoff
Nile Basin 36 881 200 32.4 84 550 69 Abbay (Blue Nile) 19 981 200 17.6 52 600 42.9 Baro-Akobo 7 410 000 6.5 23 600 19.3 Setit-Tekeze/Atbara 8 900 000 7.8 7 630 6.2 Mereb 570 000 0.5 260 0.6
Rift Valley 31 764 000 27.9 29 020 23.7 Awash 11 270 000 9.9 4 600 3.7 Afar-Denakil 7 400 000 6.5 860 0.7 Omo-Gibe 7 820 000 6.9 17 960 14.7 Central Lake 5 274 000 4.6 5 600 4.6
Shebelli-Juba 37 126 400 32.7 8 950 7.3 Wabi-Shebelle 20 021 400 17.6 3 150 2.6 Genale-Dawa 17 105 000 15.1 5 800 4.7
North-East Coast 7 930 000 7 0 0 Ogaden 7 710 000 6.8 0 0 Golf of Aden/Aysha 220 000 0.2 0 0
TOTAL 113 681 600 100 122 000 100
Note: The areas are estimated and the total area is slightly different from the total area of the country, which is 110 430 000 ha. This last figure should be considered as being the correct one nationally.
Intense rainfall sometimes causes flooding particularly along the Awash river and in the lower Baro-
Akobo and Wabe-Shebelle river basins, causing damage to standing crops and infrastructures. The
construction of dykes mitigated the problem but has not provided a long-lasting solution.
Ethiopia has 11 freshwater lakes and 9 saline lakes, 4 crater lakes as well as over 12 major wetland
areas. Most of the largest lakes are found in the Rift Valley, except Lake Tana which is the source of
Abbay River in the Nile Basin. Most Rift Valley lakes have no surface water outlets, i.e. they are
endorheic, hence extremely saline. Lakes Langano, Abbaya and Chamo are freshwater lakes and not
endorheic, but because of diminishing outflow, they are becoming increasingly saline. Most of the lakes
are rich in fish. Lakes Shala and Abiyata have naturally high concentrations of chemicals and a soda ash
operation is located on the shore of the latter for the production of sodium carbonate (IWMI, 2007). The
total area of wetlands in Ethiopia is estimated between 1.4 and 1.8 million ha (EPA, 2003; IUCN, 2010).
Floodplains are mostly found in the north-western and western highlands, the Rift Valley and the eastern
highlands but some are also located in lowlands.
The groundwater potential of the country is not known with any certainty, but so far only a small fraction
of the groundwater has been developed. It is however more easily available than surface water in the
arid areas and supplies about 80 percent of the existing drinking water sources (EPA and UNEP, 2008).
Traditional wells are widely used by nomads.
Internal renewable surface water resources are estimated at 120 000 million m³/year and renewable
groundwater resources at around 20 000 million m³/year, but 18 000 million m³/year is considered to be
overlap between surface water and groundwater, which gives a value of total internal renewable water
resources (IRWR) of 122 000 million m³/year (Table 2). External water resources are null and the
surface water leaving the country is estimated at 96 500 million m³/year, of which:

6 Irrigation in Africa in figures - AQUASTAT Survey - 2016
64 600 million m3/year flow into Sudan through the Blue Nile and its tributaries (52 600 million
m³/year), the Atbara rive (4 370 million m³) and the Setit-Tekeze river (7 630 million m³/year);
13 000 million m³/year flow into South Sudan through the Baro and Akobo rivers forming the
Sobat river;
8 200 million m³/year flow into Somalia through the Genale and Dawa rivers forming the Juba
river (5 900 million m³/year) and the Shebelle river (2 300 million m³/year);
10 000 million m³/year flow into Kenya through the Omo river into Lake Turkana; and
700 million m³/year flow into Eritrea.
TABLE 3 Water resources
Renewable freshwater resources:
Precipitation (long-term average) - 848 mm/yr
- 936 400 million m3/yr
Internal renewable water resources (Long-term average) - 122 000 million m3/yr
Total renewable water resources - 122 000 million m3/yr
Dependency ratio - 0 %
Total renewable water resources per inhabitant 2015 1 227 m3/yr
Total dam capacity 2015 31 484 million m3
Ethiopia has many small, medium and large reservoir dams constructed for hydropower generation,
irrigation and drinking water supply. There are currently 12 hydropower plants cumulating a total
installed capacity of 1 945 MW (ODI, 2015). Micro-dams, i.e. dams with a water storage capacity of
less than 0.15 million m3, have been constructed for small-scale irrigation, especially around 1999 and
2000 in the Amhara and Tigray regional states. Total dam capacity was estimated at 6 540 million m3
in 2008, and increased tremendously in recent years to reach about 31 484 million m3 in 2015. The new
Tekeze dam, built on the eponym river in the Nile basin and completed in 2009, has a storage capacity
of 9 000 million m3 and thus largely exceeds the previous largest Koka dam (1 900 million m3). The
new Gilgel Gibe III dam, built on the Omo river, has a storage capacity of 14 000 million m3 and started
to generate electricity after its completion in 2015. It will soon be supplanted by the controversial Grand
Ethiopian Renaissance Dam (GERD) started in 2011 on the Abbay (Blue Nile) river close to the
Sudanese border mostly for hydropower generation. The GERD dam, expected to create a huge reservoir
of 79 000 million m3, is as of May 2016 almost 70 percent completed.
Desalinization is not practiced in Ethiopia, being a landlocked country, and treatment of wastewater is
still marginal. The lack of wastewater treatment is partly explained by the way wastewater is collected
since the major wastewater disposal system in Addis Ababa, but also in most large and medium cities
of the country, is by vacuum trucks. Only 7.5 percent of the collected wastewater is collected by the
sewerage system. The Kalitiy and Kotebe wastewater treatment plants are the only two in the capital.
The produced municipal wastewater in the 9 main cities–Addis Ababa, Dire Dawa, Hawassa, Mekelle,
Bahir dar, Adama,Gondar, Jimna ad Hara–is estimated in 2014 at 226 million m3, out of which only 0.8
million m3 is collected, mostly by trucks (MoWIE, 2015).
INTERNATIONAL WATER ISSUES
Ethiopia has seven transboundary rivers (Table 4), of which the Abbay river, part of the Nile basin, is
the most important (Table 2). These important run-off flows to surrounding countries make Ethiopia the
“Water Tower of East Africa”.

Ethiopia 7
TABLE 4 Transboundary rivers
River Total basin area (km2)
% of basin within Ethiopia
Sharing countries
Nile basin 3 112 369 12 Burundi, Democratic Republic of Congo, Egypt, Eritrea, Kenya, Rwanda, South Sudan, Sudan,
Uganda, United Republic of Tanzania,
Abbay Sudan
Baro-Akobo South Sudan
Tekeze Sudan
Mereb Eritrea
Rift Valley basin 637 593 49 Djibouti, Eritrea, Kenya, South Sudan,
Uganda, United Republic of Tanzania
Gibe-Omo Kenya
Shebelle-Juba basin 810 427 46 Kenya, Somalia
Shebelle Somalia
Genale-Dawa Kenya, Somalia
Ethiopia is a member of the Nile Basin Initiative (NBI), an inter-governmental partnership launched in
1999, together with ten other Nile riparian countries. Because both the 1929 and 1959 Nile Water
Agreement assigned the Nile's water to Egypt and Sudan without including Ethiopia and the other
riverside nations, the NBI was intended to strengthen the cooperation within the basin. The NBI, the
headquarters of which are in Entebbe, Uganda, prepared a Strategic Action Programme, which consists
of two sub-programmes: the Shared Vision Programme (SVP) and the Subsidiary Action Programme
(SAP). The SVP is to help create an enabling environment for action on the ground through building
trust and skill, while the SAP is aimed at the delivery of actual development projects involving two or
more countries. Projects are selected by individual riparian countries for implementation and submitted
to the Council of Ministers of the NBI for approval.
The NBI is intended to be a transitional institution until the Cooperative Framework Agreement (CFA)
negotiations are finalized and a permanent institution created. This new Nile CFA was signed in 2010
by Ethiopia and four other countries–Kenya, Rwanda, Uganda and United Republic of Tanzania–and in
2011 by Burundi. Egypt strongly opposed this agreement which gives deciding power over large-scale
hydraulic projects to a commission representing all the signatories, hence cancelling Egypt's historical
right of veto. Pre-2011 Sudan, a traditional ally of Egypt, initially also rejected the agreement, but the
new Sudan is now considering its signature due to increasing awareness of the unequal sharing and also
hoping for benefits, in particular from the Ethiopian Renaissance dam, expected to be completed in
2017. Due to its proximity to the Sudanese border, the dam could provide water for vast areas of irrigable
land in Sudan, as well as mitigate floods in the agricultural El-Gezira region and greater Khartoum. The
Democratic Republic of the Congo is also still to decide upon the CFA signature, as well as South Sudan,
moreover so since the water contribution of the latter is considerable. The CFA was ratified by Ethiopia
and Rwanda in 2013 and by United Republic of Tanzania in 2015. Signature of all countries would help
organize a comprehensive management of the water resources between the basin countries and find an
agreed solution to multiple projects of dams on the Nile for hydroelectricity generation in Uganda (see
also the country profile for Uganda). Despite there is no progress yet on the CFA, Egypt, Sudan and
Ethiopia have signed in 2015 the Agreement on Declaration of Principles on the GERD, on which Egypt
and Sudan accept the GERD project and Ethiopia agreed on two studies on the impacts of the dam on
the two downstream countries.
The Genale, Dawa and Shebelle rivers are part of the larger Shebelle-Juba basin, of which almost half
lies within Ethiopia. No framework of cooperation between riparian countries exists for this basin.
The only significant transboundary lake is Lake Abbe, shared with Djibouti. It receives water mostly by
the Awash river.

8 Irrigation in Africa in figures - AQUASTAT Survey - 2016
Table 5 below summarizes the transboundary aquifers shared with other countries.
TABLE 5 Transboundary aquifers (Source: IGRAC, 2014)
Aquifer Total aquifer area (km2)
Sharing countries
Dawa 24 173 Kenya, Somalia Juba 34 587 Somalia Shebelle 30 985 Kenya, Somalia Sudd Basin 331 661 Kenya, South Sudan African Rift Valley Aquifer 46 856 Djibouti Mereb Aquifer 22 786 Eritrea Gedaref (Upper Nile Basin) 36 491 Sudan
WATER USE
Agriculture is by far the main water-withdrawing sector. Based on the total irrigated area, cropping
pattern and calendar, annual agricultural water withdrawal was estimated to be in the order of 5 200
million m3 in 2002, while municipal and industrial water withdrawals were estimated to be about 330
and 20 million m3 respectively (Table 4 and Figure 2). Agricultural water withdrawal in 2016 is
estimated at around 9 000 million m3. This figure, however, seems to be a low estimate considering both
the large increase in irrigated areas and the changing pattern in irrigated crops. The huge livestock
population withdraws an estimated 687 million m3 in 2010 (EU, 2011). Industrial demand is estimated
at 51 million m3 level and municipal water withdrawal at 810 million m3 in 2005.
Groundwater is mostly used for drinking supply. It represents about 70 percent of rural water supply
and a major role in several of the largest cities (Addis Ababa, Dire Dawa, Mekelle, Harar) and a number
of medium sized towns. Groundwater use in irrigation is only at pilot scale for now, but plans to develop
it are studied and shallow groundwater wells are constructed by farmers in some areas (MoWR, 2011).
TABLE 6 Water use
Water withdrawal:
Total water withdrawal 2016 10 548 million m3/year
- Irrigation 2016 9 000 million m3/year
- Livestock 2010 687
- Municipalities 2005 810 million m3/year
- Industry 2005 51 million m3/year
Per inhabitant 2015 106 m3/year
Surface water and groundwater withdrawal (primary and secondary) 2016 10 548 million m3/year
As % of total renewable water resources 2016 8.6 %
Non-conventional sources of water:
Produced municipal wastewater 2014 226* million m3/year
Treated municipal wastewater 2014 0.8* million m3/year
Direct use of treated municipal wastewater - million m3/year
Direct use of agricultural drainage water - million m3/year
Desalinated water produced - million m3/year
* This refers to the nine main cities only

Ethiopia 9
FIGURE 2 Water withdrawal by sector
Total 10 548 million m3 in 2016
IRRIGATION AND DRAINAGE
Evolution of irrigation development
River basin master plan studies and related surveys indicate a maximum irrigation potential of about 5.7
million ha, but about 3.7 million ha is commonly quoted. The irrigation potential of Ethiopia is at present
estimated at about 2.7 million ha, considering the availability of water and land resources, technology
and finance (Table 7).
TABLE 7 Economical irrigation potential by river basin
Major drainage system
River basin Economical irrigation potential (ha)
As % of total potential
Nile Basin Total 1 312 500 49.1 Abbay (Blue Nile) 523 000 19.6 Baro-Akobo 600 000 22.4 Setit-Takaze/Atbara 189 000 7.1 Mereb 500 0.02
Rift Valley 731 700 27.4 Awash 205 400 7.7 Denakil 3 000 0.1 Omo-Gibe 384 000 14.4 Central Lake 139 300 5.2
Shebelli-Juba 627 300 23.5 Wabi-Shebelle 204 000 7.6 Genale-Dawa 423 300 15.9
North East Coast 0 0.0 Oogaden 0 0.0 Gulf of Aden 0 0.0
Total 2 671 500 100
Traditional irrigation in Ethiopia dates back several centuries, especially in the highlands for subsistence
food crops, while "modern" irrigation was started by the commercial irrigated sugar estate established
in the early 1950s by the Imperial Government of Ethiopia and the Dutch company known as HVA-
Ethiopia in the upper Awash basin for industrial crops such as sugarcane and cotton. In the 1960s, large-
scale irrigation was developed by private companies in the whole Awash basin, thanks to the Koka dam,
as well as in the Lower Rift Valley. Modern small-scale irrigation through communal schemes started

10 Irrigation in Africa in figures - AQUASTAT Survey - 2016
only in the 1970s to fight major droughts and famines, especially the 1973 one. In the mid-1970s, state
farms were created through the nationalization of private property. Modern private irrigation re-emerged
with the liberalization of the economy in the 1990s.
Estimates of irrigated areas vary widely. In 1994, the water managed area was estimated at about
190 000 ha, in 2001 at nearly 290 000 ha (Table 8). The actually irrigated area was then estimated to be
equal to the area equipped for irrigation with the following reasoning: on the one hand some irrigation
schemes were not operating to their full potential or were not functional at all due to factors related to
shortage of water, damaged structures and poor water management; on the other hand, farmers were
extending canal networks in some modern irrigation projects and therefore irrigating more land than
was reportedly equipped for irrigation.
TABLE 8 Evolution of irrigation and water managed area (in ha)
Schemes 1994 1998 2001 2004 2006 2010 2015
Equipped for full-control irrigation 151 191 175 300 197 250 487 427 658 340
Equipped for spate irrigation 200 000 200 000
Small temporary water managed 138 339 334 700 428 570 853 100 1 100 000
Total water managed 189 560 197 260 289 530 510 000 625 820 1 540527 1 958 340
Note: Estimated by AQUASTAT, based on MoADR, 2006; IWMI, 2009; IWMI, 2010; MoFED, 2010; NPC, 2015
In 2004, the water managed area was estimated at 510 000 ha, of which 175 300 ha estimated to be full-
control irrigation. However, a research estimated that about 30 percent of the command area was not
operating at that time (IWMI, 2010). In 2015, the area equipped for full-control irrigation is estimated
at 658 340 ha. The area equipped for community spate irrigation is estimated at around 200 000 ha,
giving a total area equipped for irrigation of 858 340 ha. In addition around 1 100 000 ha was estimated
to be cultivated by small farmers using temporary structures. Thus, in total around 1 958 000 ha (Table
9 and Figure 3) is considered to be water managed in 2014/15 (NPC, 2015).
TABLE 9 Irrigation and drainage
Irrigation potential 2 700 000 ha
Irrigation:
1. Full control irrigation: equipped area 2015 658 340 ha
- Surface irrigation - ha
- Sprinkler irrigation 2015 10 000 ha
- Localized irrigation - ha
Area equipped for full control irrigation actually irrigated ha
- As % of area equipped for full control irrigation 2010 70 %
2. Equipped lowlands (wetland, ivb, flood plains, mangroves) - ha
3. Spate irrigation 2015 200 000 ha
Total area equipped for irrigation (1+2+3) 2015 858 340 ha
As % of cultivated area 2015 5 %
% of area irrigated from surface water - %
% of area irrigated from groundwater - %
% of area irrigated from mixed surface water and groundwater - %
% of area irrigated from non-conventional sources of water - %
Area equipped for irrigation actually irrigated - ha
- As % of total area equipped for irrigation - %
Average increase per year 2001-2015 11 %
Power irrigated area as % of total area equipped for irrigation - %
4. Non-equipped cultivated wetlands and inland valley bottoms 1 100 000 ha
5. Non-equipped flood recession cropping area - ha
Total water-managed area (1+2+3+4+5) 2015 1 958 340 ha
As % of cultivated area 2015 12 %

Ethiopia 11
TABLE 9 (Continued) Irrigation and drainage
Size of full control irrigation schemes: Criteria:
Small schemes < 200 ha 2015 200 000 ha
Medium and large schemes > 200 ha 2015 658 340 ha
Total number of households in irrigation -
Irrigated crops in full control irrigation schemes:
Total irrigated grain production - metric tons
As % of total grain production - %
Harvested crops: -
Total harvested irrigated cropped area - ha
Temporary crops: total - ha
Permanent crops: total - ha
Irrigated cropping intensity (on full control area actually irrigated) - %
Drainage - Environment:
Total cultivated area drained - ha
Non-irrigated cultivated area drained - ha
Area equipped for irrigation drained - ha
- As % of total area equipped for irrigation - %
Area salinized by irrigation - ha
Area waterlogged by irrigation - ha
FIGURE 3 Area equipped for irrigation Total 858 340 ha equipped for irrigation in 2015
Harvested irrigated crops reported by the Central Statistics Agency (CSA) cover 327 036 ha for private
holdings in 2014/15 (148 132 ha in Belg season and 178 904 ha in Meher season) (CSA, 2015b and
2015c) and there is no precision of the irrigated crops area in the census dedicated to medium and large
commercial farms, although most of them seem to practice it.
Spate irrigation is practiced both in the midlands and lowlands. Despite few patches practised for some
decades, most of the spate irrigation has been developed relatively recently, especially in arid areas,
such as in East Tigray, Somali, Oromia, Dire Dawa, SNNP (Southern Nations, nationalities and
Peoples), Afar and Amhara regions. Spate irrigation development concerns between 100 000 and
200 000 ha. Spate irrigation was actually done on 140 000 ha in 2008 (Spate Irrigation Network, 2011).
About 1 240 ha of vegetables are irrigated around Addis Ababa using wastewater or the Akaki river
receiving most of the wastewater produced in the city (WeldeSilassie, 2011; UNEP, 2014).

12 Irrigation in Africa in figures - AQUASTAT Survey - 2016
Irrigation schemes in Ethiopia are distinguished by:
Irrigation technologies:
Traditional: often small-scale and community-based, carried out by farmers on their
own initiative, including in peri-urban areas particularly in Addis Ababa and Bahir Dar,
for the production of vegetables for the local market. Traditional river diversions are
physical structures built with local materials. The diversion structures are normally
destroyed by floods during the rainy seasons and have to be built each year.
Modern: any size or ownership.
Size:
Small: less than 200 ha, often community-based and traditional, but can be modern.
Includes wells, spate, river diversion.
Medium: between 200 and 3 000 ha, community-based or public. Examples include
Sille, Hare and Ziway irrigation schemes.
Large: more than 3 000 ha, commercial or public, such as Wonji-Shoa sugarcane
plantation, Methara, Nura Era and Fincha. Similarly to medium, they are mainly
supplied by surface water stored in dams, with some pilot areas using groundwater.
Ownership 1:
Smallholders, for subsistence or local market.
Commercial.
Ownership 2:
Community-based.
Private.
Public: constructed in the 1960-70s either as private farms or joint venture, owned and
operated by public enterprises. About 73 percent of the public irrigation schemes are
located along the Awash river. Public schemes are medium or large.
For census purposes, the CSA only distinguishes between small private holdings on the one hand and
medium and large commercial farms on the other hand.
Most of the water used for irrigation is surface water, while groundwater use just started on pilot basis
in East Amhara. Surface irrigation methods dominate throughout, predominantly furrow irrigation for
cotton and wheat and basin irrigation for commercial fruits such as bananas. Sprinkler irrigation is being
practiced on about 10 000 ha area for sugarcane on Fincha State Farm. Similarly, it is being used in
limited areas of eastern Amhara and southern Tigray in some smallholders’ schemes and some private
farms in the Rift Valley. Most of the earlier schemes were pump-irrigation projects, but later gravity
irrigation schemes were introduced. Some private farms had installed hydraulic rams on the banks of
the Awash river to lift up water (MoA, 2011).
Finally, rainwater harvesting, also sometimes named micro-irrigation in national documents, is well
developed in the country, although estimates vary again widely: from 40 000 to 800 000 ha, certainly
encompassing the basin catchment for the latter figure. A recurrent estimate of 128 000 ha seems more
probable.
Role of irrigation in agricultural production, the economy and society
Irrigated agriculture contributed less than 3 percent of the total cereal production in the early 2000s. By
2010, it contributed 9 percent of the agricultural GDP and 3.7 percent of the overall GDP. Over 1.2
million private holders practiced irrigated agriculture in 2014/15 in the Meher season–main rainy
season–and over 0.8 million in the Belg season–small rainy season.
Irrigated crops in medium and large scale commercial farms are mostly cash crops, in particular cotton
and sugarcane, but fruits and vegetables were also introduced. The Wonji/Shoa, Metehara and Finchaa
schemes grow sugarcane (total 21 425 ha in 2005/06), the Amibara scheme cotton (6 448 ha in 2005/06),

Ethiopia 13
and Upper Awash scheme fruits and vegetables (6 017 ha in 2005/06) (MoA, 2011). Large-scale
irrigation schemes are under full irrigation throughout the year (IWMI, 2009).
In small-scale irrigation schemes, irrigated crops are more diversified, but for the country as a whole the
main irrigated crops are cereals–maize, wheat, barley or teff–, pulses, vegetables, root crops, fruits and
fiber crops (cotton). Smallholder irrigators generally prefer subsistence crops rather than cash crops
(MoA, 2011) and use irrigation to complement rainfed agriculture, i.e. supplementary irrigation.
However, during the dry season, they use full irrigation to get additional income (IWMI, 2009).
Status and evolution of drainage systems
Drainage is as important as irrigation, particularly in the highlands of Ethiopia. However, except in
irrigated lands, drainage is not given the required attention in rainfed agriculture where farmers construct
traditional drain ditches commonly diagonal to the main slope of the farmlands. Because of irregularity
in cross-sections and longitudinal slopes as well as inadequate capacities, the drains are usually
converted to gullies if the same drains are adopted year after year. To avoid this happening, drain lines
are changed every year. Designs of small-scale irrigation schemes incorporate drainage systems but
these are not properly implemented. The drainage system used in the country is the surface drainage
system (gravity drainage). The construction of subsurface drainage systems was started for one large-
scale irrigation scheme in the Awash Valley for salinity control, but was discontinued.
Women and irrigation
Women and children are the main responsible for fetching water, even when it requires traveling long
distances, up to half a day (UNESCO-WWAP, 2004). In agriculture, out of the 15 million farm holders
in 2011, only 2.7 million were women (CSA, 2011). Both women and men can register for land
ownership, but women do not equally get access to farm plots despite the fact that they undertake up to
75 percent of farm labour and produce 70 percent of the households’ food (USAID, 2016). Women also
have less access to extension services and agricultural inputs, including irrigation, as well as a lower
bargaining power for changing water schedules. Hence, even with water rights, their crops fail more
often just because water was not available on time (CDR, 2011). As a result, both in rainfed and irrigated
agriculture, they produce up to 35 percent less than men (USAID, 2016) and female-headed households
have a weaker position. Finally, the cultural perception that women are unable to plough in some
communities may explain partly their lower access to land and inputs (CDR, 2011).
WATER MANAGEMENT, POLICIES AND LEGISLATION RELATED TO WATER USE IN AGRICULTURE
Institutions
At the federal level, the public institutions involved in water resources development include:
The Ministry of Water, Irrigation and Energy (MoWIE) replacing the Ministry of Water
Resources (MoWR), responsible for the overall planning, development, management,
utilization and protection of the country’s water resources, as well for the supervision all
medium and large irrigation schemes. The following six directorates in particular are dedicated
to water:
Irrigation and Drainage
Water Use Permit and Administration
Hydrology and Water Quality
Groundwater
Basin Administration
Water Supply and Sanitation

14 Irrigation in Africa in figures - AQUASTAT Survey - 2016
The Ministry of Agriculture (MoA), in charge of water management (irrigation extension),
including water harvesting for smallholder irrigated and rainfed agriculture.
The Ministry of Environment and Forestry (MoEF), formerly the Environmental Protection
Authority (EPA), responsible for the preparation of environmental protection policy, laws and
directives. It is also in charge of evaluating the impact of social and economic development
projects, particularly irrigation and hydropower projects, on the environment and is further
responsible for follow-up work.
The Water Resources Development Fund (WRDF)
At sub-national level, three River Basin Organisations have been established since 2008, comprising a
Basin High Council and River Basin Authorities to ensure integrated water resources management at
basin level:
Awash Basin Authority (AwBA), replacing the former only basin-level institution the Awash
Basin Water Resources Management Agency (ABWRMA). Most of the medium- and large-
scale irrigation projects and salinity and flooding problems are concentrated in this basin;
Abbay River Basin Authority (ARBA);
Rift Valley Lakes Basin Authority (RVLBA).
Finally, the regions are the major operational unit for projects through their:
Bureau of Water, Mines and Energy (BoWME) and/or Bureau of Water Resources
Development (BoWRD), which are responsible for small-scale irrigation and rural water
supply as well as small-scale hydropower development.
State’s Irrigation Development Authorities, which undertake operational activities in line with
their mandates (study, design and construction of small-scale irrigation schemes).
Water management
Basin Master Plans are expected to rule and detail water allocation, but since most of them are outdated,
they do not reflect the actual water needs. In addition, formal water rights are not yet in place, so
customary water rights dominate, such as for example the rights associated to communal land tenure in
pastoralist areas. However, but these traditional institutions are not always adapted to increasing water
scarcity and mobility (EU, 2011).
Almost all traditional irrigation schemes have a corresponding traditional water management
organization, but they do not receive any formal support. These traditional water committees, locally
known as ‘water fathers’, administer the water distribution and coordinate the maintenance activities
of the schemes. Some Water Users Associations (WUA) have been established. However, WUAs have
no legal status and are to be converted into irrigation cooperatives. There are nonetheless differences,
in particular in membership and focus, between the two types of association. Membership is
compulsory in WUA, but voluntary in cooperative. Marketing is also the main focus of irrigation
cooperatives, while WUAs mostly concentrate on water distribution and management (MoA, 2011).
The water management of small-scale irrigation schemes is the responsibility of the farmers themselves,
mainly through informal/traditional community groups. Apart from the provision of extension and
training services to the WUAs from the MoA, no institution is directly involved in water management
in smallholder-irrigated agriculture. Once the construction of irrigation schemes is completed, they are
handed over to the beneficiaries but maintenance remains within the responsibility of the regional
governments. The absence of any appropriate local-level organs to cater for small-scale irrigation has
resulted in a lack of guidance in irrigation operation and maintenance at a community level. With an
increase in irrigated areas and more users, irrigation water management and rules for water allocation
are becoming more complex and problematic.

Ethiopia 15
Finances
Funding for water development activities is mainly provided by the federal or regional government. The
WRDF provide small credits to WUAs. Private investment is increasing but remains low. The States’
irrigation authorities have financial autonomy only over their approved and allocated budget. So far,
neither cost recovery nor irrigation charges have been considered in irrigation development. However,
in some cases beneficiaries have been contributing to the development of some small-scale irrigation
schemes by providing free labour for up to 10 percent of the investment. Most beneficiaries have not
even contributed to the operation and management of the existing schemes let alone to construction
costs. In some small-scale irrigation schemes, though, beneficiary communities collect irrigation
charges for covering minor maintenance costs, each beneficiary paying the same amount irrespective of
farm size or quantity of water withdrawn.
Irrigation development costs between US$5 000 and US$20 000 per hectare (MoA, 2011).
Policies and legislation
The 1995 Ethiopian Constitution states in its article 44 that all natural resources (including water) are
the common property of the Ethiopian people and the state (MoA, 2011). The Ethiopian Water
Resources Management Policy (WRMP) Proclamation 2000 (No 197) sets out the basis for
contemporary integrated water management in the country. Its guiding principles are: i) recognition of
water as a scarce and vital socio-economic resource to be managed and planned strategically; ii)
recognition of water as an economic good; iii) stakeholders to be involved in water resources
management. It allocates water to all regional states regardless of the source and location of the resource,
and provisions for water rights. In 2001, the Ethiopian Water Strategy translated the policy into action.
More recently, additional legislation completed the 2000 WRMP Proclamation:
Water Resources Management Regulation 2005 (No 115) makes provision for maintaining
environmental flows, protecting or restoring ecosystem services and addressing the water
needs of marginalized groups but its enforcement is not rigorous (ODI, 2015).
River Basin Councils and Authorities Proclamation 2007 (No 534) authorizes RBHCs and
RBAs for each major river basins.
One chapter of the 2000 Water Resources Management Policy is dedicated to irrigation, the Irrigation
Policy, to develop the huge irrigated agriculture potential for the production of the food crops and raw
materials needed for agro-industries in a sustainable way. It emphasizes decentralization and user-based
management of irrigation systems, development of priority schemes, support and enhancement of
traditional irrigation schemes, establishment of water allocation, as well as integration of appropriate
drainage facilities.
The Water Sector Development Programme (WSDP) was launched in 2002 for a 15-year period (2002
to 2016). It includes the financing of water resources management and development; the creation of an
enabling environment; transboundary rivers management; stakeholder participation and gender
mainstreaming; disaster-prevention and public safety, and environmental health standards. The WSDP
requested Master Plans for the seven river basins to form a comprehensive “national river basin master
plan”. Most of these plans were completed by 2014 but used 1990s data and thus needed updates, which
started only in the three basins with functioning RBAs (Awash, Abbay and Rift Valley).
Finally, the Growth and Transformation Plan (GTP) replaced the Plan for Accelerated and Sustained
Development to End Poverty (PASDEP) in 2010 as Ethiopia’s overarching five-year poverty reduction
plan (MoA, 2011).
16 Irrigation in Africa in figures - AQUASTAT Survey - 2016
ENVIRONMENT AND HEALTH
The main environmental issues related to water management are erosion and siltation of water
infrastructures. Water pollution is still mostly limited to urban and industrial areas, but soil salinization
is directly linked to irrigated agriculture.
Erosion and sedimentation
Erosion is caused by natural factors, such as topography, torrential rains and wind. It is also caused by
human activities, in particular deforestation for agriculture, charcoal, construction, mining, or by
grazing, all due to unsustainable utilization and rapidly expanding human and livestock populations.
Annual soil erosion amounts to about 1 900 million tons/year, impacting water, land and agricultural
productivity (IWMI, 2010). Since the majority of the main rivers have their headwaters in the highlands
parts of the country, their silt content is high. As a result, water bodies are silting up, especially in the
Abbay basin (ODI, 2015). Sedimentation in dams, such as the Koka, Aba Samuel, Borkena and Gondar,
reduced their storage capacity. Water levels of natural lakes have decreased, in particular Awasa, Abaya,
Alemaya, Lange, Rudolf, Chew Bahir, Adele and Zway, and some show signs of drying up. Finally, a
number of rivers change their courses due to siltation, particularly during the rainy season, resulting in
yearly flooding in the areas near the riverbanks. This is particularly the case of the Lower Awash river
(EPA, 2003 and EPA and UNEP, 2008).
Water pollution
Water pollution is still limited to industrial, mining and urban areas (EPA, 2012), but is a growing
problem in the Awash river basin, due to major cities and industries in the Upper basin. In early 2000s,
about 80 percent of industries around Addis Ababa discharged their waste into nearby water bodies
without any treatment. Tributaries of the Awash river around Addis Ababa and Nazareth are polluted
(EPA, 2003). Pollution causes water hyacinth infestation in Lake Koka, algal bloom in Lake Aba
Samuel, industrial pollution of the Akaki river and nitrate pollution of the Awash river (ODI, 2015).
Salinization
Salinity problems due to waterlogging were observed in irrigated lands along the Awash river. In the
1980s, thousands of hectares of the Amibara plantation for cotton, in the middle Awash basin, had to be
abandoned after less than five years of irrigation farming due to faulty drains (WB, 2007).
PROSPECTS FOR AGRICULTURAL WATER MANAGEMENT
Recurring droughts and growing population pressure drove Ethiopian government to prioritize irrigated
agriculture in the country’s development agenda in order to reduce the food deficit. Targets of the 2006-
2010 PASDEP, 487 000 ha of small-scale irrigation and 323 000 ha of medium- and large-scale
irrigation by the end of the period (PASDEP), were mostly achieved. Ethiopia’s first Growth and
Transformation Plan (GTP) targeted again a colossal increase in irrigated land area for the period 2010-
2015, for a total of 1.85 million ha in small irrigation and an additional 785 583 ha in medium and large
irrigation schemes by 2015 (GTP, 2010). Anew these were almost reached but mostly through traditional
water management often with temporary structures not full-control irrigation schemes. The second GTP
set once more for the period 2015-2020 a vast increase, although this small scale irrigation target is
lower than in the 2010-2015 GTP, with 1.7 million ha under small irrigation schemes and 954 000 ha
under medium and large scale by 2019/2020 to develop 98 percent of the irrigation potential (GTP2).
Area under irrigation is mostly expanded with small irrigation schemes requiring lower capital and
technical investments and reaching small communities.
However, despite the immense increases mentioned above, the harvested irrigated crops were in
2014/2015 not yet using this new potential fully. In addition, the rapid infrastructure development should

Ethiopia 17
be quickly followed by institutional development and in particular creation of WUAs for local irrigation
management to ensure these new irrigation schemes are properly managed, operated and maintained.
MAIN SOURCES OF INFORMATION
CSA. 2011. Agricultural statistics results for 2009/10. Central Statistical Agency.
CSA. 2015. Key findings of the 2014/2015 (2007 E.C.) Agricultural sample surveys. Central Statistical Agency.
Addis Ababa.
CSA. 2015b. Agricultural sample survey 2014/15.Volume V. Report on area, production and farm management
practice of Belg season crops for private peasant holdings. Central Statistical Agency, Addis Ababa.
CSA. 2015c. Agricultural sample survey 2014/15.Volume III. Report on farm management practice of Meher
season crops for private peasant holdings. Central Statistical Agency, Addis Ababa.
EPA. 2003. State of environment report of Ethiopia. Environmental Protection Authority. Addis Ababa.
EPA. 2012. United Nations Conference on Sustainable Development (Rio+20). National report of Ethiopia.
Environmental Protection Authority. Addis Ababa.
EPA, UNEP. 2008. Ethiopia environment outlook. Environment for development. Environmental Protection
Authority. United Nations Environment Programme. Addis Ababa.
EU. 2011. Managing water for inclusive and sustainable growth in Ethiopia: key challenges and priorities.
European Report on Development. European Union.
FAO. 2015. State of food security 2015. Food and Agriculture Organization of the United Nations. Rome.
IGRAC. 2014. Transboundary aquifers of the world. Update 2014. International Groundwater Resources
Assessement Center.
IUCN. 2010. Wetlands of Ethiopia. Proceedings of a seminar on the resources and status of in Ethiopia’s wetlands.
The World Conservation Union.
IWMI. 2007. Water resources and irrigation development in Ethiopia. Working Paper 123. International Water
Management Institute.
IWMI. 2009. Importance of irrigated agriculture to the Ethiopian economy: capturing the direct net benefits of
irrigation. Research Report 128. International Water Management Institute.
IWMI. 2010. Irrigation potential in Ethiopia. Constraints and opportunities for enhancing the system.
International Water Management Institute.
JMP. 2015. Progress on drinking water and sanitation – 2014 update. WHO/UNICEF Joint Monitoring
Programme for Water Supply and Sanitation.
MoA. 2011. Small-scale irrigation situation analysis and capacity needs assessment. Ministry of Agriculture.
MoADR, 2006. Agricultural policies, programs and targets for a plan for accelerated and sustainable
development to end poverty (PASDEP) 2005/6 - 2009/10. Ministry of Agriculture and Rural Development.
MoFED, 2010. Growth and transformation plan 2009/10-2014/15. Volume I: Main text. Ministry of Finance and
Economic Development.
MoWIE. 2015. Urban wastewater management strategy. Ministry of Water, Irrigation and Energy.
MoWR. 2011. Ethiopia: strategic framework for managed groundwater development. Ministry of Water
Resources.

18 Irrigation in Africa in figures - AQUASTAT Survey - 2016
NPC. 2015. The second growth and transformation plan (GTP II) (2015/16-2019/20). National Planning
Commission.
ODI. 2015. Building adaptive water resources management in Ethiopia. Overseas Development Institute.
Spate Irrigation Network. 2011. Status and potential of spate irrigation in Ethiopia.
UNDP. 2016. Human Development Reports: Data. United Nations Development Programme. New York.
UNEP. 2014. Building urban resilience-assessing urban and peri-urban agriculture in Addis Ababa, Ethiopia.
United Nations Environment Programme.
UNESCO-WWAP. 2004. National water development report for Ethiopia. United Nations Educational,
Scientific, and Cultural Organization- World Water Assessment Program.
CDR. 2011. Digging, damming or diverting? Small-scale irrigation in the Blue Nile basin, Ethiopia. Working
Paper Series 84. Center for Development Research, University of Bonn.
USAID. 2016. Empowering women through agricultural development in Ethiopia. Available at:
https://www.usaid.gov/results-data/success-stories/empowering-women-through-agricultural-development-
ethiopia, accessed in June 2016.
WB. 2007. Environmental and social management framework-Ethiopia irrigation & drainage project. World
Bank.
WB. 2016. World Development Indicators. World DataBank. World Bank. Washington.
WeldeSilassie. 2011. Wastewater use in crop production in peri-urban areas of Addis Ababa: impacts on health
in farm households. Environment and Development Economics 16(1):25-49.
![GRAVES’ DISEASE AND THE MANIFESTATIONS OF · description by the Irish physician Robert Graves [1], to whom credit is usually attributed. The eponym Basedow's disease is often used](https://img.dokumen.tips/doc/110x75/5bbd7c5a09d3f2ee168d0bdb/graves-disease-and-the-manifestations-of-description-by-the-irish-physician.jpg)