Embed Size (px)
Citation preview

Council for Geoscience Strategy
Presentation to the Parliamentary Portfolio Committee on Mineral Resources
12 June 2013

Structure
• Five-year goals
• Vision, Mission and Values
• Mandate
• Strategy
• Budget
• Strategic performance objectives and targets
• Key programmes and projects
• Human capital

Goals

Five-year Goals
Strategic outcome-oriented goals of the CGS
• Employees view the CGS as an attractive career opportunity
• The CGS is responsive to the developmental needs of the country and is recognized among global leaders in the geological field because of its commitment to excellence
• The CGS is a financially viable and structurally robust organization catering for all stakeholders and utilizing multiple revenue streams
Vision, Mission and Values

Vision
Leading Earth-Science Solutions
Mission
To provide expert earth-science information and services to improve the management of natural resources and the environment for a better quality of life for all
Vision & Mission

The Values
• Innovate and create through teamwork
• Excel through quality and performance
• Value diversity through trust and respect
• Invest in our people

Mandate

The Mandate of the CGS
The Geoscience Act, Act 100 of 1993 • The systematic onshore and offshore geoscientific mapping of
South Africa • Basic geoscience research into the nature and origin of rocks • The collection and curation of all geoscience data and act as a
National Geoscience Repository • Rendering of geoscience knowledge services and advice to the
State • Manage a number of national geoscience facilities on behalf of
the country • Render commercial geoscience services and products to
national and international clients • CGS also aligns its strategy and activities with
– Government programme of action – national imperatives – DMR’s strategy (Mining Growth strategy) – DST’s national research and development strategy

Geoscience Amendment Act (Act 16 of 2010)
• Changes and additions to the scope of the mandate of the CGS
Custodianship of geoscientific information
National advisory authority
Prospecting research and exploration (reconnaissance)

Additional Mandate from Amendment Act (still excluded)
The AA (Act 16 of 2010) was promulgated on 1 July 2012, subject to the exclusion of the following Articles:
• Article 4(c): serve as the national custodian of geotechnical information, prospecting information and all other geoscientific information relating to the earth, the marine environment and geomagnetic space, all of which shall be lodged with the Council;
• Article 4(eA): review and evaluate all geotechnical reports in respect of geohazards that may affect infrastructure and development at prescribed tariffs;
• Article 4(f): develop and maintain the National Geoscientific Library, the National Geoscientific Information Centre, the National Borehole Core Depository, the National Geophysical and Geochemical Test Sites, the National Geoscience Museum, the National Seismological Network and the National Geoscience Analytical Facility;

Amendment Act
• Article 5(b): by the addition after subsection (2) of the following subsection: “(3) All geotechnical reports pertaining to infrastructure and development shall be submitted to the Council in the prescribed manner.”;
• Article 8: Appointment of geotechnical appeal committee.

Other mandates
• Medium Term Strategic Framework for 2009 to 2014 - Government
• National System of Innovation - Government
• Stakeholders’ declaration on Strategy for the Sustainable Growth and meaningful Transformation of South Africa’s Mining Industry - DMR
• Grand Challenges - DST

Expenditure $$
Exploration area km2
feasibledeposit
Time >>>
Pre
co
mp
eti
tiv
e
pu
blic
Geo
-scie
nce
data
Inv
estm
en
t
pro
mo
tio
n
Pro
sp
ecti
ve
terr
ain
Pri
ori
ty
are
as
Exp
lora
tio
n
targ
ets
GSOs / public sector
(developing economies, e.g. RSA) Mining Industry / private sector
GSOs
(US, Can, Aus)Mining Industry / private sector
Oil and Gas Companies / private sectorOil Ministry
Public- versus Private-Sector Funding
Expectations gap

Strategy

Strategic planning process
• Board strategic planning workshop - 12 to 13 May 2011
• CGS management strategic planning workshop 23 to 24 June 2011
• Board approval of CGS Strategic and Performance Plans – 17 November 2011
• Ministerial approval – 1 March 2012

Strategy
Imperatives
• Speeding up economic growth
• Rural development and poverty eradication
• Increasing innovation
• Skills development
• Expediting transformation
• Development of Africa
• Addressing stakeholder needs and regulatory requirements

Strategy
CGS Strategic Objectives
• To address stakeholder needs
• To effectively promote the CGS and disseminate strategic information to the public
• To develop and implement effective policies and procedures
• To drive preferential procurement

CGS Strategic Objectives (cont.)
• To attract and retain a skilled workforce
• To enhance present levels of excellence
• To build a positive organizational culture
• To reflect and embrace South Africa’s diversity
• To generate revenue
• To manage overhead efficiency
Strategy

Strategy
Key Challenges
• Insufficient resources
• Ageing infrastructure
• Continuing with Transformation
• Refocusing and aligning the organization to address SA’s developmental challenges

Budget

Budgets for the period 2012/13 to 2015/16
INCOME (RANDS) 2012/13
x 1000
2013/14
x 1000
2014/15
x 1000
2015/16
x 1000
Government grant 223 006 265 268 297 908 319 027
Sales and contracts 72 600 79 860 87 846 96 630
Sundry income 2 756 2 894 3 039 3 191
TOTAL INCOME 298 362 348 022 388 793 418 848
EXPENDITURE
Personnel costs 147 360 160 289 172 787 186 148
Bursaries 1 900 2 090 2 300 2 530
Commercial project costs 32 670 35 937 39 531 43 484
Overheads and operating costs 105 432 128 206 147 175 147 536
SUBTOTAL 287 362 326 522 361 793 379 698
CAPITAL EXPENDITURE
Equipment 1 000 1 500 2 000 10 000
Land and buildings 10 000 20 000 25 000 29 150
SUBTOTAL 11 000 21 500 27 000 39 150
TOTAL EXPENDITURE 298 362 348 022 388 793 418 848
Surplus (Loss) -- --

Analysis of Government grant allocation for 2012/13 to 2015/16
ITEM 2012/13
R
2013/14
R
2014/15
R
2015/16
R
Baseline allocation 144.6m 155.5m 166.9m 176m
Water Ingress project 18.4m 19.8m 21m 22m
Total Government
Grant as at January
2013
163m
175.3m
187.9m
198m
Derelict and Ownerless
Mines Project
20m 20m 20m 21m
Additional Funding
(MTEF proposals)
- Stimulation of investment in the Mineral Sector
30m
50m
65m
74m
- Building & Laboratory infrastructure
10m 20m 25m 26m
TOTAL GOVERNMENT
GRANT
223m 265.3m 297.9m 319m

Strategic Performance Targets and Objectives

Economic / Financial Growth
Key Objectives Measures Target 2013/14 Target 2014/15 Target 2015/16
To generate
Revenue
Total revenue
(Rands) R348m R388,8m R418,9m
Contract revenue
(Rands) R79,9m R87,9m R96,6m
Ratio of external
revenue to total
revenue
23,8% 23,4% 23,8%
Number of large
tenders submitted
(>R1m)
24 24 24
Tender success rate 10% 10% 15%
To manage
overhead
efficiency
Ratio of overheads
to total cost 60% 60% 60%
Ratio of personnel
cost to total cost 59% 59% 55%

Stake Holder / Customer Perspective
Key Objectives Measures Target
2013/14
Target
2014/15
Target 2015/16
To contribute
towards South
Africa’s
economic
growth and
serve
stakeholders
No. of Geoscience Maps and
Publications published 16 18 20
Customer satisfaction level 85% 85% 85%
No. of Rural Development Project
reports completed 12 14 14
No. of Regional and African
Development Project reports
completed
25 27 28
No. of Environment-Related Projects
reports completed 7 8 9
Annual Technical Programme
performance index 85% 85% 85%
To integrate the Mine Seismic Network
into National Network
Number of stations installed
10 10 10
To promote the
CGS and
disseminate
information
Articles published in the popular press 2 2 2
Articles published in industry
publications 4 4 4

Effective Systems Perspective
Key Objectives Measures Target
2013/14
Target
2014/15
Target
2015/16
To develop and
implement
effective polices
and procedures
Number of audit
qualifications 0 0 0
Number of policies
written and/or
reviewed
5 7 10
To drive
Preferential
procurement
Preferential
procurement as a %
of total procurement
40% 40% 40%

World-class People Perspective
Key
Objectives Measures
Target
2013/14
Target
2014/15
Target
2015/16
To attract and
retain a
skilled
workforce
Nett staff turnover 0% 0% 0%
No. of staff funded
for MSc and PhD degrees 35 35 40
Proportion of scientists to total staff
45% 50% 50%
% of scientific staff with PhD and MSc degrees
57% 60% 60%
% Protégée satisfaction level 60% 60% 60%
To enhance
present levels
of excellence
No. of papers and articles
published 70 70 75
No. of projects with external
collaborators 50 55 60
No. of strategic science
partnerships 20 22 25

World-class People Perspective (cont.)
Key Objectives Measures Target 2013/14 Target 2014/15 Target 2015/16
To build positive
organisational
culture
Staff satisfaction
level 65% 65% 65%
To reflect and
embrace RSA
diversity
EE Stats
(Consolidated)
W:B ratio
34:66 32:68 30:70
EE Stats
(Gender) (M:F) 54:46 53:47 52:48

Key Programmes and Projects

Business Model : Seven Scientific Thrusts
Engineering
Geoscience
Environmental
Geoscience
Water /
Geohydrology
Geoscience Mapping
•Geological
•Geochemical
•Geophysical
•Remote Sensing
Mineral Resources
Development
Energy
Information
and Education

1:250 000-scale Geological Mapping
MAPS PUBLISHEDPolokwane
Pretoria
Johannesburg
Mafikeng
Kimberley
Bloemfontein
Durban
Port Elizabeth
Cape Town
INDEX MAP:- PROGRESS OF THE MAPPING ANDPUBLICATION OF 1:250 000-SCALE GEOLOGICALMAPS IN SOUTH AFRICA
REVISION MAPPINGCOMPLETED
MAP READY TO PRINT

1:50 000-scale Geological Mapping
Km
INDEX MAP:- PROGRESS OF 1:50 000-SCALE GEOLOGICAL MAPPINGIN SOUTH AFRICA
Maps published
Mapping in progress
Mapping completed

1:250 000-scale Metallogenic Mapping
Map compilation planned for2012/2013
Upington
Cape Town
Pretoria
Polokwane
Durban
Port Elizabeth
INDEX MAP:- 1:250 000-SCALE METALLOGENICMAPPING PROGRAMME FOR SOUTH AFRICA
Map compilation completed
Map published

1:50 000-scale Geotechnical Mapping
INDEX MAP:- PROGRESS OF1:50 000-SCALE GEOTECHNICALMAPPING IN SOUTH AFRICA
Maps published

Regional Geochemical Mapping
Geochemical dataavailable
Sampled
Springbok
Cape Town
Beaufort West
MafikengJohannesburg
Polokwane
INDEX MAP:- PROGRESS OF THE REGIONALGEOCHEMICAL SURVEY OF SOUTH AFRICA

High-density Airborne Geophysical Flying

Seismicity recorded by the SANSN in Southern Africa during 2012
Majority of
seismicity occurs
in the mining
regions (both
opencast and
underground)

Status of the project:
Integration of the South African National
Seismograph Network and Database with Mining
Networks as per the recommendation in chapter 1 of
the Presidential Mine Health and Safety Audit 2008
entire long-term project 1) South African National Seismograph Network (SANSN) has
been extended into the KOSH region and data is sent in real
time to the CGS,
2) The database has been established and populated by data
from the extended SANSN. MoU’s with mining companies in
place for exchange of data and integration into the database,
3) A dedicated group of seismologists is conducting research
into induced seismicity, specifically mining seismology.

Seismicity recorded by the CGS cluster networks in three mining districts
Central Basin Area
Far West Rand Area
12 stations
KOSH
25 stations 11 stations
The sensitivity of
these networks is far
better than the
national network (a
greater number of
events are recorded
and lower magnitudes
measured).

Centre of Research in Induced Seismicity (CRIS)
Consist of:
- Senior and Junior seismologists,
- Electronic Technicians and
- Seismological Analysts.
Will perform research on induced
seismology in general, but will focus on
mine seismology, such as:
- Integration of mining data with CGS
data into one database,
- Velocity models and depth estimation
for the regions for better locations,
- Provide advice on standards and
codes of practice within the mines,
- Use the database to build up a record
of how seismicity is affected after
mining and advise on mine closure
procedures.
In addition, young
scientists, electronics
technicians and
seismological analysts will
be trained in order to
expand the CGS team and
expertise into mining
seismology

Strategic Mine Water Management Project
Canalisation of the natural watercourse from Florida Lake to
Fleurhof Dam
Prevention of ingress in Central Rand
Basin

Strategic Mine Water Management Project
MONITORING OF SEISMICITY IN THE CENTRAL BASIN
PASSIVE TREAMENT TECHNOLOGIES: Princess Dam Case
SOURCE AND LIABILITY APPORTIONMENT OF POLLUTION
IDENTIFICATION OF ADDITIONAL INGRESS AREAS, ASSESSMENT AND
PRIORITISATION
OTHER ACTIVITIES IN EAST RAND BASIN
MINE WATER (AMD) RELATED GEOTECNICAL IMPACTS: Laboratory
EXPERIMENTS Of Acid Mine Drainage Attack On Engineering Materials And Structures
OTHER ACTIVITIES IN CENTRAL RAND BASIN

Project ST2012-1150 - A holistic approach towards best
management practices of AMD impacts using a catchment
approach strategy, South Africa
The Olifants River Catchment Area is
severely impacted by historical and current
gold, coal, Pt-Ni, and other mining activities.
AMD “lake” in the Witbank coalfield
Un-rehabiliated tailings deposit in Sabie gold mine
area discharging AMD into a nearby stream
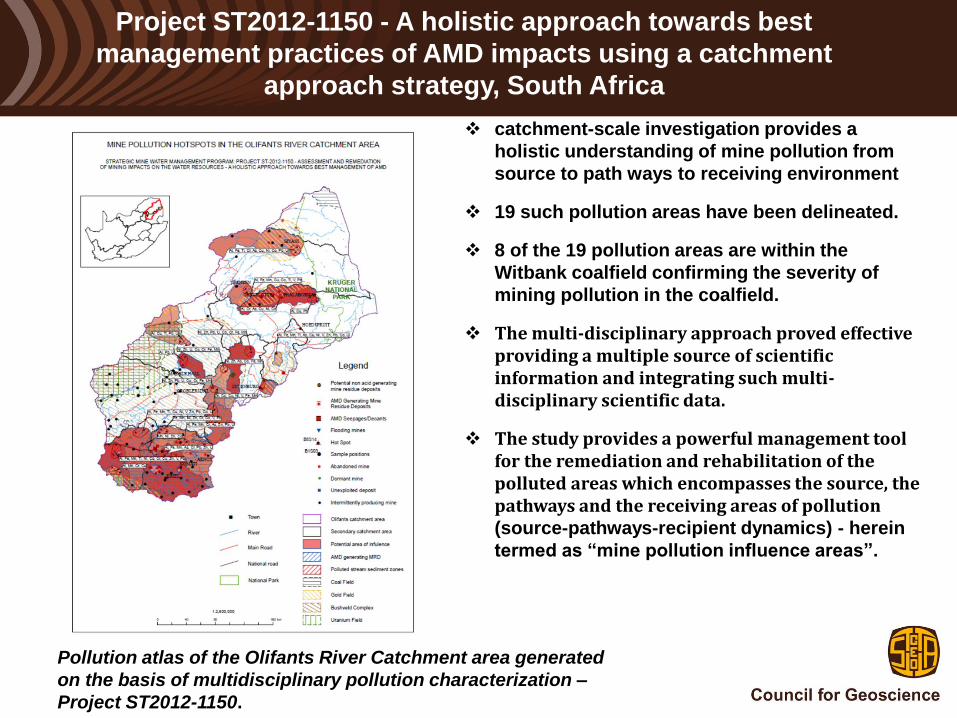
Pollution atlas of the Olifants River Catchment area generated
on the basis of multidisciplinary pollution characterization –
Project ST2012-1150.
catchment-scale investigation provides a
holistic understanding of mine pollution from
source to path ways to receiving environment
19 such pollution areas have been delineated.
8 of the 19 pollution areas are within the
Witbank coalfield confirming the severity of
mining pollution in the coalfield.
The multi-disciplinary approach proved effective providing a multiple source of scientific information and integrating such multi-disciplinary scientific data.
The study provides a powerful management tool for the remediation and rehabilitation of the polluted areas which encompasses the source, the pathways and the receiving areas of pollution (source-pathways-recipient dynamics) - herein
termed as “mine pollution influence areas”.
Project ST2012-1150 - A holistic approach towards best
management practices of AMD impacts using a catchment
approach strategy, South Africa

Project Objectives: Derelict and Ownerless Mines
The objectives of the project are to:
• Update, maintain and rank the database and to improve its integration into the licensing system of the DMR.
• The database should facilitate the estimation of the contingent liability of the DMR with respect to derelict and ownerless mines.
• Rehabilitation plans must be developed and bills of quantities on identified mine sites must be developed.
• A field investigation and database ranking must be undertaken to identify priorities on an ongoing basis.
• Dangerous openings must be closed where these pose an immediate threat to human safety.

Distribution of Asbestos mines in south Africa
The Northern Cape Province has the largest number of D & O asbestos
mines (127), Limpopo (77), Mpumalanga (28), KwaZulu-Natal (9),
Gauteng (3) and North West (1). The field visit was conducted to all the 6
Provinces.

Closure of dangerous holings
CONTRACTOR LOCALITIES OF
THE
HOLINGS
NO. OF
HOLES
CLOSED
LOCAL
LABOU
RERS
CONTRACTOR S
EMPLOYEE
S
TOTAL
LABOUR
PER
SUBPROJ
ECT
EURO BLITZ 1068
CC
CULLINAN 7 12 1 13
SEFAKO/KGANTS
A JV
BRAKPAN 9 15 12 27
ELPHASH &
SKIROO JV
GIYANI 7 20 5 25
TOTAL 23 47 18 65

Stimulation of Investment in the Minerals and Energy Sectors
Global Exploration Budgets

50
Responsibilities for mineral development
Information from Survey data pool
prospective terrain
90 priority areas
16 exploration targets
Classical sector of Geological Surveys
Classical sector of mining industry
Mining industry Geological Survey (many developing countries)
Geol. Survey Mining industry (many Industrialised countries)
1 feasible deposit
Expenditure path
Exploration path
With permission:
BGR

Project schedule
• The MTEF project “Exploration and Mining Investment Stimulation in Minerals and Energy Sectors” started in the budget year 2012/13 in Tugela region in Kwazulu Natal.

Project progress (Budget Year 2012/13)
From the Total budget of R30,000,000 allocated for the Tugela (KZN) project: • R15,815258 has been or will be used for airborne TEM + magnetics and
radiometrics surveys. – Magnetics and Radioimetric Surveys have been completed
– Airborne TEM is completed.
• R6,184,742 was utilised to gathered all the available historical geological data in the follwing geological terrains: Tugela, Namaqualand, Barberton Greenstone Belt and Sabi-Pilgrim’s Rest Goldfield. – This process was completed
• R8,000,000 is to be used for airborne soil sampling in Tugela from March -September 2013.
• Around 40% of the proposed sampling has been completed.

Expected interim deliverables – Tugela (KZN) project
The deliverables of this project include:
• An integrated report accompanied by mineral prospectivity map, to be completed by March 2014
– Geophysical report – to be completed by June 2013
– Geochemical report –to be completed February 2014.

Future activities and schedule timelines – Namaqualand
Project, Northern Cape Budget Year 2013/14
• Airborne magnetics and Radiometric and geochemical surveys will be conducted in the Namaqualand region.
• The total budget is R55,000,000.
– About R35,000,000 has been estimated to be used in Airborne magnetic and radiometric surveys, and
– R20,000,000 will be used for geochemical surveys.

International Front: Key Projects
• Organisation of African Geological Surveys (SA-Secretariat; Algeria - Presidency)
• Seismotectonic map of Africa with the Commission of the Geological Map of the World
• Onegeology – Geological map of the world
• AEGOS – Develop standard data by which geoscience data can be shared across the continent
• Madagascar – geological studies
• Namibia – geological mapping
• Japan – rare-earth elements research project
• EU – sustainable mining
• Sweden – prospectivity mapping
• Tanzania – geological/geochemical mapping


Build up to 35th IGC
• 19th IGC held in Algiers in 1952 – highlight was the Mediterranean field cruise
• A number of bids were made to hold a 2nd IGC in Africa and finally won by South Africa in 2008 in Oslo with the 35th IGC to be held in Cape Town in 2016
• South Africa was chosen both for its geological superlatives and as a stepping stone for the African continent
• Bid made it clear that the IGC should be a Pan African event
• Co-operation with African Surveys and other groups is therefore essential

Organization
• Local organizing committee formed (LOC) with subcommittees responsible for various functions
• Well defined branding “Dances with Earth” established
• Section 21 company formed
• PCO appointed
• Website established – www.35igc.org
• First official function – receiving the “World Cup” of Geology at 34th IGC in Brisbane
• Full support by Government - the DMR Minister Susan Shabangu addressed the delegates at the IGC34 Closing Function

35th IGC stand
at 34th IGC Expo

Human Capital

Human Resources
• Strategy anchored on the following pillars:
– Continue to transform the organisation
– Retaining skilled scientists
– Fast tracking the training of young scientists especially previously disadvantaged
– Training Programmes are:
• Bursaries (Part-time and fulltime)
• Internship Programme (In collaboration with MQA)
• Mentorship Programme
• Geological Mapping Field School

39%
61%
40%
60%
43%
57%
52%
48%
53%
47%
60%
40%
59%
41%
61%
39%
64%
36%
69%
31%
0%
10%
20%
30%
40%
50%
60%
70%
2004 2005 2006 2007 2008 2009 2010 2011 2012 2013
Black
White
Period – 2004 to 2013
Comparative Figures Staff Profile by Race

63%
37%
63%
37%
62%
38%
57%
43%
56%
44%
60%
40%
61%
39%
61%
39%
60%
40%
59%
41%
0%
10%
20%
30%
40%
50%
60%
70%
2004 2005 2006 2007 2008 2009 2010 2011 2012 2013
Male
Female
Period – 2004 to 2013
Comparative Figures Staff Profile by Gender

17%
83%
22%
78%
27%
73%
40%
60%
39%
61%
48%
52%
48%
52%49%
51%53%
47%
61%
39%
0%
10%
20%
30%
40%
50%
60%
70%
80%
90%
2004 2005 2006 2007 2008 2009 2010 2011 2012 2013
Black
White
Period – 2004 to 2013: Professionals only
Comparative Figures, Professional Job Category by Race

Number of Bursars - 2004 to 2013
14
27
34
30
41
39
29
22
8
16
0
5
10
15
20
25
30
35
40
45
2004 2005 2006 2007 2008 2009 2010 2011 2012 2013
No. Bursars
.
Bursary Intake Analysis

Geological Field School
Initiated in 2005, based
in Limpopo
Now a one-year modular
programme:
• CGS trainees full-time
for one year
•Introductory short
course
•In the process of
acquiring accreditation
from MQA

Thank You