Embed Size (px)
Citation preview

Could Co-products Give Corn and Soybean Meal a Run for Your Money?
Matt Oryschak and Eduardo BeltranenaAlberta Agriculture and Rural Development; Edmonton, AB

Monogastric Feed Research Group
Our mission:
To enhance the feed competitiveness of pig and poultry production in Alberta (and
Western Canada in general)

Our Approach
Developing information about novel/underutilized feedstuffs (e.g., legumes, bio-energy co-
products)Studying cost effective processing methods to improve nutritive value
of non-traditional feedstuffs
Studying effects of dietary inclusion of non-traditional
feedstuffs on performance and product quality

Faba beans
Field peas
Lentils
Lupin
Corn DDGS
Wheat DDGS
Canola meal
Camelina meal

Why I’m here (….I think)
Feedstuffs Truro, NS
Wheat 350Oats ‐Barley 399Corn 323Soybean Meal 48% 538Canola Meal 441Corn DDGS 360
Eggs (farm price, $/doz.) NSGrade A (Jumbo, XL, L) 2.13
Broilers (farm price, $/kg live wt) NS1.4 ‐ 2.7 kg (live) average 1.82
Edmonton, AB % Diff
288 ‐ 18%188 ???255 ‐ 36%316 ‐ 2%455 ‐ 15%315 ‐ 29%330 ‐ 8%
AB2.13 ‐
AB1.74 ‐ 5%
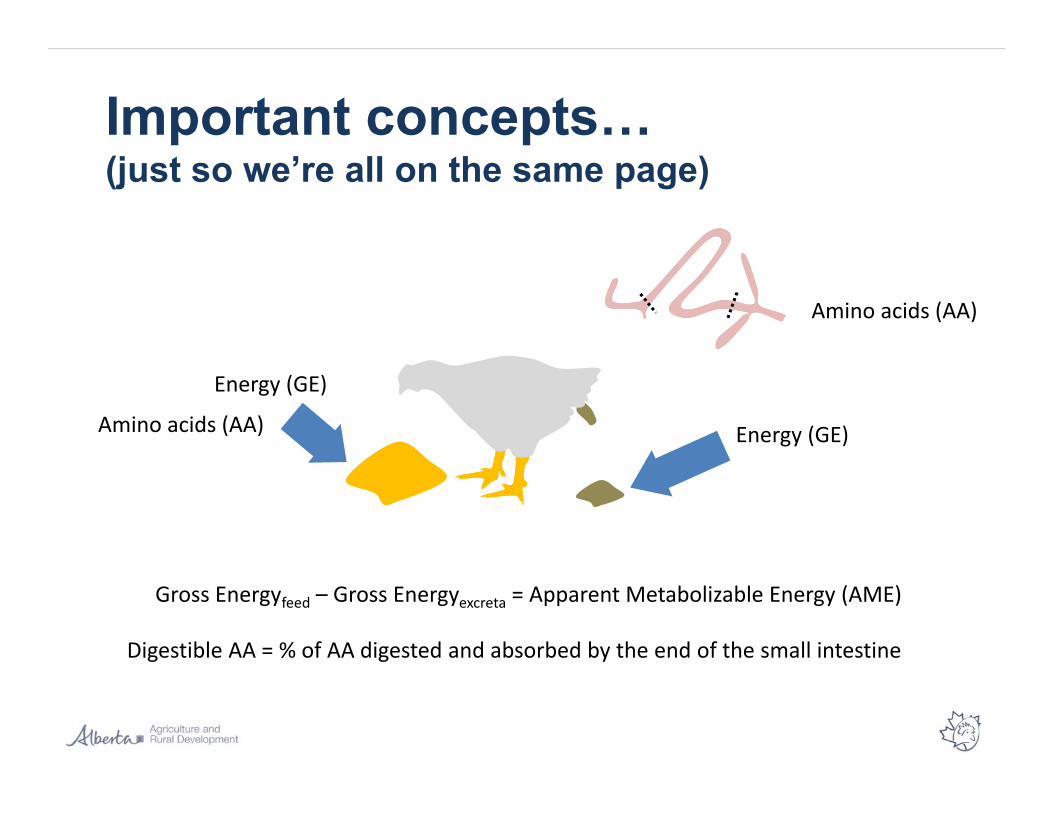
Important concepts…(just so we’re all on the same page)
Energy (GE)
Energy (GE)
Gross Energyfeed – Gross Energyexcreta = Apparent Metabolizable Energy (AME)
Amino acids (AA)
Amino acids (AA)
Digestible AA = % of AA digested and absorbed by the end of the small intestine
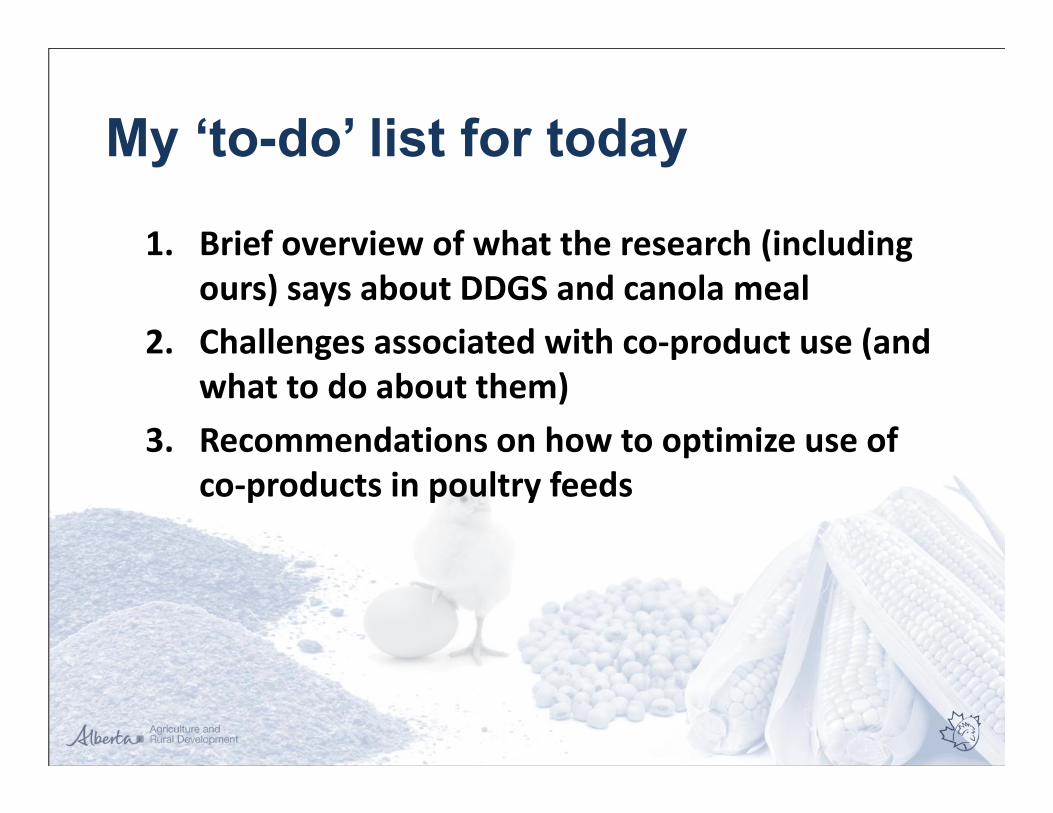
My ‘to-do’ list for today
1. Brief overview of what the research (including ours) says about DDGS and canola meal
2. Challenges associated with co‐product use (and what to do about them)
3. Recommendations on how to optimize use of co‐products in poultry feeds

Distiller’s Dried Grains with Solubles (DDGS)
PART 1

Figure 1. Grain-based ethanol-DDGS production flow chart

DDGS for Poultry: What the literature says…
• 100+ citations in the literature for corn DDGS– The most studied ingredient in the last 10 years
• Widely included in commercial US poultry rations (depending on availability)– Broilers 5 – 15%– Layers 5 – 10%– Turkeys 5 – 15%

DDGS for Poultry: What the literature says…
• ▲oil content = ▲ energy concentration• Lighter colour = ▲ AA digestibility• P and minerals are highly available (thank you yeast!!!)
• Wide variation in nutrient content between plants and regions– Greater quality control consistency within plant– More on this later…

Ethanol Production in NA & Canada
Corn (64.7%)
Wheat (35.2%)
Other (0.1%)
Corn (92%)
Wheat (1%)
Other (7%)

DDGS for Poultry: What our research says…
• AA digestibility coefficients in wheat and corn DDGS are similar
• Corn, wheat and triticale DDGS all respond positively to extrusion treatment
• Dry fractionation increases digestible nutrient density but not digestibility
• No negative effects of up to 10% inclusion of corn, wheat or triticale DDGS in wheat‐based broiler diets

Formulation matrix values for wheat and corn DDGS
Nutrient New GenerationCorn DDGS
New Generation Wheat DDGS
AME, kcal/kg
Crude Fat
Crude Protein
Calcium
Av. phosphorus
AID Arginine
AID Lysine
AID Methionine
AID Total Sulfur AA
AID Threonine
AID Tryptophan
2.94
10.08
26.45
0.07
0.48
0.93
0.50
0.43
0.85
0.72
0.18
2.22
4.06
39.40
0.13
0.44
1.31
0.60
0.47
1.41
0.35
1.02

CANOLA MEALPART 2

Location of crushing plants in Canada

Overview of Canola Crushing
from Canola Meal Feed Industry Guide

Feeding value of ‘modern’ canola meal
• The Canola Science Cluster (AAFC)– Joint initiative that is industry‐lead and supported by federal research funding
– Intent: to mobilize scientific/technical resources to support innovation and competitiveness in canola sector
• Includes meal nutrition theme– Mission: increase AME content in canola meal by 10%

from NRC, 1994
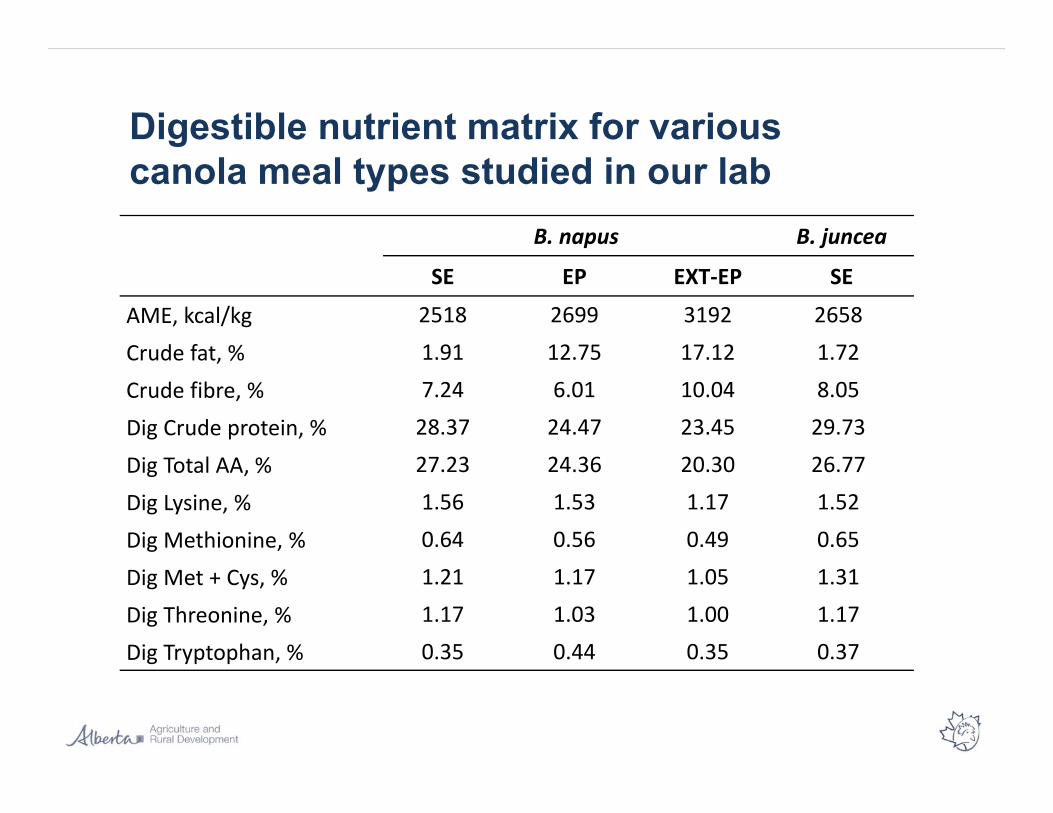
B. napus B. juncea
SE EP EXT‐EP SE
AME, kcal/kg
Crude fat, %
Crude fibre, %
Dig Crude protein, %
Dig Total AA, %
Dig Lysine, %
Dig Methionine, %
Dig Met + Cys, %
Dig Threonine, %
Dig Tryptophan, %
Digestible nutrient matrix for various canola meal types studied in our lab
2518
1.91
7.24
28.37
27.23
1.56
0.64
1.21
1.17
0.35
2699 3192
12.75 17.12
6.01 10.04
24.47 23.45
24.36 20.30
1.53 1.17
0.56 0.49
1.17 1.05
1.03 1.00
0.44 0.35
2658
1.72
8.05
29.73
26.77
1.52
0.65
1.31
1.17
0.37

Dietary inclusion level of CM, %
0%B. napus B. juncea
10% 20% 30% 10% 20% 30% StatsWt, d 35 2284 2236 2282 2269 2300 2312 2261 NS
ADG 61.9 60.7 62.0 61.7 62.5 62.9 61.4 NS
ADFI 106.8 107.1 106.7 107.3 107.5 107.9 108.4 NS
GF 0.614 0.607 0.625 0.616 0.621 0.614 0.606 NS
Carcass Wt, g 1518 1511 1514 1502 1512 1504 1499 NS
Dressing, % 0.697 0.694 0.695 0.690 0.694 0.689 0.687 NS
Net revenue,($/ bird marketed)
Performance of broilers fed diets containing graded inclusion levels of B. napus or B. juncea meal (d0 - 35)
2.73bc 2.66d 2.74bc 2.70cd 2.80ab 2.86a 2.74bcd ***

Challenges associated with use of co-products
PART 2
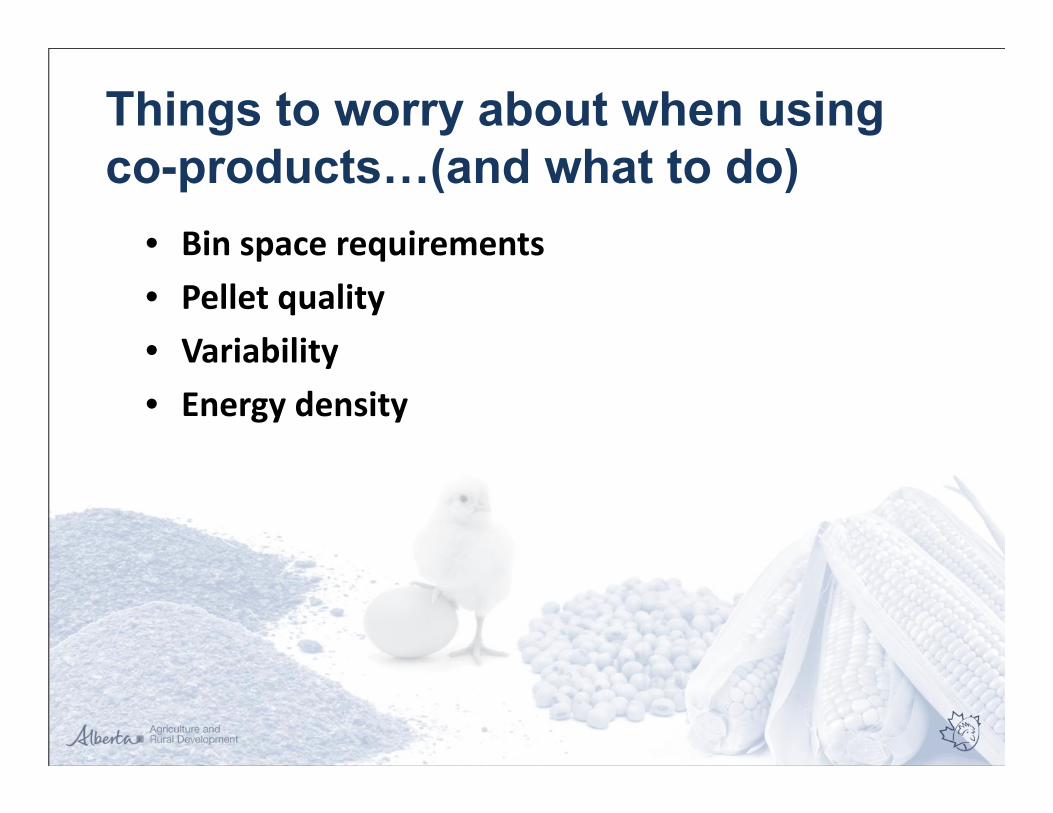
Things to worry about when using co-products…(and what to do)
• Bin space requirements• Pellet quality• Variability• Energy density

Bin space
• Increasing co‐product inclusion tends to reduce bulk density of the diet– Need more bin space per T of feed– Much more serious issue at feed mills

Bin spaceCorn‐SBM Corn‐SBM‐15%
Corn DDGSCorn‐SBM‐15%Canola meal
Corn 57.77 49.75 53.42
Soybean meal 35.27 28.53 23.93
Corn DDGS ‐ 15.00 ‐
Canola meal ‐ ‐ 15.00
Bulk density (kg/m3)
Space requirements (m3/T)664 641 633
1.51 1.56 1.58

Bin spaceUnprocessed Corn
DDGSPelleted‐Reground
Corn DDGS
Control 10% 20% 30% 10% 20% 30%
Mash BD (kg/m3) 57.99a 56.6bc 54.73d 53.22e 57.14ab 55.56cd 54.98d
Pellet BD (kg/m3) 62.43a 60.71bc 58.66de 57.87e 61.77ab 60.15bcd 59.84cd
from Farenholz, 2005

Pellet quality
• Limited info on effects of canola meal but problems with DDGS are well documented– Low‐starch, high oil in DDGS interferes with bonding– Less Dical required in co‐product diets (‘polishes’ die)
• Fibre content/type is problematic– Fibre doesn’t compress easily– Pelleter has to operate at higher power to push co‐product containing mixtures through

Pellet quality case studyPelleting temperature
Motor loadCSBM
From Lignotechfeed.com
PDI = 93
CSBM + 15% DDGS + 0.5% LS
PDI = 95
CSBM + 15% DDGS

Optimizing pellet quality when feeding co-products
• Proper conditioning helps– Target for 15‐16% moisture going into the pelleting chamber
• Pellet binders seem to make a big difference– Improves pellet durability and reduces load on the pelleter
– Lignosulfonate (by‐product of paper processing) seems to be effective with DDGS formulations

Variability in co-product feed quality
• Not really a big issue with modern solvent‐extracted canola meal
• Big issue with corn DDGS– Particularly with move toward fractionation prior to fermentation (variable oil and fibre content)
– Has big effect on AME content and therefore relative economic value

Variability in DDGS feed quality
OriginVeraSunEnergy
Corporation(Aurora, SD)
VeraSunEnergy
Corporation (Aurora, SD)
Ace Ethanol(Racine, WI)
Poet Biorefining
(Groton, SD)
Poet Biorefining
(Corning, IA)
Hawkeye Renewables
(Iowa Falls, IA)
Bulk density (kg/m3) 490 490 580 470 440 470Avg Particle size (µm) 579 480 1054 330 352 784Moisture 13.41 12.64 6.82 10.87 8.20 9.75Gross energy (kcal/kg) 5434 5076 5314 5547 5174 5375Crude protein 31.94 34.74 29.62 29.49 26.48 29.65Starch 6.24 3.04 7.85 4.94 3.30 3.47NDF 40.12 50.96 34.61 33.41 27.72 40.13Crude fat 10.16 3.15 11.45 11.71 11.52 10.89
AMEn, kcal/kg of DM = −30.19(NDF,% DM) + 0.81(GE, kcal/kg) − 12.26 (CP, % DM) R2= 0.87
AMEn, kcal/kg 2685 2146 2628 3098 2903 2593
Relative value 0.87 0.69 0.85 100 0.94 0.84

Coping with variability
• Contracted levels with supplier – Guaranteed min. fat and protein– Guaranteed max. moisture and fibre
• Wet chem testing random samples from random batches to ensure levels are being met– Penalty to supplier for non‐compliance– When coupled to NIRS technology saves big $$$ over long term (Alberta’s strategy)

Dietary energy density
• Breeding company recommendations suggest high nutrient density (e.g., C‐SBM)– Performance = Genetics + Environment + G x E– E.g., recommended AME content for broilers is 3.05, 3.15 and 3.2 Mcal/kg in starter, grower and finisher phases, respectively
• To achieve these densities, usually there is reliance on fat in the diet– Fat is the most expensive macroingredient in a feed (>$1000/T)

Dietary energy density
• The key to optimizing use of co‐products in poultry feeds actually lies in:– Formulating diets on a digestible nutrient basis– Formulating to lower energy density
• Ignore Feed Efficiency/Feed Conversion– Focus more on income over feed cost– Birds are biologically capable of compensating for lower energy density by increasing feed intake

Feed cost scenario exercises
• Conservative approach– Finisher phase only– Co‐product inclusion capped at 15% max.
• Assumptions:– CFC production stats for NS, NB and PEI in 2012– 55% of market weight gained during finisher period – 5 Mcal/kg of liveweight gain (> 14 d of age)– Ingredient costs = actual feed costs in Truro in mid Jan– $30/T margin added to all formula costs

Target AME density in finisher formula, Mcal AME/kg
Ingredient, % of formula 3.20 3.15 3.10 3.05 3.00Corn 55.4 56.58 57.77 58.96 60.14Soybean meal 35.68 35.48 35.27 35.07 34.86Canola oil 4.72 3.8 2.88 1.96 1.05Methionine 0.28 0.27 0.27 0.27 0.26Limestone 1.27 1.24 1.22 1.19 1.16Dical 1.16 1.12 1.09 1.06 1.03Other stuff 1.5 1.5 1.5 1.5 1.5
Feed cost, $/Tonne 485.16 477.34 469.52 461.70 453.88Feed Conversion, kg feed: kg gain 1.563 1.587 1.613 1.639 1.667Cost of gain, $/kg liveweight 0.758 0.758 0.757 0.757 0.756
Estimated Feed Cost, $/producer/yrNew Brunswick $406,319 $406,117 $405,908 $405,693 $405,470Nova Scotia $214,531 $214,424 $214,314 $214,200 $214,082PEI $241,063 $240,943 $240,819 $240,691 $240,559
Net Savings, $/producer/yrNew Brunswick 0 $202.33 $411.10 $626.72 $849.53Nova Scotia 0 $106.83 $217.06 $330.90 $448.54PEI 0 $120.04 $243.90 $371.82 $504.01
Scenario 1: The effect of lowering target AME density in finisher phase (d 25‐market) using exclusively corn‐SBM formulation
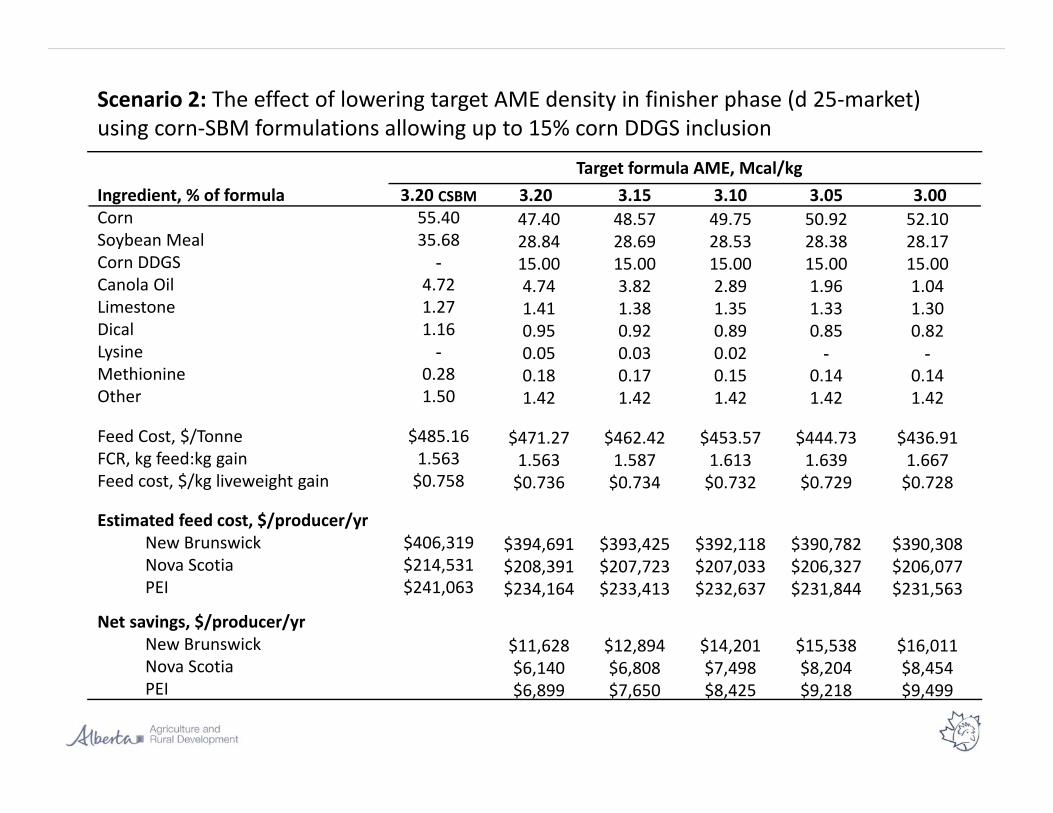
Scenario 2: The effect of lowering target AME density in finisher phase (d 25‐market) using corn‐SBM formulations allowing up to 15% corn DDGS inclusion
Target formula AME, Mcal/kgIngredient, % of formula 3.20 CSBM 3.20 3.15 3.10 3.05 3.00Corn 55.40Soybean Meal 35.68Corn DDGS -Canola Oil 4.72Limestone 1.27Dical 1.16Lysine -Methionine 0.28Other 1.50
Feed Cost, $/Tonne $485.16FCR, kg feed:kg gain 1.563Feed cost, $/kg liveweight gain $0.758
Estimated feed cost, $/producer/yrNew Brunswick $406,319Nova Scotia $214,531PEI $241,063
Net savings, $/producer/yrNew BrunswickNova ScotiaPEI
47.4028.8415.004.741.410.950.050.181.42
$471.271.563$0.736
$394,691$208,391$234,164
$11,628$6,140$6,899
48.5728.6915.003.821.380.920.030.171.42
$462.421.587$0.734
$393,425$207,723$233,413
$12,894$6,808$7,650
49.7528.5315.002.891.350.890.020.151.42
$453.571.613$0.732
$392,118$207,033$232,637
$14,201$7,498$8,425
50.9228.3815.001.961.330.85
-0.141.42
$444.731.639$0.729
$390,782$206,327$231,844
$15,538$8,204$9,218
52.1028.1715.001.041.300.82
-0.141.42
$436.911.667$0.728
$390,308$206,077$231,563
$16,011$8,454$9,499

Scenario 3: The effect of lowering target AME density in finisher phase (d 25‐market) using corn‐SBM formulations allowing up to 15% canola meal inclusion
Target formula AME, Mcal/kg
Ingredient, % of formula 3.20 CSBM 3.20 3.15 3.10 3.05 3.00Corn 55.40Soybean Meal 35.68Canola MealCanola Oil 4.72Limestone 1.27Dical 1.16Methionine 0.28Other 1.50
Feed Cost, $/Tonne $485.16FCR, kg feed:kg gain 1.563Feed cost, $/kg liveweight gain $0.758
Estimated Feed Cost, $/producer/yrNew Brunswick $406,319Nova Scotia $214,531PEI $241,063
Net Savings, $/producer/yrNew BrunswickNova ScotiaPEI
54.2532.664.005.001.241.130.251.48
$483.751.563$0.756
$405,141$213,908$240,363
$1,179$622$699
52.5224.8814.014.791.131.050.171.45
$472.681.587$0.750
$402,152$212,330$238,590
$4,168$2,201$2,473
53.4223.9315.003.941.101.010.161.44
$464.541.613$0.749
$401,604$212,041$238,265
$4,715$2,489$2,797
54.6123.7215.003.021.070.980.151.44
$456.721.639$0.749
$401,316$211,889$238,094
$5,003$2,642$2,968
55.7923.5215.002.111.040.950.151.44
$448.901.667$0.748
$401,018$211,731$237,917
$5,301$2,799$3,145

Summary of cost exercises
Target AME, Mcal/kg
Province/scenario 3.20 3.15 3.10 3.05 3.00
New BrunswickCorn‐SBM - $202 $411 $627 $850Corn‐SBM‐15% max DDGS $11,628 $12,894 $14,201 $15,538 $16,011Corn‐SBM‐15% max CM $1,179 $4,168 $4,715 $5,003 $5,301
Nova ScotiaCorn‐SBM - $107 $217 $331 $449Corn‐SBM‐15% max DDGS $6,140 $6,808 $7,498 $8,204 $8,454Corn‐SBM‐15% max CM $622 $2,201 $2,489 $2,642 $2,799
PEICorn‐SBM - $120 $244 $372 $504Corn‐SBM‐15% max DDGS $6,899 $7,650 $8,425 $9,218 $9,499Corn‐SBM‐15% max CM $699 $2,473 $2,797 $2,968 $3,145
Annual finisher phase feed cost savings, $/average producer/yr

Are there risks to reducing AME density in diets?
• Genetically, modern poultry lines have the ability to adjust intake based on energy density– Practical constraining factors are environmental
• Expect negative impacts on performance if birds are overcrowded– If dropping energy density in diets, stay towards lower end of CFC recommended density guidelines (31 kg/m2)
– Gap in the literature: importance of feeder space at different stocking densities

Take-away messages
• Co‐products have come a long way– Modern stocks are greatly improved thanks to better QC by producers
• Both DDGS and CM are high quality feeds for poultry backed up by considerable research– Corn DDGS = proportionately displaces corn and SBM– Canola meal = displaces SBM only

Take-away messages
• There are challenges to using co‐products but these are for the most part manageable– Variability in DDGS feed quality is of principal concern
• Big opportunity for cost savings– Savings will depend on prices of DDGS, canola meal in relation to corn/SBM
– Dropping energy density in diets is key to optimizing cost savings

Acknowledgements• APC 2013 organizing committee• Claire Hanlon‐Smith (NS Ag)• Alex Oderkirk (Perennia)
Supporters of our research program
Feed Opportunitiesfrom Biofuels Initiative
FOBI