Embed Size (px)
Citation preview
1
Costs in the Norwegian Payment System
Olaf Gresvik and Harald Haare1
Payment Systems Department, Norges Bank
Staff Memo No. 4/2009
Norges Bank
Oslo, May 14th 2009
Abstract
We calculate social and private cost for the use and production of payment services in
Norway for 2007. The calculations include banks’, merchants’ and households’ cost for cash,
cards and giro payments. The social cost is calculated to be 0.49 % of GDP, or NOK 11.16
billion. Costs are also calculated on a per-service basis. The results are compared with data
from earlier cost surveys by Norges Bank. The unit costs of the most popular services have
decreased over the years. Efficiency and productivity of banks’ payment service operations
has improved. We also make comparisons between frameworks, methodologies, and results
from cost surveys in five European countries.
Keywords: Cash payments, Card payments, Giro payments, Social costs, Private costs, Unit
costs, Banks’ efficiency.
JEL classifications: D 12, D 23, D 24
1 The authors would like to thank Leif Veggum, Sigbjørn Atle Berg, Gunnvald Grønvik, Asbjørn Enge and Knut
Sandal at Norges Bank for comments to the memo and drawing on their valuable knowledge. The views expressed in this memo are ours and does not necessarily reflect those of Norges Bank. All remaining errors are our own.
2
Contents
Foreword .................................................................................................................................... 3
1 Introduction ........................................................................................................................ 4
2 Social cost ............................................................................................................................ 7
3 Transactions at point-of-sale - two approaches ............................................................... 20
4 Costs in banks in Norway: 2007 and development over time .......................................... 28
5 Costs at merchants in 2007 ............................................................................................... 43
6 Household costs in 2007 ................................................................................................... 49
7 Cost surveys compared ..................................................................................................... 56
8 Conclusion ......................................................................................................................... 64
References ................................................................................................................................ 66
Appendixes ............................................................................................................................... 70
Appendix to chapter 2 Social cost ......................................................................................... 70
Appendix to Chapter 4 Costs in banks ................................................................................... 81
Appendix to Chapter 5 Costs at merchants ........................................................................... 90
Appendix to Chapter 6 Household costs ............................................................................... 96
3
Foreword
This is the fourth study Norges Bank has conducted on costs in the payment system.
Conducting cost studies is one of several approaches to understand and analyse the
efficiency in the payment system. As stated in section 1 of the Central Bank Act (1985):
“Norges Bank (…) shall (…) promote an efficient payment system domestically as well as vis-
à-vis other countries (…)”
The 2007 cost study was initiated in 2006, and the results were published in 2008 and 2009.
The analysis was initiated by Norges Bank, (the Payment Systems Department and supported
by the Governor), mainly conducted by two economists in the Payment Systems Department
with support from the Cashier's Department. The analysis has been conducted using
approximately two and a half man-years / full time equivalents in the Central Bank.
The study has benefited greatly from the support offered by banks’ and merchants’
associations. The Norwegian Financial Services Association (FNH) and The Norwegian Savings
Banks Association (Sparebankforeningen) shared information of their cash survey
questionnaire, which were embedded in the bank survey (see chapter 4). 12 banks
responded to the bank survey.2 The federation of Norwegian commercial and service
enterprises (HSH) and the Norwegian Hospitality Association (NHO Reiseliv) offered help in
developing and conducting the merchant survey (see chapter 5). The Household survey was
conducted by Norges Bank using a market analysis company (Norstat AS).
2 These were: Andebu Sparebank, Halden Sparebank 1, Larvikbanken Brunlanes Sparebank, Sparebanken Vest,
Sparebanken Øst, Sparebank 1 Midt-Norge, Sparebank 1 Vestfold, DnB NOR Bank ASA, Skandiabanken AB, Sparebanken Pluss, Fokus Bank ASA and Handelsbanken filial Norge. Unfortunately only one (of the two major) card acquirers responded: Elavon Merchant Services. Due to anonymity reasons, their data is not published.

4
1 Introduction
Scope, purpose and background
To our knowledge, the Norwegian Cost Study 2007 has a more comprehensive scope3 than
any cost survey on payments conducted so far. The analysis includes all participants in the
payment chain; banks and their subcontractors, merchants and households. The costs of
cash-, cards- and giro-services are calculated. The study shows that modern and efficient
payment services are produced at a low cost.
The purpose of this analysis is to assess total costs of payments in Norway in 2007 and look
at the development over time.
The 2007 survey is a follow up of previous studies,
the latest one in 2001. We analyse the cost
developments in the period 2001-2007. We also
make comparisons with recent cost surveys
conducted in other countries. The scopes of these
surveys are not identical and the methodologies
and payment systems differ. One should therefore
be cautious when comparing the results.
The Norwegian 2007-survey covers social costs as
well as private costs for the different agents and
instruments. We calculate unit costs for a range of
payment instruments. We also show some
indicators of development of banks’ productivity
and efficiency since 1988.
Information used in the analysis is obtained from three surveys; on banks, merchants and
households respectively. Information from Norges Banks’ Annual Report of Payment
Systems 2007 and general information from Statistics Norway are also used.
3 “Scope” is the number of agents and instruments which are included in the survey. The instruments and
agents not included in the scope are: cheque, e-money, interbank transfers and cross-border payments and the cost of billing institutions.
Related documents:
There are several related documents to the cost study. All can be found on Norges Banks website:
Staff memo 5/2009: “Costs in the Norwegian Payment system: Questionnaires”
Economic Bulletin 1/2009: “Costs in the payment system”, (a short text on the analysis) also in Norwegian: Penger og Kreditt 1/2009: “Kostnader i betalingssystemet”
Staff Memo 6/2008: “Payment habits at point of sale. Different methods of calculating use of cards and cash in Norway”
5
We would like to add that public’s payment instrument preferences are not based on costs
alone, but on a range of practical considerations.
Results
The social cost of the Norwegian payment system is calculated to be 0.49 % of GDP, or NOK
11.16 billion, producing 1.8 billion payments in 2007.
Social costs calculated on the basis of production costs and user costs. In Norway the
production costs, mainly costs in banks and at banks’ subcontractors, account for about 2/3
of social cost. When distributing social cost on cash, cards and giro we find that card
payments accounts for about half the costs.
In the analysis cash use is estimated to be about 14 % of the value and 24 % of the number
of transactions at point of sale. This is low compared to other countries. In spite of this, cash
represents 31 % of social costs.
For many years, prices on payment services in Norway have reflected relative differences in
the costs. This has contributed to the phasing out of manual/paper-based services. In 2007
96 % of non-cash payments were electronically processed in Norway.
Calculation of unit costs per payment for the 26 most important services in Norway show
that high-volume, electronic services have the lowest unit costs. The banks’ cost for such
services has been reduced since 2001.
Banks’ efficiency/productivity and their cost recovery have improved over time. Banks’ costs
have been reduced since 1988, while the number of transactions has quadrupled. The cost
recovery is the highest recorded in these cost surveys.
Contents of the Memo
In chapter 2 calculations of the social costs are described. Costs are distributed on the
different agents and on the different main groups of payment instruments. Chapter 3 show
estimates on the number of cash payments. In chapter 4 we calculate costs in banks and
look at developments over time. We proceed by estimating merchants’ costs in chapter 5,
and in chapter 6 the households’ costs. In chapter 7 we reproduce information from surveys

6
carried out in four countries, and compare them to our own study on scope, methodology,
results etc. We conclude in chapter 8 looking at some experiences gained and some
thoughts about future surveys.
Details on the methodology and framework used in chapters 2 to 6 are found in the
appendixes. The spreadsheets and questionnaires used are published in a separate Staff
Memo, No Y 2009.

7
2 Social cost
What is social cost?
Social costs are “the total costs to the society reflecting the real use of resources in the
production of the industry’s output”4. A useful approach to illustrate where the costs occur
is to describe the payments process as a supply chain, the payment chain. In the payment
chain, the agents have different tasks in producing or using the payment services. All agents
carry costs, generated by their own activity (own production costs) and by the costs incurred
through fees etc paid to other agents in the chain. For example, the banks use
subcontractors to produce many payment services.
4 Bergman et al 2007, p. 4 Note that we assume negative externalities from payments to be marginal or nil; and they are therefore ignored in the calculations. Positive externalities exists in payment systems (for example network externalities in card systems), but as the positive externalities would count as benefits, they are outside the scope of the analysis.

8
Offering payment services to customers (payers / payees) spur a range of activities that
generate costs in the banks (own production costs). Also, the delivery of payment services
from the subcontractor is paid for by the banks (subcontractor costs). The own production
cost at subcontractors is the income from their customers (banks) less profit. The sum of
own production costs at each agent in the payment chain is the social cost.
The agents in the payment chain are banks, the central bank, merchants, subcontractors and
households. In this chapter we calculate the social cost for these agents. Further details on
calculations for each agent are found in chapters 3, 4 and 5 and the appendixes to these
chapters.
Methodology
To analyse the costs of the payment system it is important to have a clear distinction
between private and social cost. Private cost is an agent’s total costs. Private cost consists of
own production cost and fees paid, e.g. banks fees to subcontractors and households
payment of bank fees for payment services. Social cost is the total costs for all agents in a
payment chain, when the value of deliveries / fees between the different agents is deducted.
Deliveries are costs for the receiving agent and income to the delivering agent. In illustration
2 the cost elements in the payment chain is shown. The regular arrows (marked “SC”)
represent cost of deliveries. The bold arrows (marked “OPC”) represent the own production
cost for each agent. The sum of own production cost across the payment chain is the social
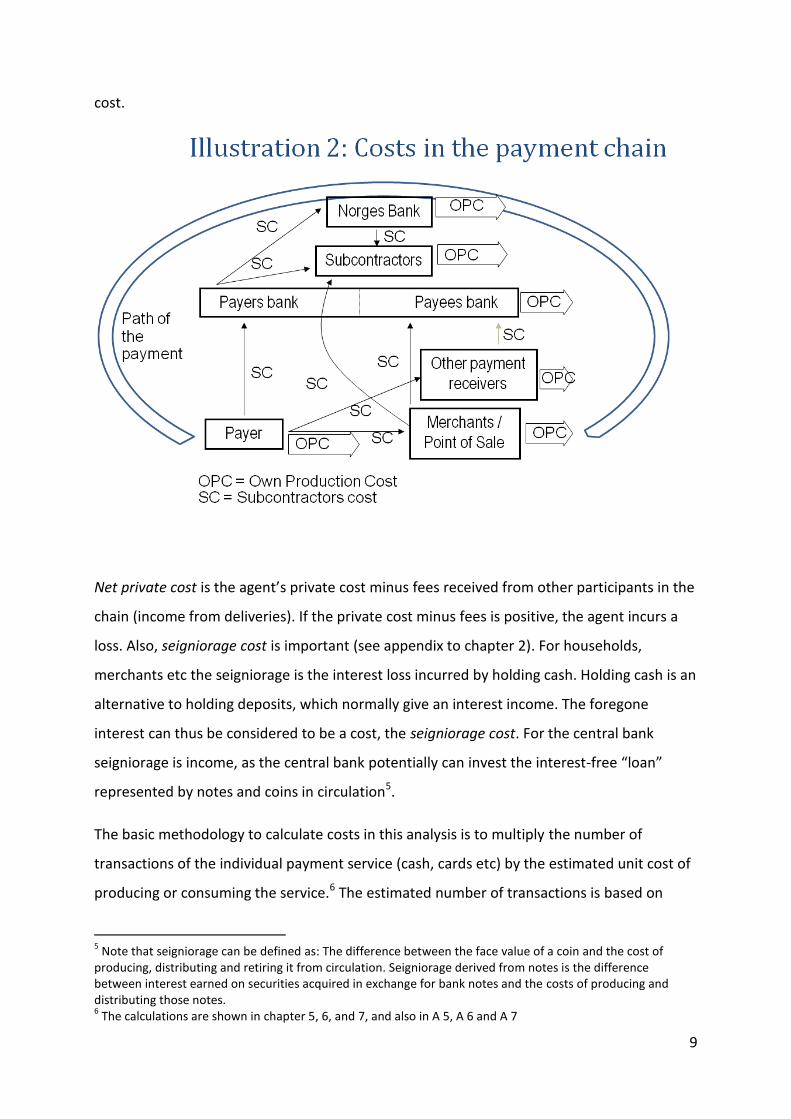
9
cost.
Net private cost is the agent’s private cost minus fees received from other participants in the
chain (income from deliveries). If the private cost minus fees is positive, the agent incurs a
loss. Also, seigniorage cost is important (see appendix to chapter 2). For households,
merchants etc the seigniorage is the interest loss incurred by holding cash. Holding cash is an
alternative to holding deposits, which normally give an interest income. The foregone
interest can thus be considered to be a cost, the seigniorage cost. For the central bank
seigniorage is income, as the central bank potentially can invest the interest-free “loan”
represented by notes and coins in circulation5.
The basic methodology to calculate costs in this analysis is to multiply the number of
transactions of the individual payment service (cash, cards etc) by the estimated unit cost of
producing or consuming the service.6 The estimated number of transactions is based on
5 Note that seigniorage can be defined as: The difference between the face value of a coin and the cost of
producing, distributing and retiring it from circulation. Seigniorage derived from notes is the difference between interest earned on securities acquired in exchange for bank notes and the costs of producing and distributing those notes. 6 The calculations are shown in chapter 5, 6, and 7, and also in A 5, A 6 and A 7

10
information from domestic payment statistics from Norges Bank for card payments, cash
withdrawals and deposits and for giro payments. The number of cash payments is based on
information calculated from the household survey in combination with domestic statistics7.
The number of transactions in Norway 2007 is shown in the Table 18.
Which costs are relevant for the analysis?
There are several approaches to calculating social costs. Traditionally, calculating marginal
costs (and marginal prices) is a widely used approach to calculating social costs. However, it
is difficult to find the necessary information to calculate marginal values. Marginal cost
calculations exclude overhead cost, which is an important element in the payment services
production environment. Furthermore, marginal cost analysis cannot take into account
major shifts in the use of different services over time. In our opinion, a full-cost study is
more suitable and easier to conduct.
The method for calculating private costs of each of the agents is developed in Norges Bank,
but partly inspired by the studies in Sweden, Belgium and the Netherlands.
There is no clear-cut answer to which costs should be relevant in a social cost analysis. In our
opinion, all direct production or user costs should be included. When it comes to the indirect
production costs, questions might arise. For instance, it is often not obvious how to allocate
indirect costs in a bank between payment operations and other activities in a bank. Likewise,
and perhaps even more difficult, is the question of allocating overhead costs between the
different payment instruments. Our choice has been to leave this decision to the individual
7 See appendix chapter 6 for details
8 Rounding errors may occur in tables.
Table 1: Number of transactions at point of sale in Norway, 2007. Source: household survey and Norges Banks’ Annual Report on Payment Systems
Base: residents Transactions Value
Million transactions
Per cent NOK billion Per cent
Point of sale total 1209.0 100.0 % 432.1 100.0 % Cash use 285.0 23.6 % 62.1 14.4 % Card use total 924.0 76.4 % 370.0 85.6 % BankAxept 805.3 66.6 % 298.1 69.0% Petrol companies cards 21.6 1.8 % 10.8 2.5% Visa, MasterCard, American Express and Diners Club 97.1 8.0% 61.0 14.1 %

11
bank, but guide them to distribute some specific overhead costs to the payments. All banks
followed our advice, and the bank survey thus might show a higher cost level than other
approaches, where overhead costs are omitted.
We assume that the time cost of the payment operation in an outlet is the time spent from
the till operator has registered all items until the receipt is handed over to the customer. The
registering of the goods is not a part of the process that generates costs for payments. This
registration is relevant for the accounting procedures of the outlet.
It can be argued that households’ costs of holding cash should not be a part of the social cost
and we have chosen to exclude the seigniorage cost in the social cost calculation. However,
we have made the relevant calculation, and shown the results in the relevant chapters.
It may also be debated to what extent the costs for the infrastructure, for instance
household’s PC equipment, broadband lines, postal services costs, even roads and bridges,
should be included. In principle it should perhaps be included, as payments need the
infrastructure to be carried out. We have chosen not to include such costs, as the
infrastructure serves several purposes and not mainly payment operations.
The costs in this analysis cover what we consider to be all relevant costs, except bill
receiver’s bill issuing costs. There is uncertainty of the size of some of the costs, and we have
had to make assumptions to calculate other costs. Despite these limitations, this analysis is
probably the most extensive analysis of costs in the payment system that has ever been
performed.
Data sources
The calculations in this chapter are based on data from different sources:
Surveys carried out by Norges Bank (banks, households and merchants)
Norges Banks’ Annual Report on Payment Systems 2007
Statistics Norway (demography, salaries etc)
Other sources (for instance: time estimates used in other countries)
The surveys are the primary source of information to calculate unit costs for banks and
merchants. The household survey, combined with statistical information from Norges Bank

12
provide an estimate of the use of cash, cards and giros in Norway (see Gresvik and Haare,
2008).
The choice of sources of information and a discussion of the data quality is elaborated in the
appendixes.
13
Results
Costs and income
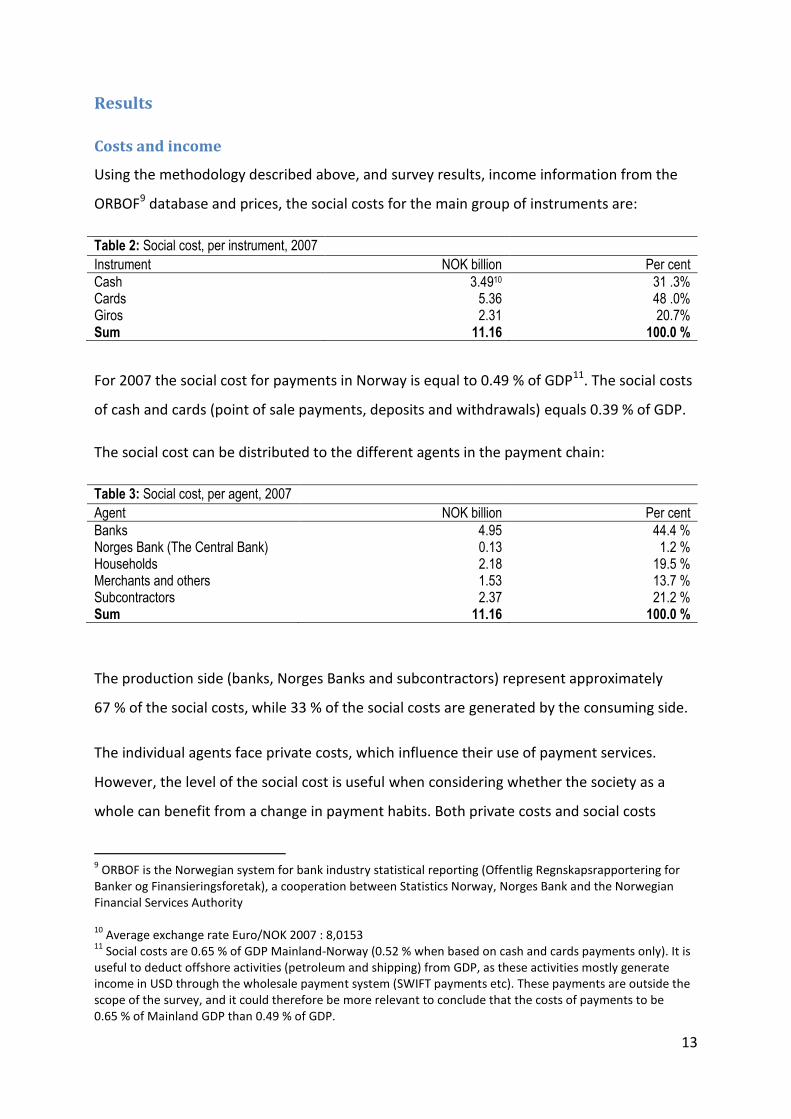
Using the methodology described above, and survey results, income information from the
ORBOF9 database and prices, the social costs for the main group of instruments are:
Table 2: Social cost, per instrument, 2007 Instrument NOK billion Per cent Cash 3.4910 31 .3% Cards 5.36 48 .0% Giros 2.31 20.7% Sum 11.16 100.0 %
For 2007 the social cost for payments in Norway is equal to 0.49 % of GDP11. The social costs
of cash and cards (point of sale payments, deposits and withdrawals) equals 0.39 % of GDP.
The social cost can be distributed to the different agents in the payment chain:
Table 3: Social cost, per agent, 2007 Agent NOK billion Per cent Banks 4.95 44.4 % Norges Bank (The Central Bank) 0.13 1.2 % Households 2.18 19.5 % Merchants and others 1.53 13.7 % Subcontractors 2.37 21.2 % Sum 11.16 100.0 %
The production side (banks, Norges Banks and subcontractors) represent approximately
67 % of the social costs, while 33 % of the social costs are generated by the consuming side.
The individual agents face private costs, which influence their use of payment services.
However, the level of the social cost is useful when considering whether the society as a
whole can benefit from a change in payment habits. Both private costs and social costs
9 ORBOF is the Norwegian system for bank industry statistical reporting (Offentlig Regnskapsrapportering for
Banker og Finansieringsforetak), a cooperation between Statistics Norway, Norges Bank and the Norwegian Financial Services Authority 10
Average exchange rate Euro/NOK 2007 : 8,0153 11
Social costs are 0.65 % of GDP Mainland-Norway (0.52 % when based on cash and cards payments only). It is useful to deduct offshore activities (petroleum and shipping) from GDP, as these activities mostly generate income in USD through the wholesale payment system (SWIFT payments etc). These payments are outside the scope of the survey, and it could therefore be more relevant to conclude that the costs of payments to be 0.65 % of Mainland GDP than 0.49 % of GDP.

14
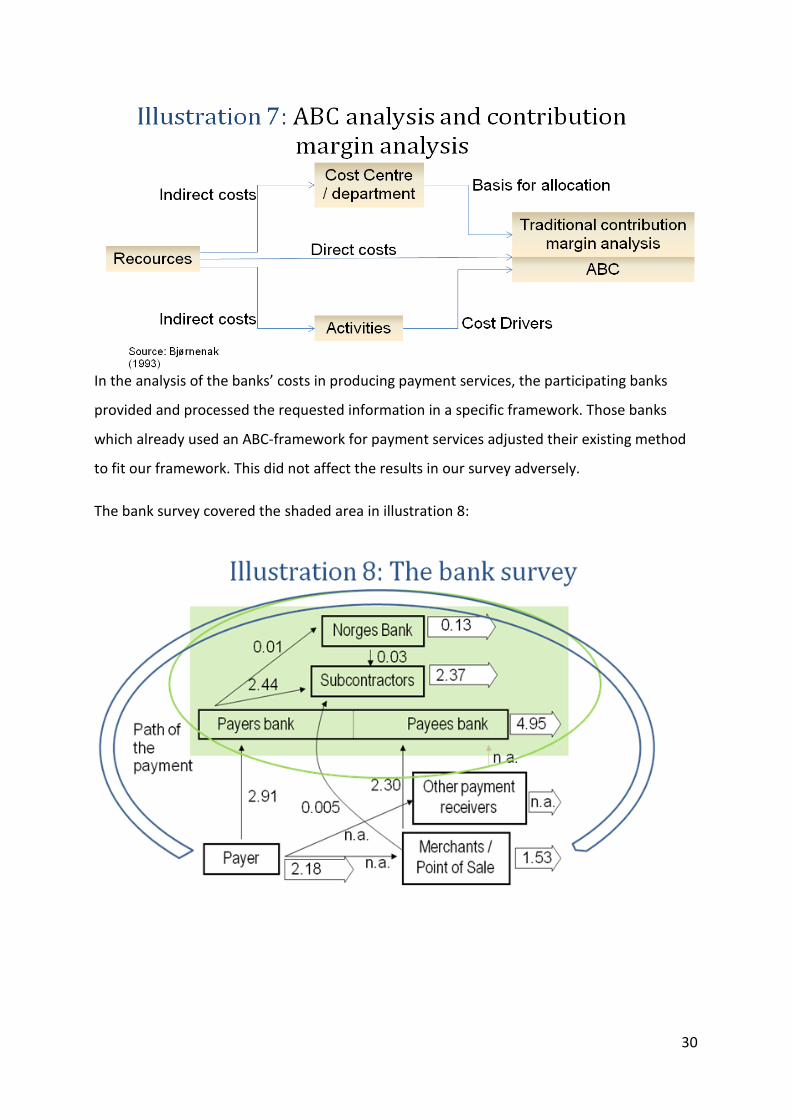
should therefore be evaluated simultaneously, see illustration 3. For instance, households’
private costs of paying is NOK 2.18 + 2.91 = NOK 5.09 billion. Similarly, the merchants and
others pay NOK 1.53 + 2.30 + 0.005 = NOK 3.84 billion. The total private cost of all
participants amounts to NOK 18.8 billion. The green areas indicate which agents this
analysis cover.
The calculation of social costs can be shown per instrument and per group of agents. In
tables 4, 5 and 6 below, own production cost of agents and fees paid/received are shown.
The tables also show private cost and net private costs. A negative value shows a surplus to
the participant, while a positive value shows that the participant carries a net private cost.
Social costs are the sum of own production costs and are indicated in bold figures in the
tables.
Table 4: Cash (payments, deposits and withdrawals)
NOK millions Private cost Fees paid Own production cost Fees received Net Private costs
Subcontractors 485.7 0.0 485.7 506.0 -20.2
Norges Bank 154.9 27.3 127.6 6.2 148.7
Banks 2194.6 479.6 1715.0 592.7 1602.0
Households 1440.7 592.7 848.1 0.0 1440.7 Merchants and other businesses 322.1 5.2 316.9 0.0 322.1
Sum 4598.1 1104.8 3493.3 1104.8 3493.3
Social cost
3493.3
15
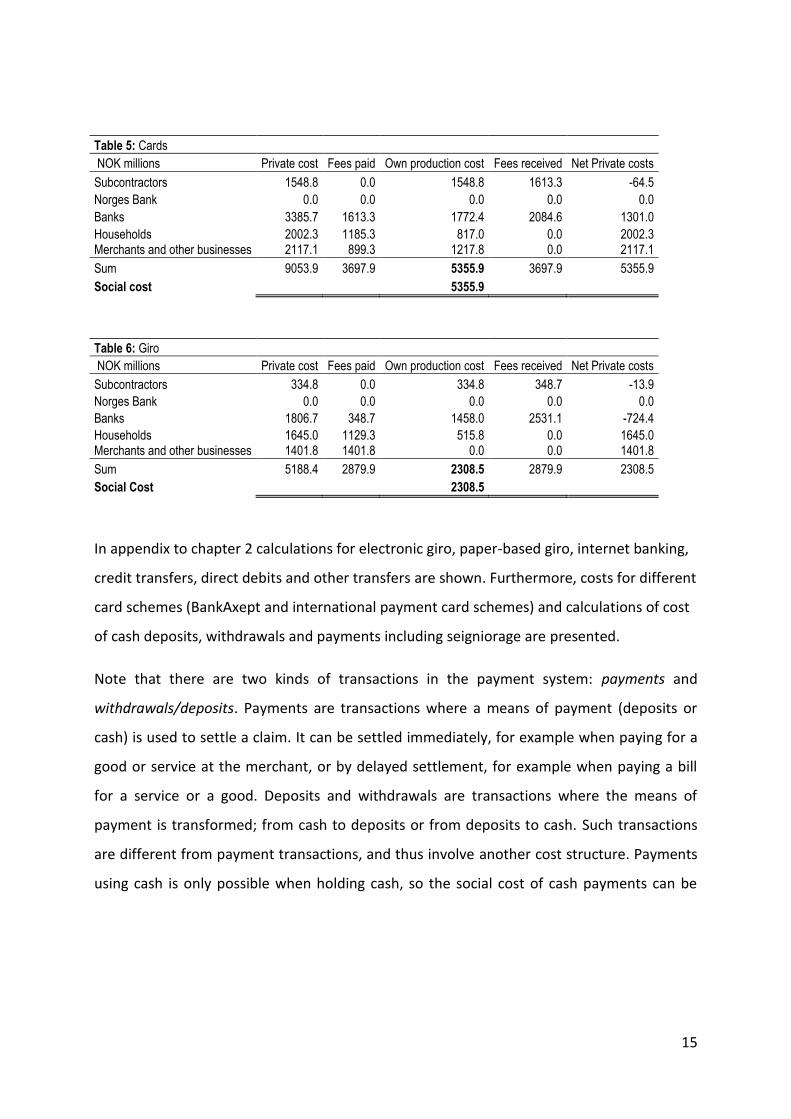
Table 5: Cards NOK millions Private cost Fees paid Own production cost Fees received Net Private costs
Subcontractors 1548.8 0.0 1548.8 1613.3 -64.5
Norges Bank 0.0 0.0 0.0 0.0 0.0
Banks 3385.7 1613.3 1772.4 2084.6 1301.0
Households 2002.3 1185.3 817.0 0.0 2002.3 Merchants and other businesses 2117.1 899.3 1217.8 0.0 2117.1
Sum 9053.9 3697.9 5355.9 3697.9 5355.9
Social cost
5355.9
Table 6: Giro NOK millions Private cost Fees paid Own production cost Fees received Net Private costs
Subcontractors 334.8 0.0 334.8 348.7 -13.9 Norges Bank 0.0 0.0 0.0 0.0 0.0 Banks 1806.7 348.7 1458.0 2531.1 -724.4 Households 1645.0 1129.3 515.8 0.0 1645.0 Merchants and other businesses 1401.8 1401.8 0.0 0.0 1401.8 Sum 5188.4 2879.9 2308.5 2879.9 2308.5 Social Cost
2308.5
In appendix to chapter 2 calculations for electronic giro, paper-based giro, internet banking,
credit transfers, direct debits and other transfers are shown. Furthermore, costs for different
card schemes (BankAxept and international payment card schemes) and calculations of cost
of cash deposits, withdrawals and payments including seigniorage are presented.
Note that there are two kinds of transactions in the payment system: payments and
withdrawals/deposits. Payments are transactions where a means of payment (deposits or
cash) is used to settle a claim. It can be settled immediately, for example when paying for a
good or service at the merchant, or by delayed settlement, for example when paying a bill
for a service or a good. Deposits and withdrawals are transactions where the means of
payment is transformed; from cash to deposits or from deposits to cash. Such transactions
are different from payment transactions, and thus involve another cost structure. Payments
using cash is only possible when holding cash, so the social cost of cash payments can be
16
considered to be the sum of the cost of paying, depositing and withdrawing cash12. Still, it is
useful to show the cost of each element.
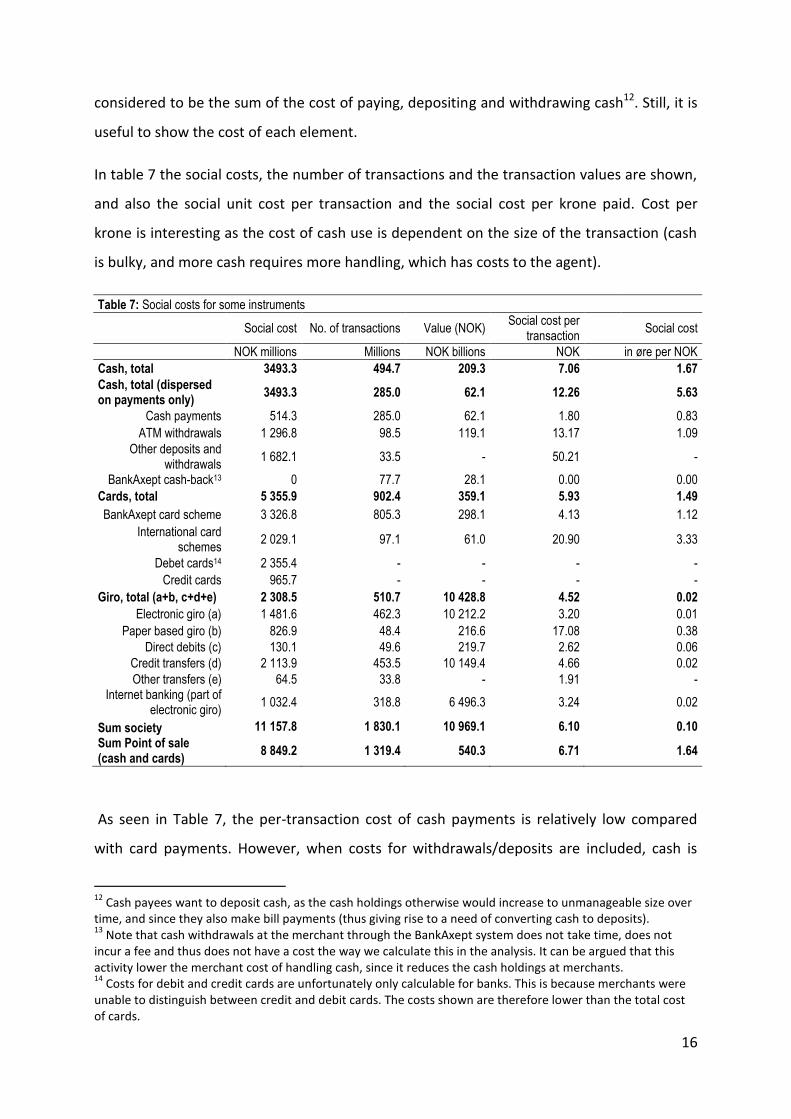
In table 7 the social costs, the number of transactions and the transaction values are shown,
and also the social unit cost per transaction and the social cost per krone paid. Cost per
krone is interesting as the cost of cash use is dependent on the size of the transaction (cash
is bulky, and more cash requires more handling, which has costs to the agent).
Table 7: Social costs for some instruments
Social cost No. of transactions Value (NOK)
Social cost per transaction
Social cost
NOK millions Millions NOK billions NOK in øre per NOK
Cash, total 3493.3 494.7 209.3 7.06 1.67
Cash, total (dispersed on payments only)
3493.3 285.0 62.1 12.26 5.63
Cash payments 514.3 285.0 62.1 1.80 0.83
ATM withdrawals 1 296.8 98.5 119.1 13.17 1.09
Other deposits and withdrawals
1 682.1 33.5 - 50.21 -
BankAxept cash-back13 0 77.7 28.1 0.00 0.00
Cards, total 5 355.9 902.4 359.1 5.93 1.49
BankAxept card scheme 3 326.8 805.3 298.1 4.13 1.12
International card schemes
2 029.1 97.1 61.0 20.90 3.33
Debet cards14 2 355.4 - - - -
Credit cards 965.7 - - - -
Giro, total (a+b, c+d+e) 2 308.5 510.7 10 428.8 4.52 0.02
Electronic giro (a) 1 481.6 462.3 10 212.2 3.20 0.01
Paper based giro (b) 826.9 48.4 216.6 17.08 0.38
Direct debits (c) 130.1 49.6 219.7 2.62 0.06
Credit transfers (d) 2 113.9 453.5 10 149.4 4.66 0.02
Other transfers (e) 64.5 33.8 - 1.91 - Internet banking (part of
electronic giro) 1 032.4 318.8 6 496.3 3.24 0.02
Sum society 11 157.8 1 830.1 10 969.1 6.10 0.10
Sum Point of sale (cash and cards)
8 849.2 1 319.4 540.3 6.71 1.64
As seen in Table 7, the per-transaction cost of cash payments is relatively low compared
with card payments. However, when costs for withdrawals/deposits are included, cash is
12
Cash payees want to deposit cash, as the cash holdings otherwise would increase to unmanageable size over time, and since they also make bill payments (thus giving rise to a need of converting cash to deposits). 13
Note that cash withdrawals at the merchant through the BankAxept system does not take time, does not incur a fee and thus does not have a cost the way we calculate this in the analysis. It can be argued that this activity lower the merchant cost of handling cash, since it reduces the cash holdings at merchants. 14
Costs for debit and credit cards are unfortunately only calculable for banks. This is because merchants were unable to distinguish between credit and debit cards. The costs shown are therefore lower than the total cost of cards.

17
more expensive per transaction. Distribution of cash is rather costly. The per-transaction
cost of electronic giro transactions is low, as giros generally go straight through the payment
chain without manual processing and without an extensive point of sale infrastructure which
is necessary for cards and cash.
Costs, benefits and break-even cost analysis
This memo focuses on the calculation of costs in the payment process.
However, the choice of payment instrument when making a payment is based on a number
of decision elements, including both costs and benefits. The potential benefits of using an
instrument can be substantial and the importance of benefits and costs can vary under
changing circumstances.
Other cost surveys determine the break-even cost for payment instruments – the amount
where the costs of one instrument is equal to the cost of another instrument (see chapter 6).
The break-even cost calculations have been used for calculations on society’s savings when
substituting one (expensive) instrument with a cheaper one – for example cash and debit
cards. We make no such calculations for a number of reasons:
First, the data we collected was not suited for this purpose. This survey calculates
average cost given today’s use of the different services, not marginal costs. To make
a break-even cost analysis we would have to make many assumptions to generate a
marginal cost analysis. The value of such a break-even-cost analysis would be limited.
Second, the break-even calculations regard fixed costs as sunk. In our opinion, fixed
costs matter – infrastructure for payments have to be built, and is not free.
Third, break-even calculations are rendered as linear cost functions. Economies of
scale are important to most payment solutions, and it is likely that the costs are non-
linear with increasing amounts paid.
Furthermore, break-even calculations are based on costs averaged across many
businesses. Different stores can face very different cost patterns in payments.

18
We might also add that both “cards” and “cash” (or “giro”) cover a number of
different services. It could therefore be argued that a break-even cost analysis should
be made for each service, not only the rather generic terms of “cash” and “cards”.
The conclusions in a break-even-cost analysis are often rather obvious: services that face an
increasing unit cost when amounts paid increase, will not be chosen over instruments that
face a flat or decreasing unit cost. Cash and card systems using a price model based on
value-related fees will not be preferable. (in the Norwegian payment system BankAxept will
be the preferable payment solution, and electronic giro will be preferred over paper-based
giro).
Break-even cost calculations can express society’s potential cost savings when substituting
one payment instrument with another. However, the calculation will not express which
benefits the society will win when substituting one instrument with another.
The average payer probably has an impression on which benefits and which costs he/she
faces when choosing a payment instrument. A good description and analysis of the benefits
and costs in the choice of payment instrument is given in Nationale Bank van Belgié (2005).
In the table below we try to identify the most relevant decision factors to the different
agents (payers, payees and banks). Some of the factors are interrelated. Both positive and
negative (benefits and costs) are listed. For some purposes only some of the instruments can
be used.

19
Table 8: Which elements affect the decision to choose the instrument in a given situation (benefits and costs)?
Payer Payee Bank Payer Payee Bank Payer Payee Bank Payer Payee Bank Payer Payee Bank Payer Payee Bank
Acceptance
Legal tender? Yes Yes Yes Yes Yes Yes No No No No No No No No No No No No
Dependent on terminal? No No No No No No Yes Yes Yes Yes Yes Yes Yes Yes Yes Yes Yes Yes
P2p / b2b acceptance? Yes Yes Yes Yes Yes Yes No No No No No No No No No No No No
Used at point of sale? Yes Yes Yes NR NR NR Yes Yes Yes Yes Yes Yes No No No No No No
Used over Internet? No No No NR NR NR Yes Yes Yes Yes Yes Yes Yes Yes Yes Yes Yes Yes
Used for bill payments? No No No NR NR NR No No No No No No Yes Yes Yes Yes Yes Yes
Security
Loss R R R R R R RRF RRF RRF RRF RRF RRF NR NR NR NR NR NR
Theft R R R R R R RRF RRF RRF RRF RRF RRF NR NR NR NR NR NR
Forgery /counterfeit RRF RRF RRF RRF RRF RRF RRF RRF RRF RRF RRF RRF NR NR NR NR NR NR
Fraud /misuse NR NR NR NR NR NR RRF RRF RRF RRF RRF RRF NR NR NR NR NR NR
Confidentiality
Anonymity Yes Yes Yes Yes Yes Yes No No No No No No No No No No No No
Transaction traceable No No No No No No Yes Yes Yes Yes Yes Yes Yes Yes Yes Yes Yes Yes
Speed
How fast is the payment? Relevant Relevant NR R R R R R R R R R R R R R R R
How fast is the
withdrawal/deposit?NR NR NR R R R R R R R R R NR NR NR NR NR NR
Is there any delay in
settlement?No No No No No No
Yes
(t+0)
Yes
(t+0)
Yes
(t+0)Yes (t+X) Yes (t+X) Yes (t+X) Yes (t+0) Yes (t+0) Yes (t+0)
Yes
(t+X)
Yes
(t+X)
Yes
(t+X)
Reliability
Electronic system is
operableNR NR NR NR NR NR R R R R R R R R R NR NR NR
Manual system is operable R R R R R R NR NR NR NR NR NR NR NR NR NR NR NR
Mixed manual/electronic
system is operableR R R R R R NR NR NR NR NR NR NR NR NR R R R
User friendliness
Treshold: reading/writing
skills necessary?NR NR NR R R R R R R R R R R R R R R R
Treshold: math skills
necessary?NR NR NR R R R R R R R R R R R R R R R
Is this practical/simple to
use?R R R R R R R R R R R R R R R R R R
Budget management
Immediate settlement Yes Yes NR Yes Yes Yes No No No No No No No No No No No No
Delayed (automatic)
settlementNo No NR No No No
Yes
(t+0)
Yes
(t+0)
Yes
(t+0)Yes (t+X) Yes (t+X) Yes (t+X)
Yes
(t+X)
Yes
(t+X)
Yes
(t+X)
Yes
(t+X)
Yes
(t+X)
Yes
(t+X)
Delayed (separate)
settlement: use of credit
facility
No No NR No No No No No No R R R No No No No No No
Availability
Is shortages possible? R R R R R R NR NR NR NR NR NR NR NR NR NR NR NR
Is ATM available? NR NR NR R NR R R R R R R R NR NR NR NR NR NR
Is Branch available? R R R R R R NR NR NR NR NR NR NR NR NR R R R
Is POS terminal available? NR NR NR R R NR R R R R R R NR NR NR NR NR NR
Is Internet payment solution
(in shop) available?NR NR NR NR NR NR R R R R R R NR NR NR NR NR NR
Is Internet banking
available?NR NR NR NR NR NR NR NR NR NR NR NR R R R R R R
Is p2p / b2b etc possible (no
terminal)?Yes Yes Yes Yes Yes Yes No No No No No No No No No No No No
Amount
Used for micro value (>100
NOK)Yes Yes NR Yes Yes Yes Yes Yes Yes Seldom Seldom Seldom Seldom Seldom Seldom Seldom Seldom Seldom
Used for small value
(100>500 NOK)Yes Yes NR Yes Yes Yes Yes Yes Yes Seldom Seldom Seldom Yes Yes Yes Yes Yes Yes
Used for medium value
(500>1000 NOK)Partly Partly NR Yes Yes Yes Yes Yes Yes Yes Yes Yes Yes Yes Yes Yes Yes Yes
Used for large value (<1000
NOK)Seldom Seldom NR Yes Yes Yes Yes Yes Yes Yes Yes Yes Yes Yes Yes Yes Yes Yes
Costs (described in detail
in text)
Direct (fees etc) No No NR Yes Yes Yes Yes Yes Yes Yes Yes Yes Yes Yes Yes Yes Yes Yes
Indirect (own production/use
cost)Yes Yes NR Yes Yes Yes Yes Yes Yes Yes Yes Yes Yes Yes Yes Yes Yes Yes
R = Relevant NR = Not Relevant RRF = Risk Reducing Features (PIN, Signature, ID, Limits etc) t+0 = today t+X = tomorrow or later
Electronic giro Paper-based giro
Withdrawal/depositPayment Payment Payment Payment Payment
Cash Bank-Axept International payment cards

20
3 Transactions at point-of-sale - two approaches
The objective of this memo is to calculate payment costs in Norway15. It is necessary to make
an estimate of number of transactions to do the cost calculation.
For a cards and giros, transaction data is shown in Norges Banks’ Annual Report on Payment
Systems 2007. However, transaction data for cash use is not found in the statistics. An
estimate for cash payments is therefore needed. In this analysis, results from the household
survey are used to make this estimate.
There are indications that the household survey may give a too low estimate on cash
payments at point of sale. These are elaborated below. We choose to base our calculation
on costs on transaction data from the household survey, since it is one of the three surveys
in which we have collected necessary information to build this analysis.
This analysis calculates number of cash deposits and withdrawals independently from the
calculation of cash payments. We are aware of the (potential) relationship between
number/value of cash payments and number/value of cash withdrawals; more cash
payments are likely to give more deposits and withdrawals. However, we do not have data
that enables us to calculate the impact of this relationship. Our approach is therefore to
make two independent calculations: one for payments and one for deposits/withdrawals.
This has effects on the cost calculation as well; it is also made of two separate calculations.
To show the impact of methodology and data to our calculation, we present two alternative
approaches to estimate the number of cash payments (household survey approach and
household consumption approach). Even though the two methods come up with rather
different estimates, we show that the effect on costs is moderate.
15
We start out by calculating the unit cost (per-transaction cost or per payment / withdrawal / deposit cost) for each instrument. The unit cost is multiplied by number of transactions in Norway. This gives the private cost per instrument (chapters 4, 5 and 6). This is done for all instruments for all agents, and summed – thereafter deducting the fees and other subcontractor costs to identify the social cost (see chapter 2).

21
Household survey estimate of cash payments
We have calculated the cash use to be 285 million transactions in 2007. Using the survey
average cash payment value of NOK 217.92, we obtain a cash-use at point of sale of NOK
62.1 billion. This implies that the cash and card payments at point of sale had a combined
value of NOK 432.1 billion (see Table 1 and chapter 6 for explanations).
Household consumption estimate of cash payments
In Gresvik and Haare (2008a), we made an alternative calculation16 of the cash and card use
at point of sale in Norway for 2007. The alternative calculation was based on information
from the national accounts and showed the household consumption at point of sale to be
NOK 595 billion17. The higher level of point of sale consumption gives a correspondingly
higher value of cash use18 at point of sale (NOK 227.7 billion; 3.7 times higher than the
survey based estimate).
Our estimate on the number of cash transactions based on the value of cash payments from
the alternative calculation is 1045.1 million transactions (this is calculated by dividing the
cash payments value of NOK 227.7 billon by the average cash payment value from the
household survey of NOK 217.92) In table 9 this is shown19.
16
In Gresvik and Haare (2008a) the alternative calculation was elaborated as the “maximum value of cash used at point of sale”. To estimate the “maximum value” of cash use at point of sale, the value of bill payments (giros, retail market), card payments and personal cheques were deducted from the household consumption calculated by Statistics Norway. The resulting value is higher than the actual value of cash payments at point of sale in Norway, as it is also possible to make payments by other instruments besides cash at point of sale (e-money schemes, chain-store specific payment cards etc). We do not know how much these other instruments (besides cash) cover household consumption at point of sale. 17
Household consumption was NOK 872.4 billion, our calculation gave an estimate of non point of sale consumption to be NOK 277 billion in 2007. 18
Note that “cash use” also include other settlement means. It is likely that part of this “cash use” is settled using e-money, giro (deposit money) or direct account-to-account transfers. 19
Note that the household consumption value is NOK 597.7 in table 9, slightly more than the original estimate of household consumption value at point of sale. This is due to differences in the statistics on card payments.

22
When using this method the value of the cash transactions rises from 14 to 38 per cent, and
the value from 24 to 53 per cent.
Important elements for an evaluation of the two calculations
The estimates of cash payments made above are simple, and ignore information that can be
important. Some information support the calculations, but there are also some anomalies to
consider:
Surveys conducted by The Norwegian Saving Banks Association
(Sparebankforeningen) and BBS (a supplier of electronic, payment- and information
solutions) give support to our cash estimate (a low and decreasing cash-use), see
chapter 5.
Cash payments estimate in the merchant survey offer some support to the household
survey cash estimations.
Is the methodology in the household survey calculation reliable? Jonker and Kosse
(2009) show that people often forget small cash payments very quickly. A diary
where they write down their payments as they occur could be a better method.
Information from BBS indicates that the household survey underestimates the
number of low-value card transactions. This might also be true to cash transactions.
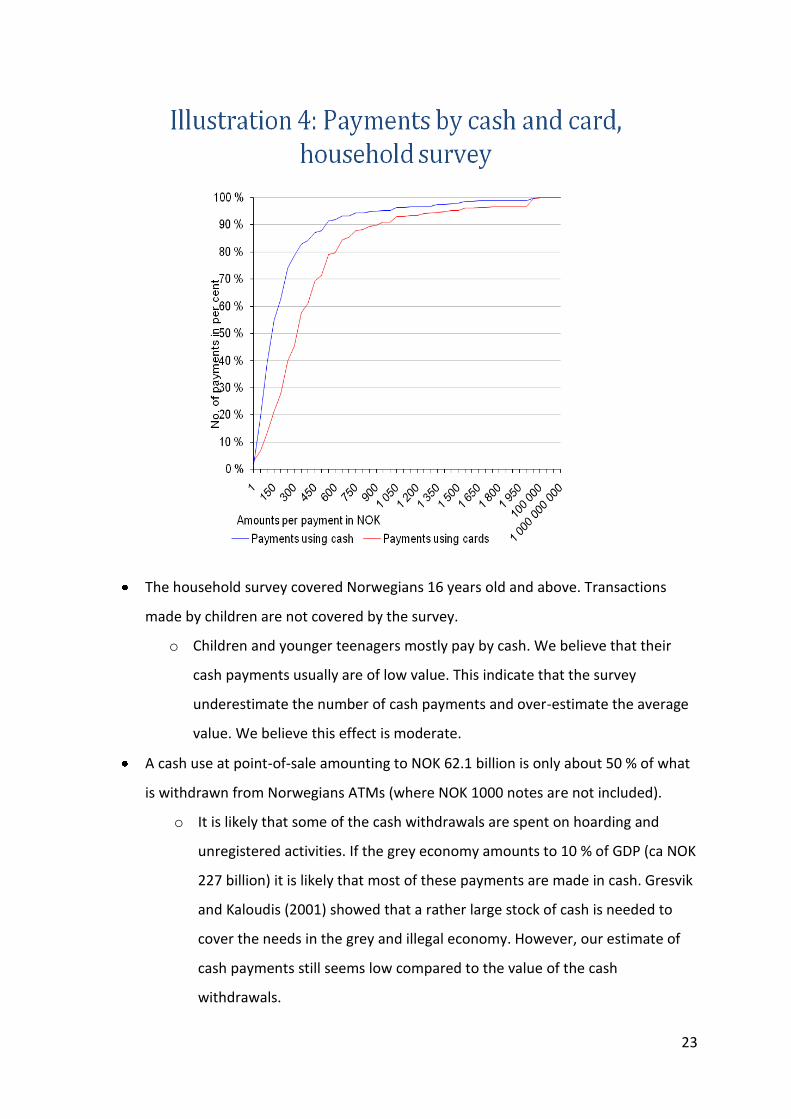
o The responses in the household survey show that a considerable number of
payments have low value (39 per cent of cash payments were of less than
NOK 100 in value). Cash payments are generally of lower value than card
payments, see Illustration 4.
Table 9: Value and number of transactions at point of sale, (household consumption estimate of cash payments)
2007 Transactions
Value Base: Residents millions per cent NOK billions per cent
Point of sale, total 1969.1 100.0 % 597.7 100.0 %
Cash usage
1045.1 53.1 % 227.7 38.1 %
Card usage, total
924.0 46.9 % 370.0 61.9 %
BankAxept 805.3 40.9 % 298.1 49.9 %
Petrol companies’ cards
21.6 1.1 % 10.8 1.8 %
Visa, MasterCard, Amex, Diners Club
97.1 4.9 % 61.0 10.2 %
(bold figures deviate from the household survey calculation in Table 1)
23
The household survey covered Norwegians 16 years old and above. Transactions
made by children are not covered by the survey.
o Children and younger teenagers mostly pay by cash. We believe that their
cash payments usually are of low value. This indicate that the survey
underestimate the number of cash payments and over-estimate the average
value. We believe this effect is moderate.
A cash use at point-of-sale amounting to NOK 62.1 billion is only about 50 % of what
is withdrawn from Norwegians ATMs (where NOK 1000 notes are not included).
o It is likely that some of the cash withdrawals are spent on hoarding and
unregistered activities. If the grey economy amounts to 10 % of GDP (ca NOK
227 billion) it is likely that most of these payments are made in cash. Gresvik
and Kaloudis (2001) showed that a rather large stock of cash is needed to
cover the needs in the grey and illegal economy. However, our estimate of
cash payments still seems low compared to the value of the cash
withdrawals.

24
o If we assume that withdrawals of 1000-NOK notes are the same as deposits
of 1000-NOK notes in Norges Bank, approximately 14 billion NOK in 2007,
the anomaly is strengthened further.
NOK 208 billion was deposited in Norges Bank and private cash depots in 2007. It can
be expected that each note / coin was used in several payments20 while they were in
circulation outside the central bank or cash depot. The deposited cash also include
currency exchanges and cash from the unregistered sector of the economy, and
should thus be expected to be higher than the results from the household survey.
o Again, hoarding and grey/illegal activities might explain some of this. But the
mismatch is so large that the estimate on number of cash payments should
be used with caution.
The estimate for number of transactions in the household consumption calculation is
based on the average value of cash transactions from the household survey.
Household consumption data does not show number of payments. If it is true that
the respondents tend to forget small-value transactions, the average cash payment
value should be lower, in effect raising the estimate of transactions in the alternative
calculation. Sensitivities are shown in table 10.
The anomalies and contradictory data to our estimate of cash payments at point of sale raise
the question whether the calculation based on the household survey is correct. In our
opinion, this the use of cash payments and the use of cash for hoarding and illegal activities
should be investigated further.
20
It is also to be expected that cash used in the black/grey sector of the economy has done one or more loops in the payment chain before the last payment laundering the cash.
Table 10: Cash payments estimate: sensitivity to average value
Value of cash payments (NOK billions) 227.7
Average value (NOK) 217.92 200.00 150.00 100.00
Number of cash payments (millions) 1045.1 1138.7 1518.3 2277.5
In per cent of number of payments at point of sale 53.1 % 55.2 % 62.2 % 71.1 %

25
Household consumption estimate: The effect on social cost
We have also made a calculation to show what happens when we apply the results in table 9
to the survey average transaction value (re-calculating table 7). Assuming that the social cost
per transaction is the same, regardless of number of transactions, we have estimated a new
social cost to the society. The results are shown in table 11:
Table 11: Social cost for some instruments, (Household consumption estimate of cash payments)
Social cost No. of
transactions Value (NOK) Social cost per
transaction Social cost per
krone
NOK millions Millions NOK billions NOK in øre per NOK
Cash, total 4865.1 1177.1 346.8 4.13 1.40
ATM 1 296.8 98.5 119.1 13.17 1.09
Other deposits and withdrawals 1 682.1 33.5 0.0 50.21 0.00
Cash payments 1 886.1 1 045.1 227.7 1.80 0.83
Cards, total 5 355.9 902.4 359.1 5.93 1.49
Giro, total 2 308.5 510.7 10 428.8 4.52 0.02
Sum society 12 529.5 2 590.2 11 134.7 4.84 0.113 Sum POS (cash and cards) 10 221.0 2 079.5 705.9 4.92 1.448
(bold figures are different from the original calculation in Table 7) (1 NOK = 100 øre)
The effect of increased cash costs is moderate to the social cost level. Measured as a ratio of
GDP, the costs increases from 0.49% to 0.55 % of GDP (based on cash and cards only, the
increase in the ratio is from 0.39 % to 0.45 % of GDP). One should remember that the cost of
cash distribution services is unaffected by the increased number of payments in Table 11, as
explained above.
Comparing 1993 and 2007 numbers of transactions
In 1993, a household survey was conducted by Norges Bank. Based on data from the survey,
an estimate of cash use at point of sale was made (NOK 231.9 billion, 1258.1 million
payments). An alternative calculation of cash use based on household consumption in 1993
was made as well (results: NOK 229.7, 1246.3 million payments, see table 12). The
calculation of cash use at point of sale for 1993 was basically same as for 2007.

26
Table 12: Household surveys in 1993 and 2007
Transactions Value 1993 2007 1993 2007 Million
transactions Per
cent Million
transactions Per
cent NOK
billion Per
cent NOK
billion Per
cent Cash 1258.1 84.5 285.0 23.6 231.9 74.6 % 62.1 14.4 Cards 191.8 12.9 924.0 76.4 62.6 20.1 % 369.9 85.6 Cheques 38.4 2.6 - - 16.4 5.3 % - -
Developments in the relative value of payments at point of sale using different payment
instruments are shown in illustration 5. Illustration 5 show values based on household
consumption data (the data used in the alternative calculation).
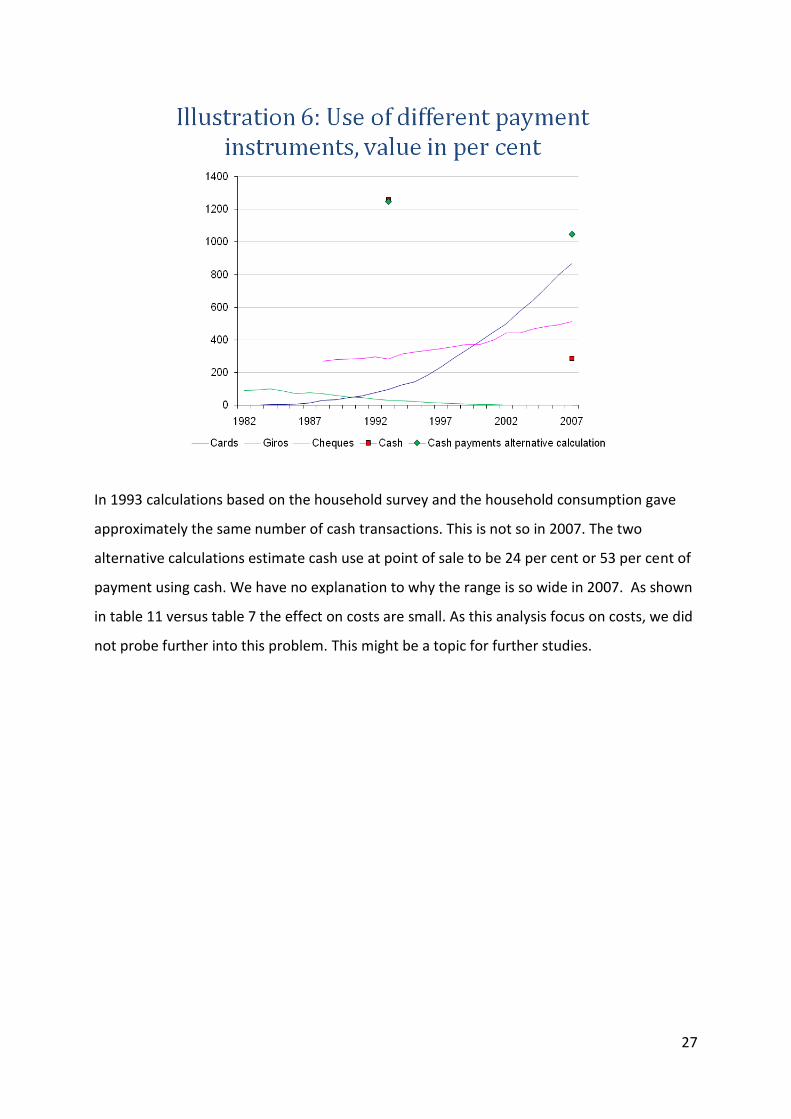
Illustration 6 shows the household survey- and alternative calculations for 1993 and 2007 in
combination with statistics on card, cheque and giro use. Statistics on card and cheque
payments are used in both the household survey and the alternative calculation.
27
In 1993 calculations based on the household survey and the household consumption gave
approximately the same number of cash transactions. This is not so in 2007. The two
alternative calculations estimate cash use at point of sale to be 24 per cent or 53 per cent of
payment using cash. We have no explanation to why the range is so wide in 2007. As shown
in table 11 versus table 7 the effect on costs are small. As this analysis focus on costs, we did
not probe further into this problem. This might be a topic for further studies.

28
4 Costs in banks in Norway: 2007 and development over time
Process
The initial invitation to participate in the survey was sent to 24 banks and 2 card acquiring
companies in October 2006. Questionnaire and spreadsheets were distributed in December
2006, giving the participating banks the whole of 2007 to collect data. A full year was
considered necessary to obtain sufficient quality of data (as use of payment services
fluctuate throughout the year, and as some databases are revised by end-year). 12 banks
and one card acquiring company responded in Q1 and Q2 2008. Based on the information
we received, it was decided that only data from banks could be published. Further details of
the process are described in Appendix to chapter 4.
Assumptions
Private costs for payment and cash services in banks are calculated as:
for each (i) of the n services offered by the banks that responded to the survey. To calculate
the weighted average unit cost, the sum of costs and sum of transactions from the 12 banks
were used:
These calculations were done under the assumption that the 12 banks are representative for
the banking industry in Norway, and that the calculation of full cost using the ABC-
framework (see below) give a detailed estimate of the costs in each bank. Assumptions are
elaborated further in Appendix to chapter 4.
Methodology
The survey of costs in banks covers all banks’ costs in producing payment and cash handling
services. The survey was constructed in order to calculate the full cost for producing cash
and payment services, based on an Activity Based Costing (ABC) methodology, both for each
bank as a whole, and for each service the individual bank offered.
29
The full cost is defined as the private cost in the banking industry, and includes own
production cost and costs of deliveries from subcontractors. The full cost consists of direct
costs and indirect costs, where direct costs are costs that are directly attributed to the
service from subcontractors and activities unique for the individual service offered, while
indirect costs are costs generated by in-house activities that are common across the bank
(support functions). The full cost can also be decomposed into variable and fixed costs, but
this distinction is not elaborated in the survey.
Descriptions of the ABC method can be found in Cooper and Kaplan (1999), Bjørnenak (1993)
and Sti (1993). The ABC method bases its cost distribution on activities, not cost centers.
Activities generate costs, and a higher activity level (larger size of the cost driver) increases
costs. Costs are distributed to the different products/services produced based on
importance of the product/service (size of the cost driver). In this analysis, important cost
drivers are the number of payment transactions and the number of deposits/withdrawals.
Costs are distributed through activities and cost drivers to indirect costs and direct costs. A
list of the activities in this survey is shown in Appendix to this chapter.
The ABC-method is particularly suited in cases where support functions’ share of total costs
is high and rising over time, and/or where there is wide variation in products, services,
customers and production processes21. Banks’ production of payment services is
characterised both by support functions that generate a large proportion of the total costs
and wide variation in how the services are produced, and hence also wide variations on the
level of costs allocated to each service.
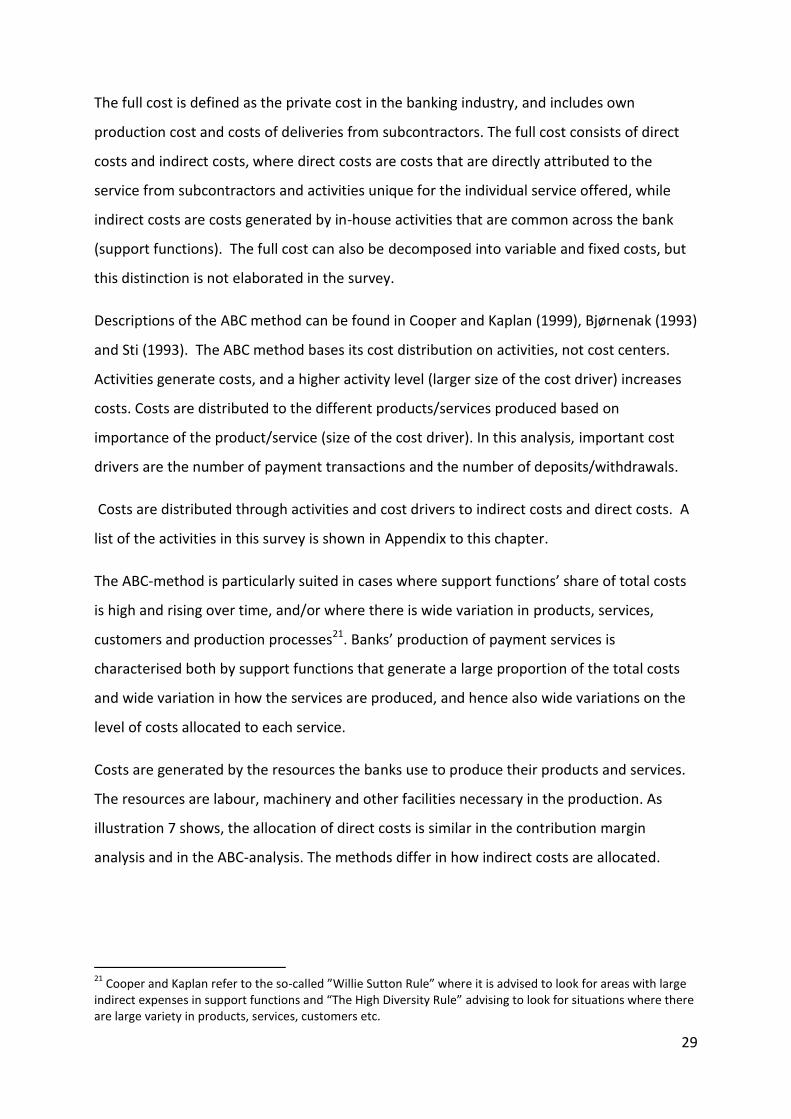
Costs are generated by the resources the banks use to produce their products and services.
The resources are labour, machinery and other facilities necessary in the production. As
illustration 7 shows, the allocation of direct costs is similar in the contribution margin
analysis and in the ABC-analysis. The methods differ in how indirect costs are allocated.
21
Cooper and Kaplan refer to the so-called ”Willie Sutton Rule” where it is advised to look for areas with large indirect expenses in support functions and “The High Diversity Rule” advising to look for situations where there are large variety in products, services, customers etc.
30
In the analysis of the banks’ costs in producing payment services, the participating banks
provided and processed the requested information in a specific framework. Those banks
which already used an ABC-framework for payment services adjusted their existing method
to fit our framework. This did not affect the results in our survey adversely.
The bank survey covered the shaded area in illustration 8:
31
Results
Total private cost
The banks’ total private cost of producing payment and cash handling services in 2007 was
NOK 7.4 billion. Cost of holding cash, the seigniorage cost, was NOK 0.15 billion, resulting in
a total cost of NOK 7.5 billion. In this chapter, we generally discuss private costs excluding
seigniorage.
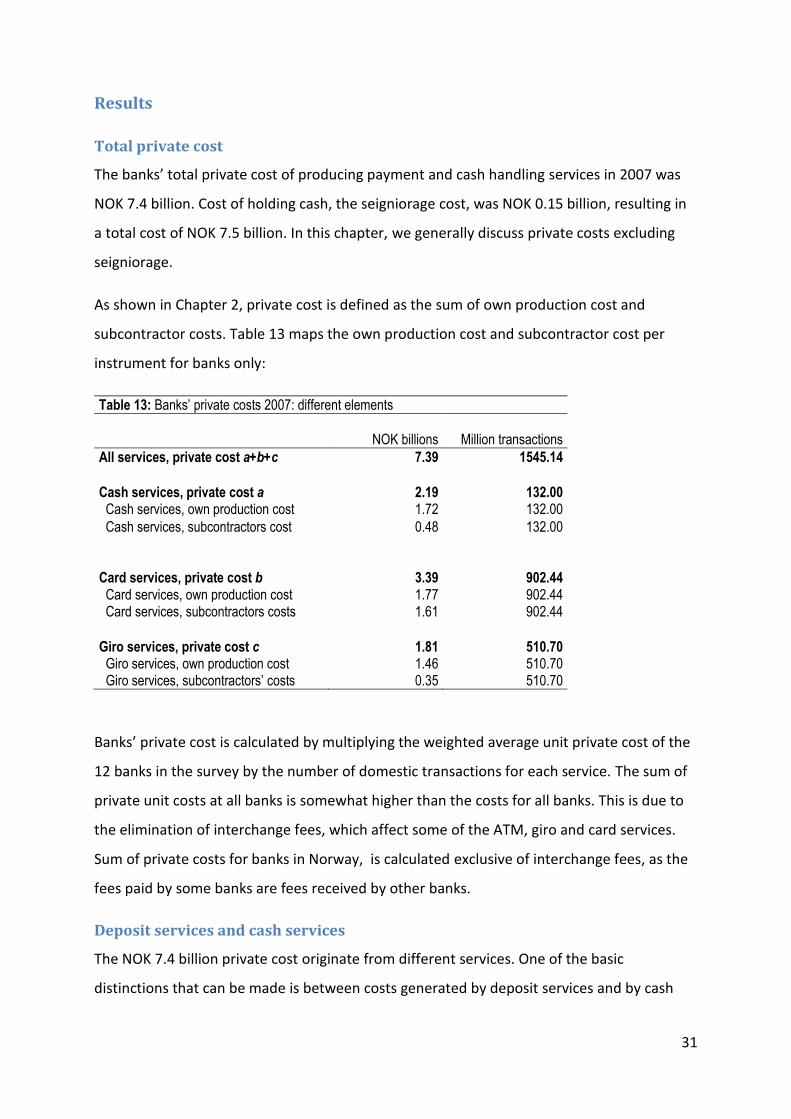
As shown in Chapter 2, private cost is defined as the sum of own production cost and
subcontractor costs. Table 13 maps the own production cost and subcontractor cost per
instrument for banks only:
Table 13: Banks’ private costs 2007: different elements
NOK billions Million transactions All services, private cost a+b+c 7.39 1545.14 Cash services, private cost a 2.19 132.00 Cash services, own production cost 1.72 132.00 Cash services, subcontractors cost 0.48 132.00
Card services, private cost b 3.39 902.44 Card services, own production cost 1.77 902.44 Card services, subcontractors costs 1.61 902.44 Giro services, private cost c 1.81 510.70 Giro services, own production cost 1.46 510.70 Giro services, subcontractors’ costs 0.35 510.70
Banks’ private cost is calculated by multiplying the weighted average unit private cost of the
12 banks in the survey by the number of domestic transactions for each service. The sum of
private unit costs at all banks is somewhat higher than the costs for all banks. This is due to
the elimination of interchange fees, which affect some of the ATM, giro and card services.
Sum of private costs for banks in Norway, is calculated exclusive of interchange fees, as the
fees paid by some banks are fees received by other banks.
Deposit services and cash services
The NOK 7.4 billion private cost originate from different services. One of the basic
distinctions that can be made is between costs generated by deposit services and by cash

32
services. Deposit services are services that move deposits from account to account, that is:
payment transactions. Cash services are services that transform deposits to cash or cash to
deposits (withdrawals and deposits). Costs from producing deposit services are NOK 5.2
billion, while costs from producing cash services are NOK 2.2 billion (see table 14).
Table 14: Banks private costs 2007: deposit and cash services NOK billions Billion transactions All services 7.39 1.55 Deposit services 5.19 1.41 Cash services 2.19 0.13
Cost coverage
As mentioned in Chapter 2, banks’ income is registered in the ORBOF statistics. Income from
payment services was NOK 5.2 billion in 2007. This gave an overall cost coverage of 71 %.
Using the same distinction between cash and deposit services, where cash services include
ATM services, gives cost coverage of 88 % and 27 % of deposit and cash services,
respectively (table 15). This is based on the calculation shown in the Appendix to chapter 2.
If ATM is considered to be a deposit service (as in prior Norwegian cost surveys), the cost
coverage will be 87% (deposits) and 0 % (cash).
Table 15: Banks private costs: cost coverage 2007 Costs, NOK billions Income, NOK billions Cost Coverage, per cent All services 7.39 5.21 71 % Deposit services 5.19 4.62 88 % Card services 3.39 2.08 61% Giro services 1.81 2.53 140% Cash services 2.19 0.59 27 %
Table 15 shows that the cost coverage varies considerably between the different payment
services22. Giro costs are more than covered.
In addition to income from direct pricing, banks have other income that can be assigned to
payments. It is common for banks to offer a lower interest rate on payments accounts than
on savings accounts, very often a rate close to nil. As salaries are commonly paid to
payments accounts, the money does not pay the account holder much interest. However,
the money is accessible to banks, which in principle can re-invest them and earn a higher
22
The information in Table 15 can also be found in Tables 4, 5 and 6
33
interest rate than what is offered to the account holder. This creates an interest margin
income that is attributable to payments, and would most likely be so large that it would turn
the payment services loss into profit.
In this paper we do not estimate such income, as it is less precise than what can be
attributed directly from prices and fees on payments.
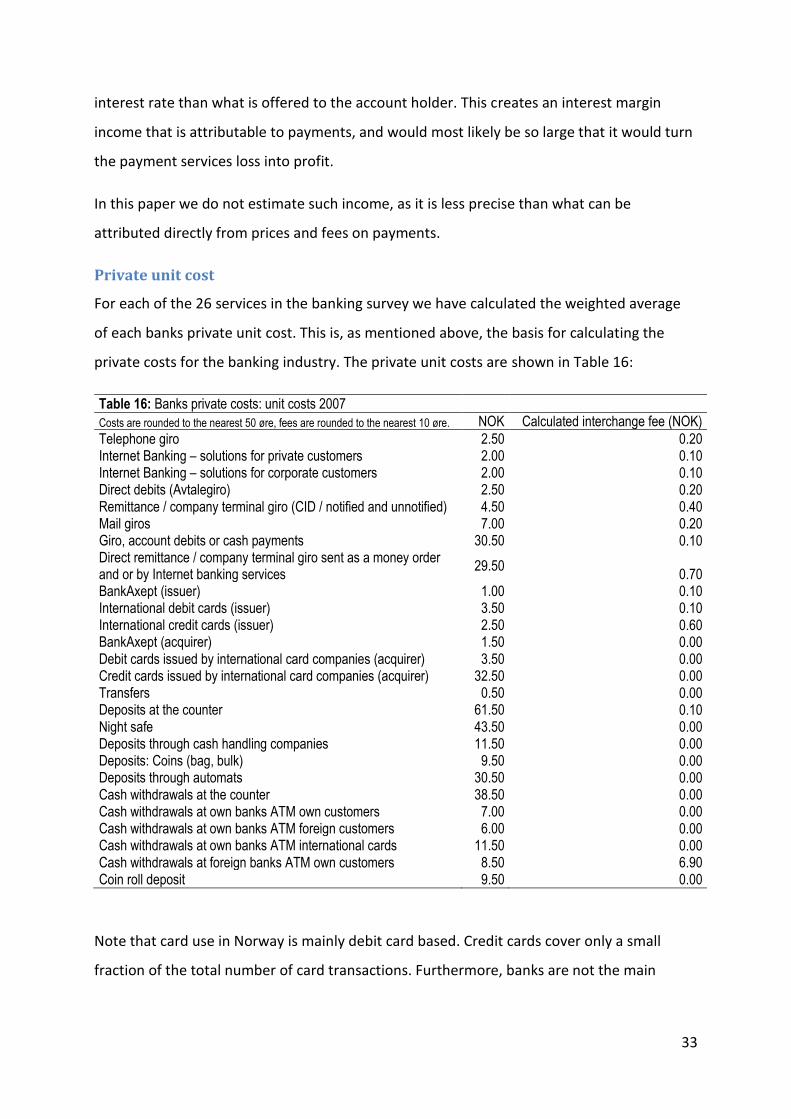
Private unit cost
For each of the 26 services in the banking survey we have calculated the weighted average
of each banks private unit cost. This is, as mentioned above, the basis for calculating the
private costs for the banking industry. The private unit costs are shown in Table 16:
Table 16: Banks private costs: unit costs 2007 Costs are rounded to the nearest 50 øre, fees are rounded to the nearest 10 øre. NOK Calculated interchange fee (NOK) Telephone giro 2.50 0.20 Internet Banking – solutions for private customers 2.00 0.10 Internet Banking – solutions for corporate customers 2.00 0.10 Direct debits (Avtalegiro) 2.50 0.20 Remittance / company terminal giro (CID / notified and unnotified) 4.50 0.40 Mail giros 7.00 0.20 Giro, account debits or cash payments 30.50 0.10 Direct remittance / company terminal giro sent as a money order and or by Internet banking services
29.50 0.70
BankAxept (issuer) 1.00 0.10 International debit cards (issuer) 3.50 0.10 International credit cards (issuer) 2.50 0.60 BankAxept (acquirer) 1.50 0.00 Debit cards issued by international card companies (acquirer) 3.50 0.00 Credit cards issued by international card companies (acquirer) 32.50 0.00 Transfers 0.50 0.00 Deposits at the counter 61.50 0.10 Night safe 43.50 0.00 Deposits through cash handling companies 11.50 0.00 Deposits: Coins (bag, bulk) 9.50 0.00 Deposits through automats 30.50 0.00 Cash withdrawals at the counter 38.50 0.00 Cash withdrawals at own banks ATM own customers 7.00 0.00 Cash withdrawals at own banks ATM foreign customers 6.00 0.00 Cash withdrawals at own banks ATM international cards 11.50 0.00 Cash withdrawals at foreign banks ATM own customers 8.50 6.90 Coin roll deposit 9.50 0.00
Note that card use in Norway is mainly debit card based. Credit cards cover only a small
fraction of the total number of card transactions. Furthermore, banks are not the main

34
international payment card acquirers, two card acquirers23 (Teller and Elavon) dominate the
market in Norway. The data from acquirers are not published in this analysis. Those two
effects lead to a private unit cost for international credit card acquiring that is not
representative for card acquiring in Norway, only for the limited activity by banks in this
area.
Unit cost versus price
Norges Bank has promoted the view that relative prices for banks’ services should reflect the
relative costs of producing the services. Given a price signal that reflects the real use of
resources, customers should be able to choose the most efficient services for their
payments. Examples in Table 17 show that relative prices reflect relative costs.
Table 17: Unit costs and listed unit prices for some services
Instrument Unit cost (NOK) Price24 (NOK) Unit cost / Price
Telephone giro 2.50 2.23 1,12 Internet Banking – solutions for private customers 2.00 2.04 0.98 Internet Banking – solutions for corporate customers
2.00 1.95 1.03
Direct debits (Avtalegiro) 2.50 2.07 1.21 Remittance / company terminal giro (CID / notified and unnotified)
4.50 2.51 1.79
Mail giro 7.00 6.87 1.02 Giro, account debits or cash payments 30.50 30.06 1.01
Costs: Further results
Cash and deposits
As shown above, costs of producing 132 million cash deposits / withdrawals were NOK 2.2
billion, while production cost of 1413 million cards and giro transactions were NOK 5.2
billions. These numbers are aggregated, and they can be decomposed in different ways.
Banks offer a wide range of services for accessing cash and depositing cash. Cash channels
to/from banks customers are the ATM network, branches and cash handling depots.
Corporate customers mainly use bulk services, while retail customers mainly use ATMs and
23
In Norway this kind of activity is regulated in the Act on Financing Activity and Financial Institutions (1988). 24
Listed prices as quoted in Norges Banks Annual Report on Payment Systems. Note that listed prices does not show the effect of discounts through product packages in the banks. The prices each customer face is therefore likely to be 30- 90 % lower.
35
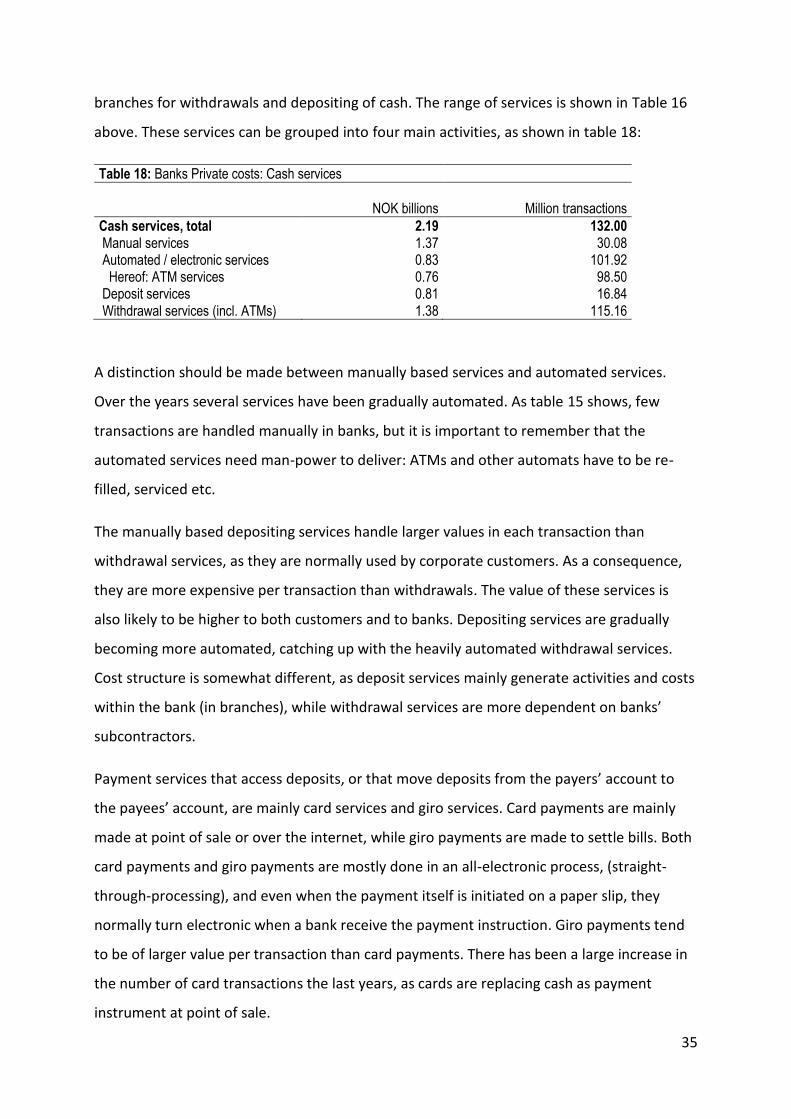
branches for withdrawals and depositing of cash. The range of services is shown in Table 16
above. These services can be grouped into four main activities, as shown in table 18:
Table 18: Banks Private costs: Cash services
NOK billions Million transactions Cash services, total 2.19 132.00 Manual services 1.37 30.08 Automated / electronic services 0.83 101.92 Hereof: ATM services 0.76 98.50 Deposit services 0.81 16.84 Withdrawal services (incl. ATMs) 1.38 115.16
A distinction should be made between manually based services and automated services.
Over the years several services have been gradually automated. As table 15 shows, few
transactions are handled manually in banks, but it is important to remember that the
automated services need man-power to deliver: ATMs and other automats have to be re-
filled, serviced etc.
The manually based depositing services handle larger values in each transaction than
withdrawal services, as they are normally used by corporate customers. As a consequence,
they are more expensive per transaction than withdrawals. The value of these services is
also likely to be higher to both customers and to banks. Depositing services are gradually
becoming more automated, catching up with the heavily automated withdrawal services.
Cost structure is somewhat different, as deposit services mainly generate activities and costs
within the bank (in branches), while withdrawal services are more dependent on banks’
subcontractors.
Payment services that access deposits, or that move deposits from the payers’ account to
the payees’ account, are mainly card services and giro services. Card payments are mainly
made at point of sale or over the internet, while giro payments are made to settle bills. Both
card payments and giro payments are mostly done in an all-electronic process, (straight-
through-processing), and even when the payment itself is initiated on a paper slip, they
normally turn electronic when a bank receive the payment instruction. Giro payments tend
to be of larger value per transaction than card payments. There has been a large increase in
the number of card transactions the last years, as cards are replacing cash as payment
instrument at point of sale.

36
Both cards and giros can be split into several different schemes, and the sum of transactions
and costs are shown in table 19.
Table 19: Banks Private costs: deposit services NOK billions Million transactions All deposit services 5.19 1413.00 Card services 3.39 902.40 Giro services (incl transfers) 1.81 510.60
Card and giro services
Card payments can also be made using credit (not deposits) as a means of payment. This is
included in the cost-calculation of “deposit services”. When the private costs of cards-
calculation is disaggregated, it is useful to have a look at debit card services and credit card
services, which shows that even though the use of credit cards are low in Norway, the per-
transaction production costs are substantial for the banks. The reason for this is mainly that
banks cover a small market share, especially in acquiring credit cards. The biggest acquiring
agents are Elavon Merchant Services and Teller, and the results from these25 are not
published. However, it is likely that the unit cost would be lower if they were included, as
there are economies of scale in acquiring card transactions.
Another interesting split is BankAxept versus other brands, as BankAxept is by far the most
widely used scheme in Norway. The effect of economies of scale is clearly shown in Table 20.
Table 20: Banks Private costs: card services
NOK billions Million transactions
Card services, total 3.39 902.40
Debit card services 2.41 874.34 Credit card services 0.97 28.06
BankAxept services 1.93 805.30 International cards services 1.46 97.10
Issuing cards services 2.27 902.40 Acquiring card services 1.12 902.8026
25
Elavon Merchant Services answered the survey, but not Teller. Due to anonymity reasons, data from Elavon is not published. 26
We use number of card transactions on the issuing side (902.4 million transactions) in this paper as a rule, since the Norges Banks Annual Report on Payment Systems give very accurate statistics on the issuing side but less so on the acquiring side. However, based on information on the issuing side on the distribution between payments made by residents and non-residents made by international debit and credit cards, an estimate of the number of transactions on the acquiring side was made (902.8 million transactions).

37
Giro schemes handle the bulk of bill payments in Norway. Strictly speaking, a giro is only a
yellow paper bill payment instruction, but most of the bill payment services are named giro
services, even if they are fully electronic and the form to be filled in often do not resemble
the yellow paper slip. As the move to fully electronic services is close to complete, the bulk
of the costs are carried by these (internet giro etc.). One should note that the unit cost of
producing the electronic services is much lower than for the paper based ones. As Table 21
shows, most giros are fully electronic, and the bulk of payments go through the Internet
banking solutions.
Table 21: Banks Private costs: giro services NOK billions Million transactions Giro services, total (a+b+c, or c+d+e) 1.81 510.60
Electronic Giro (a) 1.01 428.40 Hereof: Internet Giro 0.64 318.80 Paper based Giro (b) 0.77 48.40 Hereof: Giro mail (Brevgiro) 0.19 29.00 Giro Over The Counter (paid cash and deposited to account)
0.53 17.70
Transfers (c) 0.02 33.80
Credit transfers (d) 1.65 427.20
Direct Debits (Avtalegiro) (e) 0.13 49.60
The services described in Table 20 and 21 can also be split in electronic/automated versus
manual/paper-based:
Table 22: Banks private cost: Electronic / automated and paper-based / manual services NOK billions Million transactions Electronic / automated services 5.25 1466.5 Paper-based / manual services 2.14 78.5
The paper-based/manual services in Table 22 are the sum of manual cash services and
paper-based Giro services. The electronic/automated services are the rest of the services. As
we can see, the manual/paper based services are not much used anymore, and the bulk of
transactions and costs are carried by the automated/electronic services.
38
Resource use compared to total resource use in the banks
There are similarities and differences between the cost structure of cash, card and giro. The
differences stem from the degree of manual handling or electronification, but also from the
differences in infrastructure and number of transactions in the banks.
The use of subcontractors is extensive for the three main groups of instruments. According
to our calculations, 6.6% of banks’ non-financial costs27 are generated from the use of
payment system subcontractors. The services from the subcontractors differ, of course, but
data processing centrals and cash handling firms are used by all banks. All banks also
participate in common solutions, like the BankAxept and Giro solutions, so they all face
interchange fees and invoices for production of the payment services. Thus the element of
direct cost is quite substantial in all services.
Of non-financial costs in banks, 15.4% are generated by payment services activities, and 5.4
% by cash handling activities. Fraud and counterfeit is a cost to banks, as they guarantee
settlement for card transactions, and since they have better equipment to identify
counterfeited notes than the merchants. Because of the characteristics of the domestic card
system BankAxept (online, PIN-based debit card system) and due to Norwegian kroner being
a small currency not heavily used abroad, fraud is rare and counterfeiting is at a very low
level. The cost to the banks of fraud and counterfeit is thus only 0.07% of their total private
cost.
Payments are very hardware/software intensive, while cash handling is more labour
intensive. The banks in our survey spend 10 % of their FTE (Full-Time Equivalent) labour on
handling payments, and 3% of their man-years to handle cash deposits and withdrawals.
Payments and cash handling is, however, a part of banking that has economies of scale
characteristics, so further mechanization /electronification will most likely increase efficiency
more than what is the potential in other activities in the banks. Payments and cash handling
has traditionally been services with low potential for income, so cost efficiency within this
field is vital to banks.
27
“Non-financial costs” are costs in banks minus interest costs, losses and taxes.

39
Prior surveys: comparing results
Prior Norwegian surveys of costs in banks considered mostly non-cash services. When
comparing costs over time we have distributed the costs on eight services. The eight services
cover banks production of the debit card solutions BankAxept and Visa, all giro services, ATM
services, and cheques.
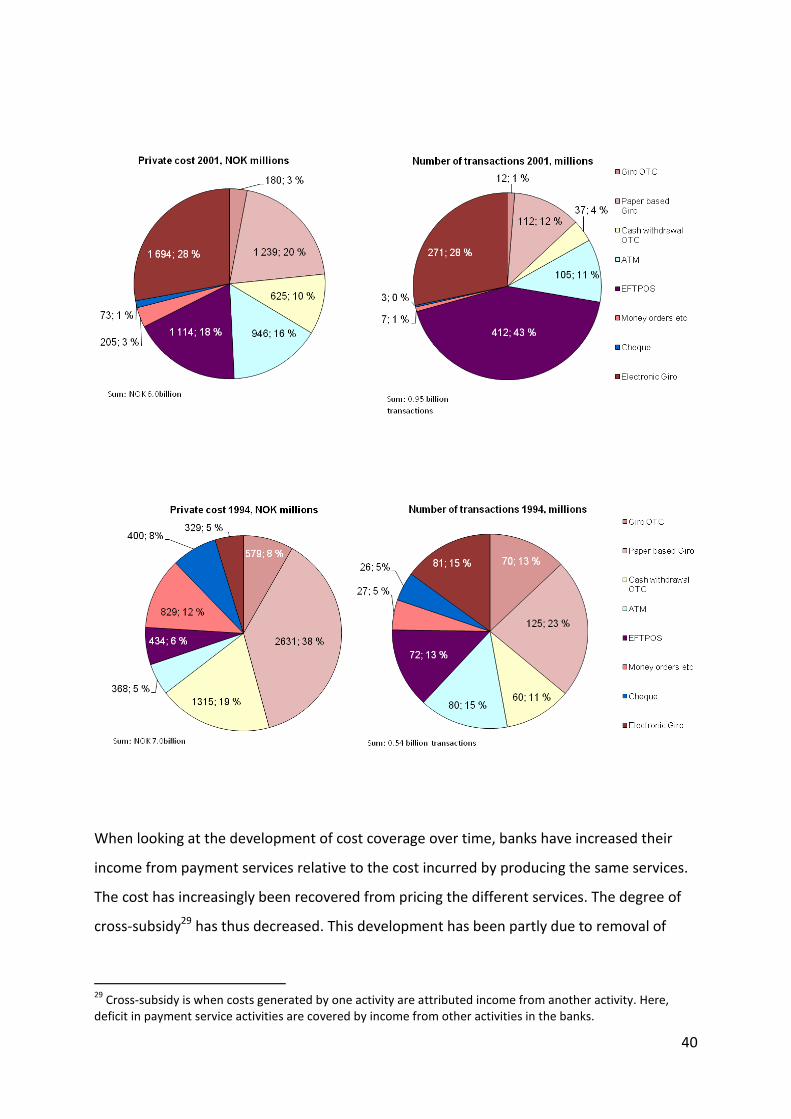
Two trends are noteworthy as regards the cost and transaction picture: Banks’ cost is
reduced from 1994 to 2007 (in 2007-values, see illustration 928). During the period the
number of transactions have almost tripled. The driving force in this development is a shift
in services, from paper-based solutions to fully electronic services. What is not shown in the
charts below is that the use of cash at point of sale, which has fallen significantly since 1993
(see chapter 5 and Gresvik and Haare 2008a for further details). Banks handle a larger share
of payments at point of sale in 2007 than before. Despite the increased activity, they have
also managed to reduce their costs over time due to economies of scale and other
rationalizations (see Illustration 10 and table 23).
28
Note that Transfers and Night Safe is excluded in Illustration 9. The costs and number of transactions are thus somewhat lower than in other illustrations and tables in this section.
40
When looking at the development of cost coverage over time, banks have increased their
income from payment services relative to the cost incurred by producing the same services.
The cost has increasingly been recovered from pricing the different services. The degree of
cross-subsidy29 has thus decreased. This development has been partly due to removal of
29
Cross-subsidy is when costs generated by one activity are attributed income from another activity. Here, deficit in payment service activities are covered by income from other activities in the banks.

41
float income, but is also caused by cooperation within the banking industry (cooperation
acceptable to the competition authorities).
The banks’ income according to the ORBOF statistics can be compared to the income
calculated on basis of the listed prices per transaction for payment services. These values
deviate, and the main reason is that banks offer discount programs for their trusted
customers.
In the bank survey we have not carried out separate calculations on how discounts given in
customer product programs affect banks’ income compared to using the list prices.
However, such calculations were made in the 2006 edition of Norges Banks’ Annual Report
on Payment Systems. The main conclusions were:
The banks offering discount for ATM withdrawals, give on average a discount of over 85 per
cent for withdrawals outside opening hours and for withdrawals from other banks’ ATMs.
42
Relatively few banks included ATM withdrawals from other banks’ ATMs in their customer
programs. On telephone giros, direct debits and paying bills via the Internet the weighted
prices are reduced by more than 50 per cent. On cards it was estimated that on average the
prices in customer programs were almost 90 per cent lower than the listed prices. If the
prices and transaction volume in the customer programs were taken into consideration, the
total average price is 50 per cent lower than the listed price. Very few of the banks offered
discounted prices for paper-based services in their customer programs.
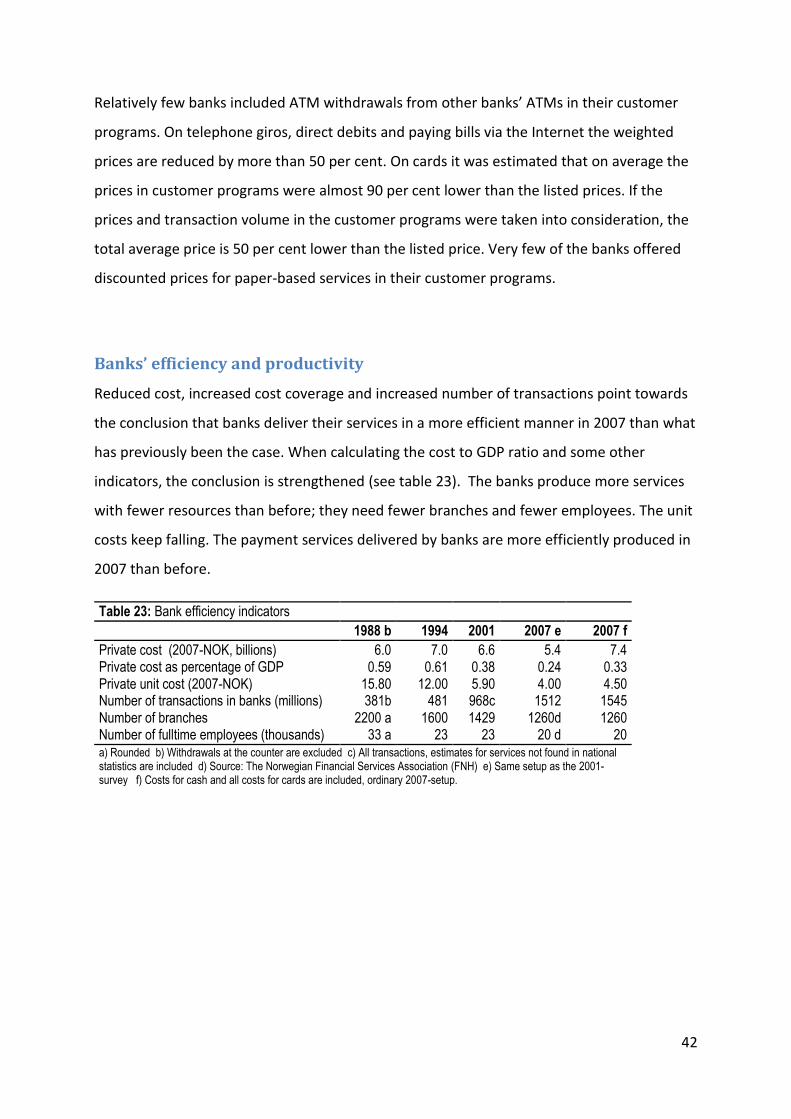
Banks’ efficiency and productivity
Reduced cost, increased cost coverage and increased number of transactions point towards
the conclusion that banks deliver their services in a more efficient manner in 2007 than what
has previously been the case. When calculating the cost to GDP ratio and some other
indicators, the conclusion is strengthened (see table 23). The banks produce more services
with fewer resources than before; they need fewer branches and fewer employees. The unit
costs keep falling. The payment services delivered by banks are more efficiently produced in
2007 than before.
Table 23: Bank efficiency indicators
1988 b 1994 2001 2007 e 2007 f
Private cost (2007-NOK, billions) 6.0 7.0 6.6 5.4 7.4 Private cost as percentage of GDP 0.59 0.61 0.38 0.24 0.33 Private unit cost (2007-NOK) 15.80 12.00 5.90 4.00 4.50 Number of transactions in banks (millions) 381b 481 968c 1512 1545 Number of branches 2200 a 1600 1429 1260d 1260 Number of fulltime employees (thousands) 33 a 23 23 20 d 20 a) Rounded b) Withdrawals at the counter are excluded c) All transactions, estimates for services not found in national statistics are included d) Source: The Norwegian Financial Services Association (FNH) e) Same setup as the 2001-survey f) Costs for cash and all costs for cards are included, ordinary 2007-setup.

43
5 Costs at merchants in 2007
Methodology and process
In 2007-2008, Norges Bank conducted a full-cost survey among merchants on their costs of
handling payments. The merchant survey covered cash and cards payments. 147 businesses
with 696 outlets responded to the survey, and a separate time study was conducted at eight
outlets. Based on the information from the survey and from other sources of information30,
private costs were calculated. Private costs are calculated on the basis of five elements:
costs related to infrastructure, amount paid, time spent in the payment process, cash
holdings and number of outlets per business.
Unfortunately, the response rate to this survey was not as good as expected, and some of
the responses did not meet the expected level of quality. The responses from merchants are
skewed, weighted too heavily on grocery chain stores. The effect is (probably) that
transaction data will be skewed towards small-value payments, and perhaps towards an
overweight of BankAxept payments compared to international card schemes. To
compensate for this, information on the use of payment services from the household survey
shown in chapter 6 is used as a basis for the calculations in the merchant survey. Statistics
on salaries and taxes are based on public statistics. The time study is deemed to be of
appropriate quality. The composition of costs (based on the merchant survey responses) is
used in the calculations. Furthermore, the fee calculation in chapter 2 based on ORBOF and
public statistics from Norges Banks’ Annual Report on Payment Systems form the basis for
fee and subcontractors’ calculations in this chapter.
A detailed description of the methodology and the process is found in appendix.
The merchant survey covers the encircled shaded area in illustration 11. Point of sale
payments is calculated for merchants and others, where others are other companies (not
merchants) and public institutions that can receive payments. Fees paid for bill payments are
also calculated for both merchants and others, as shown in appendix to chapter 2, based on
information from the ORBOF statistics. The costs calculated for the merchants are based on
30
Data from Statistics Norway on salaries, from Norges Bank on use of payment instruments and interest rates, and from ORBOF on fees paid to banks for use of payment services.

44
the survey, and include own production costs and subcontractor costs (fees etc). Others’
costs cover only subcontractors’ costs (fees).
Results
Merchants’ private costs
Total private costs for merchants and others amount to NOK 3.8 billion. Including
seigniorage, merchants’ private cost amounts to NOK 4.0 billions. This should be split on
merchants and others31. Total private costs are shown in Table 24:
31
Lacking information on others besides ORBOF fees paid, as calculated in appendix chapter 2, one should be aware that the sum of costs in this chapter underestimates the “true” private cost for merchants and others. However, the underestimation is likely to be moderate, as we assume that merchants handle the bulk of the number of payments in question.
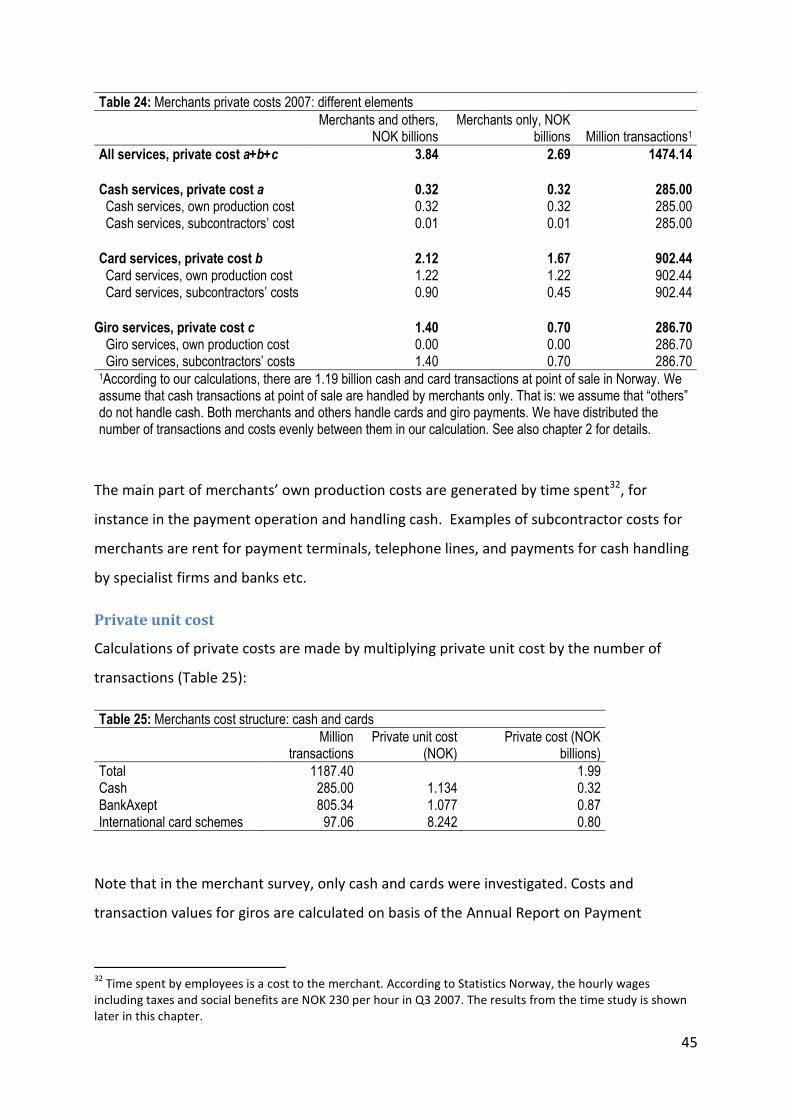
45
Table 24: Merchants private costs 2007: different elements
Merchants and others,
NOK billions Merchants only, NOK
billions Million transactions1 All services, private cost a+b+c 3.84 2.69 1474.14 Cash services, private cost a 0.32 0.32 285.00 Cash services, own production cost 0.32 0.32 285.00 Cash services, subcontractors’ cost 0.01 0.01 285.00 Card services, private cost b 2.12 1.67 902.44 Card services, own production cost 1.22 1.22 902.44 Card services, subcontractors’ costs 0.90 0.45 902.44
Giro services, private cost c 1.40 0.70 286.70 Giro services, own production cost 0.00 0.00 286.70 Giro services, subcontractors’ costs 1.40 0.70 286.70 1According to our calculations, there are 1.19 billion cash and card transactions at point of sale in Norway. We assume that cash transactions at point of sale are handled by merchants only. That is: we assume that “others” do not handle cash. Both merchants and others handle cards and giro payments. We have distributed the number of transactions and costs evenly between them in our calculation. See also chapter 2 for details.
The main part of merchants’ own production costs are generated by time spent32, for
instance in the payment operation and handling cash. Examples of subcontractor costs for
merchants are rent for payment terminals, telephone lines, and payments for cash handling
by specialist firms and banks etc.
Private unit cost
Calculations of private costs are made by multiplying private unit cost by the number of
transactions (Table 25):
Table 25: Merchants cost structure: cash and cards
Million
transactions Private unit cost
(NOK) Private cost (NOK
billions) Total 1187.40
1.99
Cash 285.00 1.134 0.32 BankAxept 805.34 1.077 0.87 International card schemes 97.06 8.242 0.80
Note that in the merchant survey, only cash and cards were investigated. Costs and
transaction values for giros are calculated on basis of the Annual Report on Payment
32
Time spent by employees is a cost to the merchant. According to Statistics Norway, the hourly wages including taxes and social benefits are NOK 230 per hour in Q3 2007. The results from the time study is shown later in this chapter.

46
Systems statistics and the ORBOF fee statistics. Giros are therefore not included in the unit
cost table.
We calculated the merchant private unit costs in Table 26:
Table 26: Merchant cost structure: private unit cost
Cash BankAxept
International payment card
schemes
NOK per transaction NOK per transaction
NOK per transaction
Private unit cost per transaction 1.134 1.077 8.242 Own production cost 1.116 1.070 3.668 Subcontractor cost 0.018 0.007 4.574 Different elements of private unit cost per transaction: Infrastructure 0.034 0.011 0.077 Amount paid 0.013 0.000 4.501 Number of transactions (time spent * salaries etc)
1.004 1.066 3.664
Cash Holdings 0.004 0.000 0.000 Number of Outlets 0.080 0.000 0.000
NOK per transaction at Merchants, average 129.33 147.02 181.40 Time spent per transaction (seconds) 15.70 16.68 57.31 Merchant fee (%, average) 0 % 0 % 2.08 %
As can be seen in the table, most of the cost is generated by own activity (own production
cost) for cash and card transactions. This is mainly the time it takes to process the payment.
Also, international card schemes have a considerable amount generated by own activity.
Once again, we see that processing time is important. International payment cards mainly
depend on signature-technology, which is slower than PIN-technology. As the table shows,
subcontractor cost is the largest part of private unit cost for international card schemes,
mainly due to the merchant fee, calculated as a percentage of the amount paid.
BankAxept is a very efficient payment solution to merchants. Costs per transaction are low,
and do not increase by the value paid, as they do for cash payments and international card
payments. The merchants seem to have understood this, and the popularity of the
BankAxept scheme is very high – reflected by the widespread use of the scheme.

47
Payment instruments used at point of sale
Even though the results from the survey may not be representative, the results are still
interesting. Since the sample was skewed towards grocery stores, we expected the use of
BankAxept cards to be higher than for the society as a whole. As discussed in Gresvik and
Haare (2008a) and in chapter 6, the calculation of transactions based on the household
survey in combination with the domestic payment statistics from Norges Banks’ Annual
Report on Payment Systems 2007 give a good estimate of the “real” use of payment
instruments. The results from the merchant survey deviated from the “real” use of payment
services in the expected direction. The results from the merchant survey are shown in
Illustration 12.
The merchants received 25% of their payments in cash, 1 % by international payment cards,
and 74 % was paid by using BankAxept cards. The percentages are the same for the number
of transactions and for volume paid. The use of international card schemes is low, since
grocery shops are overrepresented in the survey. In Norway most grocery shops do not
accept international card schemes. Use of these schemes is more common in buying travel
services (transportation and hotels), capital intensive goods or services and in internet-
shopping.
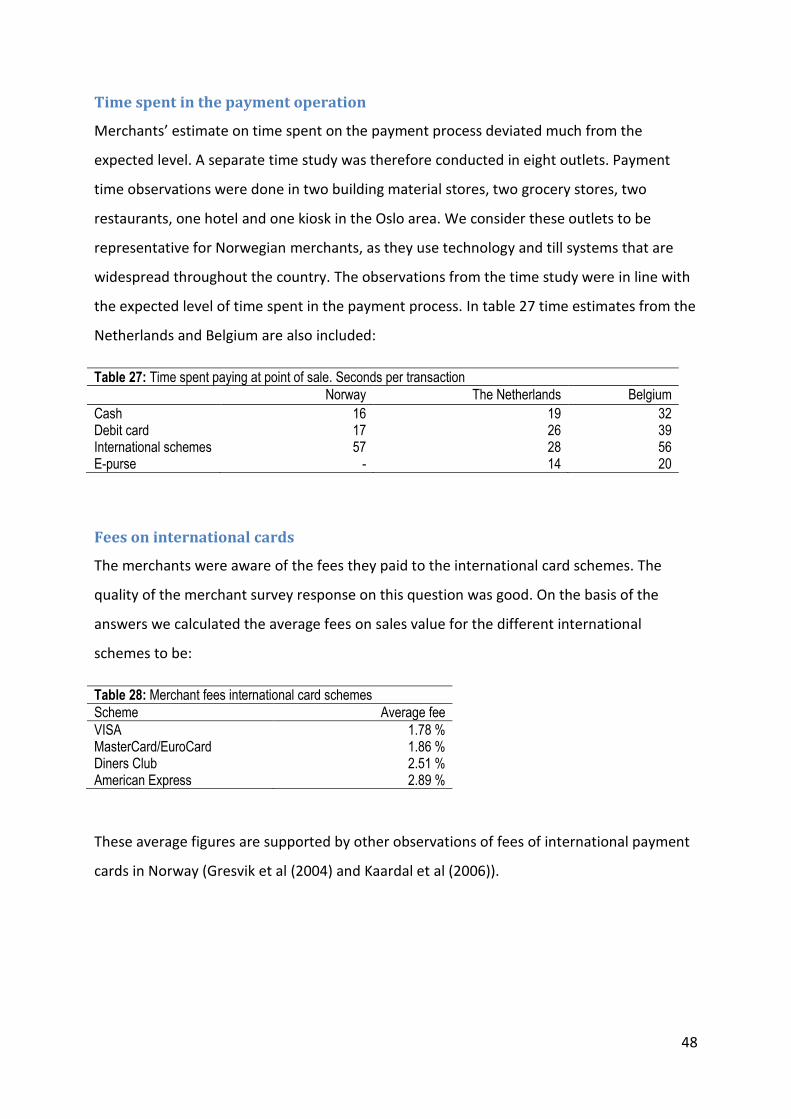
48
Time spent in the payment operation
Merchants’ estimate on time spent on the payment process deviated much from the
expected level. A separate time study was therefore conducted in eight outlets. Payment
time observations were done in two building material stores, two grocery stores, two
restaurants, one hotel and one kiosk in the Oslo area. We consider these outlets to be
representative for Norwegian merchants, as they use technology and till systems that are
widespread throughout the country. The observations from the time study were in line with
the expected level of time spent in the payment process. In table 27 time estimates from the
Netherlands and Belgium are also included:
Table 27: Time spent paying at point of sale. Seconds per transaction Norway The Netherlands Belgium
Cash 16 19 32 Debit card 17 26 39 International schemes 57 28 56 E-purse - 14 20
Fees on international cards
The merchants were aware of the fees they paid to the international card schemes. The
quality of the merchant survey response on this question was good. On the basis of the
answers we calculated the average fees on sales value for the different international
schemes to be:
Table 28: Merchant fees international card schemes
Scheme Average fee
VISA 1.78 % MasterCard/EuroCard 1.86 % Diners Club 2.51 % American Express 2.89 %
These average figures are supported by other observations of fees of international payment
cards in Norway (Gresvik et al (2004) and Kaardal et al (2006)).

49
6 Household costs in 2007
Methodology and process
The survey covered Norwegian households’ payment habits. The results from the survey
form the basis for estimation of the use of cash at point of sale in Norway, and the results
are used in all calculations in this memo. Details of the calculation are shown in Gresvik and
Haare (2008a). The number of payment transactions in Norway in 2007 at point of sale (cash
and cards) and bill payments (giro) is estimated to be 1.83 billion. Of these, 1.43 billion is
made by the households.
To calculate households’ payments costs, we used information on salaries33 from Statistics
Norway, and observations and assumptions on the time spent paying, and by making cash
deposits and withdrawals. In addition, information on payment fees from ORBOF was used
(see chapter 2) to estimate social and private costs of households.
The most important assumptions are:
Time spent: for payments at point of sale we assume that the observations from the time
study in the merchant survey are valid also for households. For time spent depositing and
withdrawing cash we make assumptions of how much time each transaction requires. The
exact number of seconds is stated in the appendix to this chapter.
Salaries: We assume that the cost of spare time is at least as valuable as average hourly
wages after tax. It can be argued that this value is higher, since the individual prefer spare
time instead of working these hours, but the information to calculate this premium is
insufficient. We therefore assume that the minimum value is the valid value of spare time to
attribute to time spent paying.
Number of transactions: We assume that the survey gives an accurate response to the
number of transactions performed through a year. This is discussed in Gresvik and Haare
(2008a). Evidence found in Jonker and Kosse (2008) indicate that the approach used in the
household survey might systematically underestimate the number of small-value payments.
In lack of better information, we still choose to use the data.
33
Salary per hour after tax is NOK 154.83 on average for all industries

50
We have made changes in the data set in the survey. These changes are based on an a priori
expectation that was confirmed in the survey results: BankAxept is a poorly recognised
brand name, while VISA is a highly recognised brand. Most Norwegians primary payment
card is a co-branded card, where BankAxept is the default option, VISA is normally only in
use when the cardholder is abroad. The number of VISA transactions in the survey is
apparently overestimated by 40 percentage points compared to domestic data, while the
number of transactions based on BankAxept cards is underestimated by 38 percentage
points.
The estimates for time use in the different payment operations are essential for the results.
Time used for the different payment instruments have been surveyed separately, but for
other activities we have used figures from other surveys (see chapter 7) or data based on our
own experience.
The data in this survey was obtained in a market survey carried out by Norstat, a market
research company, on Norges Bank’s behalf. The sample drawn was representative of the
Norwegian population 16 years and older.
Further details can be found in appendix to this chapter.
The costs in the Household survey are encircled in green in illustration 13:
Appendix Graph 1

51
Results
Main results on households’ payment cost
Households’ private costs amount to NOK 5.09 billion. This is:
Households’ own production cost: NOK 2.18 billion
Fees paid by households: NOK 2.91 billion
= Sum private cost NOK 5.09 billion
For the household sector, seigniorage is calculated to be NOK 0.46 billion. It is not shown in
Table 29; as it does not affect the social cost34.
Table 29: Households: private costs 2007
NOK billions
Million transactions
All services’ private cost (a+b+c) 5.09
1427.1
Cash services, private cost (a) 1.44
285.0 Cash services, own production cost 0.85
285.0
Cash services, subcontractors’ cost 0.59
285.0
Card services, private cost (b) 2.00
902.4 Card services, own production cost 0.82
902.4
Card services, subcontractors’ costs 1.18
902.4
Giro services, private cost (c) 1.65
223.9 Giro services, own production cost 0.51
223.9
Giro services, subcontractors’ costs 1.13
223.9
Households’ own production costs consist of estimated time cost walking to and from ATMs
and withdrawing money from the ATM (NOK 0.47 billion), depositing and withdrawing cash
at a banks’ counter (NOK 0.18 billion) and time spent paying in shops etc (NOK 1.53 billion).
The assumptions to this can be found in appendix to this chapter.
The households pay banks fees for use of payment services. The calculation on fees is found
in appendix to chapter 4. Own production costs are generated by using different services,
and are based on number of transactions and time spent paying /withdrawing / depositing.
The results from the calculation are shown in the tables below:
34
To the households, seignorage cost is (should be) part of the information in which decisions of cash versus deposit use should be made.

52
Table 30: Households: fees paid by households, distributed on different services Payment service Fee (NOK billion) Paper-based giro 0.34 Electronic giro 0.34 Cards 1.78 Transfers 0.01 Other payment services 0.44 Sum 2.91
Own production cost is distributed as follows:
Table 31: Households: own production costs, by service Service Own production cost (NOK billion) Cash 0.85 Cash withdrawals and deposits 0.66 Cash Payments 0.19 Cards 0.82 Giro 0.51 Sum 2.18
Households’ costs: details
Fees
For many years, Norwegian banks’ prices have reflected relative differences in the costs of
the various payment services. This has facilitated a move from services with a large element
of manual processing to electronic services. Banks’ income from the payment system was
mainly based on transaction charges. This has changed, today a considerable share of the
income comes from standing charges associated with customer programs and payment
cards. At the same time, customer programs give large discounts on the listed prices. The
programs make it more difficult for customers to compare prices for payment services of the
various banks. This may hinder competition. Some banks have recently abolished annual
fees. This may make it difficult to achieve cost recovery in the payment system.
ORBOF-fees
Banks’ income from payment services is registered in the ORBOF (official reporting from
banks and finance companies on accounts and income/cost). In their reporting, the banks
don’t split the income between income from merchants and income from households. The
ORBOF fees are therefore distributed in this analysis according to the setup in chapter 2,
based on the transaction statistics from the Norges Banks’ Annual Report on Payment

53
Systems 2007. Details concerning the calculations distributing the ORBOF-income between
merchants and households are found in the appendix to chapter 2.
Interest cost (alternative value of money)
Money deposited in a bank earns interest, as opposed to cash held, which give no yield. The
“loss” incurred is called seigniorage cost, and is calculated in this analysis based on the
average interest rate of NIBOR tomorrow / next for 2007 (5.15 % p.a.) The counterpart to
this cost is the seigniorage income earned by the central bank. Seigniorage is discussed in
more detail in appendix to chapter 2.
Time costs
Households spend time on several operations in their payment activities: Time is spent when
they withdraw cash from an ATM, they also spend time getting to the ATM and when paying
in a store. If we assume that time spent on these operations could be used on something
else having a pecuniary value, these activities have a value we can calculate. In our
calculations time cost represents nearly 48 % of households’ total costs for paying.
Cost for households paying bills
Households spend time when paying bills (giros) in a bank or when carrying out an Internet
payment at home. The household survey does not include these payments. We have not
found any information on time spent on these operations from other Norwegian sources. In
the calculations for households’ costs on bill payments, we assumed that a bill payment
would on average require 60 seconds. This is an assumption made to illustrate the cost, and
further study is required to make a more precise estimate.

54
Other results
The use of cards and cash
Based on the information from the survey the use of different payment instruments
calculated for Norway total for 2007 is as follows:
Table 32: Households: number of transactions in Norway, 2007,basis: household survey and domestic statistics
Base: residents Transactions Value
Million transactions
Per cent NOK
billion Per cent
Point of sale total 1209.0 100.0 % 432.1 100.0 % Cash use 285.0 23.6 % 62.1 14.4 % Card use 924.0 76.4 % 370.0 85.6 % BankAxept 805.3 66.6 % 298.1 69.0% Petrol companies cards 21.6 1.8 % 10.8 2 .5% Visa, MasterCard, American Express and Diners Club 97.1 8.0% 61.0 14 .1%
Based on survey results, cash use in Norway is low both measured by number of transactions
and by value. The value is just 14 % of the value of sales at point of sale, while the number of
cash transactions is just 24 % of the total. As can be seen from the table, card payments
dominate at point of sale.
Norway is not a country with a very large tourist industry, so the effect of foreigners paying
at point of sale in Norway is not substantial. However, it is likely that foreign visitors have a
different payment pattern than Norwegians; they don’t have access to the BankAxept
solution, and will be more dependent on cash and international payment card schemes. In
this analysis we have focused on residents’ activities, so visitors are omitted.
The bulk of card use in Norway is through the domestic debit card solution, BankAxept. In
2007 debit cards account for 67 % of the number of transactions and 69 % of the value,
while international card schemes account for 8 % of the number of transactions and 14 % of
the value. The remainder is made up by petrol companies’ cards and other local card
solutions.
Low cash use in Norway is indirectly supported by other surveys
As described earlier in this chapter, our household survey revealed that 14 % of the value
and 24 % of the transactions at POS are paid by cash. This might seem to be very low. The
55
figures are much lower than corresponding figures from other European countries; a
possible explanation might be that information from other countries dates back a few years.
The findings are to a large extent supported by other Norwegian surveys: The Norwegian
Saving Banks Association (Sparebankforeningen) has each year since 2000 conducted a
series of surveys primarily targeting the general public’s attitudes to Internet banking. A
minor part also deals with the use of cards and cash. The survey reveals that the use of cards
in grocery stores has risen in the period 2005-2007. In 2007, 77 % used cards in payment
operations at least every second time (of these 42 % always used cards, 20 % normally used
cards and 15 % used cards every second time). 8 % never use cards when paying for
groceries. In 2005, 72 % used their cards at least every second time.
A survey from BBS mapped the general public’s attitudes towards the use of payment cards
in 2007. In the survey, cards were the preferred way of paying for 74 %, while 23 % preferred
cash. Every fourth card holder stated that he/she uses his/her cards more than ten times a
week.
Possible shortcomings of the household survey are elaborated in chapter 3.

56
7 Cost surveys compared
Introduction
Cost surveys have been carried out in a number of countries. In this chapter we have
gathered information from the different surveys and tried to compare results. Comparison
cannot be made easily, as both scopes and methodologies differ markedly. Furthermore,
payment systems differ between countries, for example is the relative use of services with
cost characteristics that varies very different between the countries discussed in this
chapter. The size of the country matters as well, since many payment services are prone to
be sensitive to effects from economies of scale.
The published cost surveys35 can be divided in two groups:
Surveys that calculate private and social costs of the national payment systems.
These are surveys from Belgium, the Netherlands, Sweden, Portugal and Norway.
Surveys that analyses whether the society is better off when inhabitants conduct an
additional transaction by using payment cards than using paper instruments. These
are surveys from Australia and USA. They also evaluate the costs and benefits of the
transaction using different payment instruments The Australian study focuses on the
marginal costs and benefits faced by consumers and merchants using different
payment instruments
In this chapter we only refer to results from the European surveys. They have been
conducted in countries with (relatively) similar payment systems and payment habits, where
debit cards and giro are popular and cheques are not. The surveys also use similar
methodologies, even if methodological choices separate them as well.
35
Netherlands survey: Brits and Winder (2005) and Working Group on costs of POS payment products (2004), Belgium survey: Nationale Bank van Belgié (2005), Sweden: Bergman et al (2007) and (2008), Portugal: Banco de Portugal (2007), USA : Garcia-Swartz et al (2006a, b), Australia: Simes et al (2006).

57
Five cost surveys
In the table below some data and characteristics from the cost surveys in Belgium, the
Netherlands, Sweden, Portugal, and Norway are shown36. The surveys have to some extent
the same scope, although it appears that the focus varies from survey to survey. The Belgian
and the Dutch surveys have more or less identical scopes.
This simple comparison does not show all details of the surveys.
These countries are small and medium-sized. The varying size can influence the cost
structure for the different agents and for the instruments. We therefore start out with some
basic information from the countries37.
Table 33: Country information
Belgium The Netherlands Sweden Portugal Norway
Survey year 2003 2002 2002 2005 2007
Population (million) 10.4 16.2 8.9 10.6 4.7 GDP total (billion) 274.73 € 465.21 € 264.24 € 149.12 € 285.37 €38 Currency in circulation (billion) 14.2 € 16.9 € 10.4 € 12.8 € 6.3 € Value of currency as % of GDP 5.2 % 3.6 % 3,94 % 8.6 % 2.2 % Million card payments 614.5 1192.8 454.0 761.5 967,0 Card transactions per inhabitant per year
59.2 73.6 50.9 72.2 205.7
Cards issued (millions) 15.6 26.7 10.4 16.4 9.239 ATMs (thousands) 12.5 7.5 2.6 13.8 2.3 POS terminals (thousands) 113.1 177.2 102.0 147.1 107.5
Methodology and scope
Full cost surveys were conducted in the Netherlands and in Belgium, but they did not take
into consideration household costs (shoe-leather cost etc). The studies also focused on
point-of-sale services only (cash, cards and e-money), while bill payments were omitted. In
the Netherlands the variable costs are either transaction-linked or sales-linked. This might
be compared with the cost drivers in the ABC framework in the Norwegian survey.
36
For details, it is advised to read the country reports. 37
Information is collected from the ECB Statistics Data Warehouse for EU countries, the annual reports from the Belgian, Dutch, Portuguese and Swedish central banks and Norges Bank’s Annual Report on Payment Systems 2007. 38
Exchange rate: 1 € = NOK 8.02, daily average 2007. 39
The figure is the number of physical cards. These cards have altogether 15.3 mill different functions (debit + credit).
58
The Swedish study focused on point of sale services, and covered many of the cost elements
from the Norwegian survey. However, bill payments were not investigated in the Swedish
survey.
The Portuguese survey considers both costs and benefits of the payment system. The
Portuguese survey only looks at costs in the banking industry (based on an ABC-framework),
and has no social cost calculations for the whole payment chain.
We would expect social costs in Norway to be higher than in the other countries based on
the scope of the analyses. Point of sale costs should be comparable for Norway and Sweden,
since roughly the same cost elements are included in both countries’ studies.
Differences in use of payment services will affect the comparison of the analyses. Debit card
payments have a systematically low social cost – in countries with a high use of debit card
relative to credit card and cheques, the social cost will be lower than when the relationship
is the opposite.

59
Tab
le 3
4: C
hara
cter
istic
s of
the
surv
eys
Bel
gium
2003
Iden
tify
and
calc
ulat
e to
tal
cost
at P
OS
and
cal
cula
te
poss
ible
cos
t sav
ings
whe
n su
bstit
utin
g
expe
nsiv
e w
ith c
heap
er
inst
rum
ents
.
The
wor
k w
as in
itiat
ed b
y
an a
gree
men
t bet
wee
n th
e
fede
ral m
inis
ters
of f
inan
ce
and
cons
umer
pro
tect
ion
and
the
Bel
gian
Ass
ocia
tion
of B
anks
. The
Bel
gian
Nat
iona
l Ban
k
chai
red
a st
eerin
g
com
mitt
ee a
long
with
repr
esen
tativ
es fr
om th
e
indu
stry
. Tw
o w
orki
ng
grou
ps w
ere
esta
blis
hed.
The
Net
herla
nds
2002
Iden
tify
and
calc
ulat
e
soci
al c
osts
at P
OS
and
calc
ulat
e po
ssib
le c
ost
savi
ngs
whe
n su
bstit
utin
g
expe
nsiv
e w
ith c
heap
er
inst
rum
ents
.
The
wor
k st
arte
d ou
t fro
m
the
reco
mm
enda
tions
from
the
Wel
link
Wor
king
Gro
up. T
he p
ract
ical
wor
k
was
car
ried
out b
y a
wor
king
gro
up c
onsi
stin
g
of a
pro
ject
team
from
DN
B, r
epre
sent
ativ
es fr
om
the
indu
stry
, Int
erpa
y,
reta
ilers
and
con
sum
ers.
Sw
eden
2002
Cal
cula
te s
ocia
l and
priv
ate
cost
for
PO
S p
aym
ents
in S
wed
en
and
exam
ine
the
thre
shol
ds
abov
e w
hich
one
inst
rum
ent i
s
chea
per
than
ano
ther
.
Wor
k in
Sw
eden
hav
e be
en
carr
ied
out i
n tw
o ph
ases
:
2002
/200
4: T
he R
iksb
ank
colle
cted
dat
a fr
om th
e fo
ur
larg
est S
wed
ish
bank
s. C
ost
reco
very
was
focu
sed.
200
7: th
e
surv
ey w
as s
uppl
emen
ted
by a
soci
al a
nd p
rivat
e co
st
calc
ulat
ion
done
by
Rik
sban
ks’
empl
oyee
s an
d on
e ac
adem
ic
from
a S
wed
ish
Uni
vers
ity.
Por
tuga
l
2005
The
pur
pose
of t
he
stud
y w
as to
ass
ess
the
cost
s an
d
bene
fits
of th
e
Por
tugu
ese
paym
ent s
yste
m.
Hea
ded
by a
stee
ring
com
mitt
ee
with
rep
rese
ntat
ives
from
Ban
co d
e
Por
tuga
l, m
embe
rs
of C
ISP
, the
Por
tugu
ese
Ban
king
asso
ciat
ion
and
5
bank
s. A
tech
nica
l
wor
king
gro
up w
as
also
est
ablis
hed.
An
expe
rt g
roup
in
Ban
co d
e P
ortu
gal
ensu
red
cont
inui
ty
of th
e w
ork.
Nor
way
2007
Cal
cula
te s
ocia
l and
priv
ate
cost
s of
the
paym
ent
serv
ices
in N
orw
ay;
calc
ulat
e ba
nks’
priv
ate
unit
cost
, com
pare
200
7-co
st
with
cos
ts fr
om 2
001
and
carr
y ou
t cal
cula
tions
on
bank
s’ e
ffici
ency
.
Nor
ges
Ban
k to
ok a
n
initi
ativ
e ve
rsus
ban
ks a
nd
bank
s’ a
ssoc
iatio
ns. I
t als
o
coop
erat
ed w
ith r
etai
l tra
de
asso
ciat
ions
. No
stee
ring
grou
p. A
part
from
the
inpu
t
from
the
bank
s m
ost w
ork
has
been
don
e by
two
empl
oyee
s in
Nor
ges
Ban
k.
Res
ults
from
(yea
r)
Sco
pe
Org
aniz
ing
the
surv
eys
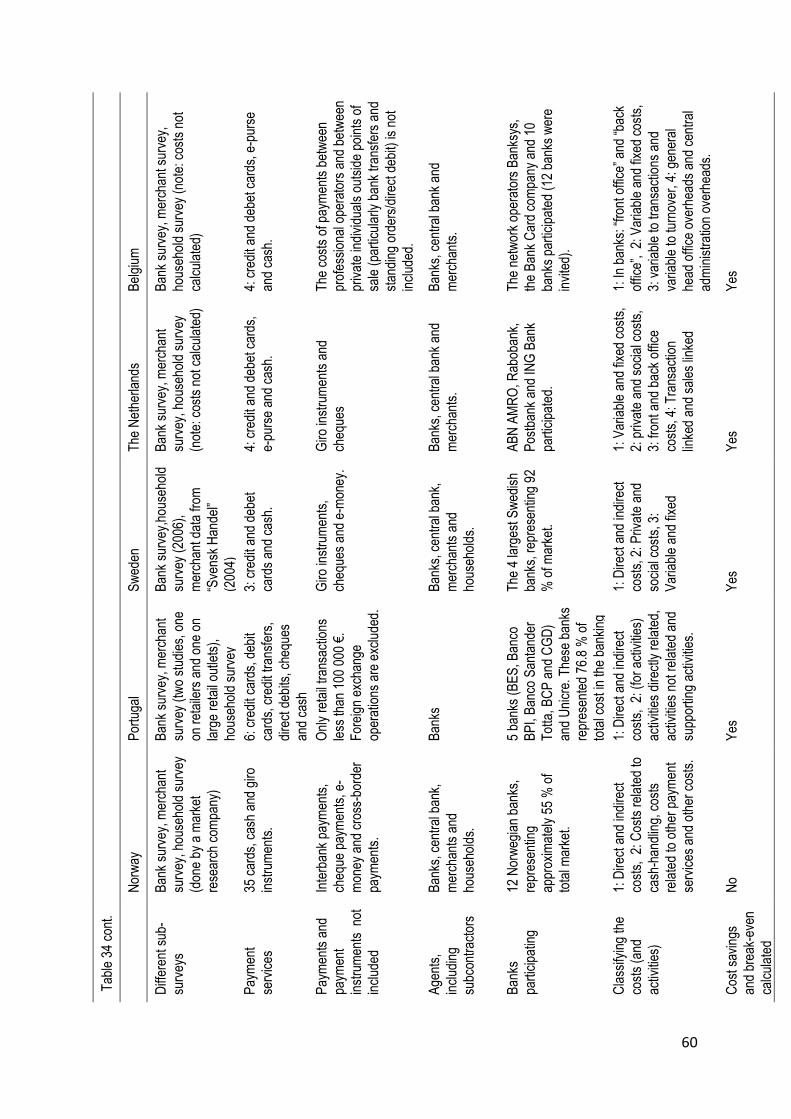
60
Tab
le 3
4 co
nt.
Bel
gium
Ban
k su
rvey
, mer
chan
t sur
vey,
hous
ehol
d su
rvey
(no
te: c
osts
not
calc
ulat
ed)
4: c
redi
t and
deb
et c
ards
, e-p
urse
and
cash
.
The
cos
ts o
f pay
men
ts b
etw
een
prof
essi
onal
ope
rato
rs a
nd b
etw
een
priv
ate
indi
vidu
als
outs
ide
poin
ts o
f
sale
(pa
rtic
ular
ly b
ank
tran
sfer
s an
d
stan
ding
ord
ers/
dire
ct d
ebit)
is n
ot
incl
uded
.
Ban
ks, c
entr
al b
ank
and
mer
chan
ts.
The
net
wor
k op
erat
ors
Ban
ksys
,
the
Ban
k C
ard
com
pany
and
10
bank
s pa
rtic
ipat
ed (
12 b
anks
wer
e
invi
ted)
.
1: In
ban
ks: “
fron
t offi
ce”
and
“bac
k
offic
e”,
2: V
aria
ble
and
fixed
cos
ts,
3: v
aria
ble
to tr
ansa
ctio
ns a
nd
varia
ble
to tu
rnov
er, 4
: gen
eral
head
offi
ce o
verh
eads
and
cen
tral
adm
inis
trat
ion
over
head
s.
Yes
The
Net
herla
nds
Ban
k su
rvey
, mer
chan
t
surv
ey, h
ouse
hold
sur
vey
(not
e: c
osts
not
cal
cula
ted)
4: c
redi
t and
deb
et c
ards
,
e-pu
rse
and
cash
.
Giro
inst
rum
ents
and
cheq
ues
Ban
ks, c
entr
al b
ank
and
mer
chan
ts.
AB
N A
MR
O, R
abob
ank,
Pos
tban
k an
d IN
G B
ank
part
icip
ated
.
1: V
aria
ble
and
fixed
cos
ts,
2: p
rivat
e an
d so
cial
cos
ts,
3: fr
ont a
nd b
ack
offic
e
cost
s, 4
: Tra
nsac
tion
linke
d an
d sa
les
linke
d
Yes
Sw
eden
Ban
k su
rvey
,hou
seho
ld
surv
ey (
2006
),
mer
chan
t dat
a fr
om
“Sve
nsk
Han
del”
(200
4)
3: c
redi
t and
deb
et
card
s an
d ca
sh.
Giro
inst
rum
ents
,
cheq
ues
and
e-m
oney
.
Ban
ks, c
entr
al b
ank,
mer
chan
ts a
nd
hous
ehol
ds.
The
4 la
rges
t Sw
edis
h
bank
s, r
epre
sent
ing
92
% o
f mar
ket.
1: D
irect
and
indi
rect
cost
s, 2
: Priv
ate
and
soci
al c
osts
, 3:
Var
iabl
e an
d fix
ed
Yes
Por
tuga
l
Ban
k su
rvey
, mer
chan
t
surv
ey (
two
stud
ies,
one
on r
etai
lers
and
one
on
larg
e re
tail
outle
ts),
hous
ehol
d su
rvey
6: c
redi
t car
ds, d
ebit
card
s, c
redi
t tra
nsfe
rs,
dire
ct d
ebits
, che
ques
and
cash
Onl
y re
tail
tran
sact
ions
less
than
100
000
€.
For
eign
exc
hang
e
oper
atio
ns a
re e
xclu
ded.
Ban
ks
5 ba
nks
(BE
S, B
anco
BP
I, B
anco
San
tand
er
Tot
ta, B
CP
and
CG
D)
and
Uni
cre.
The
se b
anks
repr
esen
ted
76.8
% o
f
tota
l cos
t in
the
bank
ing
syst
em.
1: D
irect
and
indi
rect
cost
s, 2
: (fo
r ac
tiviti
es)
activ
ities
dire
ctly
rel
ated
,
activ
ities
not
rel
ated
and
supp
ortin
g ac
tiviti
es.
Yes
Nor
way
Ban
k su
rvey
, mer
chan
t
surv
ey, h
ouse
hold
sur
vey
(don
e by
a m
arke
t
rese
arch
com
pany
)
35 c
ards
, cas
h an
d gi
ro
inst
rum
ents
.
Inte
rban
k pa
ymen
ts,
cheq
ue p
aym
ents
, e-
mon
ey a
nd c
ross
-bor
der
paym
ents
.
Ban
ks, c
entr
al b
ank,
mer
chan
ts a
nd
hous
ehol
ds.
12 N
orw
egia
n ba
nks,
repr
esen
ting
appr
oxim
atel
y 55
% o
f
tota
l mar
ket.
1: D
irect
and
indi
rect
cost
s, 2
: Cos
ts r
elat
ed to
cash
-han
dlin
g, c
osts
rela
ted
to o
ther
pay
men
t
serv
ices
and
oth
er c
osts
.
No
Diff
eren
t sub
-
surv
eys
Pay
men
t
serv
ices
Pay
men
ts a
nd
paym
ent
inst
rum
ents
not
incl
uded
Age
nts,
incl
udin
g
subc
ontr
acto
rs
Ban
ks
part
icip
atin
g
Cla
ssify
ing
the
cost
s (a
nd
activ
ities
)
Cos
t sav
ings
and
brea
k-ev
en
calc
ulat
ed

61
Results
The level of the calculated social cost in the different countries reflects differences in scope,
methodology and use of payment services. Table 35 illustrate that the social cost is not
directly comparable between countries due to different scope and methodology. Still, we
can make some observations from the surveys that can illustrate how the differences in use
of services affect the results.
Table 35: Social cost
Country Year Agents Services Costs as % of GDP
Norway 2007 Banks, merchants and households
Cash, cards, giro 0.49 %
Portugal 2005 Banks Cash, cards, cheque, giro 0.77 %
Sweden 2002 Banks, merchants and households
Cash, cards 0.40 %
Belgium 2003 Banks, merchants Cash, cards, e-money 0.74 % The Netherlands 2002 Banks, merchants Cash, cards, e-money 0.65 %
The scope of the surveys can be measured by investigating how large proportion of non-cash
transactions is covered and how many agents the surveys include. The table below shows
this, note that cash transactions are excluded.
Table 36: Scope of surveys
Number of transactions in the survey in per cent of total number of transactions (cash
payments excluded)
Number of agents in the survey to total number of agents. 6 (potential)
agents: banks, central bank, subcontractors, payers, payees and
bill issuers
Norway 100 % 5 of 6 Portugal 100 % 3 of 6 Sweden 51 % 4 of 6 Belgium 40 % 4 of 6 The Netherlands 35 % 4 of 6
The low percentages for Belgium, The Netherlands and Sweden are due to the fact that giro
transactions (bill payments) are not a part of these surveys. The Portuguese and the
Norwegian surveys cover all transactions (insignificant instruments like e-money and cheque
are omitted in the Norwegian survey).

62
In Norway the point of sale services represents 79 % of total costs, while bill payment / giro
represent 21 %. In Norway the use of cheques is almost non-existent. If we only look at the
relative cost share of POS instruments we have the following picture:
Table 37: Relative cost share of point of sale services
Country Cash Cards Other
Norway 39 % 61 % - Portugal 18 % 52 % (cheques ) 30% Sweden 77 % 23 % - Belgium 78 % 20 % (e-money) 2 % The Netherlands 73 % 24 % (e-money) 3 %
Sweden, Belgium and The Netherlands have almost the same structure, while the structures
in Norway and especially Portugal are different. The high cost share of cash in Sweden,
Belgium and the Netherlands is somewhat surprising. These countries also have efficient
payment systems with a high card use. An explanation to the relatively low share of cash
cost in Norway is the low use of cash, an efficient distribution system for cash and a very
extensive use of cards (compared to Sweden, Belgium and The Netherlands). The low share
of cash cost in Portugal is probably due to the limited scope of that survey – only banks’ cost
on deposits and withdrawals are included. One should also note that the calculations for
Norway are based on more recent data than in the other countries – so the move from cash
to cards has had a few more years in Norway.
If we just look at the Norwegian banks the ratio of total private costs for cash and cards is
the same as the ratio for social costs for cash and cards for Norway, 39 % vs. 61 %. In
chapter 6 cash use in Norway is further elaborated.
The costs in the payment process may be split on the various agents participating:
Table 38: Agent’s share of social cost
Country Banks Currency issuing
Merchants Households
Norway 66 % 1 % 14 % 20 % Portugal40 - - Sweden 62 % 3 % 19 % 16 % Belgium 47 % 2 % 51 % - The Netherlands 48 % 2 % 50 % -
40
Only banks’ costs are included in the survey.
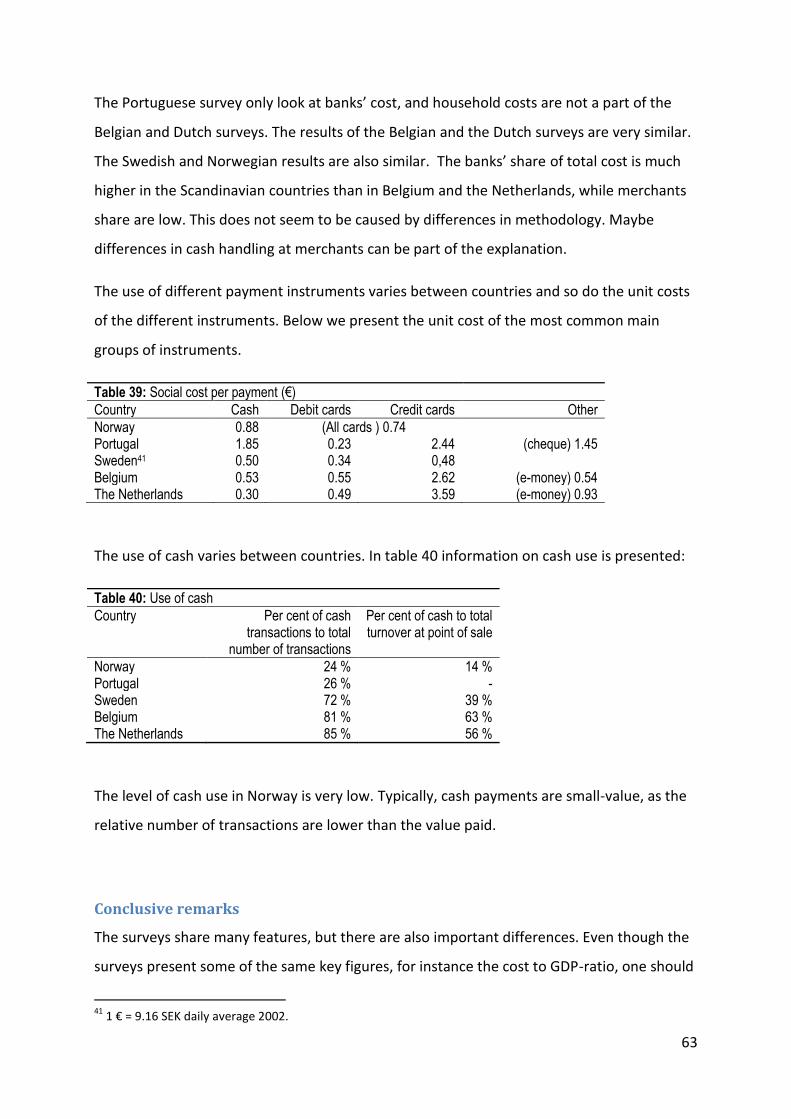
63
The Portuguese survey only look at banks’ cost, and household costs are not a part of the
Belgian and Dutch surveys. The results of the Belgian and the Dutch surveys are very similar.
The Swedish and Norwegian results are also similar. The banks’ share of total cost is much
higher in the Scandinavian countries than in Belgium and the Netherlands, while merchants
share are low. This does not seem to be caused by differences in methodology. Maybe
differences in cash handling at merchants can be part of the explanation.
The use of different payment instruments varies between countries and so do the unit costs
of the different instruments. Below we present the unit cost of the most common main
groups of instruments.
Table 39: Social cost per payment (€)
Country Cash Debit cards Credit cards Other
Norway 0.88 (All cards ) 0.74 Portugal 1.85 0.23 2.44 (cheque) 1.45 Sweden41 0.50 0.34 0,48 Belgium 0.53 0.55 2.62 (e-money) 0.54 The Netherlands 0.30 0.49 3.59 (e-money) 0.93
The use of cash varies between countries. In table 40 information on cash use is presented:
Table 40: Use of cash
Country Per cent of cash transactions to total
number of transactions
Per cent of cash to total turnover at point of sale
Norway 24 % 14 % Portugal 26 % - Sweden 72 % 39 % Belgium 81 % 63 % The Netherlands 85 % 56 %
The level of cash use in Norway is very low. Typically, cash payments are small-value, as the
relative number of transactions are lower than the value paid.
Conclusive remarks
The surveys share many features, but there are also important differences. Even though the
surveys present some of the same key figures, for instance the cost to GDP-ratio, one should
41
1 € = 9.16 SEK daily average 2002.

64
be cautious when comparing. All numbers must be regarded as indications. One should also
be aware that in addition to what can be considered as “technical differences”, there are
real differences between the payment systems.
Even though it is difficult to compare the surveys, we think that comparisons between
countries are valuable. The results can be used as a benchmark for countries working to
improve their payment systems.
This chapter illustrates that it is necessary to improve or coordinate the development of
methodologies in this field to be able to compare countries in a more consistent manner.
With SEPA being established in Europe, standardizing payment solutions, perhaps
differences in services will be less of a problem in the future.
8 Conclusion
In this analysis we have calculated the cost of payments. We have demonstrated that using
data from surveys and statistics can provide a basis for the calculations made, but there are
also shortcomings to this approach.
The analysis covers payment activities in banks, at merchants / point of sale, and in
households. The analysis covers the most widely used payment services. The full cost to the
society of cash and card use, and most of the cost to the society of giro use is calculated.
However, some services have deliberately been omitted42. To calculate the full (true) social
cost, a widening of the scope would be necessary.
The social costs of payments is low, only 0.49 % of GDP in Norway in 2007. Roughly half the
costs are generated by card payments. In 2007, a total of 1.8 billion cash, card and giro
payments were made; banks processed more than 1.5 billion of these. Banks have improved
their efficiency in delivering payment services, producing more transactions at a lower cost
than before. Production costs, mainly costs in banks and at banks’ subcontractors, account
for about 2/3 of social cost.
42
The analysis does not calculate costs of cheques, E-money, interbank transfers or cross-border payments. Payments carried out by Norwegians abroad or visitors to Norway are not covered by the analysis. This is partly due to low use, but also to limit the scope of the analysis.
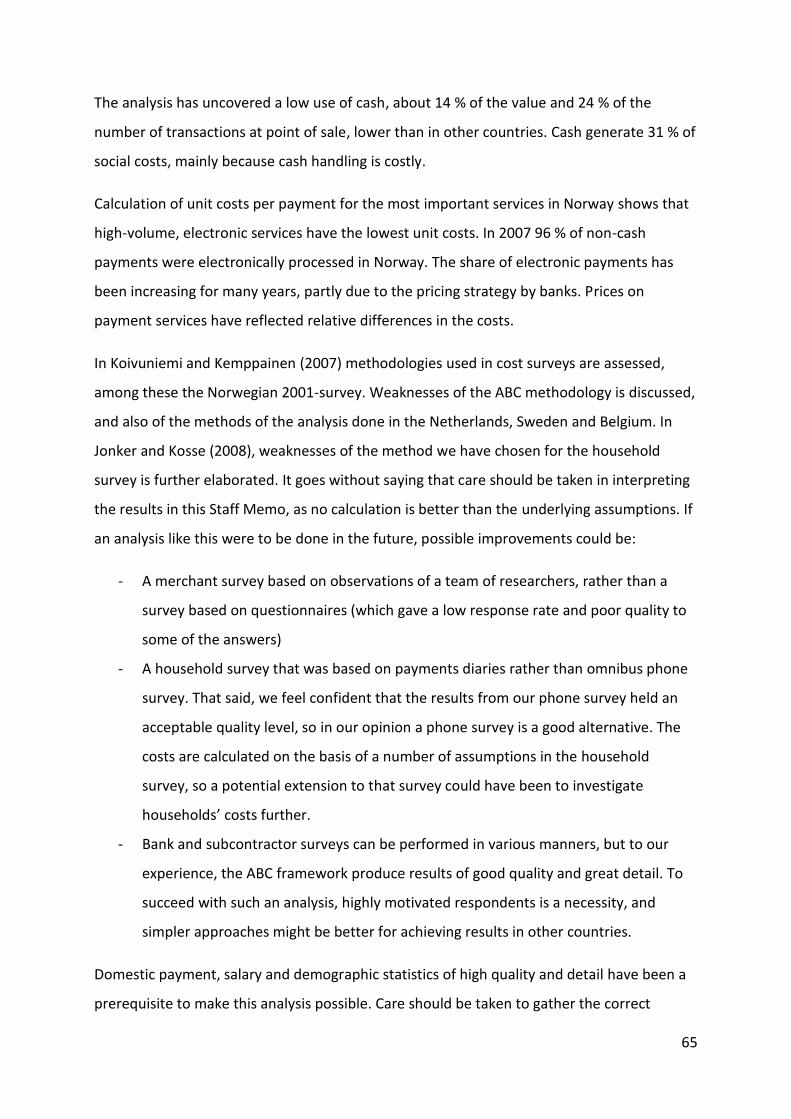
65
The analysis has uncovered a low use of cash, about 14 % of the value and 24 % of the
number of transactions at point of sale, lower than in other countries. Cash generate 31 % of
social costs, mainly because cash handling is costly.
Calculation of unit costs per payment for the most important services in Norway shows that
high-volume, electronic services have the lowest unit costs. In 2007 96 % of non-cash
payments were electronically processed in Norway. The share of electronic payments has
been increasing for many years, partly due to the pricing strategy by banks. Prices on
payment services have reflected relative differences in the costs.
In Koivuniemi and Kemppainen (2007) methodologies used in cost surveys are assessed,
among these the Norwegian 2001-survey. Weaknesses of the ABC methodology is discussed,
and also of the methods of the analysis done in the Netherlands, Sweden and Belgium. In
Jonker and Kosse (2008), weaknesses of the method we have chosen for the household
survey is further elaborated. It goes without saying that care should be taken in interpreting
the results in this Staff Memo, as no calculation is better than the underlying assumptions. If
an analysis like this were to be done in the future, possible improvements could be:
- A merchant survey based on observations of a team of researchers, rather than a
survey based on questionnaires (which gave a low response rate and poor quality to
some of the answers)
- A household survey that was based on payments diaries rather than omnibus phone
survey. That said, we feel confident that the results from our phone survey held an
acceptable quality level, so in our opinion a phone survey is a good alternative. The
costs are calculated on the basis of a number of assumptions in the household
survey, so a potential extension to that survey could have been to investigate
households’ costs further.
- Bank and subcontractor surveys can be performed in various manners, but to our
experience, the ABC framework produce results of good quality and great detail. To
succeed with such an analysis, highly motivated respondents is a necessity, and
simpler approaches might be better for achieving results in other countries.
Domestic payment, salary and demographic statistics of high quality and detail have been a
prerequisite to make this analysis possible. Care should be taken to gather the correct

66
statistics. One specific challenge is to get a correct estimate of the number of transactions,
not an easy task in a two-sided market where transactions are counted a number of times in
the payment process.
Norges Bank has for years promoted a view that payment services should be priced and that
the price level should reflect relative differences in the cost (of production of payment
services) level. The discussion of banks’ income and fee structure in this memo illustrate the
challenges in this area. In 2008, a number of banks in Norway abandoned their per-
transaction-prices altogether (no fee-policy). Wider use of product packages and annual fees
will make it harder to track the cost-price-relation of the different payment services. A cost
analysis is still useful to banks, overseers and regulators, as observations on the use of
resources can contribute to developments that can lead to an even more efficient payment
system in the future.
References
Banco de Portugal (2007), “Retail Payment instruments in Portugal: Costs and Benefits”, Study, July 2007.
Bergman, Mats, G. Guibourg and B. Segendorf (2007) “The Costs of Paying – Private and Social Costs of Cash and Card Payments”. Working Paper Series No. 212, December 2007, Sveriges Riksbank
Banking and Business Solutions (BBS), A survey on customer satisfaction (data published in this memo with special permission from BBS), Oslo 2007
Banking and Business Solutions (BBS), A survey on behaviour and attitudes towards card usage (data published in this memo with special permission from BBS), Oslo 2007
Bergman, Mats, G. Guibourg and B. Segendorf (2008), “Card and cash payments from a social perspective”, Economic Review No. 2 2008, Sveriges Riksbank

67
Bjørnenak, Trond (1993): “ABC – hva er D? Grunnleggende prinsipper i aktivitetsbasert kalkulasjon”, (ABC – what is D? Basic principles in activity-based calculation), Praktisk økonomi og ledelse no. 2/93.
Brits, Hans and C. Winder (2005) “Payments are no free lunch”, DNB Occasional Studies, Vol. 3 No. 2. 2005, De Nederlandsche Bank.
Cooper, Robert and R. S. Kaplan, (1999): “The design of cost management systems – text and cases”, Prentice-Hall, Inc, ISBN 0-13-570417-0.
Fidjestøl, Asbjørn, D. Flatraaker and C. J. Vogt (1989a): “Inntekter, kostnader og prissetting i betalingsformidlingen” (Income, costs and pricing in the payment system), Penger og Kreditt no. 4/89, Norges Bank.
Fidjestøl, Asbjørn, D. Flatraaker, and C. J. Vogt (1989b): “Kostnader i betalingsformidlingen” (Costs in the payment system), Penger og Kreditt no. 3/89, Norges Bank.
Folkestadås, E. and B. Grovan, (1999): “En ABC analyse av utvalgte produkter i dagligbankavdelingen i Andebu Sparebank” (An ABC analysis of selected products at Andebu Sparebank) Project assignment at the Norwegian School of Management.
Garcia-Swartz, Daniel & R. Hahn & A. Layne-Farrar (2006a). “The Move Toward a Cashless Society: A Closer Look at Payment Instrument Economics”, Review of Network Economics, Vol. 5, Issue 2. (Jun. 2006), pp. 175-198.
Garcia-Swartz, Daniel & R. Hahn & A. Layne-Farrar (2006b). “The Move Toward a Cashless Society: Calculating the Costs and Benefits”, Review of Network Economics, Vol. 5, Issue 2. (Jun. 2006), pp. 199-228.
Gresvik, Olaf and H. Haare (2009), “Costs in the Norwegian Payment System: Questionnaires”, Staff Memo No 5/2009, Norges Bank.
Gresvik, Olaf and H. Haare (2008), “Payment habits at point of sale. Different methods of calculating use of cards and cash in Norway”, Staff Memo No 6/2008, Norges Bank.

68
Gresvik, Olaf and H. Haare (2008),” Costs in the Norwegian payment system 2007 – a brief overview of the surveys and results”, Staff Memo No 9/2008, Norges Bank.
Gresvik, Olaf and G. Øwre (2003), “Costs and income in the Norwegian payment system 2001. An application of the activity-based costing framework” Working Paper no 8/2003, Norges Bank
Gresvik, Olaf, K.S. Kaardal, K-A. Rein, (2004): “Regulation of the international card companies’ fees” report from a project group in Norges Bank, the Financial Services Authority and the Norwegian Competition Authority to the Norwegian Ministry of Finance
Grovan, Børre and L. Richardsen (2000): “En analyse av kundelønnsomhet i Andebu Sparebank” (An analysis of customer profitability at Andebu Sparebank), Project assignment at the Norwegian School of Management.
Humphrey, David., K. Moshe, and B. Vale (2001): “Realizing the gains from electronic payments: costs, pricing and payment choice”, Journal of Money, Credit and Banking, 33, pp. 216-234.
Jonker, N. and A. Kosse (2008) “How to measure the number of cash payments? A pilot study of seven possible methodologies”, Forthcoming paper, De Nederlandsche Bank.
Kaardal, Karen Sofie, K. Ryste, I. Solberg (2007): ”Ny vurdering av markedet for internasjonale betalingskort i Norge” report on the regulation of the international card companies’ fees from a project group in Norges Bank, the Financial Services Authority and the Norwegian Competition Authority to the Norwegian Ministry of Finance
Koivuniemi, Emilia. and K. Kemppainen (2007), “On Costs of Payment Methods: A survey of Recent Studies”, Working paper No. 6/2007, Suomen Pankki.
Nationale Bank van Belgié (2005) “Kosten, voor- en nadelen van de verschillende betaalmiddelen” (Costs, advantages and drawbacks of the various means of payment), Studie, December 2005

69
Norges Bank (2008), “Annual Report on Payment Systems 2007”, Oslo 2008
Norges Bank (2007), “Annual Report on Payment Systems 2006”, Oslo 2007
Robinson, Pål Erik and D. Flatraaker, (1995a): “Income, costs and pricing in the payment system”, Economic Bulletin no. 3/95, Norges Bank.
Robinson, Pål Erik and D. Flatraaker, (1995b): “Costs in the payment system”, Economic Bulletin no. 2/95, Norges Bank.
Simes, Ric & Lancy, A. & Harper, I. (2006): “Costs and benefits of alternative payments instruments in Australia”, Centre for Business and Public Policy, Melbourne Business School.
Sparebankforeningen (The Norwegian Savings Banks Association), A survey on internet banking, Oslo 2008
Working Group on Costs of POS Payment Products (2004): “The costs of payments – Survey on the costs involved in POS payments products”, Report by the National Forum on the Payments System. De Nederlandsche Bank, March 2004

70
Appendixes
Appendix to chapter 2 Social cost
Assumptions
The social cost calculation rests on a set of assumptions.
Social cost per transaction and per krone
Social cost per transaction for Norway is calculated as
Social cost per krone for Norway is calculated as
Number of transactions is based on statistics from Norges Banks’ Annual Report on Payment
Systems 2007 and on calculations made in our surveys. “Other deposits and withdrawals” is
the sum of deposits over the counter, bulk deposits and night safe, bulk withdrawals and
withdrawals over the counter. The number of transactions of these deposits and
withdrawals in the society are based on observations from the 12 banks in the bank survey,
explained in appendix to chapter 4. Number of transactions and value of “Cash payments” is
based on observations from the household survey, explained in Gresvik and Haare (2008a).
Social cost per instrument (cash, card and giro)
Social cost per instrument is calculated as follows:
These definitions will also be used on a per unit basis.
Social cost of cash
Social cost of cash is the sum of social costs for deposits, withdrawals and payments. Social
costs are calculated on the basis of private costs and fees paid, as mentioned above. Private

71
costs are based on results from the bank survey and the merchant survey. Private costs
were calculated from the number of transactions and some assumptions in the household
survey. The tables A2.1 – A2.5 show how cash use costs are distributed across agents.
Seigniorage
In the social cost calculation, seigniorage is eliminated, since seigniorage is income for the
central bank and costs for others. However, the seigniorage calculation is shown in this
memo. It rests on some assumptions that need to be explained.
Seigniorage is interest income/loss on cash issued/held. Norges Bank issues cash and has
thus a potential income in the possible alternative: a risk free investment. Households, banks
and other agents (merchants and others) hold cash, and thus have an interest loss on the
alternative investment (for example a deposit in a bank). Our calculations were based on the
average annual tomorrow/next NIBOR interest rate for 2007, (4.75%)43.
Total seigniorage is the interest loss/income on the total stock of cash outstanding (NOK
51.5 billion in 2007). However, only stock of cash held for payment purposes are relevant in
this analysis. Based on information from the three surveys, cash stock held for payment
purposes is NOK 15.4 billion (Banks: NOK 3.11 billion, households: NOK 9.75 billion,
merchants and others: NOK 2.54 billions) . Based on an average interest rate of 4.75 per cent
this gives a seigniorage cost of NOK 732 million. 44.
However, there is also other information accessible from Statistics Norway (described in
Gresvik and Haare 2008a), and we have made an alternative calculation of seigniorage based
on these statistics as well. Based on this information, cash stock held for payment purposes
is NOK 15.7 billion (Banks: NOK 5.66 billion, households: NOK 5.67 billion, merchants and
others: NOK 4.33 billions). Based on an average interest rate of 4.75 per cent this gives a
seigniorage cost of NOK 745 million.
In this analysis, we use the first calculation, since it is based on information from the surveys.
The sum of seigniorage is not very different in the two alternative calculations. The
distribution of seigniorage is, however, very different between the agents in the two
calculations, and this will affect the size of the private cost to the agents (not the social cost,
43
See: http://www.norges-bank.no/webdav/stat/no/renter/renter_mnd.sdv

72
though). The second calculation is possible to do on a yearly basis, since the information is
based on official statistics.
Table A2.1: Cash: payments, deposits and withdrawals Seigniorage included
NOK millions Private cost Fees paid Own production cost Fees received Net Private costs Subcontractors 485.7 0.0 485.7 506.0 -20.2 Norges Bank -577.4 27.3 -604.7 6.2 -583.6 Banks 2342.4 479.6 1862.8 592.7 1749.8 Households 1904.4 592.7 1311.7 0.0 1904.4 Merchants and other businesses
443.0 5.2 437.8 0.0 443.0
4598.1 1104.8 3493.3 1104.8 3493.3
Table A2.2: Cash: deposits and withdrawals only No seigniorage
NOK millions Private cost Fees paid Own production cost Fees received Net Private costs Subcontractors 480.7 0.0 480.7 500.7 -20.0 Norges Bank 154.9 27.3 127.6 6.2 148.7
Banks 2194.6 479.6 1715.0 592.7 1602.0 Households 1248.3 592.7 655.6 0.0 1248.3 Merchants and other businesses
0.0 0.0 0.0 0.0 0.0
4078.5 1099.6 2979.0 1099.6 2979.0
Table A2.3: Cash: deposits and withdrawals only Seigniorage included
NOK millions Private cost Fees paid Own production cost Fees received Net Private costs Subcontractors 480.7 0.0 480.7 500.7 -20.0 Norges Bank 7.1 27.3 -20.2 6.2 0.9 Banks 2342.4 479.6 1862.8 592.7 1749.8 Households 1248.3 592.7 655.6 0.0 1248.3 Merchants and other businesses
0.0 0.0 0.0 0.0 0.0
4078.5 1099.6 2979.0 1099.6 2979.0
Table A2.4: Cash: payments only No seigniorage
NOK millions Private cost Fees paid Own production cost Fees received Net Private costs Subcontractors 5.0 0.0 5.0 5.2 -0.2 Norges Bank 0.0 0.0 0.0 0.0 0.0 Banks 0.0 0.0 0.0 0.0 0.0 Households 192.4 0.0 192.4 0.0 192.4 Merchants and other businesses
322.1 5.2 316.9 0.0 322.1
519.6 5.2 514.3 5.2 514.3

73
Table A2.5: Cash: payments only Seigniorage included
NOK millions Private cost Fees paid Own production cost Fees received Net Private costs Subcontractors 5.0 0.0 5.0 5.2 -0.2 Norges Bank -584.5 0.0 -584.5 0.0 -584.5 Banks 0.0 0.0 0.0 0.0 0.0 Households 656.1 0.0 656.1 0.0 656.1 Merchants and other businesses
443.0 5.2 437.8 0.0 443.0
519.6 5.2 514.3 5.2 514.3
Social cost of cards
Calculation of social cost of cards is based on the private costs of the agents including the
fees paid/received. Social cost of cards include usage and infrastructure costs (terminals
etc), both on the issuing and acquiring side.
There is not sufficient information to split costs on debit and credit cards, only on BankAxept
and international card schemes. The reasons for this is that i) the domestic statistics are not
sufficiently detailed on this matter, ii) the information on banks’ fees are not split in debit
and credit cards, iii) the merchants cannot make a distinction between card payments based
on credit or deposits from international cards and iv) the household survey did not focus on
cardholders costs, only on use.
Table A2.6: BankAxept NOK millions Private cost Fees paid Own production cost Fees received Net Private costs Subcontractors 931.7 0.0 931.7 970.5 -38.8 Norges Bank 0.0 0.0 0.0 0.0 0.0 Banks 1926.1 970.5 955.6 604.0 1322.1 Households 1170.4 592.7 577.7 0.0 1170.4 Merchants and other businesses
873.2 11.4 861.8 0.0 873.2
4901.3 1574.5 3326.8 1574.5 3326.8

74
Table A2.7: International card schemes NOK millions Private cost Fees paid Own production cost Fees received Net Private costs Subcontractors 617.1 0.0 617.1 642.8 -25.7 Norges Bank 0.0 0.0 0.0 0.0 0.0
Banks 1459.5 642.8 816.7 1480.6 -21.1 Households 831.9 592.7 239.2 0.0 831.9 Merchants and other businesses
1244.0 888.0 356.0 0.0 1244.0
4152.5 2123.4 2029.1 2123.4 2029.1
Social cost of bill payments: Giro
Domestic bill payments are generally paid electronically in Norway. The dominant payment
solution is Internet banking. Payments are made both as credit transfers and as direct debits.
The tables show how giro costs are distributed across agents. Calculations are shown in
appendix chapter 4, 5, and 6. Note that for merchants and others the giro calculation is not
as complete as for cash and cards. There is not sufficient information on time spent on
paying these giros to make estimates on the costs.
Table A2.8: Electronic Giros NOK millions Private cost Fees paid Own production cost Fees received Net Private costs Subcontractors 269.8 0.0 269.8 281.0 -11.2 Norges Bank 0.0 0.0 0.0 0.0 0.0 Banks 1035.4 281.0 754.4 1698.4 -663.0 Households 1198.1 740.7 457.5 0.0 1198.1 Merchants and other
businesses 957.8 957.8 0.0 0.0 957.8
3461.1 1979.4 1481.6 1979.4 1481.6
Table A2.9: Paper based Giros NOK millions Private cost Fees paid Own production cost Fees received Net Private costs Subcontractors 65.0 0.0 65.0 67.7 -2.7 Norges Bank 0.0 0.0 0.0 0.0 0.0
Banks 771.3 67.7 703.6 832.7 -61.4 Households 446.9 388.6 58.3 0.0 446.9 Merchants and other
businesses 444.1 444.1 0.0 0.0 444.1
1727.3 900.4 826.9 900.4 826.9
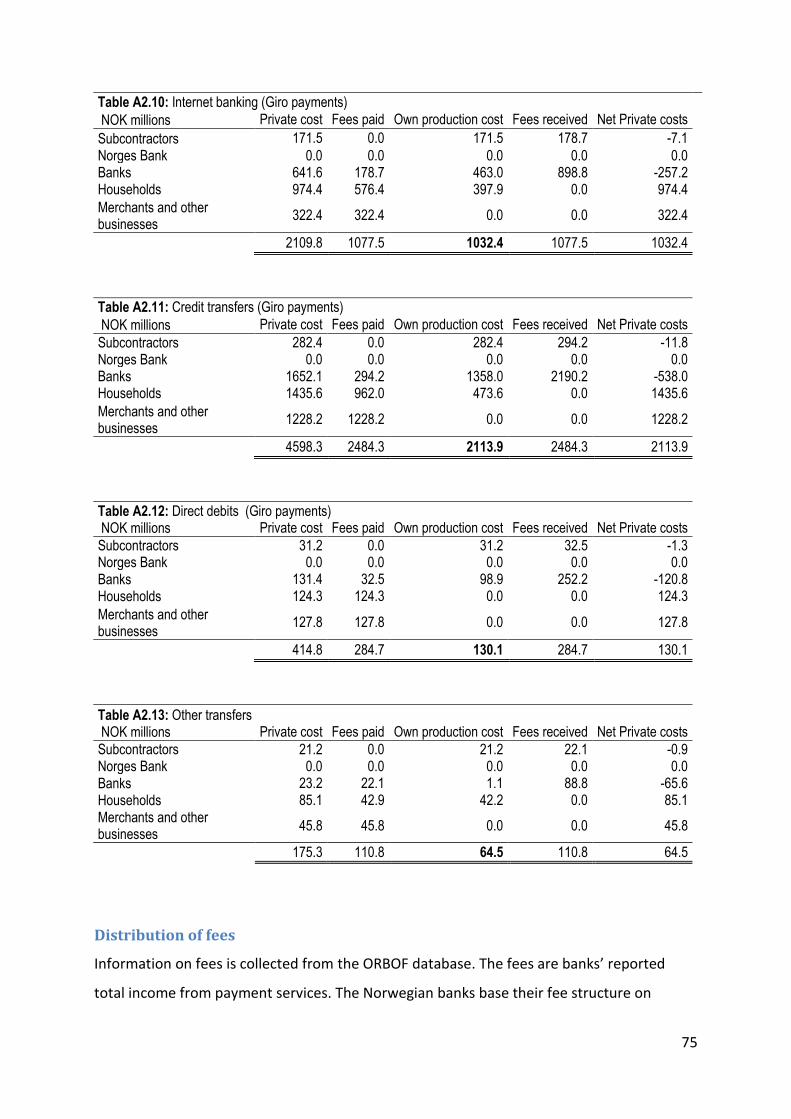
75
Table A2.10: Internet banking (Giro payments) NOK millions Private cost Fees paid Own production cost Fees received Net Private costs Subcontractors 171.5 0.0 171.5 178.7 -7.1 Norges Bank 0.0 0.0 0.0 0.0 0.0 Banks 641.6 178.7 463.0 898.8 -257.2 Households 974.4 576.4 397.9 0.0 974.4 Merchants and other
businesses 322.4 322.4 0.0 0.0 322.4
2109.8 1077.5 1032.4 1077.5 1032.4
Table A2.11: Credit transfers (Giro payments) NOK millions Private cost Fees paid Own production cost Fees received Net Private costs Subcontractors 282.4 0.0 282.4 294.2 -11.8 Norges Bank 0.0 0.0 0.0 0.0 0.0 Banks 1652.1 294.2 1358.0 2190.2 -538.0 Households 1435.6 962.0 473.6 0.0 1435.6 Merchants and other
businesses 1228.2 1228.2 0.0 0.0 1228.2
4598.3 2484.3 2113.9 2484.3 2113.9
Table A2.12: Direct debits (Giro payments) NOK millions Private cost Fees paid Own production cost Fees received Net Private costs Subcontractors 31.2 0.0 31.2 32.5 -1.3 Norges Bank 0.0 0.0 0.0 0.0 0.0 Banks 131.4 32.5 98.9 252.2 -120.8 Households 124.3 124.3 0.0 0.0 124.3 Merchants and other
businesses 127.8 127.8 0.0 0.0 127.8
414.8 284.7 130.1 284.7 130.1
Table A2.13: Other transfers NOK millions Private cost Fees paid Own production cost Fees received Net Private costs Subcontractors 21.2 0.0 21.2 22.1 -0.9 Norges Bank 0.0 0.0 0.0 0.0 0.0 Banks 23.2 22.1 1.1 88.8 -65.6 Households 85.1 42.9 42.2 0.0 85.1 Merchants and other
businesses 45.8 45.8 0.0 0.0 45.8
175.3 110.8 64.5 110.8 64.5
Distribution of fees
Information on fees is collected from the ORBOF database. The fees are banks’ reported
total income from payment services. The Norwegian banks base their fee structure on
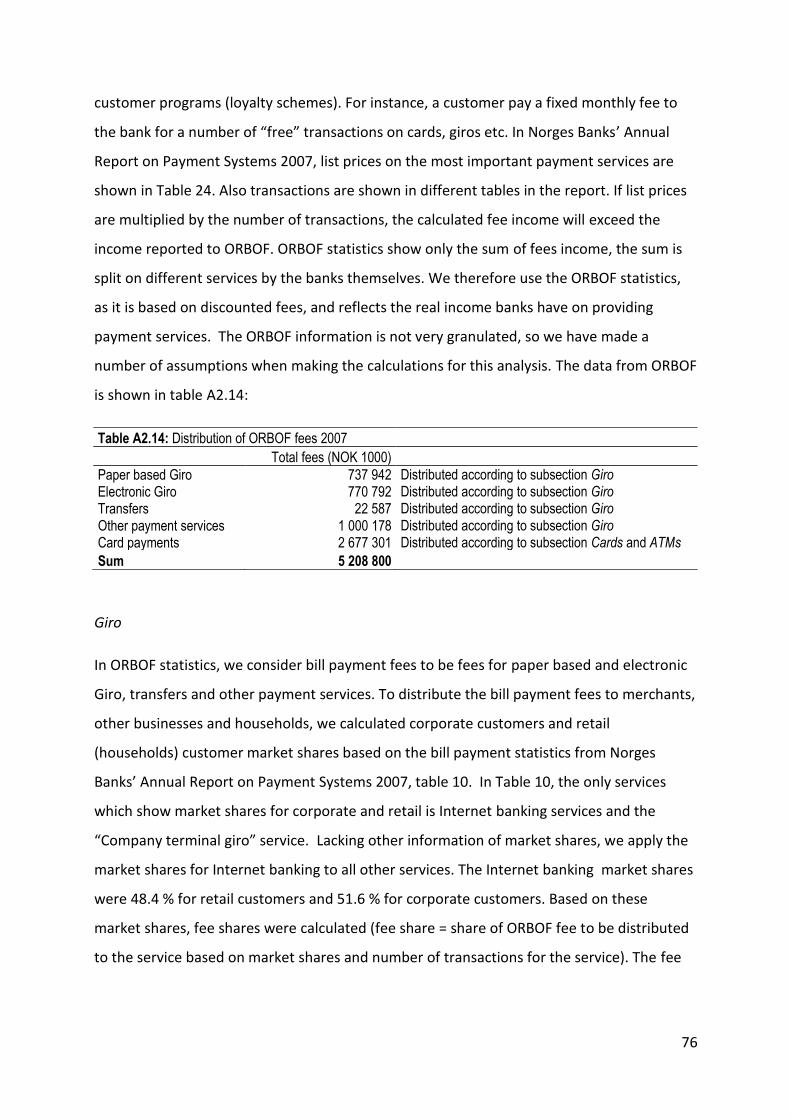
76
customer programs (loyalty schemes). For instance, a customer pay a fixed monthly fee to
the bank for a number of “free” transactions on cards, giros etc. In Norges Banks’ Annual
Report on Payment Systems 2007, list prices on the most important payment services are
shown in Table 24. Also transactions are shown in different tables in the report. If list prices
are multiplied by the number of transactions, the calculated fee income will exceed the
income reported to ORBOF. ORBOF statistics show only the sum of fees income, the sum is
split on different services by the banks themselves. We therefore use the ORBOF statistics,
as it is based on discounted fees, and reflects the real income banks have on providing
payment services. The ORBOF information is not very granulated, so we have made a
number of assumptions when making the calculations for this analysis. The data from ORBOF
is shown in table A2.14:
Table A2.14: Distribution of ORBOF fees 2007
Total fees (NOK 1000)
Paper based Giro 737 942 Distributed according to subsection Giro Electronic Giro 770 792 Distributed according to subsection Giro Transfers 22 587 Distributed according to subsection Giro Other payment services 1 000 178 Distributed according to subsection Giro Card payments 2 677 301 Distributed according to subsection Cards and ATMs Sum 5 208 800
Giro
In ORBOF statistics, we consider bill payment fees to be fees for paper based and electronic
Giro, transfers and other payment services. To distribute the bill payment fees to merchants,
other businesses and households, we calculated corporate customers and retail
(households) customer market shares based on the bill payment statistics from Norges
Banks’ Annual Report on Payment Systems 2007, table 10. In Table 10, the only services
which show market shares for corporate and retail is Internet banking services and the
“Company terminal giro” service. Lacking other information of market shares, we apply the
market shares for Internet banking to all other services. The Internet banking market shares
were 48.4 % for retail customers and 51.6 % for corporate customers. Based on these
market shares, fee shares were calculated (fee share = share of ORBOF fee to be distributed
to the service based on market shares and number of transactions for the service). The fee

77
shares formed the basis for distributing fees to the retail and corporate customers for
different bill payment services.
The relevant service range is for example “electronic giro”. To illustrate this, have a look at
the second row in Table A2.15: Electronic giro for retail customers:
- Market share of 48.4% is given, as explained above.
- Number of transactions is based on Table 10 in Norges Banks’ Annual Report on
Payment Systems 2007 as 154.2 million retail Internet banking transactions + 48.4% x
(sum of direct debits (49.6), telephone giros (13.9) and misc. other electronic
transfers(33.8) = 201.3 million transactions
- Fee share = 201.3/(electronic credit transfers (412.7) + direct debits (49.6)) = 43.5%.
- Electronic giro give banks a fee income of NOK 771 millions in 2007 (source: ORBOF).
Fee share (of electronic giro) 43.5% x 771 = fees paid by retail customers = NOK 336
million in second row in Table A2.17 (retail customers electronic giro cost.
Table A2.15: ORBOF Fee share calculated on the basis of market share Retail Customers Market share Million transactions Fee share Internet banking solutions 48.4 % 154.2 33.4 % Electronic giro 48.4 % 201.3 43.5 % Paper based giro 48.4 % 22.6 46.7 % Direct debits 48.4 % 24.0 5.0 % Credit transfers 48.4 % 183.5 38.5 % Other transfers 48.4 % 16.3 3.2 % Sum Retail Customers 48.4 % 223.9 43.8 % Corporate customers Market share Million transactions Fee share Internet banking solutions 51.6 % 164.6 35.6 % Electronic giro 51.6 % 260.9 56.4 % Paper based giro 51.6 % 25.8 53.3 % Direct debits 51.6 % 25.6 5.4 % Credit transfers 51.6 % 243.7 51.1 % Other transfers 51.6 % 17.5 3.4 % Sum Corporate Customers 51.6 % 286.7 56.1 %

78
Cards
Calculation of distribution of ORBOF card fees are based on a different set of assumptions.
- Value of Card fees was NOK 2,677 million (see Table A2.14).
- We assume that the card users and card acceptances are households, merchants and
other businesses.
- From the merchant survey we have costs of card acceptance (NOK 44 millions for
international cards and NOK 5.7 millions for BankAxept).
- We assume that card acceptance has the same cost for merchants and for other
businesses
- The rest, NOK 1,777 millions, is distributed to households and split in three equal
parts on international card payments, on BankAxept card payments and ATM
withdrawals (see table A2.17).
In the merchant survey, a group of questions focused on the fees merchants paid for having
access to card schemes. This covered international card schemes and BankAxept. The
distribution of card fees from ORBOF to merchants is based on the information from the
survey. From the survey, card unit fees paid by merchants to banks and other card service
providers were calculable. Multiplying the unit fees paid by number of transactions at point
of sale gave the sum of fees paid by merchants to banks and others:
It was not possible to distinguish between debit and credit cards in the merchant survey.
However, the merchants could separate fees paid for card services for different schemes
(BankAxept and International card schemes). The results from the survey are shown in the
table below:
Table A2.16: Merchants’ fees paid for card services
Unit Cost (NOK) Transactions NOK thousands
BankAxept 0,0070 805 338 241 5 675 International card schemes 4,5744 97 057 228 443 976

79
Note that these fees are only part of merchants’ private costs (fees paid are part of
subcontractor cost, while the merchants also have own production costs, as discussed
above).
When distributing fees, we separate between households (retail market) and corporate
(merchants and other businesses). That gives two corporate markets and one retail market.
Unfortunately, this is all the information we are able to collect. We have information
sufficient to calculate fees distributed on corporate and retail markets, but only by making
some bold assumptions on the distributions.
For the corporate market, we separate between merchants and other businesses. We only
have information on fees on the corporate market as a whole for bill payments, while we
only have information on fees paid by the merchant part of the corporate market for card
payments.
For the households/retail market, we only have adequate information to calculate bill
payment fees directly, but that is not the situation for card payment fees.
To solve this problem, we choose to look at the three markets in combination. For bill
payments, we split the corporate market in two equal parts: merchants and other
businesses. Bill payment fees are distributed equally between the two corporate markets
and the remaining is distributed to households. For example, the calculation above showed
that 56.4 % of paper based giro fees were generated by corporate electronic payments. This
is (56.4% X 737.942) = NOK 393.545 millions. Split equally between the two corporate
markets, NOK 196.772 millions are laid on merchants and other businesses, respectively. The
remaining 43.6% of paper based giro fees are laid on households (NOK 344.397 millions). All
bill payment fees are distributed this way, according to the fees shares calculated above.
When looking at the three markets in combination for card fees, a different approach is
used. As mentioned, the merchant survey provided information on card fees paid. Assuming
that other businesses receive payments by card, part of the card fees should be distributed
to them. However, we do not have any information on how much this is. It is perhaps likely
that cards are used less at non-point-of-sale businesses, but we cannot know for sure. To
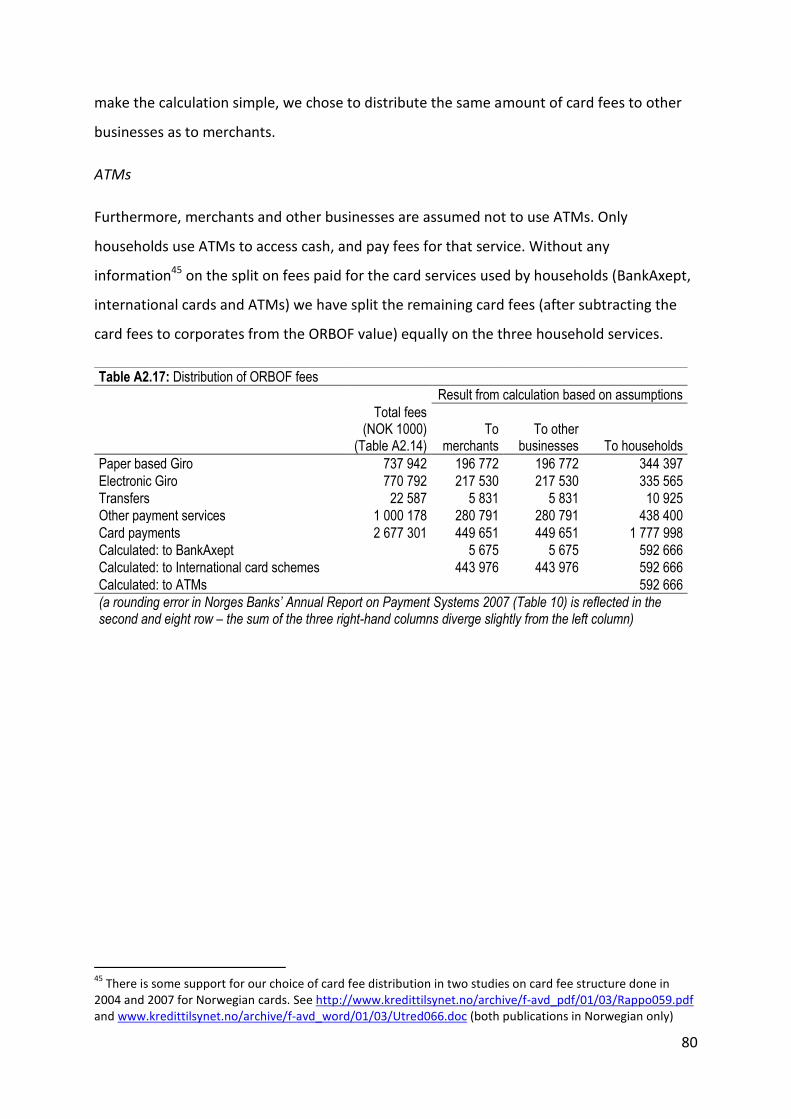
80
make the calculation simple, we chose to distribute the same amount of card fees to other
businesses as to merchants.
ATMs
Furthermore, merchants and other businesses are assumed not to use ATMs. Only
households use ATMs to access cash, and pay fees for that service. Without any
information45 on the split on fees paid for the card services used by households (BankAxept,
international cards and ATMs) we have split the remaining card fees (after subtracting the
card fees to corporates from the ORBOF value) equally on the three household services.
45
There is some support for our choice of card fee distribution in two studies on card fee structure done in 2004 and 2007 for Norwegian cards. See http://www.kredittilsynet.no/archive/f-avd_pdf/01/03/Rappo059.pdf and www.kredittilsynet.no/archive/f-avd_word/01/03/Utred066.doc (both publications in Norwegian only)
Table A2.17: Distribution of ORBOF fees
Result from calculation based on assumptions
Total fees (NOK 1000)
(Table A2.14) To
merchants To other
businesses To households Paper based Giro 737 942 196 772 196 772 344 397 Electronic Giro 770 792 217 530 217 530 335 565 Transfers 22 587 5 831 5 831 10 925 Other payment services 1 000 178 280 791 280 791 438 400 Card payments 2 677 301 449 651 449 651 1 777 998 Calculated: to BankAxept
5 675 5 675 592 666
Calculated: to International card schemes
443 976 443 976 592 666 Calculated: to ATMs
592 666
(a rounding error in Norges Banks’ Annual Report on Payment Systems 2007 (Table 10) is reflected in the second and eight row – the sum of the three right-hand columns diverge slightly from the left column)

81
Appendix to Chapter 4 Costs in banks
Assumptions
A simplified Activity Based Costing (ABC) analysis
An analysis based on the ABC framework can be very detailed. In a large organization it is
possible to identify thousands of activities necessary to produce the different services
delivered.
This survey covers only a small part of banks’ business activities, namely payment services
and cash handling. The survey was designed to be of use in any kind of bank, and was
therefore designed to be simple and automated. The questionnaire itself gave few options
to adapt to special circumstances in the participating banks. Because of this, the survey was
designed with relatively few activities and few services, but the intention is still to use it as a
full-cost-study of banks. With a more detailed analysis it is possible to granulate the cost
estimates further. However, in the survey a few banks used their own internal ACB
calculation framework, and some banks made small adjustments to the standard framework.
Activities generate costs, and the output generated by activities decides the size of the costs.
In this survey, cost drivers for payment services and cash handling are the number of
payment transactions, number of deposits, number of withdrawals and number of accounts.
There are also other possible cost drivers, but for simplicity, we kept the range at a
minimum.
The general ledger is not a sufficiently detailed source of information for an ABC- analysis.
Cost information was therefore based on financial accounts, bank-internal information on
the composition of the costs shown in the financial accounts and of imputed costs (replacing
and sometimes adding to costs from financial accounts). Imputed costs were used for
depreciation of property, IT, research and development, interest loss on cash held and a few
other areas. The intention was to estimate a more realistic cost to the bank than what was
shown in the general ledger. The effect was that costs for cash handling and payments are
somewhat higher than if they were based on information from the general ledger only.
82
Particularly important assumptions in the ABC analysis
The analysis makes assumptions on how costs are distributed to separate areas within a
bank. This distribution is not necessarily reflected in the banks’ official accounts or ordinary
organization chart. The reason is that cash handling and payment services seldom are
organized as separate departments in the organization.
Results: Assumptions
12 banks responded to the survey. We consider these banks to be representative for banks
in Norway. The 12 banks cover 55 per cent of the total assets in the banking market in
Norway, and consist of small and large banks, savings banks and commercial banks.
Private costs for payment and cash services in banks are calculated as:
for each (i) of the n services offered by the banks that responded to the survey. Of the 35
services included in the survey, only 26 are published, which covered the most widely used
cash-, card- and giro services. Not all banks in the survey offered all services, and for some of
the services we did not achieve sufficient quality of the answers to publish the results
(anonymity reasons). 5 services are omitted as it was not possible to calculate a viable
market share, and the quality of information provided by the few banks that offered these
services was not sufficient to make basis for calculations. These five services generate costs
in banks for other agents, costs that are not covered by the survey. Costs for two services
(OCR) were distributed on other giro services, while four giro services were combined in two
services. This is shown it table A4.1.

83
Table A4.1: How the 35 services in the bank survey is treated: only 26 services form the basis for the cost calculation.
35 services from the questionnaire
How service is treated in analysis 26 services published in analysis
Telephone giro Weighted average unit cost (W.A.C.)for the service based on the 12 banks, including OCR costs
Telephone giro
Internet banking retail customers W.A.C. for the service based on the 12 banks, including OCR costs
Internet banking retail customers
Internet banking corporate customers
W.A.C. for the service based on the 12 banks, including OCR costs
Internet banking corporate customers
Direct Debits (Avtalegiro) W.A.C. for the service based on the 12 banks, including OCR costs
Direct Debits (Avtalegiro)
Remittance / company terminal giro (CID / notified and unnotified)
W.A.C. for the service based on the 12 banks, including OCR costs
Remittance / company terminal giro (CID / notified and unnotified)
Giromail W.A.C. for the service based on the 12 banks, including OCR costs
Giromail
Giro credited at the counter Giro credited and paid in cash at the counter is combined in one service (Giro OTC). Weighted average unit cost for the service based on the 12 banks, including OCR costs
Giro OTC Giro paid in cash at the counter
Remittance / company terminal giro sent as a money order
Remittance / company terminal giro sent as a money order and Internet Banking Money Order is combined in one service W.A.C.for the service based on the 12 banks, including OCR costs
Remittance / company terminal giro sent as a money order and Internet Banking Money Order
Internet Banking Money Order
Optical Character Recongition (OCR) - File
OCR-costs are added to the cost of other services where number of transactions for each giro service is the distribution key: sum of direct and indirect costs service N) + (total costs of OCR File and Return) / ((number of transactions for instrument N) / (sum of all giro service transactions))
Distributed on giro services
Optical Character Recongition (OCR) - Return
OCR-costs are added to the cost of other services where number of transactions for each giro service is the distribution key: sum of direct and indirect costs service N) + (total costs of OCR File and Return) / ((number of transactions for instrument N) / (sum of all giro service transactions))
Distributed on giro services
BankAxept (issuer) W.A.C.for the service based on the 12 banks BankAxept (issuer)
International debit cards (issuer) W.A.C.for the service based on the 12 banks International debit cards (issuer)
International credit cards (issuer) W.A.C.for the service based on the 12 banks International credit cards (issuer)
BankAxept (acquirer) W.A.C.for the service based on the 12 banks BankAxept (acquirer)
International debit cards (acquirer) W.A.C.for the service based on the 12 banks International debit cards (acquirer)
International credit cards (acquirer) W.A.C.for the service based on the 12 banks International credit cards (acquirer)
Transfers W.A.C.for the service based on the 12 banks Transfers
Deposits at the counter W.A.C.for the service based on the 12 banks Deposits at the counter
Night safe W.A.C.for the service based on the 12 banks Night safe
Deposits through cash handling companies
W.A.C.for the service based on the 12 banks Deposits through cash handling companies
Deposits: Coins (bag, bulk) W.A.C.for the service based on the 12 banks Deposits: Coins (bag, bulk)
Deposits through automats W.A.C.for the service based on the 12 banks Deposits through automats
Withdrawals at the counter W.A.C.for the service based on the 12 banks Withdrawals at the counter
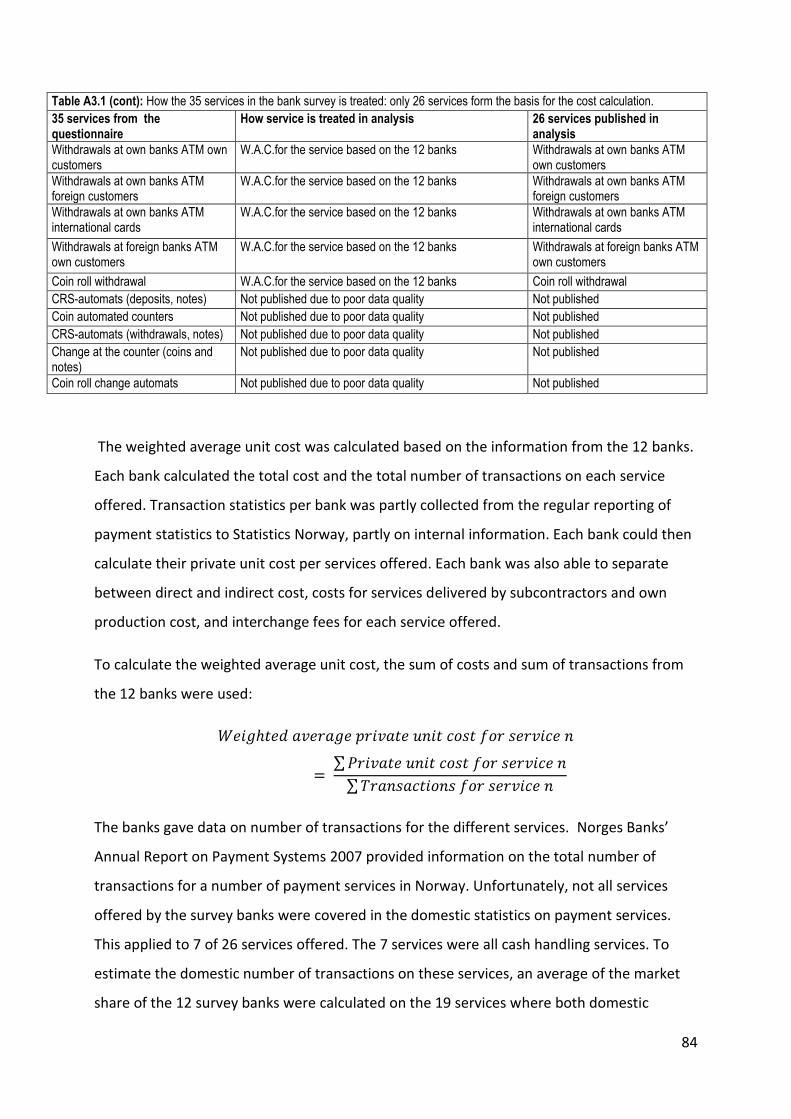
84
Table A3.1 (cont): How the 35 services in the bank survey is treated: only 26 services form the basis for the cost calculation.
35 services from the questionnaire
How service is treated in analysis 26 services published in analysis
Withdrawals at own banks ATM own customers
W.A.C.for the service based on the 12 banks Withdrawals at own banks ATM own customers
Withdrawals at own banks ATM foreign customers
W.A.C.for the service based on the 12 banks Withdrawals at own banks ATM foreign customers
Withdrawals at own banks ATM international cards
W.A.C.for the service based on the 12 banks Withdrawals at own banks ATM international cards
Withdrawals at foreign banks ATM own customers
W.A.C.for the service based on the 12 banks Withdrawals at foreign banks ATM own customers
Coin roll withdrawal W.A.C.for the service based on the 12 banks Coin roll withdrawal
CRS-automats (deposits, notes) Not published due to poor data quality Not published
Coin automated counters Not published due to poor data quality Not published
CRS-automats (withdrawals, notes) Not published due to poor data quality Not published
Change at the counter (coins and notes)
Not published due to poor data quality Not published
Coin roll change automats Not published due to poor data quality Not published
The weighted average unit cost was calculated based on the information from the 12 banks.
Each bank calculated the total cost and the total number of transactions on each service
offered. Transaction statistics per bank was partly collected from the regular reporting of
payment statistics to Statistics Norway, partly on internal information. Each bank could then
calculate their private unit cost per services offered. Each bank was also able to separate
between direct and indirect cost, costs for services delivered by subcontractors and own
production cost, and interchange fees for each service offered.
To calculate the weighted average unit cost, the sum of costs and sum of transactions from
the 12 banks were used:
The banks gave data on number of transactions for the different services. Norges Banks’
Annual Report on Payment Systems 2007 provided information on the total number of
transactions for a number of payment services in Norway. Unfortunately, not all services
offered by the survey banks were covered in the domestic statistics on payment services.
This applied to 7 of 26 services offered. The 7 services were all cash handling services. To
estimate the domestic number of transactions on these services, an average of the market
share of the 12 survey banks were calculated on the 19 services where both domestic
85
statistics and banks’ own information on number of transactions were available. The average
market share was used to calculate an estimate on the domestic number of transactions for
the remaining 7 services.
Also, two other approaches were considered when estimating the market share. We
calculated the 12 banks’ market share based on deposits on transaction accounts and based
on total assets. Both estimates gave roughly the same market share as measured in number
of transactions, so we chose number of transactions as our market share variable (to use
data from the survey only). Number of transactions to the society is thus based on domestic
statistics for 19 services. On the basis of transactions’ market share for these 19 services, we
calculated the market share for the remaining 7 services.
To calculate the private cost of cash, the survey included information on banks own and
subcontractors’ costs on deposits and withdrawals of cash. The private costs are calculated
as:
The data necessary to make this calculation was collected from Norges Banks’ Annual Report
on Payment Systems 2007 and internal calculations on Norges Banks own production costs.
The bank survey showed banks’ and subcontractors’ costs in issuing and acquiring cards and
costs for producing bill payment services. The private costs are calculated as:
Unfortunately, settlement costs in Norges Bank on retail payments are not available.
Interchange fees
Banks pay interchange fees when their customers use other banks ATMs, or when their
customers pay by card and giro to a merchant or institution and where the payee’s bank is
different from the payer’s bank. To some banks the interchange fee is a net cost, to others it
is a net income. This is a cost survey, so gross interchange fees were included as costs only.
Each bank also provided information on their gross interchange income, but that

86
information is not used in the analysis. In sum, across all banks, the interchange fee should
be zero, as the net costs for some banks equals the net income for other banks.
As we have information on the unit interchange fees paid for ATMs and giros from the
banks’ common agreements on payment system issues, and each bank also provided
information on interchange fees for giros, cards and ATMs, it was relatively simple to
eliminate interchange fees when making the calculation of total private costs to banks. This
was done as follows:
ATMs:
The interchange fee in 2007 was NOK 6.90 per transaction for a withdrawal made in an ATM
owned by a different bank than the cardholder’s bank. That is: the cardholder’s bank paid
the ATM-owning bank NOK 6.90 per transaction done by the cardholder in the foreign ATM.
51.35 million transactions were done in a foreign ATM, which gave a total interchange fee of
NOK 354.35 million to be subtracted from the sum of ATM costs calculated.
Giros:
For some of the giro services, the banks have agreed on an interchange fee, dependent on
how the giro payee receives the payment. It is not, however,as simple to calculate this as for
ATMs, since our survey framework primarily follows the behavior of the payer. The payers’
actions will not always trigger an interchange fee, and it cannot be identified when an
interchange fee is triggered in the information provided by the survey.
To solve this problem, we use the bank survey data for each giro service. The banks have
paid these fees, and the individual bank has stated the cost distributed to each service in the
survey response. For example: the interchange fee cost for Internet banking for retail
customers is 5% of unit cost (weighted average across the 12 banks). These interchange fees
were deducted from the sum of each giro service cost. The level of interchange fees ranged
from 0.4 per cent to 8.2 per cent of the total cost of giro services.

87
Cards:
The banks paid interchange fees for different card services (other than ATM services). These
were reported in the same manner as interchange for Giro, and subtracted from the total
cost in the same manner.
Unit cost calculation
Unit cost is calculated as a weighted average of the 12 banks costs for each service. The
weighted average is calculated as the sum of costs for each service divided by the sum of
transactions for each service. This was done for each of the 26 services.
Direct costs
Direct costs are in principle costs generated by production of a specific service. The costs are
mostly costs generated from banks subcontractors’ activities, and the banks pay their
subcontractors for their delivery. Data are collected from invoices. For a few items, costs are
imputed, for example research and development (can be attributed to separate services)
and credit cost (based on the credit cost banks carry for the credit card activities). The banks
distributed the direct costs based on internal assessments, and were not guided as strongly
as for the indirect cost setup in the questionnaire.
Indirect costs
Indirect costs are costs not specifically generated by production of the different services.
Indirect costs are generated by “in-house” activities.
In this survey we have decided to define one of the major items, salaries, as indirect costs.
This is because most payment services are handled by central processors or are heavily
computerized, and personnel in banks normally do not have any direct activities relating to
the individual transaction. Even cash handling is very often handled by subcontractors, and
are thus outside the bank. However, we are aware of differences within the 12 banks, as
some of the personnel in the banks do some “direct” work relating to cash handling and
payment services. We find this to be a minor part of the personnel cost (salaries), and as a
simplification we choose to treat personnel as an indirect cost.
Most of the costs can be found in the financial accounts. Some costs are replaced with
imputed values, for instance depreciation of machinery or buildings.

88
Questionnaire and manual
Further details on the different items (costs, activities, services etc) are found in Gresvik and
Haare (2009). The spreadsheet shows how costs are distributed to the different services
according to the built-in distribution mechanisms (activities, number of transactions etc.).
The manual and the spreadsheet form are a complete guide to make a response to the
survey.
Process
The 2007 bank survey was carried out in 2006-2008. The basis for the methodology was the
survey conducted in 2001, and a planned cash handling survey constructed by the banks
associations in 2006. Based on the information in these survey frameworks, we built a
complete framework for mapping costs in payment services and cash handling in the
banking industry in Norway 2007.
The decision to conduct a survey was made in 2006. An invitation was sent to 24 banks and 2
card acquirers. The invitation was sent from Norges Bank’s Governor Svein Gjedrem to the
CEO of each bank / firm in October 2006.
A meeting was held in Norges Bank in December 2006 for those banks/firms that had made
a commitment to participate, and questionnaire and manual was sent to the participating
banks/firms by Christmas 2006.
The respondents spent 2007 to register data, and responded by Q2 2008.
During 2007, there were extensive contact with the participants, via phone, e-mail and a
website created for the purpose. All banks were also visited in autumn 2007.
Deadline for replying to the survey was originally set to February 1st, but few banks managed
to meet this date. Responses were thus collected throughout the next months, the last one
was sent in May 26th 2008. For all respondents, extensive quality improvements were made,
and all handed in several improved versions (10, at most) of the original response. This
dialogue concerning the results was very important to reach the desired level of quality to
the data set.
89
After initial analysis, a meeting was held in September 2008 for the participants. Preliminary
results were presented, and the participants made comments that were valuable to further
improve the results. Some of the main conclusions from the analysis were presented at
Norges Bank’s Payment Systems Conference in November 14th 2008 (Gresvik and Haare,
2008b).
Experiences
We consider the bank survey process to be a success. Even though it was voluntary to
participate, the respondents showed a lot of commitment and delivered high-quality results.
There are several reasons for this:
Norges Bank signaled early in the process that it considered the bank survey to be
important, the letter of invitation was signed by the governor and sent to each bank’s
managing director.
The communication with the banks’ associations was very good. The associations also had
direct interests in parts of the results46. Even though the banks were presented a ready-
made framework to be used for the survey, banks could make minor adjustments.
Data was collected throughout 2007. The quality of the information might perhaps been
more or less the same if we had collected data for instance over a 6 months period and
extrapolated it to a whole year.
Communication interface should be kept as simple as possible. In our communication with
the banks we also used a web-based project management tool to create a private
environment for communication. On the platform all the relevant documents were
available. This tool was not extensively used by the banks. Rather, e-mail and secure e-mail
were the preferred means of communication.
Quality control is important. Even though we had established a detailed framework, there
were many questions. We therefore interacted closely and often with the banks to ensure
that the replies met the desired quality level. This was considerably more time-consuming
than expected.
46
The banks’ associations had themselves planned to carry out a survey of the costs of cash handling.
90
Appendix to Chapter 5 Costs at merchants
Results: Assumptions
The merchant survey covered cash and cards payments. 147 businesses or 696 outlets
responded to the survey. Private unit costs were calculated on basis of five elements:
infrastructure, amount, time, cash holdings and number of outlets per business.
To the merchant, costs are generated by investments in and rent for infrastructure items
such as card terminals, tellers etc. Increasing value per transaction (amount) leads to higher
costs, as the fee structure for some cards is dependent on value paid, while a larger value
increases the cost of handling cash. In addition, time spent on receiving a payment carry a
cost, as salaries and social costs are to be paid for the personnel. Holding cash has a lost-
interest cost, since the cash could have been deposited on an account over night. Number of
outlets increases costs of handling cash, as many outlets handle a relatively small amount
each, compared to fewer, but larger outlets. For a business with many outlets, the cash
transport has to make more stops, and cash handling can be arranged in a more efficient
way in a large outlet than in a small outlet.
Based on the sum of these five elements, private unit cost per transaction was calculated.
This was done for cash transactions and card transactions (BankAxept and international
payment card schemes). Multiplying the unit cost for each instrument (i) with number of
transactions in the society, and adding the values for the n (three) categories of instruments
give:
Number of cash transactions was calculated as in the household survey, while number of
card transactions was known from the payment statistics.
To make the calculation useful in the social cost calculation (Chapter 2), a separation
between subcontractors’ costs and own production costs had to be made. The merchant
survey contains the information necessary to make this separation, supported by data from
the ORBOF database.

91
The merchant survey showed information on merchants’ costs on cash payments and
merchants’ costs on cash handling, bulk deposits and withdrawals. The time study gave
information on how much time the customers and merchants spent on cash payments, per
transaction on average. Merchants’ private costs of cash were calculated as:
The merchant survey showed information on merchants’ costs on card payments. The time
study in this survey gave information on how much time the customers and merchants spent
on cards payments, on average per transaction. Merchants’ private costs of cards were
calculated as:
Merchants face a very different price structure on BankAxept compared to international
card schemes, which were reflected in the results from the survey. Also, the time study
showed distinct differences in time spent on a signature-based transaction (57 seconds) and
a PIN-based transaction (17 seconds).
Merchants and others pay bills, and according to our calculation in chapter 2, 52 % of bills
paid are paid by the corporate market. Unfortunately, we do not have any information on
routines for paying bills in the corporate market. The merchant survey did not focus on this
matter. The only information we have accessible is the fees paid to banks for the bill
payment service. Private costs calculated for merchants and other industries consist only of
fees. Costs of time spent etc on paying is omitted. The costs calculated are therefore too
low.
Subcontractors to the merchant are banks, card acquirers and cash handling companies.
Fees paid are found in the ORBOF statistics, and are also shown in the responses made by
merchants (Table 25). Other fees are for example card terminal rent or cash transport.
Own production costs are based on time spent on handling cash and receiving cards and
cash payments, time spent settling tellers, counting cash, in-house security, fraud, loss and
insurance cost etc. Time cost is calculated as:
92
Average salary is based on information from Statistics Norway47.
The results show that salaries and fees based on payment value are the most important cost
drivers to the merchants.
Information from the merchant survey that are not used in our analysis
The merchant survey was designed to give an estimate of number and value of transactions,
both on cash and cards use. It was also designed to be representative for Norwegian
businesses and outlets, so that values from the survey could be multiplied by the
corresponding statistics on businesses for Norway, and thus give an independent estimate
on use of cash and cards at point of sale in Norway. Unfortunately, the response rate was
too low to enable us to make these calculations. We had to settle for the estimate of
transactions made in the household survey in combination with information from the
payment statistics. That said, the quality of the household survey estimate is sufficient for
our purpose.
Process
In 2007-2008, Norges Bank conducted a survey among merchants on costs of handling
payments. One question focused on how many payments the business received in the
course of one month, the value, and how payments were made; cash or card. These answers
could have provided a good basis for estimating payments at point of sale.
Unfortunately, the response rate to this survey was very low. Responses to some of the 14
questions were of poor quality. A few questions were answered properly, though, and can
be used as indications when combined with other information. The responses from
47
See http://statbank.ssb.no/statistikkbanken/temp/200812914388122943804AKINaer.xls and http://statbank.ssb.no/statistikkbanken/temp/200812914414852943804ArbKraftIndex.xls (average salary including social costs, paid by employer). Statistics per industry from 2000, indexed to 2007-values.

93
merchants are skewed, weighted too heavily on grocery chain stores compared to
businesses in Norway on the whole. This leads us to believe that transaction data will be
skewed towards small-value payments, and perhaps towards an overweight of BankAxept
payments compared to other card brands as some grocery chains do not accept all card
brands. In addition, Norwegians usually do not use credit cards or delayed debit cards when
buying food.
When asking shops, hotels and restaurants etc. about costs relating to payments from their
customers, we encountered obstacles that made us alter our original plan twice. Even
though we put a significant amount of effort into this survey, we still feel uncomfortable
using some of the results, due to a low response rate and low quality of the responses. Some
of the information is quite robust, though, and can be used (with caution) in our analysis.
Below, we show a record of our efforts to give an indication of the robustness of the
numbers and to share our experiences when we tried to shed light on an issue which is of
very little interest to most of the respondents.
Our POS study was inspired by similar studies carried out by the Dutch and Belgian central
banks.
When constructing the survey, we had numerous consultations with HSH (The Federation of
Norwegian Commercial and Service Enterprises) and NHO Reiseliv (Norwegian Hospitality
Association). We assumed that the bulk of the respondents would be organised in one of
these organisations. We also conducted a pilot study among some of the members of these
organisations, to test and improve the quality and relevance of the questions. The survey
was administered by Norges Bank.
Plan A:
To draw a statistically valid sample, we contacted Statistics Norway. We defined the
statistical codes of the different industries that we wanted in our sample. The total
population consisted of 128 141 enterprises. Most of these enterprises were very small. The
sample drawn consisted of 2 996 enterprises. In order to avoid too many very small
enterprises in the sample, our drawing procedure was as follows:

94
The population was divided by industry and size (the number of employees). The likelihood
of being drawn was constant within each industry. The likelihood of being drawn increased
with the number of employees. The likelihood was twice as large for enterprises with 0 to 3
employees as for enterprises where we had no information on the number of employees
(normally one-person entities). The likelihood of being drawn doubled for enterprises with 4
to 19 employees compared to enterprises with 0 to 3 employees. The likelihood was again
doubled for enterprises with more than 20 employees compared to enterprises with 4 to 19
employees.
The questionnaire was sent to the respondents in late autumn 2007. It was accompanied by
a letter from the governor of the central bank which emphasised the importance of this
survey to society. We also attached a letter from HSH and NHO urging their members to
respond. Enterprises participating would at a later stage receive the results of the survey so
that they could compare their own submitted information to the average for all
respondents.
The response to the questionnaire was indeed far from good. Even though we reminded the
businesses about our questionnaire by letter and phone, the total number of enterprises
responding was only 122, representing 155 businesses, far from being satisfactory for our
purposes.
Plan B:
To improve the data, we selected 40 large members from HSH and NHO. Even though our
hopes were high for a better response rate this time, we had to work hard for this.
The data from Plan B was added to the data from Plan A. Disappointingly, even the
combined Plan A + B consists only of 147 respondents, covering 696 businesses. This is
better, but not as good as it should be to make a proper statistically reliable analysis.
Plan C:
Working with the data collected we discovered that the time spent by the customer to pay
at the cash register was substantially greater for all payment instruments than in similar
surveys from the Netherlands and Belgium. We suspected that the respondents’ degree of
accuracy on these questions was low. We therefore conducted a special study, collecting

95
detailed information from 8 different businesses on time spent on payment transactions.
559 cash transactions, 401 debit card transactions and 103 credit card transactions were
recorded. The results showed that the time used to perform the payment operation were in
line with our expectations, and even lower than what was recorded in the surveys in Belgium
and the Netherlands.
Questionnaire
The questionnaire was developed to take into account all potential cost elements relevant
for cash handling and payments. Of course, not all items were relevant for all respondents,
but overall the form enabled us to obtain the necessary information for the analysis. See
Gresvik and Haare (2009).
Experiences
We can see a couple of reasons why the response rate was low.
First, our questionnaire had a many questions asking for detailed and complex financial
information. The response rate would perhaps been better if the questions had been of the
“yes-no” type or giving qualitative assessments to a number of statements, or if we had
made visits to a sample of merchants, collecting information on-site.
Second, the result would perhaps also have been better if the merchants associations had
been directly involved in the survey. Even though we had very good support from the
associations, they were not directly a part of it.
We put a lot of effort in trying to convince the merchants to answer the questionnaire, but
did not succeed very well. The reason might be that payment costs is not considered to be a
big element in merchants’ total costs.

96
Appendix to Chapter 6 Household costs
Results: Assumptions
The household survey covered use of cash and cards payments. There is information
accessible that enables us to calculate households’ private costs on cash and cards
payments. Making assumptions on time spent paying giros and withdrawing and depositing
cash made it possible to calculate households’ private costs for these activities as well. The
calculation of households’ costs is thus fairly complete. The calculation of costs is based on a
set of assumptions, and on the calculation of payment transactions elaborated below.
The household survey gave information on number of cash payments in the society,
calculations are shown in Gresvik and Haare (2008a). Based on accessible information, we
calculated the households’ private cost of paying, depositing and withdrawing cash as
follows:
Time studies on paying using cash were collected from the merchant survey. Average time
spent on a cash payment was 16 seconds. Time spent on cash withdrawals from ATM was
assumed to be 110 seconds, split on 60 seconds in queue / shoe-leather cost and 50 seconds
spent on the withdrawals itself (Bergman et al. (2007)). Time spent on cash withdrawals over
the counter were assumed to be 180 seconds, split on 60 seconds in queue / shoe-leather
cost and 120 seconds spent at the counter. Time spent on cash deposits over the counter
97
were assumed to be 180 seconds, split on 60 seconds in queue / shoe-leather cost and 120
seconds spent at the counter.
Average salary in society is based on statistics from Statistics Norway48. Average tax in
Norway is assumed to be 28 per cent on income.
Number of transactions is based on Norges Bank’s statistics (withdrawals), the bank survey
(deposits) and on the household survey (payments).
The household survey gave information on the use of cards. This information was checked
against the domestic statistics on card use. Based on these two sources, the number of
transactions was calculated (see Gresvik and Haare, 2008a for details). Based on the number
of transactions, time spent and fees paid, households’ private costs were calculated.
The household survey gave no information on bill payments. However, information on use of
bill payment services (giro) and fees paid for using these services were available.
Norges Banks’ Annual Report on Payment Systems 2007 provides statistics on the use and
values paid in tables 10 and 14. A problem for the use in this analysis is that there are no
split on retail market and corporate market for other solutions than Internet banking. We
made the assumption that the same distribution between the two markets for internet
banking is valid for other bill payments. This gave households a 48.4 % share of the bill
payments, measured by number of transactions.
Households generally pay fees for using bill payment services. The distribution of fees is
explained in annex to chapter 2.
The survey provided no information of the time spent on paying bills. To make calculations
on costs, we therefore assumed that time spent on a bill payment is 60 seconds, on average.
The private costs to households of bill payments were calculated as follows:
48
See: http://www.ssb.no/emner/06/05/lonnansatt/tab-2008-06-19-01.html
98
The main findings in the household survey were domestic use of cash and cards by residents
and non-residents. As explained in Gresvik and Haare (2008 a and b), the number of
payments using cash and cards at point of sale rests on a couple of assumptions. These
assumptions are repeated here.
Altering survey data
The data in the survey agree rather well with statistics on card use in Norges Banks’ Annual
Report on Payment Systems 2007. However, we have chosen to make changes in the data
set in the survey for a particular relation: the number of VISA transactions in the survey is
apparently overestimated by 40 percentage points compared to domestic data49, while the
number of transactions based on BankAxept cards (the domestic debit card solution) is
underestimated by 38 percentage points.
A probable explanation is that most physical plastic cards issued in Norway are combined
cards, and the combination Visa / BankAxept is by far the most common. The Visa logo is on
the front of the card, while the BankAxept logo is on the back. When the card is used in a
card terminal which accepts BankAxept, the BankAxept card function is used by default. Visa
is a well-known brand, and BankAxept is not. In a survey conducted by BBS (the owner of the
BankAxept brand), only 15 % of the respondents recognised the brand to be related to
payment cards. Most cardholders thus believe they have a Visa card, while the truth is that
they have a BankAxept card for payments. We believe this is a just cause for adjusting the
data from the survey, and we will use the adjusted data set in our analysis.
49
Domestic data is from Norges Bank’s Annual Report on Payment Systems 2007 and includes all transactions in Norway.
Appendix Graph 1

99
The average value of card payments in the survey differs from the average value of card
payments in domestic data. We believe this is due to the low number of observations for
some of the brands. In the domestic data set, average value is higher for international
brands of payment cards than for the survey data set. We believe this is due both to a
limited number of observations in the survey and because the respondents did not include
businesses. When businesses use international cards, the value of the purchases is typically
higher than when private individuals use the same cards. We therefore assume that the
survey gives a relatively correct picture of cash use in the society. As an example, we had
only two observations based on American Express cards in the survey. The value of these
two transactions can hardly be representative for an average payment in Norway for such
cards. This is a weakness in the survey data set which is difficult to compensate for and leads
us to recommend caution when interpreting the results. There were a relatively high number
of BankAxept observations, and the average BankAxept payment is closer to what is found in
the domestic statistics.

100
Residents, non-residents, and residents travelling
The survey only covers people living permanently in Norway (residents). In our calculations,
we make the assumption that residents and non-residents have the same pattern of use of
cash and cards.
Process
The household survey was conducted by phone to a representative sample of Norwegians 16
years and older. 2608 persons responsed, of these 1201 replied to all 9 questions. 8
questions in the survey covered households’ access to cash and deposits, while the 9th
question covered payments using cash and cards.
The survey was conducted through the third week of September 2007. This week was
chosen as it was a week that was “normal” in payment systems terms (no major holidays, tax
payments, welfare payments etc), so that it could be used as basis for calculating annual
values for 2007.
The survey was conducted as an omnibus type, that is: the market analysis company
(Norstat) made calls every day through one week, asking questions about what the
respondent did the previous day.
The questionnaire was developed on basis of a similar survey done by Norges Bank in 1993,
a similar survey conducted by the Belgian Central Bank, and coordinated towards the
banking and merchant survey questionnaires in this memo.
Experiences
The household survey gave proper data material and met the desired quality level, and we
consider it to be a success.
When constructing such a survey it is important that the questions are clear and not
equivocal. Before interviewing the interviewers should have a minimum knowledge about
the topic and the background. We therefore had an information session with the
interviewers before they started calling respondents.

101
If the survey in any way should be supplemented, we could perhaps have had questions on
what the households consider to be their costs of paying. To this end we used information
from other sources in our calculations.