Embed Size (px)
Citation preview

Upjohn Institute Working Papers Upjohn Research home page
2011
Benefit Payment Costs of UnemploymentInsurance Modernization: Estimates Based onKentucky Administrative DataChristopher J. O'LearyW.E. Upjohn Insitute, [email protected]
Upjohn Institute Working Paper No. 11-172
This title is brought to you by the Upjohn Institute. For more information, please contact [email protected].
CitationO'Leary, Christopher J. 2010. "Benefit Payment Costs of Unemployment Insurance Modernization: Estimates Based on KentuckyAdministrative Data." Upjohn Institute Working Paper No. 11-172. Kalamazoo, MI: W.E. Upjohn Institute for Employment Research.https://doi.org/10.17848/wp11-172
Benefit Payment Costs of Unemployment Insurance Modernization:
Estimates Based on Kentucky Administrative Data
Upjohn Institute Working Paper 11-172
Christopher J. O’Leary W.E. Upjohn Institute for Employment Research
e-mail: [email protected]
January 2011
ABSTRACT The American Recovery and Reinvestment Act (ARRA) of 2009 provided financial incentives for UI modernization. The financial incentive is the state share of $7 billion available nationwide. States can receive one-third of their allocation by having an alternate base period (ABP) for monetary determination of UI eligibility that includes the most recently completed calendar quarter. States can receive the remaining two-thirds of their allocation for having two of four additional program features: 1) UI eligibility while seeking only part-time work, 2) UI eligibility after job separations due to harassment or compelling family reasons, 3) continuation of UI benefits for at least 26 additional weeks after exhaustion of regular benefits while in approved training, and 4) dependents’ allowances of at least $15 per dependent up to $50. This paper presents estimates of the UI benefit payment costs of these five program changes based on data from the Commonwealth of Kentucky. To date 39 states have received modernization payments for having an ABP, and 32 states have received the remaining two-thirds of funds available. The numbers of states adopting each of these additional features are as follows: 25 for seeking part-time, 18 for family reasons, 14 for exhaustee benefits while in training, and 7 for dependents’ allowances. Estimates of the UI benefit payment costs for these features, based on Kentucky data, suggest a pattern of states choosing UI modernization features to minimize the expected benefit payment costs. However, for states broadening UI eligibility through modernization, UI benefit payment costs will be higher for any given level of unemployment. Liberalized eligibility rules must be balanced by structural financing enhancements to ensure long-term fiscal stability of the system. JEL Classification Codes: J65, J68, H83 Key Words: unemployment insurance, UI, modernization, American Recovery and Reinvestment Act, benefit payments, Kentucky, administrative data, state expenditures Acknowledgments: I wish to thank Ken Kline for expert research assistance and Claire Black for excellent clerical support. This paper is based on research done for the Commonwealth of Kentucky under a subcontract to the W.E. Upjohn Institute from the Urban Institute and was prepared for presentation at a Labor and Employment Relations Association (LERA) session titled “Unemployment Insurance Benefits and Financing during the Great Recession,” part of the Allied Social Science Association (ASSA) conference held in Denver, Colorado, January 8, 2011. I thank Rob Pavosevich, Wayne Peel, Wayne Vroman, and Steve Woodbury for useful suggestions. Opinions expressed and any errors are mine.

1
INTRODUCTION
The American Recovery and Reinvestment Act (ARRA) of 2009 provided financial
incentives for states to adopt permanent changes to their unemployment insurance (UI) systems.
This package of reforms has been called UI modernization. The financial incentive is the state’s
share of the $7 billion available nationwide, computed as the state’s proportion of all federally
taxable earnings in UI-covered employment.1
States can receive one-third of their modernization allocation by having an alternate base
period (ABP) for monetary determination of UI eligibility that includes the most recently
completed calendar quarter. States can receive the remaining two-thirds of their allocation for
having two of the following four additional program features: 1) UI eligibility while seeking only
part-time work, 2) UI eligibility after job separations due to harassment or compelling family
reasons, 3) continuation of UI benefits for at least 26 additional weeks after exhaustion of regular
benefits while in approved training, and 4) dependents’ allowances of at least $15 per dependent
up to $50.
The total allocation available to Kentucky under
this initiative is $90.2 million.
This paper presents estimates of the UI benefit payment costs of these five program
changes based on data from the Commonwealth of Kentucky. To date, 39 states have received
modernization payments for having an ABP, and 32 states have received the remaining two-
thirds of funds available. The numbers of states adopting each of these additional features are as
follows: 25 for seeking part-time, 18 for family reasons, 14 for exhaustee benefits while in
training, and 7 for dependents’ allowances. Estimates of the UI benefit payment costs for these
1 Each state’s share of the $7.0 billion is determined based on the state’s proportionate share of Federal
Unemployment Tax Act (FUTA) taxable wages in calendar year 2007. SOURCE: Section 903(d)(2)(A) of the Social Security Act (SSA), as added by the Temporary Extended Unemployment Compensation (TEUC) Act, and Section 903(a)(2), SSA.

2
features, based on Kentucky data, suggest a pattern of states choosing UI modernization features
to minimize the expected benefit payment costs. However, for states broadening UI eligibility
through modernization, UI benefit payment costs will be higher for any given level of
unemployment. Liberalized eligibility rules must be balanced by structural financing
enhancements to ensure the long-term fiscal stability of the system. Kentucky has not qualified
for any UI modernization payments.
KENTUCKY DATA FOR ANALYSIS
Analysis of UI modernization was done with administrative data constituting a census in
program administrative records. The sample included all applications for regular UI benefits with
effective dates of claim from January 1, 2006, through June 30, 2009. There were 728,109 claims
for regular UI benefits in Kentucky during these 14 calendar quarters (Table 1).2
From this total we deleted 120 records for persons who applied multiple times within the
same calendar quarter. For each of these cases we retained only the first application in the
quarter. We also deleted the second of back-to-back UI claims from exhaustees of their full UI
benefit entitlement. These second claims were deleted because different monetary eligibility
rules apply to the establishment of back-to-back claims following exhaustion of UI benefits. A
total of 7,076 claims were deleted for such cases, yielding a sample of 720,913 for analysis.
Beyond these administrative data, we also relied on case notes from 500 administrative hearings
2 Data was extracted from Kentucky UI administrative systems in early August 2009. There are sufficient
data to identify actual monetary eligibility for all applicants. Complete benefit-year payment data are available for more than 90 percent of the sample. Benefit-year UI payment information is censored for most claims in 2009 Q2 and some in 2009 Q1. We use the full sample for simulations both to maximize use of information and because our interest is in differences between SBP and ABP. With monetary eligibility rates distributed similarly across quarters, censoring of benefit payment data does not impact estimates of percentage changes in participants and costs.

3
involving appeals of UI eligibility. Additionally, we received staffing and turnover estimates
from major federal military bases in Kentucky.
ALTERNATE BASE PERIOD
To qualify for an ABP modernization grant, states can choose one of two ABP options: 1)
a base period that includes the most recently completed calendar quarter or 2) for applicants not
eligible under a state’s standard base period, monetary eligibility is determined using a base
period including the most recently completed calendar quarter (PL 111-5, Section 2003). Under
ARRA, $30.1 million would be paid to Kentucky for adopting an alternate base period (ABP) for
monetary determination of UI eligibility. This section summarizes the complete ABP analysis for
Kentucky presented in O’Leary (2009a).
Monetary Eligibility for UI in Kentucky
Monetary eligibility for UI in Kentucky requires four conditions to be met: 1) at least
$750 earned in the high quarter of the base period, 2) total base period earnings of at least 1.5
times the earnings in the high quarter, 3) at least $750 in earnings outside the high quarter, and 4)
earnings in the two most recent quarters of the base period of at least eight times the UI weekly
benefit amount (WBA). The WBA is computed as 0.013078 multiplied by base period earnings
rounded to the nearest whole dollar. The UI base period is the first four of the five most recently
completed calendar quarters. For back-to-back benefit years, a UI applicant must have earnings
for the last two quarters of the base period of the second claim of at least eight times the WBA.
For 2009 the minimum WBA is $39 and the maximum $415.3
3 Kentucky is one of six states using an annual wage formula for the WBA; the others are Arkansas,
Montana, New Hampshire, Oregon, and West Virginia. The minimum WBA has been $39 since at least 2001. The maximum was $365 in 2006, $401 in 2007, and was raised to $415 in 2008.

4
Estimating Kentucky’s ABP Costs
For the sample of 720,913 Kentucky UI applications there were 654,838 actual
monetarily eligible claims for UI benefits, meaning a rate of 90.83 percent. To simulate the ABP
options we first validate that our computation for monetary eligibility is correct. Applying the
Standard Base Period (SBP) formula to the quarterly earnings records stored by Kentucky Office
of Employment and Training (OET) yields 654,851 claims simulated as monetarily eligible
under the SBP, for a rate of 90.84. The simulation wrongly classified only 13 UI applicants out
of 720,913. This is an extremely high level of concordance between the simulation and the actual
decisions. In some cases wages might be added or removed in the monetary determination
process, with such changes not recorded in the quarterly wage records.
Validation of the simulation for the SBP is important for estimating the costs of ABP
implementation since we compare the simulated SBP with the ABP. The simulations classify
monetary eligibility and compute an estimate of the WBA. Both the SBP and the ABP
simulations rely on the full-time equivalent weeks of UI benefit receipt (compensation received
in the benefit year divided by WBA) and the actual beneficiary rates observed for UI applicants
in the data.
Not everyone who is monetarily eligible draws UI benefits. Some might not satisfy
nonmonetary eligibility rules regarding conditions of their job separation, such as those who quit
their jobs or were justifiably discharged by their employers. In our analysis, the beneficiary rate
is the fraction of monetarily eligible applicants who receive benefits. We separate the monetarily
eligible sample into WBA groups and figure the beneficiary rate for each dollar increment of the
WBA. We array the sample in WBA groups from $39 to $415 and list the mean beneficiary rate
and mean observed duration of benefit receipt for each group. These means are based on the
actual experience of monetarily eligible UI claimants at each WBA level. The UI benefit

5
payment estimate for each WBA group is the product of the number of monetarily eligible
claims, the WBA, the beneficiary rate, and the mean observed duration of benefit receipt for each
WBA group.
It is important to note the change over time in the volume of UI claims, listed in Table 1.
The table shows that 176,522 UI applications were filed in 2007 from Quarter 1 through Quarter
4, which was a normal year for UI claims in Kentucky. For the 12-month recession period from
2008Q3 through 2009Q2, a total of 283,217 UI claims were filed—a 60 percent higher UI
application rate.
Option A: The ABP is applied to all applications The simulation of the SBP on the initial sample of 720,913 Kentucky UI applications
yielded 654,851 claims that are monetarily eligible, for a rate of 90.84 percent. Option A for the
ABP requires that monetary eligibility for all applicants be determined based on earnings in the
four most recently completed calendar quarters. Results from the Option A simulation for the
ABP are summarized in Table 2, which reports monetary eligibility for 660,718 of the 720,913
claims for UI benefits. That rate is 0.90 percent higher than under the SBP. However, not
everyone who is monetarily eligible under the SBP is also monetarily eligible under the ABP.
Applying the ABP alone, instead of after the SBP as in Option B, excludes 12,616 applicants that
were monetarily eligible under the SBP. The ABP allows eligibility for 24,246 applicants that
were not monetarily eligible under the SBP. Of these, 5,763 claims had already been paid under
the SBP after reapplication at a later date. Thus, the actual number of new monetarily eligible
claims under the ABP would be 18,483. In addition to the potential costs associated with the
newly monetarily eligible group, the likely costs associated with those previously eligible under
the SBP change under the ABP.

6
A total of 642,235 applicants in the sample are monetarily eligible under either the SBP
or the ABP. Simulations suggest that among those who would be monetarily eligible under either
the SBP or the ABP, the average WBAs, beneficiary rates, and duration of UI benefit receipt
would change. A subgroup of 251,654, or 39 percent, would qualify for the same WBA under
either the ABP or the SBP, so we simulate no change in the cost associated with payment of
these claims (Table 3). These applicants have an average WBA of $398, a beneficiary rate of
88.4 percent (as a percentage of monetarily eligible applicants), and an average UI duration of
11.1 weeks. Another 237,030, or 37 percent, would have a higher WBA under the ABP than the
SBP, resulting in an increased cost of $86.2 million in our sample. On average, for these UI
claimants the average WBA increases from $241 to $269, their beneficiary rate increases from
76.7 to 79.0 percent, and their average UI duration increases from 12.3 to 12.5 weeks. The final
subgroup of 153,551, or 24 percent, who qualify under both the SBP and the ABP would have a
lower average WBA under the ABP than the SBP, resulting in a cost decrease of $31.6 million.
Their average WBA falls from $282 to $259, their beneficiary rate falls from 79.3 to 78.2
percent, and their average UI duration falls from 13.1 to 12.6 weeks. The net cost of switching
from the SBP to the ABP for the 642,235 monetarily eligible applicants under either regime is
$31.6 million, resulting from an average WBA that increased from $312 to $317, a beneficiary
rate that increased from 81.9 to 82.5 percent, and an average duration of receipt that was
unchanged at 12.0 weeks.
Among all applicants, 660,718 would be monetarily eligible under the ABP, including
18,483 who would be monetarily eligible only under the ABP and not under the SBP. In our
computations, the figure of 18,483 results from an additional 24,246 simulated to be monetarily
eligible minus 5,763 who are already paid under the SBP because they reapply after initially

7
being denied. Their second claim is eligible under the SBP, and their first claim would have been
eligible under the ABP. Our simulation on this sample suggests that the UI beneficiary rate for
the whole group of 24,246 would be 67.6 percent, the average WBA would be $156, and the
average duration of UI benefit receipt would be12.8 weeks. The cost of UI benefit payments to
this group would be $35.3 million. From this amount we subtract $12.1 million, which is the cost
already paid to the 5,763 who become monetarily eligible after reapplication. Thus, the 18,483
brought into monetary eligibility end up costing $23.2 million.
Compared to the SBP, the additional cost of the ABP under Option A is estimated to be
$30.7 million. It is the sum of the increased cost of paying benefits to those already monetarily
eligible under the SBP of $7.5 million, plus the increased cost of paying UI to those newly
monetarily eligible under the ABP of $23.2 million. Recall that all these figures were computed
over data covering three-and-one-half years, from 2006Q1 through 2009Q2. At the rate of
simulated monetarily eligible UI benefit claims in calendar year 2007—chosen to represent
normal economic times—payments for ABP under Option A would be $8.8 million in a normal
year. At the rate of simulated monetarily eligible UI benefit claims in the four calendar quarters
from 2008Q3 through 2009Q2—chosen to represent a recession year—payments for ABP under
Option A would be $12.1 million.4
4 The Kentucky data on all UI benefit claims between January 1, 2006 and June 30, 2009, include four
calendar quarters of recession-level data (2008Q3 through 2009Q2) and 10 calendar quarters of data from times of more normal labor markets (2006Q1 through 2008Q2). Dividing total claims in these 14 calendar quarters by 3.5 yields a simple annual average claims rate. However, this average is a blend of claims rates in times of both normal and recessionary labor markets. That is, total claims, T, are composed of 2.5 years at the level of normal claims, N, plus 1 year at the level of recession claims, R, or T = 2.5 * N + R. The ratio of recession to normal UI claims is r = R/N. To partially represent the UI eligibility process, which can vary with labor market conditions, the ratio for our Kentucky data, based on simulated monetarily eligible UI claims, is r = R/N = (260,261 / 159,509). Rearranging this, we have N = R/r. Therefore, substituting, we have T = 2.5 * R/r + R, and solving for R yields R = T / ((2.5/r) + 1). Assuming that total costs, TC, change in proportion to total simulated monetarily eligible claims, from our ABP incremental cost estimates we can solve for annual recession UI benefit payment costs, RC, as RC = TC / ((2.5/r)+1), and for normal annual UI benefit payment costs, NC, as NC = RC/r.
8
The ARRA would grant Kentucky $30.1 million for adopting ABP. Under Option A this
would yield approximately 4.0 years of ABP-related UI payments in normal economic times and
2.5 years of such payments during times of severe-recession labor markets.
Option B: The ABP is applied only to those not monetarily eligible under the SBP A simulation of monetary eligibility under the SBP on the initial sample of 720,913
Kentucky UI applicants yields 654,851 monetarily eligible claims, for a rate of 90.84 percent.
We then consider the 9.16 percent of the sample not monetarily eligible under the SBP.
Among the 66,062 not monetarily eligible under the SBP, there are 24,245 that would be
eligible under the ABP. This number is 3.36 percent of the initial sample of applicants. However,
when considering the additional cost to the Kentucky UI system, we must recognize that some
people filed more than one application for UI in this period. Indeed, it is the case that 5,763
claimants who were not monetarily eligible under the SBP reapplied a short time later and had
their second claim accepted as being monetarily eligible because earnings in a more recent
calendar quarter were considered at the later date. By their reapplication, these claimants
essentially applied an ABP and were paid benefits. If an ABP is adopted in Kentucky, UI
payments to such claimants do not result in additional costs to the system. Removing these
claimants from the simulated number of additional monetarily eligible claimants under ABP
yields a total of 18,483 new monetarily eligible claimants who are potential beneficiaries. That
is, the ABP under Option B would increase the proportion of monetarily eligible UI applicants
by 2.82 percent, to 673,334.
Those not eligible under the SBP who become eligible under the ABP tend to have lower
average earnings, and therefore a lower average WBA, than those eligible under the SBP (Table
3). So while Option B increases the number of monetarily eligible UI claims by 2.82 percentage

9
points, the percentage increase in the cost of paying UI to this additional group is lower. In
addition to having a lower average WBA, some of the applicants who qualify under an ABP fail
to satisfy nonmonetary eligibility rules for job separations. That is, the beneficiary rate for those
who qualify under the ABP is less than 100 percent.
For the incremental sample of persons found eligible under an ABP scenario, the WBA is
calculated. Since we cannot know who would have ultimately become a beneficiary, nor the
duration of UI benefits received, the actual, observed beneficiary rate and UI duration of persons
in the comparison group who had comparably calculated weekly benefit amounts is used.5
To compute the cost of the increased monetary eligibility resulting from the ABP, we
array the sample of 18,483 by WBA from $39 to $415 and multiply the mean observed
beneficiary rates and benefit durations times the number of observations and the WBA amount.
We total these results across all WBAs, yielding an estimate of the incremental cost of adding
the ABP for those without sufficient earnings in the SBP.
The cost of Option B for implementing an ABP is estimated to be $23.2 million, or an
increase of 1.17 percent in regular UI benefit payment costs above the cost for paying benefits
under the SBP. Over the 14 calendar quarters from 2006Q1 through 2009Q2, the average annual
cost is estimated to be $6.6 million per year. At the rate of UI benefit payments in calendar year
2007, representing normal economic times, payments for the ABP under Option B would be $5.6
million. Letting benefit payments in the four calendar quarters from 2008Q3 through 2009Q2
5 Among the claimants eligible under the Kentucky SBP, 99.2 percent had calculated WBAs based on
Kentucky UI law and the wage record data that matched the actual WBA used for paying benefits. Since wages may be added or removed in the monetary determination process without such changes being entered into the quarterly wage records, only a small fraction of persons show a difference between calculated and actual weekly benefit amounts. Because it is not possible to know such differences for persons simulated to be eligible under the ABP, the calculated WBA is used throughout the entire analysis. The exception to this is for the calculation of UI duration, which is defined as actual UI compensation received divided by actual WBA in the SBP-eligible sample.

10
represent annual benefit payments during periods of recessionary labor markets, payments for
Option B’s ABP would be $9.2 million.
The ARRA would grant Kentucky $30.1 million for adopting the ABP. Under Option B
this would yield approximately 5.4 years of ABP-related UI payments in normal economic times
and 3.3 years of such payments during times of severe-recession labor markets.
Prior Estimates of ABP Costs
Before ARRA, 20 states had ABP rules for UI (GAO 2007, p. 21). To date, 39 states have
approved ABP rules to receive the first one-third allocation of UI modernization funds. Vroman
(1995, p. 138) estimates the effects of ABP Option B using claimant-level administrative data
from three of the six states with ABP rules in 1994 (Table 4). He analyzes data from Maine,
Vermont, and Washington.6
6 Massachusetts, Ohio, and Rhode Island also had ABP provisions in 1994.
Vroman estimates that ABP Option B would increase beneficiaries
by between 5.5 and 12.5 percent, and that total UI benefit payments would increase by between
3.8 and 9.6 percent. Planmatics (1997, p. 127) estimates that based on simulations of switching
from the SBP (the first four of the previous five completed quarters) to ABP Option A (the most
recent four completed quarters) in Massachusetts, New Jersey, Ohio, Vermont, and Washington
would increase estimated benefit payment costs by between 4.2 and 5.8 percentage points. Using
Survey of Income and Program Participation data, Stettner, Boushey, and Wenger (2005, p. 3)
estimate that overall UI monetary eligibility would have increased by 7.2 percent in 2003 if all
states had implemented the ABP’s Option B. In states that have implemented the ABP, between
2.1 and 6.5 percent of all eligible claims used the ABP. ABP-eligible claims only represent 1.1 to
5.2 percent of all UI payouts in these states, because ABP claimants qualify for far less in UI
benefits.
11
Summary of ABP
Among the 39 states that since the ARRA’s passage have received the first 1/3 of funds
from the modernization grant for having an ABP in their UI programs, all have systems that
operate like Option B for their ABP. Of these, 19 states already had ABP statutes (USDOL,
2010). Adopting Option B for the ABP is estimated to increase Kentucky’s UI benefit payment
costs by 1.17 percent and to increase the rate of monetary eligibility among applicants by 2.82
percent. At the rate of UI benefit payments in normal economic times, additional UI payments
for ABP under Option B would be $5.6 million per year. At recession rates, benefit payments for
ABP Option B would be $9.2 million per year.7
This cost estimate of 1.17 percent for Kentucky under ABP Option B is much smaller
than previous estimates, which were in the range of 5.5 to 12.5 percent for other states. These
differences can be partly explained by the differing time frames and samples used for the studies,
but removing refiled claims is an important adjustment. One element of an ABP not simulated in
this analysis is the possibility of an entry effect due to the availability of an ABP. The entry
effect is the percentage increase in applications resulting from knowledge in the general
population of all unemployed that UI eligibility is determined based on more recent earnings. An
The $30.1 million ARRA grant for adopting the
ABP under Option B would yield approximately 5.4 years of ABP-related UI payments in
normal economic times and 3.3 years of such payments during times of recessionary labor
markets. The Kentucky Office of Employment and Training (OET) estimates additional
administrative costs of $259,000 annually for ABP Option B.
7 Analysis based on Kentucky UI claims from January 1, 2006, through June 30, 2009. Recession and
normal years of UI benefit payments are imputed from the ratio of UI claims simulated to be monetarily eligible during four calendar quarters of the recession period (2008Q3 through 2009Q2) and during a prerecession year (2007Q1 to 2007Q4).

12
entry effect could increase UI benefit costs by about 0.61 percent.8
ELIGIBILITY WHILE SEEKING ONLY PART-TIME WORK
An entry effect of this size
implies UI benefit payments would rise after implementing an ABP under Option A by 2.16
percent and under Option B by 1.78 percent.
Beyond the ABP, one of the four UI modernization features states may adopt to qualify
for an incentive payment is to permit eligibility while a UI applicant is seeking only part-time
work. This section summarizes the complete analysis for Kentucky of the UI benefit payment
costs for Kentucky of adopting such a program change, as presented in O’Leary and Kline
(2009). Regarding this program change, the ARRA specifies the following:
An individual shall not be denied regular unemployment compensation under any State law provisions relating to availability for work, active search for work, or refusal to accept work, solely because such individual is seeking only part-time work (as defined by the Secretary of Labor), except that the State law provisions carrying out this subparagraph may exclude an individual if a majority of the weeks of work in such individual’s base period do not include part-time work (as so defined). (PL 111-5, 2003 [3][A]) For purposes of the incentive payment, the Labor Department defines “seeking only part-
time work” as meeting any one of the following situations (UI Program Letter 14-09, Small
2009, Attachment III, pp. 1–2):
• Situations where the individual is willing to work at least 20 hours per week.
• Situations where the individual is available for a number of hours per
8 The entry effect can be assumed to most affect decisions by those with earnings close to the monetary
eligibility threshold. In data on three-and-one-half years of UI applications, we found that 0.8 percent of applications involved claims by persons with insufficient earnings under the SBP who reapplied a short time later and gained eligibility based on more recent earnings. This rate may be considered a reasonable estimate of the entry effect. Furthermore, this potential entry group has lower average earnings and WBAs than those who qualify under the SBP, so the cost per monetarily eligible applicant would be lower for this group. Based on these assumptions, the annual cost of an entry effect could be about 0.61 percent of UI benefit costs, or approximately $2.9 million per year in normal economic times and $4.8 million per year in recession periods (O’Leary 2009a).

13
week that are comparable to the individual’s part-time work experience in the base period. For example, if the individual worked 16 hours per week in the base period, the state may require the individual to seek jobs offering at least 16 hours of work. If the individual worked 32 hours per week, the state may require the individual to seek jobs offering at least 32 hours of work.
• Situations where the individual is available for hours that are comparable
to the individual’s work at the time of the most recent separation from employment. That is similar to the preceding definition except that it allows the state to take into account periods between the end of the base period and the filing of the first claim for UC.
The Department will approve a state’s application if the state uses any one of the above definitions. The state may also use a combination of these definitions. For example, a state may define part-time work as having comparable hours to the individual’s work in the base period, except that an individual must be available for at least 20 hours of work per week. A state may also have a broader definition of part-time work. For example, the state may require the individual to be available for only 10 or more hours per week. Of course, the state may not allow the individual to limit his or her availability to the extent that it constitutes a withdrawal from the labor market. (See 20 CFR 604.5(A)(1).)
Research Plan for Part-Time Job Seeking
The plan for measuring the effects of permitting UI eligibility while seeking only part-
time work relies on the quarterly wage records for UI applicants. These records include data on
the quarterly earnings for every person working in the state and the employer identity numbers
for the employers paying those earnings. For each employer, the North American Industry
Coding System (NAICS) code is also given. We examine earnings in the standard base period for
each UI claimant. To avoid biases due to periods of joblessness, we focus on the base period
quarter with the highest total earnings.9
9 For workers with multiple employers in a quarter, we select the industry of the employer paying the most
wages in that quarter.
Our research strategy is to infer the weekly earnings of
each UI claimant and compare these to industry average weekly earnings to judge whether the
14
claimant usually works full-time or part-time. We estimate average earnings by industry using a
method we call the “weekly wage method.”10
The available data for Kentucky includes wage records on all UI-covered employment
from the fourth quarter of 2003 through the fourth quarter of 2008. For each UI beneficiary, we
start with earnings in the high quarter of the base period, then divide that total by 13 weeks,
yielding estimated weekly earnings. If these earnings estimates are less than 55 percent of
industry average weekly earnings as reported in the Quarterly Census of Employment and Wages
(QCEW), we tag individuals as usually working part-time.
11
Based on these results, we identify UI claims that may have been denied because of job
seeking limited to part-time work, then we estimate the cost of paying UI to such denied
applicants. This estimate will be the minimum cost to the system of broadening eligibility to
part-time job seekers. Additional costs could result from a higher rate of UI applications
stemming from an “entry effect” to UI application by unemployed persons who previously
would not have applied since they believe they would not have been entitled to benefits.
Weekly Wage Method for Estimating Part-Time Job Seeking
The QCEW contains statewide and county-based quarterly data on the average weekly
wage (AWW) by NAICS industry code for Kentucky.12
10 O’Leary and Kline (2009) also report results for a method they call the “hourly wage method,” which
relies on occupational wage data within industry groups.
For each employer reporting payments
in the UI quarterly wage records, the employer county location is identified by a Federal
11 O’Leary and Kline (2009) in their Table 6 report estimates based on part-time earnings as 50, 55, and 60 percent of the average weekly wage (AWW). Results presented in this paper are based on 55 percent of the AWW since they conform most closely with results from the hourly wage method.
12 The Quarterly Census of Employment and Wages (QCEW) program publishes a quarterly count of employment and wages for employers covering 98 percent of U.S. jobs, available at the county, MSA, state, and national levels by industry (BLS 2009). Counties are identified by the five-digit Federal Information Processing Standard (FIPS) county code.

15
Information Processing Standard (FIPS) code and a NAICS industry code. However, because of
data quality checks and data suppression to prevent identification of firms, the QCEW does not
report average weekly wage estimates for all county and six-digit NAICS combinations. Some
counties might include only one or two enterprises in a six-digit industry, thereby making
confidentiality impossible if the estimates were to be released. The QCEW reports wage
estimates for a higher proportion of county/industry groups at higher levels of NAICS code
aggregation. Naturally, average weekly wage estimates are provided by the QCEW for an even
higher fraction of industry groups at the statewide level.
At the finest level of detail, 51 percent of the QCEW average weekly wage records were
successfully matched to six-digit NAICS codes in the quarterly wage records by county, year,
and calendar quarter. The remaining records were successfully matched using different levels of
aggregation in the remaining QCEW data. The following methods, in order of highest to lowest
priority, were used to complete the matching process (the percentage of all records matched
using that method is shown in parentheses): 1) AWW at the five-digit NAICS level by county,
year, and calendar quarter (5.0 percent); 2) AWW at the six-digit level using statewide estimates
for the year and quarter (29.9 percent); 3) AWW at the five-digit level of detail using statewide
estimates for the year and quarter (3.1 percent); 4) AWW at the four-digit NAICS level for the
county, year, and quarter (0.4 percent); and 5) AWW for the four-digit NAICS level using
statewide estimates for the year and quarter (1.6 percent). The result of this process was an
overall match success rate of 91.6 percent (38.7 million out of 42.2 million records).
With QCEW average weekly wage estimates having been matched with the quarterly
wage records, the final step was to define part-time employment. The definition used was based
on wages reported for an individual as a percentage of the QCEW average weekly wage. We

16
defined someone as being employed part-time if his or her total wages as reported for a quarter,
divided by 13, were less than 55 percent of the average weekly wage for that worker’s industry
of employment.13
Entry Effects for Part-time Job Seeking
Over the entire interval of available quarterly wage records, the weekly wage
methodology suggests that 32.8 percent were employed on a part-time basis. Estimated average
weekly earnings based on actual quarterly wage records were $190 for the part-time employed
compared with $848 for those employed on a full-time basis.
In estimating the cost of a UI program change, we should consider the possible additional
cost of paying UI benefits to unemployed job seekers who do not apply for benefits under current
eligibility conditions, but might apply if rules are changed. Among all people eligible for UI
benefits after involuntary job loss, only about two-thirds apply for and receive cash benefits
(Blank and Card 1991). This proportion is called the program take-up rate. This rate tends to
increase with the aggregate level of unemployment in the labor market, and it might be further
increased by the availability of extended unemployment compensation.
As guidance for estimating increases in the UI take-up rate, we consider the estimates of
possible “entry effects” associated with experimental evaluation of UI reemployment bonuses
(Davidson and Woodbury 2001, pp. 191–195). Moffitt (1992, p. 250) argues that estimation of
entry effects is best done with observational administrative data–contrasting situations,
comparing places where a program feature operates against places where it does not. Based on
evidence from the UI bonus field experiments, Meyer (1995, p. 109) estimates that the
availability of a cash reemployment bonus about 3.5 times the average weekly benefit amount
13 For individuals employed by multiple employers in a quarter across multiple industries, the overall
QCEW average weekly wage, used to define part-time employment, is a weighted sum of the average weekly wages for the individual industries. Wages reported for the individual for an industry as a share of total wages reported serve as weights. The weights sum to 1.0.

17
would induce an additional 7 to 12 percent of UI-eligible unemployed job seekers to apply for
benefits. Davidson and Woodbury (2001, p. 191) assert that “workers who claimed UI benefits in
response to the bonus would generally be workers with short expected durations of
unemployment for whom the advantages of claiming benefits were previously not enough to
outweigh the costs.”
Broadening eligibility to permit UI benefit payments to applicants willing to accept only
part-time reemployment may draw in some additional applicants, but unemployment rates tend
to be lower among regular part-time workers. During the recent recession, from September 2008
to September 2009, while the total unemployment rose from 6.2 to 9.8 percent, the
unemployment rate among full-time workers rose from 6.3 to 10.7 percent, and the rate among
part-time workers rose from 5.9 to 6.4 percent. Indeed, many who normally work full-time
remained employed by reluctantly accepting part-time work during the recession (BLS 2008a, p.
1). A conservative estimate of increased UI benefit payment costs associated with an entry effect
would be to double the added costs associated with paying part-time workers already applying
for, but not receiving, UI benefits.
Costs of Paying UI to Part-time Job Seekers
The two key aspects of UI eligibility are 1) monetary—having sufficient prior earnings to
demonstrate strong labor force attachment—and 2) nonmonetary—job separation was not the
result of a voluntary quit or employer discharge for cause. Estimates of the effects of eligibility
for part-time job-seeking on UI monetary, nonmonetary, and beneficiary rates among current UI
applicants are summarized in Table 5 based on UI applicants from January 2006 through July
2009. The overall estimated initial UI eligibility rate is 46.5 percent. It is possible to qualify and
receive UI benefits even if a claimant is not monetarily and nonmonetarily eligible. The

18
beneficiary rates are estimated to be 0.568. Among those simulated to satisfy both eligibility
conditions, the nonbeneficiary percentage is 5.2 percent. This is the core estimate for computing
the likely cost of liberalizing eligibility to permit part-time job-seeking.
For the group of likely part-time job seekers eligible for UI but not receiving benefits,
Table 5 also summarizes the estimated percentage cost increase to Kentucky for paying benefits.
The table presents estimates suggesting that the UI weekly benefit amount (WBA) for eligible UI
applicants seeking part-time work is likely to be significantly lower than for other eligible UI
applicants. Assuming the benefit duration for current beneficiaries who normally work part-time,
we estimate that 9.1 percent of benefit payments are made to such workers and that liberalizing
the job-seeking rule would increase UI benefit payment costs by about 0.6 percent. For example,
based on parameter estimates, we multiply the number of part-time UI applicants (109,689)
times the proportion of those eligible but not beneficiaries (0.052), times the average WBA for
eligible nonbeneficiaries ($135), by the mean duration in weeks for part-timers who actually
receive UI benefits (13.4). Dividing this result by total UI benefits paid yields the additional cost
in percentage terms of paying UI to applicants who are part-time job seekers.14
Based on Kentucky UI benefit payouts in recent years, Table 6 presents the estimated
annualized increase in UI benefit payments to part-time job seekers as $2.6 million in
nonrecession years (such as 2006) and $5.1 million in a yearlong recession period (such as
2008Q2 through 2009Q1).
15
14 For this computation UI benefit payments total $1,893,839,913. This is based on UI claims from 2006Q1
to 2009Q2, with quarterly wage records successfully matched to an industry weekly wage rate by the method described above.
Allowing for an entry effect that doubles costs for part-timers,
estimates for additional benefit payments are $5.2 million in years with normal labor markets
and $10.2 million in years with recession labor markets.
15 While we have claims data for 2009Q2, the benefit year payment data for new applications in this quarter are incomplete. The data were extracted from administrative records in July 2009.

19
Summary of Part-Time
Of the 32 states qualifying for full UI modernization grants, 25 permit UI eligibility if job
search is limited to only part-time work. These states are Arkansas, Colorado, Delaware, the
District of Columbia, Georgia, Hawaii, Idaho, Iowa, Kansas, Maine, Maryland, Minnesota,
Montana, Nebraska, Nevada, New Hampshire, New Jersey, New Mexico, New York, North
Carolina, Oklahoma, South Carolina, South Dakota, Tennessee, and the Virgin Islands.16
For the group of likely part-time job seekers eligible for UI but not receiving benefits,
liberalizing the job-seeking rule would increase UI benefit payment costs by about 0.6 percent.
Based on Kentucky UI benefit payouts in recent years, the estimated increase in UI benefit
payment costs to part-time job seekers is $2.6 million in nonrecession years (such as 2006) and
$5.1 million in a yearlong recession period (such as 2008Q2 through 2009Q1). Allowing for the
likelihood that some of the unemployed non-UI applicants who are seeking only part-time work
will apply for UI if the law is changed—an entry effect—the cost estimates for additional benefit
payments are $5.2 million in years with normal labor markets and $10.2 million in years with
recession labor markets. These results suggest that one-third of the total UI modernization grant
to Kentucky would finance about five years of benefits during times of normal labor markets and
three years of benefits during recessions.
Among
these, 4 states previously had permitted part-time job search by statute, 18 changed their laws, 1
changed regulations, and 2 changed administrative procedures (USDOL 2010).
16 For purposes of this study the District of Columbia and the Virgin Islands are counted as states.

20
COMPELLING FAMILY REASONS FOR JOB SEPARATION
One of the options for UI modernization offered to states under ARRA is permitting
eligibility for job separations resulting from compelling family reasons. This section summarizes
the complete analysis of eligibility for compelling family reasons done for Kentucky and
presented in O’Leary (2009c). Under current rules, such family reasons for a job quit or
employer discharge often result in denial of benefits. The particular issues identified by ARRA
relate to circumstances involving domestic violence, illness of an immediate family member, and
moving to stay with a spouse. To qualify for a UI modernization payment by this feature, the law
specifically states the following, in PL 111-5, 2003 (3)(B):
An individual shall not be disqualified from regular unemployment compensation for separating from employment if that separation is for any compelling family reason. For purposes of this subparagraph, the term ‘compelling family reason’ means the following:
(i) Domestic violence, verified by such reasonable and confidential documentation as the State law may require, which causes the individual reasonably to believe that such individual’s continued employment would jeopardize the safety of the individual or of any member of the individual’s immediate family (as defined by the Secretary of Labor). (ii) The illness or disability of a member of the individual’s immediate family (as those terms are defined by the Secretary of Labor). (iii) The need for the individual to accompany such individual’s spouse— (I) to a place from which it is impractical for such individual to commute; and (II) due to a change in location of the spouse’s employment.

21
Research Plan for Compelling Family Reasons
Our analysis of extending definitions of good cause quits and wrongful employer
discharges to include compelling family reasons defined in ARRA relied on a review of case
notes from a sample of UI appeals decisions after employer protests of claims for benefits. The
sample for analysis was drawn by stratified random sampling. Among several approaches to this
question, the case notes provided the most reliable evidence on the rate of compelling family
reasons among UI eligibility appeals.17
Review of Appeals Decision Case Records
Employers may protest UI claims resulting from job separations other than layoff (lack of
work) or standby (awaiting employer recall). In particular employers can protest voluntary quits
and claims following employer discharge. Justifiable discharges occur when the employer can
document circumstances such as tardiness, absences, misconduct, or inadequate job performance.
Just as employers can protest claims, claimants can appeal protests. Appeals are decided by an
Office of Employment and Training (OET) hearing officer and case notes are retained. Reasons
that are compelling family issues causing quits or discharges might be recorded in the case notes.
Together with the OET we undertook examination of case notes from 500 appeals after
quits or discharges were protested by employers. The sample size of 500 balanced the
considerations of time availability and statistical adequacy. This is only one of several UI
modernization questions investigated, and 500 is the mean sample size chosen by the U.S.
Department of Labor program of random audits for Benefits Accuracy Measurement (BAM).
The range of BAM state samples is 400 to 600, varying directly with the state population.
17 O’Leary (2009c) also reports evidence from administrative appeals data, permanent change of station
figures for Kentucky military bases, and job loss among cases documented by the Kentucky Domestic Violence Association.

22
Sample selection process The Kentucky OET provided the Upjohn Institute with a list of 51,176 UI claims having
a date of quit or discharge determination between August 1, 2008, and July 31, 2009. This
complete list suggests that about 18.1 percent of all claims for regular UI benefits are appealed
by claimants. The list of appeals includes 4,504 interstate claims and 46,672 Kentucky UI claims
(Table 7).
To analyze the impact of compelling family reasons, interstate claims are particularly
important because of the higher-than-average expected rates of trailing spouses who might
experience reemployment problems. To structure the sampling frame for selection, we removed
interstate claims by regular commuters to Kentucky from across state lines. These areas include
places like the Cincinnati, Ohio metro area north of Covington; and southern Indiana counties
north of Louisville.18 This process resulted in 1,546 interstate appeals, or 34.3 percent of the
original interstate appeals sample. Of the 46,672 claims from Kentucky residents on the list of
appeals, 44,677 were associated with a quit or discharge stop reason.19
The combined interstate (1,546) and Kentucky (44,677) claims provided a pool of 46,223
from which to draw a sample of 500 for reviewing appeals case notes. Given the interstate and
Kentucky composition of the pool, a random sample of 500 would result in a sample that
included 17 interstate claims and 483 Kentucky claims. Since trailing spouses are expected to be
a relatively larger share of interstate claims than of Kentucky claims, we decided on a stratified
random sampling plan with oversampling from the interstate list. The OET had already reviewed
18 From the interstate claims in each of the neighboring states—Ohio, Indiana, Illinois, Tennessee, Virginia,
and West Virginia—the number of claims by county was calculated and then sorted in descending order (highest-to-lowest frequency). Within each state, claims associated with the top 25 percent of counties were excluded as being areas from which regular commuting to Kentucky is possible. Any ties between two or more counties at the cutoff point were broken randomly.
19 Excluding duplicate SSNs left 46,267 appeals. Two of these appeals were not in the applications data. Of the 46,265 claims remaining, 46,218 (99.9 percent) were associated with a Kentucky county and not an out-of-state FIPS code. Finally, 1,541 were excluded for not having a quit or discharge listed as the job separation reason.

23
notes on about 52 appeals. Of these, 45 were found in the list provided. The 45 included 11
interstate and 34 Kentucky claims. To minimize the burden of reviewing case notes, we accepted
the results of the 45 previously reviewed cases and focused on selecting a supplementary sample
to yield 500 cases in total.
The remaining sample to be chosen was 455. Since there are three categories of
compelling family issues (domestic violence, trailing spouse, and family member illness), with
the expectation of capturing at least half of the trailing spouse observations from the interstate
population, we decided that 75 cases should come from the interstate claims and 425 from the
Kentucky claims. There would be a little over 150 observations for each of the three issues, with
the interstate population oversampled since it was expected to yield more trailing spouse cases.
The random draw for the supplementary sample yielded 64 interstate claims and 391
claims from Kentucky residents. The 11 interstate claims already extracted by Kentucky would
bring the total to the desired number of 75, and the 34 Kentucky claims combined with 391
randomly drawn yielded a sample of 425.
Summary of case notes on appeals Kentucky provided the Upjohn Institute with 500 sets of case notes. Of these, 45 were
selected by a nonrandom procedure to be appeals resulting in denied claims. To focus on
decisions about family issues, Upjohn excluded these 45 cases in subsequent analysis. The
random sample of 455 appeals case notes delivered to Upjohn included 159 (35 percent) appeals
granted UI benefit payments. The appeals sample of 455 was composed of 30 percent voluntary
quits and 70 percent employer discharges. Within this sample, 3 percent of quits and 32 percent
of discharges were granted UI benefit payments.

24
Results of reviewing the 455 sets of case notes delivered to Upjohn are summarized in
Table 8 in terms of percentages. Among the 455 cases, a total of 20 (4.4 percent of 455) involved
compelling family issues. Of these, 5 (1.1 percent) were allowed benefits and 15 (3.3 percent)
were denied UI benefits under current Kentucky UI laws and regulations.
Of the three categories of compelling family issues that were approved for benefit
payments: 1) trailing spouses had 7 appeals, all following job quits and interstate claims; 1 was
approved for benefit payments and 6 denied; 2) illness of a family member caused 11 appeals;
among 7 quits, 3 were interstate claims and 4 were Kentucky residents; among 4 discharges, all
were Kentucky residents; and among the 11 appeals, 3 were approved for benefit payments (all 3
followed discharges of Kentucky residents) and 8 were denied; 3) domestic violence led to 2
appeals; 1 was an interstate claim following a quit and 1 was a Kentucky claim following an
employer discharge; the 1 Kentucky discharge was approved for benefit payments, and the other
was denied.
Considering the overall results as percentages of the sample of 455, we see that trailing
spouses made up 1.5 percent of the sample, with denials for this reason equal to 1.3 percent.
Family illness reasons constituted 2.4 percent of the sample, with denials for this reason equal to
1.8 percent of the sample. Domestic violence was noted as an issue in two cases, or 0.4 percent
of the sample; one case was allowed benefits (an interstate claim after a job quit) and the other
case was denied benefits (a Kentucky claim following employer discharge). Cumulatively family
reasons accounted for 4.4 percent of the sample, and denials of these cases amounted to 3.3
percent of the sample (15 out of 455).

25
Summary of Compelling Family Reasons
Based on a random sample of claimant appeals of employer protests, the estimated
percentage of all UI eligibility appeals denied benefits for compelling family reasons is about 3.3
percent. Over the period from August 2008 through July 2009, approximately 18.1 percent of
regular UI applications reached the appeals process.20
To date, 32 states have applied for and received their full UI modernization grants under
ARRA.
Therefore we estimate that 0.6 percent of
all UI benefit applications were denied payments for compelling family reasons. Assuming these
applicants would qualify for mean UI weekly benefit amounts and durations, we estimate that the
impact on benefit payment cost of this program change would be 0.6 percent of regular UI
benefits. The estimated cost of permitting job separations for compelling family reasons is about
half the cost of implementing an alternate base period (ABP).
21
In terms of social insurance, the workings of UI have elements of both private insurance
and social welfare. Unemployment insurance is an earned entitlement, paid to active labor force
members during periods of involuntary unemployment. Benefits are paid, up to a level deemed
socially adequate, in direct proportion to prior earnings. Measures like the ABP, for example,
operate to broaden eligibility to claimants with adequate, but more recent, strong labor force
Of the 32 states, a total of 18 have chosen to permit UI eligibility if job separations are
caused by compelling family reasons. These states are Alaska, Arkansas, Colorado, Connecticut,
Delaware, Hawaii, Illinois, Minnesota, Nevada, New Hampshire, New York, North Carolina,
Oklahoma, Oregon, Rhode Island, South Carolina, the Virgin Islands, and Wisconsin. Among
these states, 17 changed their statutes, and one changed existing administrative procedures.
20 Applications for benefits in the four calendar quarters from July 1, 2008, through June 30, 2009, totaled
283,217. From August 2008 through July 2009 there were 51,176 UI appeals in Kentucky, for an appeals rate of about 18.1 percent.
21 Another 13 States have received only the first one-third UI modernization payment for having an ABP conforming to guidelines given in ARRA.

26
attachment as demonstrated by earnings. However, measures like the compelling family reasons
provision, while socially important, link benefit payments to events outside the employment
relationship.
Expanding UI program features to include compelling family reasons could be adopted if
there is a social consensus, but the financing might properly be handled differently from regular
UI benefits. Whereas regular UI benefits are financed through an experience-rated tax on
employers, expansion of UI to include compelling family reasons should instead be financed
through socialized taxes imposed uniformly across all employers, or all citizens, in the state.
While the choice about layoffs is somewhat under an employer’s control, the circumstances of
employees outside the employer-employee relationship are not. Tax mechanisms for
nonchargeable benefits are common in state UI tax systems to pay the cost of benefit charges, at
maximum tax rates, against bankrupt employers and surviving negative-balance employers, both
of whom are ineffectively charged for benefit payments. Such a mechanism, if adopted, could be
used to pay the cost of compelling family reasons.
TRAINING ALLOWANCE FOR UI EXHAUSTEES
The provision for continued UI receipt during participation in job training for up 26
weeks after exhausting entitlement to regular UI essentially grants work search waivers for
participants in something like “commissioner-approved training,” which is currently available
under all state plans during the initial period of regular UI benefit entitlement. This section
summarizes the complete analysis of UI for exhaustees while in job training that was done for
Kentucky and presented in O’Leary (2010). This section presents estimates of the ARRA
modernization requirement, which adds up to 26 additional weeks of UI benefits, paid at the

27
claimants’ usual beneficiary rate, while exhaustees participate in commissioner-approved
training.
Training for All UI Exhaustees
The Kentucky sample of all applications for regular UI benefits with effective dates of
claim from January 1, 2006, through December 31, 2008, excluding back-to-back claims,
included a total of 581,081. Among these there were 100,169 exhaustees of regular UI benefits.
The number of UI exhaustees constituted 17.2 percent of all applicants. These exhaustees
received an average of $7,735 each in regular UI benefits, for a total of $775 million in the
sample over three years (O’Leary 2010, Table 1). If all exhaustees received UI for an additional
26 weeks while engaged in job training, the average annual UI benefit payment costs could be
around $225 million. This is an extreme estimate of benefit payments to exhaustees. It is worth
noting that the actual entitled duration of regular UI for many exhaustees is less than 26 weeks,
so this cost estimate could be higher. We estimated benefit payments under a variety of other
assumptions.
Employment after UI Exhaustion
A first refinement in our estimates restricts analysis to a sample on which we can check
return to work after benefit exhaustion. Presumably some UI exhaustees would return to work
even if training stipends become available during an extra 26 weeks. We define return to work as
the presence of earnings in the UI wage records in the calendar quarter immediately after
exhaustion of UI benefits.22
22 This is the common measure for reemployment used in U.S. Department of Labor performance-
monitoring systems.
The exhaustion date is based on the full-time-equivalent weeks of UI
duration. For most exhaustees the date is 26 weeks after the effective date of claim (EDC).

28
Assuming that the availability of extended UI during training does not change the
behavior of exhaustees regarding return to work, the UI exhaustees who return to work would
neither participate in training after UI exhaustion nor draw additional UI during training. Among
all monetarily eligible UI applicants, 73.9 percent return to employment as defined by the
presence of earnings in the wage records in the quarter after the UI benefit year begin (BYB)
date, and the rate of return to employment by UI beneficiaries is slightly higher at 75.7 percent.
However, among UI benefit exhaustees, only 40.4 percent return to work within one quarter after
exhaustion (O’Leary 2010, Table 3).
Over the 10 calendar quarters of our sample inflow from 2006Q1 through 2008Q2, the
59.6 percent of UI exhaustees who did not return to work in the quarter after UI benefit
exhaustion received $307.7 million in UI benefits. That amount is 59.5 percent of UI payments
to exhaustees and 26.2 percent of total UI payments over the 10-quarter period. However, this
estimate is probably still too high (O’Leary 2010, Table 3).
Data for Analysis of Training and Reemployment Services
Analysis of participation in job training and reemployment services is based on the
Employ Kentucky Operating System (EKOS) data merged with UI claims records. Service
participation was counted from one year prior to the effective date of claim (EDC) for UI
benefits through the benefit year ending (BYE) date. The EKOS data classifies participants in
programs for the Workforce Investment Act (WIA), Trade Adjustment Assistance (TAA), or
Wagner-Peyser employment services.23
23 EKOS registrations are coded as WIA = 1, Trade Act = 2, and Labor Exchange = 11. Not used in the
present analysis is a code for “Stimulus Summer Youth = 13.”
Counts for a variety of training referral and participation
types were combined to yield unique counts whereby each exhaustee was counted at most once.
Also associated with the training variables are the start and end dates of the activity. These dates

29
were used to determine participation between the start and end dates of UI benefit years and to
define the duration of training.
Table 9 presents unique counts of training, intensive, and core service participation,
restricted to at most one of each type for each exhaustee. This provides the most restricted basis
for estimating the cost of UI as training stipends for up to 26 weeks after exhaustion of regular
UI benefits. Because service counts are spotty in the data for 2008, we rely on the 2006 training
participation rate of 5.5 percent to represent nonrecession or normal years and the 2007 rate of
4.1 percent of exhaustees to represent recession rates. These rates translate into UI payment cost
increases of 2.2 percent and 2.1 percent in normal and recession times, respectively.
Duration of Training by Reemployment Status
UI payment costs during training would be lower if the average duration of training was
shorter than 26 weeks. Among WIA registrants who get reemployed, 12.6 percent are in training,
with an average duration of 35.4 weeks. Among WIA registrants who do not get reemployed,
16.3 percent are in training, with an average duration of 54.7 weeks. For both those who get
reemployed and those who do not, the mean training duration far exceeds the 26-week duration
of additional benefits under UI modernization. The mean durations are far longer than 26 weeks
for participants in 2006, and above 26 weeks in 2007 (O’Leary 2010, Table 7).
Training duration means are also significantly longer than 26 weeks for participants
referred through Trade Adjustment Assistance and Wagner-Peyser employment services. For
conservative cost estimates we assume that all training participants receiving extended training
UI benefits receive the full 26 weeks after exhaustion of their regular entitlement.
30
Alternative Sources of Funding Direct Training Costs
In Training and Employment Guidance Letter 2-09, USDOL Assistant Secretary for
Employment and Training Jane Oates encourages states to broaden the rules for granting
commissioner-approved training to UI beneficiaries (Oates 2009). She says that such actions
should include the following eight changes: 1) liberalized approval during periods of high
unemployment, 2) any WIA-funded training, 3) participation in remedial education when
necessary, 4) participation in formal postsecondary education for occupations requiring
postsecondary certificates or degrees, 5) relaxed time limits for completing training, 6)
permitting participation in part-time training for UI beneficiaries working a reduced work week
or for such training occurring during regular working hours, 7) permitting distance training in
cases where required on-line participation may conflict with an occupation’s regular working
hours, and 8) relaxing disqualification provisions for temporary lapses while in training between
class sessions, or for leaving a temporary job between such periods.
Oates (2009) also writes that states should streamline the training approval procedures by
doing such things as delegating training approval to staff at Workforce Investment Act (WIA)
one-stop career centers and allowing application assistance by UI staff who work for the UI
agency issuing a determination. Furthermore, beneficiaries need not file continuing claims for UI
during the period of participation in an approved training course of study. Additionally, Oates
(2009) suggests that while agencies have procedures for developing lists of approved training
providers located in their own states, for long-distance learning institutions agencies may rely on
lists developed by the following three resources: 1) the U.S. Department of Education’s National
Center for Education Statistics’ College Navigator, 2) the Department of Veterans Affairs’s Web
site list of approved institutions (including correspondence schools), and 3) the Council for
Higher Education Accreditation’s database of institutions and programs accredited by recognized

31
U.S. accrediting organizations. Finally, Oates (2009) says that UI benefits paid during approved
training are not required to be charged back to prior employers as a condition of receiving the
additional credit against the federal unemployment tax under Section 3303(a)(1) of the Federal
Unemployment Tax Act. Instead, such amounts may be distributed among all employers.
Summary of Cost Estimates for Training Allowance to UI Exhaustees
Estimates of the cost for providing 26 weeks of UI to exhaustees in training depend on
rates of training participation and the duration of training. Data from Kentucky suggest that
exhaustees who enter training stay in job training on average much longer than 26 weeks.
Therefore the key to estimating UI benefit payment costs is entry to training. Following is a
review of the possibilities as summarized in Table 10.
All Exhaustees Participate in Training. For the nonrecession year of 2006, regular UI
payments to exhaustees constituted 40.8 percent of all regular UI payments. In the recession year
of 2008, UI benefits paid to exhaustees were 52.4 percent of the total. These first approximations
suggest that one-third of the UI modernization money available to Kentucky, or about $30.1
million, would pay for only 2.1 months of training benefits in normal times or about 0.8 months
in recession times.
Some Exhaustees Return to Work. During the six months when they might be drawing
UI as a training stipend, the estimated rate of return to employment among exhaustees is 45.7
percent in normal years and 28.5 in recession years. Assuming training benefits at the level of
exhaustee benefits, total UI payments would be 22.2 percent of benefits in normal labor markets
and 37.5 percent of benefits in recession labor markets. These estimates imply the UI
modernization grant for training stipends would pay for 3.8 months in normal times and 1.1
months in recession times.

32
Current Rates of Training. Based on unique counts of training participants, about 5.5
percent of exhaustees participate in training during nonrecession years, and 4.1 percent
participate in recession periods. Assuming these training participants draw a proportionate share
of total UI exhaustee benefits they would receive 2.2 percent in non-recession years and 2.1
percent in recession years, which means the one-third UI modernization grant for exhaustee
training would provide about 37.4 months of benefits in normal labor markets and about 19.7
months of benefits in recession labor markets.
ARRA Rates of Training. Funding from ARRA increased money for training by 123
percent over planned levels for 2009 (O’Leary 2010). Assuming a proportionate increase in
training participation, the rate would rise to 9.1 percent of UI exhaustees in a recession. A
proportionate increase in UI benefits for exhaustee training participants would yield a total cost
at 4.8 percent of total UI benefits. Given this level of training participation by UI exhaustees, the
one-third UI modernization grant would pay for 8.9 months of benefits. In a nonrecession year,
these funding levels for training suggest that 12.2 percent of exhaustees could participate in
training, and the additional 26 weeks of UI benefits would amount to 5.0 percent of total benefit
costs. The one-third modernization grant to Kentucky would pay for 16.8 months of benefits at
this rate.
Training at Rates of ARRA Plus Added Sources. Program letters from U.S. DOL
Assistant Secretary Jane Oates (2009) and Deputy Assistant Secretary Douglas Small (2009)
encourage states to broaden the granting of UI work search waivers for training participants
regardless of the source of funding to pay the direct costs of training. Training could be paid for
with funds from ARRA, WIA, the Veterans Administration, Pell grants, student loan programs,
or even personal and family assets. Furthermore, the list of what qualifies as approved training is

33
broadened when demand in labor markets is low. Assuming that such initiatives increased
training opportunities by double the amount added under ARRA, the training participation rate in
nonrecession years would rise to 19.0 percent of UI exhaustees, and, assuming a proportionate
increase, UI benefit payments to exhaustee training participants would add 7.7 percent to total UI
benefit payments. Given this level of training participation by UI exhaustees, the one-third UI
modernization grant would pay for 10.9 months of benefits. In a recession year these funding
levels for training suggest that 14.1 percent of exhaustees would participate in training, with the
additional 26 weeks of UI benefits amounting to 7.4 percent of total benefit costs. The one-third
modernization grant to Kentucky would pay for 5.7 months of benefits at this rate.
Choices about Job Training Policy. The cost of retraining has two dimensions for
jobless workers: 1) the direct costs of paying for instruction and 2) the indirect costs of
maintaining subsistence for self and family during participation in retraining. A skilled
workforce is the foundation for economic recovery, growth, and prosperity. Extended UI benefits
during training for exhaustees of regular benefits could be a wise investment for citizens and
employers, but among the UI modernization options in ARRA it is not the least expensive. In
fact, depending on the ancillary supports available to defray the direct costs of training, it has the
potential to raise UI benefit payments more than any of the other policy improvements suggested
by the UI modernization provisions in ARRA. The final cost of benefit payments would depend
to a large degree on state policy for approval of training while on extended benefits. Expansion
of commissioner-approved training before UI exhaustion could be a more cost-effective policy
for promoting skill development and return to work.

34
DEPENDENTS ALLOWANCE
One of the options for UI modernization offered to states in the ARRA is adding a
dependents allowance. This section presents the implications for Kentucky of adopting a UI
dependents allowance in conformity with the requirements set forth in the ARRA UI
modernization guidelines. This section is based on analysis presented in O’Leary (2009b). In
deciding whether to adopt a dependents allowance in conformity with ARRA, a state must
choose a clear definition for dependents of UI claimants. The ARRA provides significant latitude
for the state to define who is a dependent. The primary group is unmarried children. Other family
members not working or unable to work may also be counted as dependents. The key variable in
the definition affecting UI benefit payment costs regards whether or not the spouse of a
beneficiary is a dependent. This paper presents cost simulation results under three alternative
assumptions: 1) all spouses are dependents, 2) no spouses are dependents, and 3) working
spouses are not dependents. The cost estimates presented in this section were computed under
the assumption of a dependents allowance meeting the minimal requirements provided in ARRA.
That is, an addition to the weekly benefit amount (WBA) of $15 per dependent up to a maximum
of $50 per beneficiary family.
Definition of Dependents
The ARRA specifies that dependents be identified “as defined in State law” (PL 111-5,
2003, (3)(D)). In UI Program Letter 14-09, the U.S. Department of Labor (Small 2009) reiterates
this primacy of state law. However, there is some latitude for states in setting this definition.
Among states with dependents allowances, the main category of dependents is unmarried
children up to a certain age, with a higher age limit for children who remain in school beyond

35
age 18.24 All states include adopted children, all but Massachusetts include stepchildren, and all
but New Mexico include older children physically or mentally unable to work. Nonworking
spouses are included in Michigan, New Jersey, Pennsylvania, and Connecticut and with limits on
the spouse’s earnings or own UI eligibility in Illinois, Iowa, Maine, and Ohio. Iowa includes
nonworking parents, and brothers and sisters who are dependents.25
Research Strategy
To estimate UI benefit payments, reliable counts of beneficiary dependents are needed.
No consistent information on household composition of claimants is maintained in Kentucky UI
or related administrative records. Our research strategy relies on combining claimant data from
Kentucky UI administrative records with results from analysis of microdata on federal income
tax returns filed by Kentucky residents. Dr. Michael Jones, senior economist in the Office of the
Governor, Commonwealth of Kentucky, provided estimates of the distribution of the number of
personal exemptions claimed by Kentucky residents on their 2005 tax returns for persons who
reported receiving UI compensation on line 19 of IRS tax form 1040. The distribution of
exemptions for each of the three filing statuses—1)single, 2) married filing separately, and 3)
married filing jointly—are relevant. Very few married filers had only one exemption, while more
than 60 percent of single filers only claim one exemption on their tax returns. Combining all tax
returns reporting UI income shows a total of 398,339 Kentucky tax filers with UI income in 2005
(Table 11).
To facilitate estimation of UI dependent payments, the Kentucky Department of Revenue
compiled 13 groups of 2005 federal tax filers reporting UI income defined by adjusted gross
24 Children in school remain dependents until age 21 in Connecticut and 24 in Massachusetts. 25 Michigan includes as dependents nonworking parents, and brothers and sisters under age 18 who are
orphaned or whose living parents are dependents.

36
income (AGI) levels. The groups are set in $5,000 increments, with the first being zero to
$5,000, the second $5,000 to $10,000, and so forth. The final group includes all those with AGIs
of $60,000 or more. Each of these income ranges includes at least 14,000 tax filers, the largest
group is the $60,000-and-over AGI group, which has more than 84,000 tax filers. The range of
income variation in this distribution provides for rich simulations since all earners of more than
$60,000 in their base year would qualify for the maximum WBA for UI in Kentucky. By
applying these exemption distributions to similarly defined income groups using the base-period
earnings of UI beneficiaries, we estimate the cost of dependents allowances.
We know the tax filing status (single, married filing separately, and married filing jointly)
of UI beneficiaries in Kentucky during 2005. Using this and the options available to the state for
defining a dependent in state UI law, we compute the number of UI dependents in one of three
different ways. From the number of tax exemptions we deduct the following:
1) one for the UI claimant;
2) one for the UI claimant if single, two for the beneficiary and spouse if married; and
3) one for the beneficiary if single, two for the 60 percent of married beneficiaries who
have working spouses, and one for the 40 percent of beneficiaries who have nonworking
spouses. The assumption that 60 percent of married beneficiaries have working spouses is based
on patterns of employment among married couples over the past 40 years (BLS 2008b).26
Number of Dependents and Weekly Dependents Allowances
Three sets of simulations were performed, one for each of the alternative rules for
inferring dependents from exemptions. The first rule is the most inclusive, treating the spouse
26 An alternate strategy for estimating the number of dependents for UI beneficiaries based on household
composition data in the American Community Survey has been described to me by Wayne Vroman, who is working on a UI modernization report for the Ohio Department of Jobs and Family Services.

37
and all tax exemptions, except for the claimant, as dependents for UI purposes. The second is the
least inclusive, removing all spouses from the potential pool of dependents. The third yields an
estimate in between the first two and is the approach most similar to the rules adopted in other
states that currently pay UI dependents allowances.
Under the first rule—that spouses are dependents—Table 11 presents estimates of the
mean number of dependents for each income category, along with an estimated mean dependents
allowance for each beneficiary in these groups. Estimates of the mean dependents allowance are
computed in two ways. The methodology for computing the mean number of dependents and the
dependents allowance for each income group is presented in Table 12 for the lowest income
category ($0 to $5,000), under the assumption that all spouses are considered dependents. The
mean number of exemptions for those with income in this range is simply the weighted sum of
exemptions and claimants divided by the total number of claimants in the income group. The
estimated number of dependents is the previous result minus one.
The mean beneficiary cost for claimants in the income group is the product of the
frequency at each level of exemptions times the number of exemptions minus one times the
dependents allowance for that number of exemptions—that is, $15 for each of the first three
dependents and a total of $50 for four or more dependents. For the lowest income group ($0 to
$5,000), the bottom two rows of Table 12 show the difference in estimated mean dependents
allowance, depending on whether the mean number of dependents (2.46 – 1) is multiplied by the
per-dependent allowance (1.46 * $15 = $21.88) or by the weighted mean of the frequency and
dependents allowance at each number of exemptions ($19.49). The latter method more
effectively accounts for the dependents allowance cap at $50 by taking into account the
frequency distribution of exemptions among claimants in the income category.

38
The mean number of dependents is rather high for the lowest income category (1.46)
because of single headed households. The mean number of dependents is lower for the next-
highest income category (1.10) then steadily rises with income reaching an average of 2.03 for
the group claimants who had an average income of more than $60,000 in 2005. Moving in step
with this, the mean dependents allowance payment for the lowest income group is $19.49, falls
to $15.41 for the next higher income group, then rises to $29.01 for the highest of the 13 income
groups.
This process is repeated under the second rule (where the practice is that spouses are not
considered dependents), a rule adopted in some states having UI dependent allowances.27
Impacts on UI Benefit Payment Costs
Results
of those simulations indicate that the mean number of dependents is 1.31 and that the mean
dependents allowance paid would be $18.78. Under the third rule—that employed spouses are
not counted as dependents—the estimated mean number of dependents is 1.38 and the mean
dependents allowance is $19.78.
To estimate the cost impact of a dependents allowance on total UI benefit payments, we
combine results from the above analysis with UI administrative payment data. The above
analysis provides estimates of the mean number of dependents and the cost of the benefit
allowances for each income group. Under the assumption that UI base period earnings are
equivalent to the adjusted gross income reported on tax returns, we create the same 13 income
groups for beneficiaries in our Kentucky data for new UI claims from January 1, 2006, to June
30, 2009. These data include earnings for 541,084 UI beneficiaries. This number is arrayed into
the 13 base-period earnings groups as shown in Table 13. From this microdata we compute the
27 These states are Arkansas, Maryland, Massachusetts, New Mexico, and Rhode Island.

39
mean of the actual WBA across all beneficiaries in each income group. The overall mean WBA
is $315.
Also reported in Table 13 is the total UI compensation paid to claimants in each of the 13
income groups. The total across all groups over the 3.5-year period is just over $2.0 billion. The
average duration of UI benefit payments for each income group is also reported in Table 13. The
mean over the whole sample is 12.06 weeks. These figures reported on beneficiaries, WBA, total
UI, and duration of benefits are repeated for the other dependents categories. The three
assumptions regarding spouses dependency status are as follows: 1) spouses are dependents
(Table 13), 2) spouses are not dependents, and 3) working spouses are not dependents.28
The estimated cost of dependents is computed as the sum of the average duration of
benefits for each income group multiplied by the dependents allowance for that income group
times the number of beneficiaries in the group, summed across all income groups. Under the
assumption that spouses are dependents, the result in Table 13 for the lowest income group is the
product of 11.47 weeks times a weekly dependents allowance of $19.49 (Table 11) times the
number of beneficiaries in that group yielding $1,765,187. Summing these results across all
income groups, we get a total of $126.1 million, which amounts to a 6.3 percent increase in UI
benefit costs for claims over the 3.5-year period from January 1, 2006, to June 30, 2009 (Table
13). Assuming that spouses are not dependents results in a percentage cost increase of 5.5
percent, while assuming that working spouses are not dependents results in a cost increase of 5.8
percent (Table 14).
28 See O’Leary (2009b) for the second and third sets of results.

40
Summary of Dependents Allowances
Before ARRA was enacted, 13 states already provided dependents allowances to UI
beneficiaries.29
Based on analysis of three-and-one-half years of Kentucky UI claims data for the period
January 1, 2006, to June 30, 2009, we estimate that total benefit payments will increase by 6.3
percent if all spouses are dependents, by 5.5 percent if spouses are not dependents, and by 5.8
percent if working spouses are not dependents. To further refine understanding of the last set of
results, we computed separate estimates for each of the three full calendar years in the available
data. Both 2006 and 2007 may be regarded as times of normal labor markets, while 2008
included the beginning of the current “Great Recession.” The percentage increases for paying
dependents allowances would have increased UI benefit costs by 6.1 percent in 2006, by 5.8
percent in 2007, and by 5.7 percent in 2008. Dependents allowance costs as a percentage of total
benefit payments declined over these three years because the average duration of benefit receipt
increased each year along with the average total UI compensation received by all beneficiaries in
the state.
Of the 32 states that have applied for and received their full UI modernization
grants under ARRA, only seven successful grant applications cited dependents allowances in
conformity with ARRA. These seven states are Alaska, Connecticut, Illinois, Massachusetts,
New Jersey, Rhode Island, and Tennessee. Of these, Illinois, Rhode Island, and Tennessee did
not have a UI dependents allowance before ARRA.
Based on the 5.8 percent cost estimate for the dependents allowances that exclude their
working spouses, we estimate that the $30.1 million ARRA grant to Kentucky would be spent in
about one year of normal labor markets, or in eight months during times of recession labor
29 Before the enactment of ARRA, UI dependents allowances were paid by Alaska, Connecticut, Illinois,
Iowa, Maine, Maryland, Massachusetts, Michigan, New Jersey, New Mexico, Ohio, Pennsylvania, and Rhode Island.

41
markets. As an option for UI modernization, the dependents allowance is approximately five
times more costly than implementing an alternate base period (ABP).
In terms of social insurance principles, the ABP is also more appealing than the
dependents allowance. As social insurance, the workings of UI has elements of both private
insurance and social welfare. Unemployment insurance is an earned entitlement, paid to active
labor force members during periods of involuntary unemployment. Benefits are paid, up to a
level deemed socially adequate, in direct proportion to prior earnings. The ABP operates to
broaden eligibility to claimants with adequate, but more recent, strong labor force attachment as
demonstrated by earnings. The dependents allowance ties benefits to personal decisions made
outside the employment relationship.
With a dependents allowance, two claimants with identical employment and earnings
histories could be paid differing weekly UI amounts because of differences in the number of
dependents. Such a program feature could be adopted if there is a social consensus, but the
financing of dependents allowances might properly be handled differently than regular UI
benefits. Whereas regular UI benefits are financed through an experience-rated tax on employers,
dependents allowance payments should instead be financed through socialized taxes imposed
uniformly across all employers in the state. While the choice about layoffs is somewhat under an
employer’s control, the number of a claimant’s dependents is not. Tax mechanisms for
nonchargeable benefits are common in state UI tax systems to pay the cost of benefit charges, at
maximum tax rates, against bankrupt employers and surviving negative-balance employerswho
are ineffectively charged for benefit payments. Such a mechanism could be used to pay the cost
of dependents allowances if they are adopted.

42
SUMMARY AND COMMENTS
The American Recovery and Reinvestment Act (ARRA) of 2009 provided financial
incentives for UI modernization. The incentives are state shares of the $7 billion available
nationwide. Shares are determined by the state share of UI taxable wages paid nationwide.
States were offered one-third of their allocation for having an alternate base period (ABP) for
monetary determination of UI eligibility that includes the most recently completed calendar
quarter. States were offered the remaining two-thirds for having two out of the following four
additional program features: 1) UI eligibility while seeking only part-time work, 2) UI eligibility
after job separations due to harassment or compelling family reasons, 3) continuation of UI
benefits for at least 26 additional weeks after exhaustion of regular benefits while in approved
training, and 4) dependents allowances of at least $15 per dependent up to $50.
This paper presents estimates of the UI benefit payment costs for these five program
enhancements based on program administrative data for the Commonwealth of Kentucky. A
summary of the cost estimates is given in Table 15, which presents them as percentages of
regular Kentucky UI benefit payments in years of normal and recession labor markets. The ABP
option B, which has been widely adopted by states, is estimated to be one of the least costly of
the five UI modernization options, with the ARRA grant covering UI payments for 5.4 years of
normal labor markets. The additional UI qualifiers under the ABP policy change have all earned
the entitlement to UI.
Also on the list of least costly is broadening coverage to those who restrict their job
search to only part-time work. It should be noted that part-time workers are often multiple job
holders for whom UI taxes are payable on the full wage base for every job. Given this, it is

43
possible that tax contributions for these workers exceed those for full-time job holders with much
higher wage and salary levels.
Compelling family reasons rank as the lowest estimated cost for likely benefit payments.
As social insurance reform, this change emphasizes social considerations over the earnings
insurance aspects of UI. Such a change could also have the effect of reducing appeals hearing
workloads, thereby reducing administrative costs while providing income replacement to those
who are without work through no fault of their own.
Providing up to 26 weeks of additional UI to exhaustees of regular benefits who are
participating in training is the feature with the most uncertainty around the cost estimate. The
indirect costs of maintaining household consumption can be the highest personal cost of
retraining, but the availability of funding for the direct costs of paying for job training is the
limiting factor on training slots. This can be a wise social investment, particularly during periods
of high unemployment, but a more cost-effective UI program reform would be early targeting of
training to those at high risk of benefit exhaustion before their regular UI entitlement is
exhausted.
The dependents allowance required under ARRA UI modernization is estimated to be the
most costly of the policy options listed. It is also the feature that stretches the social insurance
principles of UI farthest from insurance toward social welfare. It results in identical workers,
experiencing identical job loss, receiving differing compensation levels because of personal
decisions made away from the workplace. It is defensible social policy, but if adopted, the
financing should be shared evenly across all employers in the state rather than being paid solely
by the separating employer through experience rating.

44
In making a policy choice, the federal emphasis on the ABP to broaden UI benefit access
to low-wage earners should be noted. While UI modernization grants are tied to a total of five
policy choices, the ABP is the first item presented by the ARRA requiring a decision. The
emphasis on ABP in the ARRA suggests it could become a state UI conformity requirement at
some future date. That would make ABP a contingency for release of 90 percent of Federal
Unemployment Tax Act (FUTA) funding to states. Others program features among the UI
modernization options could also become compulsory conformity requirements over time. The
ARRA modernization grants are available to states for only a limited time.
To date, 39 states have received modernization payments for having an ABP, and 32
states have received the remaining two-thirds available. The numbers of states adopting each of
these additional features are as follows: 25 for seeking part-time work, 18 for family reasons, 14
for exhaustee benefits while in training, and 7 for dependents allowances. A total of $3.4 billion
of the $7.0 billion available has been disbursed to date. Some particularly large states, including
California, Florida, and Texas, have not yet received any UI modernization money from ARRA.
The deadline for disbursements is drawing near.
Applications should only be made under provisions of state laws that are currently in effect as permanent law and not subject to discontinuation. Since all incentive payments must be made before October 1, 2011, and since the Department must have adequate time to review any application, all applications must be received by the Department no later than August 22, 2011 . . . If the state law provision takes effect within 12 months of the date of the Secretary of Labor’s certification, then the provision will be considered to be in effect as of the date of the Secretary’s certification to the Secretary of Treasury . . . As a result, the latest effective date of a provision must be on or before September 21, 2012. (Small 2009, pp. 2–3)
Estimates of the UI benefit payment costs for these features, based on Kentucky data,
suggest a pattern of states choosing UI modernization features to minimize the expected benefit
payment costs. However, for states broadening UI eligibility through modernization, UI benefit

45
payment costs will be higher for any given level of unemployment. The UI modernization grants
provided by ARRA are one-time, finite amounts. Liberalized eligibility rules must be balanced
by structural financing enhancements to ensure long-term fiscal stability of the system.
POSTSCRIPT
In Kentucky, the Governors’ Task Force on Unemployment Insurance (2010) funded this
investigation of UI modernization costs in the context of a severe structural deficit in financing
regular UI benefits. On June 15, 2009, Governor Steven Beshear signed House Bill 5 updating
Kentucky’s unemployment tax and benefits structure, thereby codifying the Task Force
recommendations. The compromise package of legislation increases the state UI taxable wage
base from $8,000 to $12,000 over a 10-year period, implements a one-waiting week wait after
eligible workers file a claim before they can begin to receive benefits, and reduces the statutory
replacement rate used to calculate a claimant’s weekly benefit amount from 68 percent to 62
percent. Cost estimates of UI modernization presented in this paper were considered by the task
force, but with the emphasis on long-term fiscal balance in the system, expansions of UI benefit
eligibility were not included in the task force recommendations.
This paper presents estimates of the additional annual regular benefit payments
associated with five different expansions of UI eligibility or generosity. The ARRA offered
financial incentives to encourage states to adopt these program features. The cost estimates
associated with each feature focus on the likely increase in regular UI benefit payments. For each
program expansion, we convert the incentive payment into the number of years of benefits that
would be covered for the associated program change in years of normal or recession labor
markets. It turns out that at least one state considered another incentive presented by the UI

46
modernization offer in the 2009 federal stimulus bill. By receiving a UI modernization incentive
payment before the end of calendar year 2010, the state of Colorado avoided having a positive
loan balance from the Federal Unemployment Account (FUA) at the start of 2011.30 If there is a
loan balance outstanding to the FUA on January 1 for two consecutive years and loans are not
paid down to zero by November 10 of the second year, then the Federal Unemployment Tax Act
(FUTA) tax rate is increased by 0.3 percentage points on federally taxable wages for that year.
The 2010 ARRA incentive payment of $127.5 million to Colorado for UI modernization
potentially saved Colorado employers as much as $45 million in added FUTA tax payments per
year, with this additional tax potentially increasing by another 0.3 percentage points each
subsequent year when loans are outstanding to the FUA on January 1.31
30 For this insight, I thank Wayne Peel, chief financial officer for the Colorado Department of Labor and
Employment, who served as a discussant for our conference session at the 2011 LERA meetings of the ASSA.
This potentially
increased the financial incentive to Colorado by one-third. Several states are facing FUA loan
balances that dwarf the ARRA incentive payment, but some states should seriously consider this
aspect of the incentive before the offer expires in September 2011.
31 Wages paid by Colorado employers in 2009 totaled $82.6 billion. Some $21.2 billion of this amount was subject to the $10,000 Colorado UI taxable wage base. Since the FUTA taxable wage base is 70 percent of the Colorado base, if we assume a proportionate share of Colorado wages are subject to the FUTA tax, then about $14.8 billion of Colorado wages would be taxed an additional 0.3 percent.

47
Table 1 Kentucky Inflow of Regular UI Claims and Simulated Monetary Eligibility Final monetary determinations Wage record data in UI file
Year and quarter of EDC
Total regular UI claims
Actual monetarily eligible Share
Simulated monetarily eligible Share
2006Q1 41,360 37,026 0.8952 37,034 0.8954 2006Q2 31,411 28,078 0.8939 28,070 0.8936 2006Q3 48,915 45,062 0.9212 45,048 0.9209 2006Q4 56,357 50,529 0.8966 50,372 0.8938
2007Q1 40,041 36,161 0.9031 35,902 0.8966 2007Q2 32,130 28,930 0.9004 28,697 0.8932 2007Q3 44,867 40,973 0.9132 40,957 0.9129 2007Q4 59,484 53,834 0.9050 53,953 0.9070
2008Q1 44,968 40,383 0.8980 40,444 0.8994 2008Q2 38,163 34,055 0.8924 34,113 0.8939 2008Q3 46,668 42,705 0.9151 42,788 0.9169 2008Q4 92,392 85,269 0.9229 85,417 0.9245
2009Q1 85,181 78,310 0.9193 78,444 0.9209 2009Q2 58,976 53,523 0.9075 53,612 0.9090
Total 720,913 654,838 0.9083 654,851 0.9084
NOTE: This sample excludes the second of back-to-back claims where the first UI claim was exhausted. The monetary eligibility rules are different for such claims. Also, 120 records were deleted for persons who applied for UI multiple times in the same calendar quarter. For such claims, the first was included in the analysis sample. SOURCE: Kentucky UI program administrative data.

48
Table 2 Summary of Changes for Options A and B of the Alternate Base Period
Monetarily
eligible UI
beneficiaries Actual UI
cost in SBP ($) Simulated UI
cost in ABP ($) Change in
cost
Monetarily eligible in SBP 654,851 534,127 1,974,830,300 Percentage of applicants 90.84 74.68 Eligible in SBP but not ABP 12,616 8,029 24,103,019 0 –24,103,019 Eligible in SBP and ABP Same WBA in ABP 251,654 222,448 975,147,577 975,147,577 0 Higher WBA in ABPa 237,030 187,187 533,218,523 619,399,367 86,180,844 Lower WBA in ABPa 153,551 120,118 442,361,154 387,791,082 –54,570,072 Total eligible in SBP and ABP 642,235 529,753 1,950,727,254 1,982,338,026 31,610,772 Paid in SBP cost to ABP ($) 7,507,753 Eligible in ABP but not SBP 24,246 16,385 35,259,767 Eligible in ABP but paid in SBPb 5,763 4,579 12,082,916 Net paid in ABP but not SBP 18,483 12,256 23,176,851 Option A 660,718 542,009 2,005,514,904 30,684,604 Percentage change from SBP 0.90 1.48 1.55 Average yearly cost ($) 8,767,030 Recession year costs ($)b 12,117,754 Normal year costs ($)b 7,426,740 Recession, ARRA grantc (years) 2.5 Normal, ARRA grantc (years) 4.0 Option B 673,334 546,383 1,998,007,151 23,176,851 Percentage change from SBP 2.82 2.29 1.17 Average yearly cost ($) 6,621,957 Recession year costs ($)b 9,152,843 Normal year costs ($)b 5,609,603 Recession, ARRA grantc (years) 3.3 Normal, ARRA grantc (years) 5.4 a The number of UI beneficiaries has been simulated. b Recession year is 2008Q3 through 2009Q2. Normal year is based on data from 2006Q1 through 2008Q2. c This is the number of years until Kentucky’s allocation of the ARRA grant is exhausted using the recession or normal year annual cost. SOURCE: Author’s computations based on Kentucky UI program administrative data.
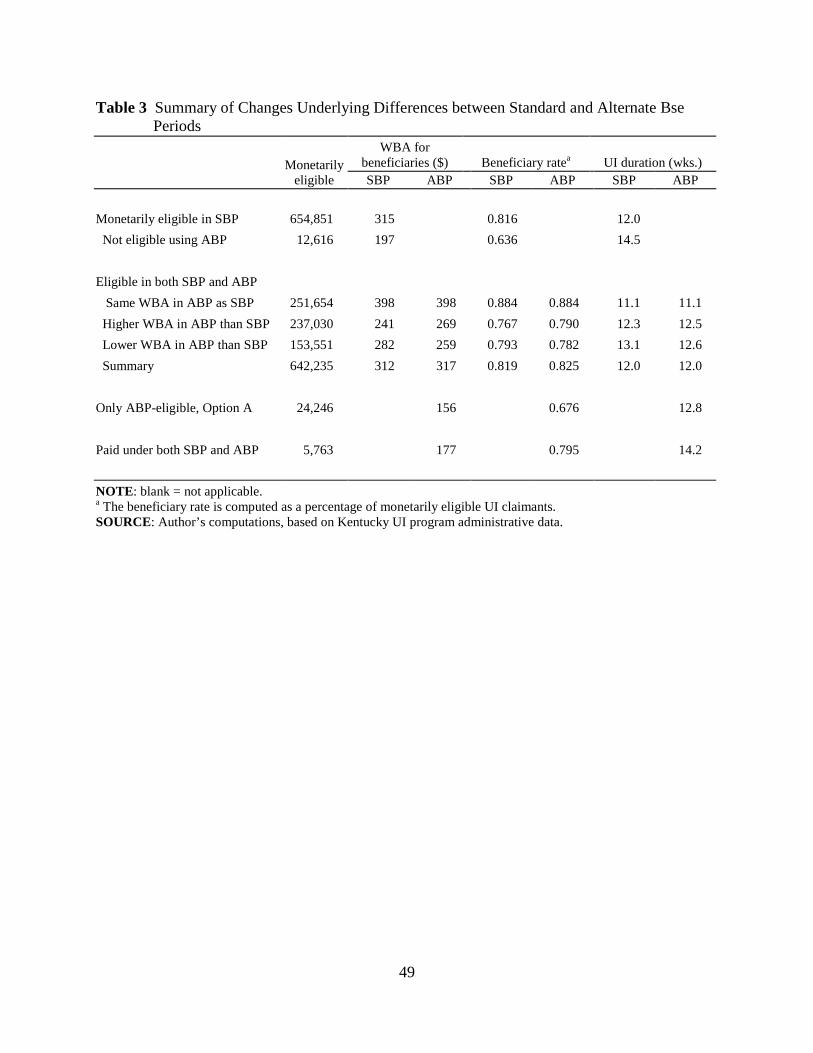
49
Table 3 Summary of Changes Underlying Differences between Standard and Alternate Bse Periods
Monetarily
eligible
WBA for beneficiaries ($) Beneficiary ratea UI duration (wks.) SBP ABP SBP ABP SBP ABP
Monetarily eligible in SBP 654,851 315 0.816 12.0 Not eligible using ABP 12,616 197 0.636 14.5 Eligible in both SBP and ABP Same WBA in ABP as SBP 251,654 398 398 0.884 0.884 11.1 11.1 Higher WBA in ABP than SBP 237,030 241 269 0.767 0.790 12.3 12.5 Lower WBA in ABP than SBP 153,551 282 259 0.793 0.782 13.1 12.6 Summary 642,235 312 317 0.819 0.825 12.0 12.0 Only ABP-eligible, Option A 24,246 156 0.676 12.8 Paid under both SBP and ABP 5,763 177 0.795 14.2 NOTE: blank = not applicable. a The beneficiary rate is computed as a percentage of monetarily eligible UI claimants. SOURCE: Author’s computations, based on Kentucky UI program administrative data.

50
Table 4 Comparison of Kentucky Estimates of Alternate Base Period Impacts on Rates of UI Monetary Eligibility and UI Benefit Payments with Previous Studies
Study Sample and ABP type simulated
Monetary eligibility
Benefit payments
Vroman (1995) 3 States (ME, VT, WA) Like ARRA Option B
5.5 to 12.5% increase 3.8 to 9.6% increase
Planmatics (1997) 5 States (MA, NJ, OH, VT, WA) Like ARRA Option A
4.2 to 5.8% point increase
Stettner, Boushey, and Wenger (2005)
National sample Survey of Income and Program Participation (SIPP) Like ARRA Option B
7.2% increase 1.1 to 5.2% of benefit payments
O’Leary (2009) Kentucky (2006Q1 to 2009Q2) ARRA Option A
0.90% increase 1.55% increase
O’Leary (2009) Kentucky (2006Q1 to 2009Q2) ARRA Option B
2.82% increase 1.17% increase

51
Table 5 Among Kentucky UI Applicants, the Estimated Number Seeking Only Part-Time Work, Their Likely UI Eligibility and UI Benefit Payment Costs by Alternate Estimation Methods
Weekly wage
method UI applicants (number) 654,635 Part-time (number) 109,689 Part-time among UI applicants (share) 0.168 Monetarily eligible 0.780 Nonmonetarily eligible 0.608 UI-eligible 0.465 Eligible but not a beneficiary 0.052 UI beneficiary 0.568 WBA for monetarily eligible ($) 184 WBA for UI beneficiaries ($) 196 WBA for eligible nonbeneficiaries ($) 135 UI duration, mean weeks 13.4 Percent of UI to part-timers 9.1 Cost of added part-timers (%)a 0.6%
a The UI benefit cost of added recipients among part-time workers who apply for UI is the number of part-time UI applicants times the proportion of those eligible but not beneficiaries, times the average WBA for eligible nonbeneficiaries, multiplied by the mean duration for part-timers who actually receive UI benefits. Dividing this result by total UI benefits paid yields the additional cost in percentage terms of paying UI to applicants who are part-time job seekers. SOURCE: Based on computations by the author, using program administrative data from Kentucky for the period 2006Q1 to 2009Q2 and results from the Quarterly Census of Employment and Wages (QCEW) for time periods matching the administrative data.

52
Table 6 Estimated Kentucky UI Benefit Payment Costs of Permitting Eligibility during Job Seeking for Part-Time-Only Work
Normal
year Recession
year Total UI benefit payments ($) 429,860,616 852,318,264 Costs for current applicants UI benefit payments (%) 0.6 0.6 UI benefit payments ($) 2,579,164 5,113,910 Costs for new applicants UI benefit payments (%) 0.6 0.6 UI Benefit Payments ($) 2,579,164 5,113,910 Total costs UI benefit payments (%) 1.2 1.2 UI benefit payments ($) 5,158,327 10,227,819
SOURCE: Based on computations by the author using program administrative data from Kentucky for the period 2006Q1 to 2009Q2 and results from surveys under U.S. Bureau of Labor Statistics programs called Occupational Employment Statistics (OES), American Time Use Survey (ATUS), National Compensation Survey (NCS), and Quarterly Census of Employment and Wages (QCEW) for time periods matching the administrative data. A normal year is assumed to be 2006Q1 to 2006Q4. A recession year is assumed to be 2008Q2 to 2009Q1.

53
Table 7 Kentucky Regular and Interstate UI Claims with Appeals of Employer Protests, August 1, 2008, to July 31, 2009, and Summary of Sample Selection for Case Notes Review
Interstate UI claims Count Share
SSNs sent to Upjohn by Kentucky 4,504 Matched to out-of-state claims by SSN 4,304 0.956 Out-of-state w/ quit/discharge employer protest 4,120 0.915 After removing likely commuters 1,546 0.343 Kentucky resident UI claims SSNs sent to Upjohn by Kentucky 46,672 Less duplicate SSNs in list 46,267 Matched resident claim for SSN (share of 46,267) 46,265 1.000 Kentucky county of residence 46,218 0.999 Claim with quit/discharge employer protest 44,677 0.966 Combined interstate and resident claims for sampling 46,223 Interstate share of combined sample 1,546 0.033 Desired sample size total 500 Interstate observations in a random sample of 500 17 0.033 Resident observations in a random sample of 500 483 0.966 Interstate claims, desired sample size (share of sample) 75 0.015 Interstate claims already selected by KY 11 Interstate claims, remainder to select 64 Kentucky claims, desired sample size (share of sample) 425 0.085 Kentucky claims already selected by KY 34 Kentucky claims, remainder to select 391 Sample already selected 45 0.090 Sample remainder to be selected 455 0.910 Sample for reviewing appeals of employer protests 500

54
Table 8 Summary of Compelling Family Reasons in Appeals of UI Denials after Quits and Discharges (Percentages of column sub-samples)
Appeals after quit Appeals after discharge Total appeals sampled
Interstate Kentucky Total Interstate Kentucky Total Interstate Kentucky Total
Subsample sizes 32 103 135 32 288 320 64 391 455 Benefits allowed (%) Trailing spouse 3.1 0.0 0.7 0.0 0.0 0.0 1.6 0.0 0.2 Family illness 0.0 0.0 0.0 0.0 1.0 0.9 0.0 0.8 0.7 Domestic violence 0.0 0.0 0.0 0.0 0.3 0.3 0.0 0.3 0.2 Total allowed UI 3.1 0.0 0.7 0.0 1.4 1.3 1.6 1.0 1.1 Benefits denied (%) Trailing spouse 18.8 0.0 4.4 0.0 0.0 0.0 9.4 0.0 1.3 Family illness 9.4 3.9 5.2 0.0 0.3 0.3 4.7 1.3 1.8 Domestic violence 3.1 0.0 0.7 0.0 0.0 0.0 1.6 0.0 0.2 Total denied UI 31.3 3.9 10.4 0.0 0.3 0.3 15.6 1.3 3.3 Total sample (%) Trailing spousea 21.9 0.0 5.2 0.0 0.0 0.0 10.9 0.0 1.5 Family illness 9.4 3.9 5.2 0.0 1.4 1.3 4.7 2.0 2.4 Domestic violence 3.1 0.0 0.7 0.0 0.3 0.3 1.6 0.3 0.4 Total sample 34.4 3.9 11.1 0.0 1.7 1.6 17.2 2.3 4.4
a We also tracked the number of persons who reported moving regardless of whether the move was due to spousal employment. For the interstate claims we sampled, there were sixteen (16) cases involving a move and zero (0) for regular Kentucky UI claims. Review of the documentation available suggest it is highly unlikely that references to a spouse’s employment would be omitted from case notes on appeals. Therefore, we only report the number we determined to “trailing spouses.” SOURCE: Author’s computations based on Kentucky UI program appeals records.
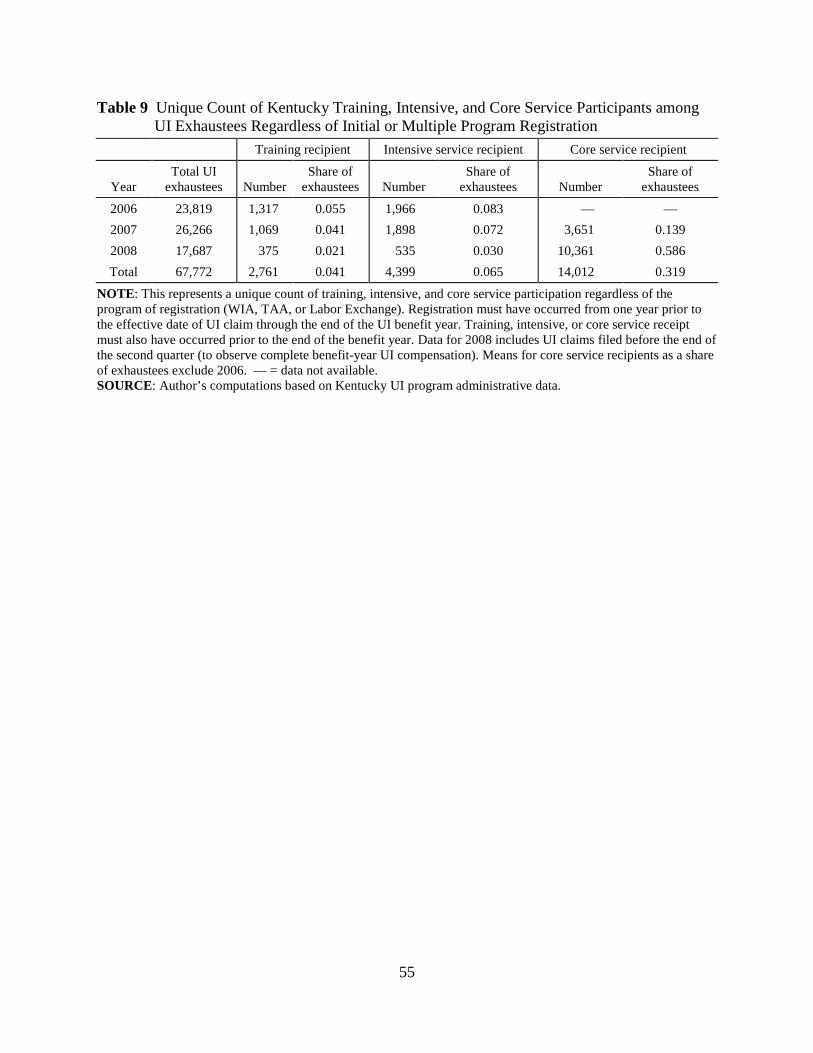
55
Table 9 Unique Count of Kentucky Training, Intensive, and Core Service Participants among UI Exhaustees Regardless of Initial or Multiple Program Registration Training recipient Intensive service recipient Core service recipient
Year Total UI
exhaustees Number Share of
exhaustees Number Share of
exhaustees Number Share of
exhaustees
2006 23,819 1,317 0.055 1,966 0.083 — — 2007 26,266 1,069 0.041 1,898 0.072 3,651 0.139 2008 17,687 375 0.021 535 0.030 10,361 0.586 Total 67,772 2,761 0.041 4,399 0.065 14,012 0.319
NOTE: This represents a unique count of training, intensive, and core service participation regardless of the program of registration (WIA, TAA, or Labor Exchange). Registration must have occurred from one year prior to the effective date of UI claim through the end of the UI benefit year. Training, intensive, or core service receipt must also have occurred prior to the end of the benefit year. Data for 2008 includes UI claims filed before the end of the second quarter (to observe complete benefit-year UI compensation). Means for core service recipients as a share of exhaustees exclude 2006. — = data not available. SOURCE: Author’s computations based on Kentucky UI program administrative data.

56
Table 10 Estimated Kentucky UI Benefit Payment Costs of Paying UI Exhaustees in Retraining Normal year Recession year
Total UI benefit payments ($) 429,860,616 852,318,264 Total UI benefits to exhaustees ($) 175,383,131 446,614,770 Exhaustee benefits as a share of total UI payments 0.408 0.524 Months in UI modernization payment 2.1 0.8
UI exhaustee costs after return to work ($) 95,233,040 319,329,561 Return-to-work rates among UI exhaustees 0.457 0.285 Exhaustee benefits share after return to work 0.222 0.375 Months in UI modernization payment 3.8 1.1
UI costs at current training rates ($) 9,646,072 18,311,206 Current training rates for UI exhaustees 0.055 0.041 Exhaustee benefits share for current training rates 0.022 0.021 Months in UI modernization payment 37.4 19.7
UI costs at ARRA training rates ($) 21,443,219 40,705,810 ARRA training rates for UI exhaustees 0.122 0.091 Exhaustee benefits share for ARRA training rates 0.05 0.048 Months in UI modernization payment 16.8 8.9
UI costs at ARRA rates plus ($) 33,240,365 63,100,414 ARRA plus training rates for UI exhaustees 0.19 0.141 Exhaustee benefits share for ARRA plus training 0.077 0.074 Months in UI modernization payment 10.9 5.7 SOURCE: Author’s computations based on Kentucky UI program administrative data.

57
Table 11 Tax Exemptions and Dependents for UI Beneficiaries by Income Group in Kentucky Assuming All Exemptions Except the Claimant are Dependents
Adjusted gross income range
(2005 tax year) Total tax returns Exemptionsa Dependentsb
Dependents allowance per
week ($)
Dependents allowance per week adjusting for
$50 cap ($)
$0–$5,000 23,481 2.46 1.46 21.88 19.49 $5,000–$10,000 30,224 2.10 1.10 16.51 15.41 $10,000–$15,000 39,227 2.15 1.15 17.19 16.23 $15,000–$20,000 39,385 2.18 1.18 17.67 16.76 $20,000–$25,000 35,293 2.19 1.19 17.85 16.95 $25,000–$30,000 30,713 2.24 1.24 18.67 17.67 $30,000–$35,000 26,111 2.35 1.35 20.25 19.24 $35,000–$40,000 22,294 2.47 1.47 22.02 20.90 $40,000–$45,000 19,740 2.58 1.58 23.64 22.50 $45,000–$50,000 17,598 2.70 1.70 25.50 24.22 $50,000–$55,000 15,813 2.77 1.77 26.56 25.39 $55,000–$60,000 14,022 2.87 1.87 28.01 26.75 $60,000+ 84,438 3.03 2.03 30.47 29.01 Total 398,339 2.49 1.49 22.36 21.15
a Spouses are included in the exemptions for “married filing jointly.” b Dependents are computed as exemptions minus one for the claimant.

58
Table 12 Exemptions across All Filing Statuses by Federal AGI Group $0 to $5,000
Exemptions Frequency
number Frequency percentage
Dependents cost for beneficiaries ($)
Single 1 2 3 4 5 6 7
8,045 1,874 3,047
359 63 9 1
60.0 14.0 22.7
2.7 0.5 0.1 0.0
0.00 15.00 30.00 45.00 50.00 50.00 50.00
Married—filing separately 1 2 3 4 5 6 7 8
0 1,037
364 767 163 379
29 6
0.0 37.8 13.3 27.9
5.9 13.8
1.1 0.2
0.00 15.00 30.00 45.00 50.00 50.00 50.00 50.00
Married—filing jointly 1 2 3 4 5 6 7 8 9
10
215 2,989
730 1,699
186 1,392
88 27 8 4
2.9 40.7
9.9 23.2
2.5 19.0
1.2 0.4 0.1 0.1
0.00 15.00 30.00 45.00 50.00 50.00 50.00 50.00 50.00 50.00
Combined filing statuses 1 2 3 4 5 6 7 8 9
10
8,260 5,900 4,141 2,825
412 1,780
118 33 8 4
35.2 25.1 17.6 12.0
1.8 7.6 0.5 0.1 0.0 0.0
0.00 15.00 30.00 45.00 50.00 50.00 50.00 50.00 50.00 50.00
Mean exemptions and cost 2.46 21.88 Beneficiaries and cap-djusted cost 23,481 19.49

59
Table 13 Estimated Cost of Kentucky UI Dependents Allowances, January 1, 2006, to June 30, 2009, Assuming All Exemptions Except the Claimant Are Dependentsa
Adjusted gross income range
(2005 tax year) UI
beneficiaries Average WBA ($)
Total UI compensation received ($)
Duration of benefits (wks)
Estimated cost of
dependents ($)
Cost increase
percentage
$0–$5,000 7,898 $52 $4,729,442 11.47 $1,765,187 37.3 $5,000–$10,000 37,193 102 49,636,445 13.03 7,465,154 15.0
$10,000–$15,000 55,150 164 122,034,416 13.45 12,040,884 9.9 $15,000–$20,000 64,014 230 195,847,052 13.34 14,309,977 7.3 $20,000–$25,000 69,899 294 257,732,832 12.53 14,847,191 5.8 $25,000–$30,000 67,596 358 288,761,840 11.93 14,250,728 4.9 $30,000–$35,000 58,655 404 277,964,276 11.72 13,231,431 4.8 $35,000–$40,000 47,665 408 217,318,312 11.19 11,144,509 5.1 $40,000–$45,000 35,948 408 160,989,036 10.97 8,868,083 5.5 $45,000–$50,000 26,749 408 120,603,864 11.04 7,151,722 5.9 $50,000–$55,000 19,208 409 85,342,196 10.86 5,295,945 6.2 $55,000–$60,000 13,717 409 60,933,910 10.85 3,981,950 6.5
$60,000+ 37,392 409 164,875,030 10.79 11,705,468 7.1
Totals 541,084 2,006,768,651 126,058,229 Weighted means 315 12.06 19.58 6.3
a Claims with effective dates January 1, 2006 through June 30, 2009. Computations assume individual gross income is composed solely of earnings and does not include other sources like interest, dividends, or capital gains.

60
Table 14 Summary of Means for Dependents Allowances
Definition of a dependent Data time frame WBA
($)
Benefit Duration
(wks)
Weekly Dependents Allowance
($)
Benefits Increase
(%)
Spouse a dependent 2006Q1 to 2009Q2 315 12.06 19.58 6.3
Spouse not a dependent 2006Q1 to 2009Q2 315 12.06 17.21 5.5
Working spouse not a dependent 2006Q1 to 2009Q2 315 12.06 18.21 5.8
Working spouse not a dependent 2006Q1 to 2006Q4 300 11.46 17.99 6.1
Working spouse not a dependent 2007Q1 to 2007Q4 311 12.09 17.93 5.8
Working spouse not a dependent 2008Q1 to 2008Q4 320 14.05 18.22 5.7
SOURCE: Author’s computations based on Kentucky UI program administrative data.

61
Table 15 ARRA UI Modernization Options: Cost Summary for Kentucky
Percentage increase in
UI costs
Years until ARRA money is exhausted Number of adopting
states “Normal”
Yearsa “Recession”
Yearsb
Alternate base period (ABP) ABP Option A 1.6 4.0 2.5 ABP Option B 1.2 5.4 3.3 39
Seeking part-time workd 1.2 5.0 3.0 25
Compelling family reasonsc 0.60 10.7 6.8 18 Trailing spouse 0.23 Illness of a family member 0.33 Domestic violence 0.04
Training (26 weeks of additional UI)e 19.1 1.2 0.6 Training at current rates 2.1 3.1 1.6 14 Training all exhaustees 40.8 0.2 0.1
Dependents allowance Include spouse 6.3 1.2 0.7 Exclude spouse 5.5 1.0 0.6 Exclude working spouse 5.8 1.1 0.7 7
Kentucky UI payments ($) 471,786,834 741,379,310 a Normal year based on data from 2006Q1 through 2008Q2. b Recession year based on data from 2008Q3 through 2009Q2. c Does not include an assumption concerning entry effect. d Part-time effect estimate of 0.6 percent by both methods is doubled to allow for entry effects. e Impact estimates reported here cover a wide variety of alternative scenarios and therefore are assumed to
encompass an entry effect.

62
REFERENCES
Blank, Rebecca M., and David E. Card. 1991. “Recent Trends in Insured and Uninsured Unemployment: Is There an Explanation?” Quarterly Journal of Economics 106(4): 1157–1189.
Bureau of Labor Statistics (BLS). 2008a. Involuntary Part-Time Work on the Rise. Issues in
Labor Statistics, Summary 08-08. Washington, DC: Bureau of Labor Statistics. ———. 2008b. Women in the Labor Force: A Databook. Report 1011, Table 23. Washington,
DC: Bureau of Labor Statistics. ———. 2009. Quarterly Census of Employment and Wages. Washington, DC: Bureau of
Labor Statistics. http://www.bls.gov/cew/ (accessed February 24, 2011). Davidson, Carl, and Stephen A. Woodbury. 2001. “From Social Experiment to Program: The
Reemployment Bonus.” In Reemployment Bonuses in the Unemployment Insurance System: Evidence from Three Field Experiments, Phillip K. Robins and Robert G. Spiegelman, eds. Kalamazoo, MI: W.E. Upjohn Institute for Employment Research, pp. 175–222.
Employment and Training Administration (ETA). 2009. Budget Summary. Washington, DC:
U.S. Department of Labor, Employment and Training Administration (ETA). Government Accountability Office (GAO). 2007. Unemployment Insurance: Low-Wage and
Part-Time Workers Continue to Experience Low Rates of Receipt. GAO-07-1147. Washington, DC: Government Accountability Office.
Governor’s Task Force on Unemployment Insurance. 2010. Ensuring Long-Term Stability of
Kentucky’s UI System. Final Report of the Kentucky Unemployment Insurance Task Force Established by Governor Steven L. Beshear. Frankfort, KY: Governor’s Task Force on Unemployment Insurance.
Meyer, Bruce D. 1995. “Lessons from the U.S. Unemployment Insurance Experiments.”
Journal of Economic Literature 33(1): 91–131. Moffitt, Robert. 1992. “Evaluation Methods for Program Entry Effects.” In Evaluating Welfare
and Training Programs, Charles F. Manski and Irwin Garfinkel, eds. Cambridge, MA: Harvard University Press, pp. 231–252.

63
Oates, Jane. 2009. Training and Employment Guidance Letter No. 2-09: Approved Training for the Unemployment Insurance Program Recommended Policies. Washington, DC: U.S. Department of Labor, Employment and Training Administration.
O’Leary, Christopher J. 2009a. “Unemployment Insurance Modernization in Kentucky: The
Alternative Base Period.” Report for research project 35242. Kalamazoo, MI: W.E. Upjohn Institute for Employment Research.
———. 2009b. “Unemployment Insurance Modernization in Kentucky: Dependents Allowance
Simulations.” Report for research project 35242. Kalamazoo, MI: W.E. Upjohn Institute for Employment Research.
———. 2009c. “Unemployment Insurance Modernization in Kentucky: Compelling Family
Reasons.” Report for research project 35242. Kalamazoo, MI: W.E. Upjohn Institute for Employment Research.
———. 2010. “Unemployment Insurance Modernization in Kentucky: Training Allowance.”
Report for research project 35242. Kalamazoo, MI: W.E. Upjohn Institute for Employment Research.
O’Leary, Christopher J., and Kenneth J. Kline. 2009. “Unemployment Insurance Modernization
in Kentucky: Eligibility while Seeking Part-Time Work.” Report for research project 35242. Kalamazoo, MI: W.E. Upjohn Institute for Employment Research.
Planmatics. 1997. Impact of the Alternative Base Period on the Trust Fund. Employment and
Training Administration Occasional Paper 1998-04. Washington, DC: U.S. Department of Labor, Employment and Training Administration
Small, Douglas F. 2009. Unemployment Insurance Program Letter No. 14-09: Special
Transfers for Unemployment Compensation Modernization and Administration and Relief from Interest on Advances. Washington, DC: U.S. Department of Labor, Employment and Training Administration.
Stettner, Andrew, Heather Boushey, and Jeffrey Wenger. 2005. Clearing the Path to
Unemployment Insurance for Low-Wage Workers: An Analysis of Alternative Base Period Implementation. New York: National Employment Law Project; Washington, DC: Center for Economic and Policy Research.
U.S. Department of Labor (USDOL). 2010. UI Modernization Incentive Payments - Approved
Applications). Washington, DC: U.S. Department of Labor, Employment and Training Administration. workforcesecurity.doleta.gov/unemploy/docs/app_form.doc (accessed February 24, 2011).

64
Vroman, Wayne. 1995. The Alternative Base Period in Unemployment Insurance: Final Report. Unemployment Insurance Occasional Paper 95-03. Washington, DC: U.S. Department of Labor.