Embed Size (px)
Citation preview

WDP- 74
-E 1 World Bank Discussion Papers
Costs and Benefits ofRent Control
A Case Study in Kumasi, Ghana
Stephen MalpezziA. Graham TippleKenneth G. Willis

RECENT WORLD BANK DISCUSSION PAPERS
No. 16. Macroeconomic Policies and Adjustment in Yugoslavia: Some Counterfactual Simulations.Fahrettin Yagci and Steven Kamin
No. 17. Private Enterprise in Africa: Creating a Better Environment. Keith Marsden and Therese Belot
No. 18. RIral Water SupplY and Sanitation: Time for a Change. Anthony A. Churchill, with theassistance of David de Ferranti, Robert Roche, Carolyn Tager,Alan A. Walters, and Anthony Yazer
No. 19. The Public Revenue and Economic Policy in African Countries: An Overview of Issues and PolicvOptions. Dennis Anderson
No. 22. Demographic Trends in China from 1950 to 1982. Kenneth Hill
No. 23. Food Import Dependence in Somalia: Magnitude, Causes, and Policy Options. Y. Hossein Farzin
No. 24. The Relationship of External Debt and Growth: Sudan's Experience, 1975-1984. Y. HosseinFarzin
No. 25. The Poor and the Poorest: Some Interim Findings. Michael Lipton
No. 26. Road Transport Taxation in Developing Countries: The Design of User Charges and Taxes forTunisia. David Newbery, Gordon Hughes, William D.O. Paterson, and Esra Bennathan
No. 27. Trade and Industrial Policies in the Developing Countries of East Asia. Amarendra Bhattacharyaand Johannes F. Linn
No. 28. Agricultural Trade Protectionism in Japan: A Survey. Delbert A. Fitchetl:
No. 29. Multisector Framework for Analysis of Stabilization and Structural Adjustment Policies: TheCase of Morocco. Abel M. Mateus and others
No. 30. Improvinq the Quality of Textbooks in China. Barbara W. Searle and Michael Mertaugh withAnthony Read and Philip Cohen
No. 31. Small Farmers in South Asia: Their Characteristics. Productivity, and Eff'iciency. InderjitSingh
No. 32. Tenancy in South Asia. Inderjit Singh
No. 33. Land and Labor in South Asia. Inderjil' Singh
No. 35. Global Trends in Real Exchange Rates. Adrian Wood
No. 36. Income Distribution and Economic Development in Malawi: Some Historical Perspectives.Frederic L. Pryor
No. 37. Income Distribution and Economic Develcopment in Madagascar: Some Historical Perspectives.Frederic L. Pryor
No. 38. Quality Controls of Traded Commodities and Services in Developing Countries. Simon Rottenbergand Bruce Yancle
No. 39. Livestock Production in North Africa and the Middle East: Problems and Perspectives. John C.Glenn LAlso available in French (39F)J
No. 40. Nonaovernmental Organizations and Local Development. Michael M. CerneaLAlso available in Spanish (40S)
No. 41. Patterns of Development: 1950 to 1983. Moises Syrquin and Hollis Chenery
No. 42. Voluntary Debt-Reduction Operations: Bolivia, Mexico, and Beyond... Ruben Lamdany
No. 43 Fertility in Sub-Saharan Africa: Analysis and Explanation. Susan Cochrane and S.M. Farid
No. 44. Adjustment Programs and Social Welfare. Elaine Zuckerman
(Continued on the inside back cover.)

74 I World Bank Discussion Papers
Costs and Benefits ofRent Control
A Case Study in Kumasi, Ghana
Stephen MalpezziA. Graham TippleKenneth G. Willis
The World BankWashington, D.C.

Copyright © 1990The World Bank1818 H Street, N.WWashington, D.C. 20433, U.S.A.
All rights reservedManufactured in the United States of AmericaFirst printing March 1990
Discussion Papers are not formal publications of the World Bank. They present preliminary andunpolished results of country analysis or research that is circulated to encourage discussion andcomment; citation and the use of such a paper should take account of its provisional character. Thefindings, interpretations, and conclusions expressed in this paper are entirely those of the author(s) andshould not be attributed in any manner to the World Bank, to its affiliated organizations, or to membersof its Board of Executive Directors or the countries they represent. Any maps that accompany the texthave been prepared solely for the convenience of readers; the designations and presentation of materialin them do not imply the expression of any opinion whatsoever on the part of the World fBank, itsaffiliates, or its Board or member countries concerning the legal status of any country, territory, city, orarea or of the authorities thereof or concerning the delimitation of its boundaries or its nationalaffiliation.
Because of the informality and to present the results of research with the least possible delay, thetypescript has not been prepared in accordance with the procedures appropriate to formal printed texts,and the World Bank accepts no responsibility for errors.
The material in this publication is copyrighted. Requests for permission to reproduce portions of itshould be sent to Director, Publications Departmnent, at the address shown in the copyrighit noticeabove. The World Bank encourages dissemination of its work and will normally give permissionpromptly and, when the reproduction is for noncommnercial purposes, without asking a fee. Pernissionto photocopy portions for classroom use is not required, though notification of such use having beenmade will be appreciated.
The complete backlist of publications from the World Bank is shown in the annual Index of Publications,which contains an alphabetical title list and indexes of subjects, authors, and countries and regions; it isof value principally to libraries and institutional purchasers. The latest edition is available free of chargefrom Publications Sales Unit, Department F, T'he World Bank, 1818 H Street, N.W, Washington, D.C.20433, U.S.A., or from Publications, The World Bank, 66, avenue d'lena, 75116 Paris, France.
Stephen Malpezzi is an economist in the Urban Development Division of the World Bank. A. GrahamTipple is senior research officer in the Centre for Architectural Research and Development Overseas,and Kenneth G. Willis, senior lecturer in the Department of Town and Country Planning, both at theUniversity of Newcasde upon Tyne (U.K.).
ISSN 0259-21OX
Library of Congress Cataloging-in-Publication Data
Malpezzi, Stephen.Costs and benefits of rent control : a case study in Kumasi, Ghana
/ Stephen Ma',pezzi, A. Grahanm Tipple, Kenneth G. Willis.p. cm. -- (World Bank discussion papers 74)
Includes bibliographical references (p.ISBN 0-8213-1463-71. Rent control--Ghana--Kumasi--Cost effectiveness. 2. Rental
housing--Ghana--Kumasi. I. Tipple, A. Graham. II. Willis, K. G.(Kenneth George) III. Title.. IV. Series.HD7288.82.M35 1990363.5'6'09667--dc2O 90-12073
CIP
ABSTRACT
Over the past forty years, rent control has been a feature of housing inGhana. This study focusses on the housing market in Kumasi, the second largestcity in Ghana. We examine the characteristics of the rent control regime inforce there, and assess the costs and benefits of rent control, on landlords andon tenants, and its effects on the housing stock.
Rent control has been successful in ensuring that housing is veryinexpensive for most households, both in absolute terms and in the proportionof income devoted to rent. Landlords, who are found to be little different frommany renters, have been deprived of economic returns from their property. Theirreaction has been to withdraw stock from renting to use for their own familymembers and to reduce maintenance. There has recently been an increase inpayment of rent in advance for new lets, and even some existing lets.
Rent control is not the only constraint on the housing market, in Kumasior in Ghana. The paper also describes other supply side and regulatoryconstraints; including those affecting land, finance, and choice of buildingdesign and materials.
Where net benefits from rent control exist they are found to be unrelatedto need, having little distributional efficiency. There is some tendency forlower income tenants to receive larger net benefits, but they are still smallrelative to their cost. The strongest pattern is that long term tenants receivelarge benefits at the expense of recent movers as well as landlords.
Our best estimates are that typical room rents in the tenement andindigenous housing sectors were 250 to 300 cedis in 1986; that long runequilibrium rents of these units in the absence of controls would be roughlytwice that (median of 574 cedis); but that households would demand more housingservices in a well functioning market and hence live in a unit yielding about80 percent more "housing services" (i.e., with a median rent of roughly 1040cedis). In other words most tenants pay less for their units (a gain to them)but live in smaller and/or lower quality units than we estimate they wouldconsume in a well functioning market (a loss to them). Not all of the loss fromdisequilibrium in consumption is necessarily due to rent control, however;constraints on land and finance, and other regulations, play a part. Overall,however, for many tenants the welfare loss from consuming less housing more orless cancels most of the benefit of lower rents.
A number of options for relaxation/decontrol are studied with the aid ofa simple present value model. Along with decontrol of new construction it isrecommended that floating up and out of controls over a period of about fiveyears should be considered, along with policy changes to ensure ready suppliesof land, finance, and building materials. Such policies are essential, giventhat private housing investment has provided and will continue to provide thegreat majority of rooms in Ghanaian urban areas.
Finally, while we emphasized "floating up and out" for existing units alongwith immediate decontrol for new construction and upgraded units, there are awide range of options which can be explored in more detail with the aid of thepresent value model. Building a political consensus behind decontrol is notindependent of but is more important than the technical means chosen fordecontrol or relaxation.
iii

ACK,NOWLEDGEMENT
The authors are grateful to Esra Bennathan, Robert Buckley, Per Ljung,Edgar Olsen, Stephen Mayo and others for their comments on the drafts of thispaper. Many Ghanaians have also assisted with this research. We areparticularly grateful to Samuel Afrane, Samuel Boapeah, and Martha Tamakloe.They are not responsible for remaining shortcomings.
This paper has been produced under a World 13ank research project on Rent Control in Developing Countries(RPO 674-01), directed by Stephen Malpezzi. The project and the methodology are described in the followingpapers:
Stephen Malpezzi and C. Peter Rydell, Rent Controls: A Framework for Analysis (Water Supply and UrbanDevelopment Department Discussion Paper No. 102, 1986).
Stephen Malpezzi, Stephen K. Mayo, Ricardo Silveira and Carmela Quintos, Measuring the Costs andBenefits of Rent Control: Case Study Design. (Infrastructure and Urban Development DepartmentDiscussion Paper No. INU 24, 1988).
An introductory descriptive paper on Rent Control in Kumasi has also been produced:
A. Graham Tipple, The History and Practice! of Rent Control in Kumasi. Ghana (World Bank, UrbanDevelopment Division Working Paper No. 88-1, 1988).
iv

TABLE OF CONTENTS
I. OVERVIEW ...... . ....... IA. Housing and the Current Macro-Economic Environment . . . . . . . 1B. Summary of Findings. 4
Key Findings & their Generality . . . . . . . . . . . . . . . 4Housing Market Conditions. 6Costs and Benefits of Controls . . . . . . . . . . . . . . . 7Distributional Issues . . . . . . . . . . . . . . . . . . . . 8Housing Supply . . . . . . . . . . . . . . . . . . . . . . . 9Rent Control and Profitability . . . . . . . . . . . . . . . 9Other Market Imperfections .10Decontrol Options .11
C. Suggestions for future work .14
II. HOUSING MARKETS AND RENT CONTROL IN GHANA . . . . . . . . . . . . . 17A. Introduction to Urban Housing in Ghana . . . . . . . . . . . . 17
Typical Designs . . . . . . . . . . . . . . . . . . . . . . . 17B. Overview of Ghanaian Housing Markets . . . . . . . . . . . . . 17
Demand . . . . . . . . . . . . . . . . . . . . . . . . . . . 18Land .18Infrastructure .20Finance . . . . . . . . . . . . . . . . . . . . . . . . . . . 20Current Housing Finance Institutions . . . . . . . . . . . . 21
The Bank for Housing and Construction . . . . . . . . . 21First Ghana Building Society . . . . . . . . . . . . . 22Social Security and National Insurance Trust . . . . . 22Other Financial Intermediaries . . . . . . . . . . . . 23Informal Sector Housing Finance . . . . . . . . . . . . 23
The Regulatory Framework .24C. Chronology of Rent Control in Ghana . . . . . . . . . . . . . 24
Rent Control before 1963 .24Rent Control between 1963 and 1979 . . . . . . . . . . . . . 26Rent Control post-1979 .29Recent developments, 1986 to 1988 . . . . . . . . . . . . . . 32
D. Current Status of Controls .33Coverage . . . . . . . . . . . . . . . . . . . . . . . . . . 33Advances and side payments .33Eviction .35Treatment of houses in government estates . . . . . . . . . . 35Reletting After Renovations .37
E. The Political Economy of Rent Control . . . . . . . . . . . . . 38Cost of Housing built by the Government . . . . . . . . . . . 39Rent Changes .39
F. Summary .40
v

III. THE HOUSING MARKET OF KUMASI . . . . . . . . . . . . . . . . . . . 41A. An Introduction to Kumasi . . . . . . . . . . . . . . . . . . . 41B. Household Survey Data . . . . . . . . . . . . . . . . . . . . . 43C. Kumasi's Housing Stock . . . . . . . . . . . . . . . . . . . . 43
Access to Utilities and Services . . . . . . . . . . . . . . 45Environmental Conditions . . . . . . . . . . . . . . . . . . 46Housing Supply .... . . . . . . . . . . . . . . . . . . . 46
D. Household Characteristics . . . . . . . . . . . . . . . . . . . 47Tenure . . . . . . . . . . . . . . . . . . . . . . . . . . . 47House Ownership and "Family Houses" . . . . . . . . . . . . . 47Income and Consumption ... . . . . . . . . . . . . . . . . 48Household Size .... . . . . . . . . . . . . . . . . . . . 50Household size by tenure . . . . . . . . . . . . . . . . . . 52Rooms occupied .... . . . . . . . . . . . . . . . . . . . 52Occupancy rates .... . . . . . . . . . . . . . . . . . . . 53Rents by Consumption Quartile . . . . . . . . . . . . . . . . 53Summary of Key Data by Tenure . . . . . . . . . . . . . . . . 54
IV. ECONOMIC ANALYSIS OF RENT CONTROL: THEORY . . . . . . . . . . . . 57A. Introduction .57B. Analysis of Rent Control as a Tax on Housing .. . ... . ... . 57
Rent Control as Expenditure Control . . . . . . . . . . . . . 58C. Dynamic Models of the Effect of Rent Control on Maintenance . 59D. The Relationship Between Controlled and Uncontrolled Markets 59E. Two ApRroaches to Measurinz Costs and Benefits .60
Cost-Benefit Using a Cross-Country Model .60Cost-Benefit Using a Model Similar to Edgar Olsen's . . . . . 61
V. ESTIMATES OF THE COSTS AND BENEFITS OF CONTROLS . . . . . . . . . . . 65A. Introduction . . . . . . . . . . . . . . . . . . . . . . . . . 65B. Choice of Reference Group . . . . . . . . . . . . . . . . . . . 66
Controlled and "Uncontro:Lled" Households Compared . . . . . . 70Selectivity Bias .... . . . . . . . . . . . . . . . . . . 71Net versus Gross Rent . . . . . . . . . . . . . . . . . . . . 72Anecdotal Recent Evidence on Increase in Advances . . . . . . 73
C. PcOc: Current Rent Paid. . . . . . . . . . . . . . . . . . . 74D. Estimating PmOm With a Cross Country Model of Housing Demand 75
"Uncontrolled" Rents Compared to Predictions from the Cross-Country Model .81
E. Estimating PmOm With Kumasi Survey Data .82F. Price Elasticity of Demand .83G. Estimating PmOc With Hedonic Indexes . . . . . . . . . . . . . 83
Hedonic Estimates .84H. Cost-Benefit Measures .85
Costs and Benefits from the Cross-Country Model . . . . . . . 85Costs and Benefits Constructed from the Hedonic and Demand
Equations .... . . . . . . . . . . . . . . . . . . . 87I. Distribution of Costs and Benefits . . . . . . . . . . . . . . 90
Distribution By Consumption . . . . . . . . . . . . . . . . . 90Benefits By Length of Tenure . . . . . . . . . . . . . . . . 91
J. Landlord and Tenant Incomes Compared . . . . . . . . . . . . . 92
vi

VI. RENT CONTROL, PROFITABILITY, AND SUPPLY . . . . . . . . . . . . . . 95A. Housing Supply in Kumasi .... . . . . . . . . . . . . . . . 95
New Construction .... . . . . . . . . . . . . . . . . . 95Rental Housing Losses -- Demolitions, Conversions and Foregone
Starts . . . . . . . . . . . . . . . . . . . . . . 96Housing From the Existing Stock . . . . . . . . . . . . . . . 96Net Effects on Supply .... . . . . . . . . . . . . . . . . 97
B. Rent Control and Landlord Profitability . . . . . . . . . . . . 98Present Values . . . . . . . . . . . . . . . . . . . . . . . 99A Present Value Model of Housing Investment in Kumasi . . . . 99Gains and Losses from Four Components and their Interaction . 103
Rents . . . . . . . . . . . . . . . . . . . . . . . . . 103Taxation .... . . . . . . . . . . . . . . . . . . . 103Maintenance .... . . . . . . . . . . . . . . . . . . 104Capital Gains .................... . 104
Effects of Rent Control on Landlord Profitability . . . . . . 105Alternative Investment Opportunities . . . . . . . . . . . . 106Affordability ....................... . 107Profitability and Affordability for an Existing Unit . . . . 108What's Missing From the Model, and Related Conjectures . . . 109
Risk ........................ . 109Imperfections in input markets and from other
regulations .................. . 109Market-wide effects ................. . 109
Summary of Effects of the Current Regime . . . . . . . . . . 110C. Effects of Other Regulations ............. . 111D. Analysis of Decontrol Policy ODtions . . . . . . . . . . . . . 112
Do Nothing .... . . . . . . . . . . . . . . . . . . . . . 113Blanket Decontrol .... . . . . . . . . . . . . . . . . . . 113Decontrol New Construction and Upgraded Units . . . . . . . . 115Decontrol for New Tenants ................. . 115Floating Up and Out .................... . 116Other Options .... . . . . . . . . . . . . . . . . . . . . 117
E. Summary ........................... . 117
VII. A FINAL SUMMING UP ....................... . 119
ANNEX TABLES .123
REFERENCES . . . . . . . . . . . . . . . . . . . . . . . . . . . . . . . 129
vii

LIST OF TABLES
1.1: Housing Infrastructure Indicators, Selected Countries . . . . . . . 3
2.1: Rent Control Measures, 1963 to 1987 . . . . . . . . . . . . . . . . 272.2: Prescribed Rents for Certain Premises, 1973 . . . . . . . . . . . . 282.3: Controlled rents July 1979 (AdFRCD 5, 1979) . . . . . . . . . . . . 302.4: Rental levels under PNDC Law 5, 1982. . . . . . . . . . . . . . . . 312.5: Rental levels under L.I. 1318, January, 1986. . . . . . . . . . . . 312.6: Prices of Selected S.H.C. House Types . . . . . . . . . . . . . . . 39
3.1: Household Environmental Indicators by Tenure . . . . . . . . . . . 463.2: Household Size by Tenure . . . . . . . . . . . . . . . . . . . . . 523.3: Mean Persons per Room by Tenure, 1980 and 1986 . . . . . . . . . . 533.4: Rents by Consumption Quartile . . . . . . . . . . . . . . . . . . . 543.5: Summary Descriptive Statistics . . . . . . . . . . . . . . . . . . 55
5.1: Controlled and Uncontrolled SaLmples Compared . . . . . . . . . . . 705.2: Gross and Net Rents Compared . . . . . . . . . . . . . . . . . . . 745.3: Controlled and "Uncontrolled" Rents Paid by Sector . . . . . . . . 755.4: Malpezzi and Mayo Demand Results .... . . . . . . . . . . . . . 775.5: Demand Equations . . . . . . . . . . . . . . . . . . . . . . . . . 835.6: Hedonic Index . . . . . . . . . . . . . . . . . . . . . . . . . . . 855.7: Summary Cost-Benefit Measures From Cross Country Model . . . . . . 865.8: Cost-Benefit Measures From Survey Demand and Hedonic Models . . . . 885.9: Summary Cost-Benefit Measures By Consumption . . . . . . . . . . . 915.10: Summary Cost-Benefit Measures By Length of Tenure . . . . . . . . . 925.11: Landlord and Renter Incomes ..... . . . . . . . . . . . . . . . 93
6.1: Cash Flow Model of Rental Investment . . . . . . . . . . . . . . . 1016.2: Key Model Inputs . . . . . . . . . . . . . . . . . . . . . . . . 102
viii
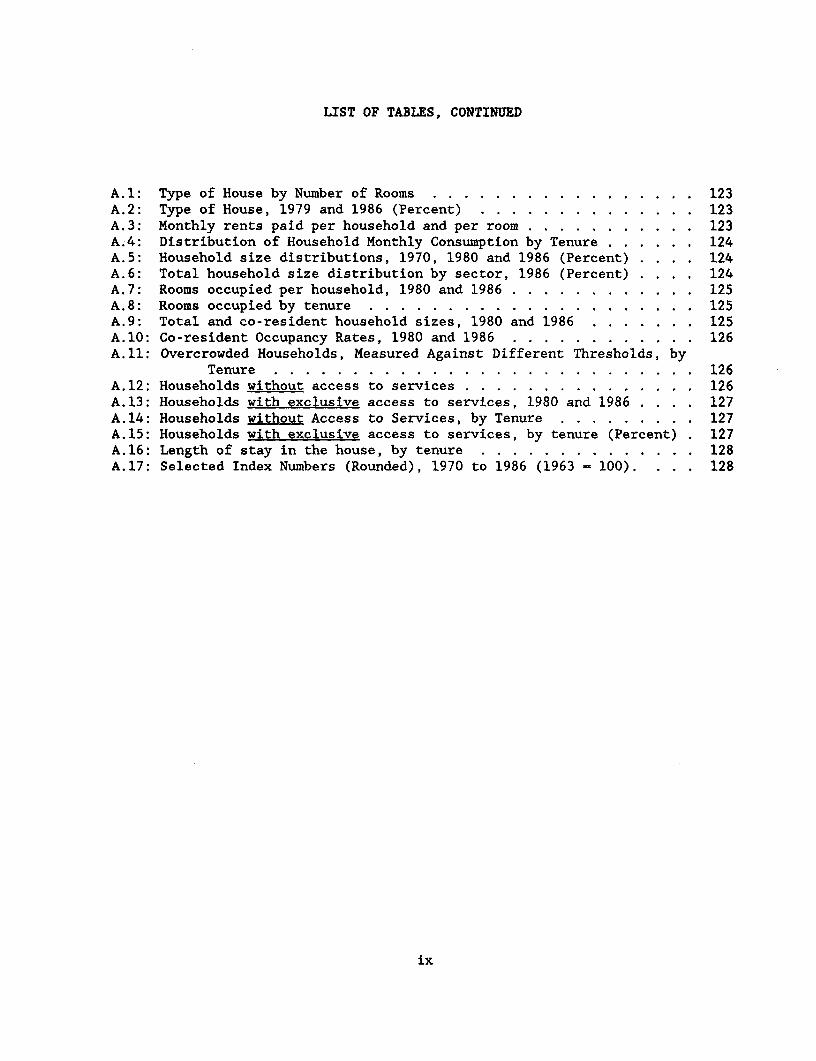
LIST OF TABLES, CONTINUED
A.1: Type of House by Number of Rooms . . . . . . . . . . . . . . . . . 123A.2: Type of House, 1979 and 1986 (Percent) . . . . . . . . . . . . . . 123A.3: Monthly rents paid per household and per room . . . . . . . . . . . 123A.4: Distribution of Household Monthly Consumption by Tenure . . . . . . 124A.5: Household size distributions, 1970, 1980 and 1986 (Percent) . . . . 124A.6: Total household size distribution by sector, 1986 (Percent) . . . . 124A.7: Rooms occupied per household, 1980 and 1986 . . . . . . . . . . . . 125A.8: Rooms occupied by tenure .. 125A.9: Total and co-resident household sizes, 1980 and 1986 . . . . . . . 125A.10: Co-resident Occupancy Rates, 1980 and 1986 . . . . . . . . . . . . 126A.11: Overcrowded Households, Measured Against Different Thresholds, by
Tenure . . . . . . . . . . . . . . . . . . . . . . . . . . . 126A.12: Households without access to services . . . . . . . . . . . . . . . 126A.13: Households with exclusive access to services, 1980 and 1986 . . . . 127A.14: Households without Access to Services, by Tenure . . . . . . . . . 127A.15: Households with exclusive access to services, by tenure (Percent) . 127A.16: Length of stay in the house, by tenure . . . . . . . . . . . . . . 128A.17: Selected Index Numbers (Rounded), 1970 to 1986 (1963 - 100). . 128
ix

LIST OF FIGURES
1.1: Real GNP Per Capita . . . . .. . . . . . . . . . . . . . . . . . . 11.2: Change in Real GNP Per Capita ... . . . . . . . . . . . . . . . 11.3: Housing Investment and Capital. Formation . . . . . . . . . . . . . 2
2.1: How Housing Markets Work ... . . . . . . . . . . . . . . . . . . 182.2: Nominal Interest Rates . . . . . . . . . . . . . . . . . . . . . . 202.3: Real Interest Rates . . . . . . . . . . . . . . . . . . . . . . . 202.4: Measures of Financial Depth . . . . . . . . . . . . . . . . . . . 212.5: Selected Prices, Logarithmic Scale . . . . . . . . . . . . . . . . 29
3.1: Map of Kumasi . . . . . . . . . . . . . . . . . . . . . . . . . . 423.2: Distribution of Households by T'enure, Sector, House Type and Number
of Rooms .... . . . . . . . . . . . . . . . . . . . . . . 443.3: Tenure by Sector . . . . . . . . . . . . . . . . . . . . . . . . . 453.4: Households Without Access to Services . . . . . . . . . . . . . . 463.5: Monthly Rents . . . . . . . . . . . . . . . . . . . . . . . . . . 473.6: Consumption by Tenure ... . . . . . . . . . . . . . . . . . . . 493.7: Household Size, Selected Years ... . . . . . . . . . . . . . . . 503.8: Size Distribution by Sector ... . . . . . . . . . . . . . . . . 503.9: Household Size by Tenure . . . . . . . . . . . . . . . . . . . . . 523.10: Rooms Occupied . . . . . . . . . . . . . . . . . . . . . . . . . 53
4.1: Rent Control as Effective Price Control . . . . . . . . . . . . . 574.2: Rent Control with Elastic Supply . . . . . . . . . . . . . . . . . 584.3: Rent Control as Expenditure Control . . . . . . . . . . . . . . . 594.4: Rent Control and Consumer's Surplus . . . . . . . . . . . . . . . 62
5.1: Effect of Selectivity Bias . . . . . . . . . . . . . . . . . . . . 715.2: Advance by Length of Tenure . . . . . . . . . . . . . . . . . . . 735.3: Rents by Sector . . . . . . . . . . . . . . . . . . . . . . . . . 755.4: Rent to Income Ratios, Cross Country Model . . . . . . . . . . . . 785.5: Rent-to-Income Comparisons, Various Models . . . . . . . . . . . . 815.6: Rents and Predictions from the Cross Country Model . . . . . . . . 865.7: Cost Benefit Measures by Sector . . . . . . . . . . . . . . . . . 895.8: Changes in Consumers Surplus for Typical Tenants . . . . . . . . . 895.9: Cost Benefit by Consumption . . . . . . . . . . . . . . . . . . . 915.10: Cost Benefit by Length of Tenure . . . . . . . . . . . . . . . . . 925.11: Income Distribution by Tenure . . . . . . . . . . . . . . . . . . 93
x

LIST OF FIGURES, CONTINUED
6.1: Number of Houses by Sector . . . . . . . . . . . . . . . . . . . . 986.2: Population, Rooms and Number of Houses . . . . . . . . . . . . . . 986.3: Change in Components of Landlord's Present Value . . . . . . . . . 1036.4: Summary Present Value, New Unit ................ . 1056.5: Internal Rate of Return: New Unit . . . . . . . . . . . . . . . . 1056.6: Real Interest Rates . . . . . . . . . . . . . . . . . . . . . . . 1066.7: Returns to Financial And Other Investments Compared . . . . . . . 1066.8: Willingness to Pay: Decontrolled New Unit (Yr 1) . . . . . . . . 1076.9: Affordability Over Time . . . . . . . . . . . . . . . . . . . . . 1076.10: Internal Rate of Return, Existing Units . . . . . . . . . . . . . 1086.11: Affordability, Existing Units ... . . . ..... . . . . . . . 1086.12: Internal Rate of Return, Existing Unit, Rents Overshoot
Equilibrium .... . . . . . . ...... . . . . . . . . . . 1146.13: Willingness to Pay Over Time, Existing Unit, Rents Overshoot . . . 1146.14: Internal Rate of Return, Floating Up and Out . . . . . . . . . . . 1166.15: Willingness to Pay, Floating Up and Out . . . . . . . . . . . . . 116
xi


I. OVERVIEW
A. Housing and the Current Macro-Economic Environment
The last twenty five years have seen Ghana decline from one of the richestcountries in Sub-Saharan Africa to one in which the infrastructure and capitalstock, including housing, are in very poor condition. During the period 1965to 1986, real per capita gross national product (GNP) declined at an averageannual rate of 1.7 percent per year. Figure 1.1 presents data for levels fromrecent years; Figure 1.2 presents the corresponding changes."1
Recently, however, there have been signs of an upturn. An ambitiouspackage of reforms has been instigated by the Provisional National DefenceCouncil Government of Flt-Lt. Jerry Rawlings. The structural adjustment programincludes a devaluation and eventual market determination of the exchange ratefor the Cedi (from C2.75 = US$1 to C90 in 1986, when we collected the householddata, and C350 by March 1989) and other policy changes including agriculturalprice reforms and reductions in government staff levels. As a result, real GNPincreased by 5 percent in both 1985 and 1986 (Figures 1.1 and 1.2).
Figure 1.1: Real GNP Per Capita Figure 1.2: Change in Real GNP Per Capita
$70 0.0 1eO
s-----------------------------------------...........................
soo0.o ,,,,,,,,, ,,,,,,,,,.,,,,,,,,,,,,,,, ,, ........... xvV/,,,<............. ,l,,,--,---,-------,-- ...........
$400.0 .-- - - --1 0% .................... .... .. ..... .........
GNP Per Capita I I -Petcenl Change|
$300.0 - 15X I * I * I70 72 74 70 70 80 82 04 86 88 70 72 74 76 78 B0 82 B4 86
Concern remains that housing conditions have deteriorated over the pastdecade; improvement in these conditions is required to ensure that the benefitsof adjustment are widely shared. As the adjustment in Ghana's economy takeshold, demand for housing can be expected to increase at least as fast as realincomes. One important task for the government is to ensure that its actionsdo not impede or constrain potential suppliers of housing. The purpose of thispaper is to examine the constraint on the housing sector imposed by rent controlin the second largest city of Ghana, Kumasi. This concentration on rent controlis not intended to imply that it is the only, or most important, constraint.
1/ National accounts and other aggregate data are from the World Bank's BESDdatabase, updated by written reports. These data are in turn obtained bythe Bank from the Government of Ghana.

2
As will be discussed below, other problems restricting the supply of rental (andowner occupied) housing must also be confronted, such as problems in landmarkets, provision of infrastructure, finance, and other regulations, such asplanning and building regulations.
Shelter is the largest single form of fixed capital investment in mosteconomies. In developing countries, the shelter sector usually ranges between10 and 30 percent of household expenditure or 6 to 20 percent of Gross NationalProduct. Housing ranges from 10 to over 50 percent of gross fixed capitalformation and from 3 to 8 percent of Gross Domestic Product. The share ofhousing investment in GDP rises as economies develop (see, for example, Mayo,Malpezzi and Gross, 1986).
In general, these patterns have not been evident in Ghana over the last15 years. Figure 1.3 shows that since 1970 the published numbers indicate thatthe share of housing investment in GNP has been falling from about 5 percent inthe early 1970s to only about 3 percent in the years since 1980. However, suchdata are only indicative. Ghosh and Mohan (1983) reports that Ghanaian housinginvestment data are derived from data on cement imports and estimates ofpopulation growth, so, for example, changes in housing investment given aparticular change in population and level of cement imports will not be reflectedin the data. On the other hand, the trend is still clear and is consistent withobservation and anecdotal evidence (and survey data presented later in thispaper).
Figure 1.3: Housing Investment amd Capital Formation
While these data have to beinterpreted with more than the usual 14%
caution, taken at face value, they indicate -HsgUG0P _GFCF!GOP
that while both investment and housing 12%
investment fell during the 70s, at the same 10% ... ............................... ...............time housing's share of fixed capitalformation rose, because other fixed capital s. .- .did even worse. Gross Fixed CapitalFormation (GFCF) has declined from roughly S.
10 percent of GDP at the beginning of the 4X ------ ..........
period to 5 percent in the early 1980s.The picture is just as bleak when annual 2%7 72 74 76 7S 8O S2 S4 S6 aI8
levels as well as ratios are studied.Roughly, real housing investment per capita,and real GFCF per capita, were halved during the period. It is understandablethat when times are hard, people defer housing and other investments in thestruggle to buy food and other current essentials.
The overall investment picture looks better in the post 1983 period.However, the recent upturn in investment is largely due to increased publicinvestment. Private investment is still lagging. While official housinginvestment data for the past several years are not available, data presented inChapter 6 suggest that housing investment has picked up somewhat.
In addition to unfavorable long term trends, Ghana started out from lowlevels of investment. Table 1.1 presents some indicators of access to housinginfrastructure for Ghana and several other African countries. Over a quarter

OVERVIEW 3
of urban households lack access to piped water (house connections or standpipes)and over half lack adequate sanitation. As in most countries, the situation isworse in rural areas. In general, according to these aggregate data theproportion served in urban areas has been static while service in rural areashas improved somewhat. While international comparisons of this type are notprecise, Ghana appears to have made some limited progress at a time when theservices in other African countries were deteriorating rapidly (perhaps becauseof faster urban growth in some of the comparator countries).
Table 1.1: Housing Infrastructure Indicators, Selected Countries
Pet Urban Pet Rural Pet Urban Pct Rural Pct Urbanv. Access to w. Access to v. Access to v. Access to GNP Per Popu- Popu-
Water Water Sanitation Sanitation Capita lation lation
(1970) (1980) (1970) (1980) (1980) (1980) (1985) (1985) (1985)
Benin 94 26 15 20 48 4 $260 4.0 35
Burkina Faso 68 27 31 30 38 5 $150 7.9 8
Burundi 77 90 20 24 40 35 $230 4.7 2
GRANA 73 72 33 47 47 17 $380 12.7 32
Kenya 97 85 15 26 89 19 $290 20.4 20
Lesotho 100 37 11 14 13 14 $470 1.5 17
Mali 29 37 0 6 79 0 $150 7.5 20
Senegal 98 77 25 42 100 2 $370 6.6 36
Sierra Leone 75 50 2 16 31 6 $350 3.7 25
Source: Habitat Global Report on Human Settlements, 1987
These low levels and adverse trends have important implications fordevelopment generally as well as for people's housing consumption. Shelter isone of two capital assets applicable across the entire income distribution andin every geographic location, rural and urban (the other is human capital, inother words, peoples' skills and innate productivity). For many, particularlythose with lower incomes, housing is inseparable from other fixed capital, forexample, shops and workrooms. Also much productive infrastructure is shared byhousing and other productive activities (for exaple, water, transport, wastedisposal). In short, housing has many spillovers and many forward and backwardlinkages with other productive sectors.
It is important that, as the economy recovers, policies encourage efficienthousing markets. Regulatory reform can be a very powerful tool to reduceunnecessary costs, ultimately improving affordability. While the focus of thispaper will be on effects and possible changes in rent control, reforms in otherareas will also be discussed.

4
B. Summary of Findings
Key Findings and Their Generality
An important question to ask about any case study of a particular marketis its generality. Housing markets are, after all, local and diverse, evenwithin countries. And a maintained hypothesis of the overall research projecton Rent Control in Developing Countries is that rent control laws and theirenforcement vary from place to place, as do market conditions. This does notmean that every time and place is unique, and that hence generalization isimpossible, but rather that we should strive to understand which results arequite generalizable, and when understanding of the differences between marketspermits a new level of generalization.
A useful analogy can be drawn with the previous research project on HousingDemand in Developing Countries (see Malpezzi and Mayo, 1985). That projectdemonstrated that previous rules of thumb about housing demand were ofteninnacurate, stemming as they did from generalizations of observeid behavior ina few markets. But the project went further, constructing simple models whichpermitted more accurate prediction (from more 'sophisticated" generalization).
In a similar spirit, this rent control research project will produce casestudies of several other markets (Brazil, Egypt and India), anid a synthesisreport which will discuss the generalizability of findings in more detail. Herewe point out a few of the key findings from this case study along with commentsabout their generalizability:
(a) Ghanaian renters benefit from lowered rents but live in worse housingconditions than we would expect, even given their lowr incomes. InKumasi, the welfare loss from reduced housing consumption more orless outweighs the gain from lowered rents. The nature of theoffsetting effects are quite general; their rough equivalence is not.And not all of the reduction in consumption is due to rent control;there are other supply s:ide constraints on the housing market.
(b) Rent control reduces the internal rate of return to a typicalinvestment (a general result) from about 8 percent to zero (aspecific result). We constructed a simple model which can be usedto analyze controls' effects on profitability as well asaffordability for Kumasi and for other times and places.
(c) In Kumasi, a significant amount of rental housing, of very lowquality, was produced undler controls. This was during a time whenzero returns to housing wTere actually quite attractive relative tolarge, negative returns to many other investments. As the structuraladjustment improves the return to competing investments, especiallyfinancial ones, continued controls can be expected to further reducesupply. This illustrates an important general point, surprisinglyoften neglected: analys:is of profitability has to take actualinvestment opportunities into account.
OVERVIEW 5
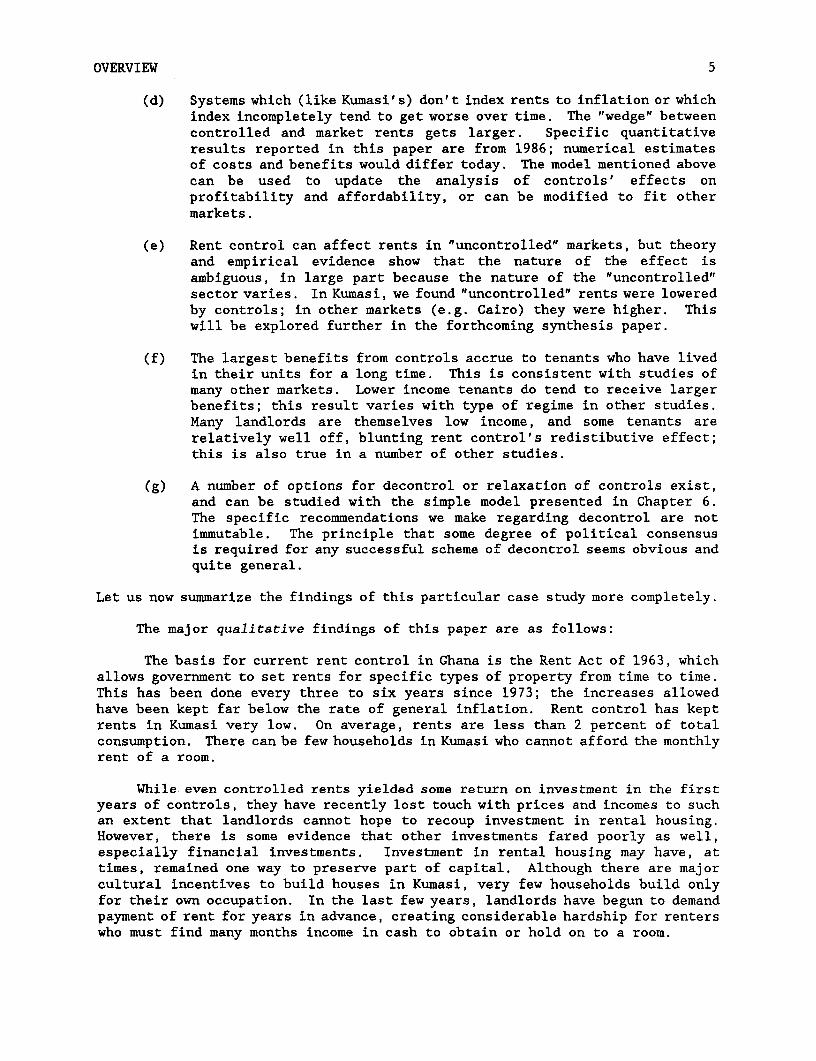
(d) Systems which (like Kumasi's) don't index rents to inflation or whichindex incompletely tend to get worse over time. The "wedge" betweencontrolled and market rents gets larger. Specific quantitativeresults reported in this paper are from 1986; numerical estimatesof costs and benefits would differ today. The model mentioned abovecan be used to update the analysis of controls' effects onprofitability and affordability, or can be modified to fit othermarkets.
(e) Rent control can affect rents in "uncontrolled" markets, but theoryand empirical evidence show that the nature of the effect isambiguous, in large part because the nature of the "uncontrolled"sector varies. In Kumasi, we found "uncontrolled" rents were loweredby controls; in other markets (e.g. Cairo) they were higher. Thiswill be explored further in the forthcoming synthesis paper.
(f) The largest benefits from controls accrue to tenants who have livedin their units for a long time. This is consistent with studies ofmany other markets. Lower income tenants do tend to receive largerbenefits; this result varies with type of regime in other studies.Many landlords are themselves low income, and some tenants arerelatively well off, blunting rent control's redistibutive effect;this is also true in a number of other studies.
(g) A number of options for decontrol or relaxation of controls exist,and can be studied with the simple model presented in Chapter 6.The specific recommendations we make regarding decontrol are notimmutable. The principle that some degree of political consensusis required for any successful scheme of decontrol seems obvious andquite general.
Let us now summarize the findings of this particular case study more completely.
The major qualitative findings of this paper are as follows:
The basis for current rent control in Ghana is the Rent Act of 1963, whichallows government to set rents for specific types of property from time to time.This has been done every three to six years since 1973; the increases allowedhave been kept far below the rate of general inflation. Rent control has keptrents in Kumasi very low. On average, rents are less than 2 percent of totalconsumption. There can be few households in Kumasi who cannot afford the monthlyrent of a room.
While even controlled rents yielded some return on investment in the firstyears of controls, they have recently lost touch with prices and incomes to suchan extent that landlords cannot hope to recoup investment in rental housing.However, there is some evidence that other investments fared poorly as well,especially financial investments. Investment in rental housing may have, attimes, remained one way to preserve part of capital. Although there are majorcultural incentives to build houses in Kumasi, very few households build onlyfor their own occupation. In the last few years, landlords have begun to demandpayment of rent for years in advance, creating considerable hardship for renterswho must find many months income in cash to obtain or hold on to a room.
6
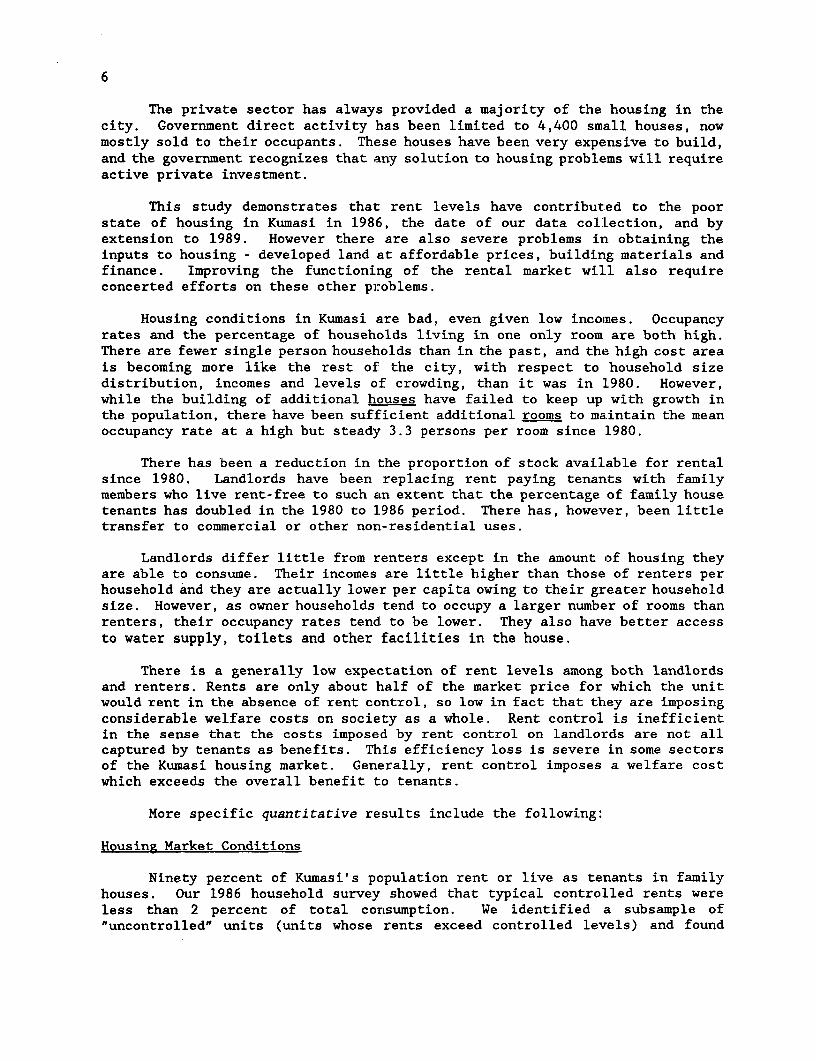
The private sector has always provided a majority of the housing in thecity. Government direct activity has been limited to 4,400 small houses, nowmostly sold to their occupants. Thiese houses have been very expensive to build,and the government recognizes that any solution to housing problems will requireactive private investment.
This study demonstrates that rent levels have contributed to the poorstate of housing in Kumasi in 1986, the date of our data colLection, and byextension to 1989. However there are also severe problems in obtaining theinputs to housing - developed land at affordable prices, building materials andfinance. Improving the functioning of the rental market will also requireconcerted efforts on these other problems.
Housing conditions in Kumasi are bad, even given low incomes. Occupancyrates and the percentage of households living in one only room are both high.There are fewer single person households than in the past, and the high cost areais becoming more like the rest of the city, with respect to household sizedistribution, incomes and levels of crowding, than it was in 1L980. However,while the building of additional houses have failed to keep up with growth inthe population, there have been suff-icient additional rooms to maintain the meanoccupancy rate at a high but steady 3.3 persons per room since 1980.
There has been a reduction in the proportion of stock available for rentalsince 1980. Landlords have been replacing rent paying tenants with familymembers who live rent-free to such an extent that the percentage of family housetenants has doubled in the 1980 to 1986 period. There has, however, been littletransfer to commercial or other non-residential uses.
Landlords differ little from renters except in the amount of housing theyare able to consume. Their incomes are little higher than those of renters perhousehold and they are actually lower per capita owing to their greater householdsize. However, as owner households tend to occupy a larger number of rooms thanrenters, their occupancy rates tend to be lower. They also have better accessto water supply, toilets and other facilities in the house.
There is a generally low expectation of rent levels among both landlordsand renters. Rents are only about half of the market price for which the unitwould rent in the absence of rent control, so low in fact that they are imposingconsiderable welfare costs on society as a whole. Rent control is inefficientin the sense that the costs imposed by rent control on landlords are not allcaptured by tenants as benefits. This efficiency loss is severe in some sectorsof the Kumasi housing market. Generally, rent control imposes a welfare costwhich exceeds the overall benefit to tenants.
More specific quantitative results include the following:
Housing Market Conditions
Ninety percent of Kumasi's population rent or live as tenants in familyhouses. Our 1986 household survey showed that typical controlled rents wereless than 2 percent of total consumption. We identified a subsample of"uncontrolled" units (units whose rents exceed controlled levels) and found

OVERVIEW 7
their median rent-to-consumption level to be .05. A simple cross country modelpredicted that the median rent-to-income level would be about .08 in the absenceof controls. It appears that the net effect of the biases on "uncontrolled"rents discussed in Chapters 4 and 5 is to lower "uncontrolled" rents.
Controlled rents are overwhelmingly in the range of 200 to 300 cedis permonth. The estimates of uncontrolled rents from the cross country model rangefrom 800 to 1300. These results are so strong that they could be described asa 'smoking gun."
Recently more and more households are paying rent in advance. While theincidence of advances was spotty in 1986 -- about 14 percent of tenants paid inadvance -- anecdotal evidence suggests that it is increasing and that landlordsare even pressuring existing tenants for payment in advance. Pressure foradvance payments causes particular hardship given the difficulty most Ghanaianshave in financing large lump sum payments.
Costs and Benefits of Controls
Using a model which permits comparison of controlled units at controlledprices (PcQc), controlled units at estimated market prices (PmQc), and estimatedmarket demand at market prices (PmQm), we find:
(a) renters pay a fraction of the estimated market rents for their units.The actual rent paid is only 43 percent of the estimated market rentin the indigenous sector and 52 percent in the tenement sector.Furthermore, while the controlled rents, PcQc, hardly vary, theestimated market rents, PmQc, vary with size and type of unit.Market demand, PmQm, varies even more.
(b) The median cost of the subsidy implied by these rent reductions isestimated to be about 274 cedis per month in the tenement and 301in indigenous sector. (All amounts in this section are in 1986prices).
(c) But households would (we estimate) spend even more on housing in theabsence of controls. Median estimated market demand, PmQm, is over1000 cedis in both sectors. Consumption of housing services has beengreatly reduced under controls.
(d) Rent control imposes a landlord cost (PmQc-PcQc) which exceeds thenet benefit to tenants in both sectors.
(e) The "transfer efficiency" (ratio of benefits to costs) is thereforelow. Under the most "favorable" assumption of the efficiency ofcontrols, the efficiency is 40 to 50 percent. Tenants receive netbenefits which are less than half the static cost to landlords. Ifthe price elasticity is in the order of -0.5, net benefits to mosttenants are negative; both landlords and (most) tenants are madeworse off by controls.

8
(f) While costs and benefits are large relative to rents paid, they aresmall relative to income!. The cost of the subsidy is usually in theorder of 2 to 3 percent of consumption. Net tenant benefits are, atbest, negligible compared to total consumption.
(g) These estimates of PmQm are smaller than those taken directly fromthe cross country model (above) but are of the same order ofmagnitude. This is not surprising since we also used the crosscountry estimates to "calibrate" our estimates of uncontrolled rentsdue to biases discussed above. While the exact results here wouldchange given different cross country estimates, t]he qualitativeresults presented would not change.
The bottom line, then, is that rent control reduces the rents thathouseholds pay, but the benefit of this rent reduction is more or less offsetby the welfare loss from underconsumption of housing. We estimate that existingunits of typical quality would have rented for about twice current rents in 1986,but that households would typically spend more than three times current rents -- implying higher housing consumption -- if supply was elastic.
Nominal prices have risen (roughly doubled) since 1986 while controlledrents remained fixed. In current prices, PmQm and PmQc would be roughly doublethe above estimates. Also note that while controlled rents are fixed at the samelevels for all cities and towns, market rents in Accra would certainly be higherthan in Kumasi while those in smaller towns would be less.
Distributional Issues
Benefits are negatively related to household income, suggesting that rentcontrol may be somewhat progressive; but the benefits are, again, small. Whenthe price elasticity of -.5 is used, only households in the lowest consumptionquartile receive positive net benefits on average. Smaller benefits -- or morenegative benefits -- for richer tenants come as no surprise since these areexactly those households with the largest welfare loss from low consumption ofhousing.
Long term tenants have the smallest estimated disequilibrium in consumptionand the largest benefits. Net benefits are still small compared to consumption.Note that the largest net costs are to recent movers. Even larger unmeasuredcosts are imposed on households who are constrained from moving at all.
Landlords are not all that much better off than tenants. The median oflandlord consumption is about 36 percent more than the median consumption of725 controlled renters (11,563) and roughly the same as 105 uncontrolled renters.Thus, while landlords are richer than tenants "on average" there is quite a lotof overlap. A quarter of controlled renters consume more than the medianresident landlord; a quarter of resident landlords consume less than the mediantenant.

OVERVIEW 9
Housing Supply
A survey of the number of houses in Kumasi in 1988 supports impressionsformed in 1986 that building had continued only slowly since 1981. Less than800 houses appear to have been added between 1982 and 1985 and only 900 between1986 and 1988, with the index for houses falling further behind that ofpopulation. However, the increase in rooms per house between the 1980 and 1986samples (supported by no increase in occupancy rates) gives some grounds tobelieve that extensions to existing houses have allowed the growth in rooms tokeep pace with population growth since 1980.
Many of the problems following from decontrol could be avoided if the supplyof new houses is increased, especially at the lower end of the market. Analysisof a number of developing countries by Ferchiou (1982) has shown that somedownward filtering of housing takes place but the shortage of accommodation formiddle income households tends to prevent its reaching the lowest income groups.Furthermore, the availability of low cost, appropriate local materials andtechnologies based on mud construction allow the lowest cost housing to be builtnew at a price most households can afford. If relatively low income householdscan be encouraged to build in local materials with local technology, rooms willbe added much more cheaply than is possible with imported cement-based materials.
Rent Control and Profitability
Rent control directly reduces profitability because it reduces the rentsa unit can command. But reduced rents also affect maintenance (anddepreciation), taxes and capital gains. These "indirect" effects can be largeand should be taken into account. We build such a model in Chapter 6, and studya series of hypothetical representative investments (using 1986 as the base yearof investment).
At a real discount rate of 10 percent, the present value of the controlledunit is about -1.3 million cedis. If the unit was uncontrolled, the presentvalue would still be negative, but the "loss" would be smaller - about -260,000cedis. We can interpret these numbers as follows. If investors could receivea real return of 10 percent on an asset with similar risks, they would prefersuch an investment over rental housing in either case. But clearly they wouldlose less in the absence of controls.
But in Ghana's disrupted economy there are a limited range of investmentswhich yield 10 percent in real terms. Returns to financial savings are, in fact,negative. With how high a rate of return could housing compete? The internalrate of return for a controlled unit is estimated at roughly zero. In otherwords, landlords could at least preserve capital with housing if otherinvestments were yielding negative returns. Without controls, housing couldcompete for capital with investments yielding up to 8 percent. Controls reducethe rate of return by about 8 or 9 percentage points. Such current investmentas exists is motivated more by capital gain (or more accurately avoiding capitalloss) and by nonpecuniary income (status conferred) than by current income fromthe unit.

10
If rents for new compound rooms were of the order of 1200 1986 cedis(compared to median estimates of 1050 cedis from the cost-benefit model) andafterwards they were indexed to general inflation, we estimate they would beaffordable to the top 40 percent of the income distribution. If rents forexisting units were to rise to 600 cedis (compared to median estimates of 575),they would remain affordable to virtually all income groups.
Other Market Imperfections
Rent control is not the only problem in rental or housing marketsgenerally. Other problems -- in land, infrastructure, finance, materials --adversely affect the market and drive costs up. They drive costs up higher forthe poor than for others.
Relaxation of rent control is necessary but not sufficient for expandingthe supply of rental housing. Relaxation/decontrol must be accompanied bymeasures to ensure a rapid supply response to the demand for rental housing, orelse rapidly rising rents could squeeze existing tenants and jeopardizedecontrol. Political consensus is, after all, required for successful change.
Of the major constraints on private rental housing, many -- land, finance,infrastructure, materials, building codes and standards -- are discussed brieflyin Chapter 2. While detailed discussion of each is beyond the scope of thisreport, the following points should be noted. Rental markets suffer from thesame constraints as housing markets generally, but there are also some whichaffect rental particularly (in addition to the obvious problem of rent controls).Among other collateral actions, it will be necessary:
(a) To pay particular attention to building codes, land use standardsand other regulations which discriminate against low cost compoundhousing. Land use regulations should be modified to permitcontruction of compounds in urban areas. Building in swish shouldbe permitted, subject to proper construction techniques.
(b) Not to discriminate against rental in the provision of serviced land.Owner occupancy should not be required for access to land in anyprogram designed to improve land availability (including sites andservices).
(c) Not to neglect finance for rental housing. It should be! ensured thatrules for lending do not discriminate (intentionally orunintentionally) against rental housing.
These and other actions need to be taken as complements to any decontrol program.Let us now turn to the analysis of several alternatives for decontrol.

OVERVIEW 11
Decontrol ORtions
There are a number of options which could be considered for removing orrelaxing controls. The main options are as follows:
(a) Blanket lifting: all rent controls are completely removed as of acertain date. This is the simplest method, but is very difficultpolitically and may lead to short run dislocations.
(b) Decontrol new construction: an obvious option which is beingundertaken in India, Brazil and a number of other markets. But newconstruction can still be inhibited unless government crediblyguarantees units will not come under controls later.
(c) Rents can also be immediately decontrolled for units which meetcertain standards, either now or after upgrading (for example, forunits which provide acceptable water supply and sanitation).Standards would have to be carefully chosen, however, to meetrequirements without imposing unneccessary costs.
(d) Floating up and out: controls are gradually relaxed, for examplerent rises are based on some multiple of CPI or wage index changes,until controls are no longer binding on most units. Then controlscan be abolished. This method can permit a smoother adjustment ifpotential landlords view the gradual program as credible.
(e) Vacancy decontrol: Units are decontrolled as they becomevacant. This method has been tried in some North Americanmarkets but may keep mobility down, with possible adverseeffects on housing and labor markets.
(f) Vacancy rate decontrol: particular markets are decontrolled as thevacancy rate rises above some threshold. But while controls (andother problems) remain, vacancy rates will probably remain extremelylow. How can vacancy rates increase while controls remain?
(g) Rent level decontrol: decontrol by market segment. Rents could bedecontrolled from the top down (the current system, with a thresholdof 1,000 cedis, embodies this to a limited extent). But such asystem can provide perverse incentives to raise rents above long runequilibrium levels in order to escape controls.
(h) Contracting out: landlord and tenant negotiate a payment to thetenant in return for his giving up the right to controls.
Of course these options are not all mutually exclusive. In many respectsfloating up and out has some a priori appeal because the market may take timeto respond, particularly given the current problems in input markets, etc.Blanket lifting carries the danger of a sharp short run rise in rents whichwould be reduced over time. The present value model mentioned above can be usedto study these alternatives.

12
Blanket decontrol, where all controls are lifted at one time, is thesimplest administratively. But some rents in Kumasi have fallen so far behindmarket values that rises could result in major dislocations, especially if otherhousing market imperfections initially impede the supply response.
How bad could this be? Suppose rents for existing units rose to (say)900 cedis initially instead of 600. Assume that only after five years does thetime path of rents fall to the long run equilibrium of 600 (in 1986 prices, i.e.they remain indexed to inflation). We estimate that under this scenario, in thefirst year the units are still affordable to the top four quintiles but not tothe lowest.
There is always a built in check on this process. Rents have to be paidby someone; so units' rent can only rise as high as the market will bear. Ourinitial "average" affordability estimate was 8 percent of consurmption, with anincome elasticity estimate of .6. This yields a predicted average willingnessto pay rents of about 11 percent for the bottom quintile. If initial rents forexisting units rose by half again als much as our estimate, this; would requirethe typical bottom quintile household to devote 15 percent of their income tohousing. If initially rents were double our best estimate, low incomehouseholds would typically spend 20 percent until rents came down to theirequilibrium levels.
Completely freeing rents for newly constructed units can only increasesupply. As noted, if a household is given a choice between remaining in anexisting unit and moving to an expensive new unit, they cannot be made worse offas they have the option to remain.
'Luxury" units renting for over C1000 are nominally exempt from controls.Given inflation since the date the ceiling was set, market prices for newlyconstructed rooms probably now exceed the CIOO ceiling for controls (at leastin Kumasi and Accra). But landlords still face the risk that the schedule ofcontrols will be revalued. Our conljecture is that credible decontrol of newunits and a firm plan for decontrol of existing units are required to buildinvestor confidence.
Revaluation whenever units turn over for new tenants could exacerbate thetrend for high advance payments and result in an even less mobile rental sectorthan at present. Renters in compound houses live in closer proximity to otherhouseholds than most tenancy groups in other countries, so large disparatiesbetween the rents paid by househoLders and those paid by their neighbours(varying according to length of tenancy) are likely to be socially unacceptable.
The most effective method for encouraging new investment while protectinglow income renters may involve a combination of decontrolling new constructionwith indexation of existing units faster than inflation to enable "floating upand out" of controls. The latter involves the transition from controlled rentsto market rents over a period of years. It is preferable to set a final dateby which controls will be withdrawn completely in order to convince landlordsthat the controls which have cost them so much will really be abolished.Indexation could provide a formula for determining the intermediate rent levels.

OVERVIEW 13
For example, rents could be increased annually by, say, the Consumer Price Indexplus a percentage of the previous year's rent until a set date when the finalincrease to market levels would be implemented. Any units reaching their marketlevel before this date would, of course, remain there. This is quite possiblefor many rooms in Kumasi where there are no services and physical conditions arepoor. This phasing would smooth the path of adjustment giving tenants who couldnot afford their current room at the market rent time to find suitablealternatives.
Suppose (1) rents were completely indexed to inflation and (2) real rentswere phased in as follows: real rents were doubled to 600 in the first year,800 the second, 1000 the third, then finally freed to find their free marketlevel. Landlord profitability is roughly the same as it would be under blanketdecontrol and so ultimately is affordability. Risk and uncertainty are reduced-- provided the decontrol is firm and credible.
Such a phase-in could prove more palatable to tenants. No system ofdecontrol is worth attempting which is not politically feasible and sustainable.Decontrol followed by recontrol does not do the market nor any participant anygood. Only if relaxation is perceived as fair by a substantial number of bothlandlords and tenants will it succeed. Only if the government's commitment tothe announced schedule is firm will landlords supply more housing.
It cannot be denied that many households would be shocked to see theirrent burdens double for existing units. Yet the present system is clearly notworking. Government can choose between:
(a) Low rents accompanied by continuing overcrowding, insanitaryconditions and reduced labor mobility, which will probably worsenas adjustment provides other investment opportunities to landlords,and
(b) Increases in rents which are not popular with tenants but which canmitigate the problems above, if combined with action on otherimpediments to the supply of housing.
Alternatives for decontrol exist. While there is certainly room fordiscussion of other alternatives, results presented above suggest decontrollingnew construction, indexing rents for existing units to general prices andletting real rents for existing units rise gradually has some appeal.
Once again, it cannot be overemphasized that whatever option is chosen,actions must be taken to ensure elasticity of housing supply so that increasesin rents are accompanied by an increase in production. This requires that rentcontrol is seen as one part of a housing strategy which also aims to releaseresources on the supply side - land, infrastructure, materials, and finance -so that supply and demand can reach equilibrium through increases in both thescale and the variety of the housing stock rather than through greatly increasedprices.

14
C. Suggestions for future work
This study presents empirical evidence from one city in Ghana while rentcontrol is practiced in all the regional capitals. It is quite possible thatthe distortions caused in other cities may be very different from those foundin Kumasi. There may especially be differences between the capital, Accra, andother cities and between the larger cities and smaller towns. There isimpressionistic evidence to suggest that the port city of Sekond:L-Takoradi isnot growing in parallel with the other cities, probably because of the declinein its port functions. Rent control distortions will differ irn differentlyevolving housing markets. There is considerable scope for modelling rentcontrol in other cities, in Ghana as well as other countries.V2
There could also be much to learn from extended examination of the Kumasidata. Further disaggregation by geographical area in the city and type ofrental unit (those in self-contained units and those in rooms). More detailedwork could be carried out on how controls affect specific aspects of housingconsumption (crowding, access to water and sanitation, etc.) Perhaps mostobviously this paper has focused on controls in the private rental market;analysis of public units is also a high future priority. Tenure choice modelswould also be fruitful.
Policies adopted in developing countries aimed at increasing owneroccupation through sites and services and upgrading have undoubtedly added muchneeded potential for home ownership. However, it appears that rental remainsan important mode of tenure and an important investment vehicle and source ofincome for a significant number of the urban population. Many countries hinderthe growth of rental markets in low income housing schemes for fear ofexploitative landlordism. The Kumasi experience shows that small-scalelandlords may be far from exploitative; indeed renting a few rooms may providethem with their only means of affording ownership and, therefore, the essentialmotivation to add to the housing stock. Do such small-scale landlords differfrom landlords who make their living out of housing? Do landlords who occupypart of a house treat tenants differently from landlords who live elsewhere?How are tenants chosen? Do ethnic, religious or status considerations affecthouseholds' access to rental housing in Africa? What are the effects whenhousing allowances are paid as part of formal sector wages?
Another interesting area for research is the changing relationship betweenhousing and culture. There are probably many parts of the world where housinghas so many symbolic meanings that housing policies which ignore this will fallfoul of what might appear to outsiders at first sight to be illogical reactionsby households. It might well be that subsidies intended for housing are spent,instead, on preparation for death, or that investment in housing in the urbanarea where a household lives is foregone in favor of investment in a house ina home village. Such issues are central to understanding housing markets in anera when governments must rely on private investment.
/ In addition to this case study, the World Bank's research project on RentControl in Developing Countries (RPO 674-01) is producing case studies ofCairo, Egypt; Rio de Janeiro, Brazil, and Bangalore, India.

OVERVIEW 15
A further issue which would bear more detailed examination is therelationship between renting and income generation. Where the place ofresidence forms a major potential for business activity -- such as storage, orsmall scale manufacturing and services, especially in cooked food preparationor laundering, retailing -- any inhibitions on renters in comparison to ownersmay have important consequences on the economy.31 There are also links intohousing design here, where the layout of rooms can help or hinder small scaleenterprise by owners and renters.
A NOTE ON EXCHANGE RATES
Ghana's currency has had what Killick (1978) calls a bewilderingly complex history. UntilIndependence in 1957, the currency used in the Gold Coast was the Pound Sterling (E). Until 1965independent Ghana used the Ghana Pound (EG) with shillings and pence (d) as minor units. Their valuewas at par with Sterling. In July 1965 the currency was decimalized with the Cedi being equal to 100d(C2.4 per £ Sterling, C1.17 per US$). The minor unit was named the Pesewa (p).
In February 1967 the Cedi was revalued to £GO.50 (10 old shillings), renamed the New Cedi (NC)and exchanged for C1.20 internally. It was valued externally at US$1.40. In February 1972 the "New'was dropped, and it again became the Cedi (C).
Since then various changes in the official rate have taken place as follows:
In July 1967 to US$0.98;In December 1971 to US$0.55;In February 1972 to US$0.78, or US$1 - C1.28;In 1978 to US$1 - C2.75;
Since the PNDC government came to power in December 1981, the Cedi has been devalued by stagesto US$1 - C90.00 where it stood in April 1986 when the new survey was carried out. In September, 1986a Second Foreign Exchange Market (SFEM) was instigated in which the Cedi is auctioned each week. ByApril 1988 its SFEM value was C185 per US$.
Exchange rate conversions, always problematic, are even more difficult under such condition. Intheir review of exchange rate conventions for their cross country comparisons Malpezzi and Mayo (1985)noted that in many LDCs black market exchange rates are also poor guides to equilibrium exchange ratesbecause of high transactions costs (including jail), thinness of the market, and the fact that we aretrying to compare non-traded goods with exchange rates driven by tradeables (the internal relativeprice of tradables and non-tradeables also subject to significant distortions). Indeed, Kravis Hestonand Summers (1982) has demonstrated that official (let alone black market) rates often understate theforeign currency price of non-tradeables relative to purchasing power parity (PPP) rates. That is,PPP rates were typically the highest rates (convertible currency per local currency unit), followedby official rates, followed by black market rates.
In general, Malpezzi and Mayo chose official exchange rates for pragmatic reasons; official rateswere readily available (black market and PPP rates are not so readily available, and different methodsof constructing them give quite different results). They included comparisons of Ghana using 1981 data(before the PNDC reforms). Ghana was the one exception in their study, because the official rate of2.7 cedis to the dollar was so overvalued relative to both black market and all PPP measures, so anequilibrium rate estimated by (ref) of 60 cedis to the dollar.
Generally in this report we use local currency amounts and avoid conversion whenever possible.An important and necessary exception is when we make comparisons to Malpezzi and Mayo's cross countrymodel in Chapter 6. In this report rates of US$1 = C30 are used for 1980 comparisons; US$1 - C60 for1981; US$1 - C90 for 1986 comparisons. The recent devaluations have been accompanied by further fallsin the black market rate until it stood at about US$1 = C250 in April, 1986.
.i./ See Kahnert (1987).

I
II. HOUSING MARKETS AND RENT CONTROL IN GHANA
A. Introduction to Urban Housing in Ghana
Typical Designs
The urban housing stock in Ghana is dominated by the traditional compoundhouse which has developed, in several stages, from relatively simplepitched-roofed huts ranged around a courtyard, to an apical form seen in therelatively sophisticated quadrangle with cement block decorations, pillaredverandas and the distinctive miniature gable junction to the hipped roof. Singlestory compounds tend to be almost square and about 30 meters along each side inKumasi. Typically, ten to fifteen rooms range round three sides of the courtyardfacing inward and usually having a veranda on the courtyard side. The mainentrance is usually at the side and takes the form of a door which can be lockedat night securing the whole compound. The fourth side usually contains a bathroom(simply a room with a small drainage hole at the base of the wall), a kitchen(a shelter open on the courtyard side and used for storing utensils) and a bucketlatrine. Most houses are now built of cement blocks rather than the traditionalcourses of rammed earth, known locally as "swish" or "atakpame" after theTogolese home-town of the masons. Windows are mainly wooden louvres manufacturedlocally, though some now use glass louvres in wood or metal frames. (See Rutter,1971; Schreckenbach, 1982; and Tipple, 1987a for further detailed analysis ofhouse forms in Kumasi).
In the main towns there are a considerable number of two and three storycompound houses in which the upstairs rooms open off continuous balconies aroundthe courtyard, reached by an internal staircase.
In both types of compound houses, households rent rooms, singly or inpairs, and share whatever kitchen, bathroom, toilet and water supply exist inthe house.
B. Overview of Ghanaian Housing Markets
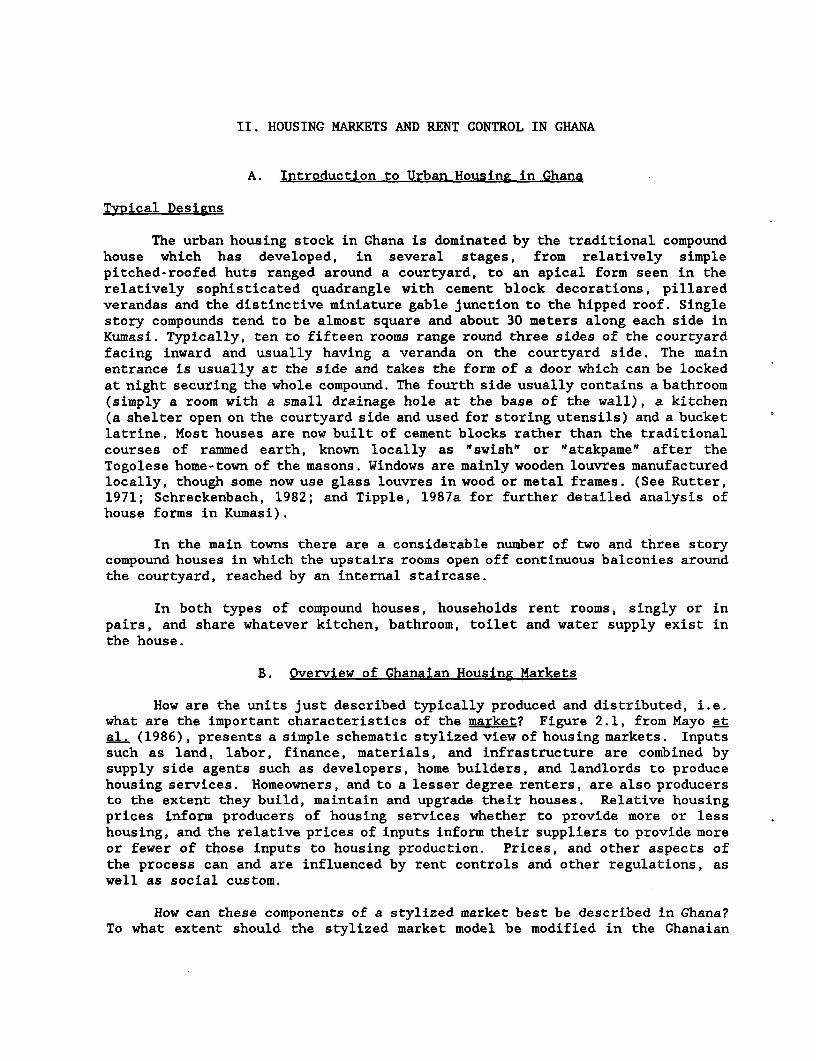
How are the units just described typically produced and distributed, i.e.what are the important characteristics of the market? Figure 2.1, from Mayo etal. (1986), presents a simple schematic stylized view of housing markets. Inputssuch as land, labor, finance, materials, and infrastructure are combined bysupply side agents such as developers, home builders, and landlords to producehousing services. Homeowners, and to a lesser degree renters, are also producersto the extent they build, maintain and upgrade their houses. Relative housingprices inform producers of housing services whether to provide more or lesshousing, and the relative prices of inputs inform their suppliers to provide moreor fewer of those inputs to housing production. Prices, and other aspects ofthe process can and are influenced by rent controls and other regulations, aswell as social custom.
How can these components of a stylized market best be described in Ghana?To what extent should the stylized market model be modified in the Ghanaian
18
context? The next few sections briefly Figure 2.1: How Housing K-irkcts Workdiscuss demand, and the supply-sideconstraints: land, infrastructure,finance, and the regulatory framework.The particular aspect of the regulaltory Inputs Production Demandframework under study, rent control, is Land p Developers p Renters
R Deeoprthen discussed in some detail. Finance - Builders Homeowners
Infrastructure -c- Landlords .C- (Income &Labor E Homeowners E Population)
Demand Materials s .
Kumasi's population has beengrowing at a rate of about 2.9 percentper annum since 1981. The most recentpopulation estimate is about 720,000 for 1988. However, referring again toChapter 1, real incomes have been falling. As real incomes fell for a decadeand a half, housing investment -- as with other investment -- fell faster.Whenever real incomes fall, investment is naturally postponed as people seek tomaintain a minimum level of consumption, especially of food. Now that realincomes are again rising and the investment climate is becoming imore generallyfavorable, investment -- including but not limited to housing investment -- willpick up faster than incomes, particularly if investor confidence is; restored thatthe reforms associated with the adjustment are permanent.
Land
The current land delivery system is a mixture of traditional and modernsystems; furthermore, there are significant regional differences in how landmarkets operate. A highly simplified description of current practice in Kumasiis as follows. Ownership of almost all land is vested in either the Stool orthe State; in the Kumasi area about 80 percent of land is still under the controlof the stool. Various use rights are held by different kinship groups andindividuals, including people not of Asante lineage. These rights are typicallyassigned by Asante chiefs on behalf of the Stool; such rights are granted to non-lineage members after discussion with appropriate members of the Stool hierarchy,and ceremonies associated with the granting of rights include the payment ofceremonial "drink money." Only recently has drink money become more than anominal payment. Individuals then pay a recurrent ground rent charge, whichremains nominal. Ground rents are shared by government and traditionalauthorities.
Land transactions will general'Ly be registered with both the Asantehene'sLands Officer as well as the governument's Lands Commission Secretariat. Itappears that the system is in transition to a leasehold market of sorts.Freehold land tenure is still rare in Kumasi, less so in Accra. Once rights areassigned, especially for housing, it appears they are rarely traded. Morespecifically, since most land in the city of Kumasi itself was assigned yearsago, relatively little change in land use is observed over time; densities andland use patterns do not follow Western patterns.
The traditional land leasing system operates as follows: a prospectivehouse-builder obtains land on lease by approaching the chief in whose care theland required rests. A tri-partite agreement is entered with the chief and the

HOUSING MARKETS AND RENT CONTROL IN GHANA 19
Asantehene, who act on behalf of the members (living, dead and yet to be born)of the lineage who own the right to use that land. A 99 year lease is thenobtainable on payment of a tribute to the ancestors - the price of a bottle ofschnapps for libation and an animal for sacrifice - called "drink" - which isdivided between the local chief and the Asantehene in the proportion of 2 to 1(see Tipple, 1983 and 1984a for further details). Payment of drink money tothe local chief does not guarantee eventual success in gaining the lease, noris it returnable in the event that the lease is not awarded. Furthermore, this"drink money" traditionally does not represent a market price for the lease; noreceipt is expected or given, it is merely a courtesy payment. In recent years,however, the amount demanded in drink money has grown to represent some measureof value. In the high cost part of Ayigya, opposite the University main gate,a plot which attracted drink money of C2000 ($730) in 1980 would require aboutC320,000 ($3,600) in 1986 (personal communication, S.B. Amissah, Director of theLand Administration Research Centre, Kumasi), an amount equivalent to 20 monthsmedian consumption of owner households. Asabere (1981) found that non-Asanteshad to pay almost twice as much drink money as Asantes and that their paymentswere more related to plot size than those of Asantes.
The traditional leasing system is still virtually intact in Kumasi. Whenland is required, even government agencies pay at least lip- service to thetraditional methods of leasing land. There are over 100 chiefs in the city whohave the right to allocate land for housing in Kumasi City Council's area andwho, often regardless of official "sector layouts" made for peripheral areas ofthe city, continue to plan the form of their settlements (Stanley, 1975),allocate land, and allow the construction of houses in traditional mud-basedmaterials.
Traditional house forms, built on traditionally leased land, allowrelatively low income householders to build for themselves and with rooms torent to outsiders. Until the early 1970s, this was still profitable.Schildkrout (1978, p.113), writing of her experience in 1969, states,
"Houses represent a reliable and important source of income, a safer form ofinvestment than transport... "
The leasing system in Kumasi is generally applicable to the forest regionof Ghana. Similar systems are followed in the North, but in the coastal plainand Volta region, patrilineal families without a paramount leader as strong asAsantehene operate the system in a more chaotic fashion causing many moreproblems of clouded titles. Accra has more fee simple ownership than otherareas, but title disputes are quite common. The new Land Title RegistrationLaw, 1986 (PNDC Law 152), should succeed in reducing such problems over the nextfew years. However, the land system is probably best described as in flux.Asabere (1981) and Tipple (1987) provide additional background.
20
Infrastructure
The government has identified inadequate urban infrastructure as a seriousconstraint on housing and on the economy generally. Roads are poorLy maintained,sanitation is often rudimentary, water and power supplies are often intermittent.Water and sanitation conditions will be discussed in more detail as part ofhousing conditions below. A few indicative measures: in Kumasi only 20 percentof the road network is currently rated serviceable;I/ there are still anestimated 4000 bucket latrines serving many thousands of city residents;2/ andpoor infrastructure affects other productive sectors as well as housing, e.g.thousands of small scale enterprises have crowded into marginal, flood prone landwith few infrastructure services, reducing their potential productivity.
Finance
The central problem faced by the housing finance system in Ghana is theneed for a stable macroeconomic environment. Chapter 1 documented that the pastdecade and a half has witnessed extreme instability in incomes and the pricelevel. Under such conditions the financial system has deteriorated markedly.Figure 2.3 shows that real interest rates on financial assets were sharplynegative during much of the period.
Figure 2.2: Nominal Interest Rates Figure 2.3: Real Interes3: Rates
25%
-mDeposit Rate -Ln {n(Property)
2DS ......... /.. ...............
5 A < 4/ ~~~~~~~ ~~~~-50% -- ....... .......
5% ..,.,...........\ (~~~~~~~~ o;7 DepstR -1DO X ....... .... .................
_- Len an3 Properjy), , , , , ,
70 12 74 18 78 80 82 84 8b 88 7 72 74 76 78 80 82 84 86 88
In addition, during the political turmoil surrounding a change ofgovernment in 1979, households with savings above modest cutoffs foulnd themselvesvetted and in some cases their savings confiscated (restitution was later madein many cases). Ghanaians have fled the financial system as real financialreturns plummeted and perceived risks increased. As real incomes fell (Figure
L/ Extensive improvements in Kumasi's road network are currently underway.
2/ Bucket latrines are particularly poor systems of urban sanitation. Animproved low cost system, the Kumasi Ventilated Improved Pit Latrine (KVIP)was invented in Kumasi, and is now in use world wide.
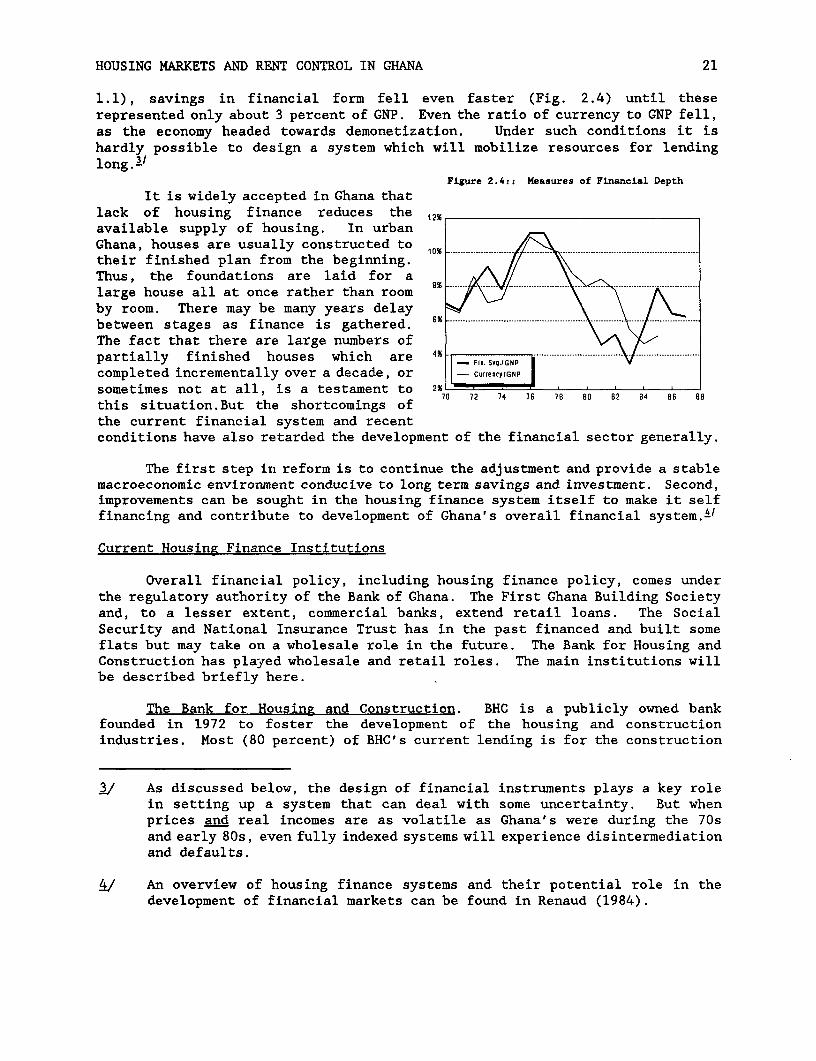
HOUSING MARKETS AND RENT CONTROL IN GHANA 21
1.1), savings in financial form fell even faster (Fig. 2.4) until theserepresented only about 3 percent of GNP. Even the ratio of currency to GNP fell,as the economy headed towards demonetization. Under such conditions it ishardly possible to design a system which will mobilize resources for lendinglong. 3/
Figure 2.4:: Measures of Financial Depth
It is widely accepted in Ghana thatlack of housing finance reduces the 12X
available supply of housing. In urbanGhana, houses are usually constructed to .. .their finished plan from the beginning.Thus, the foundations are laid for alarge house all at once rather than room % ......by room. There may be many years delaybetween stages as finance is gathered. 6% ............-------------------------- ...
The fact that there are large numbers ofpartially finished houses which are 41 - Fin. Svg.lGNP ...........................................
completed incrementally over a decade, or I- Currency(GNPI
sometimes not at all, is a testament to 2x 7 72 74 7 78 80 82 84 8b 88
this situation.But the shortcomings ofthe current financial system and recentconditions have also retarded the development of the financial sector generally.
The first step in reform is to continue the adjustment and provide a stablemacroeconomic environment conducive to long term savings and investment. Second,improvements can be sought in the housing finance system itself to make it selffinancing and contribute to development of Ghana's overall financial system.A'
Current Housina Finance Institutions
Overall financial policy, including housing finance policy, comes underthe regulatory authority of the Bank of Ghana. The First Ghana Building Societyand, to a lesser extent, commercial banks, extend retail loans. The SocialSecurity and National Insurance Trust has in the past financed and built someflats but may take on a wholesale role in the future. The Bank for Housing andConstruction has played wholesale and retail roles. The main institutions willbe described briefly here.
The Bank for Housing and Construction. BHC is a publicly owned bankfounded in 1972 to foster the development of the housing and constructionindustries. Most (80 percent) of BHC's current lending is for the construction
i/ As discussed below, the design of financial instruments plays a key rolein setting up a system that can deal with some uncertainty. But whenprices and real incomes are as volatile as Ghana's were during the 70sand early 80s, even fully indexed systems will experience disintermediationand defaults.
An overview of housing finance systems and their potential role in thedevelopment of financial markets can be found in Renaud (1984).

22
industry although, as will be seen in the discussion of the housing fund below,BHC may take on more responsibilities for end user and other housing finance inthe future. Among other issues wlhLich would have to be addressed for BHC inparticular as well as the system in general are the improving mortgageorigination and servicing, new instruments, improving the resource mobilizationside of housing finance, the need to separate commercial and development bankingfunctions, and ways to improve appraisal practices.
First Ghana Building Society. FGBS dates from 1956. Formed in responseto a U.N. mission's recommendation about the need for a specialized housingfinance institution, FGBS is currently almost moribund. Negative real interestrates ensure that deposits are not a significant proportion of the sources offunds for FGBS. Government provides the bulk of capital (recently about C217million). A total of only 779 loans are presently outstanding, valued at C143million. While detailed records were not readily available, it appears that asfew as four loans have been made in some past years, and by any measure few loansare currently being made.
Depositors are paid 6-9 percent (compared to commercial banks which pay15 percent). Loans are at variable rates (presently 20 percent). Loan termsvary between 1-30 years depending on the age of the person (FGBS's policy is thatloans should be amortized before the borrower reaches retirement aLge). A maximumloan of C500,000 is allowed up to a maximum of 80% of building value. Generally,payments records on loans are reportedly good and there have been no recentforeclosures. But in the current rmacroeconomic environment FGBS is obviouslyand severely constrained by their deposit and lending policies.
Social Security and National Insurance Trust. SSNIT is a provident fundwhich is currently in the process of converting to a pension scheme.51 Begun in1965, the Trust's status as a provident fund was always meant as a temporaryexpedient, but conversion was delayed by political issues. Howetver, given thefixed defined benefits and high recent inflation, the value of provident fund
.2./ Briefly, a provident fund is a mandatory savings scheme for workers whichpays a lump sum distribution under certain predefined conditions. Apension fund pays out periodically, based on actuarial estimates of aparticipant's expected lifetime. Either kind of system can be fundedactuarially, or pay-as-you-go. When participation is mandatory, any ofthese systems can be analyzed as a tax, although the degree of implicittaxation depends on the way the benefit is defined and calculated.Detailed discussions are beyond the scope of this report; see Wallich(1983) for more details. For more information about the Ghanaian systemand proposals for change, see SSNIT (1987).

HOUSING MARKETS AND RENT CONTROL IN GHANA 23
distributions has dwindled to the point where a consensus was reached on the needfor reform.61
As SSNIT attempts to convert to an actuarially based pension fund, itrequires long term investment vehicles which can preserve the real value of itsparticipants capital. There is a confluence of interest between SSNIT's needfor long term assets and the need to mobilize more long term funds for housingfinance. As is well known to those involved, the details of how funds arechanneled will make a critical difference in the viability of the pension fund(and hence of the supply of loanable funds).
In the past, SSNIT has also played a role in the direct construction ofapartments, but their management believes this has not worked out. They arecurrently completing unfinished units and selling off the inventory, so we willnot discuss them further here.
Other Financial Intermediaries Commercial banks, credit unions, insurancecompanies, etc. don't currently lend much for housing. This is not surprisinggiven the risks of lending long in such a volatile economy. Less than 5% oftheir total loan portfolio invested in housing. Generally the banks arereluctant to finance housing projects as their deposits are short term and unlessthere is access to long term funds they will not lend long term. The CentralBank sets credit ceilings for the banks; these are absolute and not related asa percentage of deposits. These limits are reviewed quarterly and there seemsto be little incentive for the banks to increase deposits by encouraging savings.
Little is known about Informal Sector Housing Finance in Ghana. Again,the prevalence of unfinished dwellings suggests that during the economic climateof the past two decades this system did not function particularly effectively,at least in financing housing.
In summary, under present policies the formal housing finance systemcontributes little to either financial intermediation or the housing sector.In general Ghana's other primary housing finance institutions need to bedeveloped and strengthened. Major changes would be necessary, not only inpolicies (such as interest rates paid to depositors, lending policies) but inthe institutions' cultures. Cutting dependence on government funding andchanging the incentives faced by its management are necessary step to effectsuch a shift. Access to other sources of funds, including secondary mortgagefacility could help, but the most important resource mobilization issue is toraise deposit interest rates to more competitive levels. In the absence ofother policy changes, preferential access to a proposed housing fund wouldprobably have little effect.
Of particular interest to the present study is the fact that of the veryfew formal housing finance loans made, virtually none appear to have been madefor rental housing. This outcome may be due to one or more of three causes.First, specialized lenders may be more ready to lend to households purchasing
i./ According to SSNIT's Proposals for Conversion of Social Security ProvidentFund, in 1986 average retirement benefits amounted to only 11,000 Cedis.
24
Western style single family houses for their own use because of formal orinformal policies restricting such lending on social or other grounds. Whetheror not this is the case, rent controls and associated regulations reduce thecollateral value of rental housing and increase landlords and lenders' perceivedrisk. Finally, as we saw above the financial system in Ghana has not performedwell during the turbulent 70s. We will return to these issues in the finalchapters of this report.
The Regulatory Framework
A number of regulatory issues arise in addition to those already describedand rent controls (discussed below). For example, Ghanaian building codes datefrom the colonial period and are based on British practice. In practice codeshave been interpreted as proscribing traditional materials ("swish," compactedearth faced with plaster) within the city limits, despite their low cost anddurability. Swish houses, if properly maintained, will last a century or more.Other building and land use regulations, not detailed here, are generallyrestrictive and not consistent with traditional housing construction,particularly compound houses. For example, within the city of Kumasi, planningcodes prescribe a plot coverage of one-third, suitable for a Western style singlefamily house but not for a compound.
The traditional method of construction uses 0.5m. high courses of rammedlaterite, known as swish or atakpaEae, with a thin plaster coating inside andout, and walls of corrugated iron or aluminum sheeting on roughly sawn rafters.Louvered windows and doors are made from local wood in wooden frames. The costof building, based on an experimental four roomed design orig:Lnating at theUniversity of Science and Technology, can be estimated for December 1985 as atleast Cll,OOO per square meter. Thus a 12 sq. m. room would cost in excess ofC130,000 ($1,444) This amount represents 10.4 months medlian householdconsumption or 58 months minimum wage.
We will return to some of these issues in the last Chapter. However themain purpose of the present paper is an analysis of rent controls, to which wenow turn.
C. Chronology of Rent Control in Ghana
Rent Control before 1963
As with many other countries (UN, 1979), rent controls started in Ghanaduring the Second World War when the Gold Coast began to suffer the effects ofinflation. In response to this, the Defence (Rent Restriction) Regulations of1942 made it an offence for anyone to increase rents above those of 3rdSeptember, 1939 except where an assessment had been made by a Rent AssessmentCommittee. Further, no- one could be evicted except by Court Order (Gold Coast,1951a).

HOUSING MARKETS AND RENT CONTROL IN GHANA 25
Similar regulations in 1943 required the Rent Assessment Committee to fixa fair and reasonable rent for any class of premises and introduced the conceptof a "Standard Rent" for various types of properties. These early, and ratherhurried, pieces of legislation have set a pattern for rent control ever since:rents are fixed at specific levels for the most common types of property and anyother accommodation can be let at a rent assessed by a body appointed to do soor, in some cases, by agreement between tenant and landlord.
The Mate-Kole Committee appointed to enquire into rentals (Gold Coast,1951a) indicated that the rent controls were being flouted by landlords who werefrustrated at the unrealism of "standard rents" which were mainly fixed atSeptember 1939 levels. The Report therefore declared that the standard rentswere quite uneconomical in post-war times and should be re-assessed accordingto valuations used for property rates assessment. Furthermore, rents shouldinclude a rate payment over and above the controlled rent.
Throughout the Mate Kole report, the landlords were not cast asdyed-in-the-wool villains. While their efforts to avoid some aspects of controlswere condemned, it is evident that the Committee appreciated their problem. Thehousing shortage was acute in the big cities, building materials were scarce andexpensive -- 200 or 300 per cent more costly than in 1939 -- and tenants weregenerally badly informed of their rights and, thus, easy prey. It was recognizedthat scarcity in any commodity bred black-marketeering. The crux of the problemwas seen to be shortage of supply. This was being manifested in the letting oflatrines and kitchens as living rooms, increasing occupancy rates, and theinability of tenants to resist paying rents which were illegal. The committeewas clear that rent control alone could do no good without an increase in thesupply of houses.
At this time, government's stated policy contained probably the greatestelement of direct government involvement in house provision and the leastreliance on private investment of any period before or since. Estate buildingon sites recommended in the 1945 draft plan for Kumasi (Fry and Drew, 1945) wasin full swing. Kumasi had 4,035 houses in 1948 (Gold Coast, 1948) and thebuilding programme lasting from 1945 to 1955 added approximately 2,500 smalldwellings.71 The major thrust of the 1951 Development Plan was building estatesof small dwellings for workers and encouraging people to build their own singlehousehold dwellings. Thus a policy which prevented landlords making much profitfrom house-letting may be understandable at the time if a little shortsightedin the light of a long-standing housing shortage (Gold Coast, 1951a and 1951b).It can be seen below, however, that later rent legislation has failed tosignificantly change this stance even though later government policy had to admit
Z/ In this paper a dwelling is a residential structure intended to be usedby one household and which has its own means of access. A house is aresidential structure intended for more than one household in which allor some of the households share a common access. This distinction hasbeen made because, when households occupy their accommodation on a roomby room basis in compound houses, the dwelling becomes an unusable termexcept in buildings intended as single household units.

26
to the heavy reliance on private investment by landlords (Ghana, 1959, 1964,1968, 1970, 1971, 1975 and 1977) and did little to reduce it.
The 1952 Rent Control Ordinance (no.2 of 1952), which followed the MateKole Report, modified "standard rent" to that rent which was paicd on 1 January,1948 or such as had been fixed by rent control, and withdrew the £100 p.a. limitso that rent control applied to all residential property. The 1952 Ordinancetidied up the law on rent in advance, evictions, etc., but did not depart in anymajor way from the idea, implicit in previous enactments, that rent should bestatic except under circumstances special enough to merit the attention of aCommittee. The Rent Control (Amendment) Act, 1960, amended the "standard rents"to those charged on 1 July, 1960.
Rent Control between 1963 and 1979
The Rent Act, 1963 (Act 220) has formed the basis of rent control for thelast 23 years being only modified by later legislation, not repealed. It containsprovisions not only for setting rents but also for ordering the relationshipbetween landlord and tenant: which have been modified separately in succeedinglegislation. A summary of the provisions and their modifications can be seenin Table 2.1. In this section, a summary of controlled rents will be presented.There will then be a discussion of the provisions of the law as they affectlandlord-tenant relations and houses built by government agencies.
Under the 1963 Rent Act, the "standard rent" (ie, that paid in 1948), wasrenamed the "recoverable rent" and incorporated as the basis of rents to berecovered by landlords. Where property was new since 1960, or material changeshad been made to the premises, or there was cause for dispute, rents were to befixed by the Rent Officer taking into account the following:
(a) rateable value,(b) land value,(c) the rates payable,(d) recoverable rent assessed for similar premises where they have been
assessed by the minister (see below),(e) estimated cost of repairs or maintenance,

Table 2.1: Rent Control Measures, 1963 to 1987
Haximum advancesRent levels Property (monthly Valid reasons subletting
Shared (1) Exclusive Excluded tenancies) for eviction Govt.
1963 'Recoverable rent' based on 1948 None 1 month Landlord could IllegalAct 220 levels, new rents fixed according evict on grounds
to standard of property (see note 2) in note 3
1973 C3.50-7.50/roomn by negotiation Income above no chanLge no change Allowable onNRCD 158 Cl, 000/annum terms set out
in note 4
1979 C20/room 27p - 34pIsq.ft. None no change no change profit marginAPRCD 5 or by negotiation raised to 25X
1982 C20/room by negotiation None no change None unless land- No prof it allowed.PNDCL 5 C50/room & hall lord had suppLied Illegal sub-letting
rent card leads to forfeiture
1986 C200-300/room by negotiation Rent above no change None until March 25X profitPNDCL 138 C300-400/room C1,O000lmonth 1987 unless needed restored£LI 1318 & hall for owner's rela-
tives. NO Changethereafter
Notes:1. Variations are according to materials used in the walls (see text).
2. Where property was new since 1960, or material changes had been made to the premises, or there was cause for dispute, rents were to be fixed by the RentOfficer taking into account the following: (a) rateable value, (b) land value, (c) the rates payable, (d) recoverable rent assessed for similar premiseswhere they have been assessed by the minister (see below), (e) estimated cost of repairs or maintenanxce, (f) amount of rent for like premises, (g) currentrate of interest charged by the Ghana Commnercial Bank for overdrafts, (h) obLigations of Landlord, tenant or other interested parties under the lease,(L) justice and merits of each case (Section 14).
3. Until and including the 1963 Rent Act, the grounds on which tenants could be evicted were broadly as follows:(a) one month's rent arrears, (b) Any other of the tenant's obligations being neglected, (c) The tenant or anyone living with him causing a nuisance,(d) A convilction for using the premises for immoral or Illegal uses, (e) Waste or damage of the premises by a tenant, (f) The tenant having given writtennotice to quit and the Landlord having acted upon it by selLing or letting, (g) Where the premises are reasonably required by the landlord for occupationby himself, his famlly, or his employees (if used to house employees), (h) Where the lease has expired and six months' notice has been given by thelandlord, (i) Where the lease has expired and the landlord intends to: (i) pull down premises and construct new ones, (ii) remodel in a way which requiresthem to be vacant, (LLi) carry out redevelopment which requires them to be vacant (j) Where the lease is tied to employment which ha-s ceased, (k) Wherethe landlord returns froma away and requires the premises to live in.
4. By Section 7, occupants of houses built by TDC, SHC, or any government agency should not charge, demand, or receive on subletting, a monthly rent in excessof an aggregate of: (a) the installment payable monthly to TDC, SHC, etc., (b) the equivalent of property rates payable; and (c) 20% of the total of aand b.

28
(f) amount of rent for like premises,(g) current rate of interest charged by the Ghana Commercial Bank for
overdrafts,(h) obligations of landlord, tenant or other interested parties under
the lease,(i) justice and merits of each case.
These appear to be a reasonable basis for assessing standard rents for anypremises and for differentiating between premises which repretsent differentquantities of housing benefits. However, they contained no provisions forassessing the ability of tenants to afford rental payments, and only considerpart of landlords' opportunity cost.
In addition to case by case assessment, the Minister has the power toassess rents for particular types of property and publish them in an ExecutiveInstrument. This has been done from time to time for rooms occupied singly orin pairs with access to shared services. As rooms with slhared servicesconstitute the majority of all property in cities like Kumasi, rents assessedthis way have been a dominant factor in rent control for 20 years. Rooms withonly some services shared, or with none at all, are treated as if they had sharedservices. The levels set in 1973 are shown in Table 2.2.
Table 2.2: Prescribed rents for certain premises, 1973
Premises (room type and size) Monthly rent payable
Sandcrete 12ft x 12ft C7.50or landcrete 12ft x lOft C6.50
lOft x l0ft C5.50
Wooden, swish 12ft x lOft C4.50or iron sheet lOft x lOft C3.50
Source: Rent (Amendment) Decree, 1973 (NRCD 158), Schedule 1.
The rents handed down in this way have owed little to any of the matterslisted above; they appear to have been arrived at more from considerations ofwhat people can afford to pay than from any assessment of the property itself.It is noticeable that there is no mention in the schedules of whether the tenantsactually have access to water supply, toilet or electricity in the house, howmany others they share them with, or whether the roof is waterproof, a ceilingis present, or mosquito proofing is provided.
It is evident that, where rents are assessed individually or collectively,they tend to remain frozen until new legislation or assessments are made (UnitedNations, 1979). This has been true in practice, and indeed in intention, in Ghanaat least until 1980 (see below for data on informal rent rises since that date).Part four of the Rent Act, 1963, statets that no reassessment shall be entertainedunless circumstances affecting the question of rent have materially altered sincethe last assessment, or that the previous assessment was made on erroneousevidence.

HOUSING MARKETS AND RENT CONTROL IN GHANA 29
Figure 2.5:: Selected Prices, Logarithmic Scale
Index,1963-100(Iog scale)
1- Urban CP I : ::::::::- : : - ............. -.. ..
..-- Bldg Cost .-. = ... U r a . P ....... ......... .......I................. . ................... ....... ... ....... .......... -: .
-- - Rent Fuel Power ,10000 = - Controlled Rent ..................................... . -- --- -.. ......--
_. ... ~~~~~~~~~~~~~~~~~~~~~~~~~~~... .... ................ ......... ......... ......... ...... ..... ......... ... , .. ,.,..... ...... ..... ...... . ........ .... .....B l g c o t. L.................. .................... ....... .... ......... ........ .. ... . .... .. ........
____,,,,~~~~~~~~~~~~~~~~~~~~~~~~~~~~~~~. ..... .. .., ...... .,,,, ___ ._.__.. ._ 7. , 7. _ ...... __.... ......... .. .... .
~~~~~~~~~~~~~~~~~~~~~~~~~~~~~~~~~~~~~~. ___._... ____ ____ . ______ .ff...... ... .... ... _... .. ... _ .
_ , ~~~~~~~~~~~~~~~~~~~... ......... .... . .. .... . ....... ...... ....... ............. .... ..... . ......... "-''- ''-'-'' ---..0 ._ ...... .. . ................. .. -- . ./ .. .-- ..> , ,. .- . . .-:::-. . : = ... ... .. ... ..
-. ------------ ---- f -._. -'-'V----'- --....................... ......... .......... .. .. .. .......................... -- . -- .- -- .. .. -. .. _.-..- - ----.
1000 .._. ..........................
_ .. ..... ..... ......... _..... -- - -- - ..... .. ,i... ----
........ . ....... ...... ........... ..... ....... .... .... .... ... ........... ................... ......... .. .... ... . .. ... .. ......... ..... .. .......... .
70 72 74 76 78 80 82 84 86 88
Despite the inflexible nature of rent control when ruled by ministerialdecree, and their consistently low level, rents in Kumasi appear to have remainedwithin the levels set by the government and the Rent Control Officers during theearly 80s (Tipple, 1988). At the same time, rooms with exclusive use ofsanitation and water supply have commanded higher rents. During the 1960s and1970s the official Development Plans noted the need to encourage privateinvestment while directly building some houses for specific groups of people.But as the Consumer Price Index rose markedly, controlled rents lagged behind,with only a 19% rise between 1963 and 1975 (see Figure 2.5).
Rent Control post-1979
The Armed Forces Revolutionary Council (AFRC) government of Flt-Lt JerryJ. Rawlings which ruled from June to September, 1979, imposed new rent levelsas set out in Table 2.3. It should be noted that no distinction was made forthe materials used in construction nor for the various levels of servicing whichconstitute "shared amenities."
The 1980 survey of Kumasi, conducted within months of AFRC Decree 5 (seeTipple, 1984a), found mean and median monthly rents per room of C22 and C20.5
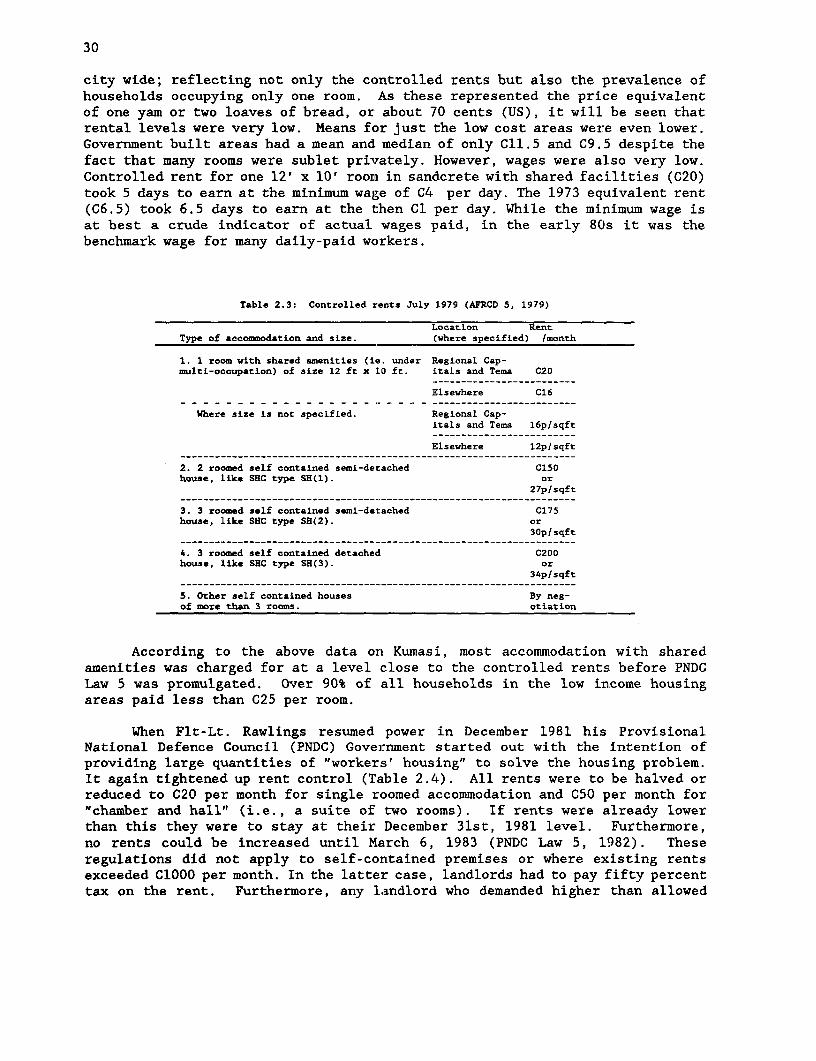
30
city wide; reflecting not only the controlled rents but also the prevalence ofhouseholds occupying only one room. As these represented the price equivalentof one yam or two loaves of bread, or about 70 cents (US), it will be seen thatrental levels were very low. Means for just the low cost areas were even lower.Government built areas had a mean and median of only C11.5 and C9.5 despite thefact that many rooms were sublet privately. However, wages were also very low.Controlled rent for one 12' x 10' room in sandcrete with shared facilities (C20)took 5 days to earn at the minimum wage of C4 per day. The 1973 equivalent rent(C6.5) took 6.5 days to earn at the then Cl per day. While the minimum wage isat best a crude indicator of actual wages paid, in the early 80s it was thebenchmark wage for many daily-paid workers.
Table 2.3: Controlled rents July 1979 (AFRCD 5, 1979)
Location RentType of accommodation and size. (where specified) Imonth
1. 1 room with shared amenities (ie. under Regional Cap-multi-occupation) of size 12 ft x LO ft. itals and Tema C20
Elsewhere C16
Where size is not specified. Regional Cap-itals and Tema 16plsqft
Elsewhere 12p/sqft----------------------------------..---------------------- __----------
2. 2 roomed self contained semi-detached C150house, like SEC type SH(l). or
27p/sqft
3. 3 roomed self contained semi-detached C175house, like SHC type SH(2). or
30p/sqft
4. 3 roomed self contained detached C200house, like SHC type SH(3). or
34p/sqft
5. Other self contained houses By neg-of more than 3 rooms. otiation
According to the above data on Kumasi, most accommodation with sharedamenities was charged for at a level close to the controlled rents before PNDCLaw 5 was promulgated. Over 90% of all households in the low income housingareas paid less than C25 per room.
When Flt-Lt. Rawlings resumed power in December 1981 his ProvisionalNational Defence Council (PNDC) Government started out with the intention ofproviding large quantities of "workers' housing" to solve the housing problem.It again tightened up rent control (TaLble 2.4). All rents were to be halved orreduced to C20 per month for single roomed accommodation and C50 per month for"chamber and hall" (i.e., a suite of two rooms). If rents were already lowerthan this they were to stay at their December 31st, 1981 level. Furthermore,no rents could be increased until March 6, 1983 (PNDC Law 5, 1982). Theseregulations did not apply to self-contained premises or where existing rentsexceeded C1000 per month. In the latter case, landlords had to pay fifty percenttax on the rent. Furthermore, any 1landlord who demanded higher than allowed

HOUSING MARKETS AND RENT CONTROL IN GHANA 31
rents or failed to pay the 50% tax would forfeit his premises to the state. Theseprovisions underline the basically anti- landlord stance of the PNDC governmentat the time of this legislation - three months after the coup which ousted theLimann government during which investment in large houses had been rife amongstthe elite. New properties let after 31st December, 1981, were to be assessed bythe Rent Officer under the Rent Act, 1963.
Table 2.4: Rental levels under PNDC Law 5, 1982.
Recoverable No. of days Rent perType of Accommodation Rentlmonth of basic square footand size of room. (Cedis). wage (1) (Cedis)(2)
1. Single-roomed accommodationwith shared amenities(ie. under multiple occupation) 20 1.7 0.2
2. Two-roomed accommodationwith shared amenities of thetype generally referred to as'chamber and hall" 50 4.2 0.2---------------------------------------------------------------------
Notes: 1. At C12 per day introduced in 1982.2. Assuming 120 square feet per room.
Before any investment in workers' housing could be made, this firmlyanti-landlord stance mellowed into a proposed housing policy which, among otherobjectives, sought to improve incentives for investment in housing through aNational Housing Fund. However, in January 1986 the PNDC once again reinforcedrent controls by the Rent Control Law, 1986, (PNDC Law 138 as modified by LI1318). Rental levels were set out in the First Schedule but were immediatelymodified upwards by Legislative Instrument 1318 to those shown in Table 2.5.
Table 2.5: Rental levels under L.I. 1318, January, 1986.
Recoverable No. of days Rent perType of Accommodation Rent/month of minimum square footand size of room. (Cedis). daily wage. (Cedis)
1. Single-roomed accouniodationwith shared amenities(ie. under multiple occupation)of a size say 12' x 10': (1)
(a) Sandcrete ... ... ... 300 3.3 2.5(b) Landerete ... ... ... 250 2.8 2.1(c) Swish ... ... ... 200 2.2 1.7
2. Two-roomed accommodationwith shared amenities of thetype generally referred to as"chamber and hall' of say12' x 10' per room:
(a) Sandcrete ... ... ... 400 4.4 1.7(b) Landerete ... ... ... 350 3.9 1.5(c) Swish ... ... ... 300 3.3 1.3
Note 1: Premises of other sizes are assessed using the amount per square foot.

32
Between March, 1983 and 1986, rents in the cities crept up followinginflation and the reducing value of the Cedi which was devalued from 2.75 perUS$1 to 25 and then, by stages, to 90 per US$ by December 1985. Despite thepossibility of forfeiture to the state for charging higher than controlled rents,only 30% of all households surveyed in 1986 were paying less than C50 in rentbefore the last rent increase in 1986. About 17% each were paying C100 and C150.Furthermore, large rent advances of 12, 24, or even 60 times the monthly rentwere being demanded of new tenants. These data suggest that resources forenforcement have been inadequate to deal with the disparity between rents andother prices at times when the gap is most acute. (In March 1988, the case loadof the Rent and Housing Committee was about 100 cases per week.)
Thus, despite the evidently large increase from the 1982 level, the newrents were, in fact, little or no higher in real terms. Although both wages andrents have increased, they have failed to keep pace with the massive inflationwhich has dogged the Ghanaian economy since the mid 1970s. While controlled rentfor one room in sandcrete had an index about one sixth of the CPI in 1976 (1963- 100), by 1985 the tight controls of the AFRC and PNDC had reduced it to one136th of the CPI (see Figure 2.5). Neither have rents kept pace with the costof building. The Index of Prime Buildling Costs is the only measure published bythe government by which to judge the cost of building but it: is probablyconsiderably lower than the real cost to the public; even so it is well abovethe index for rent for one room.
By the end of 1985, just before PNDC Law 138, controlled rents had losttouch with the CPI to such an extent that they represented only 0.07% of their1963 index. Figures 2.5 shows how rents have related to price indexes since1970.
Recent developments. 1986 to 1988
Since the 1986 survey through which data for this paper were collected,there have been significant changes in rents paid despite no change in thecontrolled rental levels. In the 1986 data, there were obvious signs of rentincreases ahead of PNDC Law 5, 1986. These affected new tenants more quicklythan existing tenants, but many households were unaffected by them. The increasesin early 1986 appear to have satisfied landlords at least for six months or soand there appears to be no cogent argument against the credibility of our 1986data as representing April to June, 1986, when they were collected. Since late1986, however, there has been a continuation of the upward trend in rentsespecially for new tenants and in self-contained accommodation. While it islikely that many households still pay the controlled rent, albeit in capital sumsin advance (see below), there are also many households who are paying up to threetimes controlled rent. The shortage of rooms is now felt so intensely thatrenters are willing to agree to C600 or C800 per month for a room without demur.Existing tenants are also willing to pay extra rent in order to maintain theirtenancies in an increasingly constrained supply. Furthermore, the rent controladministrators in the Rent and Housing Committee have no involvement in this ifno complaint is made.
In the following sections, the various aspects of landlord-tenantrelationships and the treatment of government-built housing will be examined.

HOUSING MARKETS AND RENT CONTROL IN GHANA 33
D. Current Status of Controls
Coverage
Initially rent control only applied to housing occupied by low- incomehouseholds. Anyone who could afford to pay £100 per annum rent during World WarII was regarded as too well off to need protection (Gold Coast, 1951a andLegislative Council Debates No.2 of 1949, p.68). The 1952 Ordinance removed thisupper limit but excluded any government housing or housing used by governmentofficers as a consequence of their employment. These have been excludedthroughout the legislation since that date. The 1963 Act also had no upper limitto controlled premises.
Where premises have been liable to control but fall outside the limits ofthe collective treatment applied to rooms with shared amenities, the recoverablerent has been assessed on an individual basis. United Nations (1979) points outthat, where this happens, the extent of coverage is generally lower than thatobtained by across-the- board measures but the rents assessed generally comecloser to the true value of each property.
The Rent (Amendment) Decree, 1973 stipulated rents for single rooms butexcluded from control any single room occupied by a tenant whose income exceedsCl,OOO per annum. At that time, minimum wage was Cl.OO per day but mean wagerates for Africans in reporting industrial establishments was C950 per annum(Ghana Economic Survey, 1972-4, p.125). Thus, anyone on more than mean industrialwage but living in one room was liable to be outside the protection of rentcontrol.
The 1979 and 1982 legislation removed any limit to controls but the 1986Rent Control Law again removed premises at the top end of the market, this timewith rents above Cl,OOO per month. This is again quite low -- being only 3.3times the rent for a sandcrete room but only 7% of households paid Cl,OOO or moreper month in 1986. At this level, the tenant pays whatever rent is estimated tobe recoverable but the landlord should pay half as tax to the state.
There has never been any differentiation between sitting tenants and newtenants in the application of rent controls; neither has there ever been anyexemption of new properties. Although landlords have been able to remove tenantsto restore, renovate or improve properties, there has never been any incentivegiven, such as removal from rent control, unless the renovations removed thepremises from the range in which controls operated at the time.
Advances and side payments
In countries where rent control is imposed, the demanding of side paymentsby landlords is very common. It provides a simple way for landlords to make upthe difference in income between market rent and controlled rent, through onceand for all payments at the beginning of a tenancy or through periodic extrapayments in cash or in kind. As the Mate Kole Report (Gold Coast, 1951a) pointedout, some landlords, notably in Kumasi, began taking advantage of wartimeconditions to demand up to one year's rent in advance from would-be tenants. This

34
"social evil" was prevented by the 1947 Ordinance, amended in 1949, makingillegal the demanding of more than one month's rent in advance of monthlytenancies or three months' in the caLse of longer tenancies.
Under the Rent Control Ordinance of 1952, it was an offencie to demand orreceive key money. The 1963 Act limited rent in advance to one month in monthlytenancies and six months in longer tenancies. No legislation since enacted haschanged the illegality of accepting or demanding advances.
With very low rents, it might be expected that recent empirical evidencewould show side payments being made to landlords to secure accommodation. InCairo, Mayo et al (1982) found that, even in a tightly controlled rental market,new building was still attracting investment because, inter alia, landlords coulddemand a large initial payment from prospective tenants. Thus, although rentsremained low, the price tenants paid for housing (monthly rent plus initialpayment) remained reasonably attractive to investors.
In 1981, following sufficient preliminary analysis of the 1980 data to showhow low reported rents were in Kumasi, a survey was done, under the author'sguidance, as a final year project by a student of planning. She interviewedjunior staff in three departments at: the University of Science and Technologywho were not living in university accommodation. As the interviews were conductedat the work-place, possible bias from the proximity of the landlord was removed.The respondents were asked about their rent, the utilities to which they hadaccess, and what side payments, gifts, advances, services, etc., they made tothe landlord. It was found that they did indeed only pay controlled rent and theproportion of rates and utilities charges for which they were legally liable(Edoo, 1982).
The 1986 survey and more recent observation and interviews with rentersand officers involved in rent control show that there has been a rapid increasein the incidence of landlords demanding rent in advance. This was relativelyrare before 1982 but, in 1988, almost all landlords demand rent in advance,sometimes for 5 years. The reason a landlord gives for demanding an advance isusually that he needs to carry out renovations and repairs. I[t is likely,however, that he is aware that he is making a gain by securing the rent as acapital sum rather than receiving it over a long period of time.
Rapid inflation renders fixed payments in the future less valuable. Whileadvances are becoming universal for new tenancies in Kumasi, there is alsoevidence that sitting tenants are being asked for rent advances (usually of atleast one years' rent). Such demands are being accompanied by threats ofeviction if payment is not made. Inevitably, if eviction occurs, grounds aregiven which are within the law (see notes on Table 2.1) -- usually that the roomis required for a relative. Many of the 100 cases per week brought before theKumasi Rent and Housing Committee in 1987-88 are from tenants aggrieved at beingevicted in this manner but there is little that can be done to redress theirgrievance if a relative of the landlord testifies to needing the room.
Contrary to our previous understanding of the advance system (Tipple 1986),the payment is offset against rents due, at the controlled rent per month. Thus,a worker giving an advance of C20,00CI for a single room in sandcrete, will pay

HOUSING MARKETS AND RENT CONTROL IN GHANA 35
no rent for 67 months unless the rent increases in the meantime. Furthermore,if he leaves the room before the advance is extinguished, the balance is due tohim.
Eviction
Until and including the 1963 Rent Act, the grounds on which tenants couldbe evicted were as set out in the notes on Table 2.1. Broadly they include rentarrears; tenants' neglecting their obligations, causing a nuisance, abusing ordamaging the premises; or expiration of the lease. A landlord can also evicta tenant where the premises are reasonably required for occupation by himself,his family, or his employees (if they are used to house employees).
These can be seen to provide a balance between secure tenure for tenantswho behave according to the terms of the lease and the ability of an aggrievedlandlord to evict bad tenants. The strength of commitments to the extendedfamily is reflected in the legal provision allowing a landlord to recover hisor her premises in case of family need. However, for a year after PNDC Law 5,1982, no complaints against tenants would be heard unless a landlord had compliedwith all the regulations concerning providing rent cards to tenants and detailsof all tenancies and rents to the rent officer.
Under the 1986 Rent Control Law, landlords were again prevented fromevicting for one year except where the landlord established that the premiseswere reasonably required for use by himself, his family, or persons in his wholetime employment for residential use, or by himself for business purposes. Onceagain, this could only be entertained if the landlord has issued rent cards andtenancy details to the Rent and Housing Committee. While Section 19 modifiedexisting legislation to give effect to the new law, nothing in it prevented theother conditions for eviction contained in the Rent Act, 1963, from beingrelevant again after 6th March, 1987. Indeed, there has been an increase inevictions by landlords since that date. It is now common to hear of householdsbeing evicted, ostensibly to make way for family members, or being threatenedwith eviction as a lever to extract advances. The considerable growth in familyhouse tenancy between 1980 and 1986 is discussed in chapter three; under currentconditions there is likely to be continued inroads made into the rented marketin this way as landlords grow increasingly discontented with rental levels.
Treatment of houses in government estates
Tenants of houses owned by government or its agencies, chiefly the StateHousing Corporation (SHC), and Tema Development Corporation (TDC), have normallypaid rents fixed from time to time by the owning authority. Houses built beforeIndependence are predominantly rows of single rooms with detached kitchens inblocks, public standpipe water supply, and public latrines. There are also somedetached and semi- detached 2 and 3 roomed bungalows with attached kitchen,bathroom and toilet. Post-independence dwellings are mainly self containedbungalows with two, three, or more bedrooms.
The 1952 Rent Act excluded government owned housing from its provisions.From 1959, tenants were encouraged to buy their dwellings on hire-purchase terms.

36
Since this time, many of those which have been purchased have also been extendedto provide rooms for rent. In consequence, there has been a growth in legislationon rents for private lettings in government housing. The 1963 Rent Akct prohibitedsub-letting without the permission of the landlord. Thus the letting of partsof government owned housing was illegal. However, the act did not apply to"premises of which a public officer is a tenant by reason of his employment andof which premises the Government is the landlord;" (Sl(2)(a)).
For many years, tenants of houses owned by State Housing Corporation orother government agencies have been profiting from the very low rents by movingout and letting the whole of their dwelling to another household for a higherrent than they have to pay, or by subletting part of their house to anotherhousehold for more than a fair proportion of their total rent. Sometimes the roomrented has not been intended for habitation. As long ago as 1968, 93% of thedetached kitchens in Asawasi were sublet to other households. While the tenantswere paying between C1.3 and C1.8 fEor their dwellings, the subtenants paidbetween C1.5 and C2 for the kitchen (BRRI, 1970, pp.16 & 17).
In 1973, the Rent (Amendment) Decree sought to control this. By Section7, occupants of houses built by TDC, SHC, or any government agency should notcharge, demand, or receive on subletting, a monthly rent in excess of anaggregate of:
(a) the installment payable per month to TDC, SHC, etc.;(b) the equivalent of property rates payable; and(c) 20% of the total of a and bi.
In older properties, the resulting rents to sub-tenants would be very low.They would, however, guarantee the owner a 20% profit on the transaction,something that controlled rents in the privately owned stock never openlyattempted to do. As the prices charged for the dwellings were subsidized, andthere was sufficient land for extension, those fortunate enough to possess sucha house were thrice blessed.
However, in newer estates, while rents were C10 per month, thehire-purchase payments were fixed considerably higher. Schmitter (1979) showsthat purchasers paid anywhere between C39 and C81 per month for ownership within10 to 25 years.
The provisions of the 1973 decree were further improved in 1974 by the Rent(Amendment) Decree (NRC Decree 250).. By it, where a dwelling acquired fromgovernment had been extended or improved, a reasonable increase in rent was tobe allowed. Disagreements or doubts could be referred to the Rent Magistrate.
In 1979, the "Ghanaian Times" (25th July) carried a list of rents ofrepresentative SHC properties. It showed that, though under review, rents werestill very low. A single roomed dwelling in North Suntresu was sti:Ll only Cl.9;a pair of rooms, C2.9; and a two roomed semi- detached bungalow with its ownwater and toilet was only C5.1 per month. More modern accommodation in a twostory, three bedroom house in Kwadaso Estate could be rented for C45.

HOUSING MARKETS AND RENT CONTROL IN GHANA 37
The review mentioned in the Times had become law a few days before -- on21st July. The Rent (Amendment) Decree, 1979, (AFRC Decree 5) more than doubledthe rents for self-contained government housing. As shown in table 2.3, the selfcontained premises were to rent for between 27 and 34p per square foot; thus atwo roomed type would rise from C50 to C150, and three room types from C75 toC175 for the semi-detached and to C200 for the detached bungalow. While theeffect of this may seem unfairly negative for government tenants who enjoyed thelowest rents per room in the city, it must be noted that many legal tenants onSHC estates were, in fact, non-resident and extracting rents from sub- tenants(see below). Furthermore, most government housing in Kumasi is notself-contained and, therefore, comes under 1 in Table 2.3 (1 and 2 in Table 2.4).
The decree also increased the profit margin on rooms in government builthouses to 25%. However, the State Housing and Tema Development Corporations(Ownership of Houses) Decree, 1979 (AFRC Decree 61), required that the profitsavailable to owners of former government housing were to be redistributed.Besides limiting ownership to one house per applicant and only allowing employedpeople to own them, this decree prohibited the subletting of former SHC and TDCproperty without written permission. Anyone already a sub-tenant, should pay rentto the SHC or TDC direct and would receive a rent card.
Like the 1963 Rent Act within which it operated, the Rent Control Law, 1982(PNDC Law 5) did not apply to housing owned by state agencies. However, a majormodification was made to the standing of unauthorized sub-tenants of former SHCand TDC houses: the subtenant was to become the direct tenant. Where anysub-tenancy had been approved by the SHC or TDC, the profit margin was removed,any rent being only equal to that paid direct to the agency for that amount ofthe house sublet. Any future illegal sub-tenancy would result in forfeiture ofthe premises to the sub-tenant who was seen to have been exploited. Accordingto newspaper reports in 1982, such forfeitures did indeed take place.
Under the 1986 Rent Control Law, subletting was once more permitted andthe rent charged returned to the cost plus 25% of AFRCD 5. Thus the threat offorfeiture was removed.
Reletting After Renovations
Under the Rent Act, 1963, a statutory tenant who is dispossessed in orderthat the landlord can remodel the premises is deemed to have an option to bereinstated in the premises at a rent to be assessed as suitable for theremodelled premises. If the remodelled premises are too small to accommodateall the former tenants, in the absence of agreement between them, the longeststanding tenant will have priority. Where they all of equal time, the RentMagistrate shall decide between the tenants on the balance of hardship causedby not regaining the tenancy.
These provisions still stand.

38
E. The Politica:L Economy of Rent Control
Successive governments in GhaLna have been engaged in building housing forrent, and recently for sale, but few have been particularly assiduous.
Most development plans have admitted governments' inactivity and theirreliance on the private market to provide the majority of new houses. In thelight of this, efforts have been made to assist the building of private housing.These have involved providing infrastructure and financial assisitance to privatebuilders to facilitate and regulate their activities. At the same time, rentcontrols have been negatively affecting the profitability of private investmentin housing.
From the beginning of the colonial period, regulations were imposed on plotsizes, building coverage, and sanitary provision, to ensure a high standard ofhouse building, (H. M. Government, 1909; Belfield, 1912) and plots were leasedto the major local chiefs and private individuals. As Kumasi grew, new areas werelaid out as grids with plots over 400 sq.m. in area, 13m wide roaLds and sanitarylanes. Old areas were rebuilt where required to make them "a credit to the town"(H. M. Government, 1921). In 1936, a new plot size (860 sq.m.) was introducedas standard and the sanitary lanes was discontinued. In 1939, new buildingregulations were framed tightening up on design and use of materials (The KumasiPublic Health Board Regulations, 1939).
It has continued to be government policy to provide services for housingdevelopment through the statutory supply corporations: Ghana Water and SewerageCorporation (GWSC) for water supply and sanitation, Kumasi City Council fordrainage and the emptying of bucket latrines, and the Electricity SupplyCorporation (ESC). The policy has only been successful in parts. GWSC has beenrequired to break even financially even though government has fixed its chargingrates. Kumasi City Council has been underfunded especially for the importationof vehicles and spare parts. Thus it is hardly surprising that the 1986 surveyshows 50% of houses without water and 29% without a toilet of any kind in 1986.Electricity is almost universal in Kumasi except in the outlying villages.
Finance has been considered an important housing generator by successivegovernments. But financial institultions like the First Ghana Building Society(set up in 1956) and the Bank for Housing and Construction (197:3) make limitedloans and mainly to the relatively secure and well- off rather than to low incomehouseholds. Other financial institutions have been encouraged to invest some oftheir capital holdings in housing. The State Insurance Corporation and the SocialSecurity and National Insurance Trust have been involved in giving mortgages ordirect investment in housing but their need to make a safe profit has removedtheir activities from the reach of low income households unless subsidi by theiremployers.
Government employees, in botlh civilian and military service, have beeneligible for concessionary loans for house building, particularly since thePublic Servants' Housing Loans Scheme Decree, 1975. While this is undoubtedly

HOUSING MARKETS AND RENT CONTROL IN GHANA 39
a boost for the recipients, who often receive quite low wages, anomalies havebeen all too common. For example, a university lecturer could raise a loan fromhis employer, build a large house, let it to the university for thousands ofcedis per month, and continue to occupy subsidi university housing. This is nowforbidden (by the Public Servants (Control of Provision of Bungalows) Decree,1979) but undoubtedly existed until then.
Cost of Housing built by the Government
There has inevitably been substantial increases in the cost of houses builtby government agencies. Data are only available from a few documents on a lessthan regular periodicity. In 1948 when the Asawasi estate was built usingstabilized mud bricks, single roomed laborer's quarters with shared utilitiescost £140 (C280), while the two roomed self-contained cottages cost £285 (C570)(Gold Coast, 1948). At that time minimum wage was about C7 per month. Ofei(1975) reported that similar houses in North Suntresu were being sold to theirtenants for C700 and C1700 respectively (when rents were C6.5 per room per monthin the private sector and minimum wage was C25).
In 1967, when the minimum wage was C17.5 per month, the government- builtone bedroom house cost C1,600, the two bedroom house cost C6,000 (Nierstrasz andHunnik, 1967). Table 2.6 shows how house prices in the government sector rosefrom 1974 to 1980. Thus, in 1980, the cheapest government-built house would cost2,500 months' (208 years') rent for one room or 167 months' (14 years') minimumwage. Unless the prospective owner was committed to sub-letting for many timesthe legal rent, there could be little rationality in exchanging renting for home-ownership under such circumstances.
Table 2.6: Prices of Selected S.H.C. House Types 1974 and 1980.
Price Months'Minimum Wage
House Type 1974 1980 1974 1980
SH.1 5,500 50,000 110 170SH.2 7,400 59,000 150 500SH.3 7,700 74,000 150 250SH.4 14,600 103,000 290 340SH.5 18,300 146,000 370 490--------------------------------------------------------
Sources: 1974, State Housing Corporation (1975),1980, Kwakye-Safo (1981) quoting SHC records.
Recent Changes
In the 1980s, there has been a hiatus in government activity in the housingfield while pressing structural issues were engaged followed by a renewedemphasis on what is seen to be a serious housing problem. Except for the ten-fold increase in the nominal level of rentals in January, 1986, which was quicklyeroded in real terms, little attention has been paid to encouraging rentalhousing. The draft Housing Plan concentrates heavily on encouraging the buildingof new single household dwellings. The landlords who are willing to build roomsin compounds (or their equivalent) have been largely ignored except forvilification by the press after reports of evictions.

40
It cannot be doubted that, since our data collection in 1986, at a timewhen landlords appear to have been happy with the new rental levels (personalcommunication, Kumasi Houseowners Association), rents have crept tlp and advancesand demanding higher than controlled rents, strictly forbidden in the rent laws,have been tolerated by the Rent and Housing Committees, at least since 1987, aslong as there was agreement between the landlord and tenant involved. As theavailability of rooms for renting has declined, especially over the last twoyears, more tenants have been willing to concur with landlords' demands withoutdemur. Anecdotal evidence suggests that rental levels for single rooms withshared services in Kumasi have crept up to about C1,000 in 1989 (still quite lowin real terms and only half the rental allowance received by middle ranking civilservants).
F. Summary
Having been started as a wartime measure to curb inflation, rent controlhas continued to dominate the housing market in Kumasi until the present day.As most households live in accommodation classed as having "shared amenities",their rents are fixed by occasional government proclamation. Apart from a fewproperties at the top end of the market, most housing units are covered byblanket controls or case by case determination by a rent officer. Advances andside payments are illegal and have been rare except recently before and sincethe 1986 increases. Eviction can only be carried out for a stipulated range ofreasons; needing the room for a family member is sufficient reason for evictionof a tenant. Government estates have been included in controls, though withlevels fixed by type of house or by so much per unit of floor area. Tenantsdispossessed for renovations have right of first occupation after the work isfinished.

III. THE HOUSING MARKET OF KUMASI
A. An Introduction to Kumasi
Kumasi is the second city of Ghana, capital of Ashanti Region, and thecenter of the forest belt which stretches across southern Ghana. The city is180 miles from the capital, Accra, by road and occupies a series of low hillsseparated by sluggish streams. It is now an industrial center with a formaltimber processing industry and large informal woodworking, light engineeringand vehicle repairing activities. It is also the commercial center for a largearea of Ghana including the main cocoa producing region. The city's centralmarket at Kejetia vies with Onitsha in south eastern Nigeria for the claim tobe the largest market in West Africa.
The city was founded around the turn of the eighteenth century by OseiTutu who, through subjugating the local people, established the Asante Empireunder himself as Asantehene; both the king and the high priest in one entity.The symbol of power and the soul of the nation, a wooden stool coated with gold,remains the apex of the cultural, religious and political structures of theAsante people even within modern Ghana. As both Asantehene and the Golden Stoolare to be found in Kumasi, the city retains a very special place in theworld-view of its inhabitants and the residents of an area covering severalhundred square miles. More detailed studies of the history and significance ofKumasi can be found in Aidoo (1977), Hagan (1971), Lewin (1974), McCaskie (1980,1981, 1983 and 1986), and Wilks (1966, 1967, 1975 and 1979).
Kumasi was an imposing town in 1817 (Bowdich, 1819) but suffereddestruction in the protracted wars with Britain in the last quarter of thenineteenth century. Having been razed by fire, it was reconstructed as thecolonial administrative and commercial center for the northern part of modernGhana, beginning in 1901, eventually gaining a reputation as the "Garden Cityof West Africa." Its population grew to 45,133 by 1944 (Fry and Drew, 1945),180,642 by the 1960 Census, 260,000 by the 1970 Census, and an estimated 590,000in 1980 (Tipple, 1984a).!/
1/ The 1980 estimate, made from extensive household data, has been calledinto question by the recently published 1984 Census preliminary results(Ghana, 1985) which show only 488,991 people in Kumasi. Discussions inKumasi with Prof. P. Austin Tetteh, a respected Ghanaian demographer,suggest that the 1984 Census may be dogged by under- enumeration.Furthermore, the housing stock estimates and occupancy rate means fromthe 1986 survey would generate a total population of approximately 690,000for 1986.

N)-i u.1
LOCATION OF RESIDENTIAL AREAS IN KUMASI CITY COUNCIL AREA
TO TAiALE TO MAMPONG
A,P*WRfONU \
TO BARE KESE ESNMANG N
to i~~' -I N1\\
- -. I AMAA\ /OtO IAUO, \.
AIA IC \/J ,.W _AIIAPAf ION . VTHNVA!WSO /AIRPORi
/WADJ AASOKf RtOUAASP JNICO \
Mont SAW~~~~~~ASI-NS\N AOIAS(- A
0 StNJA.V - S I
/ ) \ asUxw^)s~~ s uNlvErtstTY C^titpO6Oi'CHIUAPATSIE
TO~~~~~~~~~~~~O
ISO SI \ AlANg VIE YA to--'
If tl"T"5 \_/TONGO} _ s}"es
STAKOADOF : i ;_J toKA~~~~~~~~RIGEASA I Ao tonx #A
GA TAttORAOIS*TO LA KE SOSU IW I
tO REltWAt

THE HOUSING MARKET OF KUMASI 43
B. Household Survey Data
At the start of the project, a survey of housing stock and householdcharacteristics for Kumasi in 1980 conducted by Graham Tipple, with additionalmaterial collected by Samuel K. Afrane was in hand (Further analysis anddiscussion of the findings can be found in Boapeah and Tipple, 1983; and Tipple,1984a, 1984b and 1987a). It was decided to conduct a further survey ofapproximately the same size, and using as many of the same houses as records ofthe 1980 survey permitted so that some sense of changes since 1980 could begained in this tightly controlled rental market.
As in 1980, students of planning at the University of Science andTechnology in Kumasi acted as enumerators under the guidance of Mr. Afrane, alecturer in the Department of Planning. A survey to count the houses in thecity, exactly similar to that carried out by Boapeah in 1981 (Boapeah, 1981;and Boapeah and Tipple, 1983) was unsuccessful in 1986, for reasons beyond thewriters' control, but was successfully carried out in 1988 collecting data forcompletions 1981 to 1985 and 1986 to 1988. The new survey gave an opportunityto check the 1981 data which was found to be slightly in error. The number ofhouses extant in 1980 was corrected from 20,600 to 21,000.
The main survey was carried out between late April and mid-July, 1986 in28 areas of the city. The sample was based on a random sample of houses withinall the main low income residential areas of the city plus areas chosen torepresent the high cost areas and the peripheral towns and villages (The samplingprocedure for areas is discussed in detail in Tipple, 1984a). Within theresidential areas, the sampling unit is the house which is defined, for theprivately developed areas of the city as a structure designed for or used as aresidential building. In the government-built areas, a house is defined as astructure originally designed to be used as a single dwelling. Within the house,all heads of households, or their representatives were interviewed. A householdis defined as a group of people who normally share the same housekeepingarrangements. Interviews were successfully conducted with 1414 households in279 houses.
In addition to the graphs and charts presented in this chapter, there area number of supporting tables in the data appendix at the end of the paper.
C. Kumasi's Housing Stock
The housing stock in Kumasi consists predominantly of compound houses.The 1986 survey shows that 40 percent of the houses are single story compounds(mainly in the indigenous sector) with a mean of 12 rooms, while 16 percent aremulti-story compounds (mainly the tenement sector) with a mean of 17 rooms.Together these contain 75 percent of the rooms in the city. The remainder aredetached houses (24 percent with a mean of 7 rooms) and semi-detached or terracedhouses mainly in the government built sector and with means of 4 rooms (mainlyin high cost and government sectors). Approximately 4160 one to five roomedhouses have been provided by government as rental housing in its own estates.Most of the houses have been sold to their tenants over the last twenty years.Kwakye-Safo (1981) reported that about 60 percent of houses formerly under the

44
control of State Housing Corporation were privately owned. The 1986 surveycarried out for this project reveals that 62 percent of occupants in governmentbuilt houses are either owners or occupy housing owned by their family.
Figure 3.2 Distribution of Households by Tenure, Sector, House Type and Number of Rooms
Sector Tenure
Indigenous
62% ~~~~~~Owners9%
S ubre ntersHigh Cost 3%
8%
5%Tenement ~ ~ ovrnenFamily ~~~~~~~~~~~~~~~~~Housers36%
House Type Number of looms
One73% 7
SS Compound ///SF Detachejd52% 16%
1TIIII IIIII Other5% 4 or More
8%
Three5%
MS Compound Two27% 14%
Figure 3.2 summarizes some of the key data on housing stock utilization.The figure presents weighted estimates of how households are distributed bysector, tenure, house type, and numlber of rooms occupied.
For purposes of sample design, the city was divided into four sectors; thepredominant house form being the major parameter for assigning areas to sectors.These sectors are referred to in the analysis in later chapters. While furtherdetails of areas assigned to sectors can be found in Tipple (1984a and 1987a),it is sufficient here to state that areas dominated by multi-story compounds wereassigned to the "tenement" sector, areas dominated by single story compounds werein the 'indigenous" sector, government built areas were in the "government"

THE HOUSING MARKET OF KUMASI 45
sector, and high cost areas in their eponymous sector. As Figure 3.2 shows, mosthouseholds live in the tenement or indigenous sectors.
Figure 3.2 also shows that most households rent their accommodation."Family housers" are separate households living rent-free with relatives.Relatively few households own their accommodation outright. Figure 3.3 showsanother key breakdown, of the number of households by tenure by sector.
Taken as a whole, Figures 3.2 and 3.3 illustrate that most households rent(or live rent free with relatives) in single rooms in compound houses in thetenement or indigenous sector.
Figure 3.3: Tenure by Sector
In many African cities, the housingstock contains a strong informal sector,mainly comprising households occupying Percent of Households
land to which they have no legal title 70'
on which they have built dwellings which bO% [E- -ernl-m .....
do not conform with local planning and En Inalgenouse
building regulations. They are usually -r..mentreferred to as squatters. In Kumasi, the 40% ------------------------------------ ------------I ...... ...........
land tenure system is controlled by local 30% - - - - .......--chiefs whose power is tmderpinned by the 20% - _ .belief in supernatural forces ofancestors, spirits and gods (Busia, 1951; 10. ----.McCaskie, 1983; Tipple, 1983). The close 0%control which they hold over their land Own Family Rent Sublet
obviates the opportunity to squat, evenif households dared to defy them and theancestors. Thus, the informal sector in Kumasi comprises houses built on landleased from the traditional authorities in a manner accepted by the government.While the structures may not conform to planning and building regulations, theland holding is entirely legal (Peil, 1976). For the purposes of analysis, thehouses built in this way are included in whichever sector the predominant typein the area merits. Thus, some are in the tenement sector, some in theindigenous sector, and some in the high cost sector.
Access to Utilities and Services
Few households have to cope without a bathroom, which is a relatively cheapservice to provide as it may only be a small bare room into which a bucket ofwater is taken for washing. However, more than a quarter of households do nothave access to toilet or water supply in their house and must rely on publiclatrines and standpipes, often many scores of meters distant. At the other endof the scale, about one in eight households have exclusive access to each of theservices. As almost all households have electricity, no tabulation is presentedhere. Given possible sampling error we would not make strong statements aboutchanges in services between 1980 and 1986, but it appears that a lower percentageof households have access to kitchen and toilet, while the water situation mighthave improved somewhat.

46
Some notable problems of access to Figure 3.4: Households Without Access to Services
toilets exist for family housers andsub-renters. Furthermore, family housers Percent
score quite badly on access to water 35 -
supply, probably the most expensive 3|ED- ----------- .....
service to provide.2 5.----------- ................................ ----..--.....
One of the main advantages of house 2 0 - - -------------- . ........
ownership in Kumasi is enhanced access toservices, at least 40 percent of owners . . ....-----.....having exclusive access to each and only 10 .. - ........................small percentages having no access.Family housers and renters only rarely S .... m.m
have exclusive use of services, but csub-renters show high percentages w:ith Kitchen Bathroom Toilel Water
exclusive use. This is undoubtedly dueto the large proportion of the few sub-renters in government-built housing areaswhere the houses have exclusive services for the single household in occupation.
Environmental Conditions
The data in Table 3.1 are collected at house level. Thus, each householdin the house scores the same environmental indicators regardless of their tenure.It is noticeable that owner households consistently have lower percentagesaffected by the selected environmental indicators than tenant households. Thisindicates that owners are more common in the houses with good environments.
Table 3.1: Household Environmental Indicators by Tenure
Selected Environmental Percent of Household with ProblemIndicator. Owners Family Housers Renters Sub-Renters
Major cracks in thewall plaster. 8 23 14 46
Overgrown vegetationclose to the house. 14 20 25 4
Standing water closeto the house. 18 33 25 46
Garbage evident closeto the house. 22 35 40 55
Broken or absentgutters. 31 64 56 57
Eroded outdoor surfaces 38 72 66 69
Housing SuDDlV
In 1986 there were approximately 22,000 houses in Kumasi witlL a total ofabout 220,000 rooms; this compares with about 21,000 houses in 1981 with about176,000 rooms. Both these data are approximate and, therefore liable to errorin either direction. However, the number of rooms per house in the sample hasincreased from 8 to a little over 10. Thus, although growth has been very slow,the number of rooms appears to be growing more quickly than the increase inhouses would suggest. This suggests that extensions on, and intensified use of,

THE HOUSING MARKET OF KUMASI 47
existing houses are providing much of the increase in the housing stock. Supplywill be discussed in detail in Chapter 6.
D. Household Characteristics
Tenure
In this study households are divided into four tenure groups: owner-occupiers, renters, sub-renters, and family housers. The great majority (65percent) of households in the city are renters. These households occupy roomsowned by a landlord, who may live on the premises, and pay to him a monthly rentand a proportion of the rates and service charges (for electricity, water andsanitation) which he pays in aggregate to the relevant agencies. A few householdspay rent to someone other than the landlord - most probably either a renter wholets a room to them or an employer who pays rent to the landlord.
Figure 3.5: Monthly Rents
The great majority of renterhouseholds in Kumasi pay C200 or C300 per Percent
month rent: the controlled rent for a single 50
room with shared facilities built in swish 50 -
(C200) or cement blocks (C300). Althoughalmost 18 percent pay monthly rent of more 40 - ,
than C300 (almost all the C300 - 399 classpay C300), only 7.5 percent pay more than 30 - .C300 Rer room. This is a similar pattern 20 . .... .........................-----------....
to that found in 1980 when the greatmajority of rents corresponded to the 10---------------------------- ..-- ..-...... -- ........controlled rent for one room with sharedfacilities (C20) under the Rent Amendment 0-99 100-199 200-299 300-399 400-499 500-599 600
Decree, 1979 (AFRC Decree No. 5) asdiscussed in chapter 2.
House Ownership and "Family Houses"
Outright ownership of a house is only enjoyed by a few households (9percent), almost all of whom rent rooms to others. There is, however, a strongand apparently growing proportion of households who occupy rooms for which theypossess some rights of ownership through their family. They represent 25 percentof the households in 1986 compared with 13 percent in 1980 (Tipple, 1984a and1987a)). The basic unit of society in Asante is the abusua lineage, a group ofpeople who share uterine descent from a common ancestress and who are ruled bya chosen senior male, the "abusua panyin" or elder. Within this matrilineage,a man and his children are separated but he is joined by his sisters' children.Until recent legislation (see Tipple, 1986) whose effects are as yet uncertain,all property (except for a few very personal items) possessed by members of alineage passed on death to the lineage in general, under the stewardship of theabusua panyin. In this way, a house built by a lineage member becomes the commonproperty of members of his lineage upon his death (see Tipple, 1984a, pp.152-3).

48
During their life, a man or woman in Asante traditionally has obligationsto members of the lineage which are at least as great as his or her obligationsto spouse and children. A house-owner cannot easily resist requests from lineagemembers for a room in his or her house. They have a right to a room, just asmuch as if they had already inherited it in common with other lineage members.In reciprocation, they would have obligations to their benefactor and an ownerwould increase in status by having them around. Indeed, the rent controllegislation recognizes the importance of this system by allowing eviction ofrenters if a room is required for a faLmily member. Thus, many family members liverent free either in a living relative's house or in one inherited in common. Inthis report they are referred to as "family housers".
Income and Consumption
Data on income are very difficult to collect in Kumasi. Not only do peoplehave formal earnings complicated by multiple allowances which can be anythingup to five times as large as salaries, but also most households have income frominformal activities, chiefly trading, in both cash and kind. As few householdsseem to pay their full liability for tax, especially on non-formal earnings,there is a great reluctance to tell the truth about income. Both the 1980(Tipple, 1984a) and 1986 surveys found that incomes bore no relationship toconsumption (in the 1986 survey, the median consumption to income ratio was 2to 1). Thus, in the 1986 survey, data were gathered on household expenditure onfood, transport, services (water, electricity, etc), rent or housing loanpayments, and an mother" category. The aggregate of these is taken to behousehold monthly expenditure and acts as a proxy for income.
There are shortcomings in this approach, chiefly uncertainty about whetherexpenditure has been inflated and to what extent the "other" category has beenaccounted accurately; some non-sampling errors are unavoidable in social researchcollecting sensitive data on personal finance. However, the use of consumptionhas advantages as it is likely to represent permanent income more accurately thanincome data, and demand is more closely related to permanent than to short-termincome (Malpezzi and Mayo, 1985).
The 1986 survey found median monthly consumption to be C12,500 ($140) perhousehold and C3300 ($37) per capita. These can be compared roughly to estimatesof consumption from National Income Accounts. The Bank's World DevelopmentReRort reports that average per capita income was US$ 390 in 19I86, and thatconsumption was 82 percent of GNP. Adjusting for household size and convertingto monthly figures yields a crude monthly household consumption of US$ 120. Wewould expect Kumasi's consumption to be somewhat higher than the nationalaverage.
Owner households have a higher median monthly consumption (016,300) thanany other tenure group but this cannot be regarded as high enough to set themapart as a separate class. Furthermore, their larger household size (see below)reduced their per capita consumption to C3100, almost C400 lower ithan renters.Figure 3.6 presents the distribution of consumption by tenure. Not surprisingly,owners' consumptions are generally higher. The other three groups -- renters,family housers and sub-renters have roughly similar distributions.
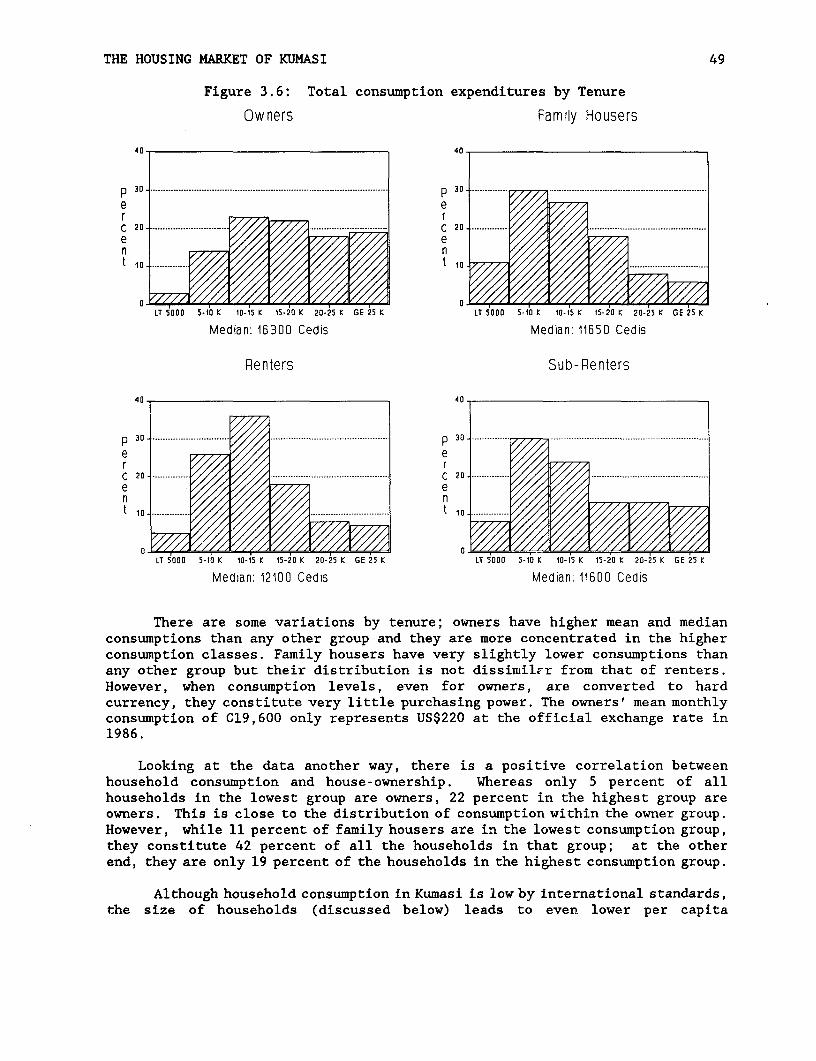
THE HOUSING MARKET OF KUMASI 49
Figure 3.6: Total consumption expenditures by Tenure
Owners Family Housers
C 2 0. ................ ......... .. .............. .............. C 2 . ........... .. ......................
e 4 a < g 3 r en ~~~~~~~~~~~~~~~~~~n
0- O.~~~~~~~~~~~~~~~~~~~~1
LT 5000 5-10 K 10-15 K 15-20 K 20-25 K GE 25 K LT 5000 5-0 K 10-fS K f5-20 K 20-25 K GE 25 K
Median: 16300 Cedis Median: 11650 Cedis
Renters Sub-Renters
40 -4 0
e er r
C, 20e en n
0OE
LT 5000 5-10 K 10-15 K 15-20 K 20-25 K GE 25 K LT 5000 5-10 K 10-15 K 15-20 K 20-25 K GE 25 K
Median: 12100 Cedis Median: 11600 Cedis
There are some variations by tenure; owners have higher mean and medianconsumptions than any other group and they are more concentrated in the higherconsumption classes. Family housers have very slightly lower consumptions thanany other group but their distribution is not dissimilrr from that of renters.However, when consumption levels, even for owners, are converted to hardcurrency, they constitute very little purchasing power. The owners' mean monthlyconsumption of C19,600 only represents US$220 at the official exchange rate in1986.
Looking at the data another way, there is a positive correlation betweenhousehold consumption and house-ownership. Whereas only 5 percent of allhouseholds in the lowest group are owners, 22 percent in the highest group areowners. This is close to the distribution of consumption within the owner group.However, while 11 percent of family housers are in the lowest consumption group,they constitute 42 percent of all the households in that group; at the otherend, they are only 19 percent of the households in the highest consumption group.
Although household consumption in Kumasi is low by international standards,the size of households (discussed below) leads to even lower per capita

50
consumption per month. Mean monthly consumption per capita is only C4,200(US$47); the median is even lower at C3,300 (US$36).
Household Size
There is a wide spread of household sizes in Kumasi around the mean of 4.5persons. It is noticeable that there is a very gradual fade in frequencies abovesix persons, the largest household encountered had 52 persons. The extendedfamily household is still common. Coresidential polygamy is evident in moslemdominated areas while polygamous Akans tend to separate their wives in differenthouseholds, often in different houses.
Figure 3.7: Household Size, Selected Years Figure 3.8: Size Distribution by Sector
Percent or Each Year's Total Percent oi Each Sector's Total30 - 20
15 ....... ..... ..... .................. i nO gefnoJs
15 - ---- ..... . 31S ... ..1 5_. ......... .... ....... ......-+*+}GvFlel---
Household Size 1 2 3 4 5 6 7 0 9 10-14 15+
Means: 1970, 4.0; 1580, 4.8;1986, 4.5 Means: Indigenous 4.5; Tenement 4.2;Sources: Ghana (1978], Table 5; Tipple Government 5.7; High Cost 5.0;(1987a), Table 18; 1986 Survey Total 4.5
Households tend to be larger in the government sector than elsewhere.This is consistent with the 1980 data (Tipple, 1984a and 1987a) but the 1986sectoral mean of 5.7 is considerably lower than the 1980 mean of 6.7 persons.Furthermore, whereas in 1980 the high cost sector had almost as large a meansize of 6.5 persons, this is reduced to 5.0 in the 1986 sample. In the 1980data, this sector had a completely different distribution from all the othersectors with no single persons and only 1.6 percent two person households. The1986 high cost sample is much closer to the other sectors. The change may be aresult of sampling differences or it may reflect the way rents in the high costsector have been kept low by the indirect effect of rent control. In antincreasingly tight housing supply, the high cost sector appears to be losing itsidentity as the home of a select group and becoming integrated wi'thin the cityas a whole.
There has been a very slight reduction in the mean household size in Kuwasibetween the 1980 and 1986 surveys, from 4.8 to 4.5.
It would, perhaps, be expected that "modernization," increasingurbanization, and an increase in availability of birth control might togetherhave reduced the proportion of large households. In fact, the percentage ofhouseholds with more than six persons has been holding fairly steady with 18(1970), 21 (1980) and 19 (1986).

THE HOUSING MARKET OF KUMASI 51
In contrast, there has been a significant decline in the percentage ofsingle person households. These have decreased from a dominant 27 percent in1970 to only 13 percent in 1986. This represents a potentially important changein household organization which needs some explanation. Asante traditionalmarriage is non-coresidential. The husband and wife do not become a jointcorporation, united in residence and economies. Obligations to their respective(and separate, as marriage is exogamous) lineages do not diminish on marriage.It is traditional for a man to live separately from his wife, in a differenthouse, where she joins him for conjugal relations and to which she may send someof his meals. This arrangement is perceived to give the woman more economicfreedom than coresidential marriage and enables polygyny without internaldomestic problems. While this practice is now less than universal, it is stillprevalent and, according to a survey by Diko (1981) in Bantama (close to Kumasicity center), desired by many married men and women. This survival of atraditional norm is consistent with other features of Asante life where traditionis very tenacious, especially during the economic hardships of the last decade(see Tipple, 1983; 1984a; and 1987b for further discussion of the survival oftraditional values). It has been argued elsewhere (Tipple, 1984a and 1984b) thatthe increasingly constrained housing supply in Kumasi has, over the last twodecades, reduced the ability of men to move out of the marital room and in toa room by themselves.1/ This is reflected in the dramatic reduction in singleperson households not only as a proportion, but also in real terms. The 1986data only reinforce the previous observations.
It should be noted in passing that those married men who live unwillinglyin the same rooms as their wives and children represent a potentially largereserve of latent households. Thus, should the housing stock be increasedsignificantly in the future, there is a strong likelihood that at least some ofthe new rooms will be filled by newly liberated, single person households. Thedifference this could make has been discussed in Tipple (1984a and 1984b).
Households have the ability to decamp some members at night to ease theproblem of crowding. In a city where traditional ties remain strong, it isquite common for male children to go and sleep in the room of a mature brotheror an uncle, or female children with a mature sister or an aunt. The differencethis makes to the size of households is seen by comparing the total size withthe co- resident size, as can be seen from Annex Table 3.8.
There may have been a very slight reduction in household size since 1980,although the difference is insignificant.
2.1 Another reason might be the poor economic conditions 80-86 that might havelead to reduced migration (thus, a reduction in the number of young men).
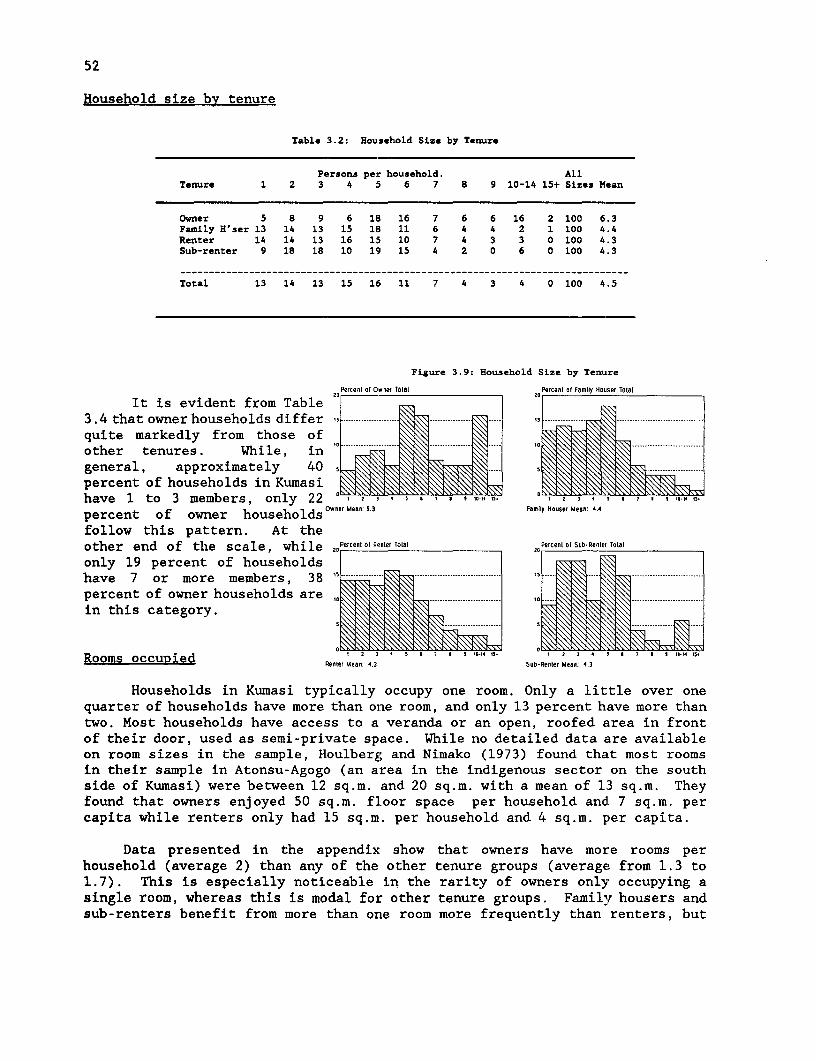
52
Household size by tenure
Table 3.2: Household Size by Tenure
Persons per household. AllTenure 1 2 3 4 *5 6 7 8 9 10-14 15+ Sizes Mean
Owner 5 8 9 6 18 16 7 6 6 16 2 100 6.3Family H'ser 13 14 13 15 18 11 6 4 4 2 1 100 4.4Renter 14 14 13 16 15 10 7 4 3 3 0 100 4.3Sub-renter 9 18 18 10 19< 15 4 2 0 6 0 100 4.3
----------------------------------..------------------------ ____-------__----__
Total 13 14 13 15 16 11 7 4 3 4 0 100 4.5
Figure 3.9: Household Size by TenuLre
Percent of Ownwr TOtal Percent of Family HoLsor Total
It is evident from Table3.4 that owner households differ .. . . ..................................
quite markedly from those ofother tenures. While, ingeneral, approximately 40 5 1 . .....
percent of households in Kumasihave 1 to 3 members, only 22 n a 5 a I a v X tnt , 2 3 4 5 7 I I llt . 15t
Owner tbtean: ti.3 ~~~~~~Famtiy Hooser tMean: 4.4percent of owner households owner Man: 6.3
follow this pattern. At theother end of the scale, while 20Percent'ofenterTotal Percent 0o Sub-Rentef Total
only 19 percent of householdshave 7 or more members, 38 .. .... \- 0mpercent of owner households are ...-------------..........in this category.
Rooms occupied Renter Meanr: 4.3 Sub-Renter Mean: 4.3
Households in Kumasi typically occupy one room. Only a little over onequarter of households have more than one room, and only 13 percent have more thantwo. Most households have access to a veranda or an open, roofed area in frontof their door, used as semi-private space. While no detailed data are availableon room sizes in the sample, Houlberg and Nimako (1973) found thaLt most roomsin their sample in Atonsu-Agogo (an area in the indigenous sector on the southside of Kumasi) were between 12 sq.m. and 20 sq.m. with a mean of 13 sq.m. Theyfound that owners enjoyed 50 sq.m. floor space per household and 7 sq.m. percapita while renters only had 15 sq.m. per household and 4 sq.m. per capita.
Data presented in the appendix show that owners have more rooms perhousehold (average 2) than any of the other tenure groups (average from 1.3 to1.7). This is especially noticeable in the rarity of owners only occupying asingle room, whereas this is modal for other tenure groups. Family housers andsub-renters benefit from more than one room more frequently than renters, but

THE HOUSING MARKET OF KUMASI 53
probably for very different reasons. The Figure 3.10: Rooms Occupied
former have rights similar to owners and Percent of Households
can, therefore, have some control overallocation of rooms in their house. Thelatter tend to be concentrated in the 60 .
government-built sector where rooms arearranged to open off each other rather thanhaving individual access from a courtyard. 40' . .Renters are overwhelmingly confined tosingle roomed accommodation. 20- .
Occupancv rates
1 2 3 4 5 or moreLess than half the households in KumasiMeans: 1980,1.7; 1986,1.6
enjoy occupancy rates of less than 3 personsper room while about 16 percent have more than 6 persons per room. Meanoccupancy rate continues to be in excess of 3 persons per room. Alongside datafrom other African cities (for example in Peil and Sada, 1984), Kumasi has arelatively high occupancy rate. The distribution in 1986 is very similar tothat of 1980.
Table 3.3: Mean Persons per Room by Tenure, 1980 and 1986
Tenure 1980 1986
Owner 2.6 2.7Family Houser 3.4 3.2Renter 3.4 3.5Sub-renter 2.9 3.1
Total 3.3 3.3
There is a high degree of consistency between 1980 and 1986 occupancyrates, following from a more substantial increase in the number of rooms thanwould be expected from the increase in houses. Furthermore, the distributionbetween tenure groups is very similar to that of 1980. It is evident that ownerscontinue to enjoy lower occupancy rates than any other tenure group. Conversely,family housers do not share the benefits of outright owners, being closer to therenter groups in their occupancy rates.
More than half the households in Kumasi are overcrowded using a thresholdof 3 persons per room. However, owner households have to cope with overcrowdedconditions more rarely than the other tenure groups, and much more rarely thanrenters for whom some measure of overcrowding is very common.
Rents by Consumption Ouartile
Table 3.4 presents a key breakdown, of rents and rent-to-consumption ratiosby consumption quartile. The means, first and third quartiles (Ql and Q3) andmedians are calculated and presented within each consumption quartile. In Table3.4 and in this paper, rents are generally expressed in Cedis per month. The

54
lack of variation in rents is striking, within and between grotLps. Chapter 5will present additional key tabulations of rents, as well as a simple demandmodel.
Table 3.4: Rents by Consumption Quartile
Rent-to-Consumption Quartile Rent Consumption Consumption
Lovest Ouartile
Mean 253 6,358 .04
Q3 300 8,000 .05Median 300 6,810 .04Q1 200 5,200 .03
Second Ouartile
Mean 323 10,722 .03
Q3 300 11,495 .03Median 300 10,730 .03Q0 200 9,900 .02
Third Quartile
Mean 387 14,539 .03
Q3 300 15,689 .02Median 300 14,425 .02Q1 250 13,393 .02
HiRhest Quartile
Mean 599 25,201 .03
Q3 500 26,468 .02Median 300 21,920 .01Q1 300 19,393 .01
Summary of Key Data by Tenure
Table 3.5 presents a final summary of some key data by tentLre. Key pointsinclude the following. Most households are renters; both owners and familyhousers stay in place longer than renters and sub renters. Owners have higherconsumptions than the other groups. Most renters, and sub renters, pay between200 and 300 cedis a month rent. Even given low consumptions, rents in Kumasiare very low, on the order of :2 percent of consumption. More detailedcomparisons will be made later in the paper.

THE HOUSING MARKET OF KUMASI 55
Table 3.5: Summary Descriptive Statistics
Median Median Median Medianlength monthly monthly Rent to
Tenure of stay consumption rent consumption(percent) (years) (Cedis) (Cedis) (percent)
Owners 10 16 16300(8, 26) (11100, 24100)
Family housers 25 16 117008, 28) (8000, 16300)
Renters 62 8 12100 300 2.3(4, 16) (9400, 16900) (200, 300) (1.7, 3.4)
Sub-renters 3 6 11600 300 3.9(2, 18) (7780, 20150) (300, 300) (2.7, 5.7)
Notes: Numbers in parenthe-ses under medians are the first and third quartiles of the distributions;family housers are households living rent free in a house belonging to family members.

I

IV. ECONOMIC ANALYSIS OF RENT CONTROL: THEORY
A. Introduction
This chapter outlines the economic analysis and theory of rent controlto provide a perspective and prelude to the empirical results from the economicmodel of the effects of rent control in Kumasi, reported in the next chapter.!,
B. Analysis of Rent Control as a Tax on Housing
Simple rent control, ignoring dynamic price adjustment mechanisms, isusually viewed as a tax on the return to housing capital. Such a simple modelof rent control as price control, where the price per unit of housing chargedby landlords is reduced by administrative fiat, is depicted in Figure 4.1. Rentcontrol is represented as a move from price (rent) PO to P1. If rather thanbeing reduced, rents are frozen at existing levels, then price inflation, as hasoccurred in Ghana, leads to a similar divergence between equilibrium andcontrolled prices.
Figure 4.1: Rent Control as Effective Price Control
In the short run the housing stockis fixed at QO, i.e. the supply ofhousing S is perfectly inelastic, but at *<P1 there now exists excess demand(Ql-QO). Previously the available units Sonly went to buyers who valued them atP0 or above. But now price has beenreduced to P1, demand has risen to Ql.\Demand exceeds supply. We do not knowprecisely how suppliers will allocatethe available supply between demanders PIin Kumasi. The work of Price (1971) andothers suggests that few transactions in 0Ghanaian society are wholly economic;personal relationships are establishedas part of the negotiation and used aslevers by both or either side. Roomsare never advertised; there are no real Q1 81 aewltyestate agents, all prospective tenantsmust keep constant vigilance and use asmany personal contacts as possible to obtain information about, and tenancy of,rooms falling vacant. In these circumstances, it cannot be doubted thatethnicity and extended family factors are important.
The divergence between P0 and P1 also provides a strong incentive for thedevelopment of key money system, where amortised key money makes up the
1/ Longer reviews of the literature can be found in Malpezzi (1986) andMalpezzi and Rydell (1986). See also the recent special issue of theJournal of Real Estate Finance and Economics devoted to internationalexperience with rent controls (Volume 1, No. 3, November 1988).

58
difference (POQO-PlQO). However, such a feature neither appears to be a strongnor broad force in the Kumasi housing market. Although advance rent paymentsare now common (see chapter 2), only commercial rooms attract a form of key moneyknown as "goodwill." However, advance payments exhibit features of key moneyin the sense that they increase the present value of the landlord's receipts.The precise impact in terms of payments over and above official controlled rentwill depend, as in amortization calculations, on the real interest rate and theperiod for which the advance rent is paid. But up to 1986 typical advance rentpayment covered about one year ahead.
Figure 4.2: Rent Control with Elastic Supply
In the longer run, the supplyschedule has more elasticity (Sl) (Figure4.2), and so if key money or advance Pvcpayments have not become an effectiveequilibriating mechanism (because ofstrict enforcement, or simply because low S1incomes and poor capital markets make itdifficult for many renters to finance keymoney or advance payments) then landlords psimply decrease the quantity of housingservices supplied to Q2. Some housesare demolished early, others aretransferred to owner occupation (both ofthese factors are very rare in Kumasi),or transferred to alternative land-uses(commercial premises), and new startsare forgone. -
Rent Control as Expenditure Control
An alternative view of rent control is to model it not as a price controlbut as an expenditure control, following Olsen (1969) and Frankena (1975).
In this model, rent control initially lowers real rents to P1 (Figure 4.3)from PO. Rent is fixed at PlQO. While supply is inelastic in the short run atQO; in the intermediate run, landlords have some latitude to vary the quantityof housing services available in the market as represented by the supply curveS.
Real world rent control regimes fix rents, not the price per unit ofhousing services. Specifically, for rental expenditure fixed at PlQO, landlordsare constrained by the rectangular hyperbola E, the locus of all combinantionsof housing services and prices yieldi.ng expenditure numerically equal to PIQO.To prevent reductions in unit housing services and quality, continualreassessment of controlled rents in the light of the landlord's maintenancepolicy would be required to prevent the implied price per unit of housing servicerising above P1. Downward filtering could be prevented if rent control werere-inforced with the introduction of heavy fines in the event of deteriorationof the landlord's housing stock (Ricketts, 1981), but this is a judgement fraughtwith evidentiary problems. Such a strict rent control regime, based upon unithousing services, has not been adopted in real world housing markets.
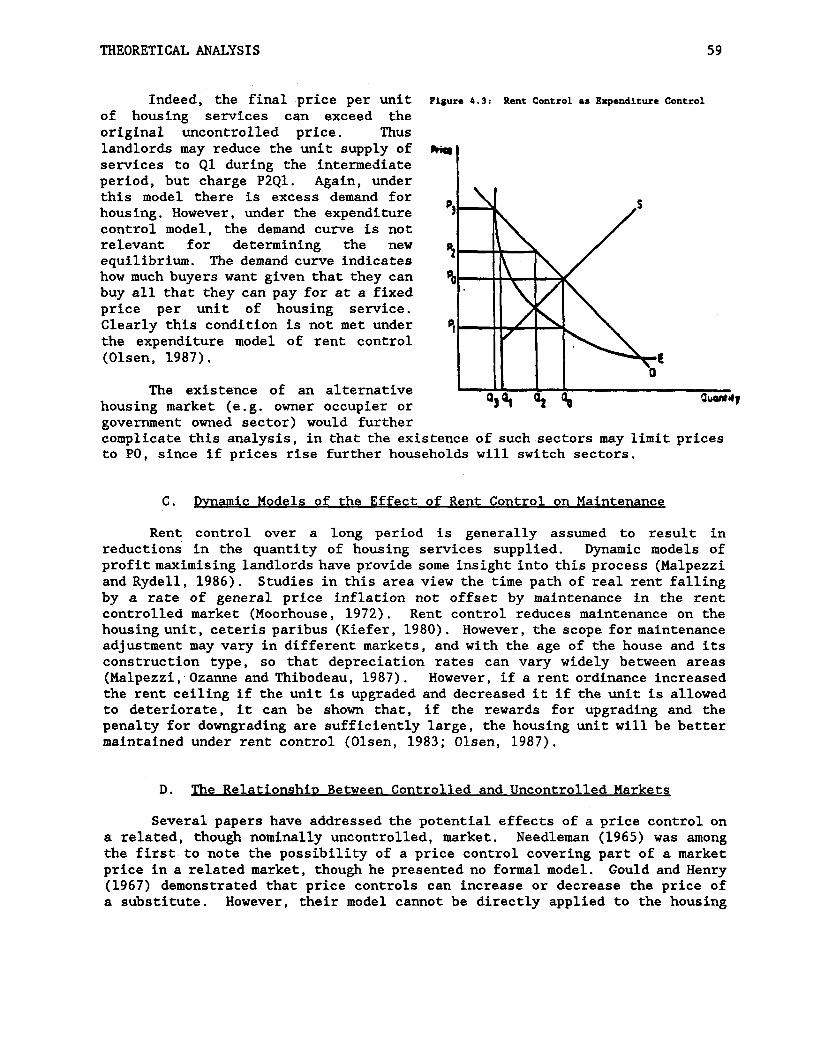
THEORETICAL ANALYSIS 59
Indeed, the final price per unit Figure 4.3: Rent Control as Expenditure Control
of housing services can exceed theoriginal uncontrolled price. Thuslandlords may reduce the unit supply of tiu
services to Ql during the intermediateperiod, but charge P2Q1. Again, underthis model there is excess demand for p
housing. However, under the expenditure '3control model, the demand curve is notrelevant for determining the new pequilibrium. The demand curve indicateshow much buyers want given that they can Pobuy all that they can pay for at a fixedprice per unit of housing service.Clearly this condition is not met under 9 -
the expenditure model of rent control(Olsen, 1987).
The existence of an alternative a . itei housing market (e.g. owner occupier or 3government owned sector) would furthercomplicate this analysis, in that the existence of such sectors may limit pricesto PO, since if prices rise further households will switch sectors.
C. Dynamic Models of the Effect of Rent Control on Maintenance
Rent control over a long period is generally assumed to result inreductions in the quantity of housing services supplied. Dynamic models ofprofit maximising landlords have provide some insight into this process (Nalpezziand Rydell, 1986). Studies in this area view the time path of real rent fallingby a rate of general price inflation not offset by maintenance in the rentcontrolled market (Moorhouse, 1972). Rent control reduces maintenance on thehousing unit, ceteris paribus (Kiefer, 1980). However, the scope for maintenanceadjustment may vary in different markets, and with the age of the house and itsconstruction type, so that depreciation rates can vary widely between areas(Malpezzi,-Ozanne and Thibodeau, 1987). However, if a rent ordinance increasedthe rent ceiling if the unit is upgraded and decreased it if the unit is allowedto deteriorate, it can be shown that, if the rewards for upgrading and thepenalty for downgrading are sufficiently large, the housing unit will be bettermaintained under rent control (Olsen, 1983; Olsen, 1987).
D. The Relationship Between Controlled and Uncontrolled Markets
Several papers have addressed the potential effects of a price control ona related, though nominally uncontrolled, market. Needleman (1965) was amongthe first to note the possibility of a price control covering part of a marketprice in a related market, though he presented no formal model. Gould and Henry(1967) demonstrated that price controls can increase or decrease the price ofa substitute. However, their model cannot be directly applied to the housing

60
market, because it assumes households consume some of each of the twosubstitutes. The most thorough treatment of the possible e:Efects of rentcontrols on related uncontrolled markets is the recent paper by Fallis and Smith(1984).
Fallis and Smith actually develop two related models, one for rent controlregimes which exempt new units from price controls, and one for regimes withvacancy decontrol provisions. Their short-run models predict that under mostconditions excess demand spills over into the uncontrolled market, and, in theshort run, driving up the uncontrolled price. In the long run, they implicitlyassume an elastic supply function that implies a reduction in the quantity ofhousing services from the controlled sector, and an expansion in the uncontrolledsector, narrowing the wedge between prices.
They also present an empirical test of the model using data from LosAngeles (1969-1978). Following Rosen and Smith (1983), they assume that thereis a straightforward relationship between rental rates, R, operaLting expenses,E, and the vacancy rate, V, estimated as:
Rt - -6.25 + .078 Et + 34.09 (l/Vt) + 26.49 (l/Vt-1)(3.30) (1.64) (4.12) (3.10)
where dots indicate time derivatives and t-statistics are in parentheses. Rentcontrol was introduced in Los Angeles at the end of this period, 1978. Theestimates are used to forecast what rents would have been in the absence ofcontrols, and the forecast compared with rents in the controlled arnd uncontrolledsector. After two years, controlled rents had risen by 10 percent: less than theforecast, and uncontrolled rents by 22 percent more, confirming the hypothesisthat rent control increases prices in the uncontrolled sector in the short run.
E. Two Approaches to Measuring Costs and Benefits
In light of the above, what empirical approach will we take to measuringcosts and benefits in Kumasi? As noted earlier we will present two alternativeapproaches to measuring the static costs and benefits of contro:Ls. The firstand simplest static model estimates the difference between actual housingexpenditures and what we'd expect them to be in the absence of controls, usinga cross country model calibrated with uncontrolled markets. The simple methoddoes not decompose expenditure into prices and quantities, but it does have theadvantage of yielding information about the effect of rent reguLlation on the"uncontrolled" market (to be definedi below). The second method does estimateprices and quantities, using the method of hedonic indexes.
Cost-Benefit Using a Cross-Country Model
The first, simple approach can be expressed without any jargon with thefollowing two questions:

THEORETICAL ANALYSIS 61
(a) What do households pay for rental housing under controls?
(b) What would they pay in the absence of controls?
The answer to the first question is directly observable from a survey. Obtainingan answer to the second is the tricky part. Malpezzi and Mayo (1985, 1987a,1987b) have developed a cross country model of housing demand which can be usedto estimate rents paid by typical households at a city at a given level ofdevelopment in the absence of controls.
This simple model does not answer some interesting questions. For example,what effect does rent control have on the rents for particular kinds of units?What are the consequent costs to owners of these units? How much do householdsvalue the reduction in rent from controls? What is the "transfer efficiency"of controls (i.e. the ratio of tenant benefit to landlord cost?) The next fewpages present a more sophisticated model that can answer some of these questions.
Cost-Benefit Using a Model Similar to Edgar Olsen's
The second method is similar to that used by Olsen (1972) in hiseconometric analysis of rent control in New York.V1 It is assumed that thereis an uncontrolled housing market as well as a rent controlled market. Thequantity of housing services provided by a unit reflects all of thecharacteristics associated with the unit: size, amenities, appearance, locationand physical features. Thus the rent of any unit reflects all the characteristicsassociated with housing. Differences in rent in a non-controlled market wouldthus reflect differences in services associated with the good.
The costs and benefits of rent control can be assessed by comparing thecontrolled situation with the non-controlled situation. One way of implementingthis with-without perspective is to estimate how much controlled units would rentfor in the absence of controls, and consider the difference between that rentand the observed controlled rent as the cost imposed on the landlord and,conversely, the transfer to the tenant.
These transfers lead to changes in producer's, but more importantlyconsumer's surpluses, resulting from the existence of controls, as can be seenin Figure 4.3.
With an uncontrolled rent per unit of housing service, Pm, householdswould consume Qm units of housing service, and pay a rent PmQm. The immediate
_/ For convenience we refer to this as the Olsen model because his 1972 paperwas (to our knowledge) the first published study to analyze rent controlswith such a model. Olsen cited the work of De Salvo (1975) and others asantecedents; similar models and extensions have been applied to housingmarket policies and programs of various kinds, e.g. Murray (1978), Mayo(1981), Schwab (1985) to name but a few. Malpezzi (1986) and Struyk (1988)apply variants of the model to rent controls in Cairo and urban Jordan,respectively.
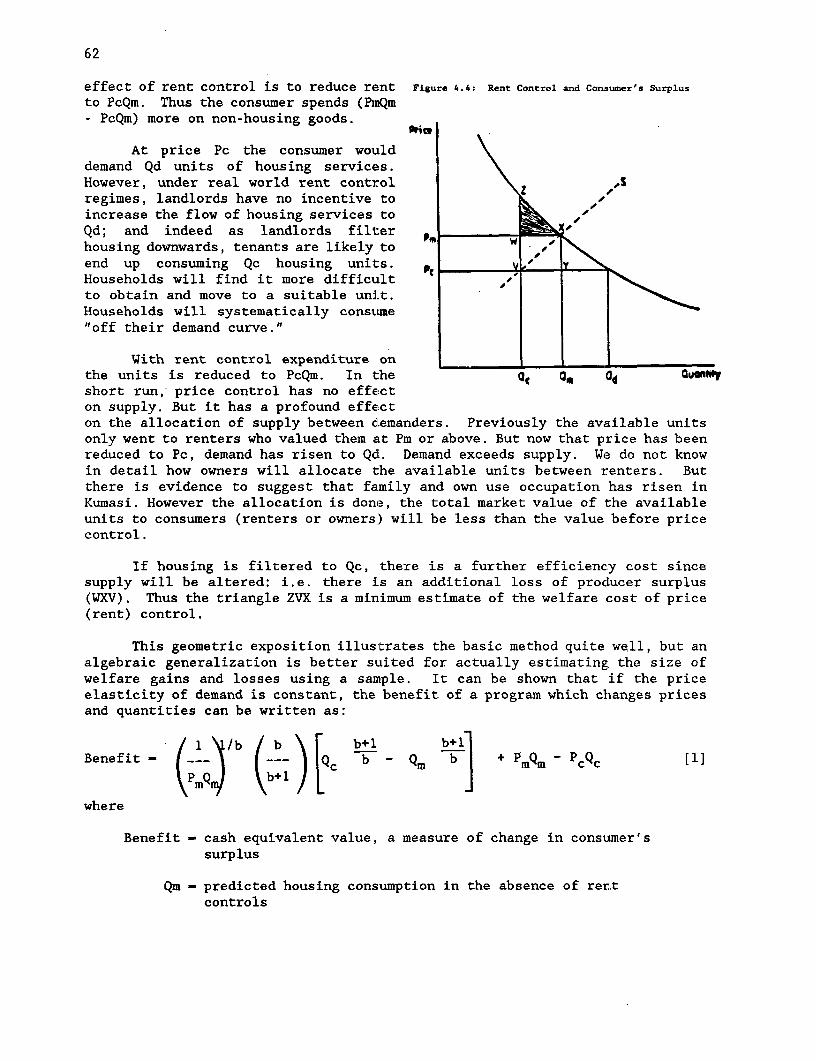
62
effect of rent control is to reduce rent Figure 4.4: Rent Control and CorLsumer's Surplus
to PcQm. Thus the consumer spends (hnQm- PcQm) more on non-housing goods.
At price Pc the consumer woulddemand Qd units of housing services.However, under real world rent control \Sregimes, landlords have no incentive toincrease the flow of housing services to K -Qd; and indeed as landlords filter -.housing downwards, tenants are likely toend up consuming Qc housing units. Pt * tHouseholds will find it more difficult , Ito obtain and move to a suitable unit.Households will systematically consumue"off their demand curve."
With rent control expenditure on _ .the units is reduced to PcQm. In the a m* ad Qu"Wshort run, price control has no effecton supply. But it has a profound effecton the allocation of supply between dLemanders. Previously the available unitsonly went to renters who valued them at Pm or above. But now that price has beenreduced to Pc, demand has risen to Qd. Demand exceeds supply. We do not knowin detail how owners will allocate the available units between renters. Butthere is evidence to suggest that family and own use occupation has risen inKumasi. However the allocation is done, the total market value of the availableunits to consumers (renters or owners) will be less than the value before pricecontrol.
If housing is filtered to Qc, there is a further efficiency cost sincesupply will be altered: i.e. there is an additional loss of producer surplus(WXV). Thus the triangle ZVX is a minimum estimate of the welfare cost of price(rent) control.
This geometric exposition illustrates the basic method quite well, but analgebraic generalization is better suited for actually estimating the size ofwelfare gains and losses using a sample. It can be shown that if the priceelasticity of demand is constant, the benefit of a program which changes pricesand quantities can be written as:
I /b /b \ b+1 b+1Benefit - (Qyb (b) FQc b - Qm b + pmQm -cQc [1]
where
Benefit - cash equivalent value, a measure of change in consumer'ssurplus
Qm - predicted housing consumption in the absence of ren,tcontrols

THEORETICAL ANALYSIS 63
Qc - housing consumption under rent controls
PmQm - estimated rent in the absence of controls, alsodenoted Rm
PcQc - observed controlled rent, also denoted Rc
b - price elasticity of demand.
In the special case where the price elasticity of demand, b, is equal to-1, the expression b/(b+l) is undefined. But it can be shown that in thisspecial case the benefit can be expressed using natural logarithms as:
Benefit - PmQm [log (PmQc) - log(PmQm)] + PmQm - PcQc [2]
These two related equations will be the centerpiece of the empiricalanalysis in the next chapter. The benefit may be thought of as composed of twoparts. The first is comprised of the two terms to the right of the brackets inequations [1] and [2]. This is simply the additional spending on non-housinggoods brought about by paying a rent Rc (=PcQc) rather than Rm (=PmQm). Thissimple difference between market and controlled rents, Rm - Rc, is often usedas an approximation to tenant benefits from the imposition of controls. But thissimple benefit measure does not take into account how households value changesin housing consumption in addition to changes in disposable income. The second,comprising the terms in parentheses and brackets in the two equations, dependson the difference in housing consumption with and without rent controls. Butwhereas in the simple benefit measure (Rm - Rc) an extra dollar of non-housingis counted as being worth exactly one dollar to the tenant, in the benefitmeasures [1] and [2] extra housing is discounted based on the tenant's relativepreference for housing vis- a-vis other goods.
The measures in [1] and [2] do not include all possible costs and benefitsto tenants. For example, rent control may increase transactions costs fortenants, including search costs (Clark, 1982), and increase waiting time forhousing units (the cost of which to tenants may be considerable, see Willis,1984). All of these will reduce the benefits to tenants, but the full systemmay also increase the bundle of property rights, such as security of tenure,enjoyed by tenants thus increasing their benefits in this area. The abovemeasures [1] and [2] are then better approximations of benefits than Rm - Rc,but they are still approximations.
The cost imposed on landlords is straightforwardly approximated by PmQc- PcQc, or the difference between controlled and market rents for the unitinhabited by the tenant. This measure of cost to landlords does not includelosses from prior accelerated depreciation of the unit. However, this couldbe regarded as a saving in maintenance costs, which would generate benefitselsewhere, perhaps equal to the opportunity cost forgone. The cost to landlordswould also include losses from the uncompensated transfer of property rights torenters. Thus, the true costs to landlords may therefore exceed the (PmQc -PcQc) estimates.
64
Estimating these costs and benefits requires four pieces of informationfor each consumer:
(a) the rent currently paid for the current controlled uinit, PcQc;
(b) the rent that the current unit would rent for in the absence ofcontrols, PmQc;
(c) the rent that the household would pay if they were at theirequilibrium demand at market prices, PmQm;
(d) the price elasticity of demand for housing, b.
The section on empirical implementation below explains how these wereconstructed in some detail, for the Kumasi housing market. Briefly, PcQc canbe observed directly from a sample of controlled households. PmQc will beestimated using the method of hedonic indexes, described below, which usesinformation from an additional sample of housing units rented at (as near aspossible) market prices. PmQm will be estimated using two alternatives: (i)the cross-country model of Malpezzi and Mayo, and (ii) a demand relation froma sample of households facing (as near as possible) market prices. The M&M modelwill also be used to examine the net effect of controls on prices in the"uncontrolled" market. The price elasticity, b, will be a parametric assumptionbased on other studies. While each of these methods has potential problems,sensitivity analysis will give us some idea of the confidence we can place inthese results.
V. ESTIMATES OF THE COSTS AND BENEFITS OF CONTROLS
A. Introduction
Once again, two separate approaches will be taken to estimating costs andbenefits. The first, simpler approach will be based on the difference betweenactual controlled rents and rents predicted by the cross-country model ofMalpezzi and Mayo. The second approach will be based on the Olsen cost-benefitmodel. The parameters used to derive the first set of estimates were taken fromMalpezzi et al., and were presented in the previous few pages. The parametersfor the second set will be derived here from the household survey data. Each willbe compared to the actual current rent paid, PcQc.
Recall that the simple model requires two basic pieces of information:
(a) the rent currently paid for the current controlled unit, PcQc;
(b) the rent that the household would pay if they were at theirequilibrium demand at market prices, PmQm.
The empirical estimation of the Olsen model discussed in the previous chapterrequires four pieces of information:
(a) the rent currently paid for the current controlled unit, PcQc;
(b) the rent that the current unit would rent for in the absence ofcontrols, PmQc;
(c) the rent that the household would pay if they were at theirequilibrium demand at market prices, PmQm;
(d) the price elasticity of demand for housing, b.
Note both methods require PcQc and PmQm. For both we use the household surveydata for PcQc, but we use the cross country model to estimate PmQm in the firstinstance and demand estimation using a sample of "uncontrolled" Ghanaian rentersto estimate PmQm in the second.
The rest of this chapter is organized as follows. First we will describehow we estimate or otherwise arrive at the components just described: PcQc fromthe household survey; PmQm from a cross country model of housing demand; PmQcusing the survey and the method of hedonic indexes; and an alternative measureof PmQm using the survey and demand estimation; and finally the price elasticityof demand. Then we will present the static cost benefit estimates, and evidenceabout their distribution.
Given the rather extreme results presented earlier, i.e., that typicalrents are less than two percent of total consumption, and that a month's rentis roughly equivalent to the price of a loaf of bread, readers may reasonablyask the following questions:

66
Why even bother with such statistical analysis? Isn'tthe demonstration that rents are so low sufficient?What could be gained from further analysis?
There are three answers to these questions:
(a) While the result that rents are very low is obviously robust,,'we would prefer a standard for comparison with basis in factor theory.
(b) Also, the simple (implicit) comparison of observed rent to incomeratios with similar statistics from other markets, controlled oruncontrolled, or with mere notions of what is a "reasonable"fraction, tell us nothing about the relationship between costs andbenefits, or their incidence.V
(c) Finally, Kumasi is one of several markets being studied in thelarger research project, and there is a return to estimating costsand benefits in as comparable fashion as possible.
A related point is that by estimating such models in rather extremecircumstances we learn more about the robustness of the models. We have alreadynoted that we will actually estimate costs and benefits using two relatedmodels. Neither is free from probleams or criticism. But given the very lowrents in Kumasi virtually all of the qualitative conclusions of thie paper in thefollowing chapters stand given any likely change in quantitative estimates.
B. Choice of Reference Group
Perhaps the single most difficult empirical problem is choosing areference group. It must be reasonable to assume that they are enough like thecontrolled group that they are comparable--or can be made so statistically. Itmust be reasonable to assume that rents are not so distorted in the referencegroup by the presence of controls that they are unreliable guides to rents inthe absence of controls--or that a good adjustment can be made for thatdistortion. Here we note the following:
1/ Three hundred cedis is roughly the price of a loaf of bread (admittedlya nicer loaf than is readily available in the U.S.). An express airmailletter from Ghana to the U.S. requires 200 cedis postage.
2/ As noted above, the models in this chapter are comparative static models.Dynamic costs of controls could be quite large, and are discussed in thenext chapter.

ESTIMATES OF COSTS AND BENEFITS 67
(a) Regression analysis is, in fact, a statistical method which enablesanalysis of "treatment" and "control" groups which are notidentical. 31
(b) One possible problem is that households in the reference and controlgroups are systematically different in their demand for housing;Malpezzi (1986) has found such selectivity bias does not make muchdifference in Cairo, but Caudill et al.(1987) found it did make somedifference in Vancouver. We can use a simple correction from Olsen(1980) to test for selectivity bias in our results.
(c) As noted earlier, rent controls can, under some circumstances,affect rents in the uncontrolled sector. But the cross countrymodel of housing demand can be used to test for and, if necessary,correct for such a problem.
There are several variables in the survey which could be used to estimatethe market rent of the unit in the absence of controls:
(a) rent charged on rooms let in the house for commercial purposes.
(b) landlords' estimate of market rent;
(c) landlords' estimate of the replacement cost of the unit;
(d) rent paid on units in the high cost sector
(e) key money and/or advance rent paid in addition to rent in thecontrolled sector;
(f) rents paid for units which are renting for greater than controlledrents (are demonstrably "uncontrolled.")
None of these is without problems. After examining the data we chosealternative f (with some modification, discussed below). Each of the potentialmethods will be discussed briefly here.
Rent charged for rooms let in the house for commercial purposes wasquickly rejected as an appropriate vehicle to assess market rent in the absenceof controls. There were a very small number of observations in this category(N-15), although the average maximum commercial rent paid was C590 (medianC400) compared to mean room rents of C340 per room (median C300) per month.Landlords also reported what they thought would be a minimum commercial rent.This was C220 per month (N-6 and median of C300). Apart from problems ofinterpreting commercial rents as proxies for residential, the small number ofobservations caused us to drop this option.
i./ See any intermediate statistics text for a more detailed explanation.
68
The landlord's estimate of mar]ket rent was also rejected. The averagemonthly rent was estimated to be C340, the same as the actual average house rentper room (medians C200 and C300 respectively). We believe that the simple waythe contingent valuation question was framed did not control for possible biasessuch as strategic, hypothetical, information, instrument and starting point bias(see Schulze, d'Arge & Brookshire, 1981; Boyle, Bishop & Welsh, 1985). Therewere also few responses.
While replacement costs comprised a reasonable number of observations(N-131), preliminary hedonics on the landlord's estimate of replacement costproduce low R squared values (less than 0.13 for all houses) and disaggregatingby sector produced very low numbers of observations. Moreover, the data wereheavily skewed towards low replacement estimates which were unrealistic in termsof known building costs. Finally, in any market rents are not simplyproportional to replacement costs. Thus replacement cost was rejected as avehicle for analysis.
Under the Rent Control Law, 1986, premises renting for more than C1,000per month are outside rent control. Out of the almost 900 renting householdsin the sample, only 36 were paying C1,000 per month or more. Thus, rent paidin the high cost sector, while a likely candidate as a suitable variable, couldnot be used, since the degrees of freedom were so limited (only 4 inmultivariate models). Furthermore!, many of the households rent theiraccommodation through their employer and pay a percentage of their salary ratherthan an amount depending on the quality of the house. We have no data on theamount paid by employees for the houses but hearsay evidence shows C25,000 permonth to be quite common in 1988/9.
Key money is a one-time non-refundable deposit paid in addition tocontrolled rent. Key money can be translated into a rental equivalent (RE) withthe following formula provided the time horizon is reasonably long:
RE = Kl * r
whereKl - the amount of key money paid in the first period
(assuming no subsequent deposits are paid)
r - real rate of discount.
This is valid if it is assumed that the landlord keeps the key money investedat the prevailing rate of interest. However, this form of key money is not asignificant feature of the Kumasi housing market, unlike other parts of WestAfrica (eg. Nigeria).
ESTIMATES OF COSTS AND BENEFITS 69
Advance aygments (A) are more common in Kumasi, and denote the practiceof paying periodic (controlled) rent in advance. Again, advance payments canbe converted into an approximate rent equivalent (RE) if the following equationis solved for RE
nA - Z RE/(l+r+p)t
t=l
where A = advance paymentn - number of periods in advancer - real discount ratep - rate of price increaset - time period.
In effect, RE is the same as a payment on a self-amortizing loan havingthe present value A. Roughly 15 percent of renters reported paying advancerent. However, the variance in the amounts paid was enormous (ranging from 2to 53,000 cedis. Of advances paid the first quartile was 300, the median was4,000, and third quartile was 10,000. Since advance amounts paid variedtremendously (partly with when the tenant moved in) we found it difficult to usethem to predict market rents with any confidence. However, recent trends inadvance are of interest in themselves, and we analyze advances separately below.Advances paid will also be used when we estimate gross rents (below).
After considering and rejecting the above, we took the simplest path.Rents are not controlled for units renting above 1,000 cedis. This is onlyabout 8 percent of median income (yet relatively few households pay rents thishigh). Further, as we mentioned earlier in Chapter 2 controlled rents are solow that, while the practice is not widespread, some households choose to payrents in excess of controls but less than the 1,000 cedis which would exemptlandlords from controls. "Uncontrolled" units were therefore defined as thosewhere the rent paid was greater than the controlled rent for that type of unit.
Table 2.5 (in Chapter 2, above) lays out the exact criteria by number ofrooms and type of material (swish, concrete, etc.) While these units areoutside rent control, since their rents exceeded controlled levels, common senseas well as the model of Fallis and Smith (1984) suggests that the presence ofcontrols could affect the rents of these "uncontrolled" units as well. Many ofthese units have exclusive use of either a kitchen or bathroom, and shared useof other facilities, in contrast to the part of the sample where controlledrents are enforced. This could lead to upward bias in the imputation ofuncontrolled rents, even though we attempt to control for characteristics of theunit and the household.A/ Also, there may be some units which would rent justbelow the 1,000 cedi floor for uncontrolled rents in the absence of controls,
4/ Briefly, this can be thought of as the problem of predicting "out ofsample." Even though, in an idealized model, correctly specified, thereshould be no problem with such predictions, when working with real dataand aRproximate specifications (Leamer, 1978), predicting out of samplehas some risks.

70
but which rent for 1,000 or more to escape controls. But there could beoffsetting bias because these rents; could be held down by the threat of appealto the Rent and Housing Committee. The net bias in "uncontrolled" rents, then,is an empirical question.
One way we control for household and, especially, house clharacteristics,is by limiting most of our analysis in this chapter to the tenement andindigenous sectors. While there are differences between these two sectors theyare small compared to differences between them and the omittedl high cost andgovernment sectors. Of course further analysis of high cost and governmentsectors would be worthwhile.
In the next few paragraphs the issue of comparability of controlled and"uncontrolled" samples will be addressed further. Then we wilL use the crosscountry model again to examine the likely net bias of this procedure, and tosuggest a correction for the bias.
Controlled and "Uncontrolled" Households Compared
Table 5.1 presents some key statistics. The uncontrolled households are,on average, 25 percent richer, more likely to have their own toilets, live inlarger units, and pay twice as much in rent.
Table 5.1: Controlled and Uncontroll^d Samples Compared
Controlled 'Uncontrolled"
Number of Observations 677 78
Median Rent 300 600
Median Number of Rooms 1 2
Percent Living in 1 Room 93% 8%
Mean Persons Per Room 3.1 2.1
Percent with Own Toilet 1% 26%
Median Consumption 11,749 14,612
Median Rent-to-Consumption .02 .05
Note: Derived from unweighted sample frequencies. Government and highcost sectors omitted.
The evidence suggests that the differences between households are a matterof degree rather than kind. Diffetrences between units are more substantial,which is in itself suggestive. One possible correction for remaining bias willbe described after we address the other issue, the extent and nature of the netbias in "uncontrolled" rents from the presence of controls.

ESTIMATES OF COSTS AND BENEFITS 71
Selectivity BiasFigure 5.1: Effect of Selectivity Bias
Consider the following potentialsource of bias in the demand and hedonicestimates using households who pay more 60 Cedis Per Month
than the controlled rent as a proxy for"uncontrolled" rents. We have, in 500_
effect, chosen the sample on the basis 400 8 ised Estimat
of the dependent variable; while we R
retain information on controlled e 300 ' '''.
households we don't use those 200 bdEse SampeCuont
observations directly in the estimation.100.
It can be easily shown that this __
is a version of the so-called "censored I 1ncome0(1 2CediS)
sample" problem simply illustrated intwo dimensions in Figure 5.1.iY Supposethe unobserved true relationship between (say) uncontrolled rents and incomecould be represe-ited by the data points in the figure, and the heavy regressionline through those points. But in the procedure adopted above, we stated thatany rents lower than $30061 were denoted as controlled. In Figure 5.1 theregression estimate of the relationship is biased because the two points lyingbelow the dotted line aren't included in the estimation.
More formally, the model is
lnR. = XB + m (if R > 300)
Ru is unobserved (if R < 300)
where R, is "uncontrolled" rent, R is rent (controlled or not), and XB are thevectors of demand (or hedonic) determinants and coefficients; m is the errorterm.
Randall Olsen (1980) has proposed a simple consistent estimator for suchmodels. In brief, the method works as follows. Estimate a linear probabilitymodel for selection into the sample, and then use the predicted value from theprobability model to construct an explanatory variable in the hedonic and demandregressions in turn.
5.! Censored samples are those in which observations on particular values ofthe dependent variable (here "uncontrolled" rent) are not available butthe right hand side variables are, permitting estimation of the probabilityof being in the selected sample. Another important class of problem, wherethe right hand side variables are also unobserved, is known as truncatedsamples, and is more difficult to handle. See Maddala (1986), and Heckman(1979).
i./ Actually a set of cutoffs depending on type of unit, but the graphrepresents the basic idea.

72
Even if the estimated regression coefficients change with the inclusionof the correction variable, the prediction for individual households may or maynot change. Since the purpose of these regression models is predicting totalrent, the question is whether the selectivity bias correction makes muchdifference in estimating PmQc and PmQm, and hence the final cost-benefitresults. 71
We applied Olsen's estimator in preliminary work. This procedure made noappreciable difference in the predictive power of the hedonic or demandregressions; nor did they affect the predictions themselves, or the cost-benefitestimates derived from them. The estimates of PmQm and PmQc were the same within3 percent with and without the correction. For the rest of this paper,therefore, we report results based on models without this correction. Thealternative estimates are available on request.
Net versus Gross Rent
So far we have focused on net: rents, that is on the monthly payment tolandlord for housing services. However, we noted above that some householdspay advance and/or key money. Some tenants also pay directly for variousutilities or services associated with the dwelling. In some markets tenantspay for maintenance of houses, or evren upgrade them.81
In Kumasi few households pay diLrectly for utilities. Among other reasons,they aren't often provided. Few rental households were found to pay formaintaining their unit. For this study gross rent is therefore defined as netrent plus (when relevant) the imputed value of paying in advance.9/
Recall that advance payments can be converted into an approximate rentequivalent RE:
7.1 See Butler (1983) and Ozanne and Malpezzi (1985) for more details on therobustness of predictions versus robustness of coefficients.
t./ Malpezzi (1986) describes these in some detail for Cairo. Side payments-- key money, utilities, tenant expenditures on maintenance and upgrading -- accounted for a significant fraction of gross rent in Cairo.
i/ For households which have paid advances in the past which have amortized,gross rent and net rents are equal.

ESTIMATES OF COSTS AND BENEFITS 73
nA = Z RE/(l+r+p)t
t=l
where A = advance paymentn = number of periods in advancer = real discount ratep = rate of price increaset = time period.
Figure 5.2: Advance by Length of Tenure
Some 105 out of 754 sample 1000 Cedis N (Out of B89 Renters)
households made advance payments in lieu _ a,m oof rent for a specified period (14 A 50 0 -+ Median B0 N
percent). A nominal discount rate of 20 d S NEmber u
percent was used to calculate the rental I 4O e
equivalent. While it might be expected e 304 0
that households with higher incomes would 2 4 C
be willing to pay higher advances to u A 20A S
secure a rental unit of their choice, '10 20
advances were not highly correlated with total consumption. as 0
Length of Tenure (Years)
Figure 5.2 shows that, accordingto the sample of 105, at least some advances have increased markedly in recentyears. Since 1980 the median advance -- of those who report advance -- is onthe order of 2-12,000 cedis, and up to maxima of 15-50,000. The latter represent50-167 months typical rent. The relative frequency of households paying advancehas also increased.
Anecdotal Recent Evidence on Increase in Advances
The 1986 survey was carried out at a time when, with the recent decreeraising controlled rents to a level above that to which rents had creptinformally, landlords were satisfied. Since that time, however, prices haverisen very rapidly while rents have not and landlords have begun to demandadvances from all-comers. By early 1988, anecdotal evidence pointed to all newtenancies being subject to between two and five years' rent in advance and evensome existing tenants being asked for their rent to be paid yearly in advance.At that time, the general belief appeared to be that an amount of, say, twentytimes C300 would last twenty months unless controlled rents were increased.However, this appears to have been over-optimistic on the tenant's part.
In February, 1989, it was universal practice to ask for advances from allrenters, except where landlords had strong personal relationships (an advantagefor particularly long-standing tenants). Renters were reporting that theiradvances were being used up at a rate of about C1,000 (US$4) per month per roomand the advance demanded was C50,000 (US$190) or more for a single room orC250,000 (US$960) for a self-contained apartment.

74
Any renter opposing the landlord and seeking satisfaction from the Rentand Housing Committee may win his case but would find that the provision in therent laws allowing eviction in order to accommodate the owner's family memberswould nullify his pyrrhic victory.
While advances are and were growing in amount and frequency, they werenot sufficiently widespread in 1986 to have much effect on rents in theaggregate. Table 5.2 presents the comparison of net and gross rents. While itdoesn't make much difference with the 1986 sample, we will henceforth work withgross rents.
Table 5.2: Gross and Net Rents Compared
Net Net Rent to Gross Gross Rent toRent Consumption Rent Constunption(cedis)
Units Payina Some Advance
Median 300 .04 318 ..04N 105 105 105 105
All Units
Median 300 .02 300 .02N 754 722 754 722
Note: Unweighted statistics, government and high cost units omitted.
C. PcOc: Current Rent Paid
The first piece of information, the rent currently paid in the controlledunit, PcQc, is directly available from the sample survey. Again, to improvecomparability, government and high cost units are omitted from the sample. Thedistribution of gross rents paid in the two remaining (and largest) sectors ispresented in Table 5.3 and corresponding Figure 5.3.101
j2/ In Figure 5.3, as in similar figures below, the first and third quartilesof each variable are represented by the top and bottom "ticks" orhorizontal line; the median by the middle tick.
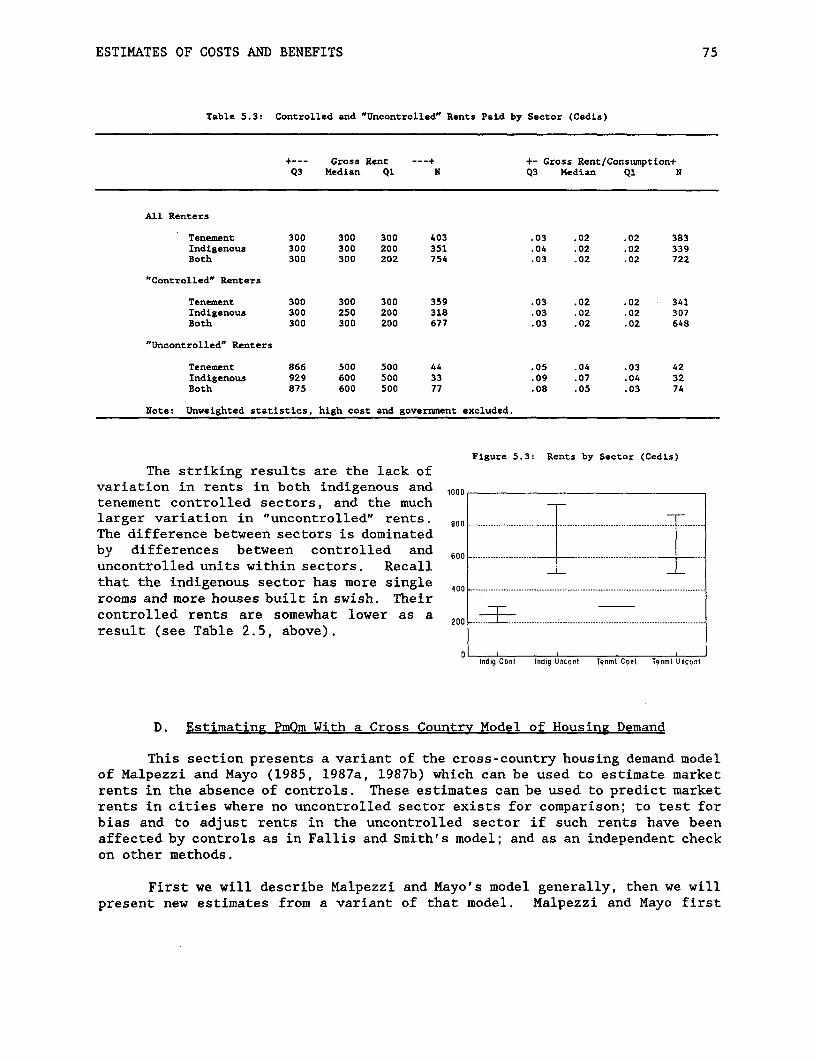
ESTIMATES OF COSTS AND BENEFITS 75
Table 5.3: Controlled and 'Uncontrolled' Rents Paid by Sector (Cedis)
+--- Gross Rent --- + +- Gross Rent/Consumption+Q3 Median Qi N Q3 Median Q1 N
All Renters
Tenement 300 300 300 403 .03 .02 .02 383Indigenous 300 300 200 351 .04 .02 .02 339Both 300 300 202 754 .03 .02 .02 722
"Controlled' Renters
Tenement 300 300 300 359 .03 .02 .02 341Indigenous 300 250 200 318 .03 .02 .02 307Both 300 300 200 677 .03 .02 .02 648
"Uncontrolled' Renters
Tenement 866 500 500 44 .05 .04 .03 42Indigenous 929 600 500 33 .09 .07 .04 32Both 875 600 500 77 .08 .05 .03 74
Note: Unweighted statistics, high cost and government excluded.
Figure 5.3: Rents by Sector (Cedis)
The striking results are the lack ofvariation in rents in both indigenous and 1000
tenement controlled sectors, and the muchlarger variation in "uncontrolled" rents. aS. --.--------8--------------------.-----------------------
The difference between sectors is dominatedby differences between controlled and 600 ------------------------ - - ------------------- --- .
uncontrolled units within sectors. Recallthat the indigenous sector has more single 400
rooms and more houses built in swish. Theircontrolled rents are somewhat lower as a 200 _ Iresult (see Table 2.5, above).
0Indig Conl Indig Uncont Tenmt Cont Tenmt Uncont
D. Estimating PmOm With a Cross Country Model of Housing Demand
This section presents a variant of the cross-country housing demand modelof Malpezzi and Mayo (1985, 1987a, 1987b) which can be used to estimate marketrents in the absence of controls. These estimates can be used to predict marketrents in cities where no uncontrolled sector exists for comparison; to test forbias and to adjust rents in the uncontrolled sector if such rents have beenaffected by controls as in Fallis and Smith's model; and as an independent checkon other methods.
First we will describe Malpezzi and Mayo's model generally, then we willpresent new estimates from a variant of that model. Malpezzi and Mayo first

76
estimated a simple log-linear model of housing expenditures in each of thesixteen cities:
ln R = a + E. (ln y) + bH + cH 2 + U
where R is rent; y is income; H is household size; Ey is the estimated incomeelasticity of demand; a, b, and c are regression coefficients, and u is anestimated disturbance. The model was stratified for renters and owners. Forrenters, rent was defined as net rent, exclusive of separate utility payments.For owners, rent was defined variously, and in order of availabi.lity, as ownerimputations of net rent, hedonic estimates of net rent based on applying renter-based hedonic price equations to owners' housing characteristics, or imputedrents based on applying a fixed amortization ratio (from one percent to one andone-half percent per month depending on the country) to owners' estimates ofhousing value. While other functional forms were tried, and other demographicvariables were included in alternative estimating equations, results from thesimple log-linear model were found to provide adequate fits and robust findingsregarding major demand parameters.

Table 5.4: Malpezzi and Mayo Demand Results
Renters Owners
Log HH HH size R-squared Log HE HH size R-squared
Country City Constant Income Size Squared N Constant Income Size Squared N
Colombia Bogota (coef) 1.11 0.66 0.09 -0.006 0.40 0.77 0.75 -0.00 -0.003 0.49
(1978) (std err) 0.03 0.03 0.003 1016 0.03 0.04 0.003 821
Cali (coef) 2.81 0.44 0.13 -0.006 0.27 1.25 0.69 -0.05 -0.000 0.38
(1978) (3td err) 0.06 0.07 0.007 257 0.06 0.07 0.005 256
Egypt Cairo (coef) 0.25 0.46 -0.17 0.010 0.16 0.89 0.17 0.12 -0.009 0.06(1981) (std err) 0.06 0.09 0.008 303 0.12 0.21 0.019 76
Beni Suef (coef) -1.2 0.51 0.38 -0.047 0.25 -0.09 0.42 0.14 -0.003 0.23
(1981) (std err) 0.14 0.28 0.029 63 0.13 0.14 0.010 63
El Salvador Santa Ana (coef) 0.37 0.48 0.13 -0.014 0.16 -2.5 1.11 -0.06 -0.004 0.37
(1980) (std err) 0.11 0.08 0.007 131 0.11 0.12 0.009 169
Sonsonate (coef) 0.79 0.50 -0.10 0.007 0.16 0.39 0.79 -0.13 0.001 0.57(1980) (std err) 0.12 0.09 0.007 83 0.15 0.17 0.012 27
Ghana Kumasi (coef) 0.82 0.33 0.02 0.000 0.11 - - - -
(1980) (std err) 0.04 0.03 0.002 814 - - _ -
India Bangalore (coef) 0.66 0.58 -0.08 0.003 0.18 2.84 0.43 -0.17 0.007 0.15
(1975) (3td err) 0.04 0.04 0.002 1041 0.08 0.06 0.004 205
Jamaica Kingston (coef) -0.12 0.70 0.16 -0.012 0.30 - - - -
(1975) (std err) 0.08 0.07 0.007 223 - - - -
Korea Seoul (coef) 5.04 0.45 0.07 -0.004 0.15 6.06 0.44 -0.04 0.002 0.12
(1979) (std err) 0.03 0.04 0.005 952 0.04 0.04 0.003 952
Busan (coef) 6.26 0.31 0.05 -0.001 0.08 5.93 0.45 -0.05 0.002 0.10(1979) (std err) 0.07 0.06 0.006 508 0.08 0.10 0.011 296
Taegu (coef) 4.95 0.44 0.03 -0.003 0.23 6.32 0.47 -0.19 0.011 0.18(1979) (atd err) 0.07 0.07 0.008 292 0.08 0.08 0.006 152
Kwangju (coef) 2.70 0.62 0.09 -0.002 0.32 7.53 0.41 -0.27 0.018 0.14
(1979) (std err) 0.09 0.13 0.014 134 0.11 0.18 0.016 84
Oth.K.c. (coef) 3.33 0.54 0.04 0.002 0.17 2.16 0.79 -0.12 0.003 0.26
(1979) (std err) 0.05 0.05 0.007 1000 0.05 0.05 0.005 779
Philippines Davao (coef) -1.6 0.88 0.00 -0.002 0.42 -3.2 0.99 0.04 -0.004 0.28
(1979) (std err) 0.03 0.05 0.002 1376 0.04 0.04 0.003 1968
Manila (coef) 1.27 0.56 0.01 -0.002 0.22 2.46 0.57 -0.02 -0.000 31
(1983) (std err) 0.04 0.04 0.003 605 0.04 0.05 0.003 390
U.S. Pittsburg (coef) 3.07 0.26 -0.02 -0.002 0.15 3.50 0.18 0.08 -0.005 0.21
(1975) (std err) 0.02 0.04 0.005 946 0.01 0.02 0.002 2378
Phoenix (coef) 3.68 0.18 0.12 -0.015 0.13 3.62 0.18 0.13 -0.011 0.24(1975) (std err) 0.02 0.03 0.005 918 0.01 0.01 0.002 2284
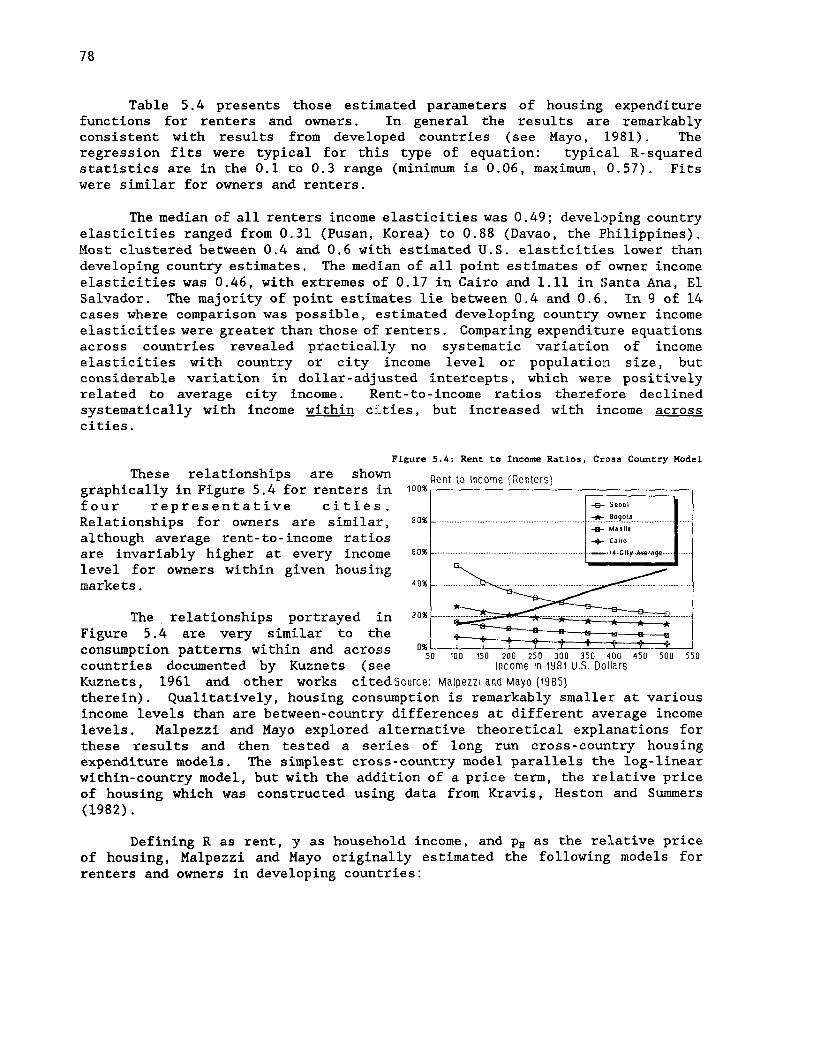
78
Table 5.4 presents those estimated parameters of housing expenditurefunctions for renters and owners. In general the results are remarkablyconsistent with results from developed countries (see Mayo, 1981). Theregression fits were typical for this type of equation: typical R-squaredstatistics are in the 0.1 to 0.3 range (minimum is 0.06, maximum, 0.57). Fitswere similar for owners and renters.
The median of all renters income elasticities was 0.49; developing countryelasticities ranged from 0.31 (Pusan, Korea) to 0.88 (Davao, the Philippines).Most clustered between 0.4 and 0.6 with estimated U.S. elasticities lower thandeveloping country estimates. The median of all point estimates of owner incomeelasticities was 0.46, with extremes of 0.17 in Cairo and 1.11 in Santa Ana, ElSalvador. The majority of point estimates lie between 0.4 and 0.6. In 9 of 14cases where comparison was possible, estimated developing country owner incomeelasticities were greater than those of renters. Comparing expenditure equationsacross countries revealed practical]ly no systematic variation of incomeelasticities with country or city income level or populationa size, butconsiderable variation in dollar-adjusted intercepts, which were positivelyrelated to average city income. Rent-to-income ratios therefore declinedsystematically with income within ciLties, but increased with income acrosscities.
Figure 5.4: Rent to Income Ratios, Cross Country Model
These relationships are shown Rent to Income (Renters)graphically in Figure 5.4 for renters in 100%
f our representative cities. Seou
Relationships for owners are similar, 9°% .. Bogol I ----- ------- Manifa
although average rent-to-income ratios Cair
are invariably higher at every incorne 60%.--------------- - ---- e----
level for owners within given housingmarkets. 4DX _ 1
The relationships portrayed in 20%. -------- =.......
Figure 5.4 are very similar to theconsumption patterns within and across 0%5 a lC 150 200 250 300 350 NO0 450 500 S'50
countries documented by Kuznets (see Income in 1981 U.S. DollarsKuznets, 1961 and other works citedSource: Malpezzi and Mayo (19B5)therein). Qualitatively, housing consumption is remarkably smaller at variousincome levels than are between-country differences at different average incomelevels. Malpezzi and Mayo explored alternative theoretical explanations forthese results and then tested a series of long run cross-country housingexpenditure models. The simplest cross-country model parallels the log-linearwithin-country model, but with the addition of a price term, the relative priceof housing which was constructed usinig data from Kravis, Heston and Summers(1982).
Defining R as rent, y as household income, and PH as the relative priceof housing, Malpezzi and Mayo originally estimated the following models forrenters and owners in developing countries:

ESTIMATES OF COSTS AND BENEFITS 79
Renters:
In R - 5.39 + 1.60 ln y + 0.15 In PH(0.18) (0.15)
R2 -090d.f. 13
Owners:
ln R 3.57 + 1.38 ln y + 0.65 ln PH(0.35) (0.50)
R2 - 0.76d.f. - 11
where rent, and income are city means converted to 1981 U.S. dollars,1 , and pHis the Kravis-Heston-Summers price index, with the U.S. relative price normalizedat one. Standard errors as in parentheses; R2 is the multiple correlationcoefficient, and d.f. are the numbers of degrees of freedom.
The implications of these models, which were confirmed with alternativespecifications, are straightforward. In the very long run, housing consumptionis income elastic. Price elasticities are smaller in absolute value than incomeelasticities, although confidence intervals are quite wide for the former. Long-run income elasticities are estimated to be slightly higher for renters thanowners. This means that as cities' economies develop over the very long run,that owner and renter consumption patterns increase at a similar pace, ceterisRaribus. However, because renter price elasticities are estimated to be higherthan owner elasticities, the net effect of both incomes and prices rising witheconomic development is that owners' consumption increase faster than renters'consumption over most of the range of the data.
However, Malpezzi and Mayo's sample included both controlled anduncontrolled markets. While they tested for rent control's effects, no preciseor robust effect was found in their sample.121 The cross country price term,which was (unsurprisingly) lower for the controlled markets, seemed to be pickingup most of rent control's measured effects. But the sample was too small to beparticularly confident about this result, and it is singularly inappropriate asa maintained hypothesis for cross country estimates of demand used to evaluate
.i/ Note that in a log-linear expenditure equation the coefficient of priceis equal to one plus the price elasticity; thus the price elasticity isthe estimated coefficient minus one, or -0.85 and -0.35 for owners.
12/ Malpezzi and Mayo did not report these results in any of their publishedpapers, but details are available from the first author.

80
costs and benefits of controls. Therefore Malpezzi et al. (1988) developed newestimates here using only uncontrolled markets.
Malpezzi et al. reestimated the cross country model segmenting the samples bycontrolled and uncontrolled markets..l3/ Reestimating the model above yields thefollowing estimates for uncontrolled markets:
Uncontrolled Renters:
In R = - 4.017 + 1.355 ln y(1.733) (0.299)
R2 .71
d.f. = 7
For controlled markets and the original data the model yields thefollowing:
Controlled Renters:
ln R = - 5.934 + 1.709 ln y(1.412) (0.286)
R2 = .85d.f. = 5
As expected, the point estimate of the elasticity from this uncontrolledsample is greater than one, although the limited degrees of freedom reduces theprecision of the estimates from M&M's original model. Using average sampleincomes of C12,500 and an exchange rate of 90 cedis to the dollar this modelpredicts an average rent-to-income ratio of .09 for Kumasi in 1986.
Of course these estimates from the uncontrolled variant of the Malpezziand Mayo model are estimates of the long run equilibrium average rent-to-incomeratio. In order to predict the uncontrolled rent (PmQm) of particular householdsin a controlled sample--or of representative households at an incomae level aboveor below the average--it is necessary to combine an estimate of the average rent-to-income ratio derived from the cross market model, with an assumed within-market income elasticity. Malpezzi and Mayo found most within-marketelasticities for renters ranged between .4 and .6. If anything these estimatesmay have a slight downward bias, so we suggest using an income elasticityestimate of 0.6.141
L3/ The Kravis-Heston-Summers price term was dropped from the new, smallermodel for reasons described in Malpezzi et al. pp. 47-57.
.i./ Analysis of the individual within-city elasticities from Malpezzi and Mayowas unable to discern any relationship between the elasticities andincome, or between the elasticities and the presence of controls.

ESTIMATES OF COSTS AND BENEFITS 81
There is no question that these estimates could be improved with a stillbetter cross country model. While these estimates are reasonable and we areconfident of their utility for the rent control study, further improving theprecision of these estimates can have a high payoff.15 1
"Uncontrolled" Rents Compared to Predictions from the Cross-Country Model
Table 5.4 showed typical controlled rents to be less than 2 percent oftotal consumption. Median rent-to-consumption level for uncontrolled units was.05. Using the median income for Kumasi in 1986 cedis, Malpezzi et al. (1988)predicted that the median rent-to-income level would be .09 in the absence ofcontrols. However, the median income in the "uncontrolled" sector is about14,750 cedis, compared to about 12,500 for the city as a whole. Using anelasticity of .6 we therefore derived a slightly lower estimate of the typicaluncontrolled rent-to-consumption ratio, .08.
Figure 5.5: Rent-to-Income Comparisons, Various Models
Figure 5.5 presents a simple 14%
comparison of these results. The bottom e 12X -Actua I
line is derived from the actual t Predtcteo i
controlled data (i.e. constrained t 10x -estimates). The middle line is from the c 8% .-- -------------"uncontrolled" Kumasi sample ° 6%. ....(unadjusted). The highest line is from u \the "uncontrolled" demand estimates from V 4% ..............
the cross country model. In Kumasi a I 2% - . .......
household with a typical monthly income n 0%
of US$ 150 or more would have an actual 0 5 10 15 20 25 30
rent to income ratio of 0.025 in the Monthly Consumption (l1OOs)controlled sector (see Table 5.1) . Pred 1: 'Uncontrolled' Demand (Unadj.)controlled sector (see Table 5-1)- EvenPred 2: From Cross Country Model
in the uncontrolled sector with ahousehold monthly income of US$ 195, the rent to income ratio is still only 0.05.The prediction from the cross country model is .09 for the market, .08 for theslightly higher income group in the uncontrolled sector. It appears that thenet effect of the biases on "uncontrolled" rents discussed above and in Fallisand Smith (1984) is to lower "uncontrolled" rents.
Given data on household consumption, the average rent-to-income ratio,and an assumed elasticity (.6), estimating PmQm for each household with thecross country model -- free from such bias -- is straightforward. In addition,when we estimate the hedonic and demand relations below with the "uncontrolled"
L5/ Particularly since there are many other uses of these estimates, such asevaluating shelter projects and other government housing policies. SeeMayo and Gross (1986) and The Urban Edge (1984).

82
sample, the sample rent will be adLjusted (multiplied by 1.6) to reduce thebias. 16/
E. Estimating PmOm With Kumasi Survey Data
As noted above, the rent that households would pay if they were at theirequilibrium demand at market prices (PmQm) can also be estimated from thehousehold survey. Table 5.5 presents the estimated coefficients from theexpenditure regression estimated using the sample of "uncontrolled" renters.Only households in the tenement and indigenous sectors are included. Householdsand (especially) units in the government and high cost sectors are so differentfrom the rest of the sample that they were omitted.17' The dependent variableis gross rent, adjusted as described above (multiplied by 1.6).
The demand results are reasonable, with an R-squared of 0.18. Theestimated consumption elasticity is 0.28. This is a low estimate compared toothers from the Malpezzi and Mayo results above.
The relationship between rents and length of tenure is strong;transformation of the log-log model shows rents falling about 15 percent peryear in the first few years of tenure, and around 1 percent per year at 20 years.The total discount at 20 years and beyond is about 40 percent. There have notbeen many studies of this discount in developing countries; this is high butwithin range of estimates of length of tenure discounts for U.S. cities foundby Malpezzi, Ozanne and Thibodeau (1981). Household size is a weak demanddeterminant.
j6/ See Malpezzi (1986) pp. 129-:L39 and Fallis and Smith (1984) for moredetailed justification.
17/ In general, if we know the "true" model a priori and have all the datanecessary to implement it, we could gain valuable information from theomitted government and high cost units. However neither condition issatisfied, and dropping these sectors as unrepresentative is, we believe,the conservative procedure.
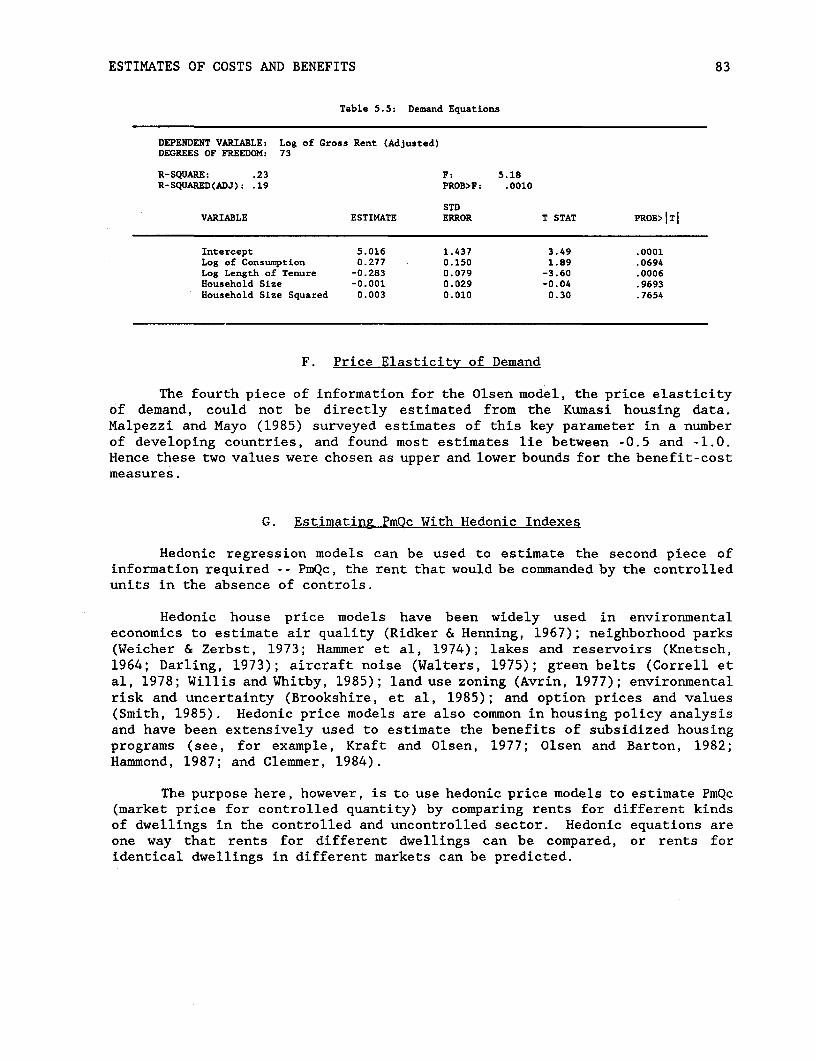
ESTIMATES OF COSTS AND BENEFITS 83
Table 5.5: Demand Equations
DEPENDENT VARIABLE: Log of Gross Rent (Adjusted)DEGREES OF FREEDOM: 73
R-SQUARE: .23 F: 5.18R-SQUARED(ADJ): .19 PROB>F: .0010
STDVARIABLE ESTIMATE ERROR T STAT PROB>ITi
Intercept 5.016 1.437 3.49 .0001Log of Consumption 0.277 0.150 1.89 .0694Log Length of Tenure -0.283 0.079 -3.60 .0006Household Size -0.001 0.029 -0.04 .9693Household Size Squared 0.003 0.010 0.30 .7654
F. Price Elasticity of Demand
The fourth piece of information for the Olsen model, the price elasticityof demand, could not be directly estimated from the Kumasi housing data.Malpezzi and Mayo (1985) surveyed estimates of this key parameter in a numberof developing countries, and found most estimates lie between -0.5 and -1.0.Hence these two values were chosen as upper and lower bounds for the benefit-costmeasures.
G. Estimating PmOc With Hedonic Indexes
Hedonic regression models can be used to estimate the second piece ofinformation required - - PmQc, the rent that would be commanded by the controlledunits in the absence of controls.
Hedonic house price models have been widely used in environmentaleconomics to estimate air quality (Ridker & Henning, 1967); neighborhood parks(Weicher & Zerbst, 1973; Hammer et al, 1974); lakes and reservoirs (Knetsch,1964; Darling, 1973); aircraft noise (Walters, 1975); green belts (Correll etal, 1978; Willis and Whitby, 1985); land use zoning (Avrin, 1977); environmentalrisk and uncertainty (Brookshire, et al, 1985); and option prices and values(Smith, 1985). Hedonic price models are also common in housing policy analysisand have been extensively used to estimate the benefits of subsidized housingprograms (see, for example, Kraft and Olsen, 1977; Olsen and Barton, 1982;Hammond, 1987; and Clemmer, 1984).
The purpose here, however, is to use hedonic price models to estimate PmQc(market price for controlled quantity) by comparing rents for different kindsof dwellings in the controlled and uncontrolled sector. Hedonic equations areone way that rents for different dwellings can be compared, or rents foridentical dwellings in different markets can be predicted.
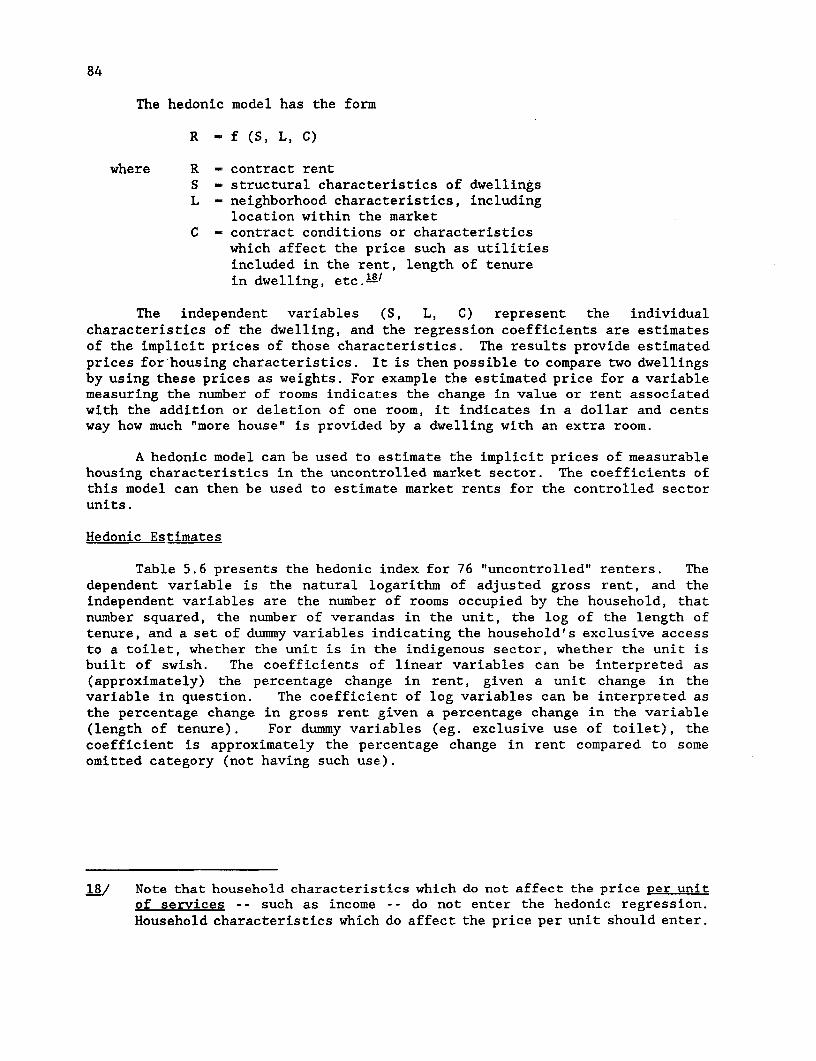
84
The hedonic model has the form
R f (S, L, C)
where R contract rentS = structural characteristics of dwellingsL - neighborhood characteristics, including
location within the marketC - contract conditions or characteristics
which affect the price such as utilitiesincluded in the rent, length of tenurein dwelling, etc.181
The independent variables (S, L, C) represent the individualcharacteristics of the dwelling, and the regression coefficients are estimatesof the implicit prices of those characteristics. The results provide estimatedprices for housing characteristics. It is then possible to compare two dwellingsby using these prices as weights. For example the estimated price for a variablemeasuring the number of rooms indicates the change in value or rent associatedwith the addition or deletion of one room, it indicates in a dollar and centsway how much "more house" is providecd by a dwelling with an extra room.
A hedonic model can be used to estimate the implicit prices of measurablehousing characteristics in the uncontrolled market sector. The coefficients ofthis model can then be used to estimate market rents for the controlled sectorunits.
Hedonic Estimates
Table 5.6 presents the hedonic index for 76 "uncontrolled" renters. Thedependent variable is the natural logarithm of adjusted gross rent, and theindependent variables are the number of rooms occupied by the household, thatnumber squared, the number of verandas in the unit, the log of the length oftenure, and a set of dummy variables indicating the household's exclusive accessto a toilet, whether the unit is in the indigenous sector, whether the unit isbuilt of swish. The coefficients of linear variables can be interpreted as(approximately) the percentage change in rent, given a unit change in thevariable in question. The coefficient of log variables can be interpreted asthe percentage change in gross rent given a percentage change in the variable(length of tenure). For dummy variables (eg. exclusive use of toilet), thecoefficient is approximately the percentage change in rent compared to someomitted category (not having such use).
1L8 Note that household characteristics which do not affect the price per unitof services -- such as income -- do not enter the hedonic regression.Household characteristics which do affect the price per unit should enter.
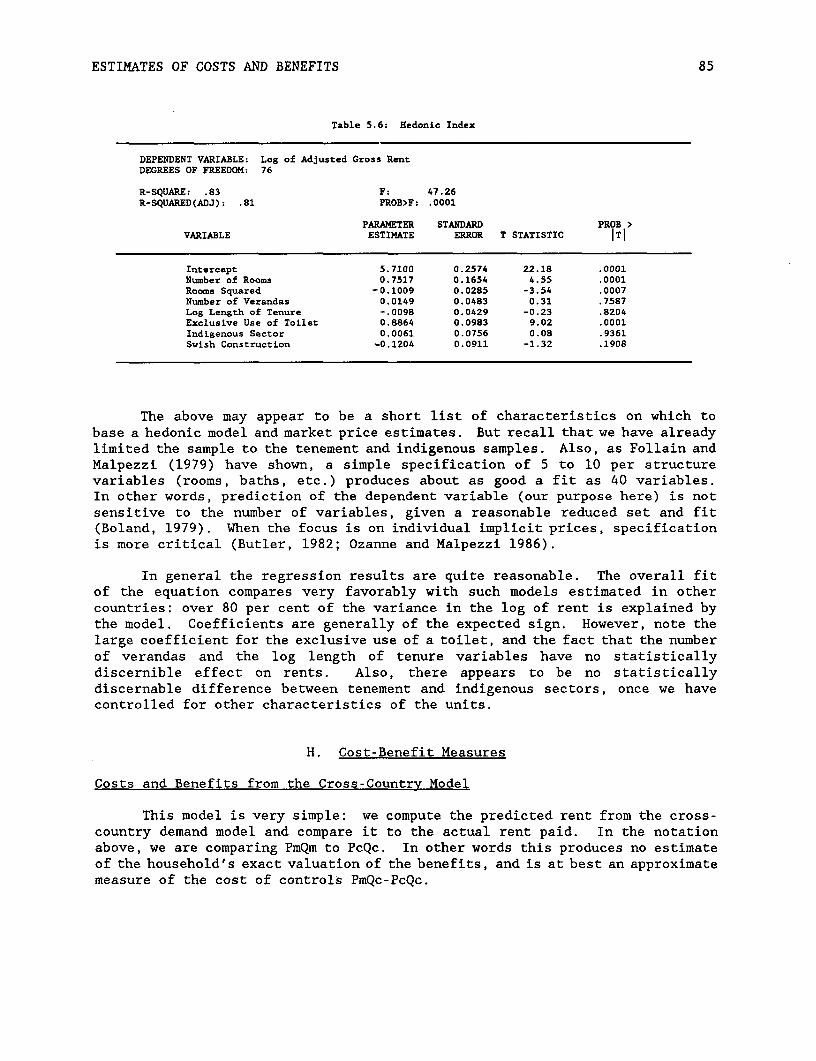
ESTIMATES OF COSTS AND BENEFITS 85
Table 5.6: Hedonic Index
DEPENDENT VARIABLE: Log of Adjusted Gross RentDEGREES OF FREEDOM: 76
R-SQUARE: .83 F: 47.26R-SQUARED(ADJ): .81 PROB>F: .0001
PARAMETER STANDARD PROB >VARIABLE ESTIMATE ERROR T STATISTIC ITI
Intercept 5.7100 0.2574 22.18 .0001Number of Rooms 0.7517 0.1654 4.55 .0001Rooms Squared -0.1009 0.0285 -3.54 .0007Number of Verandas 0.0149 0.0483 0.31 .7587Log Length of Tenure -.0098 0.0429 -0.23 .8204Exclusive Use of Toilet 0.8864 0.0983 9.02 .0001Indigenous Sector 0.0061 0.0756 0.08 .9361Swish Construction -0.1204 0.0911 -1.32 .1908
The above may appear to be a short list of characteristics on which tobase a hedonic model and market price estimates. But recall that we have alreadylimited the sample to the tenement and indigenous samples. Also, as Follain andMalpezzi (1979) have shown, a simple specification of 5 to 10 per structurevariables (rooms, baths, etc.) produces about as good a fit as 40 variables.In other words, prediction of the dependent variable (our purpose here) is notsensitive to the number of variables, given a reasonable reduced set and fit(Boland, 1979). When the focus is on individual implicit prices, specificationis more critical (Butler, 1982; Ozanne and Malpezzi 1986).
In general the regression results are quite reasonable. The overall fitof the equation compares very favorably with such models estimated in othercountries: over 80 per cent of the variance in the log of rent is explained bythe model. Coefficients are generally of the expected sign. However, note thelarge coefficient for the exclusive use of a toilet, and the fact that the numberof verandas and the log length of tenure variables have no statisticallydiscernible effect on rents. Also, there appears to be no statisticallydiscernable difference between tenement and indigenous sectors, once we havecontrolled for other characteristics of the units.
H. Cost-Benefit Measures
Costs and Benefits from the Cross-Country Model
This model is very simple: we compute the predicted rent from the cross-country demand model and compare it to the actual rent paid. In the notationabove, we are comparing PmQm to PcQc. In other words this produces no estimateof the household's exact valuation of the benefits, and is at best an approximatemeasure of the cost of controls PmQc-PcQc.

86
Table 5.7: Summary Cost-Beniefit Measures From Cross Country Model
Actual PredictedRent Rent DifferencePcQc PmQm PmQm-PcQc
Tenement Sample
Mean 290 1179 887
Q3 300 1334 1043Median 300 1162 868Q1 300 999 711
N 358 338 338
RepresentativeConsumer 300 1162 862
Indigenous Sample
Mean 244 1040 795
Q3 300 1186 955Median .250 1025 766qi .200 829 584
N 322 312 312
RepresentativeConsumer .250 1025 775
Figure 5.6: Rents and Predictions from the Cross Country
The implicit assumption is thatModel
the cross country demand results can be 1400
used to predict long run competitive 1200 -
equilibrium rents in Kumasi. While we +have confidence in these cross country 100°
demand models, it is clear that in any G0o 0
event the difference between estimatesof PmQm and actual PcQc is large enough 600
to dominate any likely imprecision of 400
the estimates. Table 5.7 andcorresponding Figure 5.6 present 200 Tsummaries of the results. Note that rows aof the table do not add up exactly, PcOc Pmom PmQm-PcQc
because the sum or difference of mediansNote: Costs cannot be distinguishedfro tineftS iththiS Model.
(or of other statistics) is not generallythe median of the sum or difference. The controlled rents are overwhelminglyin the range of 200 to 300 cedis. T'he estimates of uncontrolled rents from thecross country model range from 800 to 1300. These results are so strong thatthey could be described as a "smoking gun."

ESTIMATES OF COSTS AND BENEFITS 87
PmQm-PcQc is the estimated difference between expenditures with andwithout controls. We can compare these results with those from Olsen's method,presented in the next section. How efficient is the transfer of purchasingpower to tenants, i.e. are the benefits received by tenants in line with thecosts?
Costs and Benefits Constructed from the Hedonic and Demand Equations
Table 5.8 and corresponding Figure 5.7 present estimates of the variouswelfare measures and their components, using a variant of Olsen's model whichwas described in Chapter 4.
Each welfare measure can be calculated separately for each sampleobservation (the approach used to derive the sample statistics); or calculatedfor a representative consumer, constructed using, say, medians of thecomponents. The two approaches do not yield exactly the same results. Again,note that rows of the table do not add up, because the sum or difference ofmedians (or of other statistics) is not generally the median of the sum ordifference.
The representative consumer rows are calculated for a representativerenter using median values of the components PcQc, PmQc and PmQm. Computingcosts and benefits separately for each observation allows us to study theirdistribution. But since the true demand relation is unknown, and everyhousehold is off their estimated demand curve, there is no information in thesample to sort out how much of the difference between costs and benefits is dueto the stochastic nature of the demand relation, and how much is due to rentcontrol (Olsen and Agrawal, 1982; Malpezzi, 1986; Gyourko and Linneman, 1986).However, unlike Malpezzi (1986) and the other studies cited, we see from Table5.8 that both approaches yield similar results in the Kumasi case.
88
Table 5.8: Cost-Benefit Measures From Survey Demand and Hedonic Models
Current Market Est.d. MedianCont- Rent for Rent Cost of Tenant Efficiency,rolled Current with no Rent Control Benefits Ep=-lRent Unit Controls Subsidy 1 2 (Benefit/Cost)PcQc PmQc PmQm (PmQc-PcQc) (Ep=-l) (Ep=-0.5)
Tenement Sample
Mean 290 613 1094 332 106 -264
Q3 300 580 1220 287 221 125Median 300 574 1040 274 135 -76 0.50Q1 300 570 909 270 14 -415
N 358 343 328 343 328 328
RepresentativeConsumer 300 574 1040 274 122 -105 0.45
Indigenous Sa ole
Mean 244 563 1105 319 72 -382
Q3 300 580 1205 370 221 80Median 250 574 1044 291 123 -127 0.41Q1 200 513 910 275 -17 -542
N 322 319 311 319 310 310
RepresentativeConsumer 250 574 1044 324 169 -61 0.52
The key results from Table 5.8 are:
(a) Renters pay a fraction of the estimated market rents for their units.The rent paid is only 43 percent of the estimated markest rent in theindigenous sector, and 52 percent in the tenement sector. Furthermore,while the controlled rents :PcQc hardly vary, the estimated market rentsPmQc vary with size and type of unit. Market demand PmQm varies evenmore.
(b) The median cost of the subsidy implied by these rent reductions isestimated to be about 274 cedis per month in the tenement and 291 inindigenous sector.
(c) But household would (we estimate) spend even more on housing in theabsence of controls. Median PmQm is over 1000 cedis in both sectors.
(d) Comparing PmQc and PmQm it appears that while units rent for lessbecause of controls, households would spend even more at market prices;that is, consumption of housing services has been greatly reduced undercontrols.
(e) Rent control imposes a landlord cost (PmQc-PcQc), which exceeds thenet benefit to tenants in both sectors. This cost to landlordsapproximates only the static cost of rent control. Dynamic costs,which can also be large, are discussed in the next chapter.
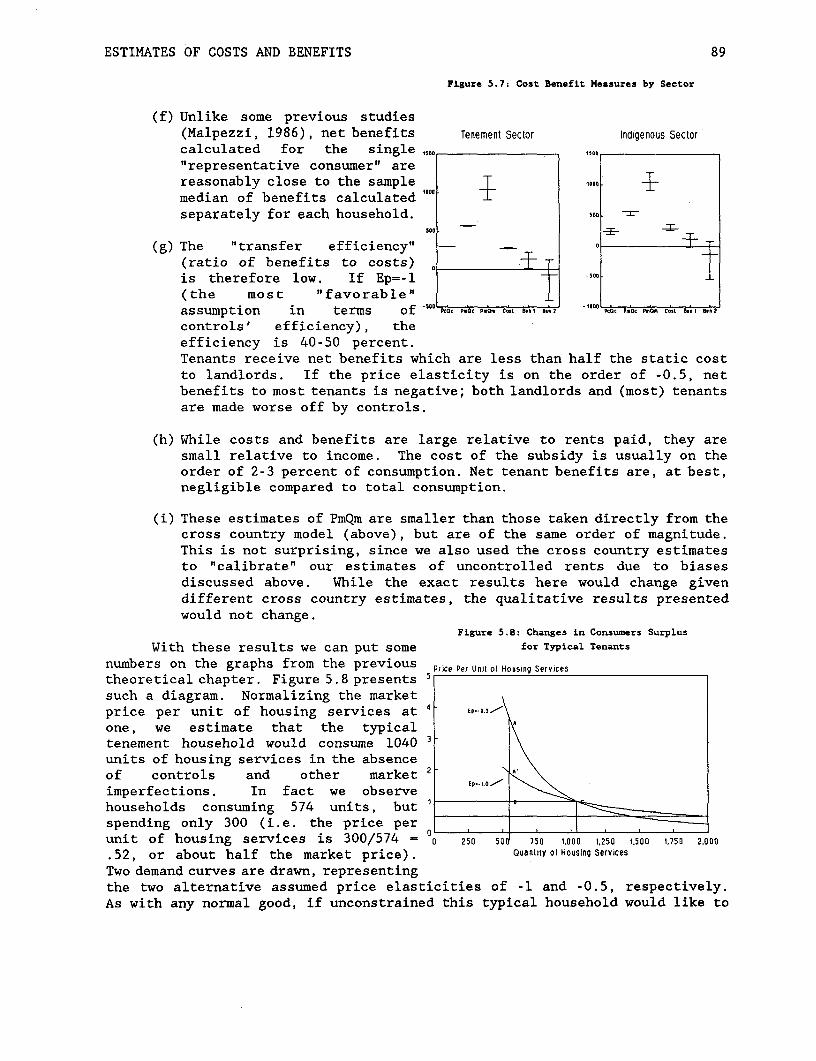
ESTIMATES OF COSTS AND BENEFITS 89
Figure 5.7: Cost Benefit Measures by Sector
(f) Unlike some previous studies(Malpezzi, 1986), net benefits Tenement Sector Indigenous Sectorcalculated for the single"representative consumer" arereasonably close to the sample 1T1- 1e
median of benefits calculated 10
separately for each household.
(g) The "transfer efficiency" -
(ratio of benefits to costs) Tis therefore low. If Ep=-l SnD
(the most "favorable"assumption in terms of k0 P.Oc P.O . Cst B.,I B.. 2f poos pMfck P.mO Cost I, Bet
controls' efficiency), theefficiency is 40-50 percent.Tenants receive net benefits which are less than half the static costto landlords. If the price elasticity is on the order of -0.5, netbenefits to most tenants is negative; both landlords and (most) tenantsare made worse off by controls.
(h) While costs and benefits are large relative to rents paid, they aresmall relative to income. The cost of the subsidy is usually on theorder of 2-3 percent of consumption. Net tenant benefits are, at best,negligible compared to total consumption.
(i) These estimates of PmQm are smaller than those taken directly from thecross country model (above), but are of the same order of magnitude.This is not surprising, since we also used the cross country estimatesto "calibrate" our estimates of uncontrolled rents due to biasesdiscussed above. While the exact results here would change givendifferent cross country estimates, the qualitative results presentedwould not change.
FLgure 5.8: Changes in Consumers Surplus
With these results we can put some for Typical Tenants
numbers on the graphs from the previous Price Per Unit of Housing Services
theoretical chapter. Figure 5.8 presents 5such a diagram. Normalizing the marketprice per unit of housing services at 4 Ep-0..
one, we estimate that the typicaltenement household would consume 1040 3units of housing services in the absenceof controls and other market 2 E
imperfections. In fact we observehouseholds consuming 574 units, butspending only 300 (i.e. the price per unit of housing services is 300/574 = 0 250 50 750 010 0 1,250 1,500 1,750 20 00
.52, or about half the market price). Quantity of Housing Services
Two demand curves are drawn, representingthe two alternative assumed price elasticities of -1 and -0.5, respectively.As with any normal good, if unconstrained this typical household would like to
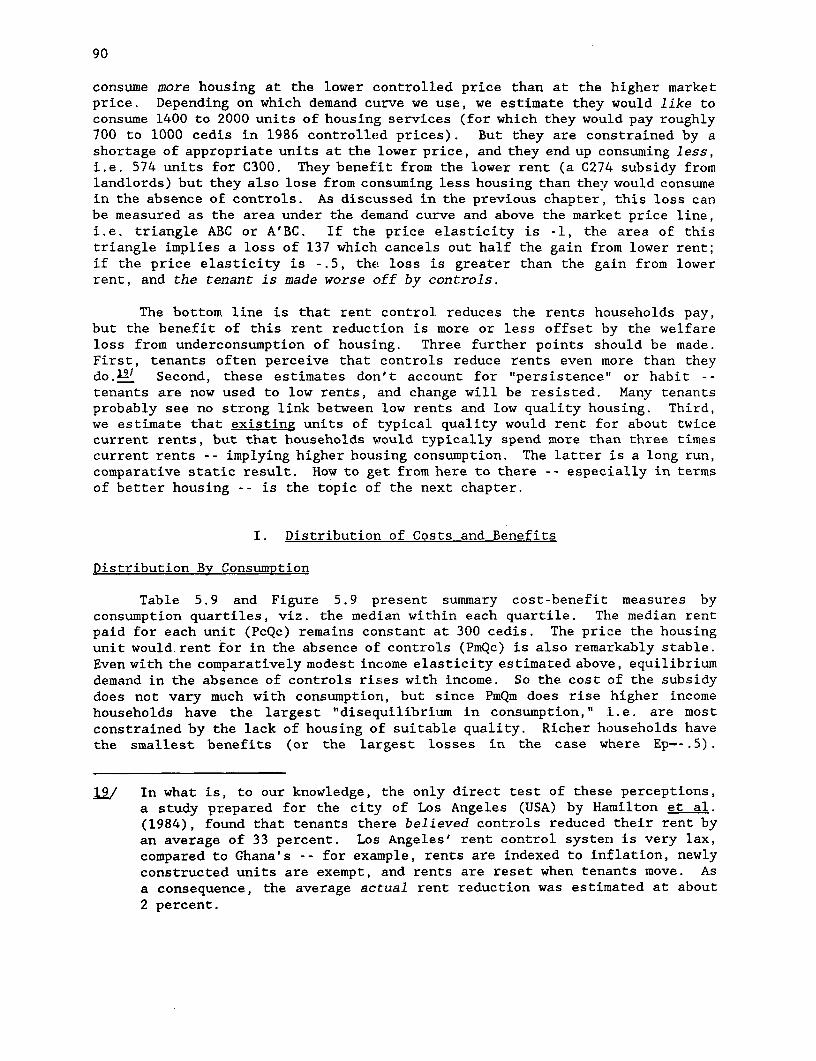
90
consume more housing at the lower controlled price than at the higher marketprice. Depending on which demand curve we use, we estimate they would like toconsume 1400 to 2000 units of housinig services (for which they would pay roughly700 to 1000 cedis in 1986 controlled prices). But they are constrained by ashortage of appropriate units at the lower price, and they end up consuming less,i.e. 574 units for C300. They benefit from the lower rent (a C274 subsidy fromlandlords) but they also lose from consuming less housing than they would consumein the absence of controls. As discussed in the previous chapter, this loss canbe measured as the area under the demand curve and above the market price line,i.e. triangle ABC or A'BC. If the price elasticity is -1, the area of thistriangle implies a loss of 137 which cancels out half the gain from lower rent;if the price elasticity is -.5, the loss is greater than the giain from lowerrent, and the tenant is made worse off by controls.
The bottom line is that rent control reduces the rents households pay,but the benefit of this rent reduction is more or less offset by the welfareloss from underconsumption of housing. Three further points should be made.First, tenants often perceive that controls reduce rents even more than theydo.19/ Second, these estimates don't account for "persistence" or habit --tenants are now used to low rents, and change will be resisted. Many tenantsprobably see no strong link between low rents and low quality housing. Third,we estimate that existing units of typical quality would rent for about twicecurrent rents, but that households would typically spend more than three timescurrent rents - - implying higher housing consumption. The latter is a long run,comparative static result. How to get from here to there -- especially in termsof better housing -- is the topic of the next chapter.
I. Distribution of Costs and Benefits
Distribution By Consumption
Table 5.9 and Figure 5.9 present summary cost-benefit measures byconsumption quartiles, viz. the mediian within each quartile. The median rentpaid for each unit (PcQc) remains constant at 300 cedis. The price the housingunit would. rent for in the absence of controls (PmQc) is also remarkably stable.Even with the comparatively modest income elasticity estimated above, equilibriumdemand in the absence of controls rises with income. So the cost of the subsidydoes not vary much with consumption, but since PmQm does rise higher incomehouseholds have the largest "disequilibrium in consumption," i.e. are mostconstrained by the lack of housing ofE suitable quality. Richer households havethe smallest benefits (or the largest losses in the case where Ep=-.5).
I./ In what is, to our knowledge, the only direct test of these perceptions,a study prepared for the city of Los Angeles (USA) by Hamilton et al.(1984), found that tenants there believed controls reduced their rent byan average of 33 percent. Los Angeles' rent control system is very lax,compared to Ghana's -- for example, rents are indexed to inflation, newlyconstructed units are exempt, and rents are reset when tenants move. Asa consequence, the average actual rent reduction was estimated at about2 percent.
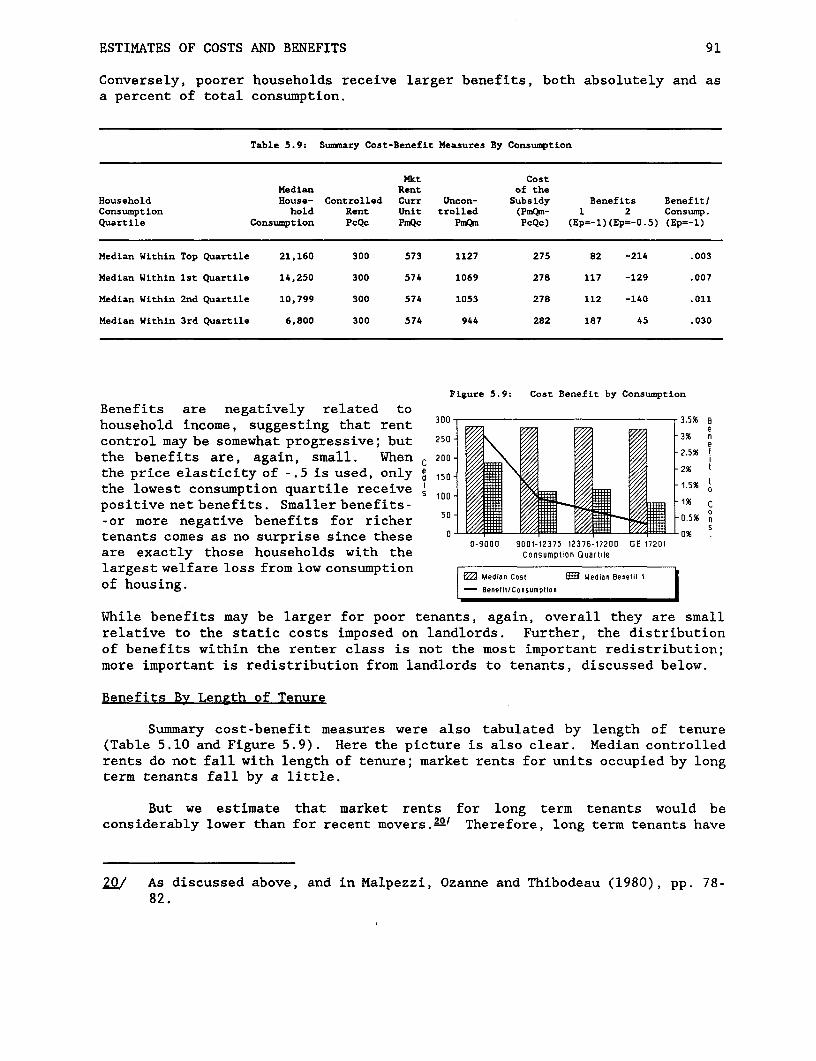
ESTIMATES OF COSTS AND BENEFITS 91
Conversely, poorer households receive larger benefits, both absolutely and asa percent of total consumption.
Table 5.9: Summnary Cost-Benefit Measures By Consumption
Mkt CostMedian Rent of the
Household House- Controlled Curr Uncon- Subsidy Benefits BenefitlConsumption hold Rent Unit trolled (PmQm- 1 2 Consump.Quartile Consumption PcQc PmQc PmQM PcQc) (Ep=-l)(Ep=-0.5) (Ep=-1)
Median Within Top Quartile 21,160 300 573 1127 275 82 -214 .003
Median Within 1st Quartile 14,250 300 574 1069 278 117 -129 .007
Median Within 2nd Quartile 10,799 300 574 1053 278 112 -140 .011
Median Within 3rd Quartile 6,800 300 574 944 282 187 45 .030
Figure 5.9: Cost Benefit by Consumption
Benefits are negatively related tohousehold income, suggesting that rent e
control may be somewhat progressive; but 250 3% e
the benefits are, again, small. When c 200 2.5%
the price elasticity of -. 5 is used, only e 150 1.%t
the lowest consumption quartile receive 5 10 .
positive net benefits. Smaller benefits- 0E %c
-or more negative benefits for richer s%tenants comes as no surprise since these 0 9001-a2375 12376-17200 GE 17201
are exactly those households with the Consumption Quartile
largest welfare loss from low consumption CM Medi CoSt E Median Benefit I
of housing. l-Benefl.Coonsumption
While benefits may be larger for poor tenants, again, overall they are smallrelative to the static costs imposed on landlords. Further, the distributionof benefits within the renter class is not the most important redistribution;more important is redistribution from landlords to tenants, discussed below.
Benefits By Length of Tenure
Summary cost-benefit measures were also tabulated by length of tenure(Table 5.10 and Figure 5.9). Here the picture is also clear. Median controlledrents do not fall with length of tenure; market rents for units occupied by longterm tenants fall by a little.
But we estimate that market rents for long term tenants would beconsiderably lower than for recent movers.'l Therefore, long term tenants have
2./ As discussed above, and in Malpezzi, Ozanne and Thibodeau (1980), pp. 78-82.
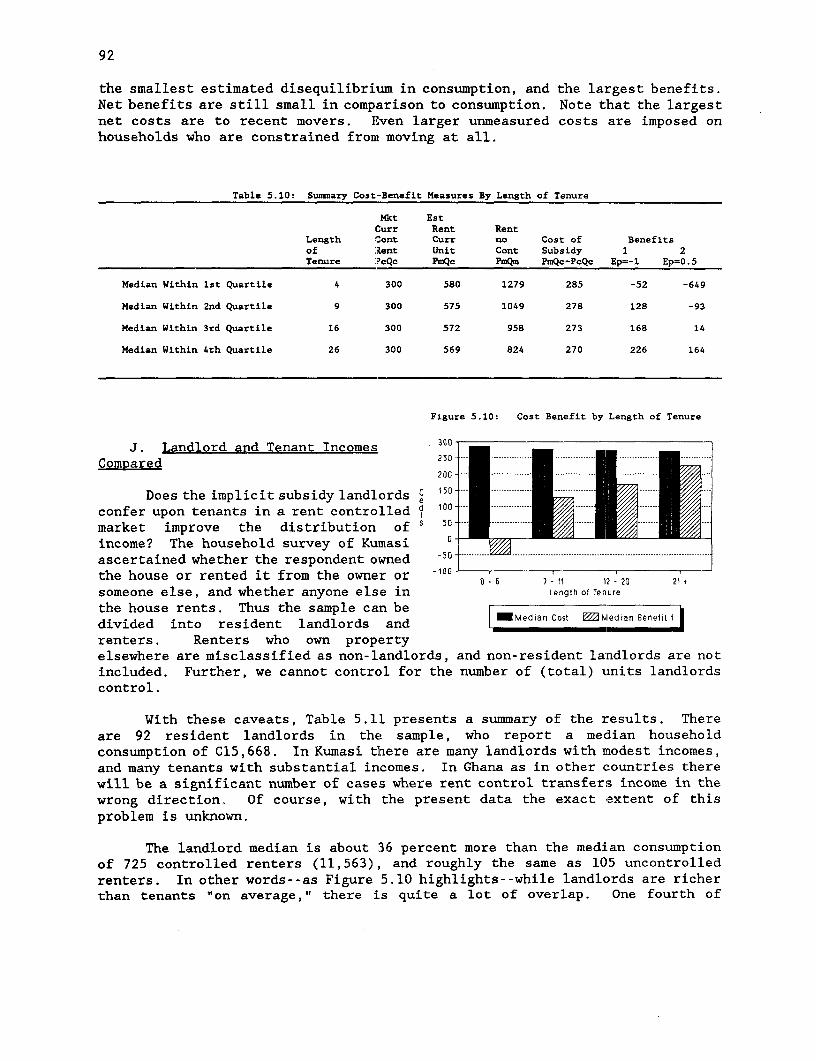
92
the smallest estimated disequilibrium in consumption, and the largest benefits.Net benefits are still small in comparison to consumption. Note that the largestnet costs are to recent movers. Even larger unmeasured costs are imposed onhouseholds who are constrained from moving at all.
Table 5.10: Summary Cost-Benefit Measures By Length of Tenure
Mkt EstCurr Rent Rent
Length Cont Curr no Cost of Benefitsof Rent Unit Cont Subsidy 1 2Tenure ]PcQc PmQc PmQm PmQc-PcQc Ep=-1 Ep=0.5
Median Within 1st Quartile 4 300 580 1279 285 -52 -649
Median Within 2nd Quartile 9 300 575 1049 278 128 -93
Median Within 3rd Quartile 16 300 572 958 273 168 14
Median Within 4th Quartile 26 300 569 824 270 226 164
Figure 5.10: Cost Benefit by Length of Tenure
J. Landlord and Tenant Incomes 300-
Compared 250 * * - d .. l
Does the implicit subsidy landlords c 150 . . . . le
confer upon tenants in a rent controlled d 100 . -, ---market improve the distribution of S 50 ... ... ......
income? The household survey of Kumasi a_ascertained whether the respondent owned 50 ..........................................................................
the house or rented it from the owner or '° - - 7 -' V t2 2t
someone else, and whether anyone else in Length of Tenure
the house rents. Thus the sample can be o_MecanCost~~ 111ed anOeli1divided into resident landlords and
renters. Renters who own propertyelsewhere are misclassified as non-landlords, and non-resident landlords are notincluded. Further, we cannot control for the number of (total) units landlordscontrol.
With these caveats, Table 5.11 presents a summary of the results. Thereare 92 resident landlords in the sample, who report a median householdconsumption of C15,668. In Kumasi there are many landlords with modest incomes,and many tenants with substantial incomes. In Ghana as in other countries therewill be a significant number of cases where rent control transfers income in thewrong direction. Of course, with the present data the exact extent of thisproblem is unknown.
The landlord median is about 36 percent more than the median consumptionof 725 controlled renters (11,563), and roughly the same as 105 uncontrolledrenters. In other words--as Figure 5.10 highlights--while landlords are richerthan tenants "on average," there is quite a lot of overlap. One fourth of

ESTIMATES OF COSTS AND BENEFITS 93
controlled renter consume more than that the median resident landlord; one fourthof resident landlords consume less than the median tenant.
Malpezzi (1986) presented similar evidence for Cairo. Again, richerlandlords certainly own more buildings and more rooms. But in Bangalore, India,Malpezzi and Tewari (forthcoming) were able to control for the amount of housingcapital owned; while it widened the gap in average incomes between landlords andtenants, significant overlap remained.
Table 5.11: Landlord and Renter Consumption
StandardMean Deviation Median Q3-Q1 Mode N
Resident Landlords 18,381 12,124 15,668 11,024 10,500 92
Controlled Tenants 12,808 6,356 11,563 6,791 10,700 725
Uncontrolled Tenants 17,554 9,151 15,260 10,665 9,850 105
Figure 5.11: Distribution of Consumption by Tenure
Controlled Renters Uncontrolled Renters Resident Landlords
ea0 4 0 so0
p p 30Median: ----- Cedis ....... p
e 30e e 30------------ ............. ...
C C 2.. ..... --- ....... ..... .... Ce 0 .. . . ... .. . .. .. . .. . .. .. 0 20 . .. . . . .. . .. . .. . . .. . . . ... . . . .
10 aj z 0.
LT 6000 1-10 K 10.1 K 18-20 K 20-25 K GE 00 K .0 600 510 K LT1 120K 2.5K E2K1 8000 5.10 K 10.1I6 K 06.00 K 200.5 K GE 05 K
Median: i1,563 Cedis Median: 15,260 Ceais Median: i5,668 Cedos


VI. RENT CONTROL, PROFITABILITY, AND SUPPLY
The previous chapter described the costs and benefits to individuallandlords and tenants. What are the market wide effects, particularly on supply?This chapter begins by describing the supply side of the market in more detail.To anticipate the key results, despite very strict controls some additionalhousing is being supplied. To explain the apparent anomaly between rents whichseem to offer no real return and a rental stock which, while poorly maintainedstill houses two thirds of the city, we will develop a simple present value modelof housing investment. While simple, the model captures the essentials of thelandlord's investment decision, as well as effects on tenants and governmentrevenue. The model will also be used to examine alternatives for relaxation ordecontrol.
A. Housing SUPD1Y in Kumasi
As discussed in detail in Chapter 3, the great majority of Kumasi'shouseholds live in rental housing, and most of those in rooms in compound houses.How has the supply of this housing in general and the rental stock in particularchanged over time? Here we discuss new construction (and its counterpart ofremovals from the stock), conversion to other uses, and the supply from theexisting stock.
New Construction
From the above, it can be seen that foregone starts on new building areprobably the most likely response to rent control. The evidence for Kumasishows substantial support for this. According to Census data and Boapeah'ssurvey, the number of houses grew from 11,600 in 1960 to 21,000 in 1981 inresponse to, but not keeping up with, population growth (Boapeah and Tipple,1983). By 1980, impressionistic evidence showed that the rate of growth ofhouses in the city had already slackened as the economic problems of the lateseventies reduced real incomes, and as rents fell behind prices and costs.Apart from a modest spurt of starts during the Limann government (September,1979 to December, 1981), most of which were at the very top end of the market,there had been a noticeable decline in house starts since the mid 1970's.
The new survey of the number of houses in Kumasi in 1988 supportsimpressions formed in 1986 that building had continued only slowly since 1981.Less than 800 houses appear to have been added between 1982 and 1985 and only900 between 1986 and 1988, with the index for houses falling further behind thatof population.l1 However, the increase in rooms per house between the 1980 and1986 samples (supported by no increase in occupancy rates) gives some groundsto believe that extensions to existing houses have allowed the growth in roomsto keep pace with population growth since 1980.
1/ The slow rate of new house building in Kumasi over at least the past decadeis all the more notable because there is a tradition of gaining statusthrough building houses in Kumasi; so much so that it has been a priorityover building in the home village in some periods. (See quotation fromFortes in McCaskie, 1986. See also Schildkrout, 1978).

96
Rental Housing Losses -- Demolitions. Conversions and Foregone Starts
Demolitions of houses appear to be extremely rare except during theA.F.R.C. regime's "house-cleaning" in 1979 in which one or two houses used forstoring contraband were blown up by the army. However, a demolition by landlordin order to evict a tenant occurred in early 1989 in Accra causinlg much publicattention. A lack of a tradition supporting individualistic action may haveinhibited demolitions in order to rebuild for commercial purposes even in primesites, e.g. the town center and around Konfo Anokye Hospital/Bantama High Street.
In theory, rent control ought to motivate landlords to consider alternativeuses for their properties, i.e. conversion to non- residential uses. There islittle evidence of a spread of the commercial sector spreading into centralresidential areas. Throughout the city, the survey showed 10% of houses withany rooms in commercial use and only 3% of houses with any rooms converted intocommercial use since 1980.
In the United Kingdom, rent control has provided incentives for landlordsto sell their property into owner occupation (although many tenants also havesecurity of tenure under the law, see Robinson, 1979; Maclennan, 1982). Thisdoes not occur in Kumasi because of a strong taboo among the dominant ethnicgroup against selling fixed property. As Tipple (1988) explains, not only dolandlords abhor the idea of selling, but also the tenants would be unwilling tobuy from them. The only exception to this has been the State Housing Corporationwhich has been selling its property to sitting tenants, or new property to theallocatee, for many years as the rents have fallen ever further behind the costof maintenance. In the survey sample, 40% of households in the government sectorowned their house, 22% were family hcusers. As a quasi-government organization,SHC cannot act with economic rationality alone and allow its property to decayin line with its returns. On the other hand, it has been required to operateon a commercial basis since subsidies were removed (Ghana, 1975). The resulthas been a slow decay in the housing stock still in SHC ownership and few newhouses being built for rental by SHC.
Housing From the Existing Stock
Rent Control in Kumasi creates an incentive for landlords to allow theirproperties to deteriorate. The 1986 survey of housing in Kumasi shows that manyrenters live in housing which, structurally, has been allowed to fall intodisrepair. Rents are generally insufficient to cover even maintenance costs.The hedonic models show that, while these units would rent for more than thecontrolled price in the open market, their price is still low and sometimes lessthan what tenants would be willing to pay for a room with additional facilities.Renters pay little but receive little in return except a location in the city.However, impressionistic evidence indicates that housing deterioration as aresult of landlord behavior is compensated for somewhat by tenants' spendingresources on maintaining and improving their rooms, probably encouraged by theirperceived security of tenure which is exhibited by their very long mean duration

RENT CONTROL, PROFITABILITY AND SUPPLY 97
of stay to date. In addition, capital raised through the recent practice ofdemanding rent advances, is allowing some landlords to carry out repairs betweentenancies -- either from the advance or by asking for extra to cover renovations.
Quite apart from rent control, the deterioration problem is compounded bythe multi-ownership of family houses where ownership in common under acaretaker/lineage head requires lineage members occupying the house to share inthe cost of maintenance. This appears to be a classic "prisoners' dilemma"problem (Robinson, 1979). Since rent does not cover maintenance costs, thedifferent "owners in common" have little incentive to invest in maintenance ofa common property, especially when no kudos are traditionally attached to partownership of a building. Status depends on completing a new building ratherthan maintaining or rehabilitating an old one (Tipple, 1983 and 1984a).
In addition to the fact that units, not their quality, confer status, thecontrol regime makes no distinction between houses with no services and thosewith services shared by many households. In order to benefit from an increasein rent, the landlord must make his rooms "self-contained" so that each householdhas exclusive use of water supply, sanitation, kitchen, and bathroom.
Apart from fulfilling the demands of the building regulations (andenforcement has been very lax for years), a landlord has very little incentiveto fit water supply and sanitation, kitchen and bathroom, into his house. Toincrease the rent, full conversion to self-contained units is necessary, foronly then can the improvement costs be passed through to the tenant by means ofincreased rents. Therefore, why should a landlord fit a water pipe to the house,or improve the latrine from a bucket to an aqua-privy or a ventilated indirectpit, when these will be shared facilities?
A similar question arises with qualitative improvements to the structureof rooms with shared facilities. As it would make no difference to the rent,what incentive can a landlord have for fitting ceilings or other improvementsor repairing the fabric of the house?
Net Effects on SuPP1Y
What is the net effect of all of the above? While some starts haveundoubtedly been forgone, neither have starts dropped to zero, as might beexpected with such extreme controls. However, the current rent control policiesalso have effects on the quality distribution of houses. We have macro evidenceon the number of units of different type, and micro evidence on the quality ofthe units.
Figure 6.1 shows that the number of houses has grown over time but atdifferent rates in different sectors. The trend for the high cost sector togrow faster than others noted from the 1960 to 1981 period by Boapeah and Tipple(1983) has been somewhat stemmed in the 1981 to 1988 period as the indigenoussector appears to have kept pace (both have grown by 10 percent over the 8years). The total number of houses has not, however, kept pace with populationgrowth in either the short or medium terms; while there was one house for every20 people in 1960 (1960 Census of Population), there was only one per 29 in 1980and one per 32 people in 1988.

98
Figure 6.1: Number of Houses by Sector
As houses vary so greatly in size,25- number of rooms is probably a much more
useful measure of housing growth. In20 . .................. .... .... 1960 (1960 Census of Population) there
__________ were 2.6 persons per room, by 1980 this15 ...... .... .. I Government had increased to 3.3 persons per room
gI 5 Hrgh coGt where it remains to date. Our data for10-- . m ... .... --- X lIndbenous 1986 shows a major increase in rooms per
M Tment house in the high cost sector compared
s - -- E ... ... ... with 1980, but this is probably more dueto sampling differences between 1980 and
o _ _ 1986 surveys than to actual growth.1950 19,81 1965 1998 However, the evidence for growth of rooms
Figure 6.2: Population, Rooms and Number of Housesin line with population is based on the Index: 198111D0
stable occupancy rates rather than on 140-
numbers of rooms per house. Undoubtedly, ,___there has been an increase in extension.activity in recent years at a time when I - a ..new starts have been severelyconstrained. Anecdotal evidence suggests n. ...............................................that the advance payable on, say, two newrooms, could finance the major part of Er-. -----'----- ............------..-..-.--.-.--.-.--.-----.---.--.-.-.-..the cost of another room. Thus, the / a ousessmall investment on an existing site is 4 0 . --Tok+ ons ---.
seen to be capable of fulfillment and 20 l _
leading to further wealth creation when 19o 19981 1986 1908
the beginning of a large house on a newNote: X-AxisNotto Scale
site may be too onerous.
In terms of the change in the quality and utilization of the stock, wehave evidence from chapter 2 than there are more family housers, that the servicelevels, never good, have deteriorated, and that crowding remains a problem.Evidence from chapter 5 suggests that in the absence of controls the majorityof households would consume more housing than obtained from their current units:the median estimated PmQm of about 1040 cedis is substantially greater thanmedian estimated PmQc of about 575.
Ultimately, in order to understand the interaction between rent controland supply, we have to understand the interaction between controls and theinvestment incentives faced by suppliers. We therefore turn to a simple presentvalue analysis of the effect of controls on landlords' profitability.
B. Rent Control and Landlord Profitability
The previous Chapter described the costs and benefits to individuallandlords and tenants. What are the effects of controls on supply? In orderto understand how controls affect incentives to landlords, and hence supply, westart with a simple present value model.

RENT CONTROL, PROFITABILITY AND SUPPLY 99
Present Values
Government subsidies, regulations, taxes and other interventions --including rent control -- change the cash flows to landlords. Someinterventions impose costs (e.g., land use regulations, taxes, rent controls,building regulations) and some benefits (e.g., land subsidies, tax relief,financial subsidies) to landlords. The incidence of costs and benefits isdiscussed in more detail in Malpezzi (1988).
Present values are a summary of the cash flow and its components. Presentvalues are computed by adding a stream of net costs and benefits from aninvestment after discounting them to account for the fact that a cedi today isworth more than a cedi tomorrow.91
Consider a simple 4 period example:
PV - A 0 + A 1 /(l+r) + A 2 /(l+r) 2 + A 3 /(l+r) 3
where A represents the net costs and benefits in each of four periods, and r isthe discount rate, or the opportunity cost of capital. For example, if aninitial investment of 300 cedis is followed by three years of net returns of150 cedis per annum, and the discount rate is 10 percent, the present value is:
PV - -300 + 150/(1+0.1) + 150/(1+0.1)2 + 150/(1+0 . 1)3 - 73 cedis
The present value rule states that if the present value of the investment isgreater than zero, the investment yields greater than the opportunity cost ofcapital (the normal rate of profit for an investment of that type), and theinvestment should be undertaken.
A closely related concept is the internal rate of return. This is thediscount rate at which the present value of the cash flow would be zero (benefitswould equal costs, adjusted for the timing of receipts and expenditures). Itcan be interpreted as a measure of profitability.
A Present Value Model of Housing Investment in Kumasi
Rent control's market effects can be analyzed using a simple cash flowmodel of a representative rental investment.31 Table 6.1 presents such a model.Each column represents a year's time. Landlord-developers are assumed to buildor purchase a unit in development period (year 0) and rent out the rooms thereinfor 10 years. During this time landlords collect rents and spend money on
2/ Even in the absence of inflation.
3/ The general method used is described in any corporate finance text (e.g.Brealey and Myers 1981). Application of cash flow models to investmentin developing countries is discussed in (e.g.) Gittinger (1982) and Mishan(1982). Examples of housing policy analysis using such models includeDeLeeuw and Ozanne (1981), Brueggeman (1985), and Malpezzi (1988).

100
maintenance and taxes. At the end of the 10 year period the unit (structure andland) have some salvage value.41
This model is quite simple,21 yet it allows us to compare t-wo differentrent regimes (labeled the baseline regime and the revised regime in Table 6.1,sometimes referred to controlled and uncontrolled). We can examine theinteraction between controls, taxes, maintenance, depreciation, profitabilityand affordability in a simple but consistent framework.
Of course the model has limitations. It focuses on a "representative"investment, and the exact numbers presented aren't exact for all or even mostunits. But we can analyze more than one "representative" investment (includingdifferent structure types, service levels, locations, and rents). We don't wantto focus on point estimates but rather on robust qualitative conclusions. Also,as it happens in Kumasi at least physical structures and current controlled rentsare fairly standardized.
The cash flow model is only as good as its inputs; "garbage in, garbageout." But we can and have tested the model with a range of inputs not allreported here, and while the exact numbers change, the qualitative conclusionsdrawn from the simulations reported below remain robust.!,
We note once again that the real valued inputs to the simulations in thischapter are all in 1986 prices. We have assumed a constant 20 percent annualinflation rate for the ten year horizon of the model; while official data onrecent price changes are not available yet, it appears that inflation has runwell above 20 percent recently.
§/ The salvage period is often discussed as if the owner sells the unit.Actually it makes no difference to the analysis if the owner retains it;the salvage value is the opportunity cost of doing so.
l/ For example, we assume the landlords pay cash for the unit. :[n Ghana, fewrental units are financed through the formal financial system. While itremains true that all durable assets must be financed in some way (evenif self financed) ignoring finance is an appropriate simplification forthe present purpose. The analysis could be readily extended to evaluateproposals for rental finance.
i/ We encourage interested readers to undertake their own analysis of otherrepresentative investments and using other parameter values (especiallyrepresenting other changes in controls). The model itself is written inLotus 1-2-3, and is available upon request from the authors. Using thecomputer model requires the Lotus spreadsheet system, version 2.0 orhigher, which is not available from the authors.

Table 6.1: Cash Flow Model of Rental Investment
Year 0 1 2 3 4 5 6 7 8 9 10General Price Index 1.00 1.20 1.44 1.73 2.07 2.49 2.99 3.58 4.30 5.16 6.19
Market Value of Land 500.000 500,000Baseline Structure Value 2.000.000 1,488,188
Financial Cost of Land (100.000)Financial Structure Cost (2.000.000)
BASELINE RENT CONTROL REGIME:
Capital Gain/Loss (111,812)Maintenance (20,000) (20,000) (20,000) (20,000) (20,000) (20,000) (20,000) (20,000) (20,000) (20,000)
NOMINAL Monthly HH Rent 300 300 300 300 300 300 300 300 300 300REAL Monthly HH Rent 250 208 174 145 121 100 84 70 58 48NOMINAL Annual Gross Rent 54,000 54,000 54,000 54,000 54,000 54,000 54,000 54,000 54,000 54,000REAL Annual Gross Rent 45,000 37,500 31,250 26,042 21,701 18,084 15,070 12,559 10,466 8,721
Rental Income Taxes (2,250) (1,875) (1,563) (1,302) (1,085) (904) (754) (628) (523) (436)Property Taxes (2,000) (2,000) (2,000) (2,000) (2,000) (2,000) (2,000) (2,000) (2,000) (2,000)
Landlord's Real Cash Flow(under controls) (2,100,000) 20,750 13,625 7,688 2,740 (1,384) (4,820) (7,683) (10,069) (12,058) 1,974,473
REVISED RENT REGIME:
Change in Structure Value 352,477Revised Structure Value 2,352,477 2,129,667Revised Capital Gain 529,667
Maintenance (60,000) (60,000) (60,000) (60,000) (60,000) (60,000) (60,000) (60,000) (60,000) (60,000)
REAL Monthly HH Rent 1.200 1.200 1.200 1.200 1.200 1.200 1.200 1,200 1.200 1.200NOMINAL Monthly HH Rent 1,440 1,728 2,074 2,488 2,986 3,583 4,300 5,160 6,192 7,430NOMINAL Annual Gross Rent 259,200 311,040 373,248 447,898 537,477 644,973 773,967 928,760 1,114,513 1,337,415REAL Gross Rent 216,000 216,000 216,000 216,000 216,000 216,000 216,000 216,000 216,000 216,000
Rental Income Taxes (21,600) (21,600) (21,600) (21,600) (21,600) (21,600) (21,600) (21,600) (21,600) (21,600)Property Taxes (2,000) (2,000) (2,000) (2,000) (2,000) (2,000) (2,000) (2,000) (2,000) (2,000)
Landlord's Cash Flow(no controls) (2,100,000) 132,400 132,400 132,400 132,400 132,400 132,400 132,400 132,400 132,400 2,791,734
OLD REGIME COMPARED TO NEW
Foregone Rental Income (171,000)(178,500)(184,750)(189,958)(194,299)(197,916)(200,930)(203,441) (205,534) (207,279)Tax Savings 19,350 19,725 20,038 20,298 20,515 20,696 20,846 20,972 21,077 21,164Savings in Maintenance 80,000 80,000 80,000 80,000 80,000 80,000 80,000 80,000 80,000 80,000Change in Structure Value (641,479)Net Change in Cost to Landlords (71,650) (78,775) (84,713) (89,660) (93,784) (97,220)(100,083)(102,469) (104,458) (747,594)
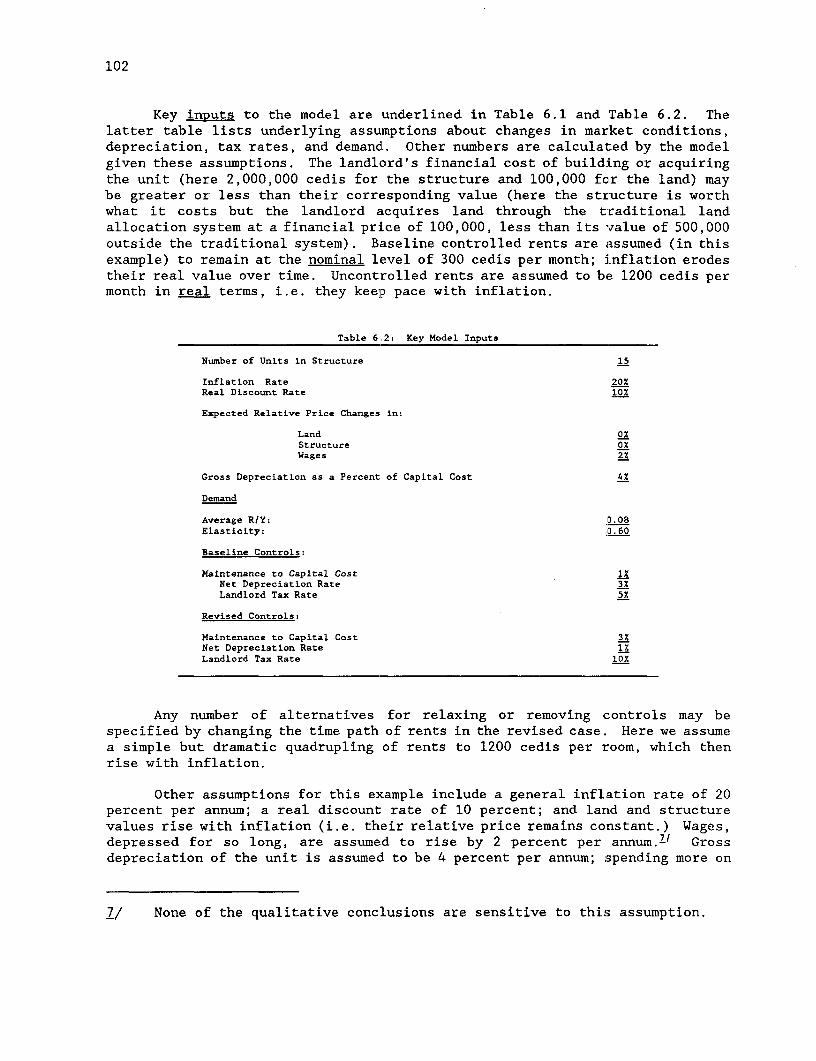
102
Key inputs to the model are underlined in Table 6.1 and Table 6.2. Thelatter table lists underlying assumptions about changes in market conditions,depreciation, tax rates, and demandL. Other numbers are calculated by the modelgiven these assumptions. The landlord's financial cost of building or acquiringthe unit (here 2,000,000 cedis for the structure and 100,000 for the land) maybe greater or less than their corressponding value (here the structure is worthwhat it costs but the landlord acquires land through the traditional landallocation system at a financial priLce of 100,000, less than its value of 500,000outside the traditional system). Baseline controlled rents are assumed (in thisexample) to remain at the nominal level of 300 cedis per month; inflation erodestheir real value over time. Uncontrolled rents are assumed to bea 1200 cedis permonth in real terms, i.e. they keep pace with inflation.
Table 6.2: Key Model Inputs
Number of Units in Structure 15
Inflation Rate 20%Real Discount Rate l0%
Expected Relative Price Changes in:
Land 0%Structure 0%Wages 2%
Gross Depreciation as a Percent of Capital Cost 4%
Demand
Average R/Y: 0.08Elasticity: 0.60
Baseline Controls:
Maintenance to Capital Cost 1XNet Depreciation Rate 3XLandlord Tax Rate 5%
Revised Controls:
Maintenance to Capital Cost 3%Net Depreciation Rate 1%Landlord Tax Rate 10%
Any number of alternatives for relaxing or removing controls may bespecified by changing the time path of rents in the revised case. Here we assumea simple but dramatic quadrupling of rents to 1200 cedis per room, which thenrise with inflation.
Other assumptions for this example include a general inflation rate of 20percent per annum; a real discount: rate of 10 percent; and land and structurevalues rise with inflation (i.e. their relative price remains constant.) Wages,depressed for so long, are assumed to rise by 2 percent per annum.71 Grossdepreciation of the unit is assumed to be 4 percent per annum; spending more on
7/ None of the qualitative conclusions are sensitive to this assumption.

RENT CONTROL, PROFITABILITY AND SUPPLY 103
maintenance is assumed to reduce net depreciation one for one.!' Landlords payan income tax of 5 percent on rents collected, rising to 10 percent for higherrents. 2 1 Households at the median income are assumed to be willing to spend 8percent of their income on such a unit; the income elasticity, .6, assumes thatlower income households spend higher fractions, and vice versa.
Gains and Losses from Four Components and their Interaction
Five key components of landlord cash flow are: initial outlay, rents,maintenance, taxes, and capital gains. Initial outlay does not change whencontrols are removed, but the other four do. Rent control directly reducesprofitability because it reduces the rents a unit can command. But reduced rentsalso affect maintenance (and depreciation), taxes, and capital gains. These"indirect" effects can be large and should be taken into account. Figure 6.3summarizes the changes.
Figure 6.3: Change In Components of Landlord's Present
Rents. Ghana' s current rentcontrol regime fixes nominal and reduces . pDa reseut values lilua cedislreal rents. In the example presented in 1.327 |Controllod zUscotrolledTable 6.1 above, the reduction in realrents increases over time as inflation ,aa -takes a larger bite. Our "uncontrolled"or modified regime assumes rents risewith inflation. Sea
~~~~~~~~~~ ~~~~~~~~~2 04
Figure 6.3 shows that the present 7value of real rents collected from this -1 -43
15 room compound over 10 years under the 2decontrolled regime is about 1.3 million _5o I3cedis, compared to 158, 000 under Rest Maintenace Taxes Capital Gain
controls.
Taxation. If taxes on rental income are collected from landlords, rentcontrol reduces these taxes as it reduces rent. This partially offsets thereduction in rent to landlords, but also decreases government revenue. MI Tipple(1988) reports that effective property taxes for units of this type (when
8/ One way the model could be extended would be to build in a moresophisticated production function relating maintenance to depreciation ina non-linear fashion.
i/ Tax on rental income rises with the monthly rent collected. See Tipple(1988, p. 34) for the full schedule.
L/ If the household spends the extra cash on goods or services that are taxed,the reduction in government revenue will be partially offset. We assumethis effect is small.

104
collected) are on the order of 2,000 cedis. We assume this is unchanged in realterms over time.111
Figure 6.3 shows that the present value of taxes rises from 8,000 cedisto about 133,000 cedis. From the landlord's point of view the tax increasepartially offsets the rents collectetd.lV But it also represents a badly neededincrease in government revenue.
Maintenance. Landlords have the option to increase or decreasemaintenance. While good data are lacking, we assume in these first simulationsthat maintenance on a controlled unit is a minimal 1 percent: of structurecost.131 When controls are removed landlords increase maintenance to a stillmodest 3 percent.
Figure 6.3 reflects this assumption that landlords spend about three timesas much on maintenance if controls are removed. But if the unit is notmaintained it depreciates faster. 'This will reduce the capital gain.
Capital Gains. Capital gains (and losses) stem from several sources.First, structures and land can appreciate more or less than general inflation.The simulation presented here assumes both structure and land prices move withinflation. Second, the land and the structure may originally (at period 0) beworth more or less than the value of resources put into it. We've assumed thatthe original value of the structure (in the baseline case) is worth its financialcost to the landlord-developer, but that the land is worth considerably more.The latter can readily be the case given the traditional system of landallocation, especially if the landLlord is an Asante. Thus we immediatelyidentify one incentive in the current system -- in traditional areas buildinga house can give the landlord contro'L over land worth far more than the fees andground rents paid. Third, the real value of structural capital declines as theunit depreciates. As we've seen, depreciation depends on maintenance, and inthis version we've assumed a simple one-for-one offset. Fourth, if the rentcontrol regime changes, increases in rents will be capitalized into value.,
I1/ In the current system, rates or ground rents are usually negligible. Whilewe don't do so here, the model could be used to study the effects ofindexing and increasing these rates.
12/ This. model assumes that taxes are collected and that land:lords bear thetax. Other assumptions about incidence could be explored in future work.
13/ Good data on maintenance are lacking. In developed countries maintenanceand other recurrent expenditures are much higher -- on the order of 8percent of structure values -- but more services are provided with theunits. On the other hand, swish units require regular structuralmaintenance. The figures in these models represent best guesses.
14/ For these simple simulations we've assumed full capitalization of thedifference between the average net income streams for the two regimes.We've also assumed that decontrol was completely unanticipated. Theseassumptions could be compared to alternatives in future work.
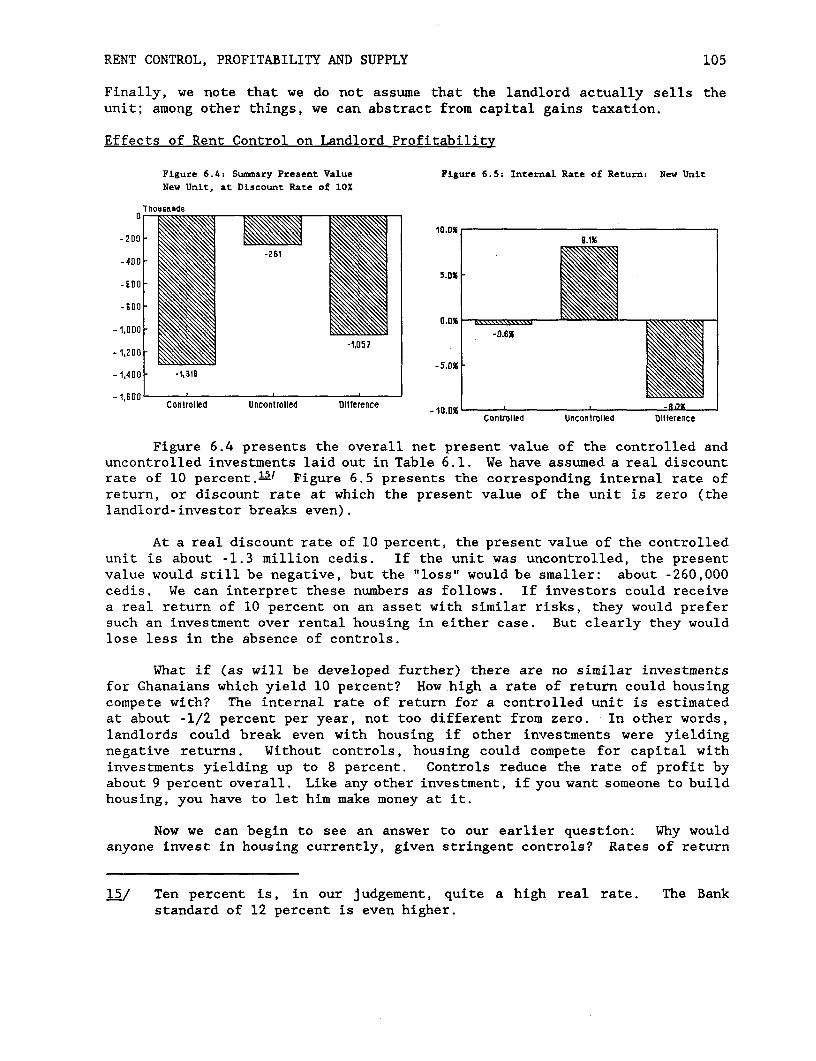
RENT CONTROL, PROFITABILITY AND SUPPLY 105
Finally, we note that we do not assume that the landlord actually sells theunit; among other things, we can abstract from capital gains taxation.
Effects of Rent Control on Landlord Profitability
Figure 6.4: Sunmary Present Value Figure 6.5: Internal Rate of Return: New UnitNew Unit, at Discount Rate of 10%
Tho u sa nds
10.0%- 200 1
-261-4D00
-600-
-H00
0.0%
-1,0DO - -0.6%~~~~~~~~-105
- 1200O-5.0%
- 1400 -,1
-1,600Controlled U nconotrolIled Difference 100D% *UZ -
Controlled Uncontrolled Dhlterence
Figure 6.4 presents the overall net present value of the controlled anduncontrolled investments laid out in Table 6.1. We have assumed a real discountrate of 10 percent.15J Figure 6.5 presents the corresponding internal rate ofreturn, or discount rate at which the present value of the unit is zero (thelandlord-investor breaks even).
At a real discount rate of 10 percent, the present value of the controlledunit is about -1.3 million cedis. If the unit was uncontrolled, the presentvalue would still be negative, but the "loss" would be smaller: about -260,000cedis. We can interpret these numbers as follows. If investors could receivea real return of 10 percent on an asset with similar risks, they would prefersuch an investment over rental housing in either case. But clearly they wouldlose less in the absence of controls.
What if (as will be developed further) there are no similar investmentsfor Ghanaians which yield 10 percent? How high a rate of return could housingcompete with? The internal rate of return for a controlled unit is estimatedat about -1/2 percent per year, not too different from zero. In other words,landlords could break even with housing if other investments were yieldingnegative returns. Without controls, housing could compete for capital withinvestments yielding up to 8 percent. Controls reduce the rate of profit byabout 9 percent overall. Like any other investment, if you want someone to buildhousing, you have to let him make money at it.
Now we can begin to see an answer to our earlier question: Why wouldanyone invest in housing currently, given stringent controls? Rates of return
5/ Ten percent is, in our judgement, quite a high real rate. The Bankstandard of 12 percent is even higher.
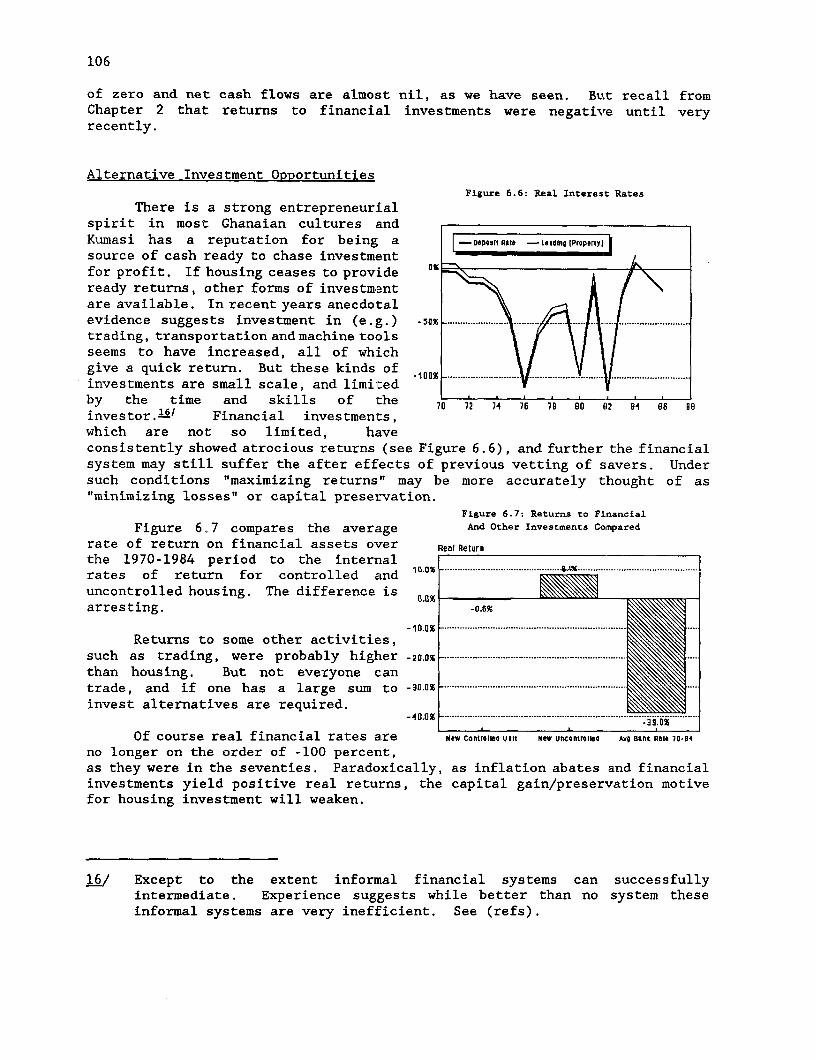
106
of zero and net cash flows are almost nil, as we have seen. But recall fromChapter 2 that returns to financial investments were negative until veryrecently.
Alternative Investment OpportunitiesFigure 6.6: Real Interest Rates
There is a strong entrepreneurialspirit in most Ghanaian cultures andKumasi has a reputation for being a DSP*WPt nRttOlnglPropertyljsource of cash ready to chase investmentfor profit. If housing ceases to provide eready returns, other forms of investmentare available. In recent years anecdotalevidence suggests investment in (e.g.) -5% ......................trading, transportation and machine toolsseems to have increased, all of whichgive a quick return. But these kinds of 10X ..................investments are small scale, and limiltedby the time and skills of ithe 70 72 74 76 7B 80 012 04 66 0E
investor . l6/ Financial investments,which are not so limited, haveconsistently showed atrocious returns (see Figure 6.6), and further the financialsystem may still suffer the after effects of previous vetting of savers. Undersuch conditions "maximizing returns" may be more accurately thought of as"minimizing losses" or capital preservation.
Figure 6.7: Returns to Financial
Figure 6.7 compares the average And Other Investments Compared
rate of return on financial assets over Real Return
the 1970-1984 period to the internalrates of return for controlled and 10°%.uncontrolled housing. The difference is oa X ___ mm____ _r-
arresting. -0.6%
-10.0% ........................................................................ ....Returns to some other activities,
such as trading, were probably higher -20.0. .................. ....
than housing. But not everyone cantrade, and if one has a large sum to -30ax ... .............. .....invest alternatives are required. 4\\
-40.0X _ ;.; = 39%.1
Of course real financial rates are NOW Controled Ulit NeW UncOntroled Avg BanK rLe. 705-4
no longer on the order of -100 percent,as they were in the seventies. Paradoxically, as inflation abates and financialinvestments yield positive real returns, the capital gain/preservation motivefor housing investment will weaken.
§6/ Except to the extent informal financial systems can successfullyintermediate. Experience suggests while better than no system theseinformal systems are very inefficient. See (refs).

RENT CONTROL, PROFITABILITY AND SUPPLY 107
Emphatically, we do not argue for subsidies or tax breaks to restore thestatus quo before Ghana's difficult struggle against inflation. Rather, werecognize that current cash flow will become a more critical investment incentivein a stable economy. Some housing investment may have occurred as a vent forsavings in the past, but housing will -- and should -- face stiffer competitionfrom a wider range of alternative investments. Rent control will bite deeperinto incentives for such investment as recovery proceeds.
AffordabilityFigure 6.8: Willingness to Pay
The model has a simple demand side Decontrolled New Unit (Yr 1)
which enables us to study theaffordability of each rent regime. Given Ea0 n Pay
an income distribution (midpoints of 1400income quintiles) and average andmarginal propensities to consume housing(the median income household's average ... § to Py
willingness to pay for such a unit, and B00 _ totrldCos
the income elasticity), the model 600 - tml Cot
generates willingness to pay for theentire income distribution and comparesit to rents under each regime. Figure 200
6.8 presents this graphically for the o . . . .7 9 II 13 1s 11 19 21 23 25
first year. The diagonal line represents Income (Thousands)
willingness to pay by income, given theincome distribution and demand parameters from Table 6.2. The five dots on theline represent the income midpoints of the five quintiles. Note that controlledrents (the bottom horizontal line) are affordable to all 5 quintiles, whilehigher uncontrolled rents are affordable to the top 2 quintiles.
Recall that this is a representative new unit. Representative does notmean that all units will deliver the same package of housing services, or willrent for this amount. Some units will be produced which will rent for more, somefor less. Note in particular that rents are always higher for new units inuncontrolled markets. We will examine existing units below.
Figure 6.9: Affordability Over Time
Since rents change over time, andsince incomes can also rise and fall 35 Real Monthly Income (100s]
(given an assumption about the growth or
25=
Woe* e Whikl Unft 'Juct Afrordabb%Accoldrog to beincid Asswnptlonc
15 madoLm InOch =
5 -e0 Botom Income Oulotile
Year

108
decline of real wages, see Table 6.2)1.Z' the model also generates the time pathof affordability (Figure 6.9). The five unmarked horizontal lines representwillingness to pay in each of five income quintiles over time (10 years). Theselines are rising because of the assumption noted above that real wages rise by2 percent per year. The heavy marked line represents the income at which realuncontrolled rents are "affordable" over the same period given the particulardemand assumptions made. This amount is fixed because (in this simulation) realrents are constant over time. So, in this simple case, since real rents remainconstant, while real wages increase, the affordability picture improves somewhatover time.
Profitability and Affordability for an Existing Unit
Our estimated rent of 1200 cedis for this illustration was based on themarket rent of the typical household in equilibrium (PmQm). But what aboutexisting units? They yield fewer housing services, and our best estimate oftypical market rents, PmQc, is roughly twice current rents (i.e. 600 cedis).
Flgure 6.10: Internal Rate of Return, Existing, Figure 6.11: Affordability, Existing Units
Units
8.0%
6.0% ~~~~~~~~~~~~~~~~~Thousands4.0%
30
2.0%25
0.0%20
-2.0%
Controlled Uncontroled Dlfference 01 2 3 4 5 0 7 8 9 I0
Year
In addition to changes in rents, the key difference is that existingstructures provide fewer services and are hence worth less than new structures.We have assumed the structure is worth 500,000 cedis, and the land is worth thesame 500,000 cedis as before.181 Figures 6.10 and 6.11 present the key internalrates of return and affordability results for these units.
ll. We assume that changes in real wages shifts the initial income distributionup or down proportionally.
i8. In other words we have assumed that if such units were traded, landlordscould sell their existing units and land for about 1,000,000 cedis total.Such trades rarely occur in practice, but it gives us some guesstimate ofthe opportunity cost of not trading (i.e. what it costs an existinglandlord who stays in business).

RENT CONTROL, PROFITABILITY AND SUPPLY 109
These assumptions yield similar profits to landlords, as measured by theinternal rate of return. Note, however, that the unit is affordable even at thebottom income quintile, according to our demand assumptions. If rents forexisting units rise to our estimates of market levels, decontrol will not makeexisting units "unaffordable."
What's Missing From the Model. and Related Coniectures
Risk. It is implicitly assumed that the time path of rents is known withcertainty by all market participants. If landlords believed that controls wouldbe reimposed, they would be unlikely to respond to decontrol by building ormaintaining and upgrading units. If tenants believed controls could bereimposed, they might spend high fractions of their income initially to gaintenure rights in a unit whose real rents might decrease; but such behaviorcarries risks for them as well.
Imperfections in input markets and from other regulations. One motive forhousing investment mentioned briefly above is that it yields an accompanyingproperty right to use of land. In general, as Chapter 2 described, land,infrastructure, and financial markets have not worked well in Ghana in recentyears. Planning regulations and building codes have at times been impediments.As a consequence, when someone does succeed in financing and building a house,a capital gain (at least relative to alternative investments) is guaranteed.Cash flow is not an issue, since cash flow under rent control is negligible.Whatever housing has been built, has been to capture capital gains (or reducecapital losses).
If controls are removed, cash flow can become a positive incentive. Butif the other impediments to housing supply -- land, infrastructure, finance,other regulations -- are not removed or mitigated, supply will be constrained.Real rents will rise, possibly well above our estimates of equilibrium rents,until such supply is forthcoming. We said above that "if rents rise to marketlevels, decontrol will not make existing units "unaffordable." This will onlycome to pass if the supply side is enabled to respond. It is essential,therefore, that decontrol be accompanied by action on these other fronts.
Market-wide effects. What can we say about market wide effects, givenanalysis of representative but still individual units? It is important tocarefully consider the difference between marginal changes to an individuallandlord and market wide changes. For example, an individual landlord freed fromcontrols could raise rents well above estimates of "market" levels and keep themthere indefinitely, if everything else was held equal (notably if other landlordswere still controlled). But if all landlords are freed from controls, they arebound by the fact that many if not most tenants would not pay rents greatly above
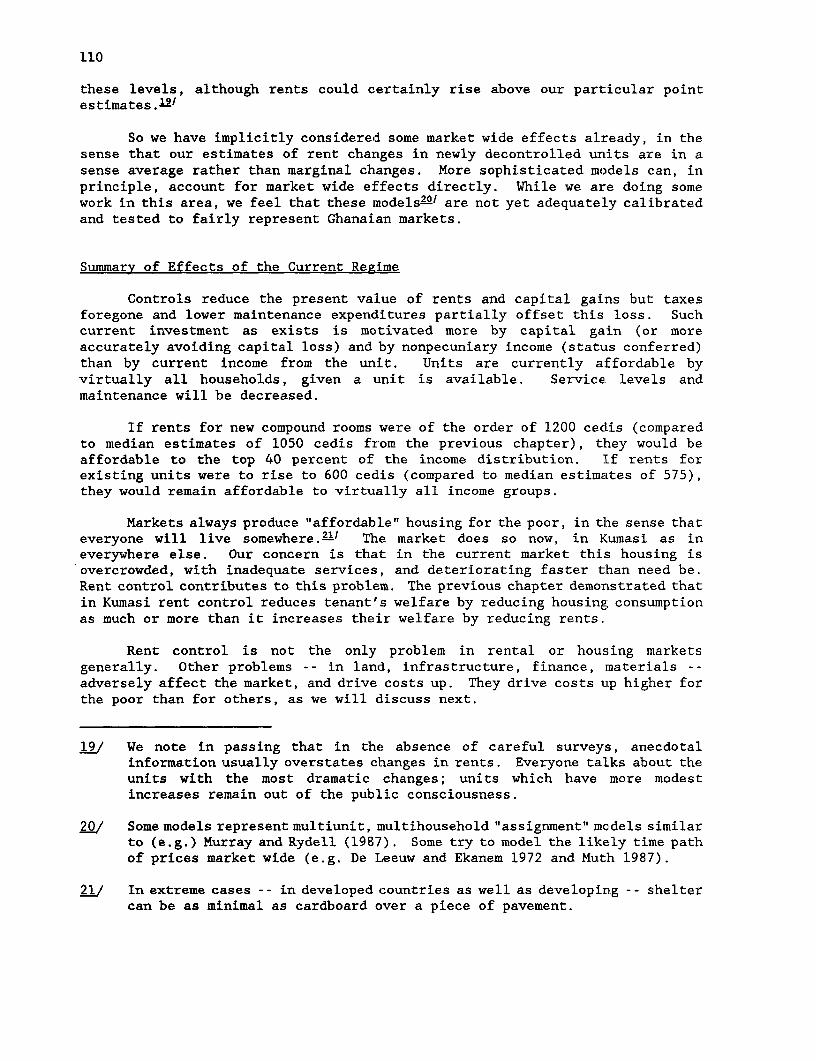
110
these levels, although rents could certainly rise above our particular pointestimates.191
So we have implicitly considered some market wide effects already, in thesense that our estimates of rent changes in newly decontrolled units are in asense average rather than marginal changes. More sophisticated models can, inprinciple, account for market wide ef-fects directly. While we are doing somework in this area, we feel that these models2al are not yet adequately calibratedand tested to fairly represent Ghanaian markets.
Summary of Effects of the Current Regime
Controls reduce the present va:Lue of rents and capital gains but taxesforegone and lower maintenance expenditures partially offset this loss. Suchcurrent investment as exists is motivated more by capital gain (or moreaccurately avoiding capital loss) and by nonpecuniary income (status conferred)than by current income from the unit. Units are currently affordable byvirtually all households, given a unit is available. Service levels andmaintenance will be decreased.
If rents for new compound rooms were of the order of 1200 cedis (comparedto median estimates of 1050 cedis from the previous chapter), they would beaffordable to the top 40 percent of the income distribution. If rents forexisting units were to rise to 600 cedis (compared to median estimates of 575),they would remain affordable to virtually all income groups.
Markets always produce "affordable" housing for the poor, in the sense thateveryone will live somewhere.21J The market does so now, in Kumasi as ineverywhere else. Our concern is that in the current market this housing isovercrowded, with inadequate services, and deteriorating faster than need be.Rent control contributes to this problem. The previous chapter demonstrated thatin Kumasi rent control reduces tenant's welfare by reducing housing consumptionas much or more than it increases their welfare by reducing rents.
Rent control is not the only problem in rental or housing marketsgenerally. Other problems -- in land, infrastructure, finance, materials --adversely affect the market, and drive costs up. They drive costs up higher forthe poor than for others, as we will discuss next.
12/ We note in passing that in the absence of careful surveys, anecdotalinformation usually overstates changes in rents. Everyone talks about theunits with the most dramatic changes; units which have more modestincreases remain out of the public consciousness.
20/ Some models represent multiunit, multihousehold "assignment" models similarto (e.g.) Murray and Rydell (1987). Some try to model the likely time pathof prices market wide (e.g. De Leeuw and Ekanem 1972 and Muth 1987).
21i In extreme cases - - in developed countries as well as developing - - sheltercan be as minimal as cardboard over a piece of pavement.

RENT CONTROL, PROFITABILITY AND SUPPLY 111
C. Effects of Other Regulations
Rental housing suffers from the same problems as the market overall --problems in the key input markets of land, finance, infrastructure and materials,and problems in the regulatory framework. Many such problems, when addressed,are not tenure specific but will aid rental as well as owner occupied housing -- for example, improvements in land titling, or in infrastructure provision.But other problems affect rental disproportionately. Building codes and landuse regulations which discourage compound houses particularly affect rentalhousing. Rent controls and other rental regulation obviously discriminateagainst this form of housing supply. Less obviously, solutions to market wideproblems -- such as land and finance -- need to be designed with both rental andowner occupied housing in mind.
Quite properly, most Ghanaian officials do not view publicly owned rentalhousing as a solution to housing problems. For example, SSNIT is working outits inventory of subsidized rental units -- finishing off uncompleted units andselling them to tenants. Their experience has highlighted the high costs andlimited replicability of publicly (or quasi-publicly) owned rental housing.
Relaxation of rent control is necessary but not sufficient for expandingthe supply of rental housing. Relaxation/decontrol must be accompanied bymeasures to ensure a rapid supply response to the demand for rental housing, orelse rapidly rising rents could squeeze existing tenants and jeopardizedecontrol. Political consensus is, after all, required for successful change.
Of the major constraints on private rental housing, many -- land, finance,infrastructure, materials, building codes and standards - - were discussed brieflyin Chapter 2. While detailed discussion of each is beyond the scope of thisreport, the following points should be noted. Rental markets suffer from thesame constraints as housing markets generally, but there are also some whichaffect rental particularly (in addition to the obvious problem of rent controls).Among other collateral actions, it will be necessary to:
(a) Pay particular attention to building codes, land use standards, andother regulations which discriminate against low cost compound housing.Land use regulations should be modified to permit construction ofcompounds in urban areas. Building in swish should be permitted,subject to proper construction techniques.
(b) Do not discriminate against rental in provision of serviced land.Don't require owner occupancy for access to land in any programdesigned to improve land availability (including sites and services).
(c) Don't neglect finance for rental housing. Ensure that rules forlending don't discriminate (intentionally or unintentionally) againstrental housing.

112
These and other actions need to be taken as complements to any decontrol program.Let us now turn to analysis of several alternatives for decontrol.
D. Analysis of Decontrol Policy Options
There are a number of options which could be considered for removing orrelaxing controls. Arnott (1981) presents a clear taxonomy. The main options,with a few comments are as follows:
(a) Blanket lifting: all rent: controls are completely remaoved as of acertain date. This is the simplest method, but is very difficultpolitically, and may lead to short run dislocations.
(b) Decontrol new construction: an obvious option whiLch is beingundertaken in India, Brazil and a number of other markets. But newconstruction can still be inhibited unless government crediblyguarantees units will not come under controls later.
(c) Rents could also be immediately decontrolled for units which are meetcertain standards, either now or after upgrading (e.g. for units whichprovide acceptable water supply and sanitation). Standards would haveto be carefully chosen, however, to meet requirements without imposingunnecessary costs.
(d) Floating up and out: controls are gradually relaxed, for example rentrises are some multiple of CPI or wage index changes, until controlsare no longer binding on most units. Then controls can be abolished.This method can permit a smoother adjustment if potential landlordsview the gradual program as; credible.
(e) Vacancy decontrol: Units are decontrolled as they become vacant. Thismethod has been tried in some North American markets, but may keepmobility down, with possible adverse effects on housing and labormarkets.
(f) Vacancy rate decontrol: particular markets are decontrolled as thevacancy rate rises above some threshold. But while controls (and otherproblems) remain, vacancy rates will probably remain extremely low.How can vacancy rates increase while controls remain?
(g) Rent level decontrol: decontrol by market segment. Rents could bedecontrolled from the top clown (the current system, with a thresholdof 1,000 cedis, embodies this to a limited extent). But such a systemcan provide perverse incesntives to raise rents above long runequilibrium levels in order to escape controls.
(h) Contracting out: landlord and tenant negotiate a payment to the tenantin return for his giving upi the right to controls.

RENT CONTROL, PROFITABILITY AND SUPPLY 113
(i) Decontrol new construction: an obvious option which is beingundertaken in India, Brazil and a number of other markets. But newconstruction can still be inhibited unless government crediblyguarantees units will not come under controls later.
Of course these options are not all mutually exclusive. In many respectsfloating up and out has some a priori appeal, because the market may take timeto respond, particularly given the current problems in input markets, etc.Blanket lifting carries the danger of a sharp short run rise in rents which wouldbe reduced over time. The present value model from above can be used to studyscenarios derived from the above.
Do Nothing
This is the baseline case already described. Rents are frozen in nominalterms at 300 cedis. Even if there were a one-time revaluation, inflation wouldquickly erode its value (as has happened in the recent past). Households wouldcontinue to consume roughly half of the housing services they would consume inthe absence of controls.
Also, we noted above that during the financial disruptions of the pastdecade and a half housing was one of the few ways to preserve capital. As thestructural adjustment takes hold financial and other investments will offer morefavorable returns, housing will no longer be such a vent for savings. If housingis prevented from offering a competitive rate of return by controls, housingconditions will worsen.
Blanket Decontrol
Conceptually, this is the simplest decontrol option. This second optionwas studied above, under the assumption that rents for new rooms in compoundsquickly adjusted to the (highest) static estimate of market rents from the crosscountry model of the previous chapter. New rooms would therefore be "affordable"(given the demand assumptions) to the top 40 percent of the income distribution.Market rents for existing units (PmQc) are lower (and more affordable). But wenoted that other market imperfections could constrain the supply response. Let'sthen examine a "worst case" where rents for new rooms rise much higher initiallydue to inelastic supply.
In this option we are concerned more with the changes in rents for existingunits than for new units. If a household is given a choice between remainingin an existing unit and moving to a new unit, however expensive, they can't bemade worse off because they have the option to remain. But they can be madeworse off if rents rise for their current unit.
Blanket decontrol, where all controls are lifted at one time, is simplestadministratively. But some rents in Kumasi have fallen so far behind marketvalues that rises could result in major dislocations. Arnott (1981) indicatesthat the greater excess demand there is in a market, the greater will be thedisruption caused by blanket decontrol. The data show that there is substantialexcess demand in the Kumasi market; thus, disruption under this alternative could
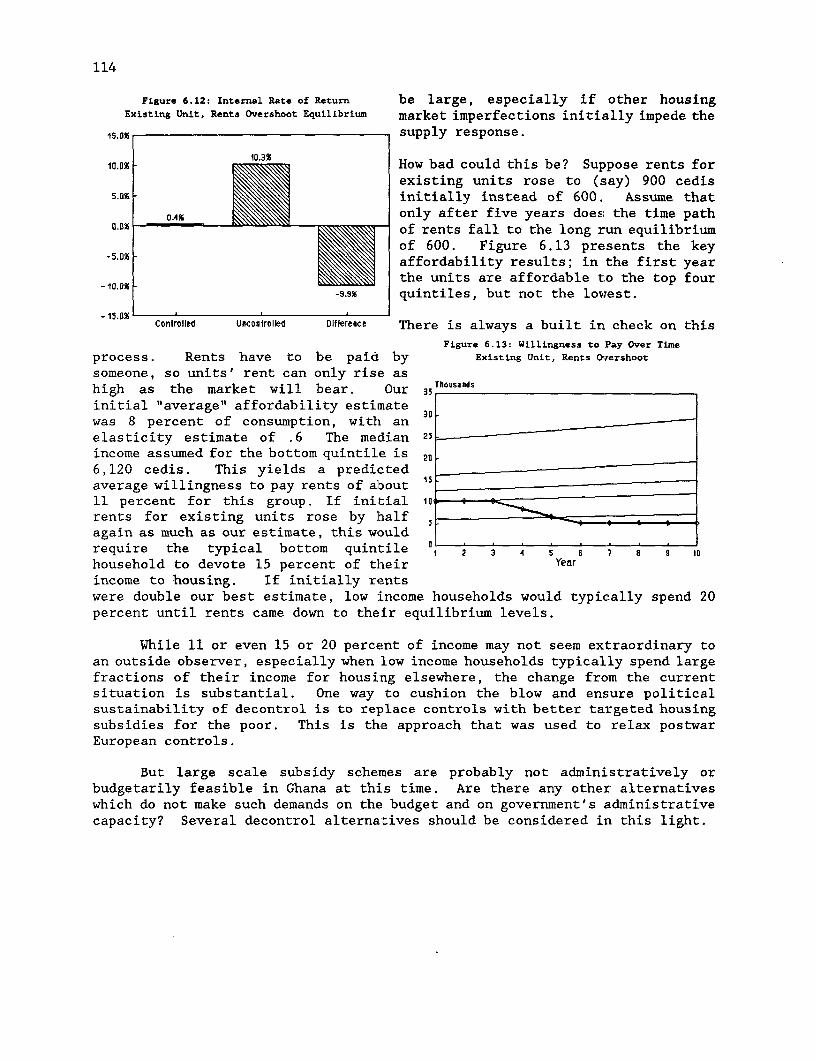
114
Figure 6.12: Internal Rate of Return be large, especially if other housingExisting Unit, Rents Overshoot Equilibrium market imperfections initially impede the
15.DX _ supply response.
la.0X - 10.3X How bad could this be? Suppose rents forexisting units rose to (say) 900 cedis
5.a -\ initially instead of 600. Assume that
0.4X \\ only after five years does; the time path0 . _ of rents fall to the long run equilibrium
of 600. Figure 6.13 presents the keyaffordability results; in the first yearthe units are affordable to the top four
9.9x quintiles, but not the lowest.
Controlled Uncontroled DIfference There is always a built in check on this
Figure 6.13: Willingness to Pay Over Time
process. Rents have to be paid by Existing Unit, Rents Orershoot
someone, so units' rent can only rise ashigh as the market will bear. Our 35Thousands
initial "average" affordability estimatewas 8 percent of consumption, with an -elasticity estimate of .6 The median 25
income assumed for the bottom quintile is 2 -
6,120 cedis. This yields a predictedaverage willingness to pay rents of about "11 percent for this group. If initial n0 0 orents for existing units rose by half ,again as much as our estimate, this wouldrequire the typical bottom quintile D 2 3 4 5 7 8 9I
household to devote 15 percent of their Yearincome to housing. If initially rentswere double our best estimate, low income households would typically spend 20percent until rents came down to their equilibrium levels.
While 11 or even 15 or 20 percent of income may not seem extraordinary toan outside observer, especially when low income households typically spend largefractions of their income for housing elsewhere, the change from the currentsituation is substantial. One way to cushion the blow and ensure politicalsustainability of decontrol is to replace controls with better targeted housingsubsidies for the poor. This is the approach that was used to relax postwarEuropean controls.
But large scale subsidy schemes are probably not administratively orbudgetarily feasible in Ghana at this time. Are there any other alternativeswhich do not make such demands on the budget and on government's administrativecapacity? Several decontrol alternatives should be considered in this light.

RENT CONTROL, PROFITABILITY AND SUPPLY 115
Decontrol New Construction and Upgraded Units
Completely freeing rents for newly constructed units can only increasesupply. As noted, if a household is given a choice between remaining in anexisting unit and moving to an expensive new unit, they can't be made worse offbecause they have the option to remain.
Exemption of new construction from rent controls is most attractive to theauthors in the short term on the grounds that it encourages new construction.Similar exemption could be applied to improvement of existing housing, toencourage improvements in conditions without adversely affecting many existinglow-income tenancies. It must be recognized that revaluing the upgraded unitsmay be very complex to administer. However, given that there is quite asophisticated rent control administration in place in Kumasi, this method maybe practical.
In a sense, new construction is already potentially decontrolled. "Luxury"units renting for over C1000 are nominally exempt from controls. Given inflationsince the date the ceiling was set, market prices for newly constructed roomsprobably now exceed the C1000 ceiling for controls (at least in Kumasi andAccra). But landlords still face the risk that the schedule of controls willbe revalued. As long as controls remain in place they remain a disincentive toinvestment. Our conjecture is that credible decontrol of new units and a firmplan for decontrol of existing units are required to build investor confidence.
In addition to removal of controls on newly constructed units, revaluationor decontrol of units which have undergone upgrading could also increase supply.In Ghana as in other countries, most housing services are produced from theexisting stock; preserving and upgrading this stock is a critical but oft-neglected part of any housing strategy. It would be important to choose thethreshold at which decontrol occurs carefully; for example, requiring (say) flushtoilets would simply make the regulation irrelevant for much of the population.
Decontrol for New Tenants
This option has been considered in a number of developed and developingmarkets (for example, Los Angeles, see Murray and Rydell, 1987). Cities likeCairo, with functioning key market systems, have systems which function de factoin a similar way, since key money can usually be collected from new tenants butnot from old. But these systems result in several perverse incentives.Landlords have incentives to undermaintain units or even harass tenants in orderto reclaim the unit and increase their rental income. Tenants have incentivesto avoid moving to units more in line with their current needs because they wouldgive up existing rent discounts. Such systems have the potential to reducemobility and decrease the efficiency of use of the existing stock.
Revaluation for new tenancies could be unhelpful as it would continue theproblems caused at present by the demands of advance payments and result in aneven less mobile rental sector than at present. As renters in compound houseslive in closer proximity to other households than most tenancy groups in othercountries, vastly different rents being paid by neighboring households, accordingto their length of tenancy, is likely to be socially unacceptable.

116
Floating Up and Out
The most effective method for encouraging new investment while protectinglow income renters may involve a combination of indexation of increases with a"floating up and out" of controls. The latter involves the transition fromcontrolled rents to market rents over a period of years. It is preferable tohave an end date when controls are withdrawn completely in order to maintainlandlord confidence in the reality of the end of the controls which have costthem so much. Indexation could provide a formula for determining theintermediate rent levels. For example, rents could be increased annually by,say, the Consumer Price Index plus a percentage of the previous year's rent untila set date when the final increase to market levels would be imp].emented. Anyunits reaching their market level before this date would, of course, remainthere. This is quite possible for many rooms in Kumasi where there are noservices and physical conditions are poor. This phasing would smooth the pathof adjustment giving tenants who could not afford their current room at themarket rent time to find suitable alternatives.
Figure 6.14: Internal Rate of Return Figure 6.15: Willingness; to PayFloating Up and Out Floating Up and Out
l O.Dg _ Thousands
-i.OX g ~~ ~ ~~~~~~~~~~~~~35 =
23
20
. ~~~~~~~~~~~~~~~~~~ g 1~~~~~~~~~~~ 50 /
- ia.o0 I 2 3 4 5 5 7 8 9 locontrolled Uncontrolled Difference Year
Figures 6.14 and 6.15 present the changes in rates of return andaffordability for a newly constructed unit between the current system andfloating up and out. Suppose (1) rents were completely indexed to inflation and(2) real rents were phased in as follows: real rents were doubled to 600 in thefirst year, 800 the second, 1000 the third, then finally freed at their freemarket level. Landlord profitability is roughly the same as it was for the firstoption presented in Figure 5.5, and affordability is ultimately also.
But the phase-in could prove less disruptive in tenants' minds. The lattermay seem a strange point, but no system of decontrol is worth attiempting whichis not politically feasible and sustainable. Decontrol followed by recontroldoes not do the market nor any part:icipant any good. Only if relaxation isperceived as fair by a substantial number of both landlords and tenants will itsucceed. Only if the government's commitment to the announced schedule is firmwill landlords supply more housing.

RENT CONTROL, PROFITABILITY AND SUPPLY 117
Other ORtions
Other systems which differentiate between tenants and or units (such asvacancy rate decontrol) are unlikely to be workable in Kumasi. Data requirementsand administrative capacity are simply too high. Any decontrol measuressuggested should be simple to administer and as fair to all parties as possible.
The contracting out option, where landlords are permitted to pay tenantsa compensatory sum in order to either change their lease or to let the room tosomeone else is most relevant in cities where the scale of rent is closely tiedto date of occupation. Thus, in a city where newer tenancies are uncontrolled,landlords can negotiate to buy out their existing tenants. Existing rents inKumasi are unaffected, in law, by the date of occupation; thus, contracting outis unlikely to be a useful mode of decontrol.
Decontrol by market segment could be useful for the self-contained unitsespecially as many of them are employer housing in which the tenant would becushioned from rent increases at least in the short term. Furthermore, thissub-market has been excluded from controls on previous occasions. However, rentsin self-contained premises are currently heavily affected by those of sharedaccommodation and would have to rise very considerably to represent marketvalues. If further segments of the market were required to spread controlgradually to the whole stock, division of the remainder would be very complex.Thus, what is intended-to be a gradual process, may need to be implemented inonly two stages.
- E. Summary
This Chapter showed that while housing quality in Kumasi is quite low, atleast the number of rooms seems to have kept pace with population growth inrecent years. Everyone lives somewhere, but often in overcrowded, unsanitaryconditions.
While rents are very low, landlords have had some residual motivation toinvest in order to reduce capital losses at a time when alternative investmentsdid not yield positive real returns. Since rents are no longer economic, "familyhousing" increased.
Simple present value models were used to explore alternative methods ofrelaxing controls. If rents rose to the levels suggested by the results of theprevious Chapter, landlords could obtain positive real returns and householdswould still pay reasonable fractions of their income for rents. However, itcannot be denied that many households would be shocked to see their rent burdensdouble for existing units.
Yet the present system is clearly not working. Government can choosebetween:
(a) Low rents accompanied by continuing overcrowding, insanitaryconditions, reduced labor mobility, which will probably worsen asadjustment provides other investment opportunities to landlords, and
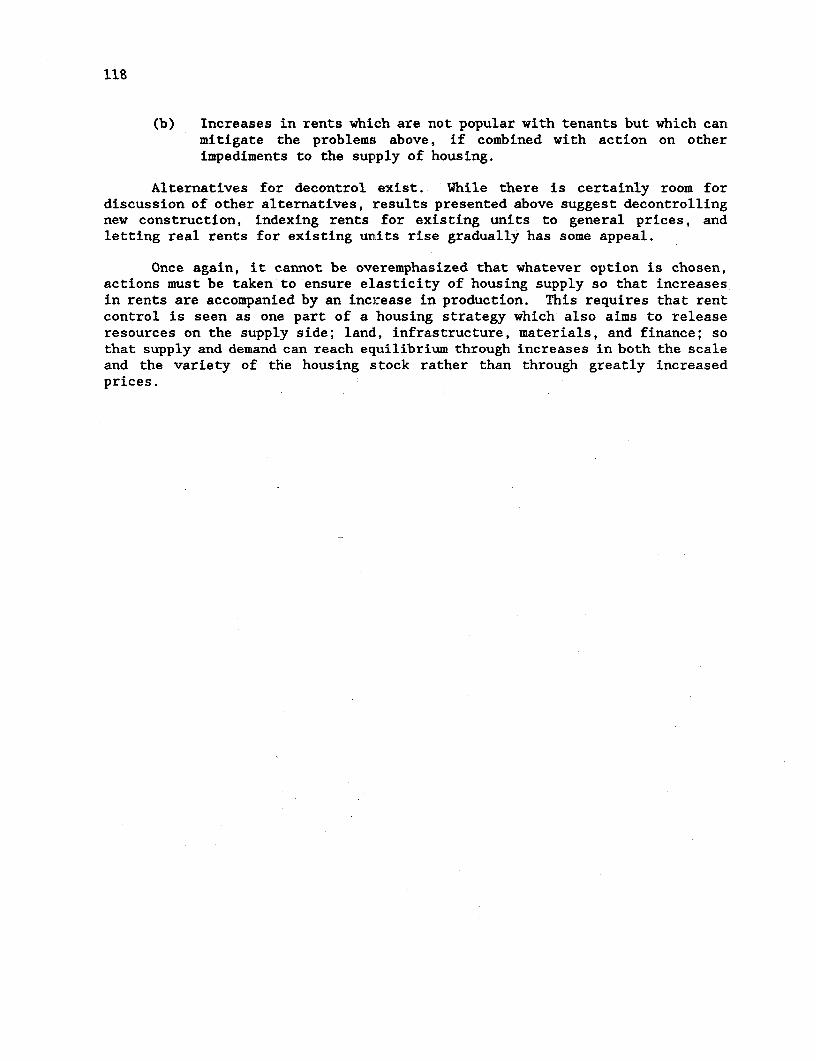
118
(b) Increases in rents which are not popular with tenants but which canmitigate the problems above, if combined with action on otherimpediments to the supply of housing.
Alternatives for decontrol exist. While there is certainly room fordiscussion of other alternatives, results presented above suggest decontrollingnew construction, indexing rents for existing units to general prices, andletting real rents for existing units rise gradually has some appeal.
Once again, it cannot be overemphasized that whatever option is chosen,actions must be taken to ensure elasticity of housing supply so that increasesin rents are accompanied by an increase in production. This requires that rentcontrol is seen as one part of a housing strategy which also aims to releaseresources on the supply side; land, infrastructure, materials, and finance; sothat supply and demand can reach equilibrium through increases in both the scaleand the variety of the housing stock rather than through greatly increasedprices.

VII. A FINAL SUMMING UP
Forty years of rent control have been successful in keeping rents in Kumasivery low, both as a percentage of consumption and in proportion to the cost ofbuilding. There can be few households in Kumasi who cannot afford the monthlyrent of a room. But housing conditions are worse than we would predict evengiven low incomes. And payment of rent advances is further eroding whatevergains some tenants receive from controls.
The Kumasi results are striking in the sense that rent absorbs less than2 percent of income on average. Indeed the rent to income ratio is extremelylow even compared to other rent control regimes in less developed countries.
The private sector has always provided most housing in the city.Government direct activity has been limited to a few small houses, now mostlysold to their occupants. At the same time, although there are major culturalincentives to build houses in Kumasi, very few households build only for theirown occupation.
Other severe problems in the housing market include problems in obtainingthe inputs to housing: land at affordable prices, building materials, andfinance. Land use and building regulations also take their toll. However, theevidence in this paper demonstrates that low rent levels have contributed to thepoor state of housing in Kumasi in 1989.
Housing conditions in Kumasi show many of the characteristics of shortage.Occupancy rates and the percentage of households in only one room are both high.There are fewer single person households than in the past, and the high cost areais becoming more like the rest of the city than it was in 1980. While there hasbeen a slowing down in housing starts since the mid 1970s, recent years have seenan increase in the number of rooms by additions to existing stock. Thus,although the number of houses has not kept pace with population growth since1980, the number of new rooms has.
There has been a reduction in the proportion of stock available for rentalsince 1980. Landlords have been replacing rent paying tenants with familymembers who live rent-free to such an extent that the percentage of family housetenants has doubled in the 1980 to 1986 period. There has, however, been littletransfer to commercial or other non-residential uses.
There is a generally low expectation of rent levels among both landlordsand renters. Rents are only about half of the market price for which the unitwould rent in the absence of rent control (roughly, 300 cedis controlled rentcompared to 600 estimated market rent for current units). But we estimatetypical households would spend considerably more than the the estimates ofuncontrolled rents for current units (roughly 1100 cedis). This implies thathousing consumption is well below equilibrium demand. Decontrolling rents wouldpermit landlords to achieve a positive real rate of return on their investment,which may be sufficient (given the additional cultural status attached to housebuilding) to stimulate an expansion in new housing units. However, collateralactions will be required in land, infrastructure, finance and other regulationto ensure that the supply response will be forthcoming.

120
Rent control is inefficient in the sense that the costs imposed by rentcontrol on landlords are not al:L captured by tenants as benefits. Thisefficiency loss is severe in some sectors of the Kumasi housing market. In allcases, rent control costs landlords more than the net benefit to tenants. Ifthe elasticity of demand for housing is around -0.5 (one reasonaLble assumption)a majority of tenants lose more from underconsumption of housing than they gainfrom lower rents.
In terms of distribution, the largest net benefits are captured by poorerhouseholds. Richer households suffer the most from consuming less than theirequilibrium demand. Long term tenants receive larger gains than others; in factfor recent movers costs exceed benefits. In the last few years, landlords havebegun to demand payment of rent for years in advance, creating considerablehardship for renters who must find many month's income in cash to obtain or holdon to a room.
Landlords differ little from renters except in the amount of housing theyare able to consume. Their incomes are little higher than renters' perhousehold; they are lower per cap:ita owing to their greater household size.However, the larger number of rooms they occupy does allow owner households tohave lower occupancy rates; they also have better access to water supply,toilets, and other facilities in the house.
Controls depress landlord's profitability and, hence, their incentives tosupply rental housing. Even after accounting for reduced maintenance and taxes,our estimate for a typical new unit is that the rate of return falls from about8 to -l percent. We noted that -1 percent at least preserved capital during theperiod when returns to financial .investments were highly negative, but thatreturns to financial investments should do better in the future. So must rentalhousing, if it is to compete for capital.
We estimate that, if decontrolled, rents for existing units would double(in 1986 prices), and rents for new units would roughly quadruple. However,these are estimates of long run equilibrium rents. While we have no dynamicmodel capable of predicting the time path of rents, we were able to explore theimplications of different assumed time paths using the present value model.
Note also that since the ceilings for "luxury" units have remained fixed(at 1000 cedis) as well as rents, and we estimate that new units would rent forover 1000 cedis, new construction could be decontrolled "by default" if landlordsbelieved the ceiling would not be changed in the future. A credible promise notto raise the ceiling could be one way to decontrol new construction.
Finally, while we emphasized "f-loating up and out" for existing units alongwith immediate decontrol for new construction and upgraded units, there are awide range of options which can be explored in more detail with the aid of thepresent value model. Building a political consensus behind decontrol is notindependent of but is more important than the technical means chosen fordecontrol or relaxation.

SUMMARY AND CONCLUSIONS 121
Rent controls reduce efficiency in the Ghanaian economy by depressing thereturn to a major share of Ghana's fixed capital, in addition to reducing thesocial efficiency of the housing stock. However, it is vital that policies forchanges in rent policy be taken as part of a broad housing strategy includingpolicies to improve the functioning of input markets for land, services, buildingmaterials, and finance, so with changes in land use and building regulations aswell, so that increases in rent would be accompanied by increases in the housingstock.

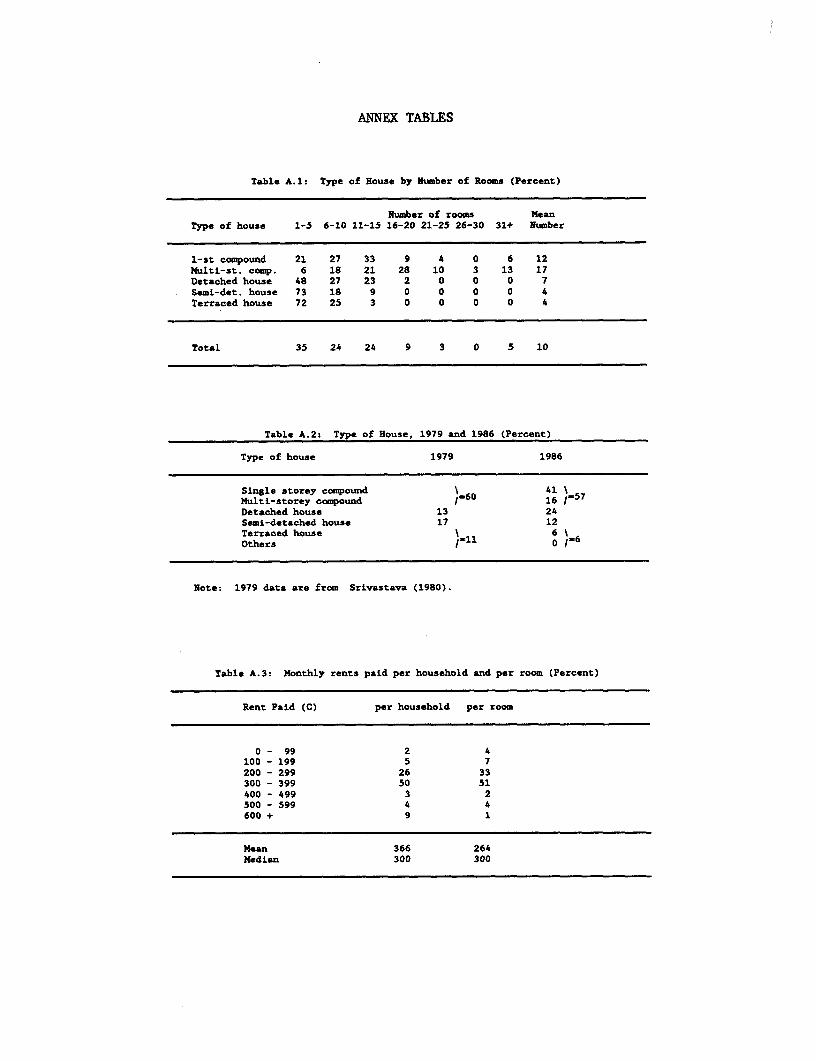
ANNEX TABLES
Table A1: Type of House by Number of Rooms (Percent)
Number of rooms MeanType of house 1-5 6-10 11-15 16-20 21-25 26-30 31+ Number
1-st compound 21 27 33 9 4 0 6 12Multi-st. comp. 6 18 21 28 10 3 13 17Detached house 48 27 23 2 0 0 0 7Semi-dot, house 73 18 9 0 0 0 0 4Terraced house 72 25 3 0 0 0 0 4
Total 35 24 24 9 3 0 5 10
Table A.2: Type of House, 1979 and 1986 (Percent)
Type of house 1979 1986
Single storey compound ' 41 \
Multi-storey compound 60 16 {-57
Detached house 13 24Semi-detached house 17 12Terraced house 6\Others /=11 0/.6
Note: 1979 data are from Srivastava (1980).
Table A.3: Monthly rents paid per household and per room (Percent)
Rent Paid (C) per household per room
0- 99 2 4100 - 199 5 7200 - 299 26 33300 - 399 50 51400 - 499 3 2500 - 599 4 4600 + 9 1
Mean 366 264Median 300 300
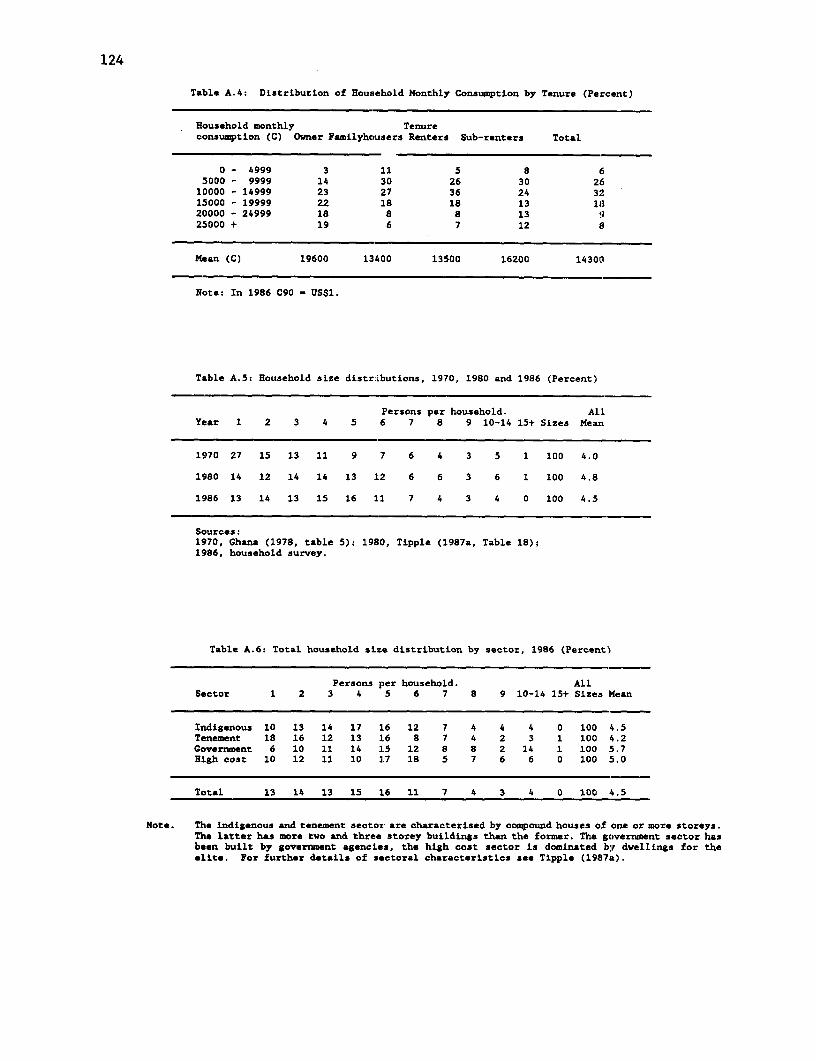
124
Table A.4: Distribution of Household Monthly Consumption by Tenure (Percent)
Household monthly Tenureconsumption (C) Owner Familyhousers Renters Sub-renters Total
0 - 4999 3 11 5 8 65000 - 9999 14 30 26 30 21510000 - 14999 23 27 36 24 3215000 - 19999 22 18 18 13 18320000 - 24999 18 8 8 13 925000 + 19 6 7 12 8
Mean (C) 19600 13400 13500 16200 14300
Note: In 1986 C90 - US$1.
Table A.5: Household size distr:Lbutions, 1970, 1980 and 1986 (Percent)
Persons per household. AllYear 1 2 3 4 5 6 7 8 9 10-14 15+ Sizes Mean
1970 27 15 13 11 9 7 6 4 3 5 1 100 4.0
1980 14 12 14 14 13 12 6 6 3 6 1 100 4.8
1986 13 14 13 15 16 11 7 4 3 4 0 100 4.5
Sources:1970, Ghana (1978, table 5): 1980, Tipple (1987a, Table 18);1986, household survey.
Table A.6: Total household size distribution by sector, 1986 (Percent)
Persons per household. AllSector 1 2 3 4 5 6 7 8 9 10-14 15+ Sizes Mean
Indigenous 10 13 14 17 16 12 7 4 4 4 0 100 4.5Tenement 18 16 12 13 16 8 7 4 2 3 1 100 4.2Government 6 10 11 14 15 12 8 8 2 14 1 100 .5.7High cost 10 12 11 10 17 18 5 7 6 6 0 100 5.0
Total 13 14 13 15 16 11 7 4 3 4 0 100 4.5
Note. The indigenous and tenement sectox are characterised by compound houses of one or more storeys.The latter has more two and three stor-y buildings than the former. The government sector hasbeen built by government agencies, the high cost sector is dominated by dvellings for theelite. For further details of sectoral characteristics see Tipple (1987aL).

ANNEX TABLES 125
Table A.7: Rooms occupied per household, 1980 and 1986 (Percent)
RoomsOccupied 1980 1986
1 70 (70) 73 (73)2 14 (84) 14 (87)3 7 (90) 5 (92)4 5 (95) 4 (96)5 2 (97) 2 (97)6 2 (99) 1 (99)7 0 (99) 1 (100)8 1 (100) 0 (100)9 0 (100) 0 (100)10+ 0 (100) 0 (100)
Mean 1.7 1.6
Table A.8: Rooms occupied by tenure (Percent)
No. of rooms Tenureoccupied Owner Family houser Renter Sub-renter
1 30 66 83 622 22 21 12 153 14 5 3 134 12 5 2 105 8 1 1 -6 9 2 0 -7 4 - 0 -8 2 1 - -9 _ _ _ _
10+ - 1 0 -
Mean rooms 3.0 1.7 1.3 1.7
Table A.9: Total and co-resident household sizes, 1980 and 1986 (Percent)
Persons per household. AllYear 1 2 3 4 5 6 7 8 9 10-14 15+ Sizes Mean
Total 14 12 14 14 13 12 6 6 3 6 1 100 4.81980
Co-res. 15 13 15 13 12 11 5 6 2 5 1 100 4.5
Total 13 14 13 15 16 11 7 4 3 4 0 100 4.51986
Co-res. 16 14 13 14 15 10 7 4 3 4 0 100 4.3
Sources.1980, Tipple (1987a, Table 18): 1986, Household Survey.

126
Table A.10: Co-resident Occupancy Rates, 1980 and 1986 (Percent)
Personsper room 1980 1986
0.0-0.9 6 41.0-1.9 22 222.0-2.9 2z1 203.0-3.9 17 164.0-4.9 12 135.0-5.9 9 96.0-6.9 6 77.0 + 8 9
Mean(personslroom) 3.3 3.3
Table A.l1: Overcrowded Households, Measured Against Different Thresholds, by Tenure (Percent)
Percentage of households overcrowded at:Overcrowding threshold (persons per room)
Tenure 2.5 3.0 3.5
Owner 38 34 29Family houser 54 49 35Renter 62 59 44Sub-renter 64 46 26
Total 58 54 40
Table A.12: Households without access to services, 1980 and 1986 (Percent)
ServiceYear Kitchen Bathroom Toilet Water
1980 15 3 22 331986 22 2 30 26

ANNEX TABLES 127
Table A.13: Households with exclusive access to services, 1980 and 1986 (Percent)
ServiceYear Kitchen Bathroom Toilet Water
1980 16 15 13 121986 16 13 12 11
Table A.14: Households without Access to Services, by Tenure (Percent)
ServiceTenure Kitchen Bathroom Toilet Water
Owner 11 3 14 17Family houser 24 3 43 34Renter 24 2 26 25Sub-renter 14 0 50 2
Total 22 2 30 26
Table A.15: Households with exclusive access to services, by tenure (Percent)
ServiceTenure Kitchen Bathroom Toilet Water
Owner 49 49 46 41Family houser 12 8 6 6Renter 12 8 8 8Sub-renter 22 27 26 27
Total 16 13 12 11

128
Table A.16: Length of stay in the house, by tenure (Percent)
Length of stay Tenure(years). Owner Family houser Renter Sub-renter
0- 4 16 21 26 385- 9 13 16 30 2210 -14 16 10 17 813 -19 13 12 13 1120 -24 11 9 6 825 + 32 32 9 13
Mean (years) 19 19 11 10
Table A.17: Selected Index Numbers (Rounded), 1970 to 1986 (1963 - 100).
General Prime Rent, Fuel ControlledConsumer Building Minimum & Power Rents ofPrice Index Costs Wage Index 1 room in
Year (Urban)(1) Index(2) Index(3) (Urban)(4) Sandcrete(5)
1970 176 123 154 113 1001971 - 129 154 - 1001972 - 151 154 - 1001973 260 177 154 119 1101974 313 238 199 119 1101975 431 331 308 119 1101976 649 360 308 119 1101977 1,370 502 615 382 1101978 2,350 782 615 530 1101979 3,520 1,210 615 677 3381980 4,970 1,810 615 1,020 3381981 11,000 3,200 1,850 1,830 3381982 13,400 3,730 1,850 2,530 5071983 28,800 4,780 3,850 3,900 5071984 40,600 - 5,380 6,620 5071985 46,200 (June) - 10,800 8,700 5071986 - - 13,800 - 5,070
Notes:1. From World Bank (1984) and Ghana Statistical Newsletter No.12/85 (1985).2. From Ghana Quarterly Digest of Statistics (1981) and Statistical Newsletter
No.16/83 (1983).3. To 1974 from Issifu Ali Committee (Ghana 1974); 1975 - 1981 own data; 1982 - 1985
Bentsi-Enchill (1986); 1986 own data.4. Before 1977 the index is just for rent. Sources, see 1 above.5. C6.50 in 1973 (NRCD 158), C20 :Ln 1979 (AFRCD 5), C30 in 1982 (PNDCL 5) and C300 in
1986 (PNDCL 138 and LI 1318).

REFERENCES
Aidoo, A. A., "Order and Conflict in the Asante Empire: A Study in InterestGroup Relations." African Studies Review, Vol. 20, No. 1 (1977) pp. 1-36.
Arnott, R., Rent Control and Options for Decontrol in Ontario. Toronto: OntarioEconomic Council (1981).
Asabere, P. K., "The Price of Urban Land in a Chiefdom: Empirical Evidence ona Traditional African City, Kumasi." Journal of Regional Science, November,(1981) pp. 329-39.
Asabere, P. and K. Owusu-Banahene. "Population Density Functions for GhanaianCities: An Empirical Note." Journal of Urban Economics 14 (1983) pp. 370-379.
Asabere, P., C.F. Sirmans and P. Colweil, "The Intensity of Residential LandUse in Accra, Ghana." Journal of Urban Economics 11 (1982) pp. 190-198.
Avrin, M. E., "Some Economic Effects of Residential Zoning in San Francisco."In: G. K. Ingram (ed) Residential Location and Urban Housing Markets.Cambridge, Mass: Ballinger Publishing Co. (1977).
Belfield, H. C., "Report on the Legislation Governing the Alienation of NativeLands in the Gold Coast Colony and Ashanti: Some Observations on the 'ForestOrdinance 1911."' Cmd 6278. London: H.M.S.O. (1912).
Belsley, D., E. Kuh and R. Welsch. Regression Diagnostics. Chichester: JohnWiley and Sons, (1980).
Bentsi-Enchill, N. K., "Work for "idle hands" (Ghana)." West Africa. 27thJanuary (1986), pp. 177-8.
Birdsall, N. & F. Orivel, Willingness to Pay for Health and Water in RuralMali: do WTP Ouestions Work? Washington DC: C.P.D. Discussion Paper No. 1983-8,The World Bank (1988).
Boapeah, S. N., "A Methodology for Calculating the Number of Houses Existing ina Settlement - An Application to Kumasi. Unpublished BSc Dissertation,Department of Planning, University of Science and Technology, Kumasi (1981).
Boapeah, S. N. and A. G. Tipple. "Estimating Housing Stock in a Third WorldCity, a Method Used in Kumasi." Third World Planning Review. vol. 5, no. 2, May(1983) pp. 177-188.
Boland, L. A., "A critique of Friedmann's critics." Journal of EconomicLiterature 17, (1979) pp. 503-522.
Bowdich, T. E., Mission from Cape Coast to Ashantee. London: J. Murray (1819),Frank Cass & Co. (1966).
Boyle, K.J., R.C. Bishop, and M.P. Welsh, "Starting Point Bias in ContingentValuation Bidding Games." Land Economics 61 (2), pp. 188-194.

130
Brealey, R. and S. Myers, Principles of Corporate Finance. McGraw Hill, 1981.
Brookshire, D. S., M. A. Thayer, J. Tschirhart, & W. D. Schulze,'A Test of the Expected Utility Model: Evidence from Earthquake Risks." Journalof Political Economy 93, (1985), pp. 369-389.
Brookshire, D. S., M. A. Thayer, W. D. Shulze & R. C. D'Arge,nValuing Public Goods: A Comparison of Survey and Hedonic Approaches." AmericanEconomic Review 72, (1982) pp. 165-177.
Brueggeman, W., Federal Rental Housing Production Incentives: Effects of Rentsand Investor Returns. Washington, DC: U.S. Government Accounting Office, 1985.
Building and Road Research Institute. Report on Asawasi Housing Estate survey.a Survey of the Living Conditions at Asawasi Housing Estate. Kumasi: Buildingand Road Research Institute (1970).
Busia, K. A., The Position of the Chief in the Modern Political System of Asante.Oxford: Oxford University Press (1951).
Butler, R. V., "The Specification of Hedonic Indexes for Urban Housing." LandEconomics 58, (1982) pp. 96-108.
Caudill, S., R. Ault and R. Saba. "Efficient Estimation of the Cost of RentControls." Mimeographed, Auburn University, (1987).
Clark, W. A. V., Modelling Housing Market Search. London: Croom Helm (1982).
Clemmer, R., "Measuring Welfare Effects of In-kind Transfers." Journal of UrbanEconomics 15, (1984) pp. 46-65.
Correll, M. R., J. H. Lillydahl, & L. D. Singell, "The Effects of Green Beltson Residential Property Values: Some Findings on the Political Economy of OpenSpace." Land Economics 54, (1978) pp.1207-217.
Cummings, R. G. et al, Valuing Environmental Goods: An Assessment of theContingent Valuation Method. Rowman and Allenhead (1986).
Darling, A. H., "Measuring Benefits Generated by Urban Water Parks." LandEconomics 49, (1973) pp. 22-34.
DeLeeuw, F. and N. Ekanem. "Time Lags in the Rental Housing Market." UrbanStudies 10 (1973) pp. 39-68.
DeLeeuw, F. and L. Ozanne, "Housing." In H. Aaron and J. Pechman (eds) HowTaxes Affect Economic Behavior. Brookings (1981).
DeSalvo, J.S., "A Methology for Evaluating Housing Programs.' Journal ofRegional Science 11 (2), (1971) pp. 173-185.

REFERENCES 131
DeSalvo, J.S., "Benefits and Costs of New York City's Middle Income HousingProgram." Journal of Political Economy 83 (4), (1975) pp. 791-807.
Diko, J., "Household Organisation in Asante Urban Settlement (A Case Study ofBantama, Kumasi).' Unpublished BSc Dissertation, Department of Planning,University of Science and Technology, Kumasi (1981).
Edoo, L. A. "Rent Control and Housing Quality: A Case Study of Rentals Paid byWorkers at U.S.T." Unpublished B.Sc. Dissertation, Department of Planning,University of Science and Technology, Kumasi (1982).
Edwards, M. 'Cities of Tenants: Renting Among the Urban Poor in Latin America.'In: A. Gilbert with J. E. Hardoy & R. Ramirez, Urbanisation in contemporaryLatin America. Chichester: John Wiley (1982)
Fallis, G. and L. Smith "Uncontrolled Prices in a Controlled Market: The Caseof Rent Controls." American Economic Review, March (1984).
Ferchiou, R., "The Indirect Effects of New Housing Construction in DevelopingCountries." Urban Studies 19, (1982) pp. 167-176.
Follain, J. R. and S. Malpezzi, Dissecting Housing Value and Rent: Estimates ofHedonic Indexes for Thirty Nine Large SMSAs. Washington DC: The Urban Institute.
Frankena, M., "Alternative Models of Rent Control." Urban Studies 12, (1975)pp. 303-308.
Fry, E. M. and J. B. Drew. Draft Town Planning Scheme for Kumasi: Report.Accra: Office of the Town Planning Adviser to the Resident Minister, W. Africa(1945).
Ghana, Government of, The Second Development Plan 1959-1964. Accra: GovernmentPrinter (1959).
Ghana, Government of, Kumasi Outline Town Planning Scheme. Accra: Ministry ofWorks and Housing (1962).
Ghana, Government of, Seven-Year Development Plan 1963/64 - 1969/70. Accra:Office of the Planning Commission (1964).
Ghana, Government of, Two Year Development Plan: from Stabilisation toDevelopment. A Plan for the Period Mid-1968 to Mid-1970. Accra (1968).
Ghana, Government of, One Year Development Plan. July 1970 to June 1971. Accra:Government Printer (1970).

132
Ghana, Government of, The Medium Term Plan. housing and town planning sector.The reRort of the Housing and Town Planning Committee (The de Graft-JohnsonReport). Accra: Development Secretariat (1971).
Ghana, Government of, Report of the Salary Review Committee (T.he Issifu AliCommission). Accra: Ghana Publishing Corporation (1974).
Ghana, Government of, Guidelines for the Five Year Development Plan 1975-80.Accra: Government Printer (1975).
Ghana, Government of, Five-Year DeveloRment Plan 1975/76 - 1979/80. Accra:Ministry of Economic Planning (1977).
Ghana, Government of, 1970 Population Census of Ghana: SRecial Report A. Accra:Census Office (1978).
Ghana, Government of, Ouarterly Digest of Statistics. Accra: Central StatisticalOffice (1981).
Ghana, Government of, 1984 Ponulation Census of Ghana. Preliminary ReRort.Accra: Bureau of Statistics (1985).
Ghana, Government of, National Housing Policy and Action Plan 1987 - 1990.Accra: Ministry of Works and Housing (1986).
Ghana, Government of, Acts, Laws, Decrees, and Instruments:
Rent Control (Amendment) Act. 1960.Rent Act. Act 220, 1963.Rent Regulations. LI 369, 1964.Rent (Amendment) Decree. NRCD 158, 1973.Taxation of Rent Decree. NRCD 204, 1973.Rent (Amendment) Decree. NRCD 250, 1974.Rent Tax Decree. NRCD 282, 1974.Public Servants Housing Loans Scheme Decree. NRCD 319, 1975.Rent Tax Decree. SMCD 115, 1977.Rent Tax (Amendment) Decree. SMCD 130, 1977.Rent Tax (Amendment) Decree. SMCD 190, 1978.Rent (Amendment) Decree. AFRCD 5, 1979.Rent (Amendment) (No 2) Decree. AFRCD 20, 1979.Public Servants (Control of Provision of Bungalows) Decree.AFRCD 34, 1979.Tema Development Corporation (Ownership of Houses) Decree.AFRCD 61, 1979.Rent Control Law. PNDC Law No. 5, 1982.Rent Tax Law. PNDC Law No. 82, 1984.Rent Control Law. PNDC Law No. 138, 1986.Rent Control (lst Schedule) (Amendment) Instrument. LI 1318, 1986.Land Title Registration Law. PNDC Law 152, 1986.

REFERENCES 133
Ghosh, Pradip and Rakesh Mohan. 'Housing in the National Accounts: A CriticalReview of Concepts and Sources." Indian Planning Commission: Housing and UrbanDevelopment Division Working Paper No. S.7, 1983.
Gittinger, J.P. Economic analysis of agricultural proiects. Baltimore: JohnHopkins University Press, 1982.
Gold Coast, Government of the. The Asawasi Housing Scheme: building instabilised laterite. Accra: Department of Social Welfare and Housing (1948).
Gold Coast, Government of the. Report of the committee of enguiry into rentals.(The Mate-Kole Report). Accra: Government Printer (1951a).
Gold Coast, Government of the. DeveloRment Plan. 1951. Accra: GovernmentPrinter (1951b).
Gold Coast, Government of the. Ordinances and Regulations:Kumasi Public Health Board Regulations, No. 1 of 1939.Defence (Rent Restriction) Regulations. No. 20 of 1942.Defence (Rent Restriction) Regulations. No. 18 of 1943.Defence (Rent Restriction) (Amendment) Regulations. No. 42 of 1943.Kumasi Lands Ordinance, Cap. 145, 1943.Emergency Powers (Transitional Provisions) Order, No. 20 of 1946.Rents (Control) Ordinance. 1947.Rents (Control)(Amendment) Ordinance. No. 39 of 1949.Rent Control Ordinance. No. 2 of 1952.
Goodman, J.L. Jr. "Is Ordinary Least Squares With a Limited Dependent VariableThat Bad?" Washington, DC: Urban Institute Working Paper No. (197 ).
Gyourko, J. and P. Linneman, "Measurement problems in quantifying thedistributional effects of subsidy programs." Wharton School Working Paper,(1986).
Hagan, G. P., "Asante Bureaucracy: A Study of the Growth of CentralisedAdministration in Asante from the Time of Osei Tutu to the Time of Osei TutuKwamina Esibe Bonsu. Transactions of the Historical Society of Ghana 12, (1971)pp.43-62.
Hamilton, Rabinovitz, Szanton and Alshuler; and The Urban Institute. The LosAngeles Rent Stabilization System: Impacts and Alternatives. April (1985).
Hammer, T. R., R. E. Coughlin & E. T. Horn, "The effect of a large urban parkon real estate value." Journal of the American Association of Planners 40,(1974) pp. 274-277.
Hammond, C., The Benefits of Subsidised Housing Programmes. Cambridge:Cambridge University Press (1987).
Heckman, J. "Sample Selection Bias as a Specification Error." Econometrica,January (1979).

134
His Majesty's Government, 'Report on Sanitary Matters in Various West AfricanColonies and the Outbreak of Plague in the Gold Coast, August 1909 (The SimpsonReport).' Cmd 4718. London: The Colonial Office (1909).
His MajestyIs Government, 'Annual Report on Asante, 1919." Col. 1058. London:H.M.S.O. (1921).
Houlberg, P. and J. Nimako. Unauthorised Housing in Kumasi. Kumasi: Departmentof Housing and Planning Research, UJniversity of Science and Technology (1973).
Kahnert, Friedrich. Improving Urban Employment and Labor Productivity. WorldBank Discussion Paper No. 10, 1987.
Kiefer, D., "Housing Deterioration, Housing Costs and Rent Control." UrbanStudies 17, (1980) pp. 53-62.
Killick, T., Development Economics in Action. London: Heinemaln (1978).
Knetsch, J. L., "The Influence of Reservoir Projects on Land VaLues." Journalof Farm Economics 46, (1964) pp. 231-243.
Kraft, J. & E. 0. Olsen, "The Distribution of Benefits from Public Housing."In: F. T. Juster (ed), The distribution of Economic Well-being. Cambridge,Mass: National Bureau of Economic Research (1977).
Kravis, I., A. Heston and R. Summers, World Product and Income: InternationalComnarisons of Real Gross Product. Baltimore: Johns Hopkins University Press,(1982).
Kuznets, S. "Quantitative Aspects of Economic Growth of Nations: VI, Long TermTrends in Capital Formation Proportions. Economic Develooment: and CulturalChange, July (1961).
Kwakye-Safo, S. "The Contribution of State Housing Corporation to HousingDevelopment in Ghana." Unpublished BSc. Dissertation, Department of Planning,University of Science and Technology, Kumasi (1981).
Lewin, T. J., 'The Structure of Political Conflict in Asante 1875 - 1900."Chicago: Doctoral Dissertation, Northwestern University (1974).
McCaskie, T. C., "Office, Land and Subjects in the History of the Manwere Fekuoof Kumasi - An Essay in the Political Rconomy of the Asante State." Journal ofAfrican History, Vol. 21, No. 2 (1980) pp.189 -208.
McCaskie, T. C., "State and Society, Marriage and Adultery - Some ConsiderationsTowards a Social History of Pre-colonial Asante." Journal of African History,Vol. 22, No. 4 (1981) pp.477-494.
McCaskie, T. C., "Accumulation, Wealth and Belief in Asante History, 1. to theClose of the Nineteenth Century." Africa, Vol. 53, No. 1.(1983).
REFERENCES 135
McCaskie, T. C., "Accumulation, Wealth and Belief in Asante History, Part II:the Twentieth Century." Africa, Vol. 56, No. 1 (1986) pp. 3- 24.
Maclennan. D., Housing Economics: An ARRlied Approach. London: Longman (1982).
Maddala, G.S. Limited-dependent and Qualtitative Variables in Econometrics.New York: Cambridge University Press, 1983.
Malpezzi, S., Rent Control and Housing Market Equilibrium Theory and Evidencefrom Cairo, Egypt. Washington DC: PhD Dissertation, The George WashingtonUniversity (1986).
Malpezzi, S., Analyzing Incentives in Housing Programs: Evaluating Costs andBenefits with a Present Value Model. World Bank, Infrastructure and UrbanDevelopment Discussion Paper No. 23 (1988).
Malpezzi, S. and Mayo, S. Housing Demand in DeveloRing Countries. World BankStaff Working Papers No. 733. Washington DC: The World Bank (1985).
Malpezzi, S. and Mayo, S. "The Demand for Housing in Developing Countries:Empirical Estimates from Household Data." Economic Development and CulturalChange, July (1987).
Malpezzi, S. and Mayo, S. "User Cost and Housing Tenure in DevelopingCountries.' Journal of Development Economics, (1987).
Malpezzi, S., S. K. Mayo, R. Silveira & C. Quintos, Measuring the Costs andBenefits of Rent Control: Case Study Design. World Bank, Infrastructure andUrban Development Department Discussion Paper No. 24 (1988).
Malpezzi, S., L. Ozanne & T. Thibodeau, Characteristic Prices of Housing in 59Metropolitan Areas. Washington, DC: The Urban Institute (1980).
Malpezzi, S., L. Ozanne & T. G. Thibodeau, "Microeconomic Estimates of HousingDepreciation.' Land Economics 63, (1987) pp. 372-385.
Malpezzi, S. and C. P. Rydell. Rent Control in Developing Countries: A Frameworkfor Analysis, World Bank Discussion Paper, Report No. UDD- 102. Washington DC:Water Supply and Urban Development Department, The World Bank (1986).
Malpezzi, S. and V. K. Tewari Costs and Benefits of Rent Control in Bangalore.India. Washington DC: Operations and Research Division, Water Supply and UrbanDevelopment Department, The World Bank (1987).
M4ayo, S.K. "Theory and Estimation of Housing Demand." Journal of UrbanEconomics, (1981).
Mayo, S.K. and D.J. Gross, "Sites and Services -- and Subsidies: The Economicsof Low Cost Housing in Developing Countries." World Bank Economic Review, July(1986).

136
Mayo S. K. et al. Informal Housing in Egypt. Washington DC: Abt Associates(1982).
Mayo, S. K., Malpezzi, S. J. & D. J. Gross, 'Shelter Strategies for the UrbanPoor," World Bank Research Observer, Summer (1986).
Mishan, E.J., Cost Benefit Analysis. London: George Allen and Unwin, (1982).
Moorhouse, J. C., "Optimal Housing Maintenance Under Rent Control." SouthernEconomic Journal 39, (1972) pp. 93-106.
Murray, M.P., "The Distribution of Tenant Benefits in Public Housing.Econometrica 43 (4), (1975) pp. 771-788.
Murray, M. "Hicks, Marshall, and Points Off the Demand Curve." Public FinanceOuarterlv, October (1976).
Murray, M. "Methodologies for Estimating Housing Subsidy Benefits." PublicFinance Quarterly, April (1978).
Murray, M. and C.P. Rydell. "Analyzing Rent Control: The Case of Los Angeles."Rand Corporation Paper P-7363, (1987).
Muth, R. F., "The Derived Demand for Urban Residential Land." Urban Studies 8,(1971) pp. 243-254.
Muth, R.F. "Housing Market Dynamics." Paper Presented to the American RealEstate and Urban Economics Association, New Orleans, (1987).
Nierstrasz, F. H. J. and H. J. van Hunnik, Report on Housing Policy to theGovernment of Ghana. A Mission from Bouwcentrum, The Netherlands in co-operationwith the U. N. Economic Commission for Africa (1967).
Ofei, T. K., "Extension of Estate Houses in North Suntreso (A Study)."Unpublished B.Sc. Dissertation, Department of Planning, University of Scienceand Technology, Kumasi.
Olsen, E. O., "A Competitive Theory of the Housing Market." American EconomicReview 59, (1969) pp. 612-622.
Olsen, E. O., "An Econometric Analysis of Rent Control." Journal of PoliticalEconomy 80, (1972) pp. 1081-1100.
Olsen, E. O., "The Role of Government: in the Housing Sector." In: H. Giersch(ed), Reassessing the Role of Government in a Mixed Economy. Tubingen: J. C.B. Mohr (1983).
Olsen, E. O., What Do Economists Know About Rent Control? Charlottesville:Department of Economics, University of Virginia (1987).

REFERENCES 137
Olsen, E.O. and N. Agrawal. "Aggregation Bias in the Estimation of the Benefitsof Government Programs." Institute for Research on Poverty Discussion Paper No.710-82, 1982.
Olsen, E. 0. & D. M. Barton, The Benefits and Costs of Public Housing in NewYork City. Charlottesville: Discussion Paper 123, The Thomas Jefferson Centrefor Political Economy, University of Virginia (1982).
Olsen, R.J. "A Least-squares Correction for Selectivity Bias.' Econometrica,November (1980).
Ozanne, L. and S. Malpezzi. "The Efficacy of Hedonic Estimation with the AnnualHousing Survey: Evidence from the Demand Experiment." Journal of Economic andSocial Measurement, July (1985).
Peil, M. "African Squatter Settlements -- A Comparative Study." Urban Studiesvol. 13, no. 1 (1976), pp. 155-166.
Peil M. and P. 0. Sada, African Urban Society. London: John Wiley (1984).
Price, R., The Social Basis of Adminstrative Behaviour in a Transitional polity:the Case of Ghana. Berkeley: PhD Dissertation, University of California (1971).
Renaud, B. Housing and Financial Institutions in Developing Countries. WorldBank Staff Working Paper No. 658 (1984).
Ricketts, N. "Housing Policy: Towards a Public Choice Perspective." Journal ofPublic Policy 1 (1981) pp. 501-522.
Ridker, R. G. & J. A. Henning, "Determinants of Residential Property Values withSpecial Reference to Air Pollution.' Review of Economics and Statistics 49,(1967) pp.246-257.
Robinson, R. Housing Economics and Public Policy. London: Macmillan (1979).
Rutter, A. F., "Ashanti Vernacular Architecture," In: P. Oliver (ed), Shelterin Africa. London: Barrie and Jenkins (1971).
Schildkrout, E. People of the Zongo, The Transformation of Ethnic Identitiesin Ghana, Cambridge: Cambridge University Press (1978).
Schmitter, J-P. Economic Effect of Housing in Developing Countries. Field Studyin Ghana. Part A.. Analysis of Two Settlements in Kumasi. Darmstadt: Instituteof Tropical Building and Planning (1979).
Schreckenbach, H., Construction Technology for a Tropical Developing Country.Eschborn: Deutsche Gesellschaft fur Technische Zusammenarbeit (GTZ) GmbH (1982).
Schulze, W. D., R. C. D'Arge & D. S. Brookshire, 'Valuing EnvironmentalCommodities: Some Recent Experiments." Land Economics 57, (1981) pp. 151-172.

138
Schwab, R.M., "The Estimation of the Benefits of In-kind Government Programmes."Journal of Public Economics 27, (1985) pp. 195-210.
Smith, V. K. "Supply Uncertainty, Option Price, and Indirect Benefit Estimation.Land Economics 61 (1985), pp. 303-309.
Social Security and National Insurance Trust (SSNIT), Proposals for Conversionof Social Security Provident Fund into a National Social Insurance Scheme (1987).
Srivastava, R. P., Kumasi Housing Survey, Current Paper No. 33, Kutmasi: Buildingand Road Research Institute (1980).
Stanley, J. The Legality of Aviia. A Case Study of Development Procedures ina Suburb of Kumasi. Research Report, No. 2., Kumasi: Department of Planning,University of Science and Technology (1975).
State Housing Corporation, Own a House: House Types. 2nd Edition. Accra,Government Printer (1975).
Struyk, R.J., "The Distribution of Tenant Benefits from Rent Control in UrbanJordan.' Land Economics 64 (2), (1988) pp. 125-134.
Theil, H. Principles of Econometrics. New York: Wiley and Sons (1971).
Tipple, A. G. Asante Culture and Low Income Housing Policies: An Examinationof Antithesis. Urban Development Department Discussion Paper UDD-45. WashingtonDC: The World Bank (1983).
Tipple, A. G., Towards a Culturally Acceptable Housing Strategy, The Case ofKumasi, Ghana. Newcastle upon Tyne: PhD Dissertation. University of Newcastleupon Tyne (1984a).
Tipple, A. G., "Household Size and Composition and Implications for Housing Needin Kumasi, Ghana: a research note." Planning Outlook. vol. 27, no. 2 (1984b),pp. 98-105.
Tipple, A. G., "A Revolution in Property Rights (Ghana)." West Africa, 27thJanuary (1986), pp. 179-180.
Tipple, A. C., The DeveloDment of Housing Policy in Kumasi. Ghana. 1901 to 1981:with an Analysis of the Current Housing Stock. Newcastle upon Tyne: Centre forArchitectural Research and Development Overseas, University of Newcastle uponTyne (1987a).
Tipple, A. G., 'Housing Policy and Culture in Kumasi, Ghana: A Study ofConstraints and Resources." Environment and Behaviour, Vol 19, No. 3 (1987b),pp.331-352.
Tipple, A. G., "Upgrading and Culture in Kumasi: Problems and Possibilities.'In: R. A. Obudho and C. C. Mhlanga, Slum and Sguatter Settlement in Africa:Towards a Planning Strategy. New York: Praeger (1988).

REFERENCES 139
United Nations. Review of Rent Control in Developing Countries. New York:Department of International Economic and Social Affairs (1979).
UNCHS (Habitat) Global Report on Human Settlements (1987).
The Urban Edge, 'Rental Housing: A Rediscovered Priority." February 1984.
The Urban Edge, "Making Shelter Projects Replicable." December 1985.
The Urban Edge, "Measuring the Benefits of Rent Control.' November 1987.
Walters, A. A., Noise and Price. Oxford: Clarendon (1975).
Weicher J. C. & R. H. Zerbst, "The Externalities of Neighbourhood Parks: AnEmpirical Investigation." Land Economics 49, (1973) pp. 99-105.
Wilks, I., "Aspects of Bureaucratisation in Asante in the 19th Century." Journalof African History, Vol. 7, No. 2 (1966).
Wilks, I., "Asante Government." In: D. Forde and P. Kaberry (eds), West AfricanKingdoms in the Nineteenth Century,. London: Oxford University Press (1967).
Wilks, I., Asante in the Nineteenth Century. Cambridge: Cambridge UniversityPress (1975).
Wilks, I., "The Golden Stool and the Golden Elephant's Tail: An Essay on Wealthin Asante." Research in Economic Anthropology 2, (1979) pp. 1- 36.
Willis, K. G., "Costs of Waiting, Risk and Individual Action: The Case of PublicHousing." Environment and Planning C. Government and Policy 2, (1984) pp.307-324.
Willis, K. G. & M. C. Whitby, "The Value of Green Belt Land." Journal of RuralStudies 1, (1985) pp. 147-162.
World Bank, The. Ghana: Policies and Program for Adjustment. Washington DC:World Bank Country Study (1984).
World Bank, The. World Development Report 1987. New York: Oxford UniversityPress (1987).
Distributors of World Bank PublicationsARGENTINA FINAND MEXX) SPAINCaros .Hl. SRL Akaioemn K .W MFaOTEC M4undwn-Pows L1lmnk SAGloGuen P.O. Eo 123 ApwtodoE a22-4C0 '=37Pladdo 165,4th Floa-Ote.453/465 SF4V101 I4D60T1111,M1 dMD.Fd :M1 Madid1333 Brm AOIMHdo 10
MOROCCO U1TUO Inadonal AED06AUSTRALIA. PAPUA NEW GUINEA, FRANCE Soe d'EtM nMarocaie 1:11 deCont, 391FIJLSOLOMON ISLANDS, Wed anI2rocM1 n OM,Ed.d'Anf (B.VANUATU, AND WhSTERN SAMOA 6S, amnw dila Caabl-aD.A. Book.&Jownals 7SI16PFus SKI IANKA AND THE MALDIVES11-13 Station Seet NfTHERLANDS Lake MotoxBlO pMtid.m 3132 GIERMANY, EDERAL. REPUB LIC OF hvrPHkdb.P.O. Eon 244Victoria UNO-Vea P.o. Box 14 I0M Sk ChidOJ o A. GCdiner
Pappdedafe Al SS 7240 SA Locn MawthaAUSTRIA D-530D Ben I Colocba 2Geuod nd Co. NEW ZEALANDGmbee,31 GECElfiB HMl Lbeay nd fmo6on Suoke S WfiDEA-1011 Win EMAE PrivaBas
6 FakiWlr24, Ipodm St EPliPlastirse Ne- Maket FPitik FKodo?OtOt
BANRAIN AIh.w-11635 ABhod oetanlI Bo1 16356DahrkomRe-nt and Conadlancy 5-103 27Stockhtolm
Awodato Ltd. GUATEMALA NIGERIAP.O. BOX 22(1 lbreisPled SSmta Univenaty PemLiUmited F h r ABManamna Teown 317 Genre ColtwnPidr. Santa ThOCrownBWIdmJidwh W.moupn-WMlamAB
oalle -I0 zoial PdRvateMaiBg5D C 30t4BANGLADESH Guatouna City Ibada 5-10425%1ckhhdmnMim htdatio Devdpment
Afeaotxe Soc9ty (MIDAS) HONG KONG, MACAO NORWAY SWITZERLANDHovme 5, Road 16 AJDa 20E Lid. N =nhdatok Catir 2forinirwEoDhamnmo,di RIAro 6 1. 146 Prince, Etwand Ro.d, W. Batm N.ewn,vei 2 Llboralk Popo
haka 120.E KAloe*t P.o. BD 6125 EBannd 6. reTCnDsHong Kaw;E N-0602 Oo 6 CepastaI38t
B nqoffa CHIVI 11Gerg 11156.NArAoed Snalk HUNGARY OMANChttagog 40D Klht MEM InfrwtimloaSevmica Faruthacrim aoni
P.o. BEo 139 P.o.UB163l SeetAhport L nine EPayot76, KDA Awme,o 1309Bud"poa62 Mutt ServkcedeAbcamemnatsKuhoa Cae p-c 3312
INDIA PAKISTAN CHi1D2L oNBLGIIIM Allie Pitblol., Private Lid. Muza BokAgKP.blirationddeeNsaicesUnie, 751 MouSt ROd 65, Muzyo4d*zam TJANZANIAAv. du Rd I2 Madlaa-60102 P.O B, No. 729 Olud Utivetty Pr,1060 Bnnebh LAhre 3 P.O. Box S299
B ranA>rw Der eaSlaaBRAZIL ISJN Heredi. Mag PERUPdulcacceaTearicas. niececdkat. Bafod ERAte EdieriatDe.snoliosA THAILAND
1Ada. Bmby - 4C 035 Apartado 3624 Ceohna Daetmnt staeRUY Pienotocrride.2D9 L.ima 3009SitoadO0109&SoPaulo,SF 13/14AadAA Road Bangkok
New Dehi-1100D2 PHILIPINESCANADA Natdioal Bock Store TRINIDAD A TOBAGO, ANiGUALe Diffueeur 17 Crdttaraan Avonue 701 SinaI Avnue BARBlWDA, BARBADOS,Cr. 85.,501BeAnpbre Calutlt-700D72 P.O. Bn 934 DOMINICA, GRENADA, GUYANA,Booehav,Ie Q, Meato MenDlA JAMAICA. MONTSERRAT, ST.43 SFE6 jayadeva Hod Buuilding KIlTS & NEWVS. ST. UCIA.
Si Maln Rod Gandhnagar POLANID ST. VINCENT&GRENADINESCHINA Barzoore-5600 ORPAN Sydlanza SbadlesUritChne Hoando1 & Eonmic Publishig Pow K(LhZY i Nauli 91N*
Havoe 35-112K ddgud Croa Road a]-gm Wamonw CweepsB D. Fn StDrgjie Hydeabd -SOD027 TtdndoAe Wet IndiaEltif PORTUGAL
F'mrtheana Rlot, 2nd Plor Lhai Poug TURKEYCOLOMBIA NearThakrxeSngNean
1gp-.a E.DCarmo7)-74 ioat Kitqpet AS.R9lwe Ud. Ahemadabad -360 009 120 Utban tlia Cedded No. 469AprtdoA Ao 342710Bogota D.E. Patial Hotois SAUDI ARABIA, QATAR Istanbu
16-AAahokMarg larirBokStanCOSTA RICA Lucknow - 226011 PO y 316 UGANDALilvda tro3D Riyldh1471 Uganda BookpCA11.11-13 WDONBSLA P.O. BE 7145Av. Fernandez Guel Pt Indir Ltidted MEMRBE WInation Se-vces K ,aSma Je JLRSa Rtduog 37 B ci*%
P.O. Box 181 Al Al. Street UNITED ARAB EMIRATESCOTEV'VOiRE Jkari. Fot Al Dohw h ter MEfMRBGulfCo.Centrsd'Edi-d,ontdeD lnn Pii-, r N P.O. Bo 6097
A(CEL1r(CEEA) BIRELAND P.O. Box 7188 Sharlh04 BP. 541 TDC PublidtRaAbtd1 n 04 PItiu 12 North Fredericnk SRte UNIrED KINGDOMCYPRUS btin I HOJ Abd5i hl Building Miaofo LAd.
CYPRUS ~~~~~~~~~~~~~~~~~~~Icing K1ale Stree P.O. Eon3MEMRB ilnfmatn SeeVin ITALY P.O Bon 3969 Altone, HaBpDY dr GU34 2PGP.O. Box 2EN U.s. Commiaia Saniori SPA Englan ndNic.da Via Benodetto I rlini, 120/10
Camio Pod le 552 33, Mdaned Hlan Awnd StoaeL URUGUAYDENMARK 5DI25Floreno P.O.BS In9ututoNadaldd lbroSanmhad*Utwatw jeddah Sa nJn1116RoaaoernaA1d 11 JAPAN MotieedDK9-lFDkPredbgC EanBorBk S-ndse SINGAPORE, TAIWAN, MYANMARn
3743, lHongo 3Xne, Bunkyo-ku 113 BRUNEI VENEZUELADOMINICAN RErUBUC Tokyw Intmaimon Publaion lrebd. dd1 EsteEdit.r. TaIlr., prA. Prvae,Ud. Apdo. 60D37Re.tawdoone e 1-balo 1 GCatic 309 KENYA 02C6 lot Fl. Pl-Fu Induatril C cl0AAp4t.d. Po"al 2190 AlHaBookSer-Ace IPE.A) LUd. Bldg.Santo Dmingo P.o. Box 45245 24 New Induira Rood YUGOSLAVIA
NainU Singaperel1S3 Jugodirno llapEL SALVADOR YU-IIGt10BelgradeTg RepublikeFuPade. XOREA. REFUBuC OF SOUTH AFRICA, BOTSWANAAvnid,a Mnud EorlueAaujo 53010 Pa Korm Book C.portlc Forio 5 ktiil.,EdiEdo SSA, la. Pian P.O. Box 101, Kw-gwhanmn Onfrd Universty Pro SoultrnnSan Snlvaor seixAtIk
P.O. Eon 1141EGYPT, ARAB REPUBLIC OF XUWAIT T MMAl Ahram MEMRSB Iration Sen Cpe Al Gaa Stree P.O. Box 5465 Forn,,i odemCalr IntGrrtcud Subecriptin Service
MALA'YSIA P.O. RBn 41095TieMiddle Eo 0b1ver Univendty d Melye Cooputive P OB no5oatwaA.Bout Sookahopit,dtbd J a 024Cairo P.O. Box 1127, J*la Pantai Saru
Kuala lmpu

RECENT WORLD BANK DISCUSSION PAPERS (continued)
No. 45. Primary School Teachers' Salaries in Sub-Saharan Africa. Manuel Zymelman and Joseph DeStefano
No. 46. Education and Its Relation to Economic Growth, Poverty, and Income Distribution: Past Evidenceand Further Analysis. Jandhyala B.G. Tilak
No. 47. International Macroeconomic Adjustment, 1987-1992. Robert E. King and Helena Tang
No. 48. Contract Plans and Public Enterprise Performance. John NellisTAlso available in French (48F)J
No. 49. Improving Nutrition in India: Policies and Programs and Their Impact. K. Subbarao
No. 50 Lessons of Financial Liberalization in Asia: A Comparative Study. Yoon-Je Cho andDeena Khatkhate
No. 51 Vocational Education and Training: A Review of World Bank Investment. John Middleton andTerry Demsky
No. 52 The Market-Based Menu Approach in Action: The 1988 Brazil Financing Package. Ruben Lamdany
No. 53 Pathways to Change: Improving the Quality of Education in Developing Countries.Adriaan Verspoor
No. 54 Educating Managers for Business and Government. Samuel Paul, Jacob Levitsky, and John C. Ickis
No. 55 Subsidies and Countervailing Measures: Critical Issues for the Uruguay Round.Bela Balassa, editor
No. 56 Managing Public Expenditure: An Evolving World Bank Perspective. Robert M. Lacey
No. 57 The Management of Common Property Natural Resources. Daniel W. Bromley and Michael M. Cernea
No. 58 Makinq the Poor Creditworthy: A Case Study of the Integrated Rural Development Program in India.Robert Pulley
No. 59 Improving Family Planning, Health, and Nutrition Outreach in India: Experience from Some WorldBank-Assisted Programs. Richard Heaver
No. 60 Fighting Malnutrition: Evaluation of Brazilian Food and Nutrition Programs. Philip Musgrove
No. 61 Staying in the Loop: International Alliances for Sharing Technology. Ashoka Mody
No. 62 Do Caribbean Exporters Pay Higher Freight Costs? Alexander J. Yeats
No. 63 Developing Economies in Transition. Volume I: General Topics. F. Desmond McCarthy, editor
No. 64 Developing Economies in Transition. Volume II: Country Studies. F. Desmond McCarthy, editor
No. 65 Developing Economies in Transition. Volume III: Country Studies. F. Desmond McCarthy, editor
No. 66 Illustrative Effects of Voluntary Debt and Debt Service Reduction Operations. Ruben Lamdany andJohn M. Underwood
No. 67 Deregulation of Shippinq: What Is to Be Learned from Chile. Esra Bennathan with Luis Escobarana eorge PanagaKos
No. 68 Public Sector Pay and Employment Reform: A Review of World Bank Experience. Barbara Nunberg
No. 69 A Multilevel Model of School Effectiveness in a Developing Country. Marlaine E. Lockheed andNicholas T. Longford
No. 70 User Groups as Producers in Participatory Afforestation Strategies. Michael M. Cernea
No. 71 How Adjustment Programs Can Help the Poor: The World Bank's Experience. Helena Ribe, SoniyaCarvalIho, Robert Liebenthal, Peter Nicholas, and Elaine Zuckerman
No. 72 Export Catalysts in Low-Income Countries: A Review of Eleven Success Stories. Yung Whee Rheeand Therese Belot
No. 73 Information Systems and Basic Statistics in Sub-Saharan Africa: A Review and Strategy forImprovement. Ramesh Chander

The World Bank UHeadquarters European Office Tokyo Office1818 H Street, N.W. 66, avenue d'Iena Kokusai BuildingWashington, D.C. 20433, U.S.A. 75116 Paris, France 1-1 Marunouchi 3-chorme
Telephone: (202) 477-1234 Telephone: (1) 47.23.54.21 Chiyoda-ku, Tokyo 100,JapanTelex: WUI 64145 WORLDBANK Telex: 842-620628 Telephone: (3) 214-5001
RCA 248423 WORLDBK Telex: 781-26838Cable Address: INTBAFRAD
WASHINGTONDC
ISBN 0-8213-1463-7