Embed Size (px)
DESCRIPTION
This report aims to highlight potential benefits and pitfalls of SLR and PLICS. It seeks to make clear the reasons underlying the effectiveness of such tools. To demonstrate these issues we focus in particular on the example of a central piece of hospital activity, examining cost calculation models of the operating theatre.
Citation preview

Costing in the National Health Service: from reporting to managing
Christopher S. Chapman and Anja KernImperial College London

1 | Costing in the National Health Service: from reporting to managing
Key findings
• Set out more clearly the underlying philosophy of cost analysis and management in official DH documents.
• Develop training for NHS staff in the roles and potentials of appropriately constructed cost information.
• Develop the evidence base on the potential and effectiveness of SLR and PLICS.
Executive summary
The NHS faces major cost reductions in the coming years. Two new costing tools are currently being implemented in trusts. The Department of Health (DH) recommends National Health Service (NHS) Acute Hospital Trusts adopt Patient-Level Information and Costing Systems (PLICS). Monitor recommends Service Line Reporting (SLR) preferably supported by patient level data. A recent CIMA survey provides evidence that more than 70% of responding NHS trusts have implemented PLICS and/or SLR.
Results from case studies and consultations with clinicians, senior finance managers, management accountants, and software suppliers1 show that great efforts are being made to initiate PLICS and/or SLR implementation in the NHS. The next step, which now needs to be taken, is to obtain greater engagement from clinicians. Engagement is crucial for going beyond a box ticking exercise and assuring the effectiveness of these tools. Securing clinical engagement depends on a shift in the analysis of cost behaviour underlying new costing tools – from allocating costs in ever greater detail to an analysis of activity and its resource consumption, thus actively supporting the management of cost. If this shift from allocating to managing is not achieved then PLICS and SLR may become a more expensive top-down cost exercise, with little added value in comparison to traditional costing tools.
Fieldwork undertaken in several acute trusts has demonstrated that effective analysis of activity and resource consumption is being developed as a part of PLICS. PLICS can produce cost information which is more meaningful and relevant for clinicians. It thus enables clinicians to consider both cost and quality of care when taking decisions. There
is a potential danger that arises if trusts first implement SLR with a view to moving on later to PLICS. If this is the case then PLICS may be carried out as a top-down analysis. The benefits of improved decision making informed by cost information may not be realised.
This report aims to highlight potential benefits and pitfalls of SLR and PLICS. It seeks to make clear the reasons underlying the effectiveness of such tools. To demonstrate these issues we focus in particular on the example of a central piece of hospital activity, examining cost calculation models of the operating theatre.
Introduction
The National Health Service (NHS) faces a major challenge to transform itself into a patient-centred organisation, while at the same time saving over £20 billion between 2011 and 2014. Managing care more efficiently and effectively is crucial for tackling this challenge. As such, more sophisticated systems for analysing the financial aspects of hospital activity are essential.
Until recently reference costs have been the major NHS costing tool. Since 1998 the DH has collected and published unit cost information, known as reference costs. Reference costs are designed for central control purposes, with the main objective of calculating a national tariff. It is substantially an annual exercise of collecting data at the level of the trust. Reference costing is based on a top-down cost calculation method. To make cost information more credible and help organisations understand their business/organisation better and to better inform national cost collection and PbR tariff setting, the Department of Health (DH) now recommends Patient-Level Information and Costing System (PLICS).
1 This report is part of an on-going research project on managing in NHS acute trusts. The report was primarily funded by the Chartered Institute of Management Accountants (CIMA), Grant Ref. R 226, in collaboration with the Health and Care Infrastructure Research and Innovation Centre (HaCIRIC) at Imperial College, London. In this context we carried out case studies in selected trusts and held five discussion forums with invited experts.
Costing in the National Health Service: from reporting to managing | 2
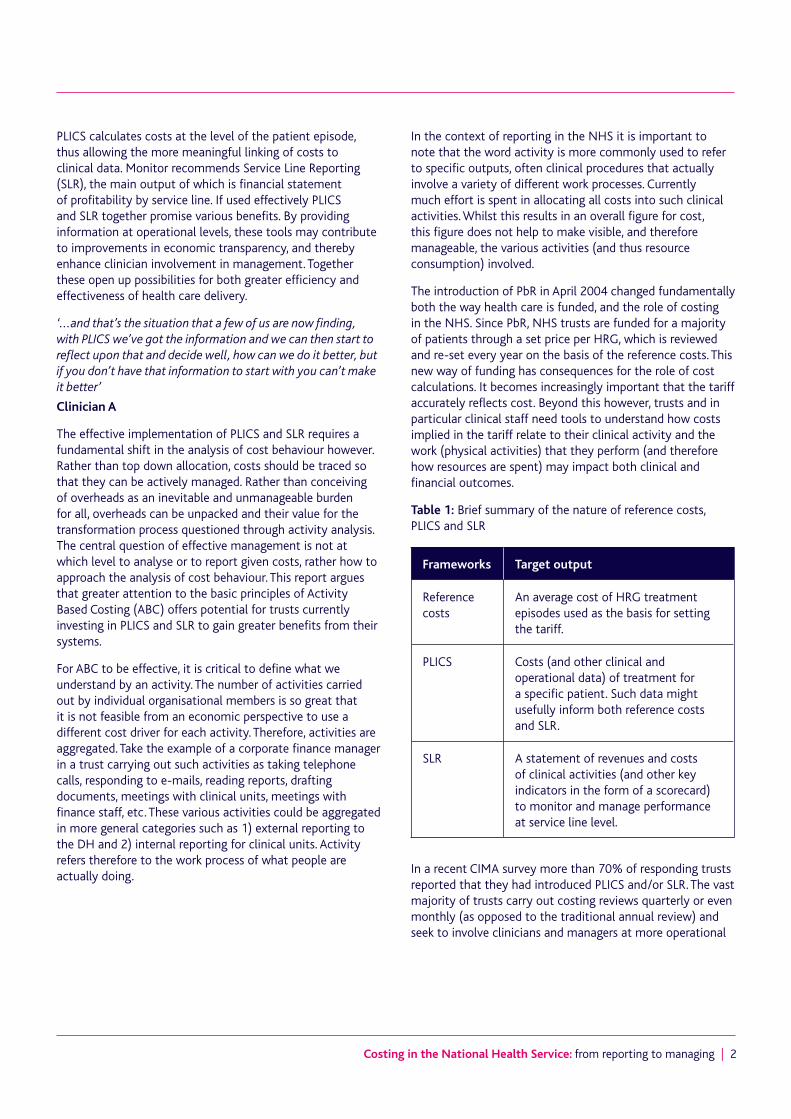
PLICS calculates costs at the level of the patient episode, thus allowing the more meaningful linking of costs to clinical data. Monitor recommends Service Line Reporting (SLR), the main output of which is financial statement of profitability by service line. If used effectively PLICS and SLR together promise various benefits. By providing information at operational levels, these tools may contribute to improvements in economic transparency, and thereby enhance clinician involvement in management. Together these open up possibilities for both greater efficiency and effectiveness of health care delivery.
‘...and that’s the situation that a few of us are now finding, with PLICS we’ve got the information and we can then start to reflect upon that and decide well, how can we do it better, but if you don’t have that information to start with you can’t make it better’
Clinician A
The effective implementation of PLICS and SLR requires a fundamental shift in the analysis of cost behaviour however. Rather than top down allocation, costs should be traced so that they can be actively managed. Rather than conceiving of overheads as an inevitable and unmanageable burden for all, overheads can be unpacked and their value for the transformation process questioned through activity analysis. The central question of effective management is not at which level to analyse or to report given costs, rather how to approach the analysis of cost behaviour. This report argues that greater attention to the basic principles of Activity Based Costing (ABC) offers potential for trusts currently investing in PLICS and SLR to gain greater benefits from their systems.
For ABC to be effective, it is critical to define what we understand by an activity. The number of activities carried out by individual organisational members is so great that it is not feasible from an economic perspective to use a different cost driver for each activity. Therefore, activities are aggregated. Take the example of a corporate finance manager in a trust carrying out such activities as taking telephone calls, responding to e-mails, reading reports, drafting documents, meetings with clinical units, meetings with finance staff, etc. These various activities could be aggregated in more general categories such as 1) external reporting to the DH and 2) internal reporting for clinical units. Activity refers therefore to the work process of what people are actually doing.
In the context of reporting in the NHS it is important to note that the word activity is more commonly used to refer to specific outputs, often clinical procedures that actually involve a variety of different work processes. Currently much effort is spent in allocating all costs into such clinical activities. Whilst this results in an overall figure for cost, this figure does not help to make visible, and therefore manageable, the various activities (and thus resource consumption) involved.
The introduction of PbR in April 2004 changed fundamentally both the way health care is funded, and the role of costing in the NHS. Since PbR, NHS trusts are funded for a majority of patients through a set price per HRG, which is reviewed and re-set every year on the basis of the reference costs. This new way of funding has consequences for the role of cost calculations. It becomes increasingly important that the tariff accurately reflects cost. Beyond this however, trusts and in particular clinical staff need tools to understand how costs implied in the tariff relate to their clinical activity and the work (physical activities) that they perform (and therefore how resources are spent) may impact both clinical and financial outcomes.
Table 1: Brief summary of the nature of reference costs, PLICS and SLR
Frameworks Target output
Reference costs
An average cost of HRG treatment episodes used as the basis for setting the tariff.
PLICS Costs (and other clinical and operational data) of treatment for a specific patient. Such data might usefully inform both reference costs and SLR.
SLR A statement of revenues and costs of clinical activities (and other key indicators in the form of a scorecard) to monitor and manage performance at service line level.
In a recent CIMA survey more than 70% of responding trusts reported that they had introduced PLICS and/or SLR. The vast majority of trusts carry out costing reviews quarterly or even monthly (as opposed to the traditional annual review) and seek to involve clinicians and managers at more operational

3 | Costing in the National Health Service: from reporting to managing
levels. This engagement is essential if PLICS and SLR are to do more than just reassure stakeholders or regulators that systems are in place. Assuring the effectiveness of PLICS and SLR does not come from ticking a box that cost data is reported, but rather that cost data constructively informs clinical decision making: taking the step from reporting to managing2.
The form of cost analysis underlying past costing tools potentially interferes with this objective of using cost information for management. Hospital costing has been a major concern for the government since the creation of the NHS in 1948 (MoH, 1948). Departmental costing, specialty costing, management budgets, resource management, HRG and PbR are some of the hospital accounting innovations which were implemented over the decades. The design of these costing tools was mostly driven by central control purposes.
An important factor in the limited engagement of clinicians with these tools is the underlying approach to the analysis of cost behaviour: the allocation of overheads and indirect costs onto clinical units or activities. Traditional costing models start from the general ledger and allocate overheads across a growing number of HRGs. The calculations are so complicated and unclearly linked to clinically relevant categories, that clinicians cannot gain an understanding of the cause and effect relationships between their decisions, resource consumption, and clinical results. The output is not information that can be easily used by front line staff to improve performance and drive value for money. This approach to the analysis of cost behaviour may point out problems, such as costs of a certain HRG being above reference costs, but does not provide any guidance on how to fix the problem.
This form of analysis of cost behaviour potentially influences how PLICS and SLR are developed and currently used. Complex allocation models for overheads and indirect costs are in many cases still the underlying method of producing PLICS and SLR data. Higher granularity of data is achieved (patient or service line level), requiring more resources to produce. If the top-down approach is still adopted there is little advancement in making data more transparent and usable. As clinicians cannot easily relate this cost data to their physical activities, the drawing of operational conclusions is greatly impaired. Therefore, the danger exists that PLICS and SLR are reduced to an expensive exercise in producing and reporting numbers, with little influence in clinical decision making.
In our view the key question is not about granularity and level of analysis, but rather the approach (see table 2). A
more detailed level of analysis (e.g. service line or patient level) is not the driver for efficiency and effectiveness in itself. Rather, what is needed is an ABC approach to costs that does not regard overheads or costs in general as inevitable. Instead costs and their contribution to health care are questioned through activity analysis and potentially transformed in direct costs.
Activity analysis is designed to establish meaningful relationships between consumed resources and activity. Costs previously classified as overheads may be translated into direct costs out of general ledger categories. In this way they are not allocated, but traced. If the logic of tracing a fixed cashflow cost (say clinician time to patients through minutes spent) is accepted, then in principle the logic of tracing other fixed cash flow costs is equally possible given the right cost pool structures and cost drivers. ABC further suggests removing fluctuations in reported cost due to changes in activity levels through the use of capacity cost drivers and the separate reporting of unused capacity. If an ABC approach is lacking, PLICS or SLR/SLM will add little value to cost management in comparison to the long established indicators at clinical level ‘length of stay’ or ‘cost of drugs’.
Table 2: Summary of differences in approach to analysing cost behaviour
Approach Summary
Top-down full cost
Costs are tagged as direct, indirect, overhead (per DH guidelines). A complex top-down process cascades allocated overhead until the full cost is collected at the level of HRGs. Danger that overheads are regarded as fixed or inevitable. Their burden must simply be shared, since overheads are, by definition, not logically transparent in their behaviour.
Activity Based Costing (ABC)
Costs pools are translated from general ledger categories to a structure reflecting different activities making costs transparent and manageable (viewed as more important than an attempt to produce a notional ‘full’ cost). This offers greater potential to evaluate effectiveness and efficiency in terms of their value contribution to the overall ‘business process’, patient care. Can be more expensive, so judgement is necessary as to how far to take this.
2 Hence the increasing emphasis on Service Line Management (SLM)

Costing in the National Health Service: from reporting to managing | 4
From reporting to managing
Even though there have been major improvements in the data quality of costs and tariffs, many clinicians do not recognise these improvements:
‘I think that’s been one of the big problems in the NHS: we haven’t had the information, we’ve got no idea what anything costs.’
Clinician B
‘We’ve been doing costing for 15 years, I don’t know, whenever, when we first started looking at it, at what things cost, and here we still are sitting saying, “Actually, nobody knows what things cost, there’s a tariff that nobody agrees with”, you’d think that over all those years they could have got it a bit nearer to being right.’
Clinician C
This perceived lack of improvement in the quality of cost information is linked to the prevailing approach to the analysis of cost behavior. Allocating the bulk of overheads and indirect costs in a top–down manner onto different clinical outputs may satisfy the objective of producing a tariff, but it is not satisfactory for informing clinical decision making.
If costing systems are implemented following a top-down methodology of allocating costs, the resulting cost information gives clinicians little added value in comparison to traditional indicators such as length of stay. In considering fully absorbed ward costs the only aspect of operations clinicians may understandably control is volume. The detailed analysis of overhead spending in relation to their activities and choices remains beyond their reach and understanding. Given this, a precise figure of overheads offers them no further benefits over a general understanding that reducing length of stay is beneficial (spreading the overhead more thinly across more patients). In the following a clinician is questioned on his future use of PLICS:
‘No because I think length of stay indirectly tells you what you want to know. PLICS exists as a financial package but the way the cost base has been built up, it’s not sufficiently accurate to give data that I would say is wholly reliable at the moment. [PLICS] is superficial, generalised, lacking real sensitivity and we could do so much better.’
Clinician D
The danger then is that PLICS and SLR are not used for managing, but only for box ticking to reassure external regulators and other stakeholders:
‘Yeah, … and Service Line Reporting we’re doing quarterly, but it does go out because it’s an important box to tick for [the regulator] , […] , but other than a few people spotting that they’ve got an overhead it hasn’t really changed anything.’
Senior manager A – with responsibility for PLICS
In the interviews and the discussion forums there was a consensus that the development of PLICS guidance and standards initiated by the DH were a foundation for a new approach to cost management in the NHS.
‘I mean, we’ve got this PLICS guidance, costing guidance, which these guys have been involved in, and that’s a really good start and that’s the kind of stuff you need to build on.’
Senior manager B – with responsibility for PLICS
But while the guidelines played a major role in initiating and supporting the implementation of PLICS, they now have to be developed and refined. A central area for more detailed discussion is the treatment of overheads and indirect costs. In particular a more detailed explanation of an ABC approach and the importance of building up cost data around actual physical activities i.e. work that people do (and not simply outputs, or departments) can make a wider range of costs amenable to management. This emphasis on physical activity as the appropriate focus for cost analysis should be far more clearly explained in such guidance, if the hoped for benefits of investments in new costing systems are to be achieved.
In this context it is important to define more clearly in the guidelines what is understood by an activity in an ABC sense. Otherwise there is a danger that even for things like clinician costs, which should in principle be direct costs, simple design errors (such as grouping clinicians with very different patterns of activity) mean that the costing system may still systematically misrepresent them even with an appropriate cost driver. In the next two sections we discuss how a change in the analysis of cost behaviour produces cost data, which is useful for operational management, in particularly in regards to clinical decision making.
The case of the operating theatre (from department to activities)
By analysing the different cost calculation models for the operating theatre used by various NHS trusts we can show how these differences influence the degree to which cost data is useful for management. Many trusts included in this research started with a simple cost calculation model, consisting of a single cost pool that assembled all costs assigned to the operating theatres. The cost driver is then minutes spent in theatre. To calculate costs per patient, the

5 | Costing in the National Health Service: from reporting to managing
total costs are then divided by the total theatre minutes. This results in a cost per minute. Based on the operating register, recording the time each patient spent in the operating theatre, the costs per specific patient can be calculated.
Figure 1: Very simple model
Even though this model allows the calculation of costs at the patient level, it gives only a very approximate cost for any individual patient. The main problem is the very loose cause effect relationship between clinical activity and their costs. The operating theatre is conceived as an administrative unit to which a certain amount of costs are assigned. These costs are then treated as overhead costs and are allocated rather than more logically traced onto the patient episode. Whilst minutes do influence costs, they are not the only relevant factor. Another significant driver is the number of staff carrying out the surgery. Thus while the number of surgical staff may vary greatly between different procedures in practice, the use of such a simple model results in the application of the same cost per minute.
In one trust that we studied, this simple model was refined to distinguish between different specialties, for example cardiac surgery, orthopedic surgery or plastic surgery. Costs for staff working within different specialties are captured in specialty based cost centres. Specialty based operating theatres easily allow for identifying other running costs per specialty. This cost calculation model therefore developed a cost pool for
each specialty. The activity drivers are still the minutes spent in each theatre. The results however show the different cost per minute across the different specialties.
This more refined cost calculation model produces cost data useful for management if the resources spent within a specialty do not vary from one procedure to another, for example the number of staff carrying out all cardiac surgery. But for many specialties, the resources spent in carrying out surgery may vary greatly, particularly in regards to number of staff. As a result, both the simple and intermediate cost models share the same problem in that costs are linked with a unit rather than actual activities. This does not allow for the establishment of meaningful links between physical activity and resources consumed. If the bulk of clinical costs are treated as overhead cost and are allocated onto the patient episode on the basis of the same costs per minute for each speciality, the model cannot take into account the variety of resources spent. It effectively applies the same average cost per minute to a procedure, regardless of whether it involved five clinicians or one. It does not recognise that some costs are not driven by time but by, for example, the number of operations performed.
Learning from cost data requires a clear signal that certain actions results in specific cost outcomes. The logic for direct costs is clear. If less time is spent with a patient then reported cost goes down. This saving must of course be considered in relation to treatment quality (which is why PLICS combines clinical and cost data). When it comes to overheads however the above cost calculation models do not produce reliably clear feedback. In such systems, overhead costs, which by definition do not relate to patient volume, are being treated as though they did. Whilst the clinician may spend less time per patient and consequently see more patients, because they receive overheads from a general pool whose allocation base sits across multiple clinicians and procedures, the quantum of overhead that they receive per
Costs/per theatre minute
Cost driver: total numberof theatre minutes
Cost pool with allcosts for all theatres
Costs/per orthopedicsurgery minute
Cost driver: totalnumber of orthopedicsurgery minutes
Cost driver: totalnumber of cardiacsurgery minutes
Cost driver: totalnumber of eyesurgery minutes
Cost pool orthopedicsurgery
Costs/per cardiacsurgery minute
Cost pool cardiacsurgery
Costs/per eye surgery minute
Cost pool eyesurgery
Figure 2: Intermediate model

Costing in the National Health Service: from reporting to managing | 6
patient may in fact rise. Overheads can thus be regarded as unsuitable for operational control since the feedback they give is noisy at best.
A second trust that we studied refined their cost calculation model to deal with this problem by engaging in activity analysis and cost tracing. In the first step, the trust identified the different activities that are carried out in the operating theatre. Secondly, the trust calculated costs for the different activities. This was done by establishing meaningful relationships between costs and activity. Instead of allocating costs onto just clinical activity, cause-effect relationships between resources consumed and physical activities were established. The relevant unit of analysis for such activities in the operating theatre is the surgery session. A session is the number of hours booked in theatre by a surgeon, for example, a four hour block.
The system captures the elements that the drive costs of a session. Through activity analysis the following activities and cost drivers were identified for a surgery session:
• preparing the operating theatre before theatre use
• performing anesthesia (anesthetic staff and anesthetic drugs)
• performing the surgery (staff)
• consumable items during surgery
• recovery of the patient
• cleaning up after theatre use
• overheads: management administration, training, catering and others.
Moving from the operating theatre as a department, in this model the operating theatre is seen as the site of a variety of physical activities. Once these are identified, the next step in the ABC methodology is to understand what drives the cost incurred in carrying out these activities. In approaching this
task it is important to always apply the principles of cost/benefit analysis in terms of how much detail and realism to aim for. The question to ask is – does the effort to transform a particular block of overheads into direct costs through an analysis of activity pay back in terms of decision making benefits obtained from such efforts?
In the trust that we studied, the analysis of cost drivers, and the tradeoffs between detail and managerial usefulness are summarised in table 3. Clearly there are many simplifying assumptions, and in each case the simplifying assumptions reflect both the cost of capturing more precise data, as well as the potentially limited learning that might arise from doing so.
The following refinements were taken into account as the model was further developed:
• if surgery takes place within normal working hours or out of hours – at weekends, evenings
• a charge for early starts and over runs
• an availability charge for the priority tables out of hours.
Table 3, on page 7 (overleaf), shows how for each activity a relationship between the activity and the consumed resources is established following the cost/benefit principle. In some cases this leads to charging a standard rate, e.g. for preparing the theatre. In other cases the consumed resources are related to an activity on the basis of a cost driver, such as time. Anaesthetic drugs, for example are charged on the basis of the length of time the patient is anaesthetised. The data of the time anaesthetised is available in the system and can be retrieved easily. Costs for nurses take into account the number of nurses present, which can also be captured in the system. However as it is too costly to include the actual staff cost for each nurse, a charge rate is applied for each nurse. For senior clinicians the actual staff cost is assigned to the session, while for juniors it is again a charged rate.
Different cost drivers for each activity
Cost of activity one Cost of activity two Cost of activity n
Patient cost = Activity1*Driver1 + Activity2*Driver2 + ... + An*Dn
Figure 3: An example of a more complex cost equation

7 | Costing in the National Health Service: from reporting to managing
A strong advantage of the data produced by the model in figure 3 is that it draws from activities that are clinically relevant.
‘I think the advantage of [PLICS] is that we drill down from the surface, down to the patient, and you can show the costs, my costs saying “This patient, [Name], was in for this period of time, was in theatre five for three and a half hours, he had these pathology tests, he started off from [X] Ward and he ended in [Y] Ward”, and the clinician goes “Yeah, I believe that, that’s what happened”, and then you move the discussion
away from “I don’t believe the numbers” to “What are we going to do about the numbers?”..’
Senior manager C – With responsibility for PLICS
Providing such information invites clinicians to engage in both personal and collective reflection on the efficiency and effectiveness of their activity. PLICS following an ABC approach produces the evidence base for comparisons between clinical practices and can become a tool for informing health care practice, the redesign of practice and the definition of patient pathways.
Table 3: Summary of activities and cost drivers
Activity Appropriate cost driver
Preparing the operating theatre before theatre use
A standard charge is applied. This assumes that the length of time of preparing the theatre does not vary greatly between patients or procedures.
Activity of anesthetic nurse A standard charge for providing anaesthetics is applied for anesthetic nurse, distinguishing whether it is a general or local anesthetic. This assumes that the staff costs of performing general or local anesthetics do not vary greatly between patients.
Activity of anesthetic physician
A standard charge for providing anaesthetics is applied for anesthetic physician, distinguishing whether it is a general or local anesthetic. This assumes that the staff costs of performing general or local anaesthetics do not vary greatly between patients.
Anaesthetic drugs Charge for anaesthetic drugs based on a weighting of the length of time the patient is anaesthetised. The time taken into account is from entering the anaesthetic room until entering the recovery room. This assumes that consumption of these drugs is well correlated with time.
Activity of the nurse for performing the surgery
Costs for the surgical nurse are charged on the basis of the session schedule. The time taken into account is the knife to skin until closure. The model charges a rate according to the number of staff present. It does not take into account actual staff costs (e.g. differentiate between agency and full time staff on the day).
Activity of the physician for performing the surgery
Costs for clinicians are charged according to the clinician planning schedule of programmed activities. The time taken into account is knife to skin until closure. The system takes into account actual staff cost for seniors with a standard rate for juniors.
Consumable items during surgery
Currently this is done on the basis of itemised lists of consumables by procedure. This system will be replaced in the near future by a new bar coding device capturing the actual consumption of consumables for each patient.
Cleaning up after theatre use A standard charge is applied. This assumes that the material used and the length of time of cleaning up the theatre does not vary greatly between patients or procedures.
Recovery of the patient An average charge for recovery for each patient. This does not take into account patient dependency and length of time in recovery. A different charge is applied to those patients entering overnight intensive recovery.
Overhead activity A charge is applied for management administration, training, catering and others on the basis of the charged time.

Costing in the National Health Service: from reporting to managing | 8
‘I think you could use [PLICS] as a catalyst for national comparisons, to encourage people to change practice. If they can see examples of good practice elsewhere. That’s always been part of medicine, you know, when I was a lad as a junior surgeon a long time ago, people used to be kept in ten days after a hernia operation, now it’s a day care, is the example that’s always quoted. So I mean I’m sure there are things we can do…’
Clinician E
The purpose of ABC is to produce usable data, and an important aspect that supports usability is the separate consideration of the cost of capacity. In the simple system mentioned, various costs are traced to patients according to the number of minutes actually spent carrying out physical activities with them. The cost per minute traces this to the total minutes actually used. This means that in a session where the full four hours are used, cost per minute will be lower, than in a session where only two hours are actually used for physical activities. This correctly gets across the intuition that it is costly to not use the full session. However the higher cost message needs unpacking to understand that it is utilisation and not cost of resources (e.g. more costly clinical staff) that have caused the cost rise.
Calculating a cost of unused capacity separately has two effects that improve the usability of the data. Firstly it cuts out fluctuations in cost per minute of physical activity that is caused by changing capacity usage. Secondly, by reporting unused capacity separately, it raises the issue for discussion. The implications of unused capacity may vary. In some cases, it may be deemed clinically necessary, and therefore must be taken into the baseline consideration of resources required for certain procedures. In other cases, it may be that rearrangements to the location or scheduling of procedures may offer more efficient ways to work. An extension of the capacity analysis would be not only to perform such an analysis for the operating theatre as a whole, but per physical activity. This would give a much more refined understanding of how capacity is used at operational levels.
Managing costs is not a problem of having a perfectly designed system. In fact there is no perfect system that can apprehend all the complexity involved in clinical decision making. The cost of attempting such a system would significantly outweigh the decision benefits it might yield. The point of a system such as PLICS based on ABC is that it provides clear signals of issues to discuss as well as providing relevant information to inform decisions as to how to undertake activity. Such questions may be considered in other forums, however if investments are to be made in PLICS it seems that enabling it to support such a role would be prudent.
The case of the accounting and finance function – from department to activity
Changing the approach to the analysis of cost behaviour is not only key for managing clinical activities, but also for managing the activities of the central administration. If costs currently labelled as overheads are accepted as inevitable then there is a risk that they are forgotten and excluded from performance analysis. ABC, by questioning the notion of overheads or indirect costs, seeks to make a greater range of cost amenable to direct management. The danger of top-down models is that overheads cannot be easily understood, nor their benefits effectively considered. If this is the case, then the danger is that they may rise for the wrong reasons.
None of the financial managers taking part in this research routinely reviewed information about the percentage of overheads as a component of overall costs, nor the trend (of growth, or decline) in recent years. ABC advocates that overheads are not a fact of nature, but a fact of cost pool structure. Overheads can be transformed into direct costs through activity analysis. In the case of the finance department, costs in the overhead cost block are typically shared out among clinical specialities. Having such costs imposed on them does not enable clinicians to think about this activity in relation to what they are doing, nor appreciate the benefits such overheads might offer in supporting them. While some of the activities in a finance department may indeed concern all specialities equally, there are various activities which are directly related to certain HRGs. One example is the preparation of cost analysis for negotiations with Primary Care Trusts (PCTs), for example.
‘For our patients on the costing system, we were able to demonstrate that we were bringing in women to have a mastectomy, and then some months later they’d come back and have a reconstruction under the tariff, and get paid £6,000 for that procedure . Our general surgeons and plastic surgeons wanted to work together in the theatre and do it all in one day […] and you only get paid once under the tariff, so it costs you £12,000 but you only get £6.000, but because of PLICS we could demonstrate that to the PCT, and they’ve agreed to take it out of tariff and pay us separately for it.’
Management accountant A

9 | Costing in the National Health Service: from reporting to managing
An activity analysis may allow not only more transparent and logical tracing of overhead costs, but also support thinking around the redesign of the overall activity flow. For example activity analysis may reveal redundant or overlapped activities between central and operational units. In such cases, the staff of central and clinical units may reflect jointly on how to improve the flow of information at critical interfaces.
One such interface that was frequently highlighted in our research was between clinicians, coders, managers and PCTs. A monthly reporting cycle can contribute to a more efficient flow of activities at this interface.
‘The tariff that’s charged is provisional for the first […] is it 30 days? And then the other 30 days, that’s it, you can’t change it, in other words, if you can go back to the PCT, the commissioners, within that period and say ‘actually no, we’ve made a mistake on this coding here, it wasn’t this, it was that, we now want more money’ then they’re obliged to pay it. If you go past that 30 days, then there is an obligation, so if what this is doing is giving you greater insights into accuracy, you’ve got coding and so on, and it does. So sometimes it just completely makes out that you’re making losses because you’ve cocked up the coding, then you can go back to the PCT and ask for the right amount. So if you’re doing it [PLICS] on a quarterly basis, then you can only do it for a very limited period.’
Management accountant B
Another critical interface emerging in the discussion forums was between PLICS and SLR and other financial management processes. Participants pointed out that there is often little or no connection between PLICS and SLR on the one hand and management reporting or budgetary processes on the other. Potential conflicts between these may then become a potential source of inefficiency and ineffectiveness.
‘ I’m interested in PLICS and I’m interested in providing those outputs, but it seems intuitively to me, instinctively, it seems if we’re going to all this bother with PLICS and producing these outputs and the robustness and we’ve had our systems set up with people lined up, then why don’t we do our planning from that?…Why don’t we do our planning and align it? …one of the by-products […] of PLICS output would be to service the planning of it and all the decisions that go along with that. … So at the moment most organisations, they’re totally divorced really, […]. In our organisation all the divisional structure is totally tied into the budget, the budget, the budget, the budget, operation, the divisional manager, the finance manager, clinical finance managers. Lately we’ve started to look at service line reporting, but they don’t really get it and it’s like, you know, as someone was saying earlier on, why
aren’t people looking at service line reports, why not? One of the reasons, possibly, is we need to line it up, we need to do our planning from PLICS.”
Senior manager D – with responsibility for PLICS
A further critical interface for the finance department is the link between external and internal reporting tools. Managers in the finance department argued that the dominating role of external reporting, the ledger, interferes with using PLICS and SLR for management purposes. With the main objective of external reporting being to produce numbers for external evaluation, the philosophy of using such numbers for internal management is unclear. The dominating role of external reporting reflects the staffing of many finance departments however.
To explore this issue in more detail we carried out a small survey with the Network of Foundation Trusts. Eight questions about the staff resources spent on PLICS and/or SLR and the staffing of the finance function were sent to all member trusts. 27 responded, of which all had implemented or were implementing PLICS and/or SLR. Across the responding trusts there was an average of less than 1.5 full-time equivalents (FTE) working on PLICS and/or SLR per trust out of an average of 55 FTE working in the overall accounting and finance department. Even in the largest trusts with more than 100 FTE working in accounting and finance the average number of FTE working on PLICS and/or SLR was two.
Given the potential significance of PLICS data, this suggests that relatively few resources are spent on linking numbers with clinical activities to actually manage activities. Hence far more detailed activity analysis of the finance function (for example) is not a peripheral issue to the management of NHS trusts. The organisation of the finance function plays an essential role in shaping the effectiveness of wider clinical and operational management. Again, following from ABC, the overheads of the finance function (and by extension other forms of overhead) must be open to question and discussion to help ensure that overall resources are spent effectively and efficiently to support patient care.
Conclusion
Our research questions the dominant approach to the analysis of cost currently found in the NHS that assumes many costs are inevitable. The emphasis on cost recovery that began with the tariff, no longer serves the NHS well in an era that increasingly emphasises the need for efficiency and effectiveness. ABC was the inspiration for PLICS, and so in approaching PLICS and SLR we argue for greater attention

Costing in the National Health Service: from reporting to managing | 10
to unpacking and discussing currently opaque cost structures. The vocabulary of cost analysis used in the NHS – dividing costs in overheads, indirect and direct costs – contributes little to the effective management of cost, activities and treatments. Rather than following a logical definition of cost, based on cost behaviour, overheads are most frequently explained with reference to their likely organisational/departmental source. Typical examples emphasise that they are something far away from the patient, contributing to a notion of their unmanageability. Closer to the patient, direct costs are also frequently defined by location and not behaviour. Here again the danger is that cost manageability may suffer. Given that the NHS must make major cost savings in coming years, this report argues that ABC analysis of cost behaviour is a tool that offers many attractions, outweighing the cost of undertaking it.
The transparency generated through activity analysis stems not from allocating costs more accurately, but from questioning the value of activities for the core transformation processes of the organisation. An activity analysis starts by identifying and mapping out activities.
Identifying activities and recognising how they are linked with patient care is an important step to transparency and an evidence based approach. Such an analysis often reveals inefficiencies in terms of quality, time and cost which can then be the basis for the redesign of activities in order to create a more effective and efficient activity flow, ultimately improving patient care.
In contrast to traditional costing approaches which can be largely produced (and consumed) in the central accounting and finance department, ABC relies on the participation of all those involved in the transformation processes. This information is more relevant for others since its fundamental unit of analysis is actual activity (as opposed to abstract constructions of the general ledger, or HRG, for example). Only if costing is significant to all those involved in the transformation processes might there be a shift in emphasis from reporting cost to managing performance. Informed by the principles of ABC PLICS and SLR offer great potential to position clinicians where they belong, as the essential custodians of the delivery of efficient and effective patient care.
Acknowledgements
The research was financially supported by HaCIRIC. We thank the following contributors for their time, the use of data, information, case study material or feedback, guidance and support: participants of five discussion forums on ABC, PLICS and SLR including senior PLICS managers, management accountants,finance managers, clinicians and software suppliers; clinicians and managers who were object of the case studies; The Network of Foundation Trusts; those who commented the draft and three anonymous reviewers.
References
CIMA, 2009, A picture of health – Service cost data in performance management in the NHS, October 2009.
Department of Health, 2009/10, NHS Costing Manual: Gateway reference: 13659.
Department of Health, 2009/10, Acute Health Clinical Costing Standards: http://webarchive.nationalarchives.gov.uk/+/www.dh.gov.uk/en/Managingyourorganisation/Financeandplanning/NHScostingmanual/DH_080056
Ministry of Health, 1948, Statutory Instrument 1414. London: HMSO.
Glossary
ABC Activity Based Costing NHS National Health ServiceCIMA Chartered Institute of Management Accountants PbR Payment By ResultsDH Department of Health PLICS Patient-Level Information and Costing SystemHRG Healthcare Resource Groups SLR Service Line ReportingMoH Ministry of Health HaCIRIC Health and Care Infrastructure Research and
Innovation Centre

ISBN 978-1-85971-670-0 (PDF) Chartered Institute of Management Accountants26 Chapter Street London SW1P 4NP United Kingdom T. +44 (0)20 8849 2285 E. [email protected]
© July 2010, Chartered Institute of Management Accountants