Embed Size (px)
Citation preview

COST OF PRODUCTION AND MARKET OPPORTUNITY FOR VETIVER GRASS
Prepared for O’ahu Resource Conservation & Development
99-193 Aiea Heights Drive Aiea, HI 96701
by the
Agribusiness Incubator Program University of Hawaii
June 26, 2009

COST OF PRODUCTION AND MARKET OPPORTUNITY FOR VETIVER GRASS
i
Executive Summary Vetiver has proven itself as a very cost‐effective method to reduce soil erosion and stabilize
steep slopes. The USDA Natural Resources Conservation Service has included the planting of
vetiver grass as a best management practice (BMP) for Hawaii farms and is recommending
usage within conservation plans.
Small amounts of ‘Sunshine’ vetiver (Chrysopogon
zizanioides) have been available from the USDA Hoolehua
Plant Materials Center (PMC) on Molokai, for testing and
grower increase, and the Hawaii Agriculture Research
Center (HARC) Kunia Substation. The PMC, however, has
completed its task of testing this species and has plans to
reduce production of vetiver. Limited supplies available from the PMC and HARC can no longer
meet the growing demand and there is currently only one known established commercial
vetiver supplier.
The purpose of this report is to analyze the cost of vetiver production and market opportunities
for the island of O’ahu.
Cost of Production
The estimated cost to grow vetiver reveals the following:
• Total cost will equate to $0.53 per slip.
• If charging $1.00 per slip, expected profit per slip is $0.47. Annual operating profit for a
1/2 acre production will total $51,426.
The estimated cost to install vetiver reveals the following:
The cost to install 200 linear feet of vetiver is $1,840.
o This equates to $9.20 per linear foot.
The cost to install 1,000 linear feet of vetiver is $6,432.
o This equates to $6.43 per linear foot.
The cost to install 2,000 linear feet of vetiver is $11,235.
o This equates to $5.62 per linear foot.
The cost to install 4,000 linear feet of vetiver is $22,072.

COST OF PRODUCTION AND MARKET OPPORTUNITY FOR VETIVER GRASS
ii
o This equates to $5.52 per linear foot.
A reduction in the per day equipment charge significantly reduced the per linear foot cost when
comparing a 200 foot installation and a 1,000 foot installation.
Market Opportunities
To determine the demand of vetiver on O’ahu over the next 5 years, 3 markets were analyzed:
Government, Large Private Landowners, and Farms. The aggregate demand and financial
estimates from the three markets is estimated as follows:
Year Slips Revenue
(at $1 per slip) Profit
1 442,110 $ 442,110 $ 207,792
2 1,198,932 $ 1,198,932 $ 563,498
3 1,961,111 $ 1,961,111 $ 921,722
4 2,567,178 $ 2,567,178 $ 1,206,574
5 2,717,624 $ 2,717,624 $ 1,277,284
Total 8,886,955 $ 8,886,955 $ 4,176,869
The demand and revenue/profit potential for installation services varies among the 3 analyzed
markets and the total is estimated as follows:
Year Feet Revenue Profit
1 49,616 591,268 295,634
2 203,927 2,314,415 1,157,208
3 360,248 4,061,415 2,030,707
4 477,954 5,371,766 2,685,883
5 498,841 5,613,234 2,806,617
Total 1,590,587 $ 17,952,098 $ 8,976,049
Conclusion
As vetiver increases its reputation as an
effective method to reduce soil erosion and
stabilize steep slopes, the demand for the
plant and installation services will continue
to increase. Based on the analysis of the
cost and market opportunity, vetiver can be
a profitable crop for growers.

COST OF PRODUCTION AND MARKET OPPORTUNITY FOR VETIVER GRASS
iii
Contents
Executive Summary ...........................................................................................................................i
Introduction......................................................................................................................................1
Background and Objective ...........................................................................................................1
Vetiver Grass ................................................................................................................................2
Use as a Vegetative Barrier for Erosion Control...................................................................... 2
Alternatives to Vetiver Grass for Soil Erosion ......................................................................... 3
Advantages of Using Vetiver for Erosion Control.................................................................... 3
Disadvantages of Using Vetiver for Erosion Control ............................................................... 3
Project Research Approach ..........................................................................................................4
Approach to Findings....................................................................................................................4
Cost of Production Estimate for Growing Vetiver ............................................................................5
Growing Vetiver for Commercial Production ...............................................................................5
Crop Plot Plan ...............................................................................................................................8
Financial Analysis..........................................................................................................................9
Assumptions .................................................................................................................................9
Cost of Production for Installation .................................................................................................11
Installing Vetiver for Soil Erosion Mitigation..............................................................................11
Financial Analysis........................................................................................................................11
Assumptions ...................................................................................................................................11
Market Analysis – Sale of Vetiver Plants ........................................................................................13
Definition of Markets .................................................................................................................13
Market Research ........................................................................................................................13
Marketing Survey Questions ................................................................................................. 14
Market Size and Demand ...........................................................................................................14
Government .......................................................................................................................... 17
Large Private Landowners ..................................................................................................... 19
Farms ..................................................................................................................................... 20
Total Market Potential ...............................................................................................................22
Competition................................................................................................................................24
Market Analysis – Installation of Vetiver Plants.............................................................................25

COST OF PRODUCTION AND MARKET OPPORTUNITY FOR VETIVER GRASS
iv
Definition of Markets .................................................................................................................25
Market Research ........................................................................................................................25
Market Size and Demand ...........................................................................................................25
Government .......................................................................................................................... 26
Large Private Landowners ..................................................................................................... 27
Farms ..................................................................................................................................... 28
Total Market Potential ...............................................................................................................29
Competition................................................................................................................................30
Pricing Analysis – Sale of Vetiver Plants .........................................................................................31
Pricing Analysis – Installation of Vetiver Plants..............................................................................32
Appendix.........................................................................................................................................33
Cost of Production Estimate – Analysis for Growing Vetiver .....................................................33
Direct Costs – First Year of Operation ................................................................................... 33
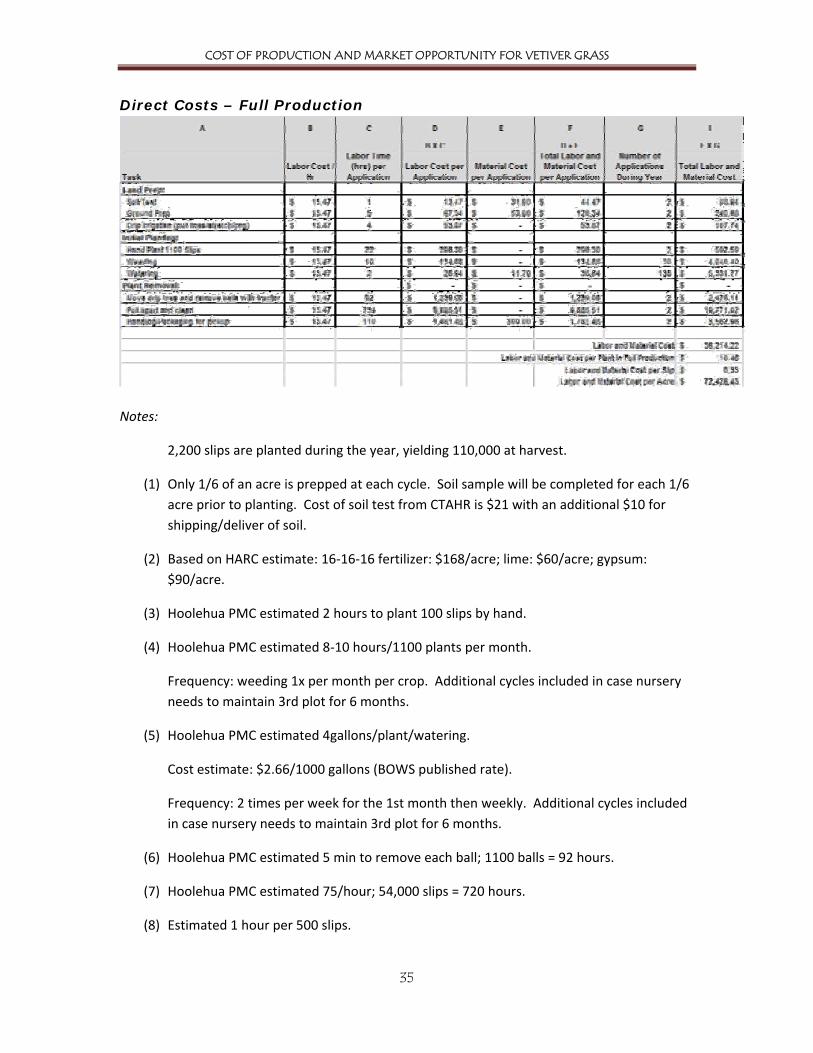
Direct Costs – Full Production ............................................................................................... 35
Indirect Costs......................................................................................................................... 36
Unit Sales Analysis ................................................................................................................. 37
Cost‐Volume‐Profit Analysis.................................................................................................. 37
Cost of Service – Analysis for Installing Vetiver..........................................................................38
Installing 200 Linear Feet of Vetiver...................................................................................... 38
Installing 1,000 Linear Feet of Vetiver................................................................................... 39
Installing 2,000 Linear Feet of Vetiver................................................................................... 40
Installing 4,000 Linear Feet of Vetiver................................................................................... 41
Solicitation Letter .......................................................................................................................42
Solicitation Letter .......................................................................................................................42
Revised Universal Soil Loss Equation (RUSLE) K Factor ..............................................................43
Market Calculations....................................................................................................................44
Government Demand............................................................................................................ 44
Large Private Landowner Demand ........................................................................................ 45
Farms Demand ...................................................................................................................... 46
Installation Demand – All Markets ........................................................................................ 47
Research Sources............................................................................................................................48
Publications ........................................................................................................................... 48

COST OF PRODUCTION AND MARKET OPPORTUNITY FOR VETIVER GRASS
v
Subject Matter Experts.......................................................................................................... 48
Subject Matter Experts ‐ Unresponsive................................................................................. 50

COST OF PRODUCTION AND MARKET OPPORTUNITY FOR VETIVER GRASS
1
Introduction
Background and Objective ‘Sunshine’ vetiver is a non‐fertile, non‐invasive perennial
grass with a dense web of roots that binds soil and penetrates
vertically to 15 feet. It thrives in the tropics, growing in a variety
of inhospitable soils with low regard for fertility, salinity, pH, and
drought. When planted in strips, vetiver forms a vegetative
barrier that slows the velocity of water and traps sediment and
debris. Decades of use in the tropics confirm that vetiver, when
used as a vegetative barrier, is a very cost‐effective method
to reduce soil erosion and stabilize steep slopes.
Its proven success has led the USDA Natural Resources
Conservation Service (NRCS) to include the planting of vetiver as
a best management practice (BMP) for Hawaii farms.
Small amounts of ‘Sunshine’ vetiver have been available from the USDA Hoolehua Plant
Materials Center (PMC) on Molokai, for testing and grower increase, and the Hawaii Agriculture
Research Center (HARC) Kunia Substation. The PMC, however, has completed its task of testing
this species and has plans to reduce its production of vetiver. Limited supplies available from
the PMC and HARC can no longer meet the growing demand and there is currently only one
known established commercial vetiver supplier.
Preliminary estimates from the Kunia and Waialua areas, gathered by the NRCS, indicate a need
for over 100,000 lineal feet on just a few of the farms. In addition, the NRCS believes that other
farms, the Hawaii Department of Transportation and Department of Land and Natural
Resources, and the US Department of Defense agencies would likely be end‐users of vetiver
grass if it were available at a reasonable cost.
In late 2008, the O’ahu Resource Conservation & Development Council (ORC&D) was awarded a
grant to evaluate, promote and advance the adoption of vetiver grass as a conservation
resource, and encourage its production on a commercial scale. The project seeks to
establish/conduct the following:
Agronomic field guides for propagation.
Economics of propagation information for potential commercial scale or contract
production.
At least two field days for potential producers to share propagation guidance.
Market opportunities that provide links and contact lists for those needing plant
materials and those interested in providing plant materials.

COST OF PRODUCTION AND MARKET OPPORTUNITY FOR VETIVER GRASS
2
The goal of the project is to:
Evaluate, promote and advance the adoption of vetiver grass as a conservation resource
to reduce sediment transport in areas needing critical area treatment. By establishing a
field site (or sites) that demonstrates profitable propagation techniques, information
can be shared with nurseries and grass farms in the form of field guides for
establishment, propagation and replanting as a conservation practice, and
publications/literature for farmers, NRCS, and other agencies/ organizations.
Inventory current and projected 1‐5 year demand on O’ahu for vetiver plant material.
This information will be shared with nurseries and grass farmers so they can better
evaluate market opportunities.
Compile propagation costs and market prices for vetiver.
o Measure growth performance of vetiver.
o Increase adoption/transference of this technology to farmers/public through
appropriate literature and/or publications.
o Identify and document effective establishment techniques for the propagation
of vetiver grass for resale.
This report fulfills the goals relating to vetiver cost of production and market opportunities for
the island of O’ahu.
Vetiver Grass Vetiver (Chrysopogon zizanioides) has been utilized for medicinal purposes, energy production,
bioremediation, mat and basket production, landscaping, hedgerows, firebreaks, insect
repellent, scented oils, perfumes, and soaps. Its primary use in Hawaii, however, has been for
soil and water conservation.
Use as a Vegetative Barrier for Erosion Control Vetiver is a quick growing grass, suitable for most soil conditions, and has a deep root system
that provides structural strength in a short period of time. When planted in a row, vetiver can
be an effective, inexpensive, low maintenance
method to minimize soil erosion. After initial
planting, a single vetiver slip quickly multiplies and
when properly planted, connects to adjoining plants
to create a thick, sturdy grass hedge. The deep and
wide hedge slows and spreads water runoff, forming
terrace‐like benches at the face of the hedges. In
addition, the thick and deep root system keeps the
plant relatively fixed during high velocity water
flows.

COST OF PRODUCTION AND MARKET OPPORTUNITY FOR VETIVER GRASS
3
Alternatives to Vetiver Grass for Soil Erosion Soil erosion can also be mitigated using the following techniques:
Diversion berms are mounds of earth used to deflect water. They can be used to move
water to a less erodible area. Soil loss can occur from the berms themselves, and berm
creation typically requires heavy machinery.
Construction methods include using reinforced concrete structures or ditches. Fixed
structures can be expensive to install, brittle, costly to repair and maintain, and are
usually unsustainable.
Other Vegetative Materials such as bana grass, wild cane, pili grass, and lemon grass
can also be used for vegetative barriers. However, ’Sunshine’ vetiver is the only plant to
receive a variance from the standard minimum width of 36 inches to 12 inches. Thus, a
single row or a closely planted double row of vetiver will suffice where multiple rows of
other species are needed. A minimum amount of crop land is devoted to these single‐
row vegetative barriers.
Advantages of Using Vetiver for Erosion Control The major benefit of vetiver over conventional engineering is its low cost and longevity. It is
estimated that the cost of installation is 30% of the cost of traditional construction methods
(Troung, Van, and Pinners, 2008: 30). In addition, vetiver has the following advantages (Troung,
Van, and Pinners, 2008: 30):
Vetiver provides a natural, environmentally‐friendly way to control erosion and stabilize
land and ‘softens’ the harsh look of conventional rigid engineering measures such as
concrete and rock structures. This is particularly important in urban and semi‐rural
areas where local communities may criticize the unattractive appearance of
infrastructure development.
• Long‐term maintenance costs are low. In contrast to conventional engineering
structures, green technology improves as the vegetative cover matures. Therefore, the
use of vetiver is particularly well suited to remote areas where maintenance is costly
and difficult.
• Vetiver is very effective in poor and highly erodible and dispersible soils.
Disadvantages of Using Vetiver for Erosion Control The main disadvantage of vetiver is its intolerance to shading, particularly within the 3‐6 month
establishment phase. However, due to sun availability in Hawaii during most of the year,
appropriate planning can reduce this risk. In addition, vetiver has the following disadvantages
(Troung, et al, 2008: 31):
• Vetiver is effective only when the plants are well established. Effective planning
requires an initial establishment period of about 2‐3 months.

COST OF PRODUCTION AND MARKET OPPORTUNITY FOR VETIVER GRASS
4
• Vetiver hedges are fully effective as a vegetative barrier only when plants form closed
hedgerows. After establishment, gaps between clumps must be minimized or
eliminated.
• It is difficult to plant and irrigate vegetation on very steep slopes, although this would
also apply to alternatives.
• Vetiver requires protection from livestock during its establishment phase.
Project Research Approach To determine the cost of production associated with growing and installing vetiver and the
market demand, the following research was conducted:
1. Interviewed key contacts (see Appendix, Research Sources, Subject Matter Experts).
2. Reviewed existing documentation (see Appendix, Research Sources, Publications).
Details on the research activities undertaken are included in the relevant sections of this
document.
Approach to Findings Information outlined in this report is based on a combination of research and experience from
the aforementioned sources and the authors. Market demand estimates are limited to the
O’ahu market only. Obtaining market demand was complicated by the fact that many sources
were not able to provide specific information for use. In lieu, estimated demand numbers based
on stated acreage were utilized.
The cost and market demand of maintaining vetiver as a service was also considered. Because
vetiver requires minimal maintenance, there was a low interest level in this service and further
analysis was not conducted.

COST OF PRODUCTION AND MARKET OPPORTUNITY FOR VETIVER GRASS
5
Cost of Production Estimate for Growing Vetiver
Growing Vetiver for Commercial Production The growing method currently used at the USDA NRCS Hoolehua Plant Materials Center (PMC)
was used to determine appropriate production requirements and costs associated with growing
vetiver for commercial production. Note that additional experience with vetiver may lead to
new information and improved production techniques.
Although this planting/growing method was used for consideration in commercial production, it
should not be used for advice with placement of vetiver for soil mitigation purposes. For advice
in planting vetiver for soil erosion mitigation, contact the local NRCS office.
Using current growing methods, the Hoolehua PMC staff provided recommendations for
commercial vetiver production and the Cost of Production figures assume adherence to these
recommendations.
General
o Plant in three phases with new vetiver planted every 6 months. Harvest at 12
months to allow the land to remain fallow for a period of 6 months and be
adequately rotated. Re‐till land prior to replanting.
o Basic farm machinery (see below) is needed to prepare land, control weeds, and
cut and harvest vetiver.
o Growers should plan for a 10% mortality rate. The plant output numbers noted
in the analysis have taken this into account.
Initial Startup/Planting
o Use a clear, relatively level area with open sun for planting.
o Use a tractor for land preparation and plant removal. It is the preferred method
and is the method used in the accompanying Cost of Production Estimate.
Manual methods can be used; however, this will increase the labor hours.
o Ground preparation includes plowing, amendment addition, and tilling.
o A specific soil type is not essential. Soil testing, however, should be conducted
to determine effective amendments.
o A specific fertilizer formula is not consistently recommended. At a recent
planting, the PMC used Triple 16 fertilizer when initially planted and is used in
the Cost of Production Estimate.

COST OF PRODUCTION AND MARKET OPPORTUNITY FOR VETIVER GRASS
6
o Install a drip irrigation system for supplemental watering.
o Prior to planting, soak soil overnight.
o Plant by hand and place each slip 1 foot apart within the row.
o Place rows 6‐8 feet apart (depending on the type of equipment that is needed
to remove and maintain plants).
Post Planting
o After initial planting, soak vetiver daily for three weeks to establish the root
system.
o After establishment, irrigate once per week for one hour with drip tape.
o Hand weed once per month.
Plant Removal
o Use a tractor to cut out a root ball about 1 foot deep.
o Plants can be harvested as early as 6 months. The ideal harvesting period is
between 12 and 18 months. The plants should not remain in the ground
beyond 24 months as slips become tight and roots become deeply rooted,
making the removal and hand splitting difficult to manage.
o Manually split and clean plants and remove most of the root.
o Plant output:
6 months: 20 slips produced per initial plant
12 months: 50 slips produced per initial plant
Other Notable Information
o Currently vetiver cannot be imported into Hawaii without fulfilling a 1‐year
quarantine period.
o Vetiver can be exported to other states if the grower has a Hawaii Department
of Agriculture certification.
o Growers can consider placing vetiver in pots instead of the ground. Although
this may allow for easier plant removal, the PMC has not tested this growing
method and its effects on plant volume.

COST OF PRODUCTION AND MARKET OPPORTUNITY FOR VETIVER GRASS
7
o Growers can consider growing vetiver hydroponically. Although this may allow
for easier plant removal, the PMC has not tested this growing method and its
effects on plant volume.

COST OF PRODUCTION AND MARKET OPPORTUNITY FOR VETIVER GRASS
8
Crop Plot Plan In determining the Cost of Production Estimate, commercial production on ½ acre of land was
used. The following is general information about the land, number of plants, and slip
production for the ½ acre:
Square Feet Per Acre 43,560 square feet
Square Feet per ½ Acre (rounded) 20,000 square feet
Assume area used is 100 feet x 200 feet
Plants per Row 100
Number of Rows (planted 6 feet apart) 33
Number of Plots 3
Number of Plants Per Plot 1,100
Slips Produced From Each Plant in 12 Months 50 (includes a 10% mortality)
The following plot plan was used in the calculation:
Plot # Number of Plants Rows Harvest Yield
Next Planting Schedule
January-2010 Plot1 100 1 Jan-11 4,000 Jan-2012
July-20101 Plot1 1,000 10 Jul-11 50,000 Jan-2012
2011 Harvest Total 1,100 11 54,000
January-2011 Plot2 1,100 11 Jan-12 55,000 Jul-2012
July-2011 Plot3 1,100 11 Jun-12 55,000 Jan-2013
2012 Harvest Total 2,200 22 110,000
January-2012 Plot1 1,100 11 Jan-13 55,000 Jul-2013
July-2012 Plot2 1,100 11 Jul-13 55,000 Jan-2014
2013 Harvest Total 2,200 22 110,000
January-2013 Plot3 1,100 11 Jan-14 55,000 Jul-2014
July-2013 Plot1 1,100 11 Jul-14 55,000 Jan-2015
2014 Harvest Total 2,200 22 110,000
1 The initial planting includes 100 free plants from the Hoolehua PMC. Six months after the
planting, 1,000 slips are removed from the sides of the starter plants and replanted.

COST OF PRODUCTION AND MARKET OPPORTUNITY FOR VETIVER GRASS
9
Financial Analysis The Cost of Production Estimate revealed the following (see Appendix for the detailed Cost of
Production Estimate):
• During the first year of operation:
o Total direct cost incurred during the first year of operation is $16,985.
o Total labor hours incurred during the first year is 1,184 ($15,948, or 94% of the
total direct cost).
• At full production:
o 2,200 plants will be planted annually.
o 110,000 slips will be harvested annually.
o Annual direct costs will total $36,214.
o Labor represents 93% of direct costs.
o Direct cost per slip will total $0.33.
o Total cost (with estimated indirect costs added) per slip will equate to $0.53.
o If charging $1.00 per slip, expected profit per slip is $0.47. Annual operating
profit will total $51,426.
Assumptions The following assumptions, based on planting methods at the Hoolehua PMC, were used when
developing the Cost of Production Estimate for growing vetiver:
Initial area is cleared for planting.
Planting area is ½ acre (100 ft. x200 ft. area). There are 100 plants in each of 33 rows.
Plants are placed 1 foot apart within each row. Rows are placed 6 feet apart (center to
center).
Ground preparation is only done in the area targeted for planting (except for the initial
planting where the 1/6 acre is prepared).
The Hoolehua PMC provides 100 started plants free of charge. Note that Hoolehua PMC
has completed its task of testing this species and has plans to reduce production of
vetiver in the near future.

COST OF PRODUCTION AND MARKET OPPORTUNITY FOR VETIVER GRASS
10
The initial planting includes the 100 free plants from the Hoolehua PMC. Six months
after the planting, 1,000 slips is removed from the sides of the starter plants and
replanted.
Eleven rows are planted every 6 months for adequate rotation. Land lays fallow for 6
months after each harvest.
The Pacific Business News (dated: 2/23/09), noted average wage for field workers in
small farms as $10.36. This dollar amount is used for labor costs.
Thirty percent is added to labor costs for employee benefits and insurance costs.
Soil test is estimated at $21 for the report plus $10 for shipping or deliver to CTAHR.
Information on soil testing can be found at www2.ctahr.hawaii.edu/adsc/
Ground preparation assumes use of 2 blade plow and includes the following per acre
time estimates:
o Plow (16 hours)
o Breaking clods of dirt with disk (3 hours)
o Adding amendments (lime/phosphorous/nitrogen) (3 hours)
o Roto‐till (8 hours)
Drip irrigation setup includes pulling lines, stretching, hooking fittings, and pegging lines.
Water cost is estimated at $2.66/1000 gallons (.00266 per gallon).
A tractor is used for plant removal. (Note: hand removal is an option but it will increase
labor hours.)
Cost per slip is based on full production.
The nursery had a 5 acre production and vetiver accounted for 10% of overall farm
production. Indirect Costs are allocated at this level.
Disposal costs are not factored into the estimate.
All plants are sold at one year of age. However, costs for maintaining plants for an
additional 6 months are factored into the estimate.

COST OF PRODUCTION AND MARKET OPPORTUNITY FOR VETIVER GRASS
11
Cost of Production for Installation
Installing Vetiver for Soil Erosion Mitigation In addition to determining the cost of production for growing vetiver, the cost and market
opportunity of installing vetiver as a service was explored.
Financial Analysis The Cost of Service Estimate revealed the following (see Appendix for the detailed Cost of
Service Estimate):
The cost to install 200 linear feet of vetiver is $1,840.
o This equates to $9.20 per linear foot.
o Labor costs total $577 (31% of total direct costs).
The cost to install 1,000 linear feet of vetiver is $6,432.
o This equates to $6.43 per linear foot.
o Labor costs total $2,560 (40% of total direct costs).
o A reduction in the per day equipment charge significantly reduced the per linear
foot cost when comparing a 200 foot installation and a 1,000 foot installation.
The cost to install 2,000 linear feet of vetiver is $11,235.
o This equates to $5.62 per linear foot.
o Labor costs total $5,038 (45% of total direct costs).
The cost to install 4,000 linear feet of vetiver is $22,072.
o This equates to $5.52 per linear foot.
o Labor costs total $22,073 (46% of total direct costs).
Assumptions The following assumptions were used when developing the Cost of Service Estimate:
Three employees are available to work on the project.
Initial area is cleared for planting.
Land grade is not prohibitively sloped.

COST OF PRODUCTION AND MARKET OPPORTUNITY FOR VETIVER GRASS
12
Purchaser provides at least 3 weeks between order and installation. This allows the
nursery to root the plants prior to installation.
A trough is dug with a plow attached to a small tractor.
Equipment is rented (vs. purchased). Delivery charges are quoted for a location in
Kunia.
Estimated rental cost is $400 per day or $1,150 per week with a $250 delivery charge.
Planting is done by hand.
Four vetiver slips are planted in each 6” x 12” area (for purposes of this report, this area
will be referred to as a linear foot since the plants will connect to form one row).
Vetiver is planted in 2 rows (6" apart) with vetiver 6" apart offset in each row (see
following diagram, where “x” indicates vetiver slip planting).
12” 12”
x x x x x x
6”
x x x x x
To ensure establishment, site visits are conducted 3 times per week for the first 3
weeks.
Land owner is responsible for irrigation installation and plant watering.
Indirect costs are not included in the per linear foot estimate.

COST OF PRODUCTION AND MARKET OPPORTUNITY FOR VETIVER GRASS
13
Market Analysis – Sale of Vetiver Plants
Definition of Markets To determine the demand of vetiver on O’ahu over the next 5 years, the following markets were
defined for the purpose of market segmentation. Each of these markets were assumed to have
a significant aggregate need to mitigate soil erosion caused by surface water flow, and thus be
candidates for vetiver purchase/implementation.
• Government: including federal, state, and city government lands that may use vetiver
for soil erosion control along roads, parks, watershed reserves, and other public
properties on the island of O’ahu.
• Large Private Landowners: such as Kamehameha Schools, Campbell Estate, and Castle
and Cooke who have landholdings over 10,000 acres on O’ahu.
• Farms: privately operated farms on O’ahu (does not include land in the Large Private
Landowner market).
Market Research Significant effort was made in gathering market demand information from a wide
representation (see Appendix, Research Sources, Subject Matter Experts) in each of the defined
Markets. Each of the contacted Subject Matter Experts was asked to provide information on a
number of questions (see below and Appendix, Solicitation Letter).
Due to the low general familiarity with vetiver, the questions were designed to provide
quantitative information on the scope of need that vetiver might address, in addition to other
information useful for selling vetiver. Data was solicited from 31 organizations/individuals with
16 providing feedback. Respondents, however, were often not able or willing to provide
answers to some of the quantitative volume questions, in part due to the lack of summary/total
information for their respective organizations.

COST OF PRODUCTION AND MARKET OPPORTUNITY FOR VETIVER GRASS
14
Marketing Survey Questions How is your organization currently managing soil erosion and stabilizing steep slopes
(structural: berm/concrete or vegetative method)?
How many Total linear feet are managed by your organization (or boundary feet or total
sq ft of properties / number of properties) on O’ahu?
What percentage of Total are sloped lands?
What percentage of Total may need soil erosion control or slope stabilization?
Are there O’ahu projects planned in the next 5 years to manage soil erosion and
stabilize slopes (obtain details on size of project and method, if possible, as well as
approximate timing)?
Are there any current O’ahu initiatives to manage soil erosion and stabilize slopes?
Are soil erosion/slope stabilization responsibilities managed by your organization or
lessee?
Would your organization consider evaluating vetiver to manage soil erosion/stabilizing
slopes and what would be the primary decision points?
Would your organization make vetiver purchase decision directly or is this determined
by a third party (contractor)?
Would your organization install or contract out installation for O’ahu implementations?
What are the requirements to award project (license/insurance/etc)?
What is the contact information for individual/department that would make purchasing
decisions for O’ahu projects?
Market Size and Demand Vetiver has not yet gained status with most markets as a de‐facto option for water diversion or
soil erosion mitigation. As such, direct demand estimates are not available. In order to provide
a proxy for direct demand, the following approach was developed:
For markets where only acreage data is available:
Square root of 43,560 (one acre in square feet) = 209 (horizontal length in feet of
acreage in the shape of a square)
Number of acres under management x 209 = A (linear feet of acreage assuming one row
per acre).

COST OF PRODUCTION AND MARKET OPPORTUNITY FOR VETIVER GRASS
15
A x B (modifier per market sub segment to reflect relative vetiver applicability—detailed
per sub segment) = C (estimated candidate for vetiver in linear feet). Note that default
value of B has been valued at 25% based on K Factor findings below.
C x 4 (prescribed number of vetiver plants per lineal foot) = Number of vetiver plants for
that market sub segment.
The authors attempt to be conservative in this approach in that it assumes only a single line of
vetiver planted horizontally across an acre of square land (a variety of parcel size would tend to
have greater horizontal length on average than the square root of an acre) . Also, just 25% of
the acreage is deemed the base modifier for vetiver candidacy as determined by the K Factor
analysis. Furthermore, market unfamiliarity, resistance to change, non‐open areas, and other
factors are taken into account and the modifier is thus typically reduced from the base. Finally,
the total acreage used for the estimates is understated due to limitations of the research
(incomplete accounting of total acreage for any given market).
In order to serve as a form of validation, the authors used the Hawaii Natural Resources
Information System (HNRIS) software from the College of Tropical Agriculture and Human
Resources, University of Hawaii, to analyze the number of acres on O’ahu with soil with
‘Moderate’ or greater ‘K factor’ (see Appendix, K Factor) as a gross indicator of candidacy for
vetiver.
By the above analysis, 99,328 acres on O’ahu have a K Factor of 0.25 or greater (the threshold
for ‘Moderate’ erodibility) as shown in the shaded areas of the map below. This represents
roughly 25% of the total O’ahu acreage of 384,043 acres.

COST OF PRODUCTION AND MARKET OPPORTUNITY FOR VETIVER GRASS
16
Effort was made to identify acreage exceeding certain grades/slopes as this would be another
form of gross validation (NRCS estimates 3%‐12% as a working figure), but the HNRIS and NRCS
GIS systems could not provide this information. As a point of reference, a study by Kinoshita
and Turn for the Department of Business, Economic Development and Tourism, provides a visual
representation of certain grades/slopes for agricultural land on O’ahu (below).
The following table contains acreage per slope range information but applies only to acreage
with soils deemed suitable to sugar cane growth.

COST OF PRODUCTION AND MARKET OPPORTUNITY FOR VETIVER GRASS
17
Government This market, consisting of Federal/military, State, and City and County of Honolulu agencies and
organizations, represents the largest opportunity for vetiver plant sales. Some reasons stated
by market interviewees that substantiate the strength of this market include:
Customers in this market manage relatively large land areas.
Customers in this market are especially sensitive to environmental concerns by policy
and/or public interest and are thus more likely to address erosion issues.
The use of natural methods for surface water diversion and erosion control is preferable
for public perception considerations.
Currently there are two identified vetiver‐using projects in the planning stages. The State
Department of Transportation Services has a plan for using vetiver on a roadside slope on
Kahekili Highway and is estimating the use of 13,000 vetiver slips (Chris Dacus). The City
Department of Parks and Recreation (James Woll) has recently approved a vetiver pilot project
on unspecified park land. In addition, interest in vetiver was expressed by the US Army Corp of
Engineers (Russell Leong).
The market potential for vetiver slips in the government market is estimated to be (see
Appendix, Market Calculations, Government Demand):
Year Slips Revenue
(at $1 per slip) Profit
1 205,672 $ 205,672 $ 96,666
2 720,623 $ 720,623 $ 338,693
3 1,206,056 $ 1,206,056 $ 566,846
4 1,753,013 $ 1,753,013 $ 823,916
5 1,844,351 $ 1,844,351 $ 866,845
Total 5,729,715 $ 5,729,715 $ 2,692,966

COST OF PRODUCTION AND MARKET OPPORTUNITY FOR VETIVER GRASS
18
0
500000
1000000
1500000
2000000
Year 1 Year 2 Year 3 Year 4 Year 5
Vetiver slips

COST OF PRODUCTION AND MARKET OPPORTUNITY FOR VETIVER GRASS
19
Large Private Landowners The large private landowners on O’ahu are identified as Campbell Estate, Kamehameha Schools,
Castle & Cooke Hawaii, and James Campbell Company Hawaii. These have land holdings on
O’ahu of over 10,000 acres. Although these four landowners account for over 131,000 acres on
O’ahu—a third of the total acreage—the demand for vetiver is estimated to be significantly
lower than the government market due to a relatively lower motivation to utilize vetiver:
Emphasis on compliance versus proactive erosion control.
Less sensitive/subject to environmental concerns by policy and/or public interest than
government market.
High rate of tenant responsibility for erosion control.
The market potential for vetiver slips in the large private landowner market is estimated to be
(see Appendix, Market Calculations, Large Private Landowner Demand):
Year Slips Revenue
(at 1$ per slip) Profit
1 0 $ ‐ $ ‐
2 182,762 $ 182,762 $ 85,898
3 400,399 $ 400,399 $ 188,187
4 400,399 $ 400,399 $ 188,187
5 400,399 $ 400,399 $ 188,187
Total 1,383,959 $ 1,383,959 $ 650,459
0
50000
100000
150000
200000
250000
300000
350000
400000
450000
Year 1 Year 2 Year 3 Year 4 Year 5
Vetiver slips

COST OF PRODUCTION AND MARKET OPPORTUNITY FOR VETIVER GRASS
20
Farms The Farms market includes privately operated farms on O’ahu (does not include that which fall
under the Large Private Landowner market). For this market, past data from NRCS on vetiver
recommendations and implementations provided a strong basis for estimating the modifier ‘C’
used in the demand calculations.
This market represents an active market for vetiver sales due for the following reasons:
Farmers have incentive to minimize soil loss due to their operational reliance on soil.
Farmers have incentives to obtain and implement conservation plans from NRCS,
including permit obviation and cost‐share programs.
The NRCS Conservation Reserve Program (CRP) and the Environmental Quality
Incentives Program (EQIP) provide technical and financial assistance to eligible farmers
and ranchers to address soil, water, and related natural resource concerns on their
lands in an environmentally beneficial and cost‐effective manner. The Programs
encourages farmers to convert highly erodible cropland or other environmentally
sensitive acreage to vegetative cover, such as tame or native grasses, wildlife plantings,
trees, filter strips, or riparian buffers. Vetiver as a vegetative barrier is a NRCS‐
recommended best management practice that addresses some of the program
objectives. Farmers receive an annual rental payment for the term of the multi‐year
contract. Cost sharing is provided to establish the practices.
Vetiver use is a recommended Best Management Practice by NRCS, who provide
conservation planning services to farmers.
This market includes some large farmers such as Del Monte and hybrid seed companies, some of
which are already implementing vetiver for erosion control.
The market potential for vetiver slips in the farms market is estimated to be (see Appendix,
Market Calculations, Farms Demand):
Year Slips Revenue
(at $1 per slip) Profit
1 236,438 $ 236,438 $ 111,126
2 295,547 $ 295,547 $ 138,907
3 354,656 $ 354,656 $ 166,688
4 413,766 $ 413,766 $ 194,470
5 472,875 $ 472,875 $ 222,251
Total 1,773,282 $ 1,773,282 $ 833,442

COST OF PRODUCTION AND MARKET OPPORTUNITY FOR VETIVER GRASS
21
0
100000
200000
300000
400000
500000
Year 1 Year 2 Year 3 Year 4 Year 5
Vetiver slips

COST OF PRODUCTION AND MARKET OPPORTUNITY FOR VETIVER GRASS
22
Total Market Potential The aggregate demand from the three markets is shown below. The general year‐over‐year
increases and sharp rise in the estimate between years one and two reflect assumptions that:
Through the dissemination of information and field demonstrations by ORC&D and
NRCS as part of this project, an increased awareness on the part of potential vetiver
suppliers and customers will occur. The resulting increase in supply availability will
enable an acceleration of vetiver implementation/purchases.
As pilot projects and early implementations demonstrate success, confidence in vetiver
and thus adoption will steadily increase.
Year Slips Revenue
(at $1 per slip) Profit Acres of Vetiver
1 442,110 $ 442,110 $ 207,792 2.01
2 1,198,932 $ 1,198,932 $ 563,498 5.45
3 1,961,111 $ 1,961,111 $ 921,722 8.91
4 2,567,178 $ 2,567,178 $ 1,206,574 11.67
5 2,717,624 $ 2,717,624 $ 1,277,284 12.35
Total 8,886,955 $ 8,886,955 $ 4,176,869
As a point of reference, note that a K factor of 0.25+ yields 83,038,208 vetiver plants using the
base demand formula. The five year aggregate is less than 10% of that number.
$0
$500,000
$1,000,000
$1,500,000
$2,000,000
$2,500,000
$3,000,000
Year 1 Year 2 Year 3 Year 4 Year 5
Revenue
The upward trend may be further supported by a Senate Concurrent Resolution (SCR ‐ No. 176)
being reviewed by various Senate committees (as of 4/16/09) requesting that the Department
of Land and Natural Resources and the Department of Transportation research the use of
vegetative erosion barriers, particularly vetiver grass, to minimize soil erosion and prevent the
resulting runoff from damaging roads, streams, coastal waters, and reefs and to stabilize stream

COST OF PRODUCTION AND MARKET OPPORTUNITY FOR VETIVER GRASS
23
banks, hillsides, and other threatened sites. The SCR requests that the Department of Land and
Natural Resources submit a final report to the Legislature prior to the 2010 Regular Session.

COST OF PRODUCTION AND MARKET OPPORTUNITY FOR VETIVER GRASS
24
Competition Currently there is one known large commercial grower and two additional sources of vetiver
plants in Hawaii as listed in the table below. The general assessment of the supply/demand
balance is that there is insufficient supply of vetiver to meet the needs of projected
conservation plan recommendations.
Potential competition for supplying vetiver would come most naturally from existing nurseries
with in‐ground growing methods.
Source ‐ Location Vetiver Pricing Capacity Notes
Vetiver Systems of
Hawaii ‐ O’ahu
Proprietary Proprietary Only known commercial grower in
Hawaii.
Hoolehua Plant
Material Center ‐
Molokai
None Limited Distribution quantity limited to
100 slips per grower.
Hawaii Agriculture
Research Center ‐
O’ahu
.40‐.65/slip Limited Research center with limited
supply. Not established for
commercial distribution but
currently sharing in consideration
of the low number of alternate
sources.
Plant removal is not included in
the cost. Purchaser must remove
plants on their own.

COST OF PRODUCTION AND MARKET OPPORTUNITY FOR VETIVER GRASS
25
Market Analysis – Installation of Vetiver Plants
Definition of Markets See Market Analysis – Sale of Vetiver Plants, Definition of Markets above.
Market Research In addition to feedback from the research described in Market Analysis – Sale of Vetiver Plants,
Market Research above, the following activities provided useful information for the analysis of
the vetiver installation market:
Publicly‐available requests for proposals and bids on soil erosion mitigation projects
demonstrated that the government market generally seeks to hire
construction/implementation services, which is analogous to installation. This
information also served as a comparison for pricing analysis.
Analysis of a State Department of Transportation, Highways Division plan for roadside
erosion mitigation involving vetiver supported the above finding, specifically for vetiver
installation. In addition, the scope of specified vetiver installation informed demand
estimates.
Interviews with Subject Matter Experts with knowledge of vetiver installations provided
insight of demand estimates for the Large Private Landowner and Farms markets.
Market Size and Demand The linear feet demand estimates for the defined markets (see Appendix, Market Calculations)
formed the basis for estimated vetiver installation demand. Applied to this figure is a per‐
market modifier to adjust for variability amongst markets for demand of contracted installation
services versus customer installation (see Appendix, Market Calculations, Installation Demand).
For market potential calculations, the various markets are characterized by different
assumptions of average vetiver installation project size and thus differing cost of service figures
are utilized (see Appendix, Market Calculations, Installation Demand). Note also that these costs
assume purchasing vetiver at the cost to produce, i.e., growing the plant material.
The pricing of the service for all markets, however, is set at the median analyzed markup of
100% due to the relative cost savings of vetiver versus traditional methods of erosion mitigation,
and includes the vetiver plant material itself.

COST OF PRODUCTION AND MARKET OPPORTUNITY FOR VETIVER GRASS
26
Government For this market, projects will tend to be large and therefore costs from the 4,000 linear foot
analysis (see Appendix, Cost of Service) were used.
Estimated Market Potential, Government
Year Feet Revenue
(at 100% markup) Profit
1 43,705 $ 482,507 $ 241,254
2 153,132 $ 1,690,580 $ 845,290
3 256,287 $ 2,829,408 $ 1,414,704
4 372,515 $ 4,112,569 $ 2,056,285
5 391,924 $ 4,326,846 $ 2,163,423
Total 1,217,564 $ 13,441,911 $ 6,720,956
Cost per linear foot (4,000 ft CoS analysis) $ 5.52
Selling price per linear foot (100% markup) $ 11.04
0
500000
1000000
1500000
2000000
2500000
3000000
3500000
4000000
4500000
Year 1 Year 2 Year 3 Year 4 Year 5
Revenue

COST OF PRODUCTION AND MARKET OPPORTUNITY FOR VETIVER GRASS
27
Large Private Landowners For this market, projects will tend to be large but more conservative and therefore costs from
the 2,000 linear foot analysis (see Appendix, Cost of Service) were used.
Estimated Market Potential, Private Large Landowner
Year Feet Revenue
(at 100% markup) Profit
1 ‐ $ ‐ $ ‐
2 43,406 $ 487,884 $ 243,942
3 95,095 $ 1,068,865 $ 534,432
4 95,095 $ 1,068,865 $ 534,432
5 95,095 $ 1,068,865 $ 534,432
Total 328,691 $ 3,694,479 $ 1,847,238 Cost per linear foot (2,000 ft CoS analysis) $ 5.62
Selling price per linear foot (100% markup) $ 11.24
0
200000
400000
600000
800000
1000000
1200000
Year 1 Year 2 Year 3 Year 4 Year 5
Revenue

COST OF PRODUCTION AND MARKET OPPORTUNITY FOR VETIVER GRASS
28
Farms For this market, projects will tend to be smaller and therefore costs from the 200 linear foot
analysis (see Appendix, Cost of Service) were used.
Estimated Market Potential, Farms
Year Feet Revenue
(at 100% markup) Profit
1 5,911 $ 108,761 $ 54,381
2 7,389 $ 135,952 $ 67,976
3 8,866 $ 163,142 $ 81,571
4 10,344 $ 190,332 $ 95,166
5 11,822 $ 217,523 $ 108,761
Total 44,332 $ 815,710 $ 407,855 Cost per linear foot (200 ft CoS analysis) $ 9.20
Selling price per linear foot (100% markup) $ 18.40
0
50000
100000
150000
200000
250000
Year 1 Year 2 Year 3 Year 4 Year 5
Revenue

COST OF PRODUCTION AND MARKET OPPORTUNITY FOR VETIVER GRASS
29
Total Market Potential The aggregate market potential from the three markets is shown below. See also Market
Analysis – Sale of Vetiver Plants, Total Market Potential).
Total Estimated Market Potential
Year Feet Revenue Profit
1 49,616 591,268 295,634
2 203,927 2,314,415 1,157,208
3 360,248 4,061,415 2,030,707
4 477,954 5,371,766 2,685,883
5 498,841 5,613,234 2,806,617
Total 1,590,587 $ 17,952,098 $ 8,976,049
0
1000000
2000000
3000000
4000000
5000000
6000000
Year 1 Year 2 Year 3 Year 4 Year 5
Revenue

COST OF PRODUCTION AND MARKET OPPORTUNITY FOR VETIVER GRASS
30
Competition Currently there is one known commercial installer of vetiver in Hawaii, located on O’ahu.
Potential competition for installing vetiver would include landscapers on O’ahu, particularly
those with the ability to grow the plant material. Other requirements of an installer would
include:
Need for expertise on the implementation of vetiver to be effective for the intended
purpose (erosion mitigation, surface water diversion, soil stabilization, etc.)
Potentially a landscape contractor or other license, bonding, and/or participation on the
GSA schedule to bid on government jobs.
Other skills related to installation, including irrigation installation.
A source for vetiver plant material.
Given that conventional (non‐vetiver) alternatives are as high as $91 per square foot,
competition with installers of these alternatives is not expected to come from price competition
but rather customer acceptance of vetiver as a solution.
Source ‐ Location Installation
Pricing
Capacity Notes
Vetiver Systems of
Hawaii ‐ O’ahu
Proprietary Proprietary Only known commercial installer in
Hawaii.
Interviews with Subject Matter Experts indicated low interest in post‐establishment plant
maintenance services (e.g., mowing/hedging vetiver). Therefore, the market was not analyzed.

COST OF PRODUCTION AND MARKET OPPORTUNITY FOR VETIVER GRASS
31
Pricing Analysis – Sale of Vetiver Plants A business should consider its competitors, suppliers, the availability of substitute products, and
their customers when developing a pricing strategy. In the case of selling vetiver slips:
Competitors: as indicated in the Competition section above, there is only one
known commercial grower in Hawaii. Therefore, the current level of competition is
low.
Suppliers: the vast majority of direct costs associated with the sale of vetiver plants
relate to labor. The reliance on suppliers has relatively no effect on the growing of
the plant.
Availability of Substitute Products: as indicated in the Alternatives to Vetiver Grass
for Soil Erosion section above, alternatives include diversion berms, construction
methods, and other vegetative methods. Berm and construction methods are
readily available at a higher cost. The following examples provide information on
recent Hawaii projects:
In 2004, the State reduced the degree of slope on a mountain at Castle Junction
on Kalanianaole Highway from 70 degrees to 30 degrees. The project cost the
state $7.8 million. This project included road modifications.
In 2008, the State Department of Transportation published a notice to bidders
for slope stabilization near the Pali Highway. The project included providing
slope stabilization using Anchor Mat System or equivalent, and providing
erosion control mat and ground cover. The area is estimated at approximately
150 feet by 50 feet. The estimated construction cost was between $500,000
and $1,000,000. Bids amount submitted ranged between $622,000 and
$745,000. This represents an average of $91 per square foot.
Since other vegetative methods are not currently recommended by the NRCS in the
Vegetative Barrier Conservation Practice, a competitive price analysis for vegetative
alternatives was not conducted.
Customers: the client base ranges from small farmers to government agencies. In
the current economy, all clients are concerned with cost. Government clients,
especially Federal, show particular interest in using a vegetative barrier instead of
traditional construction materials.
Considering that there is minimal competition and limited information regarding competitor
pricing, a business might consider using a cost plus markup strategy for determining pricing. The
business can determine the desired profit level and add it to total costs to determine selling
price.

COST OF PRODUCTION AND MARKET OPPORTUNITY FOR VETIVER GRASS
32
Pricing Analysis – Installation of Vetiver Plants Similar to the pricing analysis for selling vetiver, a business should consider the following factors
when determining installation prices, which include the vetiver plant material itself. In the case
of installing vetiver slips:
Competitors: there are many experienced, licensed contract landscapers who could
install vetiver. As of 4/1/09, there were 70 licensed landscape architects on O’ahu.
The most recent Landscape Industry Council of Hawaii membership list reflects 105
members on O’ahu. Superpages.com lists 127 landscape contractors on O’ahu.
Suppliers: other than labor, the cost of the vetiver slips account for most of the cost
associated with installation. If the installer is also a grower (supplier) of vetiver, it
will have an advantage over non‐grower/installers since they can factor in a profit
from the plant sale in addition to a profit from the installation service.
Availability of Substitute Products: Farmers and landowners/government
departments with adequate expertise and labor may opt to self install the vetiver.
In addition, other landscapers may have an automated method which could reduce
the labor costs associated with the installation.
Customers: the client base ranges from small farmers to government agencies. In
the current economy, all clients are concerned with cost.
Considering that there is a fair amount of competition in addition to the opportunity for the
customer to install the vetiver on their own, a business might consider using competitor
pricing as a benchmark for their own prices. They may consider pricing slightly below, above
or the same as their competitors. A query of landscapers on O’ahu concluded that jobs are
priced based on a cost plus strategy, ranging between 50 and 100%. Considering that there
is no markup reflected for the cost of the plants in the Cost of Service estimates, it is
recommended that the business consider markups on higher end of the range.
To ensure that prices remain competitive, the business should continually observe
competitor pricing and strategy and adjust prices as necessary.

COST OF PRODUCTION AND MARKET OPPORTUNITY FOR VETIVER GRASS
33
Appendix
Cost of Production Estimate – Analysis for Growing Vetiver
Direct Costs – First Year of Operation
Notes:
1,100 slips are planted during the year, yielding 54,000 at harvest.
(1) Only 1/6 of an acre is prepped at each cycle. Soil sample will be completed for each 1/6
acre prior to planting. Cost of soil test from CTAHR is $21 with an additional $10 for
shipping/deliver of soil.
(2) Based on HARC estimate: 16‐16‐16 fertilizer: $168/acre; lime: $60/acre; gypsum:
$90/acre.
(3) Hoolehua PMC estimated 2 hours to plant 100 slips by hand.
(4) Hoolehua PMC estimated 8‐10 hours/1100 plants per month. Frequency: weeding 1x
per month per crop. Additional cycles included in case nursery needs to maintain 3rd
plot for 6 months.
(5) Hoolehua PMC estimated 4gallons/plant/watering. Cost estimate: $2.66/1000 gallons
(BOWS published rate). Frequency: 2 times per week for the 1st month then weekly.
Additional cycles included in case nursery needs to maintain 3rd plot for 6 months.
(6) Hoolehua PMC estimated 5 min to remove each ball; 1100 balls = 92 hours.

COST OF PRODUCTION AND MARKET OPPORTUNITY FOR VETIVER GRASS
34
(7) Hoolehua PMC estimated 75/hour; 54,000 slips = 720 hours.
(8) Estimated 1 hour per 500 slips.
COST OF PRODUCTION AND MARKET OPPORTUNITY FOR VETIVER GRASS
35
Direct Costs – Full Production
Notes:
2,200 slips are planted during the year, yielding 110,000 at harvest.
(1) Only 1/6 of an acre is prepped at each cycle. Soil sample will be completed for each 1/6
acre prior to planting. Cost of soil test from CTAHR is $21 with an additional $10 for
shipping/deliver of soil.
(2) Based on HARC estimate: 16‐16‐16 fertilizer: $168/acre; lime: $60/acre; gypsum:
$90/acre.
(3) Hoolehua PMC estimated 2 hours to plant 100 slips by hand.
(4) Hoolehua PMC estimated 8‐10 hours/1100 plants per month.
Frequency: weeding 1x per month per crop. Additional cycles included in case nursery
needs to maintain 3rd plot for 6 months.
(5) Hoolehua PMC estimated 4gallons/plant/watering.
Cost estimate: $2.66/1000 gallons (BOWS published rate).
Frequency: 2 times per week for the 1st month then weekly. Additional cycles included
in case nursery needs to maintain 3rd plot for 6 months.
(6) Hoolehua PMC estimated 5 min to remove each ball; 1100 balls = 92 hours.
(7) Hoolehua PMC estimated 75/hour; 54,000 slips = 720 hours.
(8) Estimated 1 hour per 500 slips.

COST OF PRODUCTION AND MARKET OPPORTUNITY FOR VETIVER GRASS
36
Indirect Costs
Notes:
(1) Estimated at $750 per month.
(2) Employee insurances are included in labor costs.
(3) Estimated $75,000 + 30% employee‐related costs.
Labor wages are included in direct costs.
(4) Estimated $3,600 per acre/per year. (Cost of Mililani Ag Park is $200‐$400 per acre/per
month for 5 acres or less).
(5) Estimated 4% GET and 5% state/fed tax for $500,000 in revenues.
(6) Estimated at $2,000 per month.

COST OF PRODUCTION AND MARKET OPPORTUNITY FOR VETIVER GRASS
37
Unit Sales Analysis
Notes:
Unit contribution margin reflects the amount available to pay for indirect costs.
Cost-Volume-Profit Analysis

COST OF PRODUCTION AND MARKET OPPORTUNITY FOR VETIVER GRASS
38
Cost of Service – Analysis for Installing Vetiver
Installing 200 Linear Feet of Vetiver Plants Per Linear Foot 4
Total Linear Feet for Estimate 200
Total Number of Plants Needed 800
Estimated Days to Install 1
Notes:
(1) Cost to remove plant from nursery is built into growing cost.
(2) Labor to change buckets daily (200 slips per bucket). Five minutes per bucket for 21
days.
(3) Drive and unload time estimated at 30 minutes in each direction/ per person. Location
estimated 15 miles away. Estimated per mile rate at 55 cents.
(4) Time estimated at 50 linear feet per hour; equipment cost is $400 per day; $250 delivery
charge to Kunia.
(5) Time estimated at 50 slips per hour/ per person. Material cost reflects total growing
cost of each vetiver slip.
(6) Time estimated at 20 minutes per 100 feet. Visiting site 3 times per week for 3 weeks.
(7) Estimated 5% plant replacement rate.

COST OF PRODUCTION AND MARKET OPPORTUNITY FOR VETIVER GRASS
39
Installing 1,000 Linear Feet of Vetiver Plants Per Linear Foot 4
Total Linear Feet for Estimate 1,000
Total Number of Plants Needed 4,000
Estimated Days to Install 5
Notes:
(1) Cost to remove plant from nursery is built into growing cost.
(2) Labor to change buckets daily (200 slips per bucket). Five minutes per bucket for 21
days.
(3) Drive and unload time estimated at 30 minutes in each direction/ per person. Location
estimated 15 miles away. Estimated per mile rate at 55 cents.
(4) Time estimated at 50 linear feet per hour; equipment cost is $1150 per week; $250
delivery charge to Kunia.
(5) Time estimated at 50 slips per hour/ per person. Material cost reflects total growing
cost of each vetiver slip.
(6) Time estimated at 20 minutes per 100 feet. Visiting site 3 times per week for 3 weeks.
(7) Estimated 5% plant replacement rate.

COST OF PRODUCTION AND MARKET OPPORTUNITY FOR VETIVER GRASS
40
Installing 2,000 Linear Feet of Vetiver Plants Per Linear Foot 4
Total Linear Feet for Estimate 2,000
Total Number of Plants Needed 8,000
Estimated Days to Install 10
Notes:
(1) Cost to remove plant from nursery is built into growing cost.
(2) Labor to change buckets daily (200 slips per bucket). Five minutes per bucket for 21
days.
(3) Drive and unload time estimated at 30 minutes in each direction/ per person. Location
estimated 15 miles away. Estimated per mile rate at 55 cents.
(4) Time estimated at 50 linear feet per hour; equipment cost is $1150 per week; $250
delivery charge to Kunia.
(5) Time estimated at 50 slips per hour/ per person. Material cost reflects total growing
cost of each vetiver slip.
(6) Time estimated at 20 minutes per 100 feet. Visiting site 3 times per week for 3 weeks.
(7) Estimated 5% plant replacement rate.

COST OF PRODUCTION AND MARKET OPPORTUNITY FOR VETIVER GRASS
41
Installing 4,000 Linear Feet of Vetiver Plants Per Linear Foot 4
Total Linear Feet for Estimate 4,000
Total Number of Plants Needed 16,000
Estimated Days to Install 20
Notes:
(1) Cost to remove plant from nursery is built into growing cost.
(2) Labor to change buckets daily (200 slips per bucket). Five minutes per bucket for 21
days.
(3) Drive and unload time estimated at 30 minutes in each direction/ per person. Location
estimated 15 miles away. Estimated per mile rate at 55 cents.
(4) Time estimated at 50 linear feet per hour; equipment cost is $1150 per week; $250
delivery charge to Kunia.
(5) Time estimated at 50 slips per hour/ per person. Material cost reflects total growing
cost of each vetiver slip.
(6) Time estimated at 20 minutes per 100 feet. Visiting site 3 times per week for 3 weeks.
(7) Estimated 5% plant replacement rate.

COST OF PRODUCTION AND MARKET OPPORTUNITY FOR VETIVER GRASS
42
Solicitation Letter

COST OF PRODUCTION AND MARKET OPPORTUNITY FOR VETIVER GRASS
43
Revised Universal Soil Loss Equation (RUSLE) K Factor RUSLE is a tool to measure rill and interrill (sometimes called “sheet and rill”) erosion on the
landscape. It is a multiplicative formula of R x K x LS x C x P in which R is a Rainfall factor, K is a
soil factor, LS is a slope length and gradient factor, C is a management factor, and P is a practice
factor.
The K‐factor is a soil erodibility is soil erodibility factor which represents both susceptibility of
soil to erosion and the rate of runoff, as measured under the standard unit plot condition. Soils
high in clay have low K values, about 0.05 to 0.15, because they are resistant to detachment.
Coarse textured soils, such as sandy soils, have low K values, about 0.05 to 0.2, because of low
runoff even though these soils are easily detached. Medium textured soils, such as the silt loam
soils, have moderate K values, about 0.25 to 0.4, because they are moderately susceptible to
detachment and they produce moderate runoff. Soils having high silt content are most erodible
of all soils. They are easily detached; tend to crust and produce high rates of runoff. Values of K
for these soils tend to be greater than 0.4.
Organic matter reduces erodibility because it reduces the susceptibility of the soil to
detachment, and it increases infiltration, which reduces runoff and thus erosion. Addition or
accumulation of increased organic matter through management such as incorporation of
manure or additions of mulch is represented in the C‐factor rather than the K Factor.
Extrapolation of the K‐factor nomograph beyond an organic matter of 4% is not recommended
or allowed in RUSLE. In RUSLE, factor K considers the whole soil and factor Kf considers only the
fine‐earth fraction, the material of <2.00mm equivalent diameter. For most soils, Kf = K.
Soil structures affect both susceptibility to detachment and infiltration. Permeability of the soil
profile affects K because it affects runoff.
Although a K‐factor was selected to represent a soil in its natural condition, past management or
misuse of a soil by intensive cropping can increase a soil's erodibility due to sub‐soil exposure on
the surface. The K‐factor may need to be increased if the subsoil is exposed or where the
organic matter has been depleted, the soil's structure is degraded or destroyed, or soil
compaction has reduced permeability. A qualified soil scientist can assist in making this
interpretation.
From Technical Guide to RUSLE use in Michigan, NRCS‐USDA State Office of Michigan. See also,
“Predicting Soil Erosion by Water: A Guide to Conservation Planning With the Revised Universal
Soil Loss Equation (RUSLE)”, USDA ARS Agricultural Handbook Number 703 by K.G. Renard, G.R.
Foster, G.A. Weesies, D.K. McCool, and D.C. Yoder, January 1997.

COST OF PRODUCTION AND MARKET OPPORTUNITY FOR VETIVER GRASS
44
Market Calculations
Government Demand Vetiver Demand on O’ahu, Government A B C B C B C B C B C
Key Customers with identified acreage Acres Formula Linear feet
Yr 1 Mod
Yr 1 candidate plants
Yr 2 Mod
Yr 2 candidate plants
Yr 3 Mod
Yr 3 candidate plants
Yr 4 Mod
Yr 4 candidate plants
Yr 5 Mod
Yr 5 candidate plants
Total 5 year
1 State Department of Health 85.71 17913 2% 1433 4.0% 2866 5.0% 3583 5.0% 3583 5.0% 3583 21.0%
2 US Army ITAM 53000 11077000 0% 0 0.5% 221540 1.0% 443080 1.5% 664620 1.5% 664620 4.5%
3 US Air Force 28000 5852000 0% 0 0.5% 117040 1.0% 234080 2.0% 468160 2.0% 468160 5.5%
4 US Navy 15000 3135000 0% 0 0.5% 62700 0.5% 62700 0.5% 62700 0.5% 62700 2.0%
5 US Marine Corp 2951 616759 0.5% 12335 1.0% 24670 1.5% 37006 2.0% 49341 2.5% 61676 7.5%
6 Hawaii Department of Agriculture 9450 1975050 2.0% 158004 3.0% 237006 4.0% 316008 5.0% 395010 6.0% 474012 20.0%
7 City Parks and Recreation 5000 1045000 0.5% 20900 1.0% 41800 2.0% 83600 2.0% 83600 2.0% 83600 7.5%
8 State Department of Transportation Services 13000 100.0% 13000 200.0% 26000 200.0% 26000 200.0% 26000
205,672 720,623 1,206,056 1,753,013 1,844,351
Key Notes 1 Public lands in the windward O’ahu watershed areas already identified as candidate for restoration. Mod increases reflect increasing acceptance of vetiver. 2 75% > 5% grade, Rehab 5000 acres/yr, vetiver of limited use for range as too tall and seeding method not ideal. Mod reflects low but increasing acceptance. 3 Not currently managing lands like ITAM, but interested. Mod reflects slow start, increasing acceptance. 4 Mostly shipyard thus low likelihood. Mod reflects low and slow acceptance. 5 Managed like ITAM but relatively small acreage. Wetter and more sloped. 6 2700 acres now, but expect 3‐4x that two years so used 3.5x current. Tenants are required to implement conservation plan in 1 year. Mod reflects growing acreage and tenancy. 7 Planned vetiver pilot project. Mod reflects increasing acceptance. 8 No feedback on acre volumes but have data from planned vetiver project. Mod reflects successful vetiver pilot.

COST OF PRODUCTION AND MARKET OPPORTUNITY FOR VETIVER GRASS
45
Large Private Landowner Demand Vetiver Demand on O’ahu, Large Private A B C B C B C B C B C
Key Customers with identified acreage Acres Formula Linear feet
Yr 1 Mod
Yr 1 candidate plants Yr 2 Mod
Yr 2 candidate plants Yr 3 Mod
Yr 3 candidate plants Yr 4 Mod
Yr 4 candidate plants
Yr 5 Mod
Yr 5 candidate plants
Total 5 year
1 Campbell Estate 36200 7565800 0% 0 0.2% 60526 0.5% 151316 0.5% 151316 0.5% 151316 1.7%
2 Kamehameha Schools 50577 10570593 0% 0 0.2% 84565 0.5% 211412 0.5% 211412 0.5% 211412 1.7%
3 Castle & Cooke, Inc. 30648 6405432 0% 0 0.1% 25622 0.1% 25622 0.1% 25622 0.1% 25622 0.4%
4 James Campbell Company 14413 3012317 0% 0 0.1% 12049 0.1% 12049 0.1% 12049 0.1% 12049 0.4%
‐ 182,762 400,399 400,399 400,399
Key Notes 1 In Kunia, 8,300 ag and 5,000 conservation acres. In Kahuku, 1000 ag acres. Mod reflects increasing acceptance of vetiver. 2 Large ag and conservation landholdings. Mod reflects increasing acceptance of vetiver. 3 Actions primarily to comply with NPDES standards and C&C Planning & Permitting. 4 Primarily industrial/commercial, Kapolei, not all developed.

COST OF PRODUCTION AND MARKET OPPORTUNITY FOR VETIVER GRASS
46
Farms Demand Vetiver Demand on O’ahu, Farms
Key Customers with identified acreage Acres Formula Linear feet
Yr 1 Mod
Yr 1 candidate plants
Yr 2 Mod
Yr 2 candidate plants
Yr 3 Mod
Yr 3 candidate plants
Yr 4 Mod
Yr 4 candidate plants
Yr 5 Mod
Yr 5 candidate plants
Total 5 year
1 All O’ahu Farms, USDA 2002 Census 70,705 14,777,345 0.4% 236,438 0.5% 295,547 0.6% 354,656 0.6% 413,766 0.6% 472,875 2.7%
236,438 295,547 354,656 413,766 472,875
Key Notes 1 Mod based on historical recommended linear feet, expected to grow with increased awareness and conservation planner capacity.
Note that the acreage used in the demand calculation only includes that which was determined to be farm land, as opposed to simply agriculturally zoned (3‐4x the farm land number). Using agricultural zoned acreage would, in effect, double‐count a significant number of acres already considered for the Large Private Landowner market.
It is generally assumed that this market will utilize vetiver based on conservation plan fulfillment and include those plans generally eligible for cost share, estimated to fall into two classes of vetiver need: o Small Cooperator: 200‐400 feet o Large Cooperator: 2,000 feet
Historical vetiver recommendations and implementation from NRCS O’ahu
Note that implementation typically lags recommendation and thus the ratio of implementation to recommendation cannot be meaningfully
calculated. Note also the limited number of years that vetiver has been recommended and the high rate of growth in recommendation.
Conservation Plan Project Year Linear feet recommended by conservation plans (O’ahu)
Conservation plan Linear feet implemented (O’ahu)
2007 1,500 500
2008 5,150 1,150
2009 22,000 TBD
Total 28,650 1,650

COST OF PRODUCTION AND MARKET OPPORTUNITY FOR VETIVER GRASS
47
Installation Demand – All Markets O’ahu Installation Demand Estimates
Key Market Mod Year 1 feet Year 2 feet Year 3 feet Year 4 feet Year 5 feet Totals
1 Government 85% 43,705 153,132 256,287 372,515 391,924 1,217,564
2 Large Private Landowner 95% ‐ 43,406 95,095 95,095 95,095 328,091
3 Farms 10% 5,911 7,389 8,866 10,344 11,822 44,332
Totals 49,616 203,927 360,248 477,954 498,841
Key Notes
1 Mod impacted by proclivity to contract services but slightly ameliorated by existence of some capacity to do this themselves.
2 Mod impacted by proclivity to contract services and low capacity to do this themselves.
3 Mod impacted by capacity for implementing vegetative material and generally low financial resources.

COST OF PRODUCTION AND MARKET OPPORTUNITY FOR VETIVER GRASS
48
Research Sources
Publications All photo images obtained with permission from the Vetiver Network International
(www.vetiver.org).
Hawaii Business Magazine, November 2007. Top 20 Wealthiest Landowners.
Hawaii Natural Resource Information System v2.0, College of Tropical Agriculture and Human
Resources, University of Hawaii.
Joy, Robert J. 2009. Plant Guide: ‘Sunshine’ Vetiver Grass. United States Department of
Agriculture, Natural Resources Conservation Service (http://plants.usda.gov/).
Kinoshita, Charles, et al. 2006. Potential for Ethanol Production in Hawaii. Department of
Business, Economic Development and Tourism, State of Hawaii.
Lavelle, Neoma. 2007. Improving Hawaii’s Water Quality: Selecting Sites for Riparian
Restoration in a GIS. Nicholas School of the Environment and Earth Sciences, Duke
University.
O’ahu Soil and Water Conservation Districts. June 2007. The O’ahu Outlook
The Vetiver Network International website. Articles and other reference materials found at
www.vetiver.com
The Vetiver System: A proven solution. Brochure written and published by The Vetiver Network
International.
Truong, Paul, Tran Tan Van, and, Elise Pinners. 2008. Vetiver System Applications Technical
Reference Manual. The Vetiver Network International.
Urban Groundwater Database, 1999
United States Department of Agriculture 2007 Census of Agriculture
Vetiver Grass: A thin green line against erosion. Written by the National Research Council.
Published in 1993 by the National Academy Press, Washington, D.C.
Subject Matter Experts Brokish, Jean, Project Manager, O’ahu Resource Conservation and Development
Char, Marvin, Civil Engineering Branch, Site Development Division, Department of Planning and
Permitting, City and County of Honolulu

COST OF PRODUCTION AND MARKET OPPORTUNITY FOR VETIVER GRASS
49
Dacus, Chris, Landscape Architect, Department of Transportation Services, City and County of
Honolulu
Howland, Mark, Integrated Training Areas Management (ITAM)/Improved Repairable Asset
Management (IRAM), General Dynamics for United States Army
Inouye, Wayne, Permit Issuance Branch, Department of Planning and Permitting, City and
County of Honolulu
Joy, Robert, Plant Materials Specialist, Natural Resources Conservation Service, United States
Department of Agriculture
Kacir, Richard, District Conservationist, Natural Resources Conservation Service, United States
Department of Agriculture
Leong, Russell, Army Corp of Engineers, United States Army
Matsunami, Garret, Engineering and Site Construction, Castle & Cooke
Miller, Kim, Land Ownership Specialist, Hawaii Housing Finance and Development Corporation,
State of Hawaii
Morton, Mawae, Strategic Resources Manager, Land Assets Division, Endowment Group,
Kamehameha Schools
Nakata, Ryan, Department of Transportation Services, City and County of Honolulu
Rice, James, Wastewater Program Manager, United States Army Garrison Hawaii
Sakamoto, Glenn (and staff David Duvauchelle, Keni Reyes, Andres Juario), Manager, Hoolehua
Plant Materials Center, Natural Resources Conservation Service, United States Department of
Agriculture
Santo, Lance, Agronomist/Field Coordinator, Hawaii Agricultural Research Center
Slay, Hudson, Clean Water Branch, Department of Health, State of Hawaii
Smith, Craig, Agronomist, USDA‐NRCS Pacific Islands West.
Takayesu, Gerald, Department of Environmental Services, City and County of Honolulu
Teruya, Randall, Agricultural Asset Manager, Agricultural Resource Management Division,
Hawaii Department of Agriculture, State of Hawaii
Turnbull, Steve, Environmental Branch, Army Corp of Engineers, United States Army
Woll, Jason, Department of Parks and Recreation, City and County of Honolulu

COST OF PRODUCTION AND MARKET OPPORTUNITY FOR VETIVER GRASS
50
Subject Matter Experts - Unresponsive The following were contacted for information but did not provide feedback in time for the
publication of this report. These contacts are listed for the purpose of further illuminating the
scope of the research as well as providing potential sources of further research.
Army Family Housing, United States Army
Bureau of Land Management, United States Department of the Interior
Constantinides, Michael, Forestry and Wildlife Division, Department of Land and Natural
Resources, State of Hawaii
Fish and Wildlife Service, United States Department of the Interior
Forest Service, United States Department of Agriculture
Hirano, Eric, Chief Engineer, Engineering Division, Department of Land and Natural Resources,
State of Hawaii
James Campbell Company, Hawaii
Land Division, Department of Planning and Permitting, City and County of Honolulu
Land Management Division, Land Management Branch, Department of Hawaiian Homelands,
State of Hawaii
Mansker, Michelle, Department of Public Works, United States Army
National Park Service, United States Department of the Interior
Penn, David, Total Maximum Daily Load (TMDL) Coordinator, Environmental Planning Office,
State of Hawaii
Road Maintenance Division, Department of Transportation Services, City and County of
Honolulu (indicated not applicable)
Urban Forestry, Department of Parks and Recreation, City and County of Honolulu
Watts, Kimberly, Director, Sustainable Ranges Program, United States Army Environmental
Command