Embed Size (px)
Citation preview

Functional Foods in Health and Disease 2013; 3(7):291-307 Page 291 of 306
Review Article Open Access
Cost-Effectiveness Analysis for the Treatment of Chronic Kidney Disease
with Low-Protein Diet
FS Mennini1,2
, S Russo1,3
, A Marcellusi1,4
, F. Palazzo6, P Quintaliani
5
1CEIS– Economic Evaluation and HTA - EEHTA), Faculty of Economics, University of
Rome “Tor Vergata”, Italy, 2Department of Accounting and Finance at Kingston University,
London, UK, 3INAIL, Department of Occupational Medicine, formerly ISPESL,
4Department
of Statistics, University of Rome “La Sapienza”, Italy, 5Departments of Nephrology Dialysis
and Cardiology, Silvestrini Hospital, Perugia, Italy, 6National Research centre (CNR), Rome,
Italy.
Corresponding Author: Francisco Mennini, CEIS– Economic Evaluation and HTA -
EEHTA), Faculty of Economics, University of Rome “Tor Vergata”, Italy; Department of
Accounting and Finance at Kingston University, London, UK
Submission date: April 27, 2013 ; Acceptance date: July 3, 2013 ; Publication date: July 7,
2013
ABSTRACT:
Background: Several clinical studies have shown that a low protein diet in patients with
Chronic Kidney Disease (CKD), delays and prevents the natural progression of the end stage
renal disease (ESRD) and the necessary treatment of renal dialysis. Studies to investigate the
effects of the low protein diets in preventing severe kidney failure are few for Italy. The aim
of this study is to estimate the cost-effectiveness of a low protein diet treatment compared
with no dietary treatment in patients with CKD 4-5 after 2, 3, 5 and 10 years.
Methods: A Markov model simulating was developed to estimate costs and QALYs
associated with low protein treatment and no treatment for patients with CKD 4-5. The
prevalence of patients with CKD 4-5 refers to a population aged ≥40 years old was 0.3%
estimated by a study of Gambaro et al. on the 2010. The transition probability was estimated
on data from seven studies identified by a Cochrane review to determine the efficacy of low
protein diets in delaying the need to start maintenance dialysis. The Quality Adjusted Life
Years (QALYs) scores used were estimated with the Time Trade Off by a study of
Gorodetskaya et al. in 2005. The costs of dialysis have been estimated by a study of Censis
(2009) and amounted to approximately €34,071.7 per patient per year. The costs of a low-
protein diet refer to contributions of €1,440 per patient per year made by Lazio Region for
patients that use a low-protein diet.
Main Results / Conclusion: The treatment with a low-protein diet is more effective in terms
of QALYs: the difference is always in favour of dietary treatment from a 0.09 after the first
two years, 0.17 after three years, 0.37 after five years and up to a differential of 1 year after
the first 10 years of treatment. In terms of cost-effectiveness, the dietary treatment is always

Functional Foods in Health and Disease 2013; 3(7):291-307 Page 292 of 306
dominant in all the intervals considered. The dominance is due to the fact that the treatment is
more effective in terms of QALYs and at the same time is less expensive. The results of these
simulations indicate that the treatment of patients with CKD with a low protein diet is cost
effective relative to no treatment in an Italian setting.
INTRODUCTION:
In recent years, chronic kidney disease has received increased attention as a leading public
health problem[1]
. The kidney disease burden, measured in terms of prevalence, associated
economic costs, and morbidity, is substantial and increasing [2, 3]
. In Italy people affected by
CRF (chronic renal failure) (Glomerular Filtration Rate (GFR) < 60 mil/min per 1.73 m2 of
BSA[4]
) represent about 6% of population[5,
6,
7]
The prevalence of individuals with chronic kidney disease (CKD) at less severe stages
(1-5 DOQI) has been estimated ranging from 13% to 9% of the adult population worldwide
and the number is growing[8,
9, 10]
. This trend poses major challenges to health care
systems[11]
, reflecting the greater health care use and more comorbid conditions among
elderly adults[12]
.
The end-stage renal disease (ESRD) for which life can be sustained only with renal
replacement therapy such as dialysis or kidney transplantation is growing and in Italy the last
report from RIDT (Italian registry of dialysis and transplant) show the incidence is about 160
parts-per-million (ppm) and prevalence is about 788 ppm[13]
. It means that in Italy we have
about 40,000 persons in ESRD treatment.
Cardiovascular mortality in patients with ESRD is 10- to 20- fold higher than in the
general population and is the leading cause of death[14,
15]
. Mortality rates for patients with
ESRD have shown only modest improvement over the past 2 decades[16]
.
For these reasons it is necessary to reduce not only the incidence of patients in ESRD
but also the complications linked to CKD Moranne[17]
which some years ago showed that
“Early detection of CKD and its metabolic complications is now a priority for delaying
disease progression and for primary prevention of many CKD-associated chronic diseases,
including cardiovascular, mineral, and bone diseases”.
It is now commonly agreed that the presence of CKD identifies a higher risk state not
only for the general population but overall in the elderly population, with an increased risk
for multiple adverse outcomes, including kidney failure, cardiovascular disease, cognitive
impairment, and death[18]
.
In other words, there are many metabolic complications and it is necessary to treat
them as soon as possible, in general, in class DOQI 3 or in any case when GFR is under 45
mil/min.
One of the most useful tools is the nutritional treatment Extensive studies in animals
and preliminary studies in humans suggest that progression of a variety of chronic kidney
diseases (CKD) may be largely due to secondary hemodynamic and metabolic factors, rather
than the activity of the underlying disorder[19]
.
In a variety of animal models (such as subtotal nephrectomy and diabetic nephropathy),
lowering protein intake protects against the development of glomerular scarring[20]
. Dietary
protein restriction may also be beneficial by exerting non-haemodynamic effects[21,
22,
23]
.
Multiple well-designed randomized controlled human trials have evaluated both the
efficacy and safety of protein restriction in patients with progressive CKD[24]
. Moderate

Functional Foods in Health and Disease 2013; 3(7):291-307 Page 293 of 306
protein restriction (0.6 to 0.8 g/kg per day) is associated with significant benefit of protein
restriction in delaying renal dialysis[25, 26, 27]
. It is generally well tolerated and does not lead to
malnutrition in patients with CKD providing caloric goals are met, dietary protein is of high
biologic value, and metabolic acidosis is avoided [28]
.
For CKD stage 3, low protein, low phosphorus diets may retard dialysis[29]
. A diet
providing about 0.60–0.75 g protein/kg/day, of which at least 0.35 g/kg/day is high biologic
value protein, is needed to ensure a sufficient intake of the essential amino acids.
For CKD stage 4 and 5, the potential advantages of using a low-protein, low-
phosphorus diet are more compelling. A low protein diet will generate less nitrogenous
compounds that are potentially toxic both systemically and to the kidney itself. In addition, it
generally contains less phosphorus and potassium, reductions which are usually imperative at
this advanced stage of renal failure.
Not all individuals with chronic renal disease are willing and able to adhere to diets
providing 0.60 g protein/kg/day or a very low protein diets. For this reason it is necessary to
have a very close follow-up and nutrition counselling by a registered dietician at least 3-4
times a year.
Nutritional studies in patients with CKD suggest that protein intake can be safely
lowered to 0.6 g/kg per day but an adequate caloric intake must be maintained (35 kcal/kg
IBW) and at least 60 percent of the ingested protein must be of high biologic value or contain
a high percentage of essential amino acids[30]
.
The K/DOQI Clinical Practice Guidelines currently recommend that the energy intake
for non-dialysed patients with advanced CKD (GFR 25 mL/minute) and for patients on
maintenance dialysis should be 35 kcal/kg/day for individuals who are less than 60 years of
age and 30–35 kcal/kg/day for those who are 60 years of age or older, who are usually more
sedentary[31]
. The same energy intakes are recommended for people with stage 3 or 4 CKD
(i.e.GFR 60 mL/ minute/1.73 m2).
Nutritional treatment is able to reduce many others metabolic complications as
cardiovascular, mineral, and bone diseases reducing salt and especially phosphorous.
Furthermore, the nutritional treatment, is able to ensure high caloric intake to older people to
reduce or invert malnutrition that, in this class of people, is mainly due to low caloric intake
rather to low protein intake[32]
.
The aim of this study is to estimate the cost-effectiveness of a low protein diet
treatment compared with no dietary treatment in patients with CKD 4-5 after 2, 3, 5 and 10
years.
METHODS:
Model: The analysis was performed by developing a Markov model simulating the clinical
pathway of patients with chronic kidney disease.
The model provides the possibility of being treated according to two different
approaches: with a low-protein diet and with a non-low-protein diet. In our simulation, we
assumed that half the prevalent patients in Italy are treated with a low-protein diet and the
other half without any dietary changes.
Over the years, the clinical pathway of each patient may have one of three possible
outcomes: death, end-stage kidney disease requiring dialysis and chronic kidney disease
(CKD) not requiring dialysis.

Functional Foods in Health and Disease 2013; 3(7):291-307 Page 294 of 306
The model provides that, at the end of each year considered in the analysis, deaths or
patients with ESKD/on dialysis remain in the absorbing state until the end of the simulation
or death (in the case of dialysed patients). Subjects who do not undergo any event remain in
the chronic kidney disease state, maintaining their quality of life until the end of the follow-
up period.
Figure 1. Markov model structure
Epidemiological data: In order to extrapolate the relevant national epidemiological data, a
literature review was conducted using the most important international search engines
(PUBMED, Cochrane Library). The study conducted by Gambaro et al. in 2010[7]
estimates
the prevalence of patients with CKD grade 4 aged 40 over 0.3% of the population of
northeast Italy (Table I).
Table I. Demographic parameters
Demographic Data Base Case Min Max Absolute values Source
General population of
ITALY 60,626,442 ISTAT
Population over 40 55.60%
33,708,302 ISTAT
Prevalence in Italy of
CKD (CKD 4) in
subjects aged 40 and
over
0.30% 0.15% 0.45% 101,125 Gambaro et al. 2010
Patients receiving
dietary treatment 50.00% 40.00% 60.00% 50,562 ASSUMPTION
Source: Gambaro et al. 2010 [Error! Bookmark not defined.], Istat[33]
In the simulation we presumed that the number of patients treated with a low-protein
diet was the same as that of patients receiving no dietary treatment. This allows a more
immediate comparison between the two treatment arms in terms of the patients requiring
dialysis, quality-adjusted life years (QALY) estimate and in terms of the cost of treatments
during the time intervals considered.
Model probability estimate: The probabilities were obtained using the data presented in the
study by Foque and Laville (Cochrane) in 2009 [26]
and pro-rated on the basis of the study
conducted by De Nicola in 2011 [34]
. The purpose of the Cochrane review was to determine
the effectiveness of a low-protein diet in delaying end-stage renal disease and the consequent

Functional Foods in Health and Disease 2013; 3(7):291-307 Page 295 of 306
need for dialysis. To do so, 40 studies were examined, of which just 10 found suitable in
terms of the data required to build a quantitative estimate of the effectiveness of low-protein
diet in delaying end-stage kidney disease. Overall, the data for 2,000 patients was considered,
of whom 1,000 had been treated with a low-protein diet and 1,000 with a higher protein
intake.
In this analysis, a further selection was made and of the ten studies identified in the
Cochrane review only seven possessed the requisites that suited our purpose. Three studies
(Rosman 1989 [35]
, Locatelli 1991 [36]
, Klahr 1994 [37]
) were based on a patient population
with grade 3 – 5 CKD. Consequently, the number of observed patients considered in our
estimates dropped to 702, of whom 351 were treated with a low-protein diet and the same
number with a normal protein intake. As shown in Table II, the diets of the patients
considered vary for the different studies. The analysis conducted by Mirescu et al. in 2007 [38]
considered a diet with a protein intake of 0.3g/kg/day for patients receiving dietary treatment
and 0.6g/kg/die for those who received no dietary treatment. In the analysis conducted by
Williams et al. in 1991 [39]
patients were treated with diets with protein intakes of 0.6
g/kg/day and 0.8 g/kg/day. The duration of the follow-up observation also varied from one
study to another, from a minimum of 12 months for the study conducted by Junger et al. in
1987 [40]
to a maximum of 24 months for the study by Di Iorio et al. in 2003 [41]
. For this
reason, the probabilities were standardised according to the duration of the follow-up period
in the individual studies (Table II).
Table II. Type of diet, follow-up and patients observed per study, probability of end-stage
renal disease (ESRD) or death, as total values and standardized at 1 month and 12 months for
each study.
Study
Type
of
low-
protei
n diet
g/kg/d
Type
of
non-
low-
protei
n diet
g/kg/d
Follow-
up
(months
)
Patient
s on a
low-
protein
diet
Patient
s with
ESRD
or dead
Patient
s not
on a
low-
protein
diet
Patient
s not
on a
diet
with
ESRD
or dead
Probabilit
y of
ESRD or
death for
patients
on a diet
Probabilit
y of
ESRD or
death for
patients
not on a
diet
ESRD/
mortalit
y rate
for
patients
on a diet
for 1
year
ESRD/
mortalit
y rate
for
patients
not on a
diet for
1 year
Probabilit
y of
ESRD or
death for
patients
on a diet
for one
year
Probabilit
y of
ESRD or
death for
patients
not on a
diet for
one year
Cianciaruso
2008 0.55 0.8 6-18 212 9 211 13 0.04 0.06 0.04 0.06 0.04 0.06
Di Iorio 2003 0.3 0.6 24 10 2 10 7 0.2 0.7 0.11 0.60 0.11 0.45
Ihle 1989 0.4 0.75 18 34 4 38 13 0.12 0.34 0.08 0.28 0.08 0.24
Jungers 1987 0.4 0.6 12 10 5 9 7 0.5 0.78 0.69 1.50 0.50 0.78
Malvy 1999 0.3 0.65 18 25 11 25 17 0.44 0.68 0.39 0.76 0.32 0.53
Mirescu 2007 0.3 0.6 15 27 1 26 7 0.04 0.27 0.03 0.25 0.03 0.22
Williams 1991 0.6 0.8 18 33 12 32 11 0.36 0.34 0.30 0.28 0.26 0.24
Mean/Total 0.4 0.7 17.5 351 44 351 75
Source: Foque and Laville (Cochrane) 2009 [26]
Table II also shows the data from the seven studies considered with regard to the
probabilities and duration of follow-up-adjusted probabilities of observing the end-stage renal
disease (ESRD) event or death for patients receiving/not receiving dietary treatment. The
probabilities were adjusted by calculating for each one the respective annual rate from which
we then obtained the annual probabilities [42-43]
. Specifically the annual mortality or ESRD
rate was calculated using the following formula:
tPr /1ln

Functional Foods in Health and Disease 2013; 3(7):291-307 Page 296 of 306
Where P is the probability of the individual study considered and t is the amplitude of
the range, expressed in years, that the probability considered refers to.
Lastly, relative probability at one year was calculated as follows:
rtp exp1
Where r is the annual mortality or ESRD rate and t is the amplitude of the range,
expressed in years, that the probability refers to and that, in our case, will be equal to 1.
Since the probabilities were standardised in relation to time, they could be grouped together
in a single indicator by calculating the weighted mean for the respective arms. In the
estimate, it was established that the weights associated with the individual values
corresponded to the sample size of the respective studies considered. By doing so, we
eliminated the potential bias produced by the different sizes of the populations analysed in the
studies.
The values obtained jointly represent the risk of experiencing the end-stage renal
disease event or death. However, the model used makes it possible to split this probability
between the two events. It was therefore necessary to estimate the weight of the two events
within this probability. The respective weights of the two events on combined probability
were estimated using the data of the study conducted by De Nicola et al. [34]
in 2011 that
estimated the probability of observing the end-stage renal death event and, separately, the
death event, on a group of patients with chronic kidney disease grade 3-5 (Table IV). Lastly,
the probability of death in patients undergoing dialysis was obtained from a study by De
Nicola et al. in 2010 [44]
. Table IV shows the transition probabilities used in the Markov
model.
Table II. Breakdown of the probability of death and end-stage renal disease for patients with
CKD.
Conte et al. 2011 Percentage
Dialysis split 8.30% 58.5%
Death split 5.90% 41.5%
14.20% 100.0%
Source: De Nicola et al. 2011 [44]
Table III. Transition probabilities used in the Markov model
Weighted probabilities for the LOW-PROTEIN DIET arm
Base case Minimum Maximum
Absolute values at 1
year
Low-protein diet → low-protein diet 90.05% 97.03% 50.00% 45,531
Low-protein diet → Haemodialysis 5.82% 1.74% 29.23% 2,941
Low-protein diet → Death 4.13% 1.24% 20.77% 2,090
Total death and ESRD 9.95% 2.97% 50.00% 5,031
Probability of death and DIALYSIS 10.00% 8.00% 12.00% 294
Weighted probabilities for the NO TREATMENT arm
Base case Minimum Maximum
Absolute values at 1
year
No treatment → No treatment 82.66% 93.84% 22.22% 41,796
No treatment → Haemodialysis 10.13% 3.60% 45.46% 5,124
No treatment → Death 7.20% 2.56% 32.32% 3,642
Total death and ESRD 17.34% 6.16% 77.78% 8,766
Probability of death and DIALYSIS 10.00% 8.00% 12.00% 512
Source: Foque and Laville (Cochrane) 2009 [26], De Nicola et al. 2011 [34], De Nicola et al. 2010 [44]

Functional Foods in Health and Disease 2013; 3(7):291-307 Page 297 of 306
Model utility estimate: Since the methodology involves the use of cost utility analysis
(CUA), it was necessary to estimate the utility values. The scores used were extrapolated
from the study by Gorodetskaya et al. in 2005 [45]
. In this study, the authors consider a cohort
of 205 USA patients with a mean age of 62.8±12.7 years and a gender composition with 52%
of female patients. Various estimates were obtained by administering various questionnaires,
such as: Kidney Disease Quality of Life Short Form 36 (KDQOL-36TM), Health Utilities
Index (HUI)-3 and Time-Trade-Off (TTO). In our model, we used utilities estimated using
the Time-Trade-Off approach. In particular, the utilities of patients with CKD 4 or 5,
corresponding to 115 subjects, were observed and calculated from two to eight times in the
subsequent two years. Table V shows the scores considered.
Table IV. Utilities estimated using Time-Trade-Off. Gorodetskaya et al. 2005
Utility Base Case Min Max
CKD4 = GFR 30-60 0.850 0.833 0.867
Haemodialysis 0.72 0.713 0.727
Model cost estimate: The costs of dialysis that we considered, were estimated by the study
processed by Censis “Renal replacement therapy in Italy” in 2009 [46]
. The estimate was
performed on the basis of two main categories: medical direct costs (all the monetary costs
generated directly by dialysis treatment) and non-medical direct costs (all those costs that
make treatment possible but that are not directly generated by it). Indeed, the costs were
estimated on the analysis of 400,000 procedures provided in 2007 by 14 centres in the four
regions considered. The basic estimate for each item was conducted per unit cost of the
dialysis procedure belonging to the “diet phase” only (costs associated with the therapy
“start-up phase” were not considered). In our model, for dialysis procedure we only
considered haemodialysis as this was the treatment provided in the vast majority of cases. On
average, the medical direct cost of a haemodialysis session comes to €166.42, the non-
medical direct costs to €51.39.
When these items are added together, each haemodialysis session has a cost of €217.81
and considering that a patient has three sessions a week, the cost per week of treatment is
€653.43. Overall, the estimated annual cost per patient of haemodialysis comes to €34,072.
For the costs of the low-protein was assumed a public payer perspective, so the diet
cost of the low-protein diet refer to the reimbursement paid in the Lazio region for patients
with chronic kidney disease on a low-protein diet, pursuant to Regional Government
Resolution no.103 of 19 February 2010, of €120 a month per person [47]
. Considering the
financial contribution provided and not the cost associated with treatment incurred by the
individual patient, reference is made to the “real” direct cost incurred by the health service, in
line with the study’s perspective. More specifically, the products for which reimbursement is
paid are: bread, pasta, flour, rusks, sliced bread, biscuits and other low-protein products
indicated on the diet. We consider this figure as inclusive of the costs of the specialist
nephrology and dietology appointments attended by the patient.
Economic and statistical analysis: The cost results are indicated as the total sum of the costs
attributed to each patient undergoing each of the different treatments (cost in €). The

Functional Foods in Health and Disease 2013; 3(7):291-307 Page 298 of 306
effectiveness results are expressed in terms of QALY lived by patients in the model’s
lifecycle.
The comparison in terms of cost-effectiveness (the cost of one incremental unit of
effectiveness) between the different treatment sequences is expressed as the Incremental
Cost-Effectiveness Ratio (ICER). The ratio is the result of the differences in cost between the
two treatment arms compared divided by the difference in effectiveness of the same
treatments:
BA
BA
EE
CCICER
Using this ratio, we can observe the cost-effectiveness of the low-protein diet treatment
compared to no treatment of CKD in non-dialysed patients.
RESULTS:
Cost and effectiveness results: By assuming an equal split between dietary treatment and no
dietary treatment of prevalent patients in Italy today, Figure 2-a shows how many patients,
according to our model, require dialysis treatment after 2, 3, 5 and 10 years for the two
different arm. In all the ranges considered, we can always observe a fairly significant
difference between the numbers of patients on dialysis for the two types of dietary treatment.
The gap between the two groups of dialysed patients tends to close over time as the clinical
programme is based on the assumption that, sooner or later, all patients with CKD require
dialysis treatment, unless they die beforehand for other causes. Indeed we can observe a
reduction in the gap from about 40% after two years of observation to approximately 18%
after 10 years, corresponding, in absolute terms, to a difference of just over 3,500 patients
after two years and approximately 2,500 patients after 10 years’ treatment.
Figure 2-b shows the total costs (calculated as the sum of the total costs associated with
dietary treatment, for the arm allocated this treatment and the medical and non-medical direct
costs for haemodialysis treatment) in different time intervals, diversified for the two
treatment arms. In total, the costs amount to approximately 880 million euros in the second
year, before almost doubling in the third year (1.5 billion euros), reaching 3.2 billion at five
years and 7.7 billion at the end of the tenth year. More specifically, in all the intervals
considered, the arm of patients not receiving low-protein dietary treatment shows an
increasing weight on total expenditure, increasing from 54% after two years to about 55%
after ten years. In absolute terms, there is an increase in the difference in costs between the
two arms of approximately 70 million euros in the second year to 828 million in the tenth
year.
We then compared the total costs produced between the basic assumptions of treatment
with a low-protein diet of 50% of CKD patients with the assumption that 90% of patients are
treated with a low-protein diet (40% increase). The increasing number of dialysis sessions
avoided thanks to treatment by low-protein diet entails increasingly significant savings over
the years as shown in Figure 2-c. This means that subjecting a further 40% of patients to low-
protein dietary treatment, would involve a saving that for each range more than doubles the
savings obtained in the previous period. After two years, the savings amount to 56 million
euros before more than doubling after three years’ observation (131 million euros), they reach
311 million euros at the end of the first five years and, lastly, at the tenth year, we obtain
savings of approximately 662 million Euros, almost 12 times the estimated savings for the
second year.

Functional Foods in Health and Disease 2013; 3(7):291-307 Page 299 of 306
a- Patients on dialysis per treatment type at 2, 3,
5 and 10 years.
b- Total costs of dietary treatment and medical
and non-medical direct costs of dialysis at 2, 3,
5 and 10 years. Percentage breakdown by type
of dietary treatment.
c- Difference in the costs of dietary treatment and medical and non-medical direct costs of dialysis
between low-protein dietary treatment for 50% vs. 90% of patients.
Figure 2 (a, b, c). Cost and Effectiveness results.
Cost-effectiveness results: As was predicted, by examining the results of the cost-
effectiveness analysis, treatment with a low-protein diet appears to be more efficacious in
terms of years of good overall quality of life in all the time intervals considered. The
difference in terms of QALY is always in favour of the dietary treatment, starting from 0.09
after the first two years, before doubling and quadruplicating after 3 (0.17) and 5 years (0.37),
up to a difference of one year (1.02) lived healthy after the first 10 years of treatment (Table
VII).
The same situation is also observed for average costs per patient: In all cases the
treatment is in favor of the low-protein treatment and after two years the gap amounts to
€1,400, before more than doubling (€3,256) and quadruplicating (€7,692) in the subsequent
intervals to reach a gap of €16,380 after ten years.
In terms of cost-effectiveness, we find that the low-protein dietary treatment is always
dominant in all the intervals considered and regardless of whether all the cost items are
included in the calculation. Dominance is due to the fact that the treatment is more effective
in terms of years of good quality of life gained and is, at the same time, less expensive.
2 years 3 years 5 years 10 years
8.847
11.463
14.282 13.946
5.295
7.150
9.658
11.421
No treatment Diet
-40,2%-37,6%
-32,4%
-18,1%
2 years 3 years 5 years 10 years
No treatment Diet
€ 881.201.649€ 1.568.549.165
€ 3.217.750.939
54,0%55,2%
56,0%
55,2%
55,3%
€ 7.757.560.923
-€ 56.643.549-€ 131.686.297
-€ 311.133.646
-€ 662.569.050
2 years 3 years 5 years 10 years

Functional Foods in Health and Disease 2013; 3(7):291-307 Page 300 of 306
Table V. Cost-effectiveness analysis for low-protein diet vs. no dietary treatment. Mean
values per patient at 2, 3, 5 and 10 years.
2 years
Cost QALY Incremental QALY Incremental COST ICER
No diet € 9,414 1.48
diet € 8,014 1.57 0.09 -€ 1,400 DOMINANT
3 years
Cost QALY Incremental QALY Incremental COST ICER
No diet € 17,139 2.13
diet € 13,883 2.29 0.17 -€ 3,256 DOMINANT
5 years
Cost QALY Incremental QALY Incremental COST ICER
No diet € 35,665 3.24
diet € 27,974 3.62 0.37 -€ 7,692 DOMINANT
10 years
Cost QALY Incremental QALY Incremental COST ICER
No diet € 84,903 5.24
diet € 68,523 6.26 1.02 -€ 16,380 DOMINANT
Sensitivity analysis: The Figure 3 shows the different ICER obtained from the
variation of the individual parameters of the model. For each parameter was considered a
lower scenario and an higher scenario. The deterministic sensitivity analysis (Figure 3)
shows a substantial robustness of the model's results since the ICER value shows a
dominance of the low protein diet after three years, in all the ten variations considered, except
for one. In fact, by using the study transition probabilities, out of the seven being considered,
with the lowest mortality and renal mortality values (Mirescu 2007)[38]
for both arms of
treatment (consequently with a greater probability to remain in a kidney failure condition),
ICER reaches a value of about €8,800 for QALY gained (with a 45% increase versus the base
case value of -€19,298), significantly below the threshold of €40,000. Conversely, by using
the study transition probabilities with the highest mortality and renal mortality values
(Jungers 1987)[40]
, ICER is clearly dominant with a -€31,800 value (equal to a 65% decrease
versus the base case value).
A significant ICER variation occurs when the dialysis costs change: with a 20%
increase in costs, we see a decrease in ICER and by contrast, with a 20% decrease in costs,
ICER is higher and in both cases it can be quantified as a variation of about 41% of the
values obtained in the base case (with ICER equal to -€11,270 in the cost reduction scenario
and -€27,326 in the cost increase scenario). A less substantial variation, but still significant, is
observed in the costs of the diet. In contrast with the results of the dialysis cost analysis, a
20% increase in the treatment costs shows an increase of the ICER value by about 21%
versus the base case value, whereas we see a 20% reduction of the ICER value when we
reduce by 20% the costs of the low protein treatment.
The variations in the other parameters of the model (±20% probability of death in
patients treated with dialysis, and patient utility associated with the different degrees of the
disease ±10%) do not involve a significant variation of the ICER.

Functional Foods in Health and Disease 2013; 3(7):291-307 Page 301 of 306
Figure 3. Radar Chart and Sensitivity analysis on the ICER value
The probabilistic sensitivity analysis confirms again the robustness of the model's
results. Figure 4 shows that after one year, 82.8% of the simulations produce an ICER value
below the willingness to pay of €10,000. After 3 years, 100% of the simulations determines
an ICER value below € 10,000 and almost always dominant. After five and ten years, the low
protein treatment continues to be dominant.
Cost Effectiveness Plan – 1 anno Cost Effectiveness Plan – 3anni
Cost Effectiveness Plan – 5anni Cost Effectiveness Plan – 10anni
Figure 4. Probabilistic sensitivity analysis on the ICER value. Values at 1, 3, 5, 10 years
-€ 35.000
-€ 30.000
-€ 25.000
-€ 20.000
-€ 15.000
-€ 10.000
-€ 5.000
€ 0
€ 5.000
€ 10.000
Base Case
Variat. of transition probability Lowerscenario (Mirescu)
Variat. of transition probability Higherscenario (Jungers)
Variat. of death probability in patientsunder dialysis Lower scenario -20%
Variat. of death probability in patientsunder dialysis Higher scenario +20%
Utility variation Lower scenario -10%Utility variation Higher scenario +10%
Variat. in dialysis cost Lower scenario -20%
Variat. in dialysis cost Higher scenario+20%
Variat. in diet cost Lower scenario -20%
Variat. in diet cost Higher scenario+20%
Functional Foods in Health and Disease 2013; 3(7):291-307 Page 302 of 306
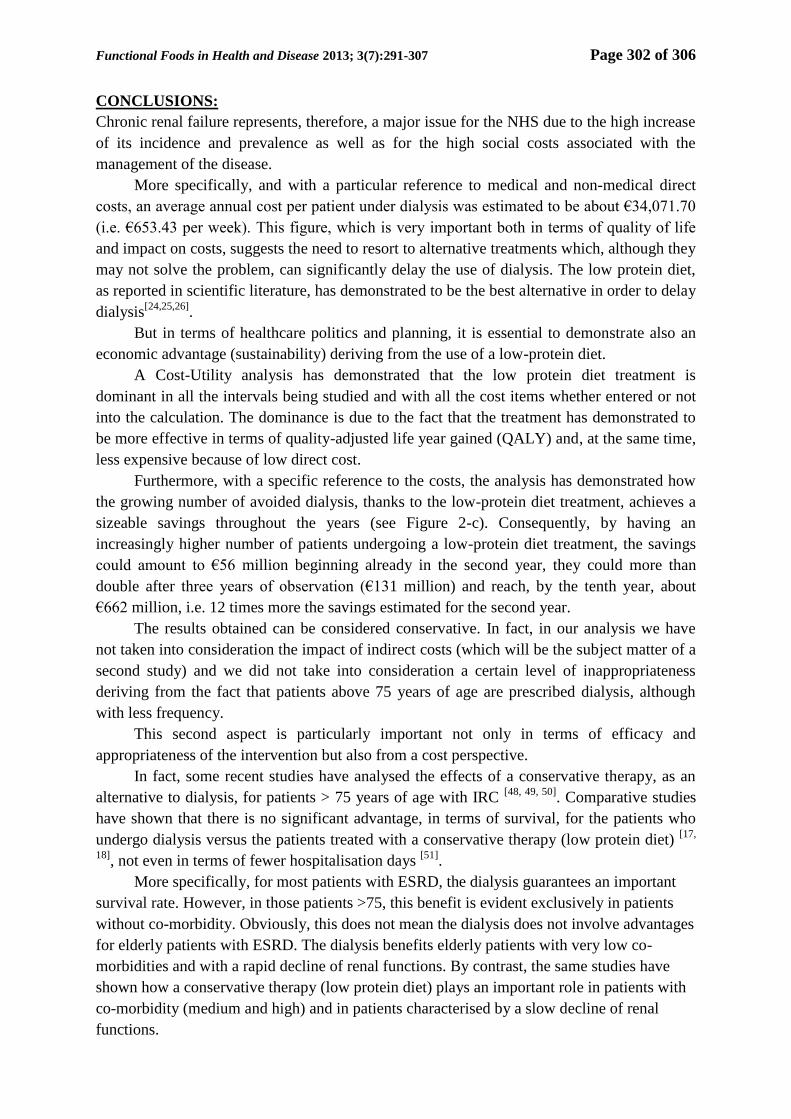
CONCLUSIONS:
Chronic renal failure represents, therefore, a major issue for the NHS due to the high increase
of its incidence and prevalence as well as for the high social costs associated with the
management of the disease.
More specifically, and with a particular reference to medical and non-medical direct
costs, an average annual cost per patient under dialysis was estimated to be about €34,071.70
(i.e. €653.43 per week). This figure, which is very important both in terms of quality of life
and impact on costs, suggests the need to resort to alternative treatments which, although they
may not solve the problem, can significantly delay the use of dialysis. The low protein diet,
as reported in scientific literature, has demonstrated to be the best alternative in order to delay
dialysis[24,25,26]
.
But in terms of healthcare politics and planning, it is essential to demonstrate also an
economic advantage (sustainability) deriving from the use of a low-protein diet.
A Cost-Utility analysis has demonstrated that the low protein diet treatment is
dominant in all the intervals being studied and with all the cost items whether entered or not
into the calculation. The dominance is due to the fact that the treatment has demonstrated to
be more effective in terms of quality-adjusted life year gained (QALY) and, at the same time,
less expensive because of low direct cost.
Furthermore, with a specific reference to the costs, the analysis has demonstrated how
the growing number of avoided dialysis, thanks to the low-protein diet treatment, achieves a
sizeable savings throughout the years (see Figure 2-c). Consequently, by having an
increasingly higher number of patients undergoing a low-protein diet treatment, the savings
could amount to €56 million beginning already in the second year, they could more than
double after three years of observation (€131 million) and reach, by the tenth year, about
€662 million, i.e. 12 times more the savings estimated for the second year.
The results obtained can be considered conservative. In fact, in our analysis we have
not taken into consideration the impact of indirect costs (which will be the subject matter of a
second study) and we did not take into consideration a certain level of inappropriateness
deriving from the fact that patients above 75 years of age are prescribed dialysis, although
with less frequency.
This second aspect is particularly important not only in terms of efficacy and
appropriateness of the intervention but also from a cost perspective.
In fact, some recent studies have analysed the effects of a conservative therapy, as an
alternative to dialysis, for patients > 75 years of age with IRC [48, 49, 50]
. Comparative studies
have shown that there is no significant advantage, in terms of survival, for the patients who
undergo dialysis versus the patients treated with a conservative therapy (low protein diet) [17,
18], not even in terms of fewer hospitalisation days
[51].
More specifically, for most patients with ESRD, the dialysis guarantees an important
survival rate. However, in those patients >75, this benefit is evident exclusively in patients
without co-morbidity. Obviously, this does not mean the dialysis does not involve advantages
for elderly patients with ESRD. The dialysis benefits elderly patients with very low co-
morbidities and with a rapid decline of renal functions. By contrast, the same studies have
shown how a conservative therapy (low protein diet) plays an important role in patients with
co-morbidity (medium and high) and in patients characterised by a slow decline of renal
functions.

Functional Foods in Health and Disease 2013; 3(7):291-307 Page 303 of 306
Data in the scientific literature, in reference to patients > 75 years, suggests that the
conservative treatment (low protein diet) can certainly represent, for this sub-population, a
major advantage in terms of QoL together with a savings in resources for the NHS.
Figure 3.Risk of death per age group and GFR. Reviewed by [52]
: O'Hare et al 2006[53]
REFERENCES:
1. Go AS, Chertow GM, Fan D, McCulloch CE, Hsu CY: Chronic kidney disease and
the risks of death, cardiovascular events, and hospitalization. N Engl J Med 2004,
351(13):1296-1305
2. Meguid El Nahas A, Bello AK: Chronic kidney disease: the global challenge. Lancet
2005, 365(9456):331-340.
3. Vanholder R: Chronic kidney disease in adults--UK guidelines for identification,
management and referral. Nephrol Dial Transplant 2006, 21(7):1776-1777
4. National Kidney Foundation SG: K/DOQI clinical practice guidelines for chronic
kidney disease: evaluation, classification, and stratification. Am J Kidney Dis 2002,
39(2 Suppl 1):S1-266
5. Minutolo R, De Nicola L, Mazzaglia G, Postorino M, Cricelli C, Mantovani LG,
Conte G, Cianciaruso B: Detection and awareness of moderate to advanced CKD by
primary care practitioners: a cross-sectional study from Italy. Am J Kidney Dis 2008,
52(3):444-453
6. Ravera M, Noberasco G, Weiss U, Re M, Gallina AM, Filippi A, Cannavo R, Ravera
G, Cricelli C, Deferrari G. CKD awareness and blood pressure control in the primary
care hypertensive population. Am J Kidney Dis. 2011;57:71–77.
7. Gambaro G, Yabarek T, Graziani MS, Gemelli A, Abaterusso C, Frigo AC,
Marchionna N, Citron L, Bonfante L, Grigoletto F, Tata S, Ferraro PM, Legnaro A,
Meneghel G, Conz P, Rizzotti P, D'Angelo A, Lupo A; INCIPE
StudyGroup.Prevalence of CKD in northeasternItaly: results of the INCIPE study and
comparison with NHANES. Clin J Am SocNephrol. 2010 Nov;5(11):1946-53. doi:
10.2215/CJN.02400310. Epub 2010 Sep 2. PubMed PMID: 20813860; PubMed
Central PMCID: PMC3001778.
8. Coresh J, Byrd-Holt D, Astor BC, Briggs JP, Eggers PW, Lacher DA, Hostetter TH:
Chronic kidney disease awareness, prevalence, and trends among U.S. adults, 1999 to
2000. J Am Soc Nephrol 2005, 16(1):180-188
9. Centers for Disease Control and Prevention. National Center for Health Statistics.
National Health and Nutrition Examination Survey Questionnaire, 1999–2000, 2001–
2002, 2003–2004, 2005–2006, 2007–2008, 2009–2010. Hyattsville, MD, U.S.
Department of Health and Human Services, Centers for Disease Control and

Functional Foods in Health and Disease 2013; 3(7):291-307 Page 304 of 306
Prevention. http://www.cdc.gov/nchs/nhanes/nhanes_questionnaires.htmAccessed
August 2011.
10. Moranne O, Couchoud C, Vigneau C; PSPA Study Investigators. Characteristics and
treatment course of patients older than 75 years, reaching end-stage renal failure in
France. The PSPA study. J Gerontol A Biol Sci Med Sci. 2012 Dec;67(12):1394-9.
doi: 10.1093/gerona/gls162. Epub 2012 Oct 9.
11. Collins AJ, Vassalotti JA, Wang C, Li S, Gilbertson DT, Liu J, Foley RN, Chen SC,
Arneson TJ: Who should be targeted for CKD screening? Impact of diabetes,
hypertension, and cardiovascular disease. Am J Kidney Dis 2009, 53(3 Suppl 3):S71-
77
12. Stevens PE, O'Donoghue DJ, de Lusignan S, Van Vlymen J, Klebe B, Middleton R,
Hague N, New J, Farmer CK: Chronic kidney disease management in the United
Kingdom: NEOERICA project results. Kidney Int 2007, 72(1):92-99
13. http://www.sin-ridt.org/Italia/Report2010/REPORT%20RIDT%202010.pdf
14. Baigent C, Burbury K, Wheeler D: Premature cardiovascular disease in chronic renal
failure.
15. Lancet 2000, 356(9224):147-152.
16. Part 7. Stratification of risk for progression of kidney disease and development of
cardiovascular disease American journal of kidney diseases: the official journal of the
National Kidney Foundation 2002, 39(2):S170-S212.
17. McCullough PA, Li S, Jurkovitz CT, Stevens L, Collins AJ, Chen SC, Norris KC,
McFarlane S, Johnson B, Shlipak MG, et al.: Chronic kidney disease, prevalence of
premature cardiovascular disease, and relationship to short-term mortality. Am Heart
J 2008, 156(2):277-283
18. Moranne O, Froissart M, Rossert J, Gauci C, Boffa JJ, Haymann JP, M'rad MB,
Jacquot C, Houillier P, Stengel B, Fouqueray B; NephroTestStudy Group. Timing of
onset of CKD-related metabolic complications. J Am SocNephrol. 2009
Jan;20(1):164-71.
19. Drawz PE, Babineau DC, Rahman M. Metabolic complications in elderly adults with
chronic kidney disease. J Am Geriatr Soc. 2012 Feb;60(2):310-5. doi: 10.1111/j.1532-
5415.2011.03818.x. Epub 2012 Jan 27.
20. Meyer TW, Anderson S, Brenner BM. Dietary protein intake and progressive
glomerular sclerosis: the role of capillary hypertension and hyperperfusion in the
progression of renal disease. Ann Intern Med. 1983 May;98(5 Pt 2):832-8.
21. Anderson S, Meyer TW, Rennke HG, Brenner BM. Control of glomerular
hypertension limits glomerular injury in rats with reduced renal mass. J Clin Invest.
1985 Aug;76(2):612-9.
22. Meyer TW, Anderson S, Brenner BM. Dietary protein intake and progressive
glomerular sclerosis: the role of capillary hypertension and hyperperfusion in the
progression of renal disease. Ann Intern Med. 1983 May;98(5 Pt 2):832-8.
23. Barsotti G, Guiducci A, Ciardella F, Giovannetti S. Effects on renal function of a low-
nitrogen diet supplemented with essential amino acids and ketoanalogues and of
hemodialysis and free protein supply in patients with chronic renal failure. Nephron.
1981;27(3):113-7.
24. Aparicio M, Bellizzi V, Chauveau P, Cupisti A, Ecder T, Fouque D, Garneata L, Lin
S, Mitch WE, Teplan V, Zakar G, Yu X. Protein-restricted diets plus keto/amino
acids--a valid therapeutic approach for chronic kidney disease patients. J Ren Nutr.
2012 Mar;22(2 Suppl):S1-21. doi: 10.1053/j.jrn.2011.09.005. Review.
25. Mitch, WE. Dietary protein restriction in chronic renal failure: Nutritional efficacy,
compliance, and progression of renal insufficiency. J Am SocNephrol 1991; 2:823.

Functional Foods in Health and Disease 2013; 3(7):291-307 Page 305 of 306
26. Andrew s. Levey, tom greene, gerald j. Beck et al: Dietary Protein Restriction and the
Progression of Chronic Renal Disease: What Have All of the Results of the MDRD
Study Shown. J Am SocNephrol 10: 2426–2439, 1999.
27. Fouque D, Laville M Low protein diets for chronic kidney disease in non diabetic
adults. Cochrane database of systematic reviews (Online) 2009 Jul 8;(3):CD001892
28. Brunori G, Viola BF, Parrinello G et al. Efficacy and safety of a very-low-protein diet
when postponing dialysis in the elderly: a prospective randomized multicenter
controlled study. American journal of kidney diseases : the official journal of the
National Kidney Foundation 2007 May;49(5):569-80
29. Cianciaruso B, Bellizzi V, Brunori G, Cupisti A, Filippini A, Oldrizzi L, Quintaliani
G, Santoro D Low-protein diet in Italy today: the conclusions of the Working Group
from the Italian Society of Nephrology]. G Ital Nefrol. 2008 Sep-Oct;25 Suppl
42:S54-7.
30. Cianciaruso B, Pota A, Bellizzi V et al. Effect of a low- versus moderate-protein diet
on progression of CKD: follow-up of a randomized controlled trial. American journal
of kidney diseases : the official journal of the National Kidney Foundation 2009
Dec;54(6):1052-61
31. Cianciaruso B, Bellizzi V, Brunori G, Cupisti A, Filippini A, Oldrizzi L, Quintaliani
G, Santoro D. Low-protein dietary therapy in patients with chronic kidney disease G
Ital Nefrol. 2008 Sep-Oct;25 Suppl 42:S1-2..
32. K/DOQI Clinical Practice Guidelines for Chronic Kidney Disease: Evaluation,
Classification, and Stratification American Journal of Kidney Diseases - Volume 39,
Issue 2 (February 2002)
33. G Brunori, G Quintaliani, B.RT. Di Iorio, V Bellizzi, A Cupisti, L Oldrizzi, D
Santoro, Terapia nutrizionale nell'IRC in fase conservativa: suggerimenti di pratica
clinica e di applicazione delle Linee Guida. settembre 2012 Nephromeet Comitato
Governo Clinico, Commissione LG e Percorsi Assistenziali:
http://www.nephromeet.com/web/procedure
34. Population at 1 January 2010. Demographics data: http://demo.istat.it/ (Last Access
March 2013)
35. De Nicola L, Chiodini P, Zoccali C, Borrelli S, Cianciaruso B, Di Iorio B,Santoro D,
Giancaspro V, Abaterusso C, Gallo C, Conte G, Minutolo R; SIN-TABLECKD Study
Group. Prognosis of CKD patients receiving outpatient nephrology care in Italy.Clin J
Am SocNephrol. 2011 Oct;6(10):2421-8. doi: 10.2215/CJN.01180211. Epub 2011
Aug 4. PubMed PMID: 21817127; PubMed Central PMCID: PMC3359552.
36. Rosman JB, Langer K, Brandl M, Piers-Becht TP, van der Hem GK, ter Wee PM,
Donker AJ. Protein-restricted diets in chronic renal failure: a four yearfollow-up
shows limited indications. Kidney Int Suppl. 1989 Nov;27:S96-102. PubMed PMID:
2636680.
37. Locatelli F, Alberti D, Graziani G, Buccianti G, Redaelli B, Giangrande A.
Prospective, randomised, multicentre trial of effect of protein restriction on
progression of chronic renal insufficiency. Northern Italian Cooperative
StudyGroup.Lancet. 1991 Jun 1;337(8753):1299-304. PubMed PMID: 1674294.
38. Klahr S, Levey AS, Beck GJ, Caggiula AW, Hunsicker L, Kusek JW, Striker G. The
effects of dietary protein restriction and blood-pressure control on theprogression of
chronic renal disease. Modification of Diet in Renal Disease Study Group.N Engl J
Med. 1994 Mar 31;330(13):877-84. PubMed PMID: 8114857.
39. Mircescu G, Gârneaţă L, Stancu SH, Căpuşă C. Effects of a supplemented
hypoproteic diet in chronic kidney disease. J RenNutr. 2007 May;17(3):179-88.
PubMed PMID: 17462550.
40. Williams PS, Stevens ME, Fass G, Irons L, Bone JM. Failure of dietary protein and
phosphate restriction to retard the rate of progression of chronic renal failure: a

Functional Foods in Health and Disease 2013; 3(7):291-307 Page 306 of 306
prospective, randomized, controlled trial. Q J Med. 1991 Oct;81(294):837-55.
PubMed PMID: 1801057.
41. Jungers P, Chauveau P, Ployard F, Lebkiri B, Ciancioni C, Man NK. Comparison of
ketoacids and low protein diet on advanced chronic renal failure progression. Kidney
Int Suppl. 1987 Oct;22:S67-71. PubMed PMID: 3323621.
42. Di Iorio BR, Minutolo R, De Nicola L, Bellizzi V, Catapano F, Iodice C, Rubino R,
Conte G. Supplemented very low protein diet ameliorates responsiveness to
erythropoietin in chronic renal failure. Kidney Int. 2003 Nov;64(5):1822-8. PubMed
PMID: 14531817.
43. Miller DK, Homan SM. Determining transition probabilities: confusion
andsuggestions. Med Decis Making. 1994 Jan-Mar;14(1):52-8. PubMed PMID:
8152357.
44. Fleurence RL, Hollenbeak CS. Rates and probabilities in economic
modelling:transformation, translation and appropriate application.
Pharmacoeconomics. 2007;25(1):3-6. PubMed PMID: 17192114.
45. De Nicola L, Dal Canton A; Research Group CARHES. [Epidemiology of chronic
kidney disease in Italy: the CARHES study]. G ItalCardiol (Rome). 2010 May;11(5
Suppl 3):106S-108S. Italian. PubMed PMID: 20879494.
46. Gorodetskaya I, Zenios S, McCulloch CE, Bostrom A, Hsu CY, Bindman AB, Go
AS, Chertow GM. Health-related quality of life and estimates of utility in chronic
kidney disease. KidneyInt. 2005 Dec;68(6):2801-8. PubMed PMID: 16316356.
47. Censis. I trattamenti sostitutivi della funzione renale in Italia, aspetti clinici,economici
e sociali 2009. www.censis.it.
48. Provision of free low protein products in the Lazio region:
http://www.aslromad.it/Servizi.aspx?Organizzazione=6&Tipologia=22.
49. Choosingnot to dia- lyse: evaluation of planned non-dialytic management in acohort
of patients with end-stage renalfailure. NephronClinPract 2003; 95: c40–c46
50. Murtagh FE, Marsh JE, Donohoe P et al. Dialysis or not?A compara-
tivesurvivalstudy of patients over 75years with chronickidneydis- ease stage 5.
NephrolDialTransplant 2007; 22: 1955-1962
51. Joly D, Anglicheau D, Alberti C et al. Octogenariansreaching end- stage renaldisease:
cohortstudy of decision-making and clinical out- comes. J AmSocNephrol 2003; 14:
1012-1021
52. Carson RC, Juszczak M, Davenport A et al. Is maximum conserva- tive management
an equivalent treatment option to dialysis for elderlypatients with
significantcomorbiddisease? Clin J AmSocNephrol 2009; 4: 1611-1619
53. S Mascia, R Minutolo, F Carlo Sasso, P D’Angiò, M Pacilio, R Sperlongano, L Pirro,
G Tirino, G Conte, L De Nicola. [Disfunzione renale nell’anziano: processo
fisiologico o malattia?] Giornale italiano di nefrologia : organo ufficialedellaSocieta
italiana di nefrologia; G ItalNefrol 2013; 30 (1) – ISSN 1724-5590
54. O'Hare AM, Bertenthal D, Covinsky KE, Landefeld CS, Sen S, Mehta K, Steinman
MA, Borzecki A, Walter LC. Mortality risk stratification in chronic kidney disease:
one size for all ages? J AmSocNephrol. 2006 Mar;17(3):846-53. Epub 2006 Feb 1.
PubMed PMID: 16452492.