Embed Size (px)
Citation preview

ACEIT Example Files, 18 September 2012 Approved for Public Release 1
Cost Benefit Analysis (CBA) Metrics Calculated in ACE
ACEIT Users Workshop Sep 18-19, 2012
Mike Allen

ACEIT Example Files, 18 September 2012 Approved for Public Release 2
Overview
Purpose What is a CBA? Why is a CBA Important? Modeling CBA Metrics in ACE Comparing alternatives with ACE and POST Conclusion

ACEIT Example Files, 18 September 2012 Approved for Public Release 3
Purpose Decisions about how to allocate resources are often supported
by a Cost Benefit Analysis (CBA). CBAs consider both quantifiable and non-quantifiable benefits. Quantifiable benefits can be assigned a numeric value such as dollars and ranked based on project selection criteria. These selection criteria (metrics) can be calculated in ACE with the aid of several functions. This presentation will demonstrate the calculation/modeling of the most common metrics used in CBAs.

ACEIT Example Files, 18 September 2012 Approved for Public Release 4
EA/CBA Defined …. a structured methodology that determines the costs and benefits of one or more alternatives and compares them in order to identify the best alternative to achieve a stated goal/objective.
– U.S. Army Cost Benefit Analysis Guide, January 2010
…. a systematic approach to identify, analyze, and compare costs or benefits of alternative courses of action that will achieve a given set of objectives.
– U.S. Army Cost Benefit Analysis Guide, January 2010 …. a conceptual framework for systematically investigating problems of choice. Posing various alternatives for reaching an objective, it analyzes the LCCE and benefits of each one, usually with a return on investment analysis. – GAO Cost Estimating and Assessment Guide, March 2009 …. an objective method for making rational decisions among alternatives. Compares time-phased, economically-adjusted costs and benefits of solutions/alternatives for a defined problem/objective. - SCEA Online

ACEIT Example Files, 18 September 2012 Approved for Public Release 5
CBA Process
– U.S. Army Cost Benefit Analysis Guide, April 2011 ** - This briefing focuses on steps 7 & 8

ACEIT Example Files, 18 September 2012 Approved for Public Release 6
Why CBAs are Important
Offer a way to systematically assess costs and benefits for each alternative Monetary costs and benefits
E.g., Financial outlays, proceeds from sale of assets, savings Non-monetary costs and benefits
E.g., Loss or gain in capability or performance
Compare relative strengths and weaknesses of each alternative
to identify the most effective alternative that accomplishes the mission
Provide information so management can make informed decisions on where to allocate resources

ACEIT Example Files, 18 September 2012 Approved for Public Release 7
Step 7 – Compare Alternatives

ACEIT Example Files, 18 September 2012 Approved for Public Release 8
Modeling the Cost Portion of CBAs with ACE
Modeling CBAs in ACE is a two step process Estimate the CBA Alternatives
The Status Quo and each alternative need to be estimated
Perform the CBA Alternative Comparisons Compare the results of the alternatives using various metrics
Alternatives can be modeled with a single ACE session (Cases) or with multiple ACE sessions

ACEIT Example Files, 18 September 2012 Approved for Public Release 9
Comparing the CBA Alternatives
No matter if you use a single ACE session or multiple ACE sessions, you need to compare the results of the alternatives
Putting the Cases together Use ACE to build a CBA Summary Model (ACE 7.4 will include an
example/template) Use ACE-to-ACE plug-in to combine results from Status Quo and
Alternatives Use POST to develop standard reporting and charting (Hint: tie to
CBA briefing template)
A CBA Summary Model makes metric calculations that compare alternatives (cases) easier to perform Math across cases is difficult since you cannot reference one case result
from within another case

ACEIT Example Files, 18 September 2012 Approved for Public Release 10
Common Metrics Cost Metrics
NET Benefits – The difference between the benefits and the costs (benefits-costs) Net Present Value (NPV) – The present value (PV) of a project’s benefits minus the PV of a
project’s cost; calculated as PV(benefits)-PV(costs) Uniform Annual Cost (UAC) – Method used to compare alternatives with unequal lives;
calculated by dividing the present value of the cost of an alternative by the sum of the discount factors for the periods covering the life of the alternative
Index Metrics Profitability Index (PI or benefit/cost ratio) – Relative profitability of any project or financial
benefit gained from an investment; calculated as PV(benefits)/PV(costs); higher is better Savings Investment Ratio (SIR) and Benefits Investment Ratio (BIR) are similar to PI
Cost/Benefit Ratio – Depicts “unit cost” of benefits; reciprocal of the PI; calculated as PV(costs)/PV(benefits); lower is better
Year and Rate Metrics Pay Back Period – Number of years required to recover initial investment Break Even Year – The year in which the initial investment is recovered Internal Rate of Return – Also known as Return on Investment (ROI); The discount rate that
equates the present value of the benefits with the present value of the costs; discount rate where NPV=0

ACEIT Example Files, 18 September 2012 Approved for Public Release 11
Economic Analysis Functions
ACE has four Economic Analysis functions to help with CBA metric calculations EADiscFact() - This function calculates the annual discounting cost
multiplier (factor) used in present value calculations. EAPayBckPd() - This function determines the payback period needed to
recover an investment cost. It returns the fractional number of years required for cumulative savings to be greater than the total investment.
EABrkEvnYr() - This function determines the break even year for an investment. It returns the first fiscal year in which the cumulative savings is greater than or equal to the total of the investment.
EADiscVal() - This function determines the discounted value of a cost stream by multiplying a value by an annual discounting factor.

ACEIT Example Files, 18 September 2012 Approved for Public Release 12
Discount Factor The discount factor is used to calculate the present value of
future costs and benefits Use the EADiscFact Function
EADiscFact ( project_year, rate, method, [ current_year ] ) Project Year – zero year of project Rate – rate used to develop annual multipliers Method – indicator variable for cost accrual method

ACEIT Example Files, 18 September 2012 Approved for Public Release 13
Present Value All future costs and benefits are discounted to the present
value The present value is used in several metric calculations like NPV, PI, and IRR
Benefits = Cost Savings + Cost Avoidances + Residual Value Cost Savings = Status Quo Operations – Alternative Operations
Costs = Alternative Investment – Status Quo Investment

ACEIT Example Files, 18 September 2012 Approved for Public Release 14
Net Present Value (NPV)
The difference between the present value of the benefits and the present value of the costs
PV(benefits)-PV(costs) Higher is better

ACEIT Example Files, 18 September 2012 Approved for Public Release 15
Uniform Annual Cost A measure of the relative cost of a project used to compare
alternatives with unequal lives Calculated by dividing the present value of the costs of an alternative by the sum
of the discount factors for the years the system provides benefits UAC = PV(total project cost) / sum of discount factors

ACEIT Example Files, 18 September 2012 Approved for Public Release 16
Profitability Index (PI) & Cost Benefit Ratio (CBR)
PI and CBR are the inverse of each other PI - the present value of total benefits divided by the present
value of the total costs (Benefit/Cost ratio) PV(total benefits)/PV(total costs) >1; Higher is better
CBR - the present value of total costs divided by the present value of the total benefits PV(total costs)/PV(total benefits) <1; Lower is better

ACEIT Example Files, 18 September 2012 Approved for Public Release 17
Savings Investment Ratio and Benefit Investment Ratio
Both ratios are related to the Profitability Index Slight variations in numerator and denominator
Savings Investment Ratio (SIR) SIR = PV(cost savings)/(PV(costs)-PV(residual value)) >1; Higher is better
Benefit Investment Ratio (BIR) BIR = (PV(cost savings)+PV(cost avoidance))/(PV(costs)-PV(residual value)) >1; Higher is better

ACEIT Example Files, 18 September 2012 Approved for Public Release 18
Break Even Year The point (year) where the investment cost is recovered Use the EABrkEvnYr Function
EABrkEvnYr (@savings, @invest) @savings – row where the annual savings cost data is contained @invest – row where the annual investment cost data is contained
Calculation is typically in current year dollars but can be done in discounted or BY dollars

ACEIT Example Files, 18 September 2012 Approved for Public Release 19
Payback Period The number of years (period) required to recover an investment
cost Use the EAPayBckPd Function
EAPayBckPd (@savings, @invest) @savings – row where the annual savings cost data is contained @invest – row where the annual investment cost data is contained
Calculation is typically in current year dollars but can be done in discounted or BY dollars

ACEIT Example Files, 18 September 2012 Approved for Public Release 20
Internal Rate of Return Internal Rate of Return (IRR) – Also known as Return on
Investment (ROI) The discount rate at which the present value of the investment cost
equals the present value of the savings; discount rate where NPV=0 Calculate this value using the “Calc with CAIV” option
Set up an IRR CAIV line where PV(Benefits) - PV(Cost) = 0 at the IRR
Use the EADiscVal Function EADiscVal (value, project_year, rate, method, [ current_year ] )
Value – the cost value to be discounted Project Year – zero year of project Rate – rate used to develop annual multipliers Method – indicator variable for cost accrual method
ACEIT Example Files, 18 September 2012 Approved for Public Release 21
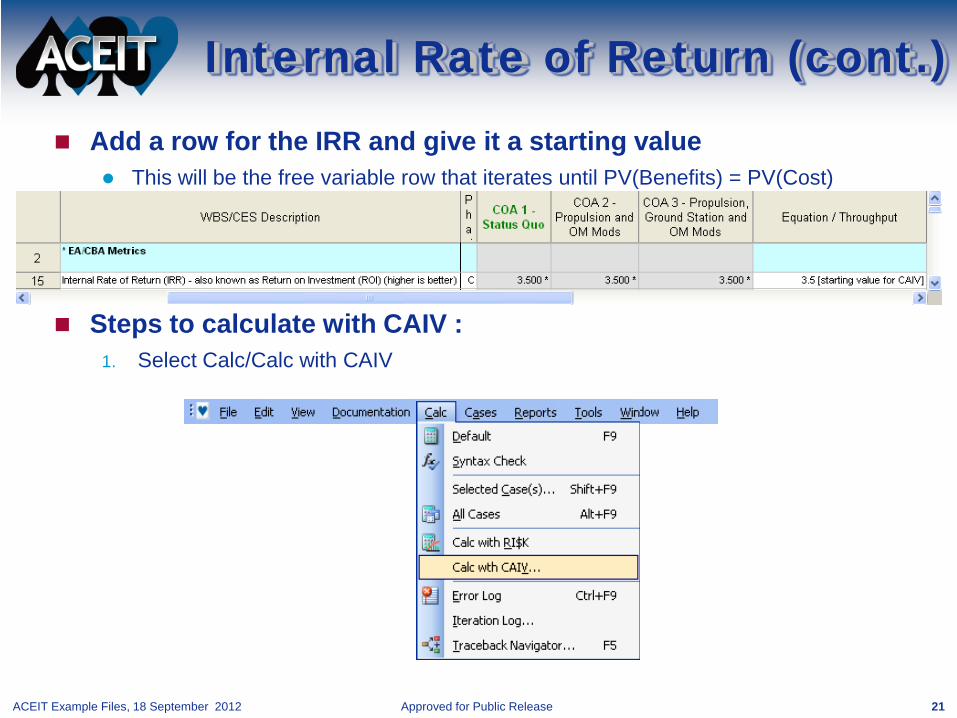
Internal Rate of Return (cont.) Add a row for the IRR and give it a starting value
This will be the free variable row that iterates until PV(Benefits) = PV(Cost)
Steps to calculate with CAIV :
1. Select Calc/Calc with CAIV

ACEIT Example Files, 18 September 2012 Approved for Public Release 22
Internal Rate of Return (cont.)
Steps to calculate with CAIV (cont.):
2. Set Estimate Row to “IRR CAIV line (where PV(Cost) = PV(Benefits))” row
3. Make sure Target Total (BY) is “0”
4. Set Free Variable Row to “Internal Rate of Return (IRR) row
5. Under Calculation Options select the appropriate case
6. Click OK
2
3
4
5
6

ACEIT Example Files, 18 September 2012 Approved for Public Release 23
Internal Rate of Return (cont.)
Steps to calculate with CAIV (cont.):
7. Once the CAIV calculation has converged you will have several options. Select “Save case results as case override to free variable row” and click OK
8. You must now calculate the case to see results on the IRR row
7
8

ACEIT Example Files, 18 September 2012 Approved for Public Release 24
Step 8 – Report Results

ACEIT Example Files, 18 September 2012 Approved for Public Release 25
Compare Costs Across Alternatives
$0.000
$50,000.000
$100,000.000
$150,000.000
$200,000.000
$250,000.000
$300,000.000
$350,000.000
$400,000.000
RDT&E Procurement Military Personel
Operations & Support
BY2
012
$K
Second Level of Visibility for Total Cost (Present Value)
COA 1 - Status Quo
COA 2 - Propulsion and OM Mods
COA 3 - Propulsion, Ground Station and OM Mods
$0.000
$2,000.000
$4,000.000
$6,000.000
$8,000.000
$10,000.000
$12,000.000
$14,000.000
2020 2021 2022 2023 2024 2025 2026 2027 2028 2029
BY2
012
$K
Total Cost (Present Value)
COA 1 - Status Quo
COA 2 - Propulsion and OM ModsCOA 3 - Propulsion, Ground Station and OM Mods
POST ACE

ACEIT Example Files, 18 September 2012 Approved for Public Release 26
Compare Metrics Net Present Value

ACEIT Example Files, 18 September 2012 Approved for Public Release 27
Time Phased Delta Report
Highlight the magnitude of Costs and Savings

ACEIT Example Files, 18 September 2012 Approved for Public Release 28
Custom Reports
ACE and POST have numerous standard tabular and graphical output options
Organizations sometimes like to see results in a format not part of the standard output options
Use POST to create a custom output format and export to PowerPoint

ACEIT Example Files, 18 September 2012 Approved for Public Release 29
Creating Custom Reports Use Excel and POST to create/export standard reports
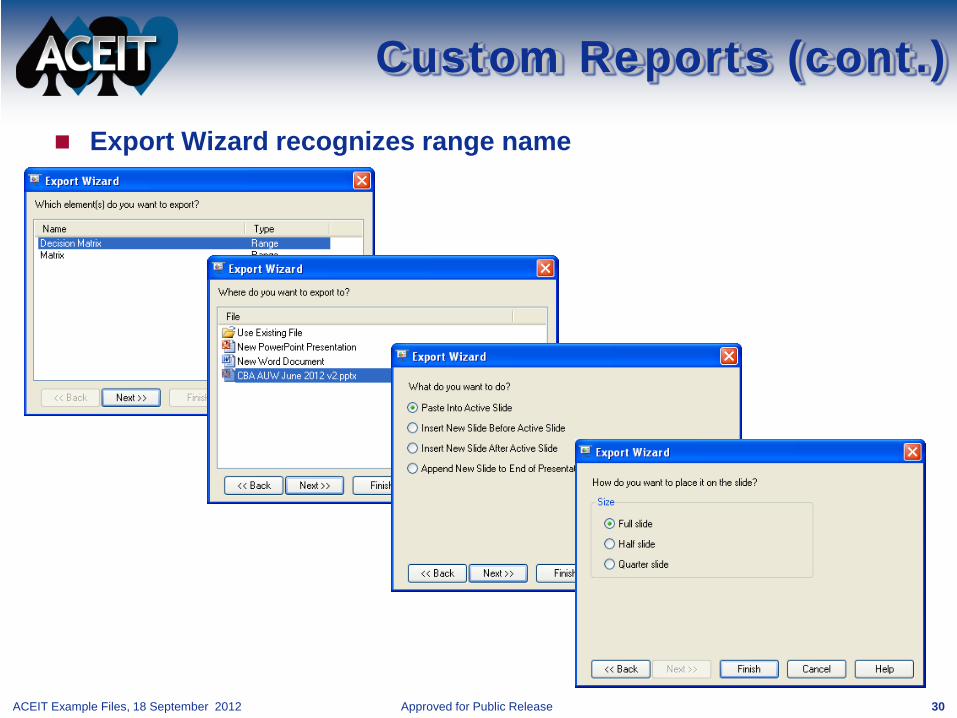
1. Create a custom output in Excel and link to results from a standard POST report 2. Give it an “Export” range name 3. Export to PowerPoint as usual
1
2
3
ACEIT Example Files, 18 September 2012 Approved for Public Release 30
Custom Reports (cont.) Export Wizard recognizes range name

ACEIT Example Files, 18 September 2012 Approved for Public Release 31
Custom Report Custom Report can be updated like other POST reports
Criteria Weight Data Rating Score Data Rating Score Data Rating ScoreTotal Cost (Constant dollars) 0.40 736,028$ 1 0.4 714,327$ 2 0.8 704,605$ 3 1.2Budget Impact (Current dollars) 0.25 844,668$ 1 0.25 817,383$ 2 0.5 805,174$ 3 0.75Maintenance Downtime 0.15 10 Hrs 2 0.3 8 Hrs 3 0.45 12 Hrs 1 0.15Response Time 0.10 Very Good 2 0.2 Good 1 0.1 Excellent 3 0.3Reduced Failure 0.10 5 per 100 2 0.2 3 per 100 3 0.3 8 per 100 1 0.1Total Score 1.00 1.35 2.15 2.50
COA 1 - Status QuoCOA 2 - Propulsion & OM
ModsCOA 3 - Propulsion, Ground
Station and OM Mods
Detailed Decision Matrix

ACEIT Example Files, 18 September 2012 Approved for Public Release 32
Conclusions ACEIT can be used effectively to support Army CBA
requirements At the core of a successful CBA is a solid estimate – ACEIT
implements the standard Army Cost Estimating Process Status Quo and multiple Alternative estimates easily combined via
ACE-to-ACE Plug-In (not shown) CBA Metrics are easily calculated POST can be used to automate reports and link to the CBA briefing
template
Extensions For apples-to-apples comparison, use ACEIT/RI$K to perform CBA
with consistent risk-adjusted estimates (e.g., normalized to 50% cost confidence level).