Embed Size (px)
Citation preview

Cortical and Thalamic Contribution to Visual and Somatosensory Control of Locomotion
in the Cat
by
Wijitha Udayalal Nilaweera
A Dissertation Presented in Partial Fulfillment of the Requirements for the Degree
Doctor of Philosophy
Approved March 2016 by the Graduate Supervisory Committee:
Irina Beloozerova, Co-Chair
Brian Smith, Co-Chair Natalia Dounskaia
Eric Vu
ARIZONA STATE UNIVERSITY
May 2016

i
ABSTRACT
Navigation through natural environments requires continuous sensory guidance.
In addition to coordinated muscle contractions of the limbs that are controlled by spinal
cord, equilibrium, body weight bearing and transfer, and avoidance of obstacles all have
to happen while locomotion is in progress and these are controlled by the supraspinal
centers.
For successful locomotion, animals require visual and somatosensory information.
Even though a number of supraspinal centers receive both in varying degrees, processing
this information at different levels of the central nervous system, especially their
contribution to visuo-motor and sensory-motor integration during locomotion is poorly
understood.
This dissertation investigates the patterns of neuronal activity in three areas of
the forebrain in the cat performing different locomotor tasks to elucidate involvement of
these areas in processing of visual and somatosensory information related to locomotion.
In three studies, animals performed two contrasting locomotor tasks in each and the
neuronal activities were analyzed.
In the first study, cats walked in either complete darkness or in an illuminated
room while the neuronal activity of the motor cortex was recorded. This study revealed
that the neuronal discharge patterns in the motor cortex were significantly different
between the two illumination conditions. The mean discharge rates, modulation, and
other variables were significantly different in 49% of the neurons. This suggests a
contextual correlation between the motor cortical activity and being able to see.

ii
In two other studies, the activities of neurons of either the somatosensory cortex
(SI) or ventrolateral thalamus (VL) were recorded while cats walked on a flat surface
(simple locomotion) or along a horizontal ladder where continuous visual and
somatosensory feedback was required (complex locomotion).
We found that the activity of all but one SI cells with receptive fields on the sole
peaked before the foot touched the ground: predictably. Other cells showed various
patterns of modulation, which differed between simple and complex locomotion. We
discuss the predictive and reflective functionality of the SI in cyclical sensory-motor
events such as locomotion.
We found that neuronal discharges in the VL were modulated to the stride cycle
resembling patterns observed in the cortex that receives direct inputs from the VL. The
modulation was stronger during walking on the ladder revealing VL’s contribution to
locomotion-related activity of the cortex during precision stepping.

iii
ACKNOWLEDGMENTS
Throughout the years I had many mentors, advisors, and guiding counselors, who
helped me to progress through my education and career. Because of their vision and
understanding I was able to reach my goals and realize my dreams. I was fortunate to
join Dr. Irina Beloozerova’s laboratory at Barrow Neurological Institute (BNI) in
Phoenix, Arizona to conduct research in neurophysiology of locomotion. Before long it
became clear to me how exciting the work in the lab was. Dr. Beloozerova helped me,
guided me, and taught me to become a successful researcher. She also encouraged me to
enroll in the neuroscience graduate program jointly offered by BNI and Arizona State
University. She became not only my supervisor at work but also a co-chair of my
dissertation committee. First and foremost I am thankful to Dr. Beloozerova for her
kindness, persistent support, and guidance.
I am deeply grateful to Dr. Eric Vu at BNI for his continuous support during my
academic years. I am also very thankful to Dr. Brian Smith for agreeing to serve as a co-
chair of my dissertation committee, without whom this neuroscience graduate program
at ASU may have not been possible. Dr. Natalia Dounskaia, I am so grateful to you for
your help during my graduate years and being a member of my dissertation committee. I
cannot forget at this time the enormous support and guidance provided by Dr. Alan
Gibson, the Chair of Division of Neurobiology at BNI during years of my employment at
the institute.
I also would like to acknowledge Dr. Mikhail Sirota at BNI for his guidance during
my tenure in the laboratory. I also would like to thank Mr. Peter Wettenstein, Dr.
Vladimir Marlinski, Ms. Madison Armer, Dr. Trevor Rivers, Dr. Eric Stout, at BNI and
Dr. Oleg Favorov at University of North Carolina, all with whom I worked closely during
iv
my years at BNI and without whom this work may have not become a reality. I deeply
appreciate the current members as well as the veterans of Dr. Beloozerova’s lab for their
help and encouragement. In addition, I will never forget the support of Wendi Simonson,
Beverly McBride, and Yuan Delgado at the School of Life Sciences at ASU.
Thank you my dear wife, Sandhya Kanthi Yaparatna, for helping me at each step of
not only in my academic endeavors, but also in my entire life. My family, especially my
sister, who never stopped believing in me being able to do great things, needs to be
named here as well. My deepest appreciation must also go to the learning and memory
laboratory at Iowa State University, especially to Dr. Vlastislav Bracha, who believed in
me and accepted me to his lab as a researcher. I learned there systematic
experimentation as a novice to neuroscience research.
Thank you my friends in Arizona and Iowa for your encouragements and support
throughout my academic years.
I am thankful to BNI foundation for granting me a fellowship toward this graduate
program during my first year. The work of this dissertation was partly supported by NIH
grant R01 NS-058659 to Dr. Irina Beloozerova.
Specific acknowledgments are given in respective Chapters. The specific
contributions of the author of this dissertation include: shared responsibility for
planning the dissertation studies with co-chair Dr. Irina Beloozerova; primary
responsibility for behavioral training of the animals; shared responsibility for animal
surgeries, neuronal and behavioral data collection, and preparation of tissues for
histological analysis; primary responsibility for data analysis for Chapters 3 and 4;
shared responsibility for data analysis for Chapter 5; and shared responsibility for
drafting the publications.

v
TABLE OF CONTENTS
Page
LIST OF FIGURES .................................................................................................... VIII
CHAPTER Page
1. INTRODUCTION ...................................................................................................... 1
Locomotion as a Fundamental Necessity of Animals ..................................... 1
Spinal Cord ..................................................................................................... 3
Motor Cortex .................................................................................................. 6
Somatosensory Cortex.................................................................................... 9
Thalamus ....................................................................................................... 11
Cerebellum .................................................................................................... 13
2. MATERIALS AND METHODS ............................................................................... 16
Animal Training ......................................................................................... 16
Cat Walking Chamber ................................................................................ 17
Surgical Procedures ................................................................................... 18
Identification of Neurons and Neuronal data Acquisition ....................... 20
Analysis of Neuronal Activity .................................................................... 21
Histological Procedures ............................................................................ 23
3. EFFECT OF LIGHT ON THE ACTIVITY OF MOTOR CORTEX NEURONS DURING LOCOMOTION ....................................................................................... 24
Abstract ........................................................................................................ 24
Introduction ..................................................................................................25
Methods ......................................................................................................... 27
Locomotion Tasks ..................................................................................... 28
Surgical Procedures .................................................................................. 29
Sampling of Neuronal and EMG Activity ................................................. 30
Identification of Neurons .......................................................................... 33
Analysis of Neural Activity ......................................................................... 35
vi
CHAPTER Page
Histological Procedures ............................................................................. 37
Results ........................................................................................................... 37
Kinematics of Walking in the Light and Darkness are Similar ................. 37
Activities of Muscles during Walking in the Light and Darkness ............. 40
Characteristics of Neurons........................................................................ 40
Activity of Neurons during Locomotion in the Darkness ......................... 43
Discussion .....................................................................................................54
4. ACTIVITY OF SOMATOSENSORY RESPONSIVE NEURONS IN HIGH SUBDIVISIONS OF SI CORTEX DURING LOCOMOTION ................................. 60
Abstract ........................................................................................................ 60
Introduction .................................................................................................. 61
Methods ........................................................................................................ 62
Locomotor Tasks ....................................................................................... 63
Surgical Procedures .................................................................................. 64
Single-Unit Recording .............................................................................. 66
Identification of Neurons and Classification of their Receptive Fields .... 66
Locomotion Data Analysis ......................................................................... 67
Histological Procedures ............................................................................ 68
Results .......................................................................................................... 69
Location and Characteristics of Neurons ................................................. 69
Characteristics of Locomotion and an Example of Firing Behavior of a Neuron ....................................................................................................... 71
Effect of Locomotion on Mean Spike Discharge Rates .............................. 73
Stride-Synchronized Modulation of Spike Discharges .............................. 75
Association between RF Properties and Patterns of Activity Modulation during Locomotion on the Flat Surface ..................................................... 79
Changes to the Activity Evoked by Necessity to Step Accurately on the Horizontal Ladder ..................................................................................... 84
Discussion .................................................................................................... 87
5. SIGNALS FROM THE VENTROLATERAL THALAMUS TO THE MOTOR CORTEX DURING LOCOMOTION ....................................................................... 94
vii
CHAPTER Page
Abstract ........................................................................................................ 94
Introduction ..................................................................................................95
Methods ......................................................................................................... 97
Locomotion Tasks ...................................................................................... 97
Surgical Procedures ................................................................................... 97
Single-Unit Recording .............................................................................. 99
Identification of Neurons ........................................................................ 100
Processing of Neuronal Activity ............................................................... 101
Histological Procedures ........................................................................... 102
Results ......................................................................................................... 103
Location of Neurons ................................................................................ 103
Anatomical Reconstruction ..................................................................... 104
Receptive Fields ....................................................................................... 106
Afferent Connections ............................................................................... 107
Neurons Projecting to the Motor Cortex ................................................. 109
Activity during Standing ........................................................................... 111
Characteristics of Locomotion ................................................................. 113
Discussion ................................................................................................... 131
VL Signals Conveyed during Simple Locomotion ................................... 131
VL Signals Conveyed During Complex Locomotion ................................ 134
Nature of Signals Conveyed by the VL during Complex Locomotion ..... 137
Relative Contribution of Signals from VL and Associative Cortex to Motor Cortex Activity during Visually Guided Locomotion ............................... 139
6. REFERENCES ....................................................................................................... 142
viii
LIST OF FIGURES
Figure Page
2.1 Cat Walking Chamber ......................................................................................... 16
2.2 Assembly of Cranial Implant ............................................................................. 18
3.1 Histological Reconstruction of Recording Areas of the Motor Cortex ............... 29
3.2 An Example of the Neuronal Activities during Locomotion in the Light vs. Dark
............................................................................................................................. 31
3.3 Kinematics of Locomotion in the Light vs. Dark ................................................ 37
3.4 Examples of Forelimb and Hind Limb EMG Activities in the Light vs. Dark
Locomotion ......................................................................................................... 39
3.5 Population-Level Characteristics of 1 and 2-PEF Neurons in the Light vs. Dark
Locomotion ......................................................................................................... 43
3.6 Population-Level Characteristics of Neurons with Different Receptive Fields in
the Light vs. Dark Locomotion .......................................................................... 44
3.7 Quantitative Comparisons of Neuronal Activities in Light vs. Dark Locomotion
............................................................................................................................. 47
3.8 Comparisons of Neuronal Activities in Light vs. Dark Locomotion ................... 48
3.9 Changes of Motor Cortical Cells within the Darkness Period ............................ 51
4.1 Cat Locomotor Tasks .......................................................................................... 62
4.2 Locations of Neuronal Recording Sites .............................................................. 64
4.3 Receptive Fields of Neurons in SI Cortex ........................................................... 70
4.4 Examples of Neuronal Activity during Flat and Ladder Locomotion ................ 73
4.5 Activity Characteristics of Neurons between Flat and Ladder Locomotion ....... 75
4.6 Population Characteristics of One-PEF Neurons during Flat and Ladder Walking
............................................................................................................................. 76
4.7 Population Characteristics of Two-PEF Neurons during Flat and Ladder Walking
............................................................................................................................. 78

ix
Figure Page
4.8 Stride-Related Activity Patterns Of 6 Neuronal Groups .................................... 82
4.9 Stride-Related Activity Patterns With RFs in Different Areas of the Limbs ...... 83
4.10 Stride-Related Activities of Neurons on the Ventral Side of the Forepaw ......... 85
5.1 Experimental Paradigm ...................................................................................... 99
5.2 Histological Reconstruction of Recording Sites of VL Thalamus ....................... 108
5.3 Histology of Cerebellar Projections to the VL Recorded Locations ................... 111
5.4 Histology of Connections of the Other Brain Areas with VL .............................. 112
5.5 Axonal Conduction Velocities of Thalamo-Cortical Projection Neurons ........... 114
5.6 Population Characteristics of One PEF Neurons: Flat Vs. Ladder Locomotion 118
5.7 One-PEF Neurons’ Activities with RF in Different Joints .................................. 122
5.8 Population Characteristics of Two PEF Neurons: Flat Vs. Ladder Locomotion 124
5.9 Comparison of Activities of Individual Neurons: Flat Vs. Ladder Locomotion . 129
5.10 Comparison of Individual Cells across Different Firing Properties ................... 131
5.11 Activity Changes of Different Neuronal Pools in Respect to Their Modulation . 133
5.12 Activity Changes of Different Neuronal Pools in Respect to 1-Pef and 2-Pef ..... 136
5.13 Patterns of Signal Propagation from VL to Motor Cortex ................................. 140

1
1. INTRODUCTION
Locomotion as a Fundamental Necessity of Animals
Locomotion is one of the most significant features of the animal world and a
fundamental necessity for the vast majority of species including humans (Dickinson et
al., 2000; Grillner 1975; Orlovsky et al., 1999). For many types of animals, locomotion is
essential for their mere survival. The main reasons for animals to move from one
location to another are to find food and water, avoid predators and hostile weather, and
find mates (Biewener, 2003). Animals use different means of locomotion. From single-
cell organisms to the most complex and largest mammals on Earth such as whales and
elephants, animals use movements of their body parts for locomotion. Fish and other
water-dwelling beings swim, terrestrial animals use their legs and/or bodies for
locomotion, and airborne animals fly. Even though it is a common behavior, locomotion
is a complex motor act. The goal of this review is to discuss locomotion of terrestrial
animals, especially visually guided locomotion and its control by networks of cortex and
thalamus.
Any movement is produced by muscle contraction. The signals for these muscle
contractions are generated within the central nervous system (CNS) and sent via the
axons of motoneurons to the target muscles. Even though the signals to the muscles are
sent from motoneurons located in the spinal cord or brain stem, there are several other
CNS structures that contribute in varying degrees to the efficient function of muscles.
Modulation of the activity during different movements, including locomotion, was
observed in a number of brain areas; and lesions in many of them impair movements
(Hultborn, 2006; Stuart and Hultborn, 2008; Kuypers, 1964). Not only do these brain

2
structures control the “lower level” neuronal networks in the spinal cord, they also
receive signals from the peripheral receptors about the status of movements and body’s
position relative to the environment.
The simplest movements are the somatic reflexes, which are generally quick,
protective movements of the body parts. They are triggered by sensory stimuli: when a
strong enough sensory stimulus specific to a particular reflex is applied to the receptor
(skin, muscle spindle, tendon, retina, etc.) it triggers contraction of a specific muscle
group as a response (rev. in e.g., Hultborn, 2006; Sherrington and Laslett, 1903). For
example, when one touches a very hot surface inadvertently, a withdrawal reflex is
activated, and the hand is quickly removed from the hot surface to prevent further
damage. Similarly, when one goes out to a bright area from a darker place, the pupils of
the eyes shrink to protect the retina from damage by the bright light. These reflexes
perform necessary adaptations without direct involvement of the higher level structures
of CNS. The reflexes are involuntary in nature and are controlled by hardwired neuronal
“chain reactions” called reflex arcs. Withdrawal reflexes and deep tendon reflexes have
the shortest neuronal arcs and are exhibited by contracting one group of muscles. For
example, the knee jerk reflex is elicited by stretching the patellar tendon that in turn
excites the quadriceps muscle by the motor neurons in the spinal cord (Renshaw, 1940;
Sherrington and Laslett, 1903). The quadriceps muscle contraction and reciprocal
inhibition of hamstring muscles cause the limb to straighten. This reflex arc is completed
between receptor spinal cord and the effector muscles without direct involvement
of supraspinal motor structures such as motor cortex. However, it should be noted that
the information about the stimulus and triggered reflex activity is sent to the higher
levels of CNS. Reflexes are critical to any organism because they are normally protective.
They are stereotypic, non-repetitive, and are not rhythmic in nature. The neuronal
3
communication of the reflexes occurs in the spinal cord or brainstem and involvement of
the forebrain is not required for the response.
The other group of simple movements is fixed actions such as sneezing and
coughing. These are also stereotypic, unidirectional, typically non-repetitive, but are
more complex than reflexes. In contrast, rhythmic motor patterns such as breathing,
scratching, and locomotion are stereotyped and repetitive. They are under substantial
voluntary control. Directed movements such as reaching to grasp or throwing are more
complex than any other movements mentioned above but neither are stereotyped nor
strictly repetitive. It has been shown that many types of movements including
locomotion can be maintained by the neuronal networks residing in the lower-levels of
the CNS such as the spinal cord or brainstem. (Duysens and. Van de Crommert, 1998;
Frosberg et al., 1980 a, b; Grillner, S. (2011); Hultborn, and Nielsen, 2007; Shik and
Orlovsky, 1976)
Spinal Cord
Locomotion is a voluntary, rhythmic act of the animal. Even though it is still not
clear how exactly locomotion is triggered, it is clear that the spinal cord networks are the
ultimate targets of the descending commands arising from the supraspinal centers. It is
also clear that to produce locomotion the spinal cord motor neurons propagate well-
modulated neuronal signals to the appropriate muscles. It had been shown that
locomotion-like rhythmic movements can be maintained by the spinal cord (Frosberg et.
al, 1980a, b; Grillner, 1973, 2011; Grillner and Zangger 1979; Shik and Orlovsky, 1976).
In other words, locomotor pattern does not require descending supraspinal signals for
rhythmic locomotor patterns to occur and the spinal cord alone can maintain the
locomotor patterns when the right conditions are met (see below). The spinal cord

4
networks that enable locomotor rhythmic patterns are called central pattern generators
(CPGs). During locomotion, the CPGs operate in such a harmony so that each muscle
group contracts at a precisely right moment while the opposite muscles relax for the
body to move smoothly.
The spinal cord alone cannot carry out locomotion successfully in a natural terrain,
however, because it requires much more than simply making rhythmic limb movements.
During natural locomotion maintaining equilibrium, bearing body weight, transferring
body weight from one side to the other, assessing the postural relationship with the
surrounding environment, and evaluating and avoiding obstacles must happen in
parallel while locomotion is in progression. Several supraspinal locomotor centers
acquire, analyze, and integrate the signals from the surroundings to provide necessary
information to the spinal cord for smooth locomotion in natural environments.
It was evident as early as at the dawn of the 20th century that mammals (the cat
was the most popular test subject) could walk on a moving treadmill belt after the
forebrain is separated from the spinal cord, hence after removing the inputs from the
cerebral cortex and other supraspinal structures to the spinal cord (Sherrington, 1910a,
b). Even after the spinal cord of the cat is transected at the mid-thoracic level, the cat’s
hind limbs can maintain locomotion-like rhythmic movements on a running treadmill
(Grillner & Rossignol, 1978; Grillner and Zangger, 1984). These animals also adjust the
walking speed to the speed of the treadmill. If high spinal transection is performed (at
upper or mid-cervical levels), all hind and fore limbs would move rhythmically and
synchronously (Miller & Van der Meche, 1976). However, to initiate these movements by
the spinal cord, appropriate conditions should be met: the spinal cord needs to be
stimulated, physically, electrically or pharmacologically (Forssberg et al. 1980a, b;
Grillner, 1973; Wallen & Williams, 1984).The first report that showed the ability to walk

5
after the spinal cord was transected at the brain stem in the cat and dog was the work of
C. S. Sherrington in as early as 1910 (Sherrington, 1910a, b). Sherrington thought that
the spinal cord-dependent locomotion was due the functions of a chain of reflexes
triggered by the sensory inputs. Graham Brown (Brown, 1911) being agreed with
Sherrington about independent functional capability of the spinal cord disagreed with
the notion about reflex chain. He showed that even after removing the sensory afferents
from the limb muscles to the spinal cord (deafferentation) and transecting the spinal
cord at T12 level, the animals were still able to produce locomotion-like rhythmic
movements with their hind limbs. Since then it has been shown many times, in many
animals that the spinal cord CPGs can function without afferent inputs from either
supraspinal centers or peripheral sensory receptors (Forssberg et al. 1980a, b; Grillner,
1975; Grillner & Zangger, 1979; Miller et al., 1976). Surprisingly, it appears that CPGs’
function across different species is similar (Duysens et. al., 1998; Pearson, 1993)
regardless of the vast differences in animals’ locomotor patterns that range from
swimming to hopping, to walking, to flying. Moreover, the spinal cord that is completely
isolated from all inputs, i.e. the supraspinal inputs, inputs from the peripheral sensory
appendages, is capable of producing rhythmic patterns by its motor neurons (Chrachri
and Clarac, 1990; Dubuc et al., 2008; Sirota et al., 2000). This is called the fictive
locomotion. However, whether it is in vivo or in vitro, for the isolated spinal cord to
produce locomotion-like movements, the CPG areas of the spinal cord need to be
manipulated (stimulated) with an appropriate electrical current or pharmacological
agent or agitate the limbs manually, without which the system would not sustain the
rhythmicity or may even completely fail to function.
Despite these capabilities of the spinal cord, it cannot navigate the body in the
natural environment because the spinal cord does not receive distant information and

6
therefore cannot avoid obstacles in the natural environment. Analysis and integration of
sensory information to produce appropriate locomotor signals to the spinal cord is the
function of supraspinal centers. What are the supraspinal locomotor centers that could
analyze and/or integrate this information? In this review I will briefly discuss some of
the supraspinal structures that are known to be involved in control of locomotion. I will
focus on the motor and somatosensory cortex, thalamus, and cerebellum.
This dissertation contains 3 studies that I have conducted in the cat to better
understand the activities of three critical areas of the forebrain that are involved in
locomotion: the motor cortex, somatosensory cortex, and motor thalamus- the
ventrolateral thalamus.
I would like to note that parts of these studies were presented in abstract form at
international neuroscience meetings (Armer et al., 2011; Favorov et al., 2010; cerebellar
poster) and also are published in peer reviewed journals (Armer et al., 2013; Favorov et
al., 2015; Marlinski et al., 2012). I present the journal articles mostly unchanged (the text
is changed minimally but the figures have been repositioned to suit the format of this
dissertation.)
Motor Cortex
The motor cortex and related areas of the cerebral cortex are closely involved in
voluntary movements including locomotion (Porter and Lemon, 1993; Armstrong and
Drew 1984; Beloozerova and Sirota 1993a, b). Electrophysiological studies have revealed
that regions of the motor cortex are active during performance of motor tasks. It is well
known that people with injuries to specific areas of the motor cortex due to
cerebrovascular accidents or other causes such as mechanical injury suffer from different
motor deficiencies. Some of more pronounced deficiencies are dragging the leg along the

7
ground, changes of limb trajectories, and interlimb discoordination (Mayer et al., 1997).
In experimental animals, removal of or lesions to the motor cortex or lesions to the
pyramidal tract lead to motor deficiencies (Adkins et al., 1971; Chambers and Liu, 1957,
Cambers et al., 1966; Courtine et al., 2005, Drew et al., 2002; Eidelberg and Yu 1981;
Eidelberg et al., 1981). It had been shown that cats are unable to walk on a wire mesh or
elevated horizontal bar after cooling of the motor cortex or lesions to it, or to the
pyramidal tract (Trendelenburg, 1911). Cats were unable to walk on a horizontal ladder
after bilateral section of the pyramidal track (Liddell and Phillips, 1944): cats
overstepped the rungs instead of stepping on tops because they lost the ability of precise
placement of the limbs. A similar study conducted by Beloozerova and Sirota (1993a)
reported while bilateral motor cortical lesions or its inactivation by cooling or
microinjections of tetrodotoxin, a potent sodium channel blocker, did not affect cats
locomotion on a flat surface, uphill walking, or even with weights on both forelimbs.
However, it did abolish their ability to walk on a horizontal ladder or accurately overstep
obstacles. Similar results have been reported for kittens when they were continuously
injected with muscimol, a GABA receptor agonist, in the motor cortex during a critical
period of their development (Friel et al., 2007; Martin et al., 2007).
Electrophysiological recordings in cats and monkeys revealed that the activity of
motor cortical neurons is step-modulated: meaning that neurons are more active during
one phase of the stride cycle and less active during another phase (Armstrong and Drew
1984a, b; Beloozerova and Sirota 1985a, b; 1993a, b; Widajewicz et al. 1994; Drew 1988,
1993; Fitzsimmons et al., 2009). An important study conducted by Beloozerova and
Sirota (1993a) showed increasing modulation of the activity in the motor cortex in the cat
when requirements for precision limb placement increased. Cats were trained to
overstep barriers and the motor cortex activity was recorded. When the gap between the
8
barriers became smaller (from 25 to 12 to 6 cm), thus forcing the animals to make more
precise foot placements, the modulation of the cortical activity became stronger. Amos,
Armstrong, & Marple-Horvat (1990) also have shown substantially increasing neuronal
activity in motor cortex when cats walked on a horizontal ladder. Motor cortical cell
activity also has increased in the cats when unexpected perturbations occurred while
walking on a treadmill (Armstrong and Drew 1984a, b; Drew 1993; Widajewicz et. al.
1994, Marple-Horvat et al., 1993).
The motor cortex conveys motor related information to the spinal cord via the
pyramidal tract. When the medullary pyramid was electrically stimulated in decerebrate
cats within specific parameters of the electrical current and impulse frequency, the
rhythmic stepping patterns could be initiated (Orlovsky, 1972). This indicates that the
descending corticospinal inputs have a major influence on the function of spinal cord
CPGs. Electrical stimulation of the motor cortex also produced responses in the limb
muscles demonstrating that the motor cortex actually influences the muscle activity in
the limbs (Armstrong and Drew, 1985 a, b) via spinal cord.
Most investigations studied the functional relationship of the motor cortex with
movements, but not the visual information processing. There are direct and indirect
anatomical connections between the visual and motor areas of the cerebral cortex,
potentially conducting visual information from visual areas to the pre-motor,
supplementary, and motor cortical areas (Andujar and Drew, 2007; Babb et al., 1984;
Symonds and Rosenquist, 1984). Indeed, several studies had found that the motor cortex
responds to visual information, suggesting the motor cortex may play a role in
integrating visual information for performance of movements (Garcia-Rill and Durovsky,
1974; Mushiake et al., 1991; Weyand et al., 1999).
9
We wanted to understand how neurons in the motor cortex react to the level of
illumination during locomotion. We recorded the activity of motor cortical neurons in
cats walking on a flat surface in two different illumination conditions: in a fully
illuminated room and in a completely dark room. We found that the neurons fired
differently in these illumination conditions. This study was published in Behavioural
Brain Research Journal and forms chapter 3 of this dissertation (Armer et al, 2013).
Somatosensory Cortex
Effective locomotion is impossible without supraspinal contribution. Acquisition
and analysis of environmental cues as well as planning and execution of the locomotion-
related signal are major functions of these centers. In their natural environments
animals adjust their limb placements according to visual information and characteristics
of the walking terrain. The somatosensory cortex allows animals to acquire information
about the outside world as touch, vibration, pain, temperature, body movement and so
forth (Kaas and Pons 1988, Kaas 1990, 1993).The parietal cortex consists of primary
somatosensory area (SI), which includes Brodmann’s areas 3a, 3b, 1, and 2, and
posterior parietal cortex (areas 5 and 7). These are in the center of my discussion. The
other major subdivisions are parietal operculum (area 43), inferior parietal lobule
including supramarginal gyrus (area 40), and the angular gyrus (area 39). The parietal
cortex receives all modalities of sensory information such as somatic, visual, and
auditory, except olfaction.
The primary somatosensory cortex (SI) receives projections from several
different parts of the central nervous system. Somatosensory information from the skin,
muscles, and joints are conveyed via thalamic nuclei, the ventroposterior nucleus being

10
the largest (Kaas et al. 1984). The ventroposterior nucleus projects to areas 3b and 1
while the ventroposterior superior nucleus projects to areas 3a and 2. Other thalamic
nuclei project to different areas of the SI and secondary somatosensory cortex.
Afferentations to subdivisions of SI are organized in a hierarchical manner (Felleman
and Van Essen, 1991; Iwamura, 1998). Lesions in areas 3a and 3b “inactivate” areas 1
and 2. Area 3b projects to area 1 and it projects to area 2 (Garraghty et al. 1990a, b). With
this transition, the size of the receptive fields becomes larger in the higher levels in the
hierarchical system. More complex properties such as center-surround effects and
direction-selectivity are evident in the higher levels of the hierarchy (Iwamura et al.
1993). Primary somatosensory cortex selectively projects to different areas of the CNS
including the motor cortex, with areas 3a and 2 being the largest contributors, pre-motor
and supplementary motor areas, posterior parietal areas 5 and 7, brainstem, spinal cord,
and contralateral somatosensory cortex (rev. in Kaas, 1993). These connections are
reciprocal.
Similar to the motor cortex and primary somatosensory cortex, the posterior
parietal cortex (PPC) is critically involved in locomotion and also involved in motor
planning and sensory motor integration. Neuronal activity in this cortical area, especially
area 5 is increased by the somatosensory stimuli (Pons and Kaas, 1985; Pons et al., 1985)
and modulated to the gait cycle. This modulation dramatically changes when it requires
precision foot placement involving visual attention (Andujar et al. 2010; Beloozerova and
Sirota, 2003; Drew and Marigold, 2015). In an overstepping task in cats, peak activity of
some area 5 neurons were observed 2-3 steps before the animal actually overstepped,
and continued to maintain high level of activity until the hind limbs cleared the obstacle
(Marigold et al., 2011). It is hypothesized that the effect is due to planning to avoid the
obstacle rather than the stimulation by afferent visual information about the ongoing

11
locomotion. The cats were able to see the obstacle several steps, not 2-3 steps, before
taking real action. Also lesions to this area caused animals to misstep. When the visual
input was interrupted for a short period of time, it did not affect the activity patterns
(Marigold and Drew, 2011). It has been postulated that the area 5 process the
information concerning the temporal relation between the animal and obstacle. However
results of one of our studies indicate that area 5 in cats does not convey this information
to the motor cortex despite the fact that the two areas are closely interconnected
(Beloozerova et al., 2011). Further studies need to be conducted to better understand the
function of the posterior parietal cortex during locomotion.
Thalamus
The thalamus is a complex, paired organ located in the center of the brain. The
thalamus is comprised of many nuclei, most of which receive sensory information and
convey it to the sensory-motor cortex and other cortical and subcortical targets. One of
the major afferents to the thalamus is the cerebellum. Ventrobasal and ventrolateral
thalamic nuclei that receive inputs from cerebellar nuclei function as intermediary to the
sensory and motor information.
The thalamic ventrolateral and ventroanterior nuclear complex (VL-VA), defined
functionally as the motor thalamus, is the main source of subcortical afferent pathways
to the sensory-motor cortex (Strick, 1973; Larsen and Asanuma, 1979; Fang et al., 2006).
According to cytoarchitectonic features and afferent connections, this complex is divided
into anterior and posterior compartments (Asanuma et al 1983; Ilinsky and Kultas-
Ilinsky 1984). The anterior part (the VA) receives its primary input from the basal
ganglia, whereas the major projections to the posterior part (the VL) originate in the
interposed and dentate nuclei of the cerebellum (Evrard and Craig, 2008; Ilinsky and
12
Kultas-Ilinsky, 1984; Na et al., 1997; Nakano et al., 1980; Rinvik and Grofová 1974;
Steriade, 1995). It also receives inputs form the spinal cord (Craig 2008; Mackel et al.,
1992; Yen et al., 1991). Lesions in the VL cause ataxia and deficits in purposeful motor
performances (Fabre-Thorpe and Levesque, 1991; Solomon et al., 1994). VL neurons
change their activity in parallel with the activity of cerebellar cortex prior to conditioned
or self-generated voluntary movements (Evarts 1971; Strick 1976; Neafsey et al., 1978;
Schmied et al., 1979; van Donkelaar et al., 1999; Kurata, 2005).
As noted above, it has been shown in decerebrate animals that the brainstem
nuclei-vestibular nucleus, red nucleus, and reticular formation-projecting directly to the
spinal cord could maintain step-related modulation only if the cerebellum was intact
(Orlovski 1970, 1972a, b). The motor cortex does not receive direct inputs from the
cerebellum, however, the cerebellum is a major afferent to the VL thalamus which
conveys information directly to the motor cortex (Na et al., 1997; Strick, 1973). The VL
thalamus is essential for normal performance of locomotor behaviors that require an
accurate foot placement. After the VL thalamus was lesioned, cats were able to maintain
walking on flat surface with even different loadings and gait variations but could not
accomplish any locomotion task that required precise positioning of paws on the surface
(Beloozerova and Sirota, 1988, 1998). Moreover, locomotion-related activity of motor
cortical cells in these animals became sparse or changed dramatically so that most
neurons lost their step-related modulation. It was concluded that the VL contributes to
integration of sensory (including visual) and motor information during locomotion, or,
at the very least, transmits integrated sensory-motor information that is necessary for an
appropriate gait modifications from cerebellum to sensory-motor cortex. Previous lesion
studies also have demonstrated that important information is conveyed to the motor
13
cortex via the VL thalamus during locomotion (Fabre-Thorpe and Levesque, 1991;
Solomon et al., 1994).
However, until recently there was no data on the activity of neurons in the VL
thalamus during locomotion. Therefore, it was unknown what type of information is
conveyed. From Dr. Beloozerova’s preliminary studies, it was only known that during
locomotion the activity of VL is modulated in the step cycle and depends on whether or
not visuo-motor coordination of locomotion is required (Beloozerova and Sirota 2002).
In this dissertation, neuronal mechanism of integration of motor and visual information
in the VL was investigated in detail and is presented in chapter 5.
Cerebellum
The cerebellum provides the main input to the ventrolateral thalamus. There is an
unambiguous consensus that the cerebellum is vital for motor control, including visuo-
motor and sensory-motor coordination during locomotion. Removal of the cerebellum or
its partial lesions results in motor deficits with a “discoordination” being a most vivid
symptom. Signals from cerebellar outputs reach all motor centers including spinal cord,
cerebral cortex via motor thalamus, red nucleus, vestibular nuclei, and reticular
formation. The cerebellum receives signals from all motor centers and also signals from
limb proprioceptors, and the spinal locomotor generators. The cerebellum also receives
visual information via several structures in the brain stem (Brodal, 1979; Glickstein et al.
1994). Stimulation of the cerebellum evokes motor responses and the activities of
neurons in cerebellum correlate with movements. Therefore one of the best candidates of
the subcortical structures that receive sufficient visual information and also related to
locomotor activities is the cerebellum (Bloedel, 1992., Brooks, 1995., Stein and Glickstein
1992, Glickstein et al., 1998, Thach et al., 1992).
14
Nearly 200 years ago (in 1824) Florence reported that after removal of cerebellum
animals were “grossly dis-coordinated” (in Fulton & Dow, 1937), however, they still could
walk. Therefore Florence concluded that the cerebellum is not necessary for producing
locomotor movements but plays a role in coordination. Later Babinski (1901) (in Stein
and Glickstein, 1992) confirmed this by concluding that the deficits in patients with
cerebellar lesions are, in fact, due to lack of coordination. Sherrington (1906)
emphasized the importance of cerebellum in movements by suggesting that it was the
“head ganglion” of the proprioceptive system. A few years later Holms (1917, 1939)
discovered that disturbance in visual processing also contributes to the loss of
coordination in movements by showing that cerebellar lesions affect visually-guided
movements. This probably was the first report that suggested the importance of the
cerebellum in visuo-motor coordination of movements. In 1955, William Chambers and
James Sprague (1955a, b) published two articles describing series of investigations on
the effects of cerebellar lesions in the cat. They performed systematic lesions in the
vermis, paravermal region, or lateral cerebellar hemispheres with or without the
corresponding deep nuclei, and recorded changes in behaviors short-term (few days) or
long-term (for up to 2 years). They concluded that the cerebellum plays a critical role in
visually guided locomotion.
In the 1970s a group of scientists from Moscow, Russia (Shik, Arshavsky, Orlovsky,
Gelfand and others), reported important findings about the cerebellum and also the
brain stem nuclei related to locomotion. Orlovsky (1972b) reported that thalamic cats,
that is, cats decerebrate at the level of the thalamus, which were capable of producing
rhythmic locomotor movements, had stride-related rhythmic activity in the reticulo-
spinal neurons only if their cerebellum was intact. Furthermore, Orlovsky (1972a, b)
demonstrated that the activities of two other major nuclei in the brainstem; the

15
vestibulo-spinal nucleus and the red nucleus are well-modulated to the step cycle only in
the presence of the cerebellum. Therefore, it was concluded that the locomotion-related
spike activities of the brainstem nuclei, that in turn influence the spinal cord neurons,
are under control of the cerebellum. All these nuclei receive direct inputs from the
cerebellum. Both reticular nucleus and the vestibular nucleus receive either direct
Pukinje cell input or input from the fastigial nucleus of the cerebellum. The red nucleus
receives monosynaptic excitatory input from the interposed nucleus of the cerebellum.
When neuronal activities of the deep cerebellar nuclei were recorded in the intact
animals during locomotion, it was found that the neuronal discharges were stride-cycle
modulated (Armstrong and Edgly, 1984; Marple‐Horvat and Criado, 1999), and the
activity patterns were different when the precision stepping was required (Armstrong
and Marple-Horvat, 1996). In our preliminary studies, we found that when cats walked
on a flat surface and a horizontal ladder, the discharge patterns of both the interposed
and dentate nuclei were stride-modulated. However, the characteristics of the activities
recorded from the two nuclei were different (Nilaweera and Beloozerova, 2009). Namely,
upon transition from flat surface walking to accurate stepping on horizontal ladder, the
activity of the interposed nucleus increased mainly in the average rate. In contrast, the
lateral nuclear activity changed mainly in the depth of its stride-related modulation,
which became stronger during accurate stepping on the ladder.

16
2. MATERIALS AND METHODS
The cat was used as a subject for the studies (male and female adult animals)
because it is a classic animal for research in locomotion. All experiments were conducted
in accordance with National Institutes of Health Guide for the Care and Use of
Laboratory Animals and upon approval by the Barrow Neurological Institute’s Animal
Care and Use Committee. All experiments were conducted in Dr. Irina Beloozerova’s
laboratory at the Barrow Neurological Institute.
Animal Training
Positive reinforcement (food) was used to habituate cats to the experimental
situation and engage them in locomotor behavior (Pryor, 1975; Skinner, 1938). At the
beginning of training, an animal was food restricted to 50% of normal ration for two
days. It was then taken to a quiet empty room where small amounts of food were given
simultaneously with a buzzer sound. Three 15 min training sessions per day were
conducted for three days. During training period and throughout the time of
experiments, the cat’s weight was monitored and maintained within 80-120% of its
original value.
When the cat showed a clear association between the sound and food, the sound
was used to train the cat to walk around the chamber. Training was started with the cat
moving gradually further away from the food dish, and continued until the cat walked to
the end of one corridor and came back along the other side. At this time, a five second
pause was introduced between cat’s arrival to the food dish and dispersal of food. The cat
had to stand on all four limbs to receive the food reward. During recording experiments,
the neuronal activity during one second in the middle of this period was used to assess
the activity of neurons during “standing”. When the animal walked confidently on the
17
flat surface, it was trained to walk on tops of crosspiece of a horizontal ladder. We first
used very wide (18 cm) crosspieces, and then gradually decreased their width.
Crosspieces of all ladders were 25 cm apart, which was empirically established to be a
half of an adult cat’s stride length. The final width of the crosspieces was 5 cm, which
was 2 cm larger than the size of the cat’s paw.
Once the cats were well-trained to walk on the horizontal ladder they were trained
to wear a “sock” on one or more of the limbs. This sock was used for recording of
footsteps. Cats were also trained to carry a communication cable that during experiments
connected the electronics on the cat with data acquisition system.
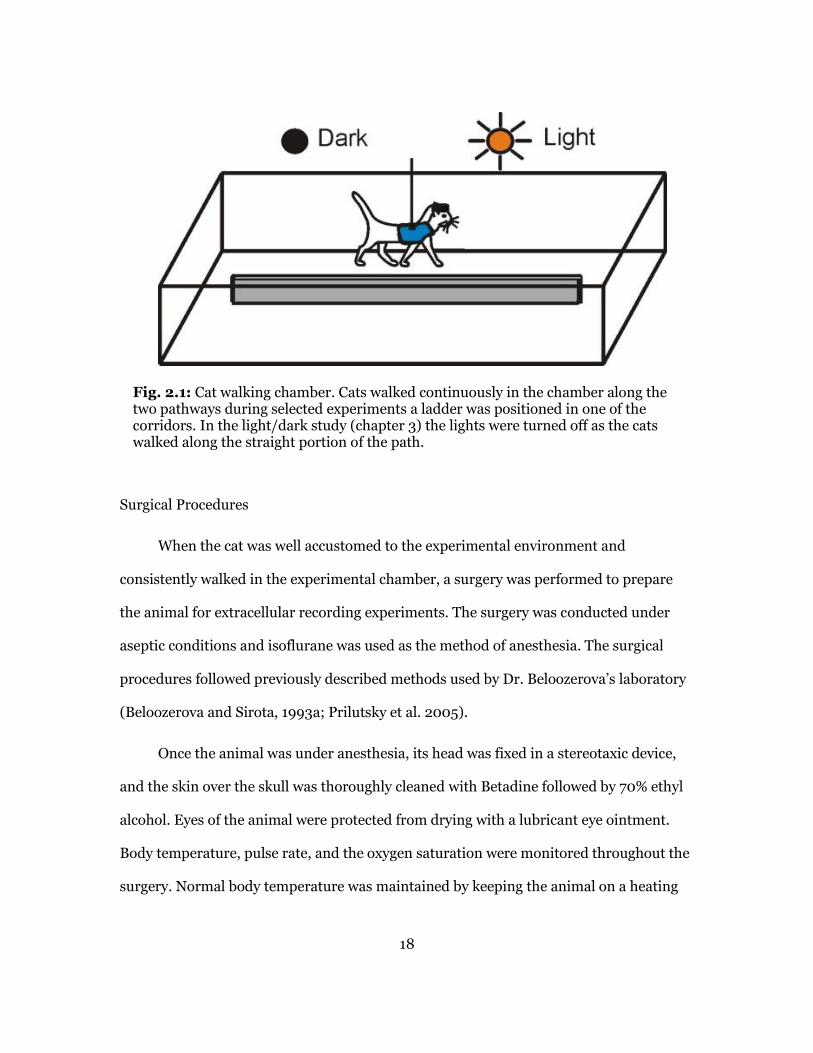
Cat Walking Chamber
Experiments were conducted in a rectangular walking chamber that was 2.5 m
long, 0.6 m wide and 0.4 m deep. The chamber was placed about 0.8 m above the
ground. It was divided into two corridors by a divider that runs in the middle of the
chamber (2.1). During experiments, cats walked away from the food dish along one
corridor and came back along the other one. To monitor cats entering and exiting the
sections of the corridors, infrared detectors were mounted within the chamber. The
chamber’s floor was covered with an electroconductive material and so were the stepping
surfaces of the ladder’s crosspieces. During walking, the foot contact with the floor was
recorded by means of an elecromechanical sensor attached to the sock on the foot.
18
Fig. 2.1: Cat walking chamber. Cats walked continuously in the chamber along the two pathways during selected experiments a ladder was positioned in one of the corridors. In the light/dark study (chapter 3) the lights were turned off as the cats walked along the straight portion of the path.
Surgical Procedures
When the cat was well accustomed to the experimental environment and
consistently walked in the experimental chamber, a surgery was performed to prepare
the animal for extracellular recording experiments. The surgery was conducted under
aseptic conditions and isoflurane was used as the method of anesthesia. The surgical
procedures followed previously described methods used by Dr. Beloozerova’s laboratory
(Beloozerova and Sirota, 1993a; Prilutsky et al. 2005).
Once the animal was under anesthesia, its head was fixed in a stereotaxic device,
and the skin over the skull was thoroughly cleaned with Betadine followed by 70% ethyl
alcohol. Eyes of the animal were protected from drying with a lubricant eye ointment.
Body temperature, pulse rate, and the oxygen saturation were monitored throughout the
surgery. Normal body temperature was maintained by keeping the animal on a heating
19
pad during the surgery. An incision was made on top the head. The skin and fascia were
moved to the sides and held with retractors. Then the skull was cleaned with normal
saline solution and dried with sterile gauze. Ten small perforations were made around
the circumference of the skull and ten anchoring screws were implanted (fig. 2.2). A pre-
made plastic mold was placed covering the heads of the screws to build a polymer ring-
like shaped base. This base later allowed immobilizing the cat’s head during experiments
with the awake animal. This was needed for insertion of recording electrodes and
identification of neurons. The base was also used to affix miniature drives, preamplifiers,
and connectors. The gaps between the screws below this plastic base were covered with a
silicone material (Silicone Elastomer, Factor II Inc. AZ). At the end of the surgery, the
base was capped with a plastic cap for mechanical protection, and electrical shielding
during recordings.
Several limb muscles were typically implanted with electrodes for
electromyography (EMG) following standard procedures (Beloozerova et al. 2010;
Prilutsky et al. 2005; Armer et al., 2013). Following the surgery immediately and 12
hours later, an analgesic buprenorphine was administered.
After the cat has recovered from the surgery, it was trained to sit quietly with its
head restrained by an external apparatus. During this training, the cat was placed in this
apparatus for increasing periods of time ranging initially from 10 sec to ~30 minutes by
the end of the training. After a few sessions, the animal calmly sat in the apparatus with
their head restrained. They did not appear to be in discomfort because they often fell
asleep in the apparatus.
20
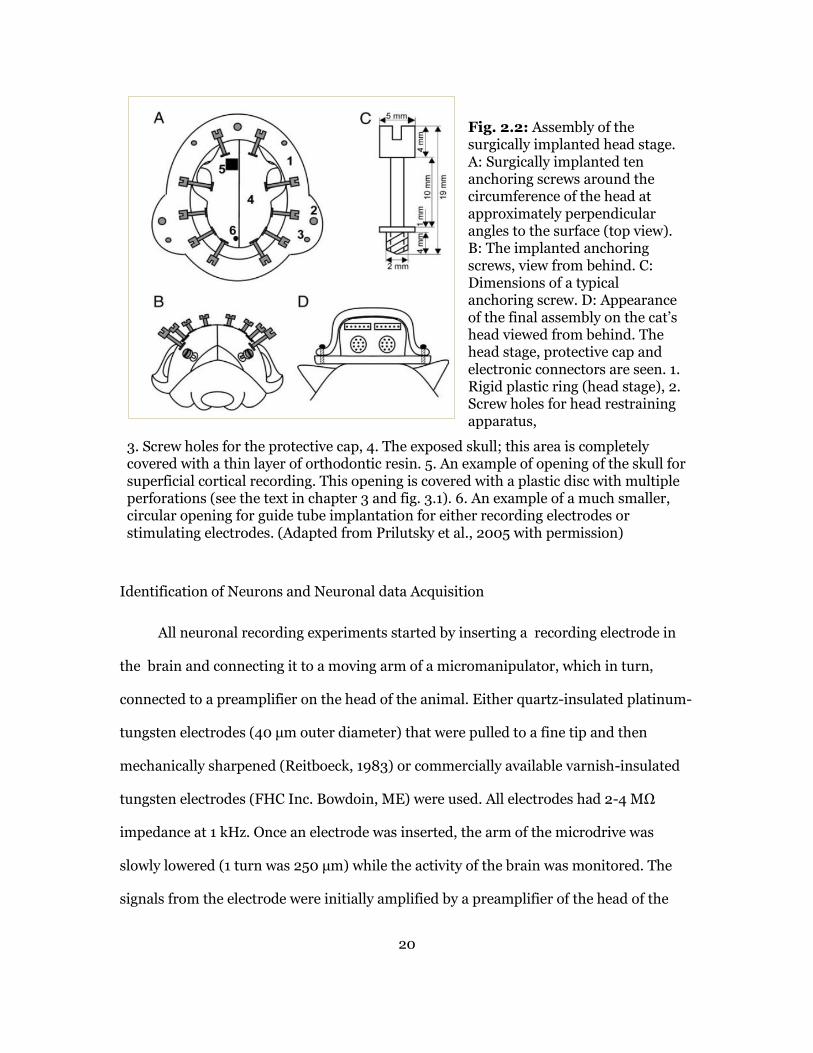
Fig. 2.2: Assembly of the surgically implanted head stage. A: Surgically implanted ten anchoring screws around the circumference of the head at approximately perpendicular angles to the surface (top view). B: The implanted anchoring screws, view from behind. C: Dimensions of a typical anchoring screw. D: Appearance of the final assembly on the cat’s head viewed from behind. The head stage, protective cap and electronic connectors are seen. 1. Rigid plastic ring (head stage), 2. Screw holes for head restraining apparatus,
3. Screw holes for the protective cap, 4. The exposed skull; this area is completely covered with a thin layer of orthodontic resin. 5. An example of opening of the skull for superficial cortical recording. This opening is covered with a plastic disc with multiple perforations (see the text in chapter 3 and fig. 3.1). 6. An example of a much smaller, circular opening for guide tube implantation for either recording electrodes or stimulating electrodes. (Adapted from Prilutsky et al., 2005 with permission)
Identification of Neurons and Neuronal data Acquisition
All neuronal recording experiments started by inserting a recording electrode in
the brain and connecting it to a moving arm of a micromanipulator, which in turn,
connected to a preamplifier on the head of the animal. Either quartz-insulated platinum-
tungsten electrodes (40 μm outer diameter) that were pulled to a fine tip and then
mechanically sharpened (Reitboeck, 1983) or commercially available varnish-insulated
tungsten electrodes (FHC Inc. Bowdoin, ME) were used. All electrodes had 2-4 MΩ
impedance at 1 kHz. Once an electrode was inserted, the arm of the microdrive was
slowly lowered (1 turn was 250 μm) while the activity of the brain was monitored. The
signals from the electrode were initially amplified by a preamplifier of the head of the
21
animal and then further amplified using stationary amplifier CyberAmp 380 (Axon
Instruments). Amplified signals were filtered (0.3 – 10 KHz band pass), digitalized (30
kHz sampling frequency) and recorded to a computer hard disk by means of a data
acquisition hardware and software package, Power-1401/Spike-2 system (Cambridge
Electronic Design, Cambridge, UK).
EMG signals were amplified with individual miniature preamplifiers carried by the
animal, then further amplified with a stationary amplifier, filtered (30-1,500 Hz band
pass), digitalized with 3 kHz sampling frequency, and stored on a computer hard disk.
Both neuronal and EMG signals were displayed in real-time on a computer screen. When
a stable neuronal signal with a good signal to noise ratio was found, responses of the
neuron to somatosensory stimulation were tested.
Somatosensory stimulation was produced manually while the cat was sitting with
its head restrained. Palpation of the parts of the body and limbs, palpation of muscle
bellies, touching the skin and fur, and passive movements of the joints were used. The
responsive neurons were further tested for directional preference.
Analysis of Neuronal Activity
During each recording session, animals completed two tasks. They either walked in
the light or darkness on a flat surface (chapter 3) or walked on a flat surface and along a
horizontally placed ladder (chapters 4 and 5). The lift of the right forelimb was
considered to be the beginning of the stride cycle. One stride cycle consisted of the swing
and stance periods. For the analysis, each cycle was divided into 20 equal bins. Phase
histograms were produced from the neuronal data after averaging over all selected
strides (e.g., Beloozerova et al. 2010).
22
In order to determine the difference between neuronal activity during different
tasks, data were analyzed by comparing average discharge rates (s-1), the coefficients of
stride-related frequency modulation (M%), the depths of modulation (dM%), periods of
elevated firing (PEF), the number of PEFs during one stride cycle, and the preferred
phases of the activity (PP).
The coefficient of stride-related frequency modulation (M) was calculated using
the phase histogram as follows: M% = (1-Fmin ÷ Fmax) x 100; where Fmin was the minimum
discharge frequency in the histogram, and Fmax was the maximum frequency in the
histogram. Neural activity with M > 50% was considered stride-cycle modulated. This
estimate was empirically established using bootstrapping technique (Efron & Tibshirani,
1993).
The depth of modulation (dM) was calculated as follows: dM% = (Nmax – Nmin) ÷ (N
x 100), where Nmax was the number of spikes in the highest bin of the histogram, Nmin was
the number of spikes in the lowest bin of the histogram, and N was the total number of
spikes in the histogram. Activity with dM >4% was considered to be stride-related, which
was also determined using bootstrapping analyses.
The bins of the phase histogram where the value of the activity exceeded a set
threshold were considered to be the period of elevated firing (PEF). The preferred phase
(PP) of neuronal activity was calculated using circular statistics (Batshelet 1981; Drew
and Doucet 1991; Fisher 1993; see also Beloozerova et al. 2003; Sirota et al. 2005). For
this purpose, the stride cycle was treated as a circle and each action potential occurring
within the stride was given a unit value and an angle to the corresponding time stamp.
Then the final vector was calculated over all the strides in the experiment.
23
The statistical methods used for comparing the neuronal activities, and the details
of these tests are provided in corresponding chapters.
Histological Procedures
After completion of recordings, the cats were deeply anesthetized with
pentobarbital sodium. Reference marks at the recording and stimulating sites were made
by passing electrical current. In selected experiments, fluorescence microbeads were
injected in the brain several weeks prior to the termination of the animal in order to
trace the neuronal connections of the structures. The positioning of EMG electrodes was
verified by testing limb movements in response to electrical stimulation and by visual
inspection. The animals were given an overdose of pentobarbital sodium and perfused
with phosphate buffered saline followed by 10% formaldehyde. The extracted brains
were sectioned at 50 µm in the coronal or sagittal plane. The sections were mounted on
gelatin coated microscope slides, stained, with cresyl violet for Nissl substance and
covered with coverslips for preservation.

24
3. EFFECT OF LIGHT ON THE ACTIVITY OF MOTOR CORTEX NEURONS
DURING LOCOMOTION
Published in Behavioural Brain Research (Armer et al. 2013)
Abstract
The motor cortex plays a critical role in accurate visually guided movements such
as reaching and target stepping. However, the manner in which vision influences the
movement-related activity of neurons in the motor cortex is not well understood. In this
study we have investigated how the locomotion-related activity of neurons in the motor
cortex is modified when subjects switch between walking in the darkness and in light.
Three adult cats were trained to walk through corridors of an experimental
chamber for a food reward. On randomly selected trials, lights were extinguished for
approximately four seconds when the cat was in a straight portion of the chamber’s
corridor. Discharges of 146 neurons from layer V of the motor cortex, including 51
pyramidal tract cells (PTNs), were recorded and compared between light and dark
conditions. It was found that cats’ movements during locomotion in light and darkness
were similar (as judged from the analysis of three-dimensional limb kinematics and the
activity of limb muscles), while the firing behavior of 49% (71/146) of neurons was
different between the two walking conditions. This included differences in the mean
discharge rate (19%, 28/146 of neurons), depth of stride-related frequency modulation
(24%, 32/131), duration of the period of elevated firing ((PEF), 19%, 25/131), and
number of PEFs among stride-related neurons (26%, 34/131). 20% of responding
neurons exhibited more than one type of change.
25
We conclude that visual input plays a very significant role in determining neuronal
activity in the motor cortex during locomotion by altering one, or occasionally multiple,
parameters of locomotion-related discharges of its neurons.
Acknowledgements: The idea for this study was suggested by Dr. Alan R. Gibson. In
addition, authors are indebted to Mr. Peter Wettenstein for his exceptional engineering
assistance and Mr. Neet Shah and Mr. Dan Griffiths for assistance with analyses. The
research was supported by NIH Grant R01 NS-058659 to INB.
Introduction
The role of the motor cortex in accurate visually guided movements such as
reaching and target stepping is important. It was shown that neuronal discharges in the
motor cortex are timed to phases of reaching and target stepping (Armstrong and Drew,
1984a; Beloozerova and Sirota, 1985a, b; 1993a, b; Beloozerova et al., 2010; Drew, 1993;
Georgopoulos et al., 1982; Kalaska, 2009; Scott, 2008; Yakovenko et al., 2011) and that
lesions or inactivation of the motor cortex impair these movements (Bastian et al., 2000;
Beer et al., 2000; Beloozerova and Sirota, 1993; Liddell and Phillips, 1944; Martin and
Ghez, 1993; Mihaltchev et al., 2005; Trendelenberg, 1911). The focus of nearly all of
previous studies, however, has been on determining only the motor parameter(s) of
reaching and target stepping that are controlled by the motor cortex. The inflow of visual
information about the location of the target and the manner by which this information
influences the movement-related activity of neurons in the motor cortex has received
much less attention.
Anatomical studies show that the motor cortex receives input from several higher
order visual areas. In the cortex, parietal area 5 intensely projects to the motor cortex
(Andujar and Drew, 2007; Babb et al., 1984; Ghosh, 1997). Area 5 receives inputs from a
26
host of cortical and subcortical visual centers, including the pulvinar and a number of
visual cortical areas such as 18, 19, 20, 21, lateral suprasylvian and splenial visual areas
(Avendano et al., 1985, 1988; Hyvarinen, 1982; Niimi et al., 1983; Symonds et al., 1981).
Rostral subdivisions of cortical parietal area 7 also project to the motor cortex (Andujar
and Drew, 2007; Babb et al., 1984; Ghosh, 1997). Area 7 receives inputs from visual
cortical areas 19, 20, 21, 22, lateral suprasylvian areas as well as from the pulvinar and
rostral intralaminar complex (Divac et al., 1977; Hyvarinen, 1982; olson and Lawler,
1987; Robertson, 1977; Symonds and Rosenquist, 1984). The main thalamic input to the
motor cortex arrives from the ventrolateral thalamus. Although the ventrolateral
thalamus contains very few visually responsive neurons, it receives intensive
afferentation from the lateral cerebellum, which is known to have a substantial visual
input (Cerminara et al., 2005; Stein and Glickstein, 1992). In our recent publication
(Marlinski et al., 2012) it was argued that the stream of visual information that travels
via the cerebellum and ventrolateral thalamus significantly contributes to the
transmission of vision-based signals to the motor cortex during motor behavior.
In agreement with anatomical data, physiological experiments show that, in both
anesthetized and awake animals, neurons in the motor cortex respond to visual stimuli
(Garcia-Rill and Dubrovskey, 1974; Weyand et al., 1999; Martin and Ghez, 1985). In the
study by Weyand and colleagues (1999), when receptive fields in paralyzed cats were
tested using stationary or moving spots or bars of light, 40% of sites within the motor
cortex area 4γ gave moderately reliable visual responses, with most other sites showing
some responsiveness, albeit weaker. Receptive fields were found to be large, occasionally
encompassing most of the contralateral hemifield, and always included the area
centralis. Sites with good responses were intermingled with nearly non-responsive areas.
In chronically implanted behaving cats, Martin & Ghez (1985) found that in many motor

27
cortical neurons the onset of the forearm flexion/extension-related activity, although
well-timed to the movement, was even better time-locked to the visual stimulus. For 56%
of these cells, however, the specificity of the visual stimulus was unimportant as they
were well tuned to any stimulus signaling a certain movement (e.g., elbow flexion), and
their visual responses were contingent upon the movement.
In previous studies from Dr. Beloozerova laboratory it was found that when visual
information is required for accurate target stepping, the activity of the cat motor cortex
differs dramatically from the activity observed during simple locomotion (Beloozerova
and Sirota, 1993a, b; Beloozerova et al., 2010). Taking into account that the inactivation
of the motor cortex impairs visually guided stepping, this altered activity was interpreted
as a control signal for accurate feet placement. However, the manner by which visual
information contributes to the formation of a control signal in the motor cortex
remained unclear. In this study we have investigated the effect of light on locomotion-
related activity of neurons in the motor cortex. We trained cats to walk along a straight
path with a flat surface under normal laboratory illumination and when the lights were
turned off (complete darkness) for approximately 3-4 seconds. The analysis of three-
dimensional kinematics and EMGs of limb muscles showed that cats walked very
similarly in the light and darkness. The locomotion-related discharges of 49% (71/146) of
neurons, however, were different between the two conditions. We conclude that the
motor cortex responds to visual stimulation during locomotion, and describe how the
light, and thus the ability to see, shapes its locomotion-related activity.
Methods
Recordings were obtained from three adult cats prepared for chronic experiments,
of which two were female and one was male. Methods of surgical preparation and

28
recording techniques have been described in detail in the methods section of this
dissertation and in previous publications from Dr. Beloozerova laboratory (Beloozerova
and Sirota, 1993; Prilutsky et al., 2005). Therefore only the specific methods used in this
study will be described here while the general methods will be only briefly reported.
Locomotion Tasks
Positive reinforcement (food) was used to habituate cats to the experimental
situation and engage them in locomotion behavior (Pryor, 1975; Skinner, 1938). Cats
walked in a rectangular chamber that had two corridors, each 2.5 m long and 0.3 m wide
(Fig. 2.1). The cat’s passage through the beginning and the end of each corridor was
monitored using infrared photodiodes (emission wavelengths of 850-900 nm, which is
outside of the visible spectral range of the cat (Guenther and Zenner, 1993).
Cats walked in two experimental conditions: under normal laboratory illumination
of approximately 500 lux (the spectral sensitivity of cats is very similar to that of humans
(Guenther and Zenner, 1993) and in full darkness. The experimental room had no
windows, its door was light-proofed, and all lights from electronics were masked.
Computer monitors were located in a neighboring room. The darkness condition was
randomly presented in approximately 50% of the rounds. It started upon the cat entering
a straight portion of the walkway and ended when it reached a photodiode at the end of
the corridor. Typically, it took cats between 2.5 and 4 seconds to walk through a corridor.
Cats were trained to walk around the chamber in this experimental setting daily for
about 2-3 weeks until they were confident in doing so.
Cats were accustomed to wearing a cotton jacket, a light backpack with
connectors, and a sock with a small metal plate on the sole of the foot for recording foot
contact with the floor. On selected trials, cat movements were recorded using the
29
Visualeyez System (3D Real Time Motion Capture and Analysis System, Phoenix
Technologies Inc., Canada). This system detects positions of light-emitting photodiodes
(LEDs) in three-dimensional space and calculates various kinematical parameters. Wide-
angle, six-chip infrared LEDs with wavelengths of 755-785 nm, which are invisible to
cats (Guenther and Zenner, 1993), were attached to the skin projections of the base of
the fifth metacarpal on the right paw and the vertebral border of the right scapula. The
frequency of sampling was 200 Hz. Position, velocity, and acceleration were determined
and averaged across all selected strides.
Surgical Procedures
After each cat was trained, surgery was performed under aseptic conditions using
isoflurane anesthesia. In two cats, bipolar EMG electrodes (flexible Teflon-insulated
stainless-steel wires) were implanted bilaterally into three forelimb muscles: m. triceps
brahii (Tri, elbow extensor), m. extensor digitorum communis (EDC, wrist and
phalanges dorsal flexor), and m. extensor carpi ulnaris (ECU- wrist dorsal flexor); and
into three hindlimb muscles: m. gastrocnemius lateralis (GL, ankle extensor), m. soleus
(SO, ankle extensor), m. vastus lateralis (VL, knee extensor). The electrode placements
were verified by stimulation through the implanted wires before closure of the incision.
The wires were led subcutaneously and connected to sockets on the head base.
To access the left motor cortex, a portion of the os frontale, os ethmoidale, and
dura above the left motor cortex over an area of approximately 1 cm2 were removed. The
motor cortex was visually identified by surface features and photographed (Fig. 2.1A).
The aperture was then covered by a 1 mm-thick acrylic plate, in which approximately
200 holes, 0.36 mm in diameter, had been drilled and filled with a mixture of bone wax
30
and petroleum jelly. Recording microelectrodes were later inserted into the motor cortex
of the awake animal through the holes in the plate.
Two 26 gauge hypodermic guide tubes were implanted vertically above the
medullary pyramids with tips approximately at the Horsley-Clarke coordinates (P7.5,
L0.5) and (P7.5, L1.5), and the depth of H0. They were later used for physiologically
guided insertion of stimulating electrodes into the pyramidal tract (Prilutsky et al.,
2005). These electrodes were used to identify pyramidal tract neurons (PTNs) in the
awake animal.
Sampling of Neuronal and EMG Activity
After recovering from surgery over a period of five or six days, the cat was placed
on a table and encouraged to take a “sphinx” position on a comforting pad. After resting
in this position for a few minutes, the base attached to the skull during surgery was
fastened to an external frame, thereby approximating the natural resting position of the
cat’s head. After a few sessions of an increased duration, all cats would calmly rest in the
sphinx position with their head restrained. The cats did not seem to be in any discomfort
and would often fall asleep.

31
Fig. 3.1: Location and identification of neurons. A: Areas of recording in the left motor cortex. Microelectrode entry points into the cortex were compiled from all cats and are shown as circles on the photograph of the cat 2-cortex: cat 1, 2, and 3 entry points are depicted by grey, white, and black circles, respectively. Positions of parasagittal sections, whose photomicrographs are shown in C and D, are indicated by dotted lines c and d, respectively. B: A collision test determines whether a neuron's response to pyramidal tract stimulation is antidromic. Top: the neuron spontaneously discharges (arrowhead 1) and the pyramidal tract is stimulated approximately 3 ms later (arrowhead 2). The neuron responds with a latency of approximately 1 ms (arrowhead 3). Bottom: the neuron spontaneously discharges (arrowhead 1) and the pyramidal tract is stimulated about 0.5 ms later (arrowhead 2). The neuron does not respond (arrowhead 3) because at 0.5 ms the spontaneous spike was still en-route to pyramidal tract, therefore causing the collision, or nullification, of the response. The test confirms the response of the neuron was antidromic, and therefore the neuron proves to be a pyramidal tract projecting neuron (PTN). C: Photomicrograph of a parasagittal section through the lateral pre-cruciate motor cortex (section c). An arrow points to a reference electrolytic lesion in the forelimb representation of the motor cortex. D: Photomicrograph of a parasagittal section through the medial motor cortex (section d). An arrow points to a reference electrolytic lesion in the hindlimb representation of the motor cortex. In C and D: Layers of the cortex are numbered. Groups of giant cells in layer V, which are characteristic for area 4γ and are visible throughout both the pre- and post-cruciate cortex, are encircled. Cresyl violet stain.
32
While the animal was at rest on the table, the motor cortex was searched for well-
isolated neurons. Neuronal activity was recorded extracellularly using either platinum-
tungsten quartz-insulated microelectrodes (40 μm outer diameter) pulled to a fine tip
and mechanically sharpened (Reitboeck, 1983), or commercially available tungsten
varnish-insulated electrodes (Frederick Haer & Co; Bowdoin, ME). The impedance of
both types of electrodes was 2–4 MΩ at 1000 Hz. A custom made light-weight (2.5g),
manual, single-axis micro-manipulator chronically mounted to animal’s skull was used
to advance the microelectrode. Signals from the microelectrode were pre-amplified with
a custom-made miniature preamplifier positioned on the cat’s head, and then further
amplified with CyberAmp 380 (Axon Instruments). After amplification, signals were
filtered (0.3-10 kHz band pass), digitized with a sampling frequency of 30 kHz, displayed
on a screen, fed to an audio monitor, and recorded to the hard disk of a computer by
means of a data acquisition hardware and software package (Power-1401/Spike-2
System, Cambridge Electronic Design, Cambridge, UK). An example of a recording is
shown in Fig. 3.2A, D.
Signals from EMG pre-amplifiers were amplified and filtered (30-1,500 Hz) using
a CyberAmp 380 amplifier, digitized with a sampling frequency of 3 kHz, displayed on
the screen, and recorded to the disc of a computer using the same data-acquisition
software as for neurons. After digitizing, the EMG signals were rectified and smoothed
by filters with a time constant of 50 ms. An example of an untreated data recording is
shown in Fig. 3.2A and D.
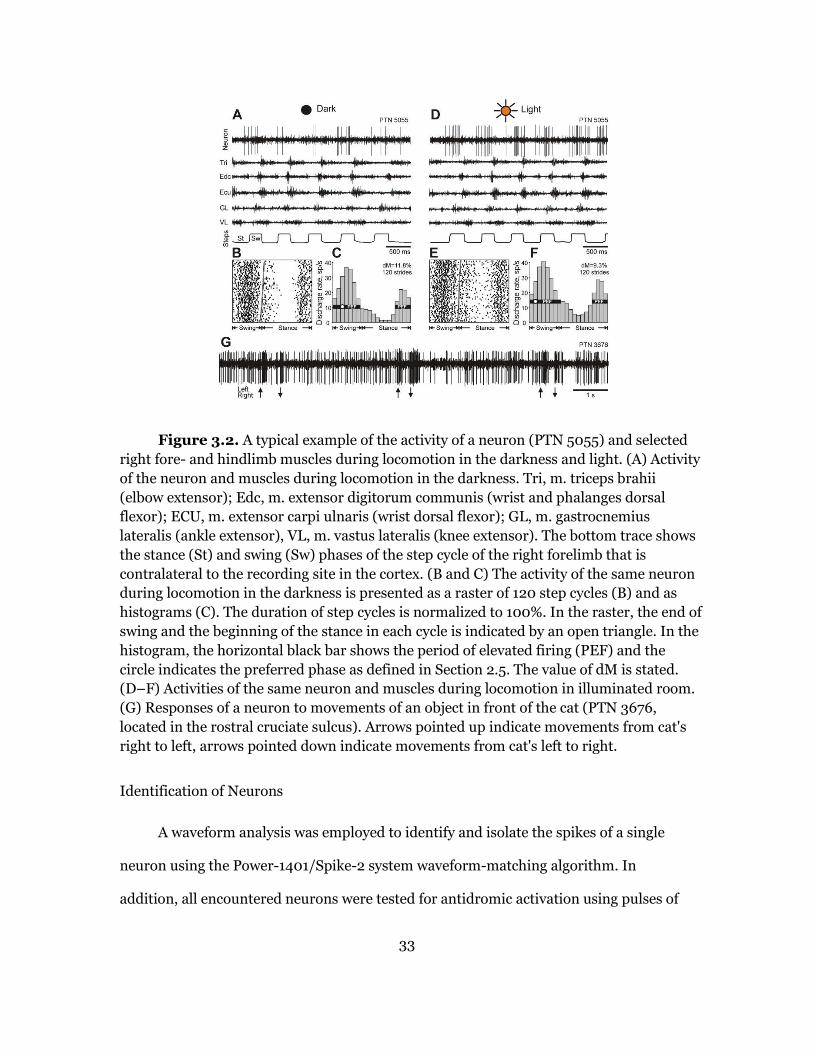
33
Figure 3.2. A typical example of the activity of a neuron (PTN 5055) and selected
right fore- and hindlimb muscles during locomotion in the darkness and light. (A) Activity
of the neuron and muscles during locomotion in the darkness. Tri, m. triceps brahii
(elbow extensor); Edc, m. extensor digitorum communis (wrist and phalanges dorsal
flexor); ECU, m. extensor carpi ulnaris (wrist dorsal flexor); GL, m. gastrocnemius
lateralis (ankle extensor), VL, m. vastus lateralis (knee extensor). The bottom trace shows
the stance (St) and swing (Sw) phases of the step cycle of the right forelimb that is
contralateral to the recording site in the cortex. (B and C) The activity of the same neuron
during locomotion in the darkness is presented as a raster of 120 step cycles (B) and as
histograms (C). The duration of step cycles is normalized to 100%. In the raster, the end of
swing and the beginning of the stance in each cycle is indicated by an open triangle. In the
histogram, the horizontal black bar shows the period of elevated firing (PEF) and the
circle indicates the preferred phase as defined in Section 2.5. The value of dM is stated.
(D–F) Activities of the same neuron and muscles during locomotion in illuminated room.
(G) Responses of a neuron to movements of an object in front of the cat (PTN 3676,
located in the rostral cruciate sulcus). Arrows pointed up indicate movements from cat's
right to left, arrows pointed down indicate movements from cat's left to right.
Identification of Neurons
A waveform analysis was employed to identify and isolate the spikes of a single
neuron using the Power-1401/Spike-2 system waveform-matching algorithm. In
addition, all encountered neurons were tested for antidromic activation using pulses of

34
graded intensity (0.2 ms duration, up to 0.5 mA) delivered through the bipolar
stimulating electrodes to the medullary pyramidal tract. The identification of antidromic
responses was determined by the test for the collision of spikes (Bishop et al., 1962;
Fuller and Schlag, 1976), which is illustrated in Fig. 3.1B. For the purpose of conduction
velocity calculation, the distance between electrodes in the medullary pyramidal tract
and at recording sites in the peri-cruciate cortex was estimated at 51 mm. Neurons were
classified as fast- or slow-conducting PTNs based on the criteria of Takahashi
(Takahashi, 1965): PTNs with conduction velocity of 21 m/s or higher were considered to
be fast-conducting, while those with conduction velocities below this threshold were
considered to be slow-conducting. Neurons were tested for antidromic activation before,
during, and after locomotion.
Recordings were obtained from the rostral and lateral sigmoid gyrus (forelimb
representation area) as well as from the postcruciate cortex within the fold of the
cruciate sulcus (forelimb and hindlimb representations) (Fig. 3.1A, C and D). These areas
are considered to be the motor cortex based on a considerable body of data obtained by
means of inactivation, stimulation, and recording techniques (Armstrong and Drew,
1984b, 1985a, b; Beloozerova and Sirota, 1993a; Drew, 1993; Martin and Ghez, 1985,
1993; Nieoullon and Rispal-Padel, 1976; Phillips and Porter, 1977; Vicario et al., 1983). A
parasagittal section through the frontal cortex with a reference electrolytic lesion next to
giant pyramidal cells in cortical layer V, which are characteristic of motor cortex area 4γ,
is shown in Fig. 3.1C (pre-cruciate cortex) and 3.1D (post-cruciate cortex). To determine
the locations of the fore- and hindlimb representations within the motor cortex, somatic
receptive fields were mapped while the animals were resting on a pad with their head
restrained. Somatosensory stimulation was produced by palpation of muscles and

35
tendons and by passive movements of joints. Neurons responsive to passive movements
of joints were further assessed for directional preference.
Responses to visual stimulation were tested by presenting moving stimuli: circles
2.5 cm in diameter, stripes 5 cm wide and 100 cm long, fields 50 x 50 cm, and complex
three-dimensional stimuli such as toys, laboratory objects, and hands. Two-dimensional
stimuli were black. All stimuli were presented against the natural laboratory background
and were moved in different directions in the frontal plane at the distance of
approximately 50 cm in front of the animal and also toward the animal and away from it
with the speed of 0.5–1.0 m/s.
Analysis of Neural Activity
To compare the activity of neurons during locomotion in the light and darkness we
used only the strides in which average durations in the two conditions differed by less
than 10%. These strides were selected from three strides made in the middle of walkway.
Earlier we showed that in the middle of the corridor cats walk with nearly constant speed
(Beloozerova et al. 2010). For forelimb-related cells, the onset of the swing phase of the
right forelimb was taken as the beginning of the step cycle. The duration of each cycle
was divided into twenty equal bins. For hindlimb-related neurons, the beginning of the
16th bin of the forelimb cycle, which corresponds to the beginning of the swing phase of
the right hind limb, was taken as the onset of the hind limb step cycle. A phase histogram
of the discharge rate of each neuron in the step cycle was then generated and averaged
over all selected cycles (Fig. 3.2B, C, E, and F). Phase histograms were smoothed by
recalculating the values of the bins according to the equation Fn’=0.25 x Fn-1 + 0.5 x Fn +
0.25 x Fn+1, when Fn is the bin’s original value. The first bin was considered to follow the
last bin, and the last bin was considered to precede the first bin. The “depth” of

36
modulation, dM, was calculated as dM = (Nmax - Nmin)/N x 100%, where Nmax and Nmin are
the number of spikes in the maximal and the minimal histogram bin, and N is the total
number of spikes in the histogram. Neurons with dM>4% were judged to be stride-
related. This was based on an analysis of fluctuations in the activity of neurons in the
resting animal. For this analysis, the activities of 100 neurons recorded while the cat was
sitting with its head restrained were processed as if the cat was walking (Marlinski et al.,
2012). The timing of steps made by the same cat during the preceding walking test was
used to construct the histogram. In stride-related neurons, the period of elevated firing
(PEF) was defined as the portion of the cycle in which the activity level exceeds the
minimal activity by 25% of the difference between the maximal and minimal frequencies
in the neuronal discharge histogram (Fig. 3.2C and F). PEFs were smoothed by
renouncing all one-bin peaks and troughs (a total of 1% of bins were altered throughout
the database). The "preferred phase" of discharge of each neuron with a single PEF was
assessed using circular statistics (Batshelet, 1981; Fisher, 1993; Drew and Doucet, 1991;
see also Beloozerova et al., 2003; Sirota et al., 2005).
For comparisons of the discharge rate of individual neurons in different conditions
and between groups of neurons, the two-tailed Student’s t-test was used to determine
statistical significance. When comparing dM, preferred phase, and duration of PEF,
differences equal to or greater than 20%, 10%, and 20%, respectively, were considered
significant. These criteria were established based on the results of a bootstrapping
analysis (Efron and Tibshirani, 1993; Stout and Beloozerova, 2012), which compared
differences in discharges between various reshufflings 0f strides of the same locomotion
task. It showed that natural PTN activity fluctuations remain within these limits with
95% confidence. Unless noted otherwise, for all mean values, the standard error of the
37
mean (SEM) is given. When data were categorical, a nonparametric Fisher's two-tailed
test was used
Histological Procedures
At the termination of experiments, cats were deeply anaesthetized with
pentobarbital sodium. Several reference lesions were made in the regions of the motor
cortex from which neurons were sampled. Cats were then perfused with isotonic saline
followed by a 3% paraformaldehyde solution. Frozen brain sections of 50 μm thickness
were cut in the regions of recording and stimulating electrodes. The tissue was stained
for Nissl substance with cresyl violet. Zoning of the cortex was performed according to
established criteria (Hassler and Muhs-Clement, 1964; Ghosh, 1997a; Weyand et al.,
1999). The positions of recording tracks in the motor cortex were estimated in relation to
the reference lesions (Fig. 3.1C and D). The positions of stimulation electrodes in the
medullar pyramids were verified.
Results
Kinematics of Walking in the Light and Darkness are Similar
During the recording of each individual neuron, cats walked between 10 and 80
(typically 20-50) times down each of the chamber’s corridors. From these runs, 20–200
strides (72±34 in the light and 73±37 in the darkness, mean ± SD) made in the middle of
the corridor (with average durations in the light and dark differing by less than 10%)
were selected for analysis. One of the cats walked relatively quickly (cat 1) and the other
two walked more slowly (cats 2 and 3). The average durations of strides selected were
600 ms and 740-780 ms, respectively (Fig. 3.3A). This corresponded to a walking speed
of 0.83 m/s and 0.65-0.68 m/s, respectively. Although different cats walked with a
38
slightly different speed overall, each of them had approximately the same speed during
walking under the two illumination conditions. Only cat 2 had a statistically significantly
different average duration of strides during locomotion under normal illumination and
in the dark, and the difference was 20 ms or 2.7% of the stride cycle. The ratio of the
stance duration to the cycle duration (the stride duty factor) varied only slightly between
cats (Fig. 3.3B), and was 60-65% on average. There was a slight difference of 1.5% for the
average stride duty factor in cat 3 between illumination conditions.
Movements of the right paw and scapula were recorded in cats 2 and 3 while they
walked around the chamber under illumination protocol similar to that used during
neuronal recordings. Representative examples of vertical paw and scapula positions, and
horizontal and vertical velocities during locomotion in the two conditions are shown in
Figs. 3.3C and D. For both cats, movements of the paw were similar in all parameters
tested (Fig. 3.3C). Position of the scapula was 2.3±1.3 mm higher throughout most of the
step cycle during walking in the illuminated room as compared to walking in the
darkness; however, in the middle of the stance phase scapula position was always similar
between the conditions (Fig. 3.3D, top panel). Vertical velocities of the scapula were also
similar (Fig. 3.3D, middle panel). In approximately one third of the trials, horizontal
velocities were slightly higher (by 7-10%) during walking in the illuminated room as
compared to walking in the darkness (Fig. 3.3D, lower panel).

39
Fig. 3.3 Kinematics of locomotion in the darkness and light. (A) The average duration of the stride of each cat in the two light conditions. (B) The average stride duty factor (the percent of the total cycle in which the right forelimb is in the stance phase). (C and D) Vertical position (top panel), and vertical (middle panel) and horizontal (bottom panel) velocity of the right paw (C) and scapula (D). Error bars are SDs. Stars denote significant differences in parameters between the conditions (Student's unpaired t test, p < 0.05).

40
Activities of Muscles during Walking in the Light and Darkness
In cats 1 and 2, the activity of three forelimb and three hindlimb muscles was
recorded on each side of the body. Muscles showed only very minor differences in the
activity during locomotion under different lightening conditions (Fig. 3.4). Elbow
extensor m. triceps brachii was typically active slightly longer during walking in the light
(Student's unpaired t test, p<0.05), by 5-10% of the cycle. Wrist and phalanges dorsal
flexor m. extensor digitorum communis often began later in the cycle during walking in
the light (Student's unpaired t test, p<0.05), by 5-10%, but finished at the same time as
during walking in the darkness. Ankle extensor m. soleus occasionally showed
differences analogous to those seen in the m. extensor digitorum communis, however in
other trials was active uniformly between conditions. Wrist dorsal flexor m. extensor
carpi ulnaris during walking in the light was more active at the peak (Student's unpaired
t test, p<0.05) generating 3.8±1.5% more output (mean±SD). At the same time, the
activity of the ankle extensor and knee flexor m. lateral gastrocnemius and that of the
knee extensor m. vastus lateralis were typically indistinguishable during locomotion in
the darkness and light.
Characteristics of Neurons
Neuronal data was collected from a total of 29 tracks through the motor cortex of
three cats (7 tracks in cat 1, 13 in cat 2, and 9 in cat 3; Fig. 3.1A). This data was
considered together to analyze the activity of 146 neurons (19 from cat 1, 77 from cat 2,
and 50 from cat 3). Based on cytoarchitectural features, it was determined that all
neurons were located in layer V of the motor cortex area 4γ. Fifty-one cells responded to
stimulation of the pyramidal tract (17 from cat 1, 22 from cat 2, and 12 from cat 3). The
latencies of responses ranged from 0.8 to 4.6 ms. Estimated conduction velocities were
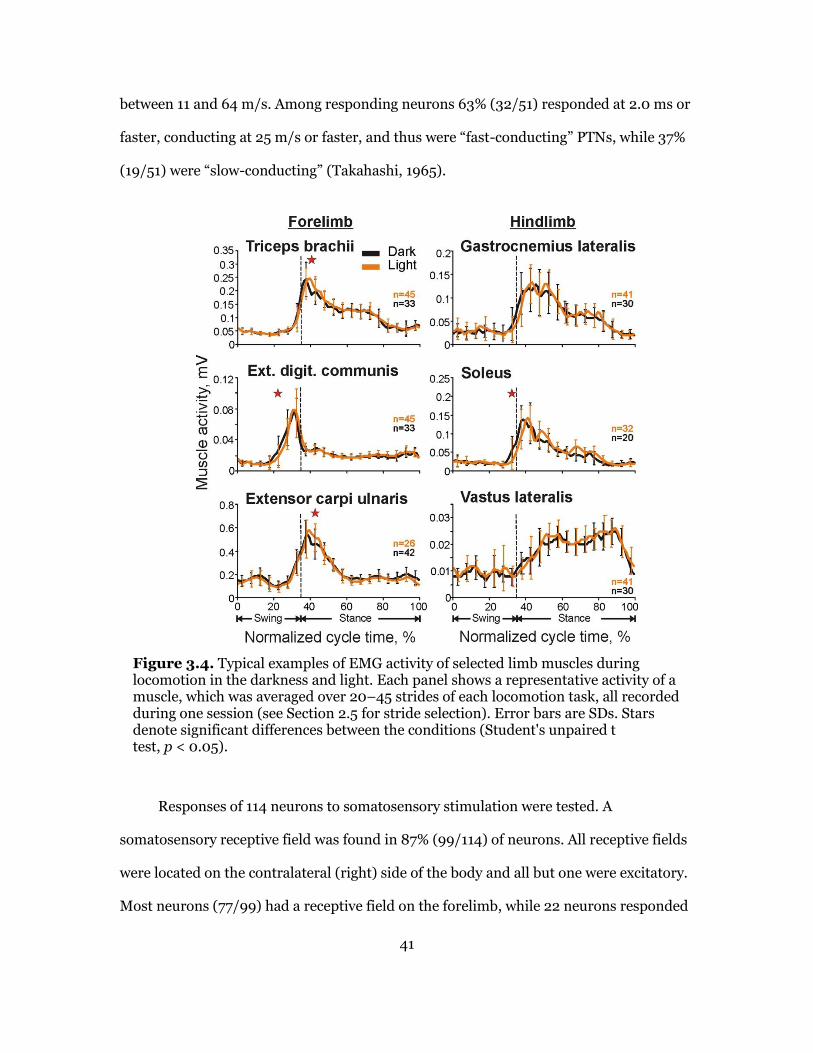
41
between 11 and 64 m/s. Among responding neurons 63% (32/51) responded at 2.0 ms or
faster, conducting at 25 m/s or faster, and thus were “fast-conducting” PTNs, while 37%
(19/51) were “slow-conducting” (Takahashi, 1965).
Figure 3.4. Typical examples of EMG activity of selected limb muscles during locomotion in the darkness and light. Each panel shows a representative activity of a muscle, which was averaged over 20–45 strides of each locomotion task, all recorded during one session (see Section 2.5 for stride selection). Error bars are SDs. Stars denote significant differences between the conditions (Student's unpaired t test, p < 0.05).
Responses of 114 neurons to somatosensory stimulation were tested. A
somatosensory receptive field was found in 87% (99/114) of neurons. All receptive fields
were located on the contralateral (right) side of the body and all but one were excitatory.
Most neurons (77/99) had a receptive field on the forelimb, while 22 neurons responded
42
to stimulation of the hindlimb. From neurons responding to stimulation of the forelimb,
23 were activated by passive movements of the shoulder or palpation of back or neck
muscles, 31 responded to movements in the elbow joint or palpation of arm muscles, and
23 were activated by movements of the wrist or palpation of muscles on the forearm or
paw. Several neurons responded to movement in two joints or the entire forelimb.
Neurons activated by a passive movement in a joint often had a preferred direction. One
third (n=8) of shoulder-related cells responded to adduction of the shoulder, while
others responded to either abduction (n=4), flexion (n=4), or extension (n=2) of the
joint. From elbow-related cells, 7 neurons responded to flexion and 3 were activated by
extension. From wrist-related neurons, 7 responded to wrist ventral flexion while 4
responded to dorsal flexion.
One half of neurons activated by stimulation of the hindlimb responded to
movement or palpation of the ankle. They often were also directionally specific with 5
neurons responding only to ankle flexion and 3 only to ankle extension. From the other
hindlimb-related cells, 4 responded to movements in the knee, 2 to the hip, and 2 to the
paw.
From the group of 15 unresponsive somatosensory neurons, nine responded to
visual stimuli. Four of these cells were activated by an object moving across the field of
view from the periphery to the central field of vision and three were activated by
approach of an object. An example of a neuron responding to movements of an object in
front of the cat is shown in Fig. 3.2G. All visually responsive cells were located within
the forelimb representation of the area 4γ, and eight of the nine were found in the post-
cruciate fold of the sigmoid gyrus.
43
A typical example of activity of a neuron during walking in the light and dark is
shown in Fig. 3.2A-F. The neuron was recorded from the forelimb representation region
but it was not responsive to either somatosensory or visual stimulation. During
locomotion in the dark, the neuron’s activity was modulated in the rhythm of strides: it
was high at the end of stance and during most of the swing phases, while low in the
beginning and middle of the stance phase. When the lights were turned on, the neuron’s
activity increased throughout all of the step cycle. The raster plots in Fig. 3.2B and E
show the activity of the neuron across 120 individual strides during locomotion in the
dark (B) and light (E). The pattern of activity was very consistent across strides of each
locomotion task, but during walking in the light there was more activity during the
middle of the stance phase compared to walking in the dark. The activity is summed in
Fig. 3.2C and F showing histograms of neuron firing rates across the step cycle during
locomotion in the dark (C) and light (F). The period of elevated firing (PEF, see
definition in Methods) is indicated by a black horizontal bar; it was contained within the
swing and late stance phase of the step during both locomotion tasks. The preferred
phase (indicated by a circle in Fig. 3.2C and E) was in the beginning of the swing phase
during both locomotion tasks.
Activity of Neurons during Locomotion in the Darkness
The mean activity of the population during walking in the darkness was 10.7±0.6
spikes/s. The discharge rate of 90% (131/146) of cells was modulated in the rhythm of
strides: it was higher in one phase of the stride and lower in another phase. The great
majority of neurons (79%, 104/131) exhibited a single PEF, while 21% (27/131) had two
PEFs. The average depth of modulation in one- and two-PEF populations was similar:
10.6±0.6 and 9.7±0.7, respectively. In both populations, PEFs and preferred phases were
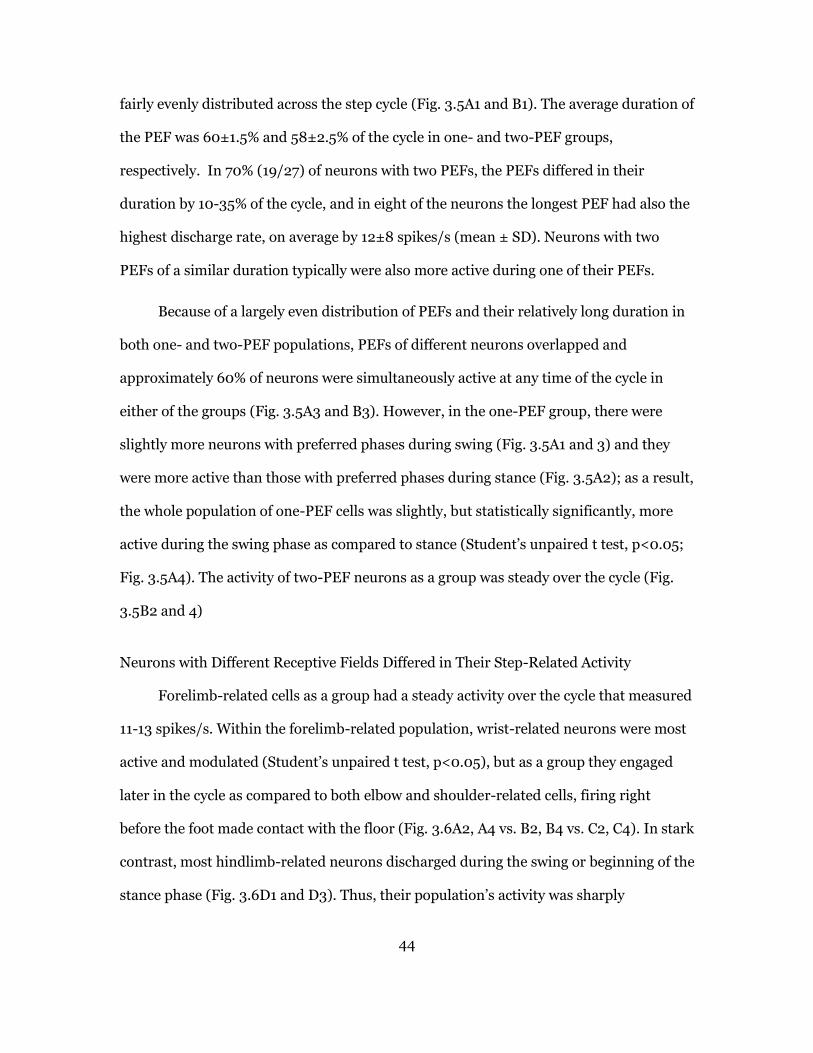
44
fairly evenly distributed across the step cycle (Fig. 3.5A1 and B1). The average duration of
the PEF was 60±1.5% and 58±2.5% of the cycle in one- and two-PEF groups,
respectively. In 70% (19/27) of neurons with two PEFs, the PEFs differed in their
duration by 10-35% of the cycle, and in eight of the neurons the longest PEF had also the
highest discharge rate, on average by 12±8 spikes/s (mean ± SD). Neurons with two
PEFs of a similar duration typically were also more active during one of their PEFs.
Because of a largely even distribution of PEFs and their relatively long duration in
both one- and two-PEF populations, PEFs of different neurons overlapped and
approximately 60% of neurons were simultaneously active at any time of the cycle in
either of the groups (Fig. 3.5A3 and B3). However, in the one-PEF group, there were
slightly more neurons with preferred phases during swing (Fig. 3.5A1 and 3) and they
were more active than those with preferred phases during stance (Fig. 3.5A2); as a result,
the whole population of one-PEF cells was slightly, but statistically significantly, more
active during the swing phase as compared to stance (Student’s unpaired t test, p<0.05;
Fig. 3.5A4). The activity of two-PEF neurons as a group was steady over the cycle (Fig.
3.5B2 and 4)
Neurons with Different Receptive Fields Differed in Their Step-Related Activity
Forelimb-related cells as a group had a steady activity over the cycle that measured
11-13 spikes/s. Within the forelimb-related population, wrist-related neurons were most
active and modulated (Student’s unpaired t test, p<0.05), but as a group they engaged
later in the cycle as compared to both elbow and shoulder-related cells, firing right
before the foot made contact with the floor (Fig. 3.6A2, A4 vs. B2, B4 vs. C2, C4). In stark
contrast, most hindlimb-related neurons discharged during the swing or beginning of the
stance phase (Fig. 3.6D1 and D3). Thus, their population’s activity was sharply
45
modulated with a peak during swing that reached approximately, 20 spike/s (Fig. 3.6
D4). Visually responsive neurons (n=9) were as active as the rest of population, however
only five displayed activity that was step cycle related. This was a significantly smaller
proportion of step-related cells as compared to the entire population (Fisher's two-tailed
test, p=0.0001)
Figure 3.5. Population characteristics of one- and two-PEF neurons during locomotion in the darkness and light. (A1 and C1) Phase distribution of PEFs of all one-PEF neurons during locomotion in the dark (A1) and under normal illumination (C1). Each row represents the PEF of one cell. A circular mark on each PEF denotes the cell's preferred phase. Neurons are rank-ordered so that those with a preferred phase earlier in the cycle are plotted on the top of the graph. Vertical interrupted lines indicate the end of swing and beginning of stance phase. (A2 and C2) Corresponding phase distributions of discharge frequencies. The average discharge frequency in each 1/20th portion of the cycle is color-coded according to the scale shown at the bottom of the figure. (A3 and C3) Proportion of active one-PEF neurons (neurons in their PEF) in different phases of the step cycle during walking in the darkness (A3) and light (C3). (A4 and C4) The mean discharge rate of one-PEF neurons during walking in the darkness (A4) and under normal illumination (C4). Thin lines show SEM. (B1–4 and D1–4) Characteristics of two-PEF neurons locomotion in the darkness (B1–4) and light (D1–4). Designations are similar to those in (A) and (C).

46
Figure 3.6. Population characteristics
of neurons with different
somatosensory receptive fields during
locomotion in the darkness and light. (A
and E) Activity of neurons responsive to
movements in the shoulder joint,
and/or palpation of back or neck
muscles during locomotion in the
darkness (A) and under normal
illumination (E). (A1 and E1) Phase
distribution of PEFs. (A2 and E2)
Corresponding phase distribution of
discharge frequencies. The average
discharge frequency in each 1/20th
portion of the cycle is color-coded
according to the scale shown at the
bottom of the figure. (A3 and E3)
Proportion of active neurons (neurons
in their PEFs) in different phases of the
step cycle. (A4 and E4) The mean
discharge rate. Thin lines show SEM.
Vertical interrupted lines denote end of
swing and beginning of stance phase. (B
and F) Activity of neurons responsive to
passive movement of the elbow joint or
palpation of arm muscles. (C and G)
Activity of neurons responsive to
passive movement in the wrist joint or
palpation of muscles on the forearm or
paw. (D and H) Activity of neurons
responsive to stimulation of the
hindlimb.

47
Effect of Light on the Activity of Neurons during Locomotion
The activity of 49% (71/146) of neurons was different during locomotion in the
light as compared to the darkness. The mean discharge rate was different in 19%
(28/146) of neurons: it was higher in 15 cells by 30±3% and lower in 13 cells by an
approximately similar amount (Student’s unpaired t test, p<0.05; Fig. 3.7A). The depth
of frequency modulation was different in 24% (32/131) of neurons. In the light, it was
higher in 11 cells by 32±4%, and lower in 21 cells by 50±7% (Fig. 3.7B). The duration of
the PEF was different in 19% (25/131) of neurons. In the light, it was shorter in 13 and
longer in 12 cells by 20-40% of the cycle (Fig. 3.7C).
Number of PEFs was different in 26% (34/131) of cells. A fifth of neurons with one-
PEF in the dark (21%, 22/104) had two PEFs in the light. This typically occurred via an
appearance of a second trough within the PEF (n=7; Fig. 3.8A and B), an appearance of a
new PEF within the trough (n=6; Fig. 3.8C and D), or an increase of activity within a part
of the PEF (n=5; Fig. 3.8E and F). On the other hand, 31% (8/26) of neurons with two-
PEFs in the dark had just one PEF in the light. This typically occurred by an increase of
activity within one of the troughs so that two of the PEFs became fused together (n=4),
or by reduction in the activity within one of the PEFs (n=3; Fig. 3.8G and H). As a result
of these differences in the number of PEFs in individual neurons, during walking in the
light, there were less one-PEF and more two-PEF neurons than during walking in the
darkness (Fig. 6A1,2 and B1,2 vs. C1,2 and D1,2). In addition to neurons having a
different number of PEFs in different lighting conditions, the activity of two cells was
step cycle-modulated only in the light, whereas the activity of two others was only
modulated in the darkness. In the population of neurons that had one PEF during both
conditions (n=86), the preferred phase was very stable with only three neurons having a
different preferred phase in the light.
48
The great majority of neurons (80%, 57/71) had only one or two parameters of
their activity different between lighting conditions: most often the average discharge rate
and the duration of the PEF, or the duration of the PEF and the number of PEFs, or the
average discharge rate and the depth of modulation. Some neurons (20%, 14/71),
however, differed in three, four, or even all five parameters measured. Figure 8D shows
distribution of neurons with a statistically significant difference in at least one parameter
of the activity between dark and light conditions across the three-dimensional space of
(i) change in the average discharge rate vs. (ii) change in the duration of the PEF vs. (iii)
change in the depth of modulation. One can see that the light substantially affected the
activity of motor cortical neurons. Moreover, there was a relationship between changes
in the average discharge rate, depth of modulation, and width of the PEF: as the
discharge rate or the width of the PEF increased, the depth of modulation tended to
decrease (Fig. 3.7E and F). There were some differences, however, in how different
neurons responded to the light during locomotion.
Neurons with different Numbers of PEFs
Two-PEF neurons responded stronger to light as compared to both unmodulated
and one-PEF cells. In the light, a much larger portion of two-PEFs neurons (25%, 6/26)
had a lower average discharge rate than in the darkness as compared to one-PEF and
unmodulated neurons, of which only 5% and 7% had a lower rate in the light (6/105 and
1/14, respectively; Fisher’s two-tailed test, p=0.01). In addition, a larger portion of two-
PEF cells (21%, 5/26) had a greater depth of locomotion-related frequency modulation in
the light than in the darkness as compared to one-PEF neurons, from which only 6%
(6/105) had a greater modulation depth in the light (Fisher’s two-tailed test, p=0.042).

49
Figure 3.7: Comparison of activity characteristics of individual neurons between locomotion in the darkness and light. (A) Mean discharge frequency averaged over the stride. (B) Depth of frequency modulation, dM. (C) Duration of PEF; for two-PEF neurons, the combined duration of two PEFs is given. (A–C) The abscissa and ordinate of each point show the values of a characteristic of a neuron during locomotion in the darkness and light, respectively. Neurons whose characteristics were statistically significantly different during the two tasks (see Section 2.5) are shown as filled circles; others are shown as open circles. (D) Neurons with a statistically significant difference in at least one of the above parameters of the activity between two conditions. The abscissa, ordinate, and applicate of each point show the difference in a discharge characteristic of a neuron between dark and light conditions. The difference is positive if the value of the parameter was larger during locomotion in the light. The star in the middle of the cube denotes the zero point. (E) Negative correlation between the relative change in the depth of modulation, dM, and activity, Act. (F) Negative correlation between the change in the depth of modulation and duration (width) of PEF, PEFw. In (E) and (F): the abscissa and ordinate of each point show the difference in a discharge characteristic of a neuron between two illumination conditions. The difference is positive if the value of the parameter was larger during locomotion in the light. Only neurons with statistically significant difference in the dM between two walking conditions are shown. The coefficient of correlation (r) is indicated.

50
Figure 3.8. Differences in discharge patterns of neurons during locomotion in the darkness and light. (A) A schematic presentation of the most frequently observed type of difference in the discharge pattern. In the light, a subtle trough within the one PEF seen during walking in the darkness deepens and divides the PEF into two. The black line shows activity during walking in the darkness, and orange line shows the activity during walking in the light. The vertical dotted line shows end of swing and beginning of stance phase. (B) An example activity of a neuron exhibiting this behavior. The dark gray area histogram shows the activity of the neuron during locomotion in the darkness. The orange bar histogram shows the activity during locomotion in the light. To promote visualization of the difference in activities between two tasks, the stride cycle is shown twice. (C and D): same as (A and B) but showing the second most frequent type of discharge pattern difference. The transition from one- to two-PRF discharge pattern occurred because in the light a new PEF appeared within the former trough. (E and F): same as above but showing the third most frequent type of discharge pattern change in the light from one to two PEFs per cycle: by an increase in activity within a part of the PEF. (G and H) Same as above but showing the discharge pattern change from two- to one-PEFs per cycle.
51
Neurons with different Receptive Fields
A larger portion of hindlimb-related cells (36%, 8/22) had different discharge rates
during walking in the darkness and light as compared to forelimb-related cells (14%,
11/76; Fisher's two-tailed test, p=0.032). In addition, all but two of the hindlimb-related
neurons discharged at a lower frequency in the light than in the dark, unlike forelimb-
related cells, which most often were more active in the light (Fisher's two-tailed test,
p=0.015).
Of the nine visually responsive cells, two had a higher discharge rate and one had a
lower rate in the light than in the darkness. Of five cells with a discharge rate that was
step-phase related in the darkness, two had a lower depth of modulation in the light.
Differences in the number of PEFs were inconsistent: the number of PEFs was smaller in
two and greater in one cell, and there was no difference in two other cells. There was no
difference to the duration of the PEF in any of visually responsive cells between light and
dark conditions.
Fast- and Slow- Conducting PTNs
The discharge rate of 45% (23/51) of PTNs was different during locomotion in the
light and darkness. Nearly a quarter of fast-conducting PTNs, 22% (7/32), had a lower
activity in the light. This was different from the behavior of slow-conducting PTNs,
which never had a lower discharge rate in the light (Fisher's two-tailed test, p=0.037).
Overall, considering fast and slow-conducting cells together, PTNs had a tendency to
discharge at different rates during locomotion in the light and darkness more often than
unidentified neurons. In contrast to the unidentified neurons, which often had a shorter
PEF in the light than in the darkness, the PEF of PTNs almost never was shorter in the
light (Fisher's two-tailed test, p=0.01). PTNs tended to have two or more parameters of
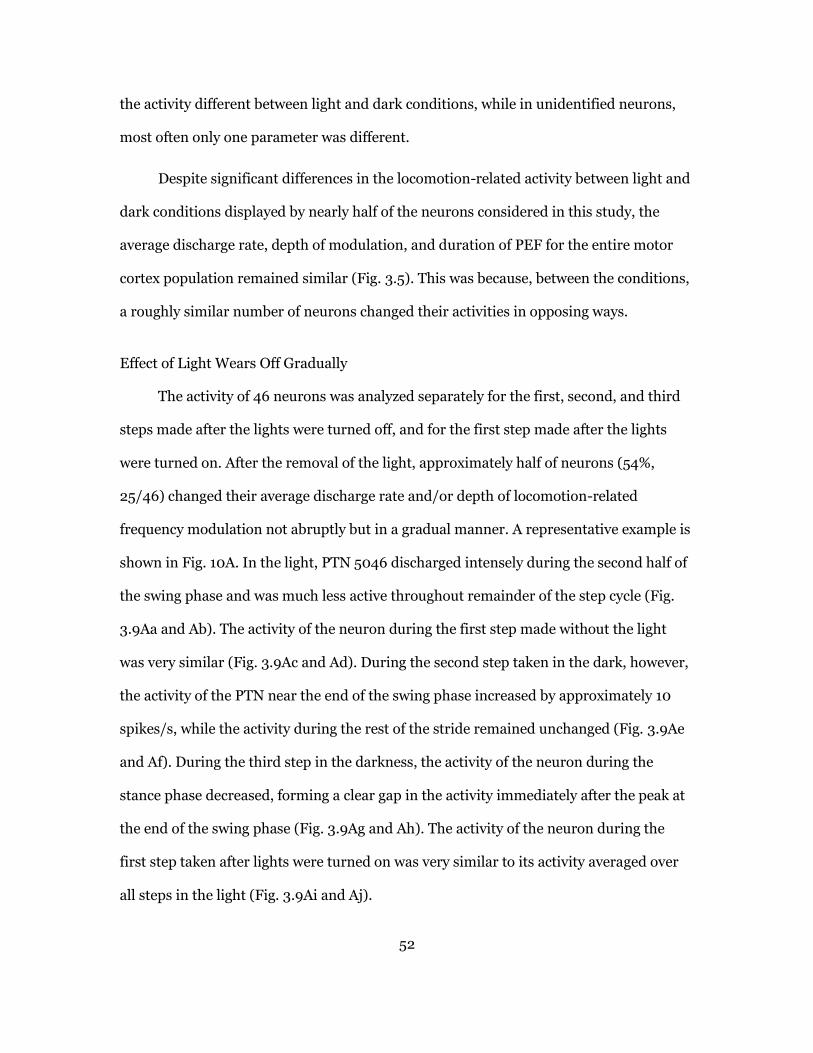
52
the activity different between light and dark conditions, while in unidentified neurons,
most often only one parameter was different.
Despite significant differences in the locomotion-related activity between light and
dark conditions displayed by nearly half of the neurons considered in this study, the
average discharge rate, depth of modulation, and duration of PEF for the entire motor
cortex population remained similar (Fig. 3.5). This was because, between the conditions,
a roughly similar number of neurons changed their activities in opposing ways.
Effect of Light Wears Off Gradually
The activity of 46 neurons was analyzed separately for the first, second, and third
steps made after the lights were turned off, and for the first step made after the lights
were turned on. After the removal of the light, approximately half of neurons (54%,
25/46) changed their average discharge rate and/or depth of locomotion-related
frequency modulation not abruptly but in a gradual manner. A representative example is
shown in Fig. 10A. In the light, PTN 5046 discharged intensely during the second half of
the swing phase and was much less active throughout remainder of the step cycle (Fig.
3.9Aa and Ab). The activity of the neuron during the first step made without the light
was very similar (Fig. 3.9Ac and Ad). During the second step taken in the dark, however,
the activity of the PTN near the end of the swing phase increased by approximately 10
spikes/s, while the activity during the rest of the stride remained unchanged (Fig. 3.9Ae
and Af). During the third step in the darkness, the activity of the neuron during the
stance phase decreased, forming a clear gap in the activity immediately after the peak at
the end of the swing phase (Fig. 3.9Ag and Ah). The activity of the neuron during the
first step taken after lights were turned on was very similar to its activity averaged over
all steps in the light (Fig. 3.9Ai and Aj).
53
Figure 3.9 Changes in the activity and modulation over the period of darkness. (A) An example of a neuron (PTN 5046) that changed the discharge rate and modulation depth during the period of the darkness. (Aa and Ab) The activity of the neuron during locomotion in the light is presented as a raster of 40 step cycles (a) and as a histogram (b). The duration of step cycles is normalized to 100%. In the raster, the end of swing and the beginning of the stance in each cycle is indicated by an open triangle. (Ac and Ad) The activity of the same neuron during the first step made after lights were turned off (Step 1) is shown as a raster of 40 step cycles (c) and as a histogram (d). (Ae and Af) The activity of the same neuron during the second step after lights were turned off (Step 2) is shown as a raster of 40 step cycles (e) and as a histogram (f). (Ag and Ah) The activity of the neuron during the third step in the darkness (Step 3) is presented as a raster of 40 step cycles (g) and as a histogram (h). (Ai and Aj) The activity of the neuron during the first step made after lights were turned back on is shown as a raster of 30 step cycles (i) and as a histogram (j). (B) Histograms of the activity of another neuron (PTN 5055) that had different activities between light and dark conditions but did not change the activity during the period of the darkness.

54
Out of 25 neurons that changed their activity gradually after removal of the light,
15 changed their average discharge rate, typically increasing it by 3.7±0.8 spikes/s, either
between the 1st and the 2nd or between the 2nd and the 3rd step in the darkness. Fourteen
cells changed the depth of modulation by increasing or decreasing it by 3.8±0.4 %. This
too could occur either between the 1st and the 2nd or between the 2nd and the 3rd step in
the darkness. Among those there were four neurons that changed both the discharge rate
and the depth of modulation as did PTN 5046 shown in Fig. 3.9A. In contrast, 21
neurons out of 46 tested had already changed their activity during the first step in the
dark and did not alter it more during the period of the darkness maintaining the change
until after the lights came back on (Fig. 3.9B).
Discussion
Characteristics of neuronal discharges in the motor cortex during locomotion
found in this study are consistent with earlier reports (Armstrong and Drew, 1984;
Beloozerova and Sirota, 1985, 1993a; 1993b; Drew, 1993; Prilutsky et al., 2005; Stout
and Beloozerova, 2012; Widaewicz et al., 1994). In accordance with previous findings,
the activity of nearly all neurons in layer V was modulated in the rhythm of strides, with
the great majority exhibiting one PEF per cycle. PEFs of forelimb-related neurons were
distributed almost evenly throughout the stride, while those of hindlimb-related neurons
were concentrated in the swing phase, so the group of hindlimb-related cells was
substantially more active during swing (Fig. 3.6).
This is the first investigation of the activity of the motor cortex during locomotion
with and without light and thus the ability of subjects to see. Comparison of motor cortex
population activity during locomotion in the darkness and light, both within this study
(Figs. 3.6 and 3.7) and with data on locomotion in the light that were previously
55
published (Armstrong and Drew, 1984a, b; Beloozerova and Sirota, 1993a; 1993b; Drew,
1993; Prilutsky et al., 2005; Stout and Beloozerova, 2012) showed that they are largely
similar. However, a comparison of activities of individual neurons during locomotion in
the darkness and light revealed that the light has a significant effect on discharges of
cells in the motor cortex. In 49% of neurons the mean discharge rate, depth of
locomotion-related frequency modulation, width of PEF, and/or the number of PEFs
were affected by the light (Figs. 3.7-3.9).
We believe that the differences in firing behavior of motor cortical neurons
between the two lighting conditions are due to the differences in available visual
information, not to a difference in the stride kinematics. We are confident in this
assessment in part because during data analysis, we specifically selected and compared
strides in the darkness and light that closely matched in duration and duty factor (Fig.
3.3A and B). In addition, the three-dimensional kinematics analysis showed that during
these selected steps, the movements of the forepaw were similar (Fig. 3.3C) between the
two conditions and only very minor differences existed in the movements of the scapula
(Fig. 3.3D). Moreover, from six muscles tested, including three from the hindlimb, two
did not show any appreciable differences in EMG timing or amplitude between the two
lighting conditions, and four had only minor differences (Fig. 3.4). One may suggest that
observed differences in neuronal discharges in the motor cortex during locomotion in the
darkness and light reflect different levels of attention to the task by the animal in
different conditions. While this cannot be completely ruled out within our experimental
paradigm, we wish to note that during our testing, the main focus of subjects’ attention
remained unchanged regardless of the illumination condition: cats’ behavior was driven
solely by their desire to complete a round of walking around the chamber to receive a
food reward.
56
The conclusion that the light and thus the ability to see, affects the activity of
neurons in the motor cortex during locomotion is consistent with both anatomical data
and previous reports on widespread distribution of visual responsiveness in frontal
cortex in anesthetized or awake but paralyzed cats (Garcia-Rill and Dobrovsky, 1971,
1974; Weyand et al., 1999). In particular, Weyand and colleagues (1999), working with
awake paralyzed cats, showed that in area 4γ, the area we recorded from, cells are
reliably responsive to visual stimuli, and respond best to the light on/off stimulus. The
motor cortex receives visual information via two groups of routes: cortical and
subcortical. The input from the parietal cortex, areas 5 and 7, is typically viewed as the
main avenue. Indeed, both of these areas respond strongly to visual stimuli and,
especially area 5, project intensively to the motor cortex (Babb et al., 1984; Andujar and
Drew, 2007; Ghosh, 1997). In our preliminary study, however, we found that neurons of
layer III in area 5b, which are the only neurons projecting to the motor cortex from this
area, have rather low activity during locomotion, both in terms of proportion of neurons
involved (58%) as well as their average discharge rates (2.5 spikes/s) and have relatively
similar activity during vision-independent locomotion on a flat surface and vision-
involved locomotion along a horizontal ladder (Beloozerova et al., 2011). Therefore it
appears unlikely that the rather sparse activity of visually unresponsive parietal-to-
motor cortex projection is actually fit to assure quite pronounced visual responses in the
motor cortex during locomotion. On the other hand, when we investigated locomotion-
related activity of the ventrolateral thalamus, which links the motor cortex with the
lateral cerebellum, we found that upon transition from a visually-independent to a
visually-demanding locomotion task, the activity of 79% of neurons in the ventrolateral
thalamus change (Marlinski et al., 2012). The most typical changes were: an increase in
the magnitude of the stride-related frequency modulation, a more precise focusing of the
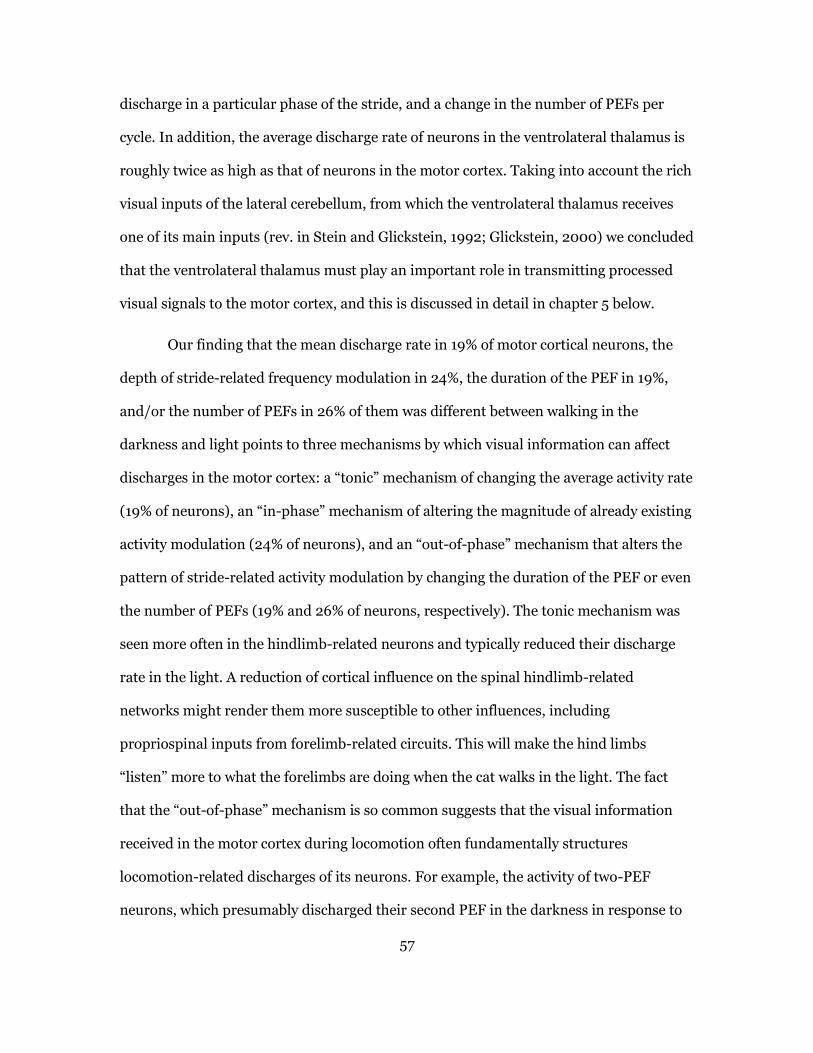
57
discharge in a particular phase of the stride, and a change in the number of PEFs per
cycle. In addition, the average discharge rate of neurons in the ventrolateral thalamus is
roughly twice as high as that of neurons in the motor cortex. Taking into account the rich
visual inputs of the lateral cerebellum, from which the ventrolateral thalamus receives
one of its main inputs (rev. in Stein and Glickstein, 1992; Glickstein, 2000) we concluded
that the ventrolateral thalamus must play an important role in transmitting processed
visual signals to the motor cortex, and this is discussed in detail in chapter 5 below.
Our finding that the mean discharge rate in 19% of motor cortical neurons, the
depth of stride-related frequency modulation in 24%, the duration of the PEF in 19%,
and/or the number of PEFs in 26% of them was different between walking in the
darkness and light points to three mechanisms by which visual information can affect
discharges in the motor cortex: a “tonic” mechanism of changing the average activity rate
(19% of neurons), an “in-phase” mechanism of altering the magnitude of already existing
activity modulation (24% of neurons), and an “out-of-phase” mechanism that alters the
pattern of stride-related activity modulation by changing the duration of the PEF or even
the number of PEFs (19% and 26% of neurons, respectively). The tonic mechanism was
seen more often in the hindlimb-related neurons and typically reduced their discharge
rate in the light. A reduction of cortical influence on the spinal hindlimb-related
networks might render them more susceptible to other influences, including
propriospinal inputs from forelimb-related circuits. This will make the hind limbs
“listen” more to what the forelimbs are doing when the cat walks in the light. The fact
that the “out-of-phase” mechanism is so common suggests that the visual information
received in the motor cortex during locomotion often fundamentally structures
locomotion-related discharges of its neurons. For example, the activity of two-PEF
neurons, which presumably discharged their second PEF in the darkness in response to
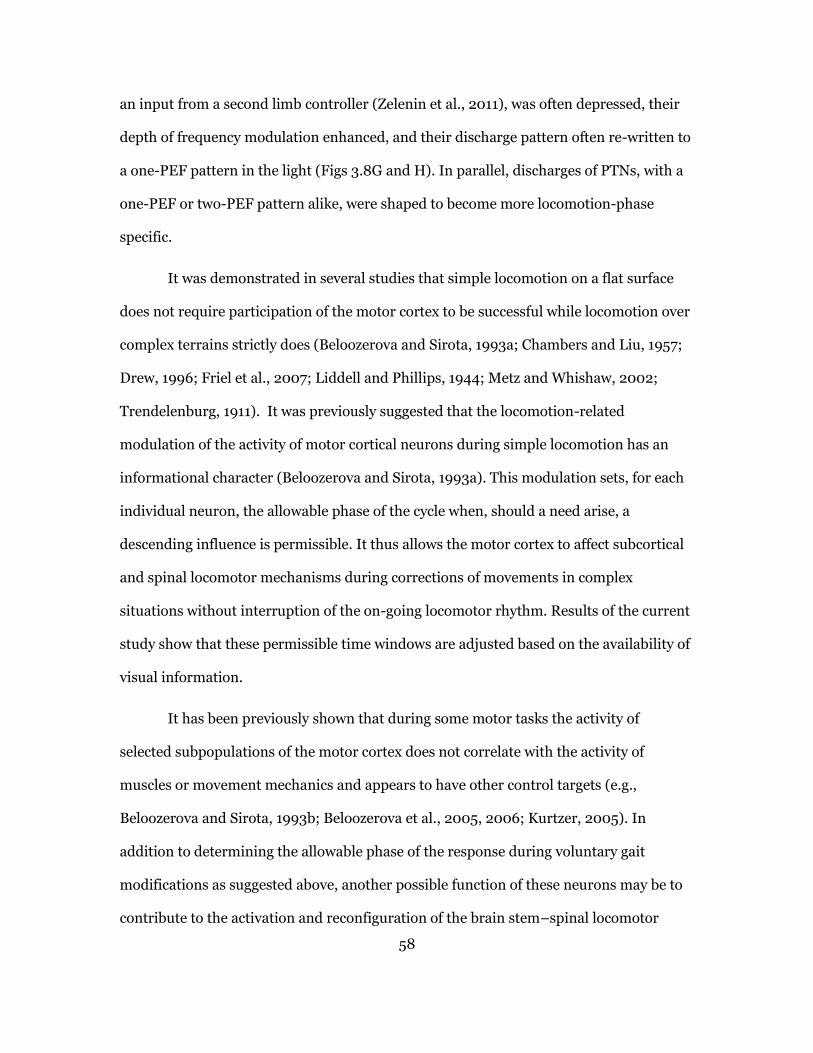
58
an input from a second limb controller (Zelenin et al., 2011), was often depressed, their
depth of frequency modulation enhanced, and their discharge pattern often re-written to
a one-PEF pattern in the light (Figs 3.8G and H). In parallel, discharges of PTNs, with a
one-PEF or two-PEF pattern alike, were shaped to become more locomotion-phase
specific.
It was demonstrated in several studies that simple locomotion on a flat surface
does not require participation of the motor cortex to be successful while locomotion over
complex terrains strictly does (Beloozerova and Sirota, 1993a; Chambers and Liu, 1957;
Drew, 1996; Friel et al., 2007; Liddell and Phillips, 1944; Metz and Whishaw, 2002;
Trendelenburg, 1911). It was previously suggested that the locomotion-related
modulation of the activity of motor cortical neurons during simple locomotion has an
informational character (Beloozerova and Sirota, 1993a). This modulation sets, for each
individual neuron, the allowable phase of the cycle when, should a need arise, a
descending influence is permissible. It thus allows the motor cortex to affect subcortical
and spinal locomotor mechanisms during corrections of movements in complex
situations without interruption of the on-going locomotor rhythm. Results of the current
study show that these permissible time windows are adjusted based on the availability of
visual information.
It has been previously shown that during some motor tasks the activity of
selected subpopulations of the motor cortex does not correlate with the activity of
muscles or movement mechanics and appears to have other control targets (e.g.,
Beloozerova and Sirota, 1993b; Beloozerova et al., 2005, 2006; Kurtzer, 2005). In
addition to determining the allowable phase of the response during voluntary gait
modifications as suggested above, another possible function of these neurons may be to
contribute to the activation and reconfiguration of the brain stem–spinal locomotor
59
networks. Such a function seems to be necessary when one considers the enormous
variety of modifications to locomotion available to animals and humans. Among other
possible functions, not related directly to the production of motor output, the motor
cortical neurons could participate in the modulation of afferent signals’ transmission to
different motor centers.
In addition to these possible roles of the activity of the motor cortex during
locomotion, the fact that it took a step or two for the activity of about half of neurons to
wear off the effect of the light when the lights were extinguished suggests that during
locomotion the activity of neurons in the motor cortex may encode memories of the
visual scene. It is interesting, however, that the activity of few cells that responded to
visual stimuli at rest, during locomotion in the darkness was often step cycle-unrelated,
and that these cells reacted inconsistently and rather weakly to introduction of the light.
These observations suggest that these motor cortical neurons are members of a separate
network, which is perhaps devoted to detection of particular visual features of the
environment.
In conclusion, in this study we extend previous observations of visual
responsiveness of cells in the motor cortex obtained in anesthetized and awake but
paralyzed cats to freely walking cats, and demonstrate that during locomotion the
responsiveness to light in the motor cortex is very common, typically stride phase-
depended, and often significantly modifies the locomotion-related pattern of the activity
observed during walking in the darkness.

60
4. ACTIVITY OF SOMATOSENSORY RESPONSIVE NEURONS IN HIGH
SUBDIVISIONS OF SI CORTEX DURING LOCOMOTION
Published in the Journal of Neuroscience (Favorov et al. 2015)
Abstract
Responses of neurons in the primary somatosensory cortex (SI) during movements
are poorly understood, including even during such simple task as walking on a flat
surface. In this study we have analyzed spike discharges of neurons in the rostral bank of
the ansate sulcus (areas 1-2) in two cats while cats walked on a flat surface or on a
horizontal ladder, a complex task requiring accurate stepping. All neurons (n=82) that
had receptive fields on the contralateral forelimb, during simple locomotion exhibited
frequency modulation of their activity that was phase-locked to the stride cycle. Neurons
with proximal receptive fields (RFs: upper arm/shoulder) and pyramidal tract-projecting
neurons (PTNs) with fast-conducting axons tended to fire at peak rates in the middle of
the swing phase while neurons with RFs on the distal limb (wrist/paw) and slow-
conducting PTNs typically showed peak firing at the transition between swing and stance
phases. Eleven out of 12 neurons with tactile receptive fields on the volar forepaw began
firing towards the end of swing, with peak activity occurring at the moment of foot
contact with floor, thereby preceding the evoked sensory volley from touch receptors.
Requirement to step accurately on the ladder affected 91% of the neurons suggesting
their involvement in control of accuracy of stepping. During both tasks, neurons
exhibited a wide variety of spike distributions within the stride cycle, suggesting that
during either simple or ladder locomotion they represent the cycling somatosensory
events in their activity both predictively before and reflectively after these events take
place.
61
Acknowledgements: This study was supported by NIH R21 NS-078619 (to OVF),
ASU–BNI Interdisciplinary Graduate Program in Neuroscience (to WUN), and NIH R01
NS-058659 (to INB).
Introduction
Primary somatosensory cortical area (SI), comprising cytoarchitectonic areas 3a,
3b, 1 and 2, is structurally and functionally a heterogeneous cortical region. While
neurons in area 3b possess receptive fields (RFs) closely resembling those of the
thalamic neurons, neurons in area 1 and especially in area 2, which receive their major
input from area 3b, possess larger RFs and exhibit greater selectivity for higher-order
stimulus features (Iwamura, 1998). This indicates that areas 1 and 2 occupy
hierarchically high levels in cortical processing of somatosensory information (Felleman
and Van Essen, 1991). It was shown that neurons in area 2 are involved in haptic
perception during object manipulation (Koch and Fester, 1989; Iwamura, 1998; Gardner
et al., 2007) however, due to technical difficulties in monitoring and controlling
spatiotemporal patterns of physical interactions between the hand and manipulated
objects, the nature of information-processing tasks performed by area 2 neurons, their
contribution to perception, or even most basically the somatosensory representation of
events by these neurons remain essentially unknown.
Locomotion is a behaviorally prevalent form of object-body interactions. During
routine locomotion, a regularly repeating pattern of proprioceptive input to SI is
periodically supplemented by tactile input coming from skin areas of the volar feet. It is
believed that this tactile input enables perception of the properties of the walking
surface. The study by Fitzsimmons and colleagues (2009) in rhesus macaques walking
with their hind limbs on a treadmill showed that information about foot contact with the
62
ground can be readily extracted from spike firing patterns of 40-150 neurons
simultaneously recorded in SI areas 1-2, along with information about speed of walking,
step length, positions and angles of the hip, knee and ankle joints, and leg muscle
contractions. In sitting monkeys, however, it appears that, in addition to the
somatosensory information, SI receives an efference copy signals from the motor system.
The major evidence for this is the fact that many SI neurons raise their spike discharge
activity up to few hundreds of milliseconds prior to the onset of an actively generated
limb movement, preceding even EMG activity (e.g., Soso and Fetz 1980; Nelson, 1987;
Lebedev et al., 1994; London and Miller, 2013). Furthermore, in the vibrissae system, it
was shown that both the somatosensory and efference copy signals contribute to
activation of neurons in the SI during whisking (Fee et al., 1997; Kleinfeld and
Deschênes, 2011). Because of difficulties associated with obtaining stable single neuron
recording in walking subjects, however, besides the study of Fitzsimmons and colleagues
in monkeys (2009) and few studies in rats (Chapin and Woodward, 1982a,b), which
investigated treadmill locomotion, little is known about what takes place in SI during
walking.
Here we have analyzed spiking activity of 82 neurons from the forelimb
representations of two cats that walked in an experimental chamber on a flat surface or
on crosspieces of a horizontal ladder, a task that required accurate placing of paws.
Methods
Extracellular recordings from single neurons in areas 1 and 2 of the SI cortex were
obtained during chronic experiments in cats. Two adult females were used. Please refer
to the chapter 2 for details of surgical preparation and recording techniques. Only the
specific techniques are briefly described here.
63
Locomotor Tasks
Two locomotor tasks were used: walking on a flat surface (Fig. 4.1A), and walking
on crosspieces of a horizontal ladder (Fig. 4.1B). Biomechanics and limb muscle activities
in the cat during walking on the flat surface and on the horizontal ladder in a similar
experimental setup have been previously described in details (Beloozerova et al., 2010).
It was shown that walking along the ladder is similar to walking on the flat surface in
nearly all kinematic and EMG parameters tested except that the variability of stride
lengths is much smaller during ladder walking because ladders’ crosspieces narrowly
determine where the cat steps. It was shown in several studies that while walking on the
flat surface does not require vision and can be accomplished without the forebrain,
walking on a ladder relies on vision and requires thalamo-cortical processing to be
successful (Trendelenburg, 1911; Liddell and Phillips 1944; Chambers and Liu 1957;
Beloozerova and Sirota 1993a, 2003; Sherk and Fowler 2001; Metz and Whishaw 2002;
Friel et al. 2007; Marigold and Patla 2008; Rivers et al. 2014).
Cats were trained to walk in an experimental chamber with two connected parallel
corridors (2.5 x 0.3 m each) that is described in the methods section (Chapter 2). In one
corridor the walking surface was flat, while the other corridor contained a horizontal
ladder. The centers of the ladder crosspieces were spaced 25 cm apart, equal to one half
of a cat’s average stride length during locomotion in the chamber with flat floor
(Beloozerova and Sirota, 1993, Beloozerova et al., 2010). The crosspieces had flat tops,
and were 5 cm wide, which was slightly greater than the 3 cm diameter support area of
the cat foot. Therefore cats had had full support for their paws.

64
Figure 4.1. Locomotor tasks. The experimental box was divided into two corridors. In one corridor the floor was flat (A), while the other corridor contained a horizontal ladder (B). C: Duration of strides during flat surface and ladder walking. D: Stride duty factor (proportion of the stance phase in the step cycle) during flat surface and ladder walking. Stars indicate statistically significant difference (p<0.05, t-test).
Surgical Procedures
The surgical procedure was similar to that described in the general methods
section (Chapter 2). On the left side of the head, the dorsal surface of the sigmoid gyrus
was exposed by removal of approximately 1.6 cm2 of bone and dura mater. The region of
the SI cortex was visually identified based on surface features and photographed (Fig.
4.2A, B). The exposure was covered with a 1 mm thick acrylic plate. The plate was pre-
perforated with holes of 0.36 mm in diameter spaced by 0.5 mm, and the holes were
filled with bone wax. It allowed for later insertion of recording electrodes in the SI
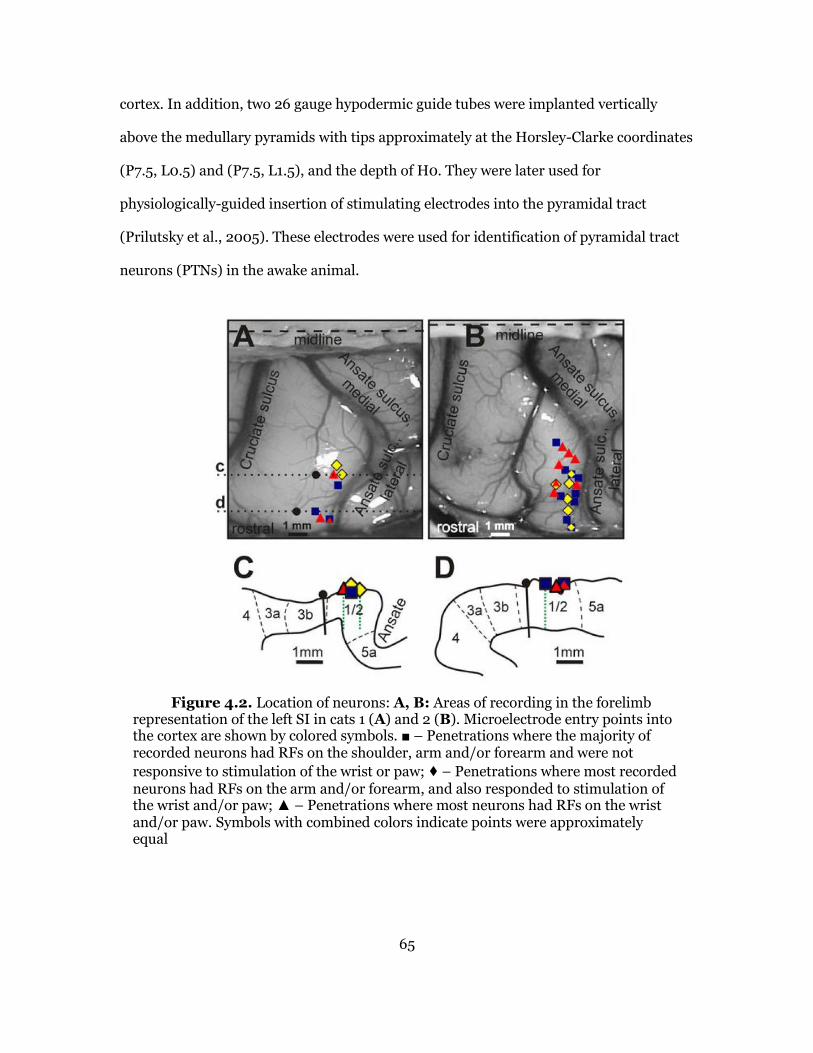
65
cortex. In addition, two 26 gauge hypodermic guide tubes were implanted vertically
above the medullary pyramids with tips approximately at the Horsley-Clarke coordinates
(P7.5, L0.5) and (P7.5, L1.5), and the depth of H0. They were later used for
physiologically-guided insertion of stimulating electrodes into the pyramidal tract
(Prilutsky et al., 2005). These electrodes were used for identification of pyramidal tract
neurons (PTNs) in the awake animal.
Figure 4.2. Location of neurons: A, B: Areas of recording in the forelimb representation of the left SI in cats 1 (A) and 2 (B). Microelectrode entry points into the cortex are shown by colored symbols. – Penetrations where the majority of recorded neurons had RFs on the shoulder, arm and/or forearm and were not
responsive to stimulation of the wrist or paw; ♦ – Penetrations where most recorded neurons had RFs on the arm and/or forearm, and also responded to stimulation of the wrist and/or paw; – Penetrations where most neurons had RFs on the wrist and/or paw. Symbols with combined colors indicate points were approximately equal
66
Single-Unit Recording
Extracellular recordings from the rostral bank of the lateral ansate sulcus were
obtained using tungsten varnish-insulated microelectrodes (120 µm in outer diameter;
FHC Inc., Bowdoin, ME) using procedures similar to those in the study described in
chapter 2. An example of a raw recording from a neuron during locomotion is shown in
Figure 4A.
Identification of Neurons and Classification of their Receptive Fields
The waveform analysis was employed to discriminate and identify the spikes of
individual neurons using the Power-1401/Spike-2 system waveform-matching algorithm.
Only the neurons with stable spike shape were used for analysis. In addition, all neurons
were tested for antidromic activation from the pyramidal tract as described in chapter 3.
A stable response latency and consistent positive collision response were required for
neurons to be classified as PTNs. For calculation of the conduction velocity, the distance
between recording electrodes in the SI and stimulation electrodes in the pyramidal tract
was estimated as 50 mm. This calculation accounted for the curvature of the pathway
and also for the spread of the current and refractory period at the site of stimulation.
The somatic RFs of neurons were examined in animals resting with their head
restrained. Somatosensory stimulation was produced by lightly stroking fur, tapping the
skin with small glass rods, palpation of the muscle bellies and tendons, as well as by
passive joint movements. The spatial extent of an RF was determined by identifying the
entire area from which action potentials could be elicited by the most effective mode of
stimulation.

67
Locomotion Data Analysis
From each walk down the corridor, two or three strides made in the middle of the
walkway were selected for the analysis. It was previously shown that the strides in the
middle of the corridor are normally made at a nearly constant speed with no net
acceleration or deceleration, and that their average stride length during flat surface and
ladder locomotion is identical (Beloozerova et al., 2010). To compare the activity of
neurons during two locomotor tasks we used only the strides for which the average
duration in the two tasks differed by less than 10%
The onset of swing of the right forelimb (contralateral to the SI recording site) was
taken as the beginning of the step cycle. The duration of each step cycle was divided into
20 equal bins, and a phase histogram of the discharge rate of the neuron in the cycle was
generated and averaged over all selected cycles (please see chapter 2 for more detailed
description). The stride-to-stride variability of the mean discharge rate of individual
neurons was calculated as V = (Standard Deviation)2/(Mean rate over the stride cycle).
The “depth” of modulation, dM, PEF (Fig. 4.4), and the Preferred Phase of one-PEF
neurons were calculated as described above.
The effects of locomotor task on parameters of strides, discharge rate of individual
neurons, and mean parameters of group activities of neurons were tested using two-
tailed Student’s t-test. When comparing depth of frequency modulation dM of individual
neurons, their preferred phases of activity, and duration of PEF during the two walking
tasks, differences equal to or greater than 2, 10%, and 20%, respectively, were
considered significant (see chapter 2 for details).
68
Non-parametric χ2 test or t test for proportions were used for comparison of
categorical data. For all tests, the significance level was set at p = 0.05. Unless indicated
otherwise, for all mean values the standard error of the mean (SEM) is given.
Histological Procedures
In deeply anesthetized cats, reference loci were made near the recording sites, and
the brains were obtained from the perfused cats (see methods chapter). The 50 μm
sections were stained for Nissl substance with cresyl violet. The position of stimulation
electrodes in the medullar pyramids was verified. The positions of recording tracks in the
cortex were estimated in relation to the reference lesions and with regard to
cytoarchitectonic boundaries separating areas 3b, 1, 2, and 5a (identified by criteria of
Hassler and Muhs-Clement, 1964; Dykes et al., 1980; McKenna et al., 1981) (Fig. 4.2).
Namely, in parasagittal sections of the lateral portion of the posterior sigmoid gyrus,
moving in the rostrocaudal direction, one can recognize sequentially areas 3b, 1 and 2. In
the area 3b, granular layer IV is readily detected as having a thick band of small, densely
packed cells bounded below by cell-poor layer V and above by sublayer IIIc containing
darkly stained pyramidal cells (Ito and Craig, 2003, Leclerc et al., 1994). Area 1 is
characterized by a clear laminar arrangement and a radial appearance involving all
laminae (Ghosh, 1997a), and the presence of large pyramidal cells in widened layer V
(Leclerc et al., 1994). In the forelimb area, a clear-cut boundary between areas 1 and 2
could reliably be determined (McKenna et al., 1981). Area 2 usually occupies most of the
rostral wall of the lateral ansate. It possesses a thick layer I, wide laminae IIIc and V with
many large pyramidal cells in layer Vb (Ghosh, 1997a), and gradually declining width of
layer VI. In the lateral ansate, it extends towards the fundus of the sulcus where it
borders area 5a. In area 5, laminae III and V are narrower, and lamina IV is well defined

69
(Andujar and Drew, 2007; Ghosh, 1997a). The overall area pattern over the flattened
(planar reconstruction of) hemisphere was most recently reported in general (Clasca et
al., 2000), and in greater detail by Andujar and Drew (2007).
Results
Location and Characteristics of Neurons
This study was confined to SI neurons that were located in the rostral bank of the
lateral ansate sulcus and had RFs on the contralateral forelimb. Eighty two such neurons
were isolated and studied in 26 microelectrode penetrations: 25 neurons from cat 1 and
57 from cat 2. Figures 2 A and B show, relative to the ansate sulcus, the entry points of
microelectrode penetrations, in which neurons were collected in cat 1 (A) and cat 2 (B).
Histological examination showed that all electrode tracks were confined to the
cytoarchitectonic areas 1 and 2 (Fig. 4.2 C, D).
The studied neurons had diverse receptive fields (RFs). The size of the RF varied
from about 2 cm2 to as large as nearly entire lateral or medial aspect of the limb (Fig.
4.3). The most commonly encountered RFs, found in 15% of the neurons, were small
cutaneous fields confined to the ventral surface of the forepaw (Fig. 4.3A, C). The rest of
neurons had RFs of varying sizes and positions throughout the forelimb (Fig. 4.3B, D-F).
Overall, the majority of neurons (58%) received their peripheral input from cutaneous
mechanoreceptors, 29% of neurons received their input from mechanoreceptors
innervating joints or deep tissues, and 13% of neurons received mixed skin and deep
inputs. The skin RFs were more commonly found in distal forelimb areas compared to
proximal forelimb areas, where deep RFs were more common. The mixed submodality
RFs included both distal and proximal forelimb regions more evenly (Fig. 4.3G). The

70
majority of neurons were excited by stimulation of their RF, while only five cells were
inhibited.
Twenty four cells (29%) responded antidromically to electrical stimulation of the
pyramidal tract. The latencies of responses varied in the range of 0.8-3.0 ms. Estimated
conduction velocities were between 17 and 60 m/s. Approximately one half of neurons
(13/24) responded at 2.0 ms or faster, conducting at 25 m/s or faster, and thus were
classified as “fast conducting” PTNs; the other half was “slow conducting” PTNs
(Brookhart and Morris, 1948; Bishop et al. 1953; Takahashi, 1965). Sixteen out of 26
Figure 4.3. Receptive fields of neurons. A - F: Outlines show locations of RFs of individual neurons on the forelimb. Numbers indicate the number of neurons that had an RF in each location. In E, asterisks denote shoulder, elbow, and wrist joints, and arrows show direction of the joint movement, to which the cells responded. G: proportions of neurons with distal (wrist/paw) vs. proximal (upper arm/forearm) RFs among neurons with skin, deep, and mixed RFs. Stars indicate statistically significant difference (p<0.05, t-test).
71
penetrations (62%) yielded at least one PTN, and these tracks were distributed
throughout the studied cortical area without a clear pattern.
Characteristics of Locomotion and an Example of Firing Behavior of a Neuron
During recording of each neuron, cats walked between 10 and 50 (typically 20-30)
times down each of the chamber’s corridors (25±8, mean±SD), and the number of
strides selected for the analysis according to the criteria described in the Methods section
ranged between 20 and 80 (45±15) for both flat surface and ladder walking. For different
neurons, the average duration of selected strides was between 450 and 800 ms, which
corresponded to the speed of walking of 0.8-1.1 m/s. Although cat 2 walked faster than
cat 1, for each cat the average duration of the strides during two tasks was the same
(p>0.05, t-test; Fig. 4.1B). The ratio of stance duration to the duration of the cycle (the
stride duty factor) was 0.45–0.64. In both cats, the duty factor was smaller during the
ladder task (p<0.05, t-test), but the difference was small: 4-5% (Fig. 4.1C). The gait that
cats used during locomotion was a walk with the support formula of 2-3-2-3-2-3-2-3,
which indicates the number of limbs supporting the body during different phases of the
stride cycle (Hildebrand, 1965).
An example of a neuron’s spiking activity during standing, walking on the flat
surface and along the ladder is shown in Figure 4. This fast-conducting PTN had a
slowly-adapting cutaneous RF covering the glabrous skin of the entire central pad, which
should be fully in contact with the ground and thus well stimulated when the cat was
standing. Nevertheless, this neuron had low spike firing activity while standing (6.3
spikes/s; marked by a dashed horizontal line in Fig. 4.4C, E). During locomotion,
however, the neuron’s average activity rose substantially to 18.8 spikes/s on the flat
surface and 18.2 spikes/s on the ladder and was prominently modulated with respect to
72
the step cycle. During walking on the flat surface, the neuron was active during most of
the swing and first half of the stance phase reaching frequency of 57 spikes/s at the
beginning of stance and was less active during the end of the stance and early swing
phases. During walking along the ladder, the neuron’s firing activity was even more
strongly modulated. The neuron became still more active during transition from swing
to stance, now reaching discharge frequency of 80 spikes/s while its activity during first
half of the swing phase decreased. The rasters in Figs. 4.4B and D show the activity of the
neuron across 40 individual strides during flat surface walking (B) and 37 strides during
ladder walking (D). The pattern of activity was very consistent across strides of each
locomotor task. The activity is summed in Figs. 4.4C and E showing a histogram of the
neuron’s firing rate across the step cycle during flat surface (C) and ladder (E) walking.
The period of elevated firing (PEF, see definition in Methods) is indicated by a black
horizontal bar: it spanned most of the swing phase and the first third of the stance phase
during flat surface walking but was confined to the swing-to-stance transition phase and
was only half as long during walking along the ladder. The preferred phase (indicated by
a circle in Figures 4.4C and E) was at the very end of the swing phase during flat surface
walking and at the very beginning of the stance phase during ladder walking.
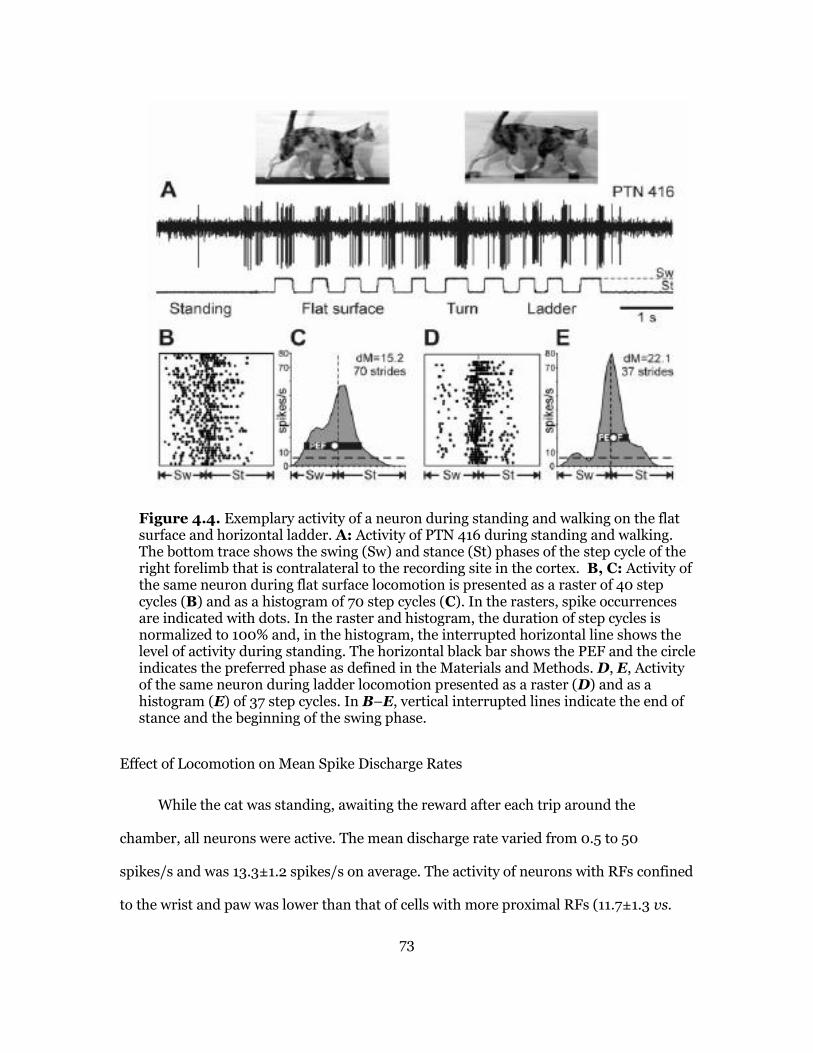
73
Figure 4.4. Exemplary activity of a neuron during standing and walking on the flat surface and horizontal ladder. A: Activity of PTN 416 during standing and walking. The bottom trace shows the swing (Sw) and stance (St) phases of the step cycle of the right forelimb that is contralateral to the recording site in the cortex. B, C: Activity of the same neuron during flat surface locomotion is presented as a raster of 40 step cycles (B) and as a histogram of 70 step cycles (C). In the rasters, spike occurrences are indicated with dots. In the raster and histogram, the duration of step cycles is
normalized to 100% and, in the histogram, the interrupted horizontal line shows the level of activity during standing. The horizontal black bar shows the PEF and the circle indicates the preferred phase as defined in the Materials and Methods. D, E, Activity of the same neuron during ladder locomotion presented as a raster (D) and as a histogram (E) of 37 step cycles. In B–E, vertical interrupted lines indicate the end of stance and the beginning of the swing phase.
Effect of Locomotion on Mean Spike Discharge Rates
While the cat was standing, awaiting the reward after each trip around the
chamber, all neurons were active. The mean discharge rate varied from 0.5 to 50
spikes/s and was 13.3±1.2 spikes/s on average. The activity of neurons with RFs confined
to the wrist and paw was lower than that of cells with more proximal RFs (11.7±1.3 vs.

74
17.4±2.5 spikes/s, p<0.05, t-test). The mean discharge rate of neurons with skin and
deep RFs however, was similar, as was the mean firing rate of fast- and slow-conducting
PTNs (p >0.05, t-test).
When the cat was walking on the flat surface, the mean activity of the entire
population of neurons was similar to that of during standing (16.6±1.4 vs.13.3±1.2
spikes/s, p >0.05, t-test). However, locomotion had diverse statistically significant
effects on the mean discharge rates of individual neurons and groups of neurons. During
locomotion, 44% (36/82) of cells increased their mean discharge rate, on average by
three fold, while 22% (18/82) decreased it by as much as 80% compared to standing
(Fig. 4.5A). The majority of neurons with RFs on the wrist and/or paw increased the
discharge rate, and this group’s average rate during walking was higher than during
standing by 9.3 spikes/s. In contrast, neurons with RFs on the upper arm or forearm
discharged with similar mean rates during standing and walking. Both fast- and slow-
conducting, PTNs more often changed their discharge rate with the start of locomotion
than the rest of the population (p<0.05, t-test) and typically increased rather than
decreased it. Neurons with deep RFs tended to be more active during walking than those
with skin fields, but the difference did not reach the level of statistical significance (p
=0.068). Across all cells, neurons with relatively low activity during standing (<10
spikes/s) nearly always increased it with the start of locomotion, while more active
neurons could either decrease or increase the activity. The stride-to-stride variability of
the mean discharge rate across the cycle, V, was 1.68±0.89 (mean ± SD).

75
Figure 4.5. Comparison of activity characteristics of individual neurons between different tasks. A: Mean discharge frequency averaged over all selected strides of flat surface walking is plotted against the mean frequency observed during standing. B: Mean discharge frequency averaged over all selected strides of walking along the ladder is plotted against that of flat surface walking. C: Mean depth of frequency modulation during walking along the ladder is plotted against that of flat surface walking. In A-C, the abscissa of each point shows the values observed during one task and ordinate shows values seen during the other task. Differently shaped symbols represent neurons with RFs on different segments of the forelimb: – neurons with RFs on the arm and/or forearm, which did not respond to stimulation of the wrist or
paw; ♦ – neurons with RFs on the arm and/or forearm that were also responsive to stimulation of the wrist and/or paw; –neurons with RFs confined to the wrist and/or paw; – neurons whose RF encompassed most of the limb as well as neurons with incompletely mapped RFs. Neurons whose characteristics were statistically significantly different during the two tasks (see Methods) are shown with filled symbols, while the other
Stride-Synchronized Modulation of Spike Discharges
During locomotion, the discharge of all 82 neurons was modulated with respect to
the stride: it was greater in one phase of the stride and smaller in another phase. There
were two major forms of modulation: 78% (64/82) of cells had one period of elevated
firing (PEF, see Methods) per stride and 22% (18/82) had two PEFs. Figures 6A and B
show phase positions within the step cycle of PEFs and preferred phases of all one-PEF
neurons. PEFs of different neurons were distributed throughout the cycle. Their duration
varied between neurons in the range of 15-90% of the cycle, and was 52±2.5 % of the
stride time on average. At any given time of the cycle, 40-75% of the cells were in their
PEF (Fig. 4.6C). However, more neurons had PEFs and preferred phases during late
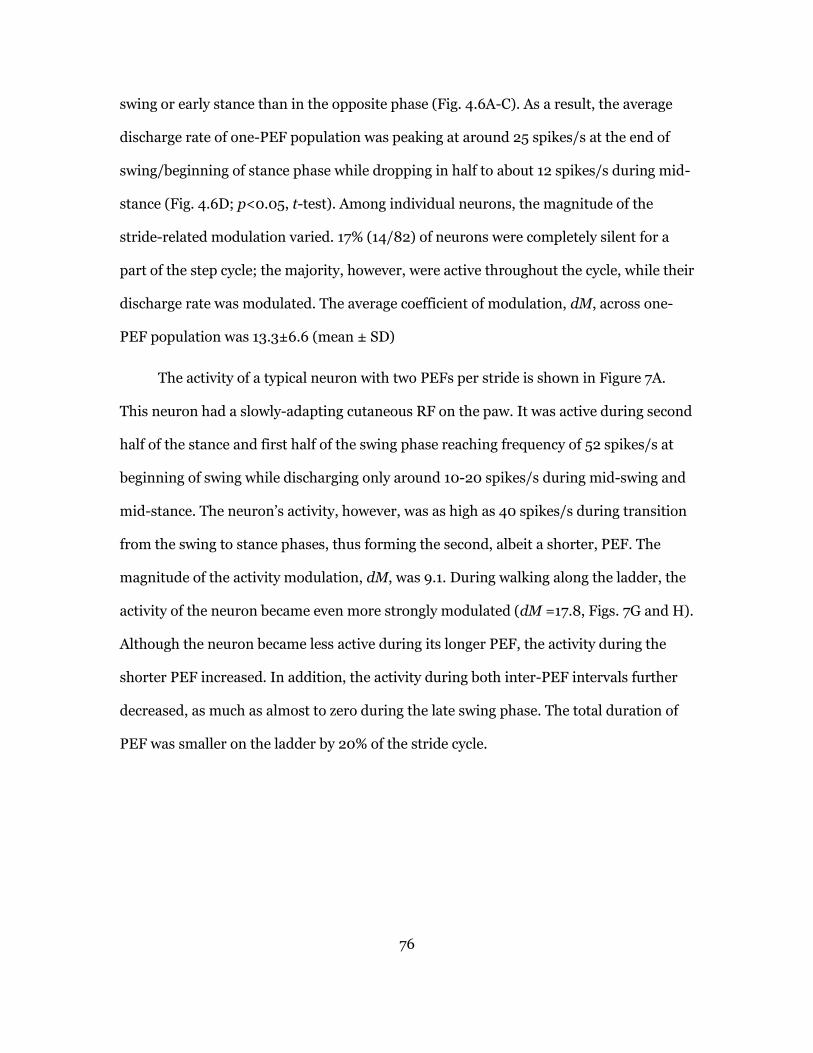
76
swing or early stance than in the opposite phase (Fig. 4.6A-C). As a result, the average
discharge rate of one-PEF population was peaking at around 25 spikes/s at the end of
swing/beginning of stance phase while dropping in half to about 12 spikes/s during mid-
stance (Fig. 4.6D; p<0.05, t-test). Among individual neurons, the magnitude of the
stride-related modulation varied. 17% (14/82) of neurons were completely silent for a
part of the step cycle; the majority, however, were active throughout the cycle, while their
discharge rate was modulated. The average coefficient of modulation, dM, across one-
PEF population was 13.3±6.6 (mean ± SD)
The activity of a typical neuron with two PEFs per stride is shown in Figure 7A.
This neuron had a slowly-adapting cutaneous RF on the paw. It was active during second
half of the stance and first half of the swing phase reaching frequency of 52 spikes/s at
beginning of swing while discharging only around 10-20 spikes/s during mid-swing and
mid-stance. The neuron’s activity, however, was as high as 40 spikes/s during transition
from the swing to stance phases, thus forming the second, albeit a shorter, PEF. The
magnitude of the activity modulation, dM, was 9.1. During walking along the ladder, the
activity of the neuron became even more strongly modulated (dM =17.8, Figs. 7G and H).
Although the neuron became less active during its longer PEF, the activity during the
shorter PEF increased. In addition, the activity during both inter-PEF intervals further
decreased, as much as almost to zero during the late swing phase. The total duration of
PEF was smaller on the ladder by 20% of the stride cycle.
77
Figure 4.6. Population characteristics of one-PEF neurons. A, E: Phase distribution of PEFs during walking on the flat surface (A) and along the ladder (E). Each row represents PEF of one cell. A circular mark on a PEF denotes the preferred phase. Neurons are rank-ordered so that those with a PEF earlier in the cycle are plotted on the top of the graph. The top row shows PEF and preferred phase of the neuron, the activity of which is shown in details in Figure 4. Vertical interrupted lines indicate end of stance and beginning of swing phase. B, F: Distribution of preferred phases. C, G: Proportion of active neurons (neurons in their PEF) in different phases of the step cycle. D, H: The mean discharge rate at different phases of the step cycle. Error bars show SEM. Star in H indicates the phase during which the activity of neurons during ladder walking is higher than during flat surface walking (p<0.05, t-test).
Figure 4.7C shows phase positions within the step cycle of PEFs of all two-PEF
neurons, with PEFs of the example neuron shown on the top of the graph. PEFs of
different neurons were distributed throughout the cycle. Their duration varied among
neurons in the range of 35-80% of the cycle and was 57±4% of the stride time on
average. Thirteen of 18 neurons had PEFs that differed in duration by 10% or more of the
stride cycle, “long” and “short” PEFs. The duration of the long PEF ranged from 20%
to55% of the cycle, and that of the short PEF was 10-35%. In the activity of all but one of

78
these neurons, the longer PEF was also the stronger one, as the peak discharge rate in it
exceeded that in the shorter PEF by 20±15 spikes/s. Across all two-PEF population at
any given time of the cycle, 45-75% of the cells were in their PEF (Fig. 4.7E). As a group,
two-PEF neurons had two approximately equal activity peaks: one at the very end of the
swing phase, which was similar to the peak of the one-PEF neuronal population and the
other peak near the transition from the stance to swing phase (Fig. 4.7F). Among
individual neurons, the magnitude of the stride-related modulation varied, with the
average dM = 10.1±0.6 slightly lower than in the one-PEF group (p<0.05, t-test).
Figure 4.7. Population characteristics of two-PEF neurons. A, E: Example activity of a neuron during walking on the flat surface (A, B) and along the horizontal ladder (G, H) presented as histograms (A, G) and rasters (B, H [22 strides and 16 strides, respectively]). In A, B and G, H designations are as in Figure 4. C, I: Phase distribution of PEFs during walking on the flat surface (C) and along the ladder (I). The top row shows PEFs of the neuron, the activity of which is shown in A, B and G, H. E, K: Proportion of active neurons (neurons in their PEF) in different phases of the step cycle. F, L: The mean discharge rate at different phases of the step cycle. Error bars show SEM

79
While one- and two-PEF spike discharge patterns were the most conspicuous
features of the discharge frequency modulation during walking, stride activity profiles –
i.e., the frequency of spike firing as a function of the phase of the stride cycle – also
varied greatly among neurons. Activity profiles of all cells could be divided into 6 groups
based on the relationship of their PEFs to the transitions between the swing and stance
phases of the stride cycle. In each panel of Figure 8, activity profiles of all cells belonging
to a particular group are shown superimposed in a single plot. Neurons in Group 1 (32%
of cells) were preferentially active during the swing phase of the stride cycle. Neurons in
Group 2 (17%) had their activity centered on the moment of the foot contact with the
ground. Neurons in Group 3 (18%) were preferentially active during the stance phase of
the stride cycle. Neurons in Group 4 (5%) had their activity peaked around the time the
foot broke contact off the ground or, in one neuron, the activity was preferentially
suppressed around this time. Neurons in Groups 5 and 6 had bimodal activity profiles.
Neurons in Group 6 (6%) were preferentially active during transitions between the swing
and stance phases, whereas neurons in Group 5 (17%) had the opposite tendency of
reducing their firing during those transitions.
Association between RF Properties and Patterns of Activity Modulation during
Locomotion on the Flat Surface
Each of the six cell groups described above included neurons with diverse RF
properties. All groups had comparable ratios of cells with skin and deep RFs, showing
that these groups had no preference for one or the other RF submodality. Preferences,
however, were seen with regard to RF location on the limb. Neurons with proximal RFs
restricted to the shoulder, upper arm and forearm (“exclusively proximal” RFs) as a
group discharged intensively throughout all of the swing phase with an average

80
population peak at around 20 spikes/s, and were only half as active during mid-stance
(Fig. 4.9 A). Neurons with RFs that included some proximal (upper arm and/or forearm)
and some distal (wrist, paw) forelimb regions (“proximal+distal” RFs) discharged more
vigorously during the swing phase as well, but reached the peak of their activity only in
the middle of this phase (Fig. 4.9 B). Neurons with RFs confined to the wrist and/or paw
(“exclusively distal” RFs) were activated still later in the cycle reaching the activity peak
during transition from the swing to stance phases (Fig. 4.9 C). In addition, these neurons
were approximately 50% more active at their peak than either ones of more proximal
groups. Thus, it appeared that, during the stride cycle, the activity of neurons with
proximal RFs tended to lead the activity of neurons with more distal RFs. This
observation was supported by results of the analysis of distribution of distal vs. proximal
RFs among the six types of activity profiles shown in Figure 8. Namely, neuronal group
2, which included cells most active when the foot was coming in contact with the ground,
consisted almost exclusively from neurons with distal RFs (p<0.01, Z-test for
proportions). In contrast, group 5, the group of two-peaked neurons active both in the
mid-swing and mid-stance, was dominated by cells with RFs encompassing both distal
and proximal limb. Neurons that had cutaneous RFs restricted to the ventral surface of
the forepaw presented a special opportunity to gauge how much stride-related activity
patterns of neurons in areas 1 and 2 reflect the stride-related spike discharge patterns of
the mechanoreceptors that innervate these neurons. The pattern of firing of cutaneous
mechanoreceptors on the ventral forepaw during locomotion can be expected to be
greatly dominated by the forepaw coming into contact with the ground during the stance
phase of the stride and the time-course of the force exerted by the foot on the ground
during the stance phase (Fig. 10 A). According to these considerations, neurons of areas 1
and 2 with cutaneous RFs on the ventral forepaw should start generating prominent

81
spike discharges about 20 ms after the moment the foot touches the ground (given that
the shortest transmission latency from cat’s forepaw to middle layer cells in area 3b is
~15 ms; Diamond, 1989) and behave as neurons of Group 3 (see Fig. 8).
Figure 4.8. Six groups of stride-related activity patterns. Each plot shows superimposed the stride activity profiles of all studied cells belonging to a particular group
Twelve neurons isolated in this study had cutaneous RFs restricted to the ventral
surface of the forepaw, and their stride activity profiles are plotted in Figure 10 B.
Surprisingly, only one neuron had its activity raised during the stance phase as the
Group 3 type (neuron 433 shown on top left), resembling at least to some degree the
expected pattern of its peripheral drive. The majority of cells (n = 8) had their activity
centered on the moment of the foot coming in contact with the ground (the Group 2
type). Two other neurons were of the Group-6 type, firing preferentially around the time
of foot making contact with the ground and also breaking contact. Finally, one cell fired
throughout the stride cycle, but more in the swing phase than in the stance phase,
making it the Group 1 category.

82
Figure 4.9
Stride-related activity of neurons with RFs on different forelimb segments. A, D: Activity of neurons with exclusively proximal RFs during walking on the flat surface (A) and along the ladder (D). In D4, star indicates the phase, during which the activity of neurons during ladder walking is higher than during flat surface walking (p<0.05, t-test). B, E: Activity of neurons with proximal+distal RFs. C, F: Activity of neurons with exclusively distal RFs. Other designations as in Figure 6.
The most striking feature of the behavior of these cells is that all 12 cells began to
increase their firing 50-150 ms before the physical contact of the foot with the ground,
although during this time – according to their RFs – these cells should not be receiving
any significant afferent input. The other striking feature is that all cells, except for a

83
single Group-3 cell, reached the peak of their firing very near the moment of the foot
touching the ground. Four cells had their firing peak just prior to the physical contact,
five cells had their peak just after the physical contact and before the afferent input could
reach SI, and only two cells had their peaks 25-30 ms after the physical contact. All these
cells showed no evidence of any major surge in spike firing that could be attributed to
activation of mechanoreceptors by the foot touching the ground. Overall, Fig. 10 C
suggests that activity of neurons with RFs restricted to the ventral surface of the forepaw
was driven during locomotion to a large extent by anticipation of the foot coming in
contact with the ground, as opposed to reacting to such a contact.
Regardless of their RFs, PTNs with different axonal conduction velocities were
different in phasing of their population activity. Although PEFs of individual fast- and
slow-conducting PTNs were distributed over the stride cycle (Figs. 11 A1-3; B1-3), the
average population activity of fast-conducting PTNs peaked during transition from the
swing to stance phases (Fig. 11 A3,4) reaching approximately 50 spikes/s; in contrast, the
activity of slow-conducting PTNs peaked earlier in the cycle: during the mid-swing
phase, albeit only reaching approximately 35 spikes/s, ~50% less than the peak activity
of fast-conducting PTN group. Thus, the activity of slow-conducting PTN group led that
of fast-conducting PTN group.
The activity of all but one neuron recorded during walking on the flat surface was
also recorded when cats walked along the horizontal ladder. Discharges of the
overwhelming majority of the neurons (74/81, 91%) were different between the two
walking tasks.

84
Figure 4.10. Stride-related activity of 12 neurons with cutaneous RFs restricted to the ventral side of the forepaw. A: Vertical ground reaction forces during walking on the flat surface (solid line) and horizontal ladder (interrupted line). SDs were similar between the tasks and for clarity are shown only for flat surface walking (error bars). Stars indicate statistically significant differences between the walking tasks (p<0.05, t-test). B: Activity profiles of the 12 cells during locomotion on the flat surface. Vertical lines indicate the moment of the foot making contact with the ground (red) and 15 ms later (green). C: Average activity profile of the 12 cells, each normalized by its mean firing rate during flat surface walking.
Changes to the Activity Evoked by Necessity to Step Accurately on the Horizontal Ladder
The activity of all but one neuron recorded during walking on the flat surface was
also recorded when cats walked along the horizontal ladder. Discharges of the
overwhelming majority of the neurons (74/81, 91%) were different between the two
walking tasks.
The average discharge rate was different in 54% (44/81) of neurons. From these,
half of cells (22/81, 27%) were more active during walking on the ladder than on the flat
surface, on average by 73%, while the other half were less active, on average by 32% (Fig.
4.5B). Neurons with RFs on the wrist and/or paw had a tendency to decrease discharge
rate, while those with RFs on the arm or forearm tended to increase it. Across all groups,
fast-conducting PTNs typically decreased activity during walking on the ladder, while

85
slow-conducting PTNs typically increased it (p > 0.05, χ2 test). Because changes in the
activity of different neurons were often of opposite directions, the average discharge rate
of the whole studied population was similar between the walking tasks. (17.5±1.5 vs.
16.6±1.4 spikes/s, p > 0.05, t-test)
The stride-to-stride variability of the mean activity across the cycle, V, was
1.42±0.74 (mean ± SD), which was statistically significantly smaller than during walking
on the flat surface (p = 0.044, t-test). Only five individual neurons, however, showed
statistically significant differences in the variability of their mean discharge rates
between the two tasks, and three of them were recorded sequentially along the same
microelectrode penetration.
During walking along the ladder, the activity of all cells was modulated with
relation to the stride. The same two major forms of modulation as during walking on the
flat surface were observed: one PEF was seen in 72% of neurons (58/81) and two PEFs
were found in 26% (21/81) of cells. Two additional cells had three PEFs. Proportions of
cells with different number of PEFs were similar to those seen during walking on the flat
surface (p > 0.05, t-test). The depth of frequency modulation, dM, however, was
different in 46% (37/81) of neurons. During walking along the ladder, it was higher in 23
cells by 40±21%, and lower in 14 by 27±13% (mean±SD, Fig. 4.5C). Two-PEF neurons
nearly always increased the depth of their frequency modulation, and the average dM for
their group was much higher during walking along the ladder than on the flat surface
(16.4±1.7 vs. 10.1±0.6, p = 0.003). Groups of neurons with different RF properties (e.g.,
proximal vs. distal, skin vs. deep) and PTNs with different axonal conduction velocities
had approximately similar proportions of cells increasing and decreasing dM upon
transition from the flat surface to ladder.

86
The duration of the PEF was different between the tasks in 15% (12/81) of neurons:
during walking along the ladder, it was longer in eight and shorter in five cells by 25-50%
of the cycle. Neurons with RFs confined to the wrist and paw were different from cells
with exclusively proximal RFs in their strong preference not to change duration of the
PEF (p<0.05, Z-test).
Neurons typically had the same number of PEFs during both locomotor tasks
(62/81, 77% of cells). However, 17% (11/63) of neurons that had one-PEF pattern during
flat surface walking changed to two PEFs during walking along the ladder. On the other
hand, 6 of 18 (30%) neurons that had two-PEFs on the flat surface changed to only one
PEF on the ladder, while two other two-PEF cells changed to three PEFs. Among 52
neurons that had one PEF during both locomotor tasks, 13 cells (25%) had it at a
different time of the step cycle however, that difference was typically only 10-15% of the
cycle. Neurons with RFs on the wrist and paw were different from the rest of one-PEF
population in that none of them changed the preferred phase of the activity upon
transition from flat surface to ladder locomotion (p<0.05, Z-test).
The great majority of neurons (74%, 60/81) had only one or two parameters of
their activity different between the two walking tasks: most often the average discharge
rate or the depth of frequency modulation, or both (30 cells total). In 11 additional cells,
these changes were accompanied by a change in the preferred activity phase or the
number of PEFs.
Changes in the activity of individual neurons upon transition from flat surface to
ladder locomotion, although often opposite, led to changes in the activity of some cell
groups. So, during walking along the ladder, the average discharge rate of the one-PEF
group was higher than on the flat surface (17.7±1.7 vs. 13.3±1.3 (spikes/s, respectively;

87
p<0.05, t-test). The increase was due to rise of activity during most of the stance phase
(compare Fig. 4.6D and H; p<0.05, t-test). Neurons with proximal RFs contributed
heavily, as their population activity during the mid-stance phase was greater than on the
flat surface (Fig. 4.9D). Much of this activation was produced by neurons that during
walking on the flat surface had PEFs in the swing phase of the stride (in Figs. 9 A2 and
D2, they are located on the top of the graphs). Fast-conducting PTNs had a tendency to
shift their activity more into the stance phase; however, this tendency did not reach the
level of statistical significance (Figs.11 A, D). Population activities of two-PEF neurons,
neurons with distal RFs as well as slow-conducting PTNs were similar between the two
walking tasks (Figs. 7 and 11 B and E).
Discussion
We found that walking on a flat surface affected spike discharge activities of all the
cells that were isolated in microelectrode penetrations through the rostral bank of the
ansate sulcus and possessed RFs on the contralateral forelimb. Specifically, spike firing
rate of all cells was modulated in relation to the stride, varying systematically as a
function of the phase of the stride. In addition, 44% of cells increased their mean firing
rate during locomotion, while 22% of cells decreased it as compared to their mean firing
rate while standing. Overall, the mean firing rate of this neuron sample was 14 spikes/s
during standing and 17 spikes/s during walking. These numbers are comparable to
average firing rates of neurons in areas 1-2 reported by Fitzsimmons and colleagues
(2009) for bipedal treadmill locomotion of macaque monkeys.
While all the cells in the study were affected by walking, they varied greatly in how
they were affected. Different cells were activated at different phases of the stride cycle
and 95% could be sorted into 6 groups based on the timing of their spike firing relative to
88
the stride cycle (Fig. 8). Some cells fired preferentially during the swing phase, other
cells fired during the stance phase, yet other cells fired at the transition phases from
swing to stance, or from stance to swing, or both. The specific pattern of firing was
correlated with the RF location on the limb. Neurons with proximal RFs (upper arm or
shoulder) tended to fire at peak rates in the middle of the swing (Group 1). They
appeared to be analogous to those neurons of primates whose activity profiles during
arm reaching movements are similar to that of the velocity of reaching: peaking between
the onset of the reach and arrival at the target (Gardner et al., 2007); these reaching
movements are largely performed by proximal muscles, especially those of the shoulder
and elbow . In contrast, neurons with RFs on the distal limb (wrist/paw) typically
showed peak firing at the transition between swing and stance phases, immediately prior
and right after the paw contacted the floor at the beginning of stance (Group 2). These
neurons, along with neurons of Groups 4 and 6, which were activated at peak rates at the
making (Group 4) or making and breaking (Group 6) of paw contact with the floor,
might be similar in function to the primate’s neurons that fire at hand contact prior to
grasping and/or release of objects held in the hand (Gardner et al., 2007). Neurons in
Group 3 fired most intensively during stance, and thus might have signaled alterations in
the disposition of the animal's weight during that phase. Within each group, cells
differed in the timing of their peak firing. As a result, each moment in the stride cycle
was characterized by a unique spatial pattern of activity in the areas 1-2 neuron
population. Such instantaneous spatial patterns of activity in areas 1-2 thus can be used
to infer the state of ongoing locomotion.
The pattern of firing activity was also distinct between groups of fast- and slow-
conducting PTNs regardless of their RFs (Fig. 4.10). This suggests that these cortical
efferent neurons have distinct roles in control of walking, as was previously also

89
suggested for fast- and slow-conducting PTNs of the motor cortex (Stout and
Beloozerova, 2013). Fast- and slow-conducting PTNs differ in their connections to the
spinal cord, such that fast-conducting PTNs preferentially influence distal muscle-
related networks, while slow-conducting PTNs influence both proximal and distal
muscle-related networks (Brookhart, 1952; Wiesendanger, 1981). Correspondingly,
population activity of fast-conducting PTNs peaked at the transition from swing to
stance when control of the distal limb was most critical, while the slow-conducting PTN
group fire most actively during mid-swing where we have previously shown that the
length of the limb is actively stabilized (Klishko et al., 2014).
The patterns of spike discharge activity generated by the population of neurons
during walking on a flat surface or on a horizontal ladder were qualitatively similar.
However, many individual neurons exhibited statistically significant quantitative
differences in their mean firing rate and/or characteristics of stride-related activity
modulation between these two locomotor tasks (Fig. 4.5B and C), just as there were
quantitative differences in the cat’s manner of walking on a flat surface vs. a ladder,
which, besides a dramatic difference in the variability of stride lengths, included
distinctions in the posture of the neck and head (e.g., Fig. 4.1A and B), flexion of distal
joints, and few other variables (Beloozerova et al., 2010). These differences suggest that
spatiotemporal activity patterns generated in areas 1-2 during locomotion might carry
detailed information on the fine status of the skeletomuscular locomotor apparatus on a
moment-by-moment basis. Indeed, using linear decoders, Fitzsimmons et al. (2009)
were able to extract information about positions and angles of the hip, knee and ankle
joints, leg muscle contractions, foot contact with the ground, step length and walking
speed from spike firing patterns of multiple neurons recorded simultaneously in areas 1-
2 of monkeys engaged in bipedal walking on a treadmill. The fact that a dramatic

90
decrease in the variability of the stride length during accurate stepping on the ladder
compared to unconstrained walking (Beloozerova et al., 2010) is accompanied by a
decrease in the variability of neuronal discharges during this cortex-controlled task,
which we found here, further supports the above suggestion.
A large body of literature shows that SI activity in behaving subjects does not
simply reflect the spatiotemporal patterns of activation of mechanoreceptors, but is
shaped by other, central, factors, such as sensory gating by anticipatory or efference copy
inputs from the motor system. In this study, the influence of such factors on SI activity
during locomotion could be ascertained among those sampled neurons that had
cutaneous RFs on the ventral surface of the contralateral forepaw. Afferent drive to these
neurons should have been initiated and terminated at each walking step by the forepaw
coming in contact and leaving the ground. However, 11 out of 12 such cells increased
their firing 50-150 ms prior to the physical contact of the forepaw with the ground (Fig.
4.10B), during which time they were not expected to receive any significant peripheral
drive. Half of all the spikes discharged by these cells, as a group, during a stride cycle
occurred prior to the foot touching the ground, at least for the range of walking speeds
that we have analyzed (Fig. 4.10C). Such anticipatory behavior suggests that these cells
acted in a predictive mode (e.g., Bubic et al., 2010).
Anticipatory activity or sensory response modulation on a similar timescale was
commonly observed in primate areas 1-2 prior to onset of a haptic task or even prior to
simple voluntary wrist or elbow movements (Soso and Fetz, 1980; Fromm and Evarts,
1982; Nelson, 1987; Koch and Fuster, 1989; Lebedev et al., 1994; Weber et al., 2011;
London and Miller, 2013). Such anticipatory cortical activity is generally thought to be
driven by efference copy inputs from the motor system, intended to facilitate the
processing of the expected sensory and motor events. Anticipatory activity can also be

91
evoked in SI without any motor action, however, by just expecting to receive a tactile
stimulus (Carlsson et al., 2000). In this case, the anticipatory activity in SI is triggered,
for example, by a visual cue that must be transmitted to SI by a top-down mechanism
engaging higher-level sensory cortical areas. So, it is possible that a significant portion of
differences in firing activity of individual neurons between flat surface and ladder
walking (Fig. 4.5 B and C) arose from differences in visual cues used for guiding stepping
during these tasks (Rivers et al., 2014).
However, unlike other studies, in which anticipatory activity in SI was observed
while the subject was in a relaxed state, expecting a tactile stimulus or getting ready for a
motor act, in this study we observed anticipatory activity while the cat was already in an
active state – walking – with neurons in areas 1-2 firing spikes on each stride cycle ahead
of the movement-generated stimulation of their RFs. In this situation, the pre-contact
anticipatory activity may reflect the rhythm of walking that is generated in the spinal
cord (Brown, 1911; Grillner and Zangger, 1979; McCrea and Rybak, 2008), and the post-
contact activity may reflect information on the action that has been accomplished. In
addition to the motor system and higher-level sensory areas, the anticipatory spike firing
in areas 1-2 can be also driven locally by other active neurons within the areas whose RFs
are stimulated earlier in the stride cycle. For example, neurons with proximal RFs may
drive those with distal RFs (Figs. 9, 10), and slow-conducting PTNs may drive fast-
conduction ones (Fig. 4.11). That is, given that locomotion is a regularly practiced
behavioral activity in which limbs cycle through a highly reproducible temporal sequence
of muscle contractions and joint movements, one can expect that in an SI neuronal
population modulated by walking, those neurons that are engaged (by virtue of their RF
properties) earlier in a stride cycle will have well developed lateral excitatory connections
onto other neurons that are engaged a little later in the same cycle (Drew and Abbott,
92
2006). Additional experiments, however, are necessary to determine specific sources of
the predictive activity in areas 1-2 during locomotion.
Regardless of the source, however, it is interesting that the peak of anticipatory
activity among our studied neurons closely matches the timing of the actual physical
contact of the forepaw with the ground (Fig. 4.10C) rather than the timing of the arrival
of the contact-evoked afferent input to those neurons. This timing suggests that areas 1-2
signaled a sensory event (i.e., a foot contact) exactly when it occurred by predicting it
rather than signaling it “after the fact” by responding to the event-evoked afferent input.
Such a predictive manner of sensory event representation appears to be common to
sensory perception in general and is referred to as “perceiving-the-present” (Changizi et
al., 2008). However, this present study is the first one to reveal neuronal correlates of
the predictive sensation during locomotion.
Numerous studies have shown that active limb movements suppress transmission
to SI of spike discharges evoked in somatosensory afferents by peripheral stimulation,
even if that stimulation was unrelated to the movement (Chapin and Woodward, 1981,
1982b; Jiang et al., 1991; Shin et al., 1994; Seki and Fetz, 2012). Such nonspecific
somatosensory gating takes place all along the somatosensory pathways, including the
dorsal column nuclei (Ghez and Pisa, 1972; Coulter, 1974; Chapman et al., 1988) and
ventrobasal thalamus (Cocquery, 1978; Shin et al., 1993). We see a possible evidence of
such sensory gating in our study in the fact that in 10 cells among the 12 that had
cutaneous RFs on the ventral forepaw, the first half of the stance period (during which
the contact-evoked afferent input from the foot should be quickly rising) was associated
with a prominent decline – rather than increase – of spike firing. However, such a
decline in firing might also be due to a more selective integration of internally generated
prediction with the actual sensory information (Chapin and Woodward, 1982a; Bays et

93
al., 2006; London and Miller, 2013). Theoretically, such integration might emphasize
“error signals;” i.e., deviations of the sensory signal from predicted, so that neural
activity in SI does not represent all the afferent somatosensory information, but only the
part that is not accurately predicted by the internal model (Rao and Ballard, 1999; Alink
et al., 2010; Ouden et al., 2010). Alternatively, integration of prediction with the afferent
information might be used to produce the representation of sensory events that is more
accurate than possible from either source alone, resulting in lower average activation and
a higher signal-to-noise ratio (Murray et al., 2004; Vaziri et al., 2006).
To conclude, in this study we found that the activity of neurons in areas 1-2, the
high subdivisions of SI, prominently reflects highly predictable somatosensory events –
such as those generated by locomotion – both shortly before and after these events take
place, and that this activity differs between unrestrained locomotion and accurate target
stepping.

94
5. SIGNALS FROM THE VENTROLATERAL THALAMUS TO THE MOTOR
CORTEX DURING LOCOMOTION
Published in Journal of Neurophysiology (Marlinski et al. 2012)
Abstract
The activity of the motor cortex during locomotion is profoundly modulated in the
rhythm of strides. The source of modulation is not known. In this study we examined the
activity of one of the major sources of afferent input to the motor cortex, the
ventrolateral thalamus (VL). Experiments were conducted in chronically implanted cats
using an extracellular single neuron recording technique. VL neurons projecting to the
motor cortex were identified by antidromic responses. During locomotion, the activity of
92% of neurons was modulated in the rhythm of strides. 67% of cells discharged one
activity burst per stride, a pattern typical for the motor cortex. The characteristics of
these discharges in most VL neurons appeared to be well suited to contribute to the
locomotion-related activity of the motor cortex. In addition to simple locomotion, we
examined the VL activity during walking on a horizontal ladder, a task that requires
vision for correct foot placement. Upon transition from simple to ladder locomotion, the
activity of most VL neurons exhibited the same changes that have been reported for the
motor cortex, i.e. an increase in the strength of stride-related modulation and shortening
of the discharge duration. Five modes of integration of simple and ladder locomotion
related information were recognized in the VL. We suggest that, in addition to
contributing to the locomotion-related activity in the motor cortex during simple
locomotion, the VL integrates and transmits signals needed for correct foot placement on
a complex terrain to the motor cortex.
95
Acknowledgements: The authors are grateful to Dr. Galina A. Pavlova for acquisition
of a part of the data and to Peter Wettenstein for exceptional engineering assistance. We
are also indebted to Drs. Alan R. Gibson, Kris M. Horn, and Vladimir K. Berezovskii for
help in processing and analysis of our morphological data. Fluorescent imaging was
supported by National Eye Institute Grant P30 EY-12196 and performed at Harvard
University Medical School. This research was supported by National Institute of
Neurological Disorders and Stroke Grants R01 NS-39340 and R01 NS-058659 to Irina.
N. Beloozerova.
Introduction
This study on the activity of the ventrolateral thalamus (VL) in the walking cat was
prompted by the fact that during locomotion the activity of the target of VL projection –
the motor cortex – changes periodically in the rhythm of locomotor movements
(Armstrong and Drew 1984; Beloozerova and Sirota 1985a, b, 1993a, 1993b; Drew 1993).
The origin of this modulation is unclear. In decerebrated cats, it was shown that integrity
of the cerebellum is required for all subcortical descending tracts: vestibulo-, reticulo-,
and rubro-spinal, to exhibit locomotion-related modulation of their activity (Orlovsky
1970, 1972a, 1972b). Neurons of those tracts receive direct synaptic projections from the
cerebellum. The motor cortex also gives rise to a major descending tract – the pyramidal
tract. The motor cortex does not receive direct input from the cerebellum, but receives
input from the VL, one synapse away from it. We hypothesized that during locomotion
the VL passes locomotion-related information from the cerebellum to the motor cortex.
The first goal of this study was to elucidate whether the pattern of activity of VL neurons
during locomotion in an uncomplicated environment (simple locomotion) is suitable to

96
contribute to the locomotion-related activity in the motor cortex. We found that the
majority of VL neurons were well fit for such a role.
It is known that VL neurons change their activity prior to voluntary movements
(Evarts 1971; Kurata 2005; Neafsey et al. 1978; Schmied et al. 1979; Strick 1976; van
Donkelaar et al. 1999). We hypothesized that VL is also involved in voluntary
modifications of locomotion. The second goal of this study was to explore whether VL
neurons contribute to an increase in modulation of the motor cortex activity that is
observed during locomotion over a complex terrain (complex locomotion). On complex
terrain, vision is required to adjust steps to irregularities of the walking path. During
stepping under visual control the activity of the motor cortex is dramatically different
from that during walking on the flat surface, and these changes are crucial for correct
stepping on a complex terrain (Beloozerova and Sirota 1988, 1993a; Beloozerova et
al.2010; Drew 1988, 1993). The inputs responsible for the changes of the activity in the
motor cortex during complex locomotion as compared to simple walking are not clear.
Area 5 of parietal cortex, which is known to integrate visual and motor information for
control of limb movements (e.g. Buneo and Andersen 2006; Mountcastle 1995), could be
responsible for modulation of the motor cortex activity during complex locomotion It
was found, however, that the pattern of activity of area 5 neurons was quite different
from that of the motor cortex and thus seemed unlikely to be the primary source of
modulation (Beloozerova and Sirota 2003). Here we consider another possibility that
during complex locomotion the input from the VL changes. We hypothesized that, in
addition to basic locomotion-related information, the VL transmits information that is
needed to control landing positions of feet during walking on a complex terrain to the
motor cortex. We have found strong evidence supporting this hypothesis.
97
Methods
Extracellular recordings from single VL neurons were obtained during chronic
experiments in cats. One adult female (cat A) and two adult males (cats B and C) were
used. The methods of experimental preparation are described in details in chapter 2.
Here I discuss only more specific method to this study and others only briefly.
Locomotion Tasks
Two locomotion tasks were used: 1) simple locomotion on a flat surface, and 2)
complex locomotion on crosspieces of a horizontal ladder. It has been demonstrated in
several studies that simple locomotion does not require vision, while complex
locomotion does (Beloozerova and Sirota 2003; Liddell and Phillips 1944; Marigold and
Patla 2008; Sherk and Fowler 2001; Trendelenburg 1911). During ladder locomotion cats
step on the support surface with substantially less spatial variability and more accuracy
as compared to simple locomotion (Beloozerova et al. 2010).
The walking chamber was a rectangular enclosure with two connected parallel
corridors, which is described in Methods chapter (Ch. 2). One corridor had flat walking
surface while the other contained a horizontal ladder (Fig. 5.1C).
Surgical Procedures
In anesthetized cats, skull was exposed, the head implants were anchored as
described in chapter 2. An arrangement of seven or nineteen 28-gauge hypodermic guide
tubes was implanted above the VL. The guide tubes were soldered together at their tops.
The outer diameter of the 7-tube arrangement was 1.08 mm, and that of 19-tube one was
1.8 mm. Cat A received the 7-tube implant in both left and right hemispheres, cat B

98
received the 19-tube implant in both left and right hemispheres, and cat C received one
7-tube implant in the left hemisphere. The tip of the arrangement was lowered to the
vertical Horsley and Clarke coordinate V +7.0. In two cats (A and B), on the left side of
the head, the dorsal surface of the rostral and lateral sigmoid gyri, and the rostral part of
the posterior sigmoid gyrus were exposed by removal of approximately 0.6 square
centimeters of bone and dura mater. The region of the motor cortex was visually
Fig. 5.1: Experimental paradigm. A: schematic drawing of a parasagittal section of the brain showing the position of chronically implanted guide tubes for recording electrodes above the ventrolateral thalamus (VL) and stimulating electrodes in the forelimb representation of the motor cortex (MC). B: method of insertion and advancement of electrodes into the VL. 1: A group of 28-gauge cannulas is chronically implanted in the cortex above VL. 2: An electrode is manually inserted into one of the cannulas and soldered to an arm (3) of a micromanipulator (4). A wire (5) that leads to a miniature preamplifier positioned on the head of the animal is also soldered to the arm. In this manually driven micromanipulator, 1 revolution of the screw results in 200-μm advancement of the electrode. C: locomotion tasks: walking in a chamber on a flat surface and along a horizontal ladder. The Gates trace indicates when the cat has passed the beginning and end of each of the chamber's corridors. The Steps trace shows the swing (Sw) and stance (St) phases of the right forelimb recorded with an electro-mechanic sensor. The Neuron trace shows discharge of a neuron from the VL.
99
identified based on surface features and photographed (Fig. 5.5A). The exposure was
covered with a 1 mm thick acrylic plate. The plate was pre-perforated with holes of 0.36
mm in diameter spaced by 0.5 mm, and the holes were filled with bone wax. The plate
allowed for later implantation of stimulation electrodes in the motor cortex for
identification of thalamo-cortical projection neurons.
Single-Unit Recording
The motor cortex was mapped using multiple-unit recording and microstimulation
techniques. During microstimulation, trains of ten 25 μA, 0.2 ms, cathodal pulses at 350
Hz were applied using a monopolar platinum-tungsten quartz insulated microelectrode
with impedance of 200-500 kΩ. Stimulating electrodes were implanted into the motor
cortex (MC) representation of the distal (MCd) and proximal (MCp) forelimb at
approximate coordinates A 25-26, L 7-9 and L 5-6, respectively (Fig. 5A and B).
Electrodes were made of platinum-iridium, Teflon-insulated wire with outer diameter
140 μm (A-M Systems Inc., Carlsberg, WA). The 0.4 mm tip of the wire was freed from
isolation and tapered. Wires were individually inserted into the cortex 1 mm apart
through perforations in the acrylic plate implanted above it, and fixed. Extracellular
recordings from the VL were obtained using tungsten varnish-insulated microelectrodes
(120 μm OD; FHC Inc., Bowdoin, ME) or platinum-tungsten quartz insulated
microelectrodes (40 μm OD) pulled to a fine tip and mechanically sharpened using a
diamond grinding wheel (Reitboeck 1983). The impedance of both types of electrodes
was 1-3 MΩ at 1000 Hz.

100
Identification of Neurons
The ventrolateral thalamus is subdivided into two parts by its afferent connections
(Asanuma et al. 1983; Ilinsky and Kultas-Ilinsky 1984). The major projections to the
posterior part originate in cerebellar nuclei while the anterior part receives its primary
input from the basal ganglia (Grofová and Rinvik 1974; Hendry et al. 1979; Larsen and
McBride 1979; Rinvik and Grofová 1974; Sakai et al. 1996). In this paper, we identify
divisions of the thalamic ventrolateral nuclear complex in accordance with nuclear
delineation of the cat brain atlas of Reinoso-Suarez (1961). Thus, we denote the anterior
division of the complex as the ventral anterior nucleus (VA). This area is analogous to the
anterior part of the ventral lateral nucleus (VLa) in primates. The posterior division of
the ventrolateral complex we name the ventral lateral nucleus (VL). This region is
analogous to the posterior part of primate’s ventral lateral nucleus (VLp). All neurons
whose activity is reported in this paper were collected in the VL.
The somatic receptive fields of neurons were examined in animals resting with
their head restrained. Somatosensory stimulation was produced by lightly stroking fur,
palpation of the muscle bellies and tendons, as well as by passive joint movements. In
the left VL of two cats, A and B, in which stimulation electrodes were implanted in the
left motor cortex, neurons were tested for antidromic activation from the motor cortex.
The motor cortex was stimulated with 0.2 ms single rectangular pulses of 0.1-1.0 mA
intensity applied 2-3 s apart. Current was passed between each pair of implanted wires
where individual wires were within 1-1.5 mm from each other. These pulses typically did
not evoke any visible motor responses, and never produced any signs of discomfort or
distress in the cats. The principal criterion for identification of antidromic activation of
thalamo-cortical projection cells (TCs) was the test for collision of spikes (Bishop et al.
1962; Fuller and Schlag 1976) (Fig. 5.5C and D). For calculation of the conduction

101
velocity, the distance between recording electrodes in the VL and stimulation electrodes
in the motor cortex was estimated as 31.5 mm.
Processing of Neuronal Activity
To compare the activity of neurons during two locomotion tasks we used only the
strides for which the average duration in the two tasks differed by <10%. The onset of
swing of the forelimb contralateral to the VL recording site was taken as the beginning of
the step cycle. The stride cycle was divided into 20 to produce phase histograms.
The coefficient of stride-related frequency modulation (M), depth of modulation
(dM), Period of Elevated Firing (PEF), and Preferred Phase of the activity were
calculated as described above.
To determine what differences in the modulation parameters of individual neurons
during simple and complex locomotion could not be explained by spontaneous
fluctuation in the discharge, we compared the activity of single neurons in sets of
randomly selected steps of the same task. Recordings from 50 neurons that were long
enough to enable selection of at least two nonoverlapping sets of 25–40 steps per task
were used. From each record the first step was assigned to set 1, the second to set 2, the
third to set 3, etc. For each neuron, the M, the dM, the preferred phase, and the duration
of the PEF were calculated for each set of steps and compared. When three or more sets
were available, all possible pairwise comparisons were considered; across all neurons,
over 100 comparisons were made. Values of differences occurring in <5% of these
“sham” comparisons across all neurons were determined. During analysis, the
differences in activity characteristics of a neuron during simple and complex locomotion
that exceeded these values were considered, with 95% confidence, to be caused by the

102
difference in the locomotion tasks but not by spontaneous background fluctuation in the
discharge rate.
For comparisons of activities of individual neurons in different tasks and between
groups of neurons, a two-tailed t-test was used. A nonparametric χ2-test was used for
comparison of categorical data. For all tests, the significance level was set at P = 0.05.
Unless indicated otherwise, for all mean values the standard deviation (SD) is given.
Histological Procedures
In cat A, 8 nl of 1% horseradish peroxidase-conjugated wheat germ agglutinin
(WGA-HRP) (Sigma) was injected by pressure in the center of the area of recording in
VL 48 h prior to the animal's death. The injection was made through a flexible capillary
tube made of fused silica (147-μm OD, 50-μm ID; Polymicro Technologies, Phoenix, AZ)
that was directly connected to the output of pressure microinjector PMI-200 (Dagan,
Minneapolis, MN). On the day of termination the animal was deeply anesthetized with
pentobarbital sodium, and reference electrolytic lesions were made in the areas of
recording and stimulation. The cat was then perfused with 3% paraformaldehyde and a
series of 10%, 20%, and 30% sucrose-phosphate buffer solutions (0.1 M, pH 7.4). The left
half of the brain was frozen and sectioned at 40 μm in the parasagittal plane. Every
fourth section was processed with a modified tetramethyl benzidine (TMB) reaction
(Gibson et al. 1984; Mesulam 1982) and then lightly counterstained with thionine.
Adjacent sections were stained with cresyl violet. In addition, the right cerebellum was
sectioned in the coronal plane and processed in the same manner. Brain sections were
inspected under polarized light illumination. Locations of retrogradely labeled neurons
were marked on digital images of brain sections with a computerized plotting system
103
(Image Tracer, Translational Technology). Positions of electrode tracks were estimated
with the use of the reference lesions.
In cat B, 1.5 μl of 10% red fluorescent microspheres (Lumafluor, Naples, FL) was
injected into the most anterior part of the explored area in the VL 6 mo. prior to the
animal's death. On the day of termination, the cat was deeply anesthetized with
pentobarbital sodium, and reference electrolytic lesions were made in the areas of
recording and stimulation. This cat was perfused with 10% paraformaldehyde. The brain
was blocked into three blocks: frontal (rostral to A14), middle (between A14 and P2), and
caudal (caudal to P2). The middle block containing thalamus was sectioned in the
coronal plane. The frontal cortex ipsilateral to the recorded VL and the posterior part of
the brain stem with the cerebellum contralateral to the recorded VL were sectioned in
the parasagittal plane. Frozen 50-μm sections were made. Every fourth section was
mounted on slides, cleared with acetone and xylene, and coverslipped. Observation and
digital imaging of cells retrogradely labeled with red fluorescent beads were done with
Neurolucida 8, Zeiss Axioscope, and AxioCamMR3 (Carl Zeiss Int.) with a rhodamine
filter. For identification of brain structures the adjacent sections were stained with cresyl
violet. Cat C received no tracers. The brain sections were obtained and stained with
cresyl violet by the same techniques as in cat B.
Results
Location of Neurons
The activity of 238 VL neurons was recorded during walking both on the flat floor
and along the horizontal ladder. The majority of neurons were recorded in two cats: 94
in cat A and 99 in cat B. In cat A, all but 10 cells were recorded from the left VL. In cat B,

104
60 neurons were recorded from the left VL, and 39 from the right VL. The remaining
neurons (n=45) were recorded from cat C.
Anatomical Reconstruction
Histological examination of recording sites showed that, in cat A, recordings were
obtained from the anterior portion of the VL at coordinates A 10.5-11.0, L 4.7-5.3, and V
+0.5-4.0. Here and further, the vertical coordinate is given after subtraction 10 mm from
the coordinate of the atlas of Reinoso-Suarez (1961) to align it with coordinates of other
commonly used atlases of the cat brain. The recording site is shown on a parasagittal
section of the brain in Fig. 5.2A. It was marked with an electrolytic lesion and injection of
WGA-HRP. The site is situated approximately 2 mm caudally to the Nucleus caudatus - a
landmark for identification of the anterior-posterior position of the section. A
reconstruction of the locations of neurons that were recorded in this cat is given in Fig.
5.2D, plates 11.0-10.5.
In cat B, nearly symmetrically on the left and right sides of the thalamus, recorded
cells were located in the central portion of the VL at coordinates A 9.5-10.75, L/R 3.0-
5.0, and V - 0.5 -+3.5. The recording site in the left thalamus is shown on a coronal
section in Fig. 5.2B. It was labeled with an electrolytic lesion and injection of red
fluorescent beads (Fig. 5.4A). A landmark for identification of the anterior-posterior
position of the section was the caudal putamen that at this level has a striped appearance
in the cat. A reconstruction of locations of neurons, combined from the left and right VL,
is shown in Fig. 5.2D, plates 10.75-9.5.
In cat C, recordings were made from the most caudal aspect of the VL at coordinates: A,
8.75-9.25, L 4.0-4.3, and V 0.5-1.5. A reference lesion that was made approximately 200
μm caudally to the most caudal recording track in this cat is shown on a coronal section

105
Figure 5.2: Sites of recording in the VL. A: recording site in cat A is shown on a photomicrograph of a parasagittal section of the thalamus. It was located in the rostral VL. Arrow points to the electrolytic lesion mark and the darkened area of tissue filled with horseradish peroxidase-conjugated wheat germ agglutinin (WGA-HRP). The site is ∼2 mm caudally to the nucleus caudatus (NC) of the basal ganglia. B: recording site in cat B is shown on a photomicrograph of a coronal section of the thalamus. It was positioned in the middle of the VL. Arrow points to the electrolytic lesion mark and the darkened area where fluorescent beads were deposited. The caudal part of putamen (PU), a landmark for the anterior-posterior position of the section, is seen laterally. C: recording site in cat C is shown on a photomicrograph of a coronal section of the thalamus. It was positioned in the caudal VL. Arrows point to a track from a reference electrode. The most rostral aspect of the lateral geniculate body (LG), a landmark for the anterior-posterior position of the section, is visible laterally. D: reconstruction of positions of individual neurons recorded during locomotion in cats A, B, and C. Squares, neurons with somatosensory receptive fields on the shoulder (responding to passive movements in the shoulder joint and/or palpation of muscles on the back or neck); diamonds, cells that were activated by movements in the elbow; up-facing triangles, neurons with receptive fields on the wrist or paw; down-facing triangles, neurons whose receptive field encompassed the entire forelimb; stars, neurons responsive to vestibular stimulation; circles, neurons without somatosensory receptive fields and those whose receptive fields were not identified. Filled symbols represent neurons with axonal projections to the motor cortex (thalamo-cortical neurons, TCs); open symbols represent neurons whose projections were not identified. AV, nucleus anterio-ventralis thalami; CI, capsula interna; CL, nucleus centralis lateralis; CLA, claustrum; EPN, nucleus entopeduncularis; LA, nucleus lateralis anterior; LME, lamina medullaris externa thalami; LP, nucleus lateralis posterior; OT, optic tract; PC, pedunculus cerebri; RE, nucleus reticularis thalami; SUB, nucleus subthalamicus; VA, nucleus ventralis anterior; VL, nucleus ventralis lateralis; VM, nucleus medialis; VPL, nucleus ventralis postero-lateralis; VPM, nucleus ventralis postero-medialis.

106
of the thalamus in Fig. 5.2C. A landmark for identification of the anterior-posterior
position of the section was the most rostral aspect of the lateral geniculate body (LG) that
is visible in this section. A reconstruction of locations of neurons recorded in this cat is
given in Fig. 5.2D, plates 9.25-8.75.
Receptive Fields
The somatosensory receptive fields of 168 neurons were tested. All receptive fields
were found on the contralateral side of the body. One-third of neurons (32%, 53/168)
responded to passive movements of the shoulder joint and/or palpation of muscles on
the back or neck. Slightly more than half of these cells showed directional preference to
shoulder movement and responded better either to flexion (17/168) or to extension
and/or abduction of the joint (13/168). Eighty-four percent of shoulder-related cells were
TCs. Fewer neurons (18%, 30/168) responded to movements in the elbow joint. Almost
all of these neurons had a directional preference: half of them responded to flexion and
another half to extension of the elbow. Ninety-five percent of tested cells were TCs. The
number of neurons with receptive fields on the paw or wrist was relatively small (10%,
17/168). Typically, these neurons responded to pressure on the paw or to the wrist
ventral flexion. Sixty-seven percent of tested cells were TCs. In addition, 15% (25/168) of
neurons responded to stimulation of most of the forelimb, typically to flexion in the
shoulder and extension in the elbow, or to synergistic movements in both joints. This
group also included the only two neurons which activity diminished during
somatosensory stimulation. Among all cells tested only one had a cutaneous receptive
field responding to brushing of fur on the medial surface of the paw. We found only six
cells that had somatosensory receptive fields on the hindlimb. Overall, characteristics of
107
somatosensory receptive fields were in agreement with previously reported data
(e.g., Asanuma and Hunsperger 1975).
Neurons that responded to stimulation of different parts of the forelimb were
distributed randomly in the VL: there were no clear clusters of shoulder-, elbow- or
wrist-related cells (Fig. 5.2D). There were also 23% (38/168) of neurons that did not
respond to any somatosensory stimulation. They were intermingled with the responsive
cells. Five of these cells responded to vestibular stimulation produced by the whole
animal translations or rotations; they were found laterally and caudally in the VL (Fig.
5.2D). Two other neurons without somatosensory receptive fields responded to visual
stimulation.
Afferent Connections
In cat A, WGA-HRP was injected in the center of the area of recordings. The
injection had a core ∼1.5 mm in diameter (dark area in Fig. 5.2A). Numerous
retrogradely labeled neurons were found in the anterior half of the lateral (dentate)
nucleus and in the anterior interposed nucleus of the right (contralateral) cerebellum
(Fig. 5.3A). In the dentate nucleus, labeled cells were found in its rostral part, with the
highest density at P 8.0–8.5, and were not seen caudal to P 9.0. The most ventral part of
the nucleus was free from labeled cells. In the anterior interposed nucleus, labeled
neurons filled its entire rostro-caudal extent but were confined to the lateral half of the
nucleus. Ipsilaterally to the injection site, labeled neurons were found in the lateral half
of the entopeduncular nucleus (from L 7.0 to L 5.5). Most laterally, labeled cells filled the
entire nucleus, but more medially cells were concentrated only in the anterior and
posterior poles of it.
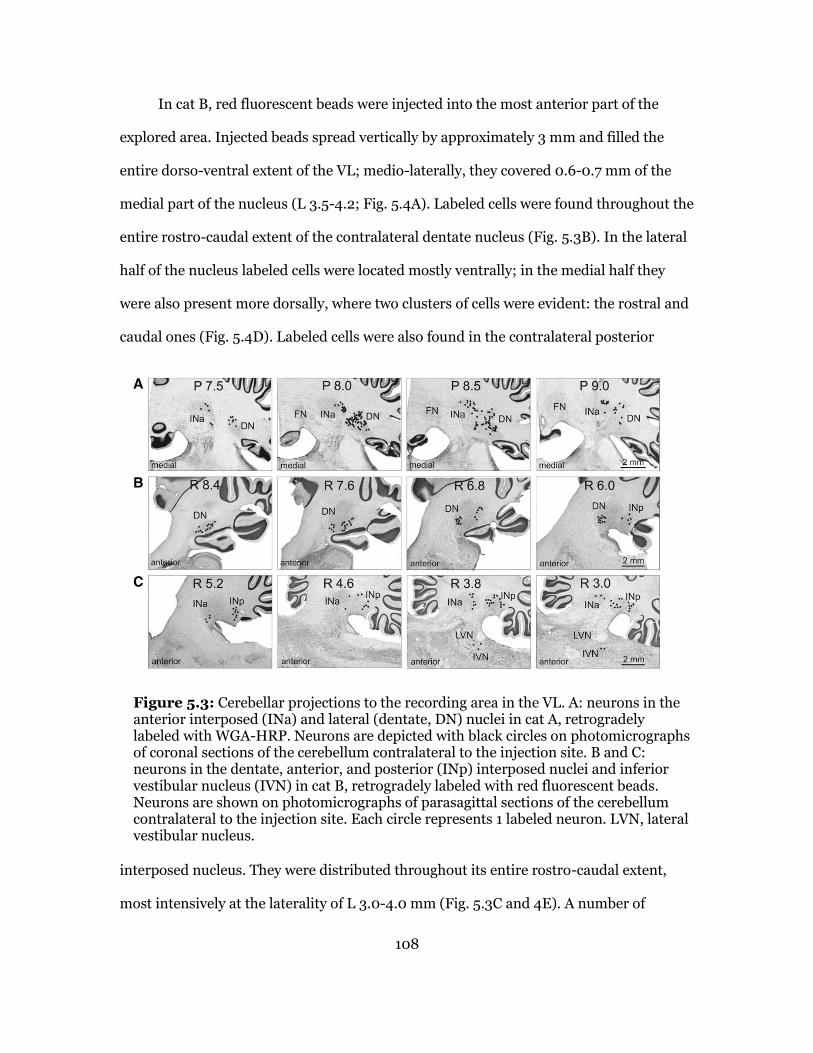
108
In cat B, red fluorescent beads were injected into the most anterior part of the
explored area. Injected beads spread vertically by approximately 3 mm and filled the
entire dorso-ventral extent of the VL; medio-laterally, they covered 0.6-0.7 mm of the
medial part of the nucleus (L 3.5-4.2; Fig. 5.4A). Labeled cells were found throughout the
entire rostro-caudal extent of the contralateral dentate nucleus (Fig. 5.3B). In the lateral
half of the nucleus labeled cells were located mostly ventrally; in the medial half they
were also present more dorsally, where two clusters of cells were evident: the rostral and
caudal ones (Fig. 5.4D). Labeled cells were also found in the contralateral posterior
Figure 5.3: Cerebellar projections to the recording area in the VL. A: neurons in the anterior interposed (INa) and lateral (dentate, DN) nuclei in cat A, retrogradely labeled with WGA-HRP. Neurons are depicted with black circles on photomicrographs of coronal sections of the cerebellum contralateral to the injection site. B and C: neurons in the dentate, anterior, and posterior (INp) interposed nuclei and inferior vestibular nucleus (IVN) in cat B, retrogradely labeled with red fluorescent beads. Neurons are shown on photomicrographs of parasagittal sections of the cerebellum contralateral to the injection site. Each circle represents 1 labeled neuron. LVN, lateral vestibular nucleus.
interposed nucleus. They were distributed throughout its entire rostro-caudal extent,
most intensively at the laterality of L 3.0-4.0 mm (Fig. 5.3C and 4E). A number of
109
labeled neurons were seen in the contralateral anterior interposed nucleus (Fig. 5.3C).
Also, several cells were found throughout the contralateral fastigial nucleus (not shown),
and a few were seen in the contralateral inferior vestibular nucleus (Fig. 5.3C and 5.4G).
In Addition, a longitudinally extended group of labeled cells was found in the
contralateral dorsal hypothalamic area. The ipsilateral entopeduncular nucleus was free
from label. Numerous labeled cells were found in the ipsilateral frontal cortex,
throughout layer VI of the anterior and posterior sigmoid gyri, at the laterality of L 4.0-
9.0 (Fig. 5.4H), as well as more caudally, across the lateral ansate sulcus into
suprasylvian gyrus up to the caudal area 5 (Fig. 5.4I). In the area 4γ, labeled cells densely
filled the entire layer VI. In other cortical areas labeled cells were sparser and formed a
thinner stretch through layer VI (Fig. 5.4C). In all cortical areas that contained labeled
neurons in layer VI, medium-size labeled pyramidal cells were occasionally found also in
the adjacent part of layer V.
Neurons Projecting to the Motor Cortex
Among the 238 neurons that were recorded during locomotion, 116 were identified as
projecting to the motor cortex [thalamo-cortical neurons (TCs)]. Positions of stimulating
electrodes in the left precruciate cortex of cat B are schematically shown in Fig. 5.5A. The
electrodes were placed in the distal forelimb (paw) representation of the motor cortex
(MCd) and in the proximal forelimb (elbow, shoulder) representations (MCp)
(see methods). In Fig. 5.5B, a track and an electrolytic lesion made by one of the
stimulation electrodes are shown on a photomicrograph. The lesion is visible in the
cortical layer VI adjacent to layer V that is populated with giant pyramidal cells
characteristic for area 4γ. In both cat A and cat B, all stimulating electrodes were placed

110
in layer VI of area 4γ in the precruciate sigmoid gyrus. An example of an antidromic
response of a TC neuron to stimulation of MCd is given in Fig. 5.5C and D.
Figure 5.4: Cerebellar and cortical neurons labeled with fluorescent beads in cat B. A: coronal section of the thalamus containing the electrolytic lesion mark and fluorescent bead deposit site in the area of recording as seen with a rhodamine filter. B: coronal section of the brain at the same anterior-posterior level as in A, cresyl violet stain. C: labeled neurons in the caudal area 5 in the suprasylvian gyrus. D: labeled neurons in the anterior interposed nucleus (INa). E: labeled neurons in the posterior interposed nucleus (INp). F: parasagittal section of the brain stem and cerebellum, cresyl violet stain. G: labeled neurons in the inferior vestibular nucleus (IVN). H: composition of parasagittal sections of the frontal cortex showing the fold of cruciate sulcus (Cru). Sections contain neurons in layer VI labeled with red fluorescent beads. White arrow points to a small depression on the top of the cortex that was left by one of the stimulation electrodes chronically implanted in the motor cortex (MC). I: labeled neurons in the forelimb representation of the motor cortex in the anterior sigmoideus gyrus. In C, D, E, and G the scale is as in I.
The TCs were distributed fairly evenly throughout the area of recording. In Fig.
5.2D, they are represented by filled shapes. Most TC neurons responded to stimulation of
either MCd or MCp only and a few responded to stimulation of both sites. Interestingly,

111
the vast majority (72%) of neurons projecting to MCd had receptive fields on proximal
parts of the forelimb, shoulder, or elbow, and only 9% had receptive fields on the wrist or
paw. Neurons projecting to the more medial cortical areas that are related to elbow and
shoulder, MCp, had various receptive fields. Latencies of antidromic responses of
different TCs varied in the range of 0.5–5.5 ms (Fig. 5.5E). Estimated conduction
velocities ranged from 5 to 70 m/s (Fig. 5.5F). We have arbitrarily divided the TC
neurons into two subgroups: responding with a latent period of 1.0 ms or faster (“fast”
TCs) and responding >1.0 ms latency (“slow” TCs). Two-thirds of slow TCs were
collected in cat A.
Activity during Standing
The discharge rates of VL neurons during standing varied in 0.6–63 spikes/s range
and was 20.2 ± 12.5 spikes/s on average. Neurons with somatosensory receptive fields
were more active than neurons without them [24.3 ± 1.5 vs. 15.4 ± 2.1 spikes/s (means ±
SE), respectively; P < 0.05, t-test]. Neurons located laterally with coordinates L 4.5–5.3
(mostly collected from cat A; Fig. 5.2Aand D) were less active than those located
medially at L 3.1–4.4 (mostly collected from cat B; Fig. 5.2B and D) [14.8 ± 1.2 vs. 25.6 ±
1.9 spikes/s (means ± SE); P < 0.05, t-test]. Fast-conducting TCs were more active on
average than slow-conducting TCs [23.7 ± 2.2 vs. 15.4 ± 1.2 spikes/s (means ± SE); P <
0.05, t-test; Fig. 5.5G]. Moreover, there was a linear relationship between conduction
velocity and the discharge rate in the standing animal (Fig. 5.5H).
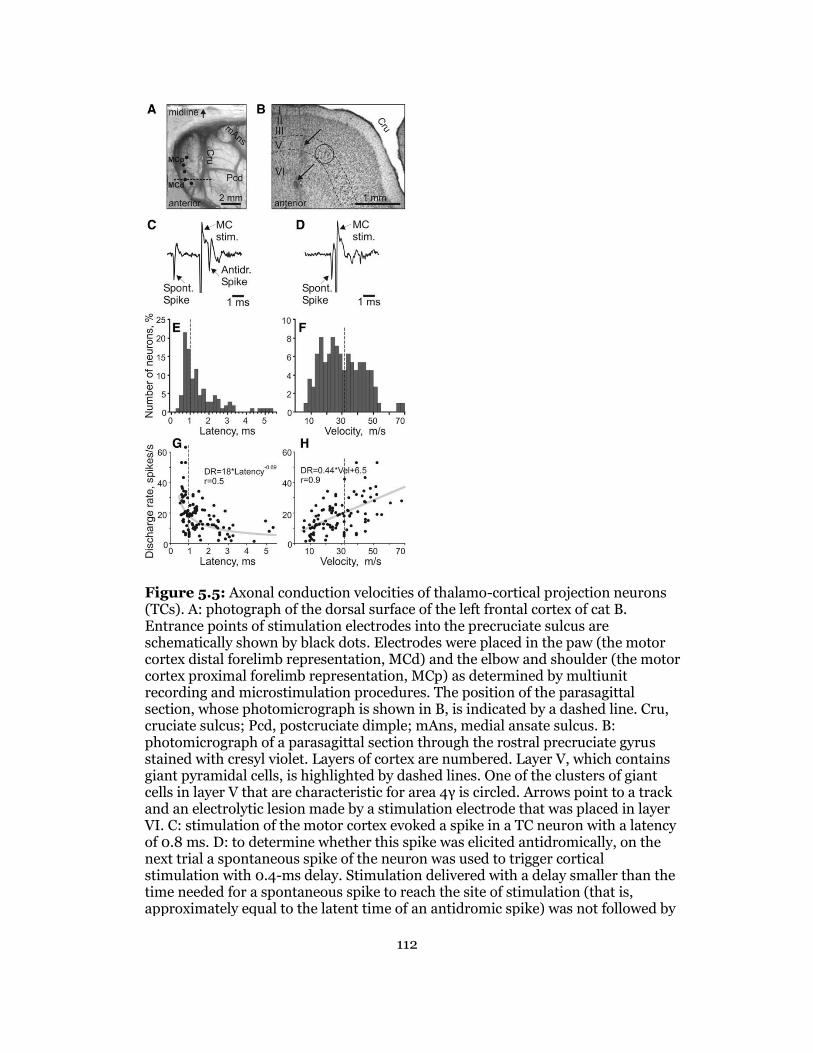
112
Figure 5.5: Axonal conduction velocities of thalamo-cortical projection neurons (TCs). A: photograph of the dorsal surface of the left frontal cortex of cat B. Entrance points of stimulation electrodes into the precruciate sulcus are schematically shown by black dots. Electrodes were placed in the paw (the motor cortex distal forelimb representation, MCd) and the elbow and shoulder (the motor cortex proximal forelimb representation, MCp) as determined by multiunit recording and microstimulation procedures. The position of the parasagittal section, whose photomicrograph is shown in B, is indicated by a dashed line. Cru, cruciate sulcus; Pcd, postcruciate dimple; mAns, medial ansate sulcus. B: photomicrograph of a parasagittal section through the rostral precruciate gyrus stained with cresyl violet. Layers of cortex are numbered. Layer V, which contains giant pyramidal cells, is highlighted by dashed lines. One of the clusters of giant cells in layer V that are characteristic for area 4γ is circled. Arrows point to a track and an electrolytic lesion made by a stimulation electrode that was placed in layer VI. C: stimulation of the motor cortex evoked a spike in a TC neuron with a latency of 0.8 ms. D: to determine whether this spike was elicited antidromically, on the next trial a spontaneous spike of the neuron was used to trigger cortical stimulation with 0.4-ms delay. Stimulation delivered with a delay smaller than the time needed for a spontaneous spike to reach the site of stimulation (that is, approximately equal to the latent time of an antidromic spike) was not followed by

113
a response. This indicated a collision of ortho- and antidromically conducted spikes and confirmed the antidromic nature of the evoked spike. E: distribution of latencies of antidromic responses to stimulation of the motor cortex of all 116 TC neurons whose activity was recorded during locomotion. F: distribution of estimated conduction velocities. In E and F dashed lines separate “fast” (latencies 0.4–1.0 ms) and “slow” (latencies 1.1–6.0 ms)-conducting neurons. G: relationship between the mean discharge rate of individual neurons in the resting animal and their antidromic latency, approximated with a power function. H: relationship between the mean discharge rate of individual neurons in the resting animal and axonal conduction velocity, approximated with a linear regression. r, Coefficient of correlation.
Characteristics of Locomotion
During recording from each neuron, cats ran between 15 and 100 (typically 25–50)
times down each of the corridors. From these trials, 15–150 strides (50 ± 30) of each
locomotion task were selected for the analysis according to criteria outlined in methods.
For different neurons, the average duration of selected strides was between 600 and 750
ms. The ratio of stance duration to the duration of the cycle (the stride duty factor) was
0.57–0.60. The gait that cats used during walking on both the flat surface and along the
ladder was a walk with the support formula 2-3-2-3-2-3-2-3 (Hildebrand 1965). Further
details of biomechanics and muscle activities in cats walking on the flat surface and
along the horizontal ladder in this experimental setup can be found in Beloozerova et al.
(2010).
Population activity during simple and complex locomotion
Upon transition from standing to walking the discharge rate of many neurons
changed. It increased, up to 10-fold, in 31% of neurons or decreased, down to less than
one-half, in 27% of them. Because changes in the activity were opposite in different
neurons, the average discharge rate of the whole population did not change. We found
no correlation between receptive fields of the neurons and changes in the discharge rate
with the start of locomotion. The average activity of neurons without somatosensory

114
receptive fields, however, was lower than that of somatosensory responsive cells (P <
0.05, t-test). Neurons with receptive fields on different parts of the forelimb had similar
average activity. The average discharge rate of neurons during walking along the
horizontal ladder was similar to that observed during standing and walking on the flat
surface. Fast-conducting TCs were more active than slow-conducting TCs during all
tasks, however (P < 0.05, t-test).
During simple locomotion, the activity of 92% of neurons (220/238), including
91% of TCs (105/116), was modulated in the rhythm of strides: it increased in one phase
of the stride and decreased in another phase. Two basic patterns of modulation were
recognized: one or two PEFs (see methods). Most common was the one-PEF pattern seen
in 67% (148/220) of neurons, including 63% (66/105) TCs. Two PEFs were observed in
31% (69/220) of cells, including 35% (37/105) TCs. During locomotion along the ladder,
the activity of 96% of neurons (229/238) was also modulated: the one-PEF pattern was
seen in 63% (145/229) of neurons and the two-PEF pattern in 34% (78/229) of neurons.
In addition, there were three neurons with three PEFs during simple locomotion and
seven such neurons during ladder locomotion; we did not consider activity of these cells
further. Most neurons had a similar modulation pattern during both locomotor tasks,
but in some neurons the pattern changed. We will first compare activities of one- and
two-PEF populations during simple and complex locomotion and then look into
activities of individual cells.
Neurons with one PEF per stride
During simple locomotion a representative neuron shown in Fig. 5.6 discharged
throughout all phases of the stride except for the middle of stance, when it was
practically silent (Fig. 5.6A and B). The discharge within the PEF varied in intensity,
115
forming three small subpeaks; the maximum discharge rate was 80 spikes/s. In Fig.
5.6B the PEF is indicated by a solid black horizontal line, and the preferred phase of the
activity is shown by a circle. During ladder locomotion, rather than discharging
throughout most of the stride cycle, the neuron was active almost exclusively around the
swing-stance transition (Fig. 5.6G and H) but peaked near the same preferred phase as
during simple locomotion. Its firing rate reached 118 spikes/s, significantly higher than
during simple locomotion (P < 0.05, t-test), whereas the activity in the trough during
stance remained low. Consequently, the strength of modulation was larger during ladder
than during simple locomotion. The duration of the PEF shortened by one-half.
Figure 5.6F and L, show phase positions within the step cycle of PEFs and
preferred phases of all neurons during simple and ladder locomotion, respectively. One
can see that, during both tasks, PEFs of different neurons were distributed fairly evenly
over the cycle. Duration of PEFs differed between neurons in the range of 20–90% of the
cycle and lasted ∼65% of the cycle on average during either task. In the vast majority of
neurons, the discharge rate within the PEF varied. In 27% of neurons at least two
subpeaks with activity above the average discharge rate were observed; this level is twice
as high as the threshold discharge rate for PEF recognition. The strength of the stride-
related modulation of the discharge varied between neurons. About 20% of neurons were
completely silent for a part of the step cycle; the majority, however, were active
throughout the cycle, while their discharge rate was modulated. During simple
locomotion the coefficient of modulation, M was 81± 1%, and the coefficient dM was 8 ±
0.2%. During ladder locomotion the strength of modulation was larger: M was 87 ± 1%,
and dM was 9.6 ± 0.3% (means ± SE); the increase in both M and dM was highly
significant (P < 0.0001, t-test). Because of even distribution of PEFs throughout the
cycle and their relatively long duration, PEFs overlapped each other, and 60–70% of

116
Figure 5.6: Population characteristics of one-period of elevated firing (PEF) neurons. A and B and G and H: example of activity of a typical neuron (group I neuron, see Fig. 13) during walking on the flat surface (A, B) and along the horizontal ladder (G, H). The activity is presented as a raster of 50 step cycles (A, G) and a histogram (B, H). In the rasters, the duration of strides is normalized to 100%, and the rasters are rank ordered according to the duration of the swing phase. The end of swing and the beginning of the stance in each cycle is indicated by an open triangle. In histograms, the horizontal interrupted line indicates the average discharge frequency during standing. The horizontal black bar shows the PEF, and the circle indicates the preferred phase (as defined in METHODS). C and I: distribution of preferred phases of activity of all one-PEF neurons during simple (C) and ladder (I) locomotion. D and J: proportion of active neurons (neurons in their PEF) in different phases of the step cycle during simple (D) and ladder (J) locomotion. E and K: mean discharge rate of neurons during simple (E) and ladder (K) locomotion. Thin lines show SE. F and L: phase distribution of PEFs during simple (F) and ladder (L) locomotion. Each horizontal bar represents the PEF location of 1 neuron (shown in black in 1 cycle only) relative to the step cycle. Neurons are rank ordered so that those active earlier in the cycle are plotted at top of graph. Vertical solid lines highlight 1 cycle. Vertical interrupted lines denote end of swing and beginning of stance phase.

117
neurons were simultaneously active at any time of the cycle during either task (Fig.
5.6D and J). As a result, despite the substantial modulation of the activity in most of the
individual neurons, the averaged discharge rate of the population was around 20–25
spikes/s throughout the cycle during both simple and ladder locomotion (Fig.
5.6E and K).
We did not find any simple correlation between neuronal responses to
somatosensory stimulation in the quiescent animal and preferred phases of their activity
during locomotion. During simple locomotion, the preferred phases of most neurons
responsive to passive extension of the shoulder or elbow were timed to the periods of
extension of the shoulder or elbow, respectively. In contrast, most neurons responsive to
passive flexion of the shoulder or ventral flexion of the wrist had preferred phases not
timed to periods of flexion in these joints. Furthermore, an overwhelming majority of
neurons without somatosensory receptive fields had profoundly modulated activity.
Similar inconsistency was found during ladder locomotion.
In contrast to this inconsistency, neurons with receptive fields involving different
joints tended to have their PEF in specific phases of the step cycle (Fig. 5.7). During
simple locomotion, neurons responsive to passive movements in the shoulder joint
and/or palpation of back, chest, or neck muscles more often had PEF during the swing
and early stance phases (Fig. 5.7A). During ladder locomotion, however, these neurons
more often had their PEF during stance, and their population activity during stance was
higher than that during simple locomotion (Fig. 5.7D). Neurons responsive to passive
movement of the elbow more often had their PEF in the late stance and early swing
during both tasks (Fig. 5.7, B and E). Most neurons responsive to stimulation of the paw
or movement in the wrist joint had their PEF in the beginning and middle of stance (Fig.

118
5.7C and F). PEFs and preferred phases of neurons without receptive fields were evenly
distributed over the cycle.
The one-PEF neurons were distributed over the entire area of recording in the VL
without apparent clustering; they projected to both distal and proximal forelimb
representations in the motor cortex via both fast- and slow-conducting TCs. When
grouped according to the site of projection in the motor cortex (distal vs. proximal), or
the conduction velocity (fast vs. slow), during simple locomotion the neuronal
populations did not show any differences in the strength of modulation or duration of
PEF. However, the neurons projecting to the cortical paw representation, as well as slow-
conducting TCs, had subtle but statistically significant higher activity during swing
compared with stance, while their counterparts did not. Furthermore, the neurons with
preferred phases in the first half of swing (SW1) or in the first half of stance (ST1) had
higher activity during their respective preferred periods, compared with the neurons
with preferred phases in the second half of swing (SW2) or in the second half of stance
(ST2) [36.8 ± 2.2 vs. 27.3 ± 1.5 spikes/s (means ± SE); P < 0.05, t-test].
During ladder locomotion, fast TCs were more active during swing compared with
stance (P < 0.05, t-test), whereas slow TCs tended to be more active in the opposite
phase. The step-related modulation of neurons with shoulder or elbow receptive fields
was stronger than that of neurons with wrist/paw receptive fields: The coefficient M was
87–90% vs. 75%, and dM was 9.4–9.8% vs. 6.4% (P < 0.005, t-test). In addition,
neurons with preferred phases in the first half of swing (SW1) became still more active
during swing (P < 0.05, t-test), while the activity of neurons with preferred phases in the
second half of swing (SW2) did not change, and their number decreased by 35%.

119
Figure 5.7: One-PEF neurons with receptive fields on different joints tend to discharge during different phases of the stride. A and D: activity of neurons responsive to movements in the shoulder joint and/or palpation of back, chest, or neck muscles during simple (A) and ladder (D) locomotion. A1 and D1: phase distribution of PEFs. A2 and D2: corresponding phase distribution of discharge frequencies. Average discharge frequency in each 1/20th portion of the cycle is color-coded according to the scale shown at bottom. A3 and D3: proportion of active neurons (neurons in their PEFs) in different phases of the step cycle during simple (A3) and ladder (D3) locomotion. A4 and D4: mean discharge rate during simple (A4) and ladder (D4) locomotion. Thin lines show SE. Vertical interrupted lines denote end of swing and beginning of stance phase. B and E: activity of neurons responsive to passive movement of the elbow joint. C and F: activity of neurons responsive to stimulation of the paw or movement in the wrist joint.
Significant differences between the activity of populations during different periods of the cycle.
120
Neurons with Two-PEF per Stride
An example of activity of a representative neuron with two PEFs is shown in Fig.
5.8. During simple locomotion this neuron was active during both swing-stance and
stance-swing transitions (Fig. 5.8A). The discharge rate reached 25 and 30 spikes/s in
two different peaks (Fig. 5.8B). On the ladder, the neuron was still active during swing-
stance and stance-swing transitions, but its two PEFs deviated from each other in both
amplitude and duration. The PEF during swing-stance transition became markedly
longer and had higher discharge rate than the other PEF. In addition, one of the troughs
deepened. As a result, the strength of modulation was larger during ladder locomotion,
while the total duration of PEFs was shorter.
Figure 5.8E and J show the distributions of PEFs in all two-PEF neurons. By the phase
and duration of their PEFs, neurons could be loosely subdivided into three groups. The
first group included cells that had a long PEF during swing and a short PEF during
stance—the “swing” neurons (33% of cells). PEFs of these neurons are concentrated in
the upper third of the graphs. The second group consisted of cells that had a long PEF
during stance and a short PEF during swing—the “stance” neurons (25% of cells). PEFs
of these neurons are concentrated in the lower part of the graphs. In both swing and
stance neurons, during simple locomotion the longer PEF was typically (in 70% of cells)
also the stronger one, as the discharge rate in it exceeded that in the shorter PEF by 20 ±
15 spikes/s. The duration of the longer PEF ranged from 25% to 70% of the cycle, and the
duration of the shorter PEF ranged from 10% to 30%. During ladder locomotion the
activity of stance neurons differed in the discharge intensity during swing: in many of
these neurons the discharge rate during the shorter PEF in swing was as high as during
the longer PEF in stance. By contrast, in the majority (73%) of swing neurons during
ladder locomotion the activity during the longer PEF in swing was still higher.
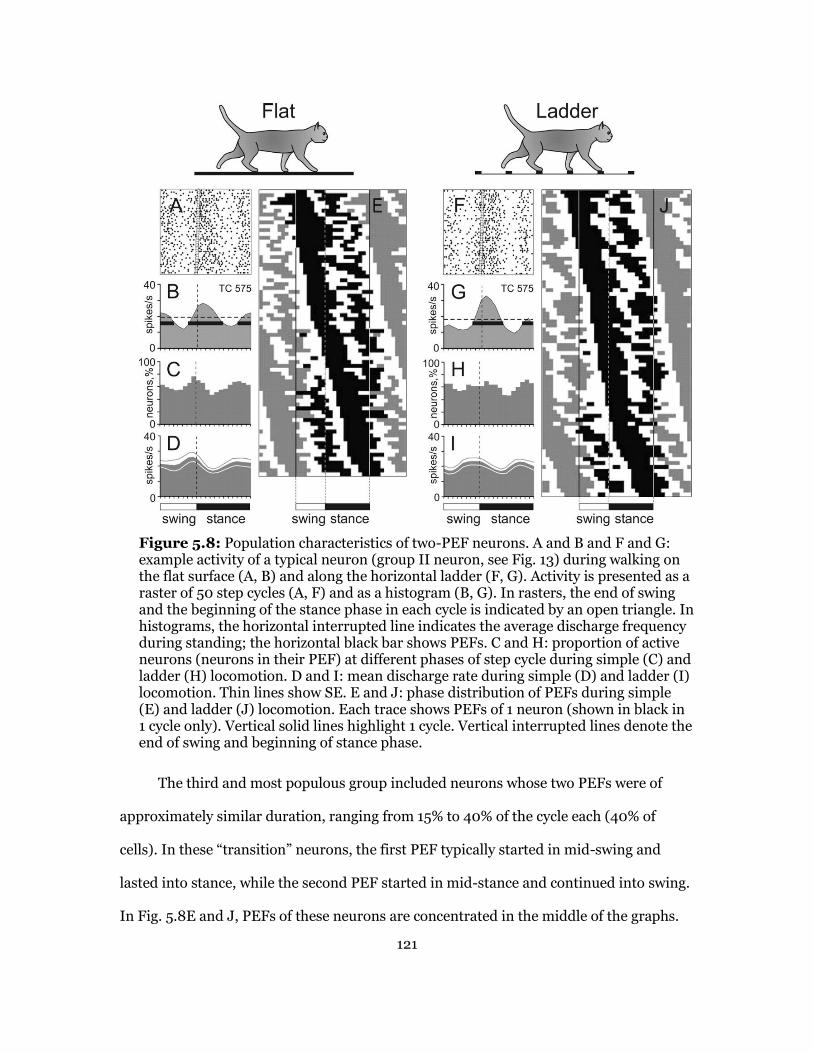
121
Figure 5.8: Population characteristics of two-PEF neurons. A and B and F and G: example activity of a typical neuron (group II neuron, see Fig. 13) during walking on the flat surface (A, B) and along the horizontal ladder (F, G). Activity is presented as a raster of 50 step cycles (A, F) and as a histogram (B, G). In rasters, the end of swing and the beginning of the stance phase in each cycle is indicated by an open triangle. In histograms, the horizontal interrupted line indicates the average discharge frequency during standing; the horizontal black bar shows PEFs. C and H: proportion of active neurons (neurons in their PEF) at different phases of step cycle during simple (C) and ladder (H) locomotion. D and I: mean discharge rate during simple (D) and ladder (I) locomotion. Thin lines show SE. E and J: phase distribution of PEFs during simple (E) and ladder (J) locomotion. Each trace shows PEFs of 1 neuron (shown in black in 1 cycle only). Vertical solid lines highlight 1 cycle. Vertical interrupted lines denote the end of swing and beginning of stance phase.
The third and most populous group included neurons whose two PEFs were of
approximately similar duration, ranging from 15% to 40% of the cycle each (40% of
cells). In these “transition” neurons, the first PEF typically started in mid-swing and
lasted into stance, while the second PEF started in mid-stance and continued into swing.
In Fig. 5.8E and J, PEFs of these neurons are concentrated in the middle of the graphs.
122
The average duration of each PEF was 30 ± 7% of the step cycle, approximately half as
long as in the one-PEF group. Although in transition neurons the two PEFs were of a
similar duration, in 68% of them the discharge in one of the PEFs was more intense, by
15 ± 12 spikes/s, on average.
Because of a rather even distribution of PEFs of different neurons throughout the
cycle, and their long duration, the PEFs overlapped each other, and 50–70% of neurons
were simultaneously active in any phase of the cycle (Fig. 5.8C and H). The discharge
rate of the population of two-PEF neurons was slightly modulated around the value of 20
spikes/s with two small peaks during the swing-stance and stance-swing transition
periods (Fig. 5.8D and I).
During simple locomotion, the strength of stride-related frequency modulation, M,
was 79 ± 12% and dM was 8.2 ± 3.4%. Both values were similar to those in the one-PEF
group. Upon transition to ladder locomotion, however, in sharp contrast with the one-
PEF group, the strength of modulation in the two-PEF population did not increase.
In two-PEF cells the active phase during locomotion usually differed from the
phase that could be expected based on somatosensory responses in the resting animal,
similar to that in one-PEF neurons. Unlike one-PEF neurons, however, the activities of
two-PEF cells with receptive fields involving different joints were similarly distributed
across the stride: all groups had two subtle maxima at swing-stance and stance-swing
transitions.
Two-PEF neurons were distributed over the entire area of sampling in the VL and
intermingled with one-PEF cells. Both fast- and slow-conducting TCs with two PEFs
projected to both the distal and proximal forelimb representations in the motor cortex.
Groups of neurons assembled according either to the site of projection to the motor

123
cortex (distal vs. proximal) or to conduction velocity (fast vs. slow) during simple
locomotion were similar in their activity phases, strength of modulation, and duration of
PEFs. During ladder locomotion, however, the step-related modulation of neurons
projecting to the paw area was stronger than that of neurons projecting to the elbow or
shoulder areas: the coefficient M was 84 ± 2% vs. 77 ± 3%, and dM was 9.3 ± 0.6% vs.
7.0 ± 0.7% (mean ± SE) (P < 0.05, t-test). Also, the PEFs of neurons projecting to the
paw/wrist area were slightly shorter, lasting for 55 ± 2% rather than 65 ± 3% of the cycle
(P < 0.05, t-test). During either task, swing, stance, and transition neurons were similar
in their average and peak discharge rates, strength of modulation, and durations of PEF.
Swing neurons, however, were more active during swing than stance neurons during
stance (30 ± 2.7 vs. 20 ± 1.2 spikes/s; P < 0.05, t-test).
Individual neurons discharge differently during two locomotion tasks
Upon transition from simple locomotion to walking along the horizontal ladder,
individual neurons changed their activity to even a greater extent than the populations
did as a whole: 79% of neurons changed at least one characteristic of the activity. First,
the mean discharge rate changed in 42% (100/238) of neurons, increasing in 19%
(46/238) of neurons and decreasing in 23% (54/238) (Fig. 5.9A). The increase was on
average 63 ± 55%, and the decrease was 34 ± 16%. The peak discharge rates averaged
over one histogram bin (1/20th of the cycle) also changed in many neurons upon
transition from simple to ladder locomotion. They increased in 30% of cells (68 of 230
neurons whose activity was step related in at least one of the tasks) and decreased in 14%
(33/230). The average increase was 20.5 ± 9.0 (73 ± 53%) and the decrease was 16.5 ±
6.5 (32 ± 15%) spikes/s, respectively.
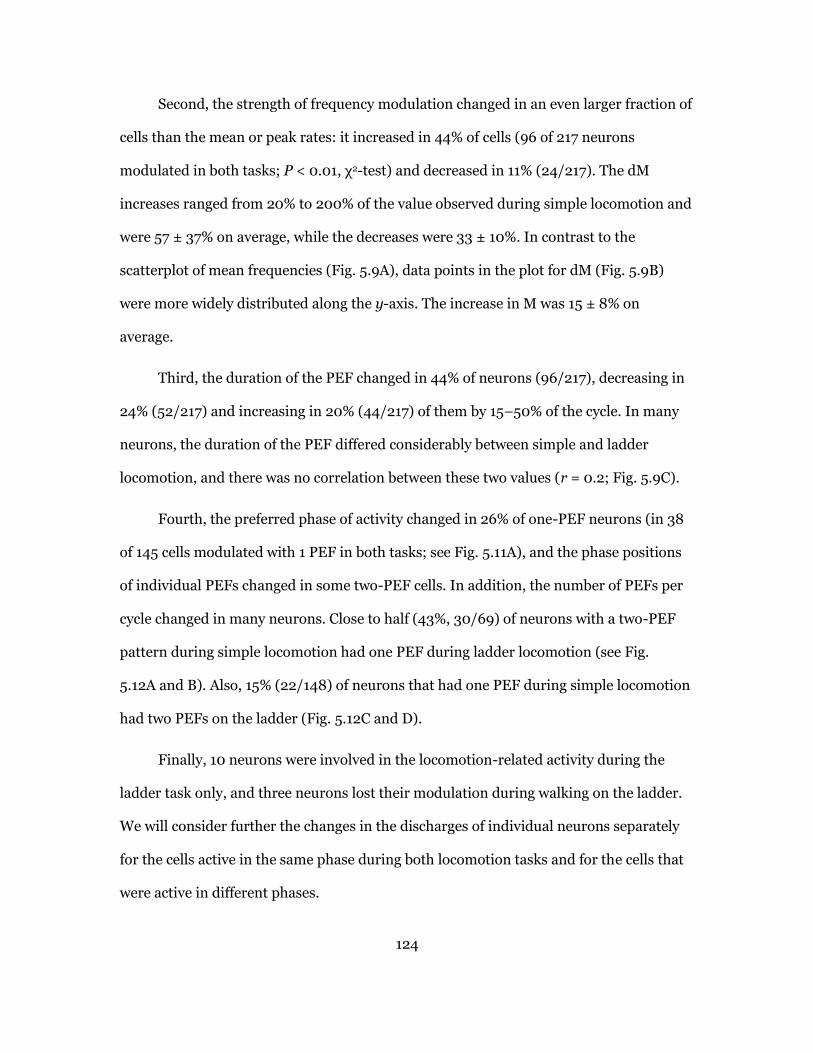
124
Second, the strength of frequency modulation changed in an even larger fraction of
cells than the mean or peak rates: it increased in 44% of cells (96 of 217 neurons
modulated in both tasks; P < 0.01, χ2-test) and decreased in 11% (24/217). The dM
increases ranged from 20% to 200% of the value observed during simple locomotion and
were 57 ± 37% on average, while the decreases were 33 ± 10%. In contrast to the
scatterplot of mean frequencies (Fig. 5.9A), data points in the plot for dM (Fig. 5.9B)
were more widely distributed along the y-axis. The increase in M was 15 ± 8% on
average.
Third, the duration of the PEF changed in 44% of neurons (96/217), decreasing in
24% (52/217) and increasing in 20% (44/217) of them by 15–50% of the cycle. In many
neurons, the duration of the PEF differed considerably between simple and ladder
locomotion, and there was no correlation between these two values (r = 0.2; Fig. 5.9C).
Fourth, the preferred phase of activity changed in 26% of one-PEF neurons (in 38
of 145 cells modulated with 1 PEF in both tasks; see Fig. 5.11A), and the phase positions
of individual PEFs changed in some two-PEF cells. In addition, the number of PEFs per
cycle changed in many neurons. Close to half (43%, 30/69) of neurons with a two-PEF
pattern during simple locomotion had one PEF during ladder locomotion (see Fig.
5.12A and B). Also, 15% (22/148) of neurons that had one PEF during simple locomotion
had two PEFs on the ladder (Fig. 5.12C and D).
Finally, 10 neurons were involved in the locomotion-related activity during the
ladder task only, and three neurons lost their modulation during walking on the ladder.
We will consider further the changes in the discharges of individual neurons separately
for the cells active in the same phase during both locomotion tasks and for the cells that
were active in different phases.

125
Neurons Active in the Same Phase during Both Tasks
The preferred phases of activity in half of one-PEF neurons (80/148, 54%) did not
change upon transition from simple to ladder locomotion, whereas other parameters of
the discharge could change (Fig. 5.10). Most striking was the change in the strength of
stride-related modulation. In 24 (30%) neurons its value increased by 50 ± 30%. Along
with this increase, either the average discharge rate or the duration of PEF often
changed. Both tended to decrease as the depth of modulation increased. At the same
time, the peak discharge rate and the average activity within the PEF typically increased
(by 10–35 spikes/s) or did not change. There were also five cells in which the duration of
the PEF decreased without a change in the strength of modulation. Thus, during complex
locomotion, the activity of 36% (29/80) neurons with one PEF during both locomotion
tasks became more task-related as well as more time restricted, better tuned to a
particular phase of the step cycle, and more precise (compare Fig. 5.6A, B, G, and H); we
have termed these cells group I neurons. Group I neurons projected to both distal and
proximal forelimb representations in the motor cortex and had a variety of conduction
velocities and receptive fields. Two-thirds of them were located medially in the VL. The
preferred phases of activity of group I neurons were distributed evenly across the stride.
Another 10% (8/80) of neurons decreased their modulation depth during ladder
locomotion by 30 ± 8% on average. Besides these, 24% (19/80) of cells changed their
discharge rate without altering the depth of modulation or PEF duration, and another
24% (19/80) discharged similarly during two locomotion tasks.
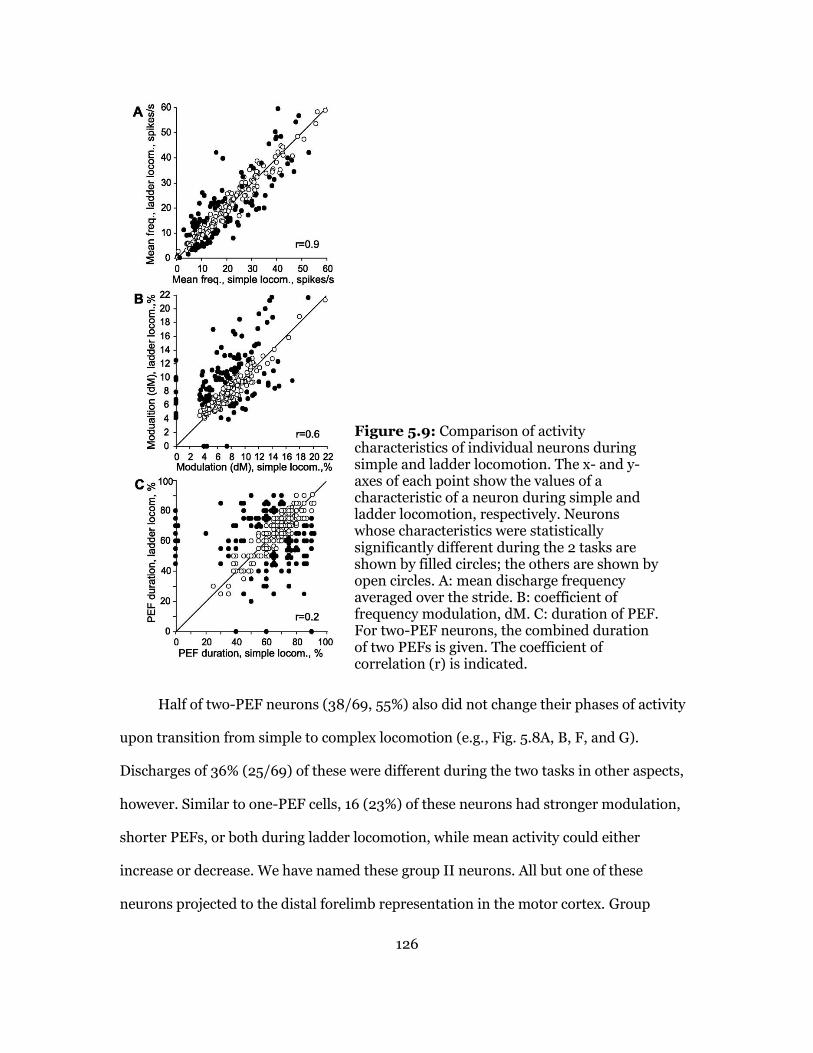
126
Figure 5.9: Comparison of activity characteristics of individual neurons during simple and ladder locomotion. The x- and y-axes of each point show the values of a characteristic of a neuron during simple and ladder locomotion, respectively. Neurons whose characteristics were statistically significantly different during the 2 tasks are shown by filled circles; the others are shown by open circles. A: mean discharge frequency averaged over the stride. B: coefficient of frequency modulation, dM. C: duration of PEF. For two-PEF neurons, the combined duration of two PEFs is given. The coefficient of correlation (r) is indicated.
Half of two-PEF neurons (38/69, 55%) also did not change their phases of activity
upon transition from simple to complex locomotion (e.g., Fig. 5.8A, B, F, and G).
Discharges of 36% (25/69) of these were different during the two tasks in other aspects,
however. Similar to one-PEF cells, 16 (23%) of these neurons had stronger modulation,
shorter PEFs, or both during ladder locomotion, while mean activity could either
increase or decrease. We have named these group II neurons. All but one of these
neurons projected to the distal forelimb representation in the motor cortex. Group

127
Figure 5.10: Changes in activity characteristics of neurons that were active in similar phases of the stride and had one PEF during both simple and ladder locomotion. A: negative correlation between change in the depth of modulation (dM) and mean discharge frequency (Act). B: negative correlation between the change in the depth of modulation and duration of PEF (PEFw). In A and B the x-axis and y-axis of each point show the difference in a discharge characteristic of a neuron between simple and ladder locomotion tasks. The difference is positive if the value of the parameter was larger during ladder locomotion. Only neurons with statistically significant difference in the depth of modulation between two tasks are shown. The coefficient of correlation (r) is indicated.
II neurons had a variety of axonal conduction velocities, and their receptive fields could
be on either distal or proximal segments of the forelimb. Swing, stance, and transition
neurons were all represented in this group.
Neurons Active in Different Phases during Two Tasks
A change in the phase of activity of a neuron upon transition from simple to
complex locomotion could occur either because of a phase shift of the same discharge
pattern within the cycle or because of re-formation of the pattern, so that the neuron had
a one-PEF pattern in one locomotion task and a two-PEF pattern during another task.

128
Phase shifts of the discharge pattern were seen almost exclusively in one-PEF
neurons. The preferred phase in 38 (26%, 38/148) one-PEF neurons changed between
two tasks in this manner (Fig. 5.11). We have named these group III neurons. The
average phase shift in group III neurons was 20 ± 9% of the cycle (Fig. 5.11A).
Approximately similar numbers of neurons discharged earlier and later in the cycle
during ladder versus simple locomotion (Fig. 5.11A). Figure 5.11C–F illustrates two most
common types of phase shifts. Aside from the preferred phase shift, the most striking
modification in the activity of group III neurons was a change in the strength of stride-
related modulation. It increased in 50% (19/38) of neurons by 65 ± 30% on average. This
was similar to the behavior of group I neurons. In group III, however, the average
discharge rate was typically similar during both locomotion tasks, while the duration of
PEF was also shorter in more than half of the cells (Fig. 5.11B). Thus, during complex
locomotion, the activity of very many group III neurons became also more strongly stride
related and often more focused on a specific phase, precise, compared with simple
locomotion. Group III neurons had a variety of receptive fields, but elbow extension was
disproportionally represented. The great majority of group III neurons projected to the
distal forelimb area of the motor cortex; 75% of group III TCs were “slow,” and two-
thirds of group III cells were located laterally within the nucleus.
Some neurons with one PEF during simple locomotion changed the preferred
phase of activity on the ladder because of acquisition of a second PEF (22/148, 15%). We
have named these group IV neurons. Fig. 5.12A–D, illustrates the two most common
types of phase shifts. There was no particular phase in which the new PEF would tend to
appear, and during ladder locomotion the number of group IV cells active in each phase
of the cycle remained the same as during simple locomotion. And once again, besides the

129
Figure 5.11: Changes in activity characteristics of neurons that had one PEF during both simple and ladder locomotion but were active in different phases of the stride (group III neurons). A: comparison of preferred phases of activity in individual neurons during simple and ladder locomotion. The x-axis and y-axis of each point show the preferred phase of a neuron during simple and ladder locomotion, respectively. Neurons whose characteristics were statistically significantly different during the two tasks are shown with filled circles; the others are shown with open circles. Areas that correspond to the swing phase during one task but stance phase during the other task are shaded. B: negative correlation between the change in the depth of modulation and the duration of PEF. The x-axis and y-axis of each point show the difference in a discharge characteristic of a neuron between simple and ladder locomotion. The difference is positive if the value of the parameter was larger during ladder locomotion. Only neurons with statistically significant differences in the depth of modulation between two tasks are shown. The coefficient of correlation (r) is indicated. C: schematic presentation of the most frequently observed type of the change in the discharge pattern of group III neurons upon transition from simple to ladder locomotion: the shift in the preferred phase occurs because the activity in a
130
part of the PEF observed during simple locomotion decreases during ladder locomotion. Solid line shows the activity during simple locomotion; interrupted line shows the activity during ladder task. Vertical dashed line shows the transition between swing and stance. D: example of activity of a typical group III neuron. Area histogram shows the activity of the neuron during simple locomotion. Bar histogram shows its activity during ladder task. To promote visualization of the difference between activities in two tasks, the cycle is repeated twice. E and F: same as C and D but showing the second most frequent type of the activity change in group III neurons when the shift in the preferred phase occurs because the activity in a part of the PEF observed during simple locomotion decreases during ladder locomotion, and this reduction is accompanied by an increase in the discharge rate during the remaining part of the PEF.
change in the pattern of modulation, the other major modification in the activity of these
neurons was an increase of modulation: in 45% of group IV neurons, it increased by 74 ±
43% on average. Group IV neurons had a variety of receptive fields, projected to both
distal and proximal forelimb representations in the motor cortex, and nearly all group
IV TCs were “slow.” Two-thirds of group IV cells were located laterally in the VL.
In contrast to one-PEF neurons that only infrequently acquired a second PEF, the
two-PEF cells often changed their discharge pattern (P < 0.0001, χ2-test). Nearly half of
neurons (30/69, 43%) with two PEFs during simple locomotion had one PEF during
walking on the ladder (Fig. 5.12E–H). We have named these group V neurons. In 18 of
these neurons the reduction in PEF number occurred because one of the PEFs seen
during simple locomotion was absent on the ladder (Fig. 5.12E and F). In the
overwhelming majority of the neurons (n = 14) this was accompanied by an increase in
the discharge rate within the remaining PEF. In 12 other cells the transition from a two-
PEF to a one-PEF pattern was accomplished by an increase in the activity during one of
the inter-PEF intervals, joining the previously distinct PEFs (Fig. 5.12G and H). There
was no particular phase preference for which PEF tended to disappear in different
neurons, and on the ladder the number of group V cells active in each phase of the cycle
remained about the same as during simple locomotion, despite the fact that on the
ladder they had only one PEF instead of two. The other major modification in the activity
131
of group V neurons was the change in the depth of modulation. It increased in one-third
of the cells by an average 72 ± 56%. Group V neurons projected to both distal and
proximal forelimb representations in the motor cortex, had a variety of conduction
velocities, and were scattered across the nucleus, but almost all had receptive fields on
the shoulder.
Discussion
VL Signals Conveyed during Simple Locomotion
The first goal of this study was to elucidate whether during locomotion VL neurons
discharge in a manner that is suitable to contribute to the locomotion-related activity in
the motor cortex. We found that they do. The activity of 92% of VL neurons was
modulated in the rhythm of strides, and 67% of neurons, including 63% of TCs,
discharged with a single period of elevated firing (PEF) per cycle. This discharge pattern
is similar to that observed in the majority of neurons in the motor cortex (Armstrong and
Drew 1984; Beloozerova and Sirota 1985a, 1993a, b; Drew 1993). Thus the one-PEF TCs
can directly contribute to the activity in the motor cortex during locomotion. All phases
of the step cycle are covered with a nearly equal neuronal representation (Fig. 5.6C, D,
and F) and similar intensity (Fig. 5.6E). A substantial number of VL neurons discharge
with two PEFs per stride, including 35% of TCs. Since a limb central pattern generator
(CPG) discharges only one time per cycle (reviewed in McCrea and Rybak 2008), if a
neuron discharges more than once, this means that it receives input from more than one
limb CPG or that there are several peripheral inputs that significantly influence its
discharge. The two-PEF pattern is less frequently observed in the motor cortex
(Armstrong and Drew 1984; Beloozerova and Sirota 1985a, 1993a, 1993b; Drew 1993).
However, in most two-PEF VL neurons one of the PEFs is typically
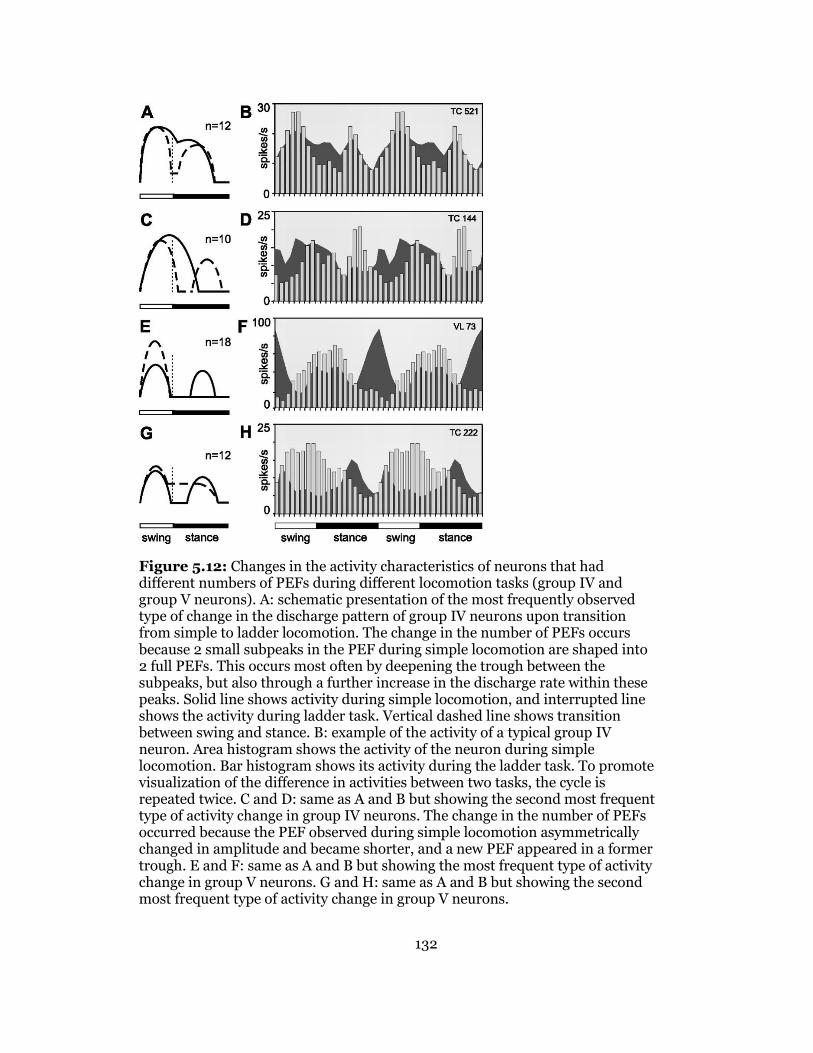
132
Figure 5.12: Changes in the activity characteristics of neurons that had different numbers of PEFs during different locomotion tasks (group IV and group V neurons). A: schematic presentation of the most frequently observed type of change in the discharge pattern of group IV neurons upon transition from simple to ladder locomotion. The change in the number of PEFs occurs because 2 small subpeaks in the PEF during simple locomotion are shaped into 2 full PEFs. This occurs most often by deepening the trough between the subpeaks, but also through a further increase in the discharge rate within these peaks. Solid line shows activity during simple locomotion, and interrupted line shows the activity during ladder task. Vertical dashed line shows transition between swing and stance. B: example of the activity of a typical group IV neuron. Area histogram shows the activity of the neuron during simple locomotion. Bar histogram shows its activity during the ladder task. To promote visualization of the difference in activities between two tasks, the cycle is repeated twice. C and D: same as A and B but showing the second most frequent type of activity change in group IV neurons. The change in the number of PEFs occurred because the PEF observed during simple locomotion asymmetrically changed in amplitude and became shorter, and a new PEF appeared in a former trough. E and F: same as A and B but showing the most frequent type of activity change in group V neurons. G and H: same as A and B but showing the second most frequent type of activity change in group V neurons.
133
shorter and weaker (Fig. 5.8E) and might lack a sufficient effect on the activity of the
target cortical neurons.
We found two notable differences in the activity of VL neurons and efferent
neurons of motor cortex layer V. The average depth of modulation (dM) is lower in the
VL, 8 ± 0.2% vs. 10 ± 0.7% (Sirota et al. 2005; P < 0.05, t-test), and the discharge within
the activity bursts is more variable. That is, stride-related responses of VL neurons are
less phase specific compared with those of motor cortex layer V neurons. This agrees
with previous findings of a weaker directional specificity of VL neuron discharges during
arm and wrist movements compared with that of neurons in the motor cortex (Kurata
2005; Strick 1976) and is in line with an analogous observation in the visual system,
where responses of neurons in the lateral geniculate nucleus are less specific to visual
stimuli than those of cells in the visual cortex (see, e.g., Tsao and Livingstone 2008).
The locomotion-related modulation of activity in the VL during simple locomotion
may arise from two main sources: the spino-thalamic projection (Craig 2008; Mackel et
al. 1992; Yen et al. 1991) and the cerebello-thalamic projection (Evrard and Craig
2008; Ilinsky and Kultas-Ilinsky 1984; Nakano et al. 1980; Steriade 1995). In addition,
influence from the motor cortex may partially contribute. In decerebrated cats, it was
found that the cerebellum plays the pivotal role in driving locomotion-related discharges
in neurons of subcortical motor centers, including neurons of the red and vestibular
nuclei, and neurons of reticular formation giving rise to the reticulo-spinal tract
(Orlovsky 1970; Orlovsky 1972a, b; reviewed in Arshavskii et al. 1986). It can be
suggested that the VL, another subcortical motor nucleus receiving direct connections
from the cerebellum, does not differ in this respect. Indeed, the cerebellum receives
information both from the spinal locomotor CPG and from somatosensory receptors
(Arshavsky et al. 1986; Lundberg and Oscarsson 1962; Oscarsson 1965) and can pass

134
both types of information to the VL. All deep cerebellar nuclei project to the area of VL
that we have explored (see, e.g., Angaut 1979; Evrard and Craig 2008; Ilinsky and
Kultas-Ilinsky 1984; Nakano et al. 1980; Rinvik and Grofová 1974; Rispal-Padel and
Grangetto 1977), and it was shown that all these nuclei house neurons whose activity is
strongly step related during locomotion (Armstrong and Edgley 1984; Nilaweera and
Beloozerova 2009; Orlovsky 1972a, b). Interposed nucleus neurons more often (57% of
cells) discharge one burst of spikes per stride, while 39% discharge two bursts
(Armstrong and Edgley 1984). These proportions are similar to those that we found in
the VL (P > 0.05, χ2-test). Also, similarly to VL neurons, periods of elevated firing in
interposed nucleus neurons are widely distributed through the stride, and as a
population they too have a slightly elevated activity during swing phase. Lateral nucleus
neurons usually have a single PEF, and their preferred phases are also distributed across
the step cycle (Beloozerova and Sirota 1998; Nilaweera and Beloozerova 2009).
VL Signals Conveyed During Complex Locomotion
The second goal of the present study was to explore whether VL neurons discharge
in a manner that is suitable to contribute to the additional modulation of the activity in
the motor cortex that occurs during locomotion over complex terrain. Do VL neurons
transmit to the motor cortex signals that are needed to control the landing positions of
feet during walking on a complex terrain? We found that the activity of VL neurons with
one PEF was modulated more strongly on the ladder than during simple locomotion. The
fast-conducting TCs and neurons with preferred phases in the first half of swing during
simple locomotion increased their activity during swing, while the slow-conducting TCs
and shoulder-related cells became more active during stance (Fig. 5.7). The
overwhelming majority of individual one-PEF and two-PEF neurons changed their
135
discharges upon transition from simple to complex locomotion. The dominant change,
similar to that in the motor cortex, was an increase in the depth and temporal precision
of the modulation (Fig. 5.9B and C). In contrast to simple walking, during complex
locomotion the depth of modulation in VL neurons was as high as in the motor cortex
efferent population of layer V: 9.6 ± 0.3% vs. 11 ± 0.8% (Sirota et al. 2005; P > 0.05, t-
test). The further increase in the similarity between VL and motor cortex discharges
during complex locomotion suggests that the VL may have a significant contribution to
the modulation of the motor cortex activity during this task.
The VL appears to be more than a simple relay for signals passing to the motor
cortex during complex locomotion. Many of the VL neurons discharged in different
phases of the cycle during simple and complex locomotion. This shows that the
information related to the complex environment changes the basic locomotion-related
discharge pattern of VL neurons. Five major modes of integration can be recognized.
The first two modes were represented in the activity of neurons of groups I and II,
respectively (Fig. 5.6A, B, F, and G; Fig. 5.8A, B, F, and G; Fig. 5.13). These were
adjustments of the modulation (with 1 PEF or 2 PEFs, respectively) with regard to
magnitude only. In the activity of group I and II neurons the simple locomotion-related
pattern was dominant, and the role of complex locomotion-related information was to
increase the activity level and the efficacy of the stride-related modulation. These modes
of integration could either occur in the cerebellum, with results transmitted to the VL, or
take place in the VL itself. Having large numbers of neurons whose activity patterns
retain their phase position within the step cycle might be beneficial for smooth
performance of complex movements such as locomotion in challenging environments.
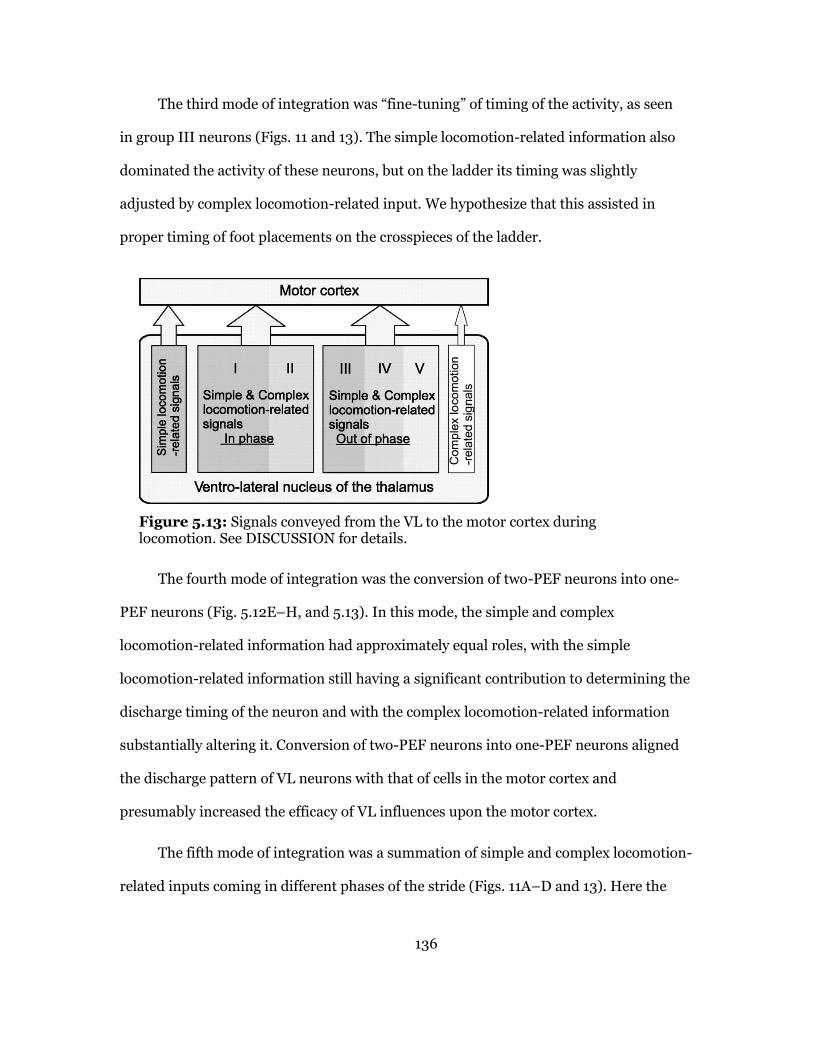
136
The third mode of integration was “fine-tuning” of timing of the activity, as seen
in group III neurons (Figs. 11 and 13). The simple locomotion-related information also
dominated the activity of these neurons, but on the ladder its timing was slightly
adjusted by complex locomotion-related input. We hypothesize that this assisted in
proper timing of foot placements on the crosspieces of the ladder.
Figure 5.13: Signals conveyed from the VL to the motor cortex during locomotion. See DISCUSSION for details.
The fourth mode of integration was the conversion of two-PEF neurons into one-
PEF neurons (Fig. 5.12E–H, and 5.13). In this mode, the simple and complex
locomotion-related information had approximately equal roles, with the simple
locomotion-related information still having a significant contribution to determining the
discharge timing of the neuron and with the complex locomotion-related information
substantially altering it. Conversion of two-PEF neurons into one-PEF neurons aligned
the discharge pattern of VL neurons with that of cells in the motor cortex and
presumably increased the efficacy of VL influences upon the motor cortex.
The fifth mode of integration was a summation of simple and complex locomotion-
related inputs coming in different phases of the stride (Figs. 11A–D and 13). Here the

137
simple and complex locomotion-related information also had approximately equal roles,
and the complex locomotion-based information simply supplemented the existing simple
locomotion-based pattern. This changed phasing of neuron activity, and we hypothesize
that it assisted in accurate timing of foot placements during complex locomotion.
Nature of Signals Conveyed by the VL during Complex Locomotion
What is the content of the complex locomotion-related information conveyed by
the VL to the motor cortex during complex locomotion? We have previously
demonstrated that the mechanics of simple locomotion on the flat surface and complex
locomotion along the horizontal ladder used in our studies are rather similar
(Beloozerova et al. 2010). The crosspieces of the ladder are positioned at comfortable
distances, and their tops are flat and wide enough to easily accommodate the foot. Under
these conditions, in the forelimbs, there are only slight differences in the wrist
movements and in the activity of some wrist-related muscles between simple and
complex locomotion. One could hypothesize, however, that largely similar movements of
simple and ladder locomotion still produce different proprioceptive afferentation, which
is then transmitted to the motor cortex via the VL. It was shown that the level of
fusimotor activity is often higher during difficult motor tasks, especially those that are
novel, strenuous, or associated with a high degree of uncertainty (Hulliger et al. 1989;
Prochazka et al. 1988). Our ladder locomotion task was well practiced, however, entirely
predictable, and, judging from levels of EMG activity (Beloozerova et al. 2010), not at all
strenuous. Thus it does not seem very likely that a potential difference in the
proprioceptive afferentation between simple and ladder locomotion can be responsible
for the entire volume and spectrum of discharge differences of VL neurons during these
two tasks.

138
In addition to moving the wrist slightly differently during simple and ladder
locomotion, on the ladder cats assume a more bent-forward posture by lowering the
center of mass and rotating the neck down. These differences in the activity of very
proximal as well as very distal limb muscles, albeit small, can be sensed by neurons in
the VL and conveyed to the motor cortex. Indeed, we found that during ladder
locomotion the neurons responsive to passive movements in the shoulder joint and/or
palpation of back, chest, or neck muscles reorganize its activity compared with simple
walking (Fig. 5.7A and D). It could then be expected that, similarly, the activity of the
wrist-related population will also reflect the difference in kinematics in this joint during
the two locomotion tasks. We did not see this, however. Although many individual wrist-
related neurons changed their activity between the tasks, as a group the activity of this
population was similar during simple and complex locomotion (Fig. 5.7C and F). This
can be explained by the too small difference in the kinematics between the tasks.
Alternatively, it can be suggested that the activity of some neurons in the VL is not
directly related to mechanics of the movements and somatosensation.
While differences in mechanics of locomotion between simple and ladder tasks are
on the small side, and the relationship of the activity of VL neurons to those differences
is inconsistent, cats move their eyes and look at the walking pathway in a very different
manner during simple and ladder locomotion (Beloozerova et al. 2010; Rivers et al.
2009). Cats only infrequently look at the surface of the pathway when it is flat, but they
intensively inspect the surface on every single run when walking along the ladder.
Moreover, on the ladder there is a correlation between timing of gaze shifts and stride
phase (Rivers et al. 2010). Similar data have been reported for humans walking on
stepping-stones (Hollands et al. 1995; Hollands and Marple-Horvat 2001). Considering
the rather similar limb motor patterns in the two locomotion tasks but dramatically

139
different gaze behaviors, we want to suggest that at least a part of the differences in
discharges of VL neurons during simple and ladder locomotion reflects differences in
processing of visual information during these two tasks, as well as the changes in motor
commands made on the basis of visual information. During locomotion in a complex
environment visual information about the position of the stepping target is first
processed through visual networks and then at some point is incorporated into the basic
locomotion rhythm in order to guide the limb. From this point on it becomes integrated
“visuo-motor” information that, in the afferent sense, is “[processed] visual
information,” while in the efferent sense it is a “limb control signal” reflecting
preparation of the movement. It has been suggested that visual information about the
environment is integrated with movement-related information in the cerebellum and
then funneled to the motor cortex via the VL for control of limb movements (Glickstein
2000; Glickstein and Gibson 1976; Stein and Glickstein 1992). Martin and Ghez (1985)
had found earlier that the onset of elbow movement-related activity in many motor
cortical neurons, although indeed well time related to the movement, is even better time
locked to the visual trigger stimulus. On the basis of anatomical evidence, the authors
suggested that the most likely pathway to convey such processed visual information to
the motor cortex is the VL.
Relative Contribution of Signals from VL and Associative Cortex to Motor Cortex Activity
during Visually Guided Locomotion
Two sources of signals that modify the stride-related modulation of neuronal
activity in the motor cortex during locomotion over a complex terrain can be suggested:
cortical and subcortical. While the VL appears to be well suited to supply the motor
cortex throughout the entire step cycle with synthesized vision-related information thus
140
determining the motor cortex's overall activity outline, direct projections from
associative cortical areas are likely to provide a more specific shaping.
Research in nonhuman primates has shown that neurons in the cortical area 6, the
premotor cortex, discharge in close relationship with reaching movements to visual
targets (see, e.g., Crammond and Kalaska 1994, Wise et al. 1992). Area 6 has substantial
inputs from parietal visual areas as well as direct cortico-cortical projections to the
motor cortex (Ghosh 1997; Jones et al. 1978; Marconi et al. 2001). So far only one study
has examined the activity of area 6 during treadmill locomotion (Criado et al. 1997). It
was found that 59% of neurons in area 6 change their discharge rate with the start of
locomotion, typically by increasing it. The discharge of only ∼30% of these cells,
however, is stride related during locomotion. In addition, nearly all step-related area 6
cells discharge predominantly during the stance phase of the stride. Thus, although area
6 neurons may influence the motor cortex and VL during stance, when it is believed that
planning of the next limb transfer takes place (Laurent and Thomson 1988; Hollands
and Marple-Horvat 1996), they cannot be responsible for the majority of swing and
transition phase-related activity in either the motor cortex or VL.
Regarding direct cortico-cortical projections from parietal area 5 to the motor
cortex, although they are numerous (see, e.g., Andujar and Drew 2007; Babb et al.
1984; Caria et al. 1997; Mori et al. 1989), at least those that come from layer III of area
5b carry rather low activity during both simple and complex locomotion, both in terms of
proportion of neurons involved (∼50%) as well as their average discharge rates (∼1
spikes/s; Beloozerova et al. 2011). The potential for the parietal area 5 to supply the
motor cortex with vision-based information during complex locomotion has been
considered in detail previously (Beloozerova and Sirota 2003). It was concluded that the

141
activity of this area is not well suited to directly determine the great majority of the
locomotion-related responses in the motor cortex. On the basis of data obtained in
experiments with cats overstepping a moving obstacle on the treadmill, a suggestion that
area 5 is most likely to exert its influence on locomotion mechanism via subcortical
motor centers such as basal ganglia or lateral cerebellum has been also made by Andujar
and colleagues (2010). The role of the sparse direct projection from area 5 to the motor
cortex during complex locomotion is yet to be determined.
Overall, available data suggest that subcortical routes that link visual and motor
cortex areas participate very importantly in transmission of vision-based signals that
modify stride-related modulation of neuronal activity in the motor cortex during
complex locomotion. The pathway that runs via the pons, cerebellum, and VL is the
largest of all subcortical links between visual and motor cortices. In this study we
investigated signals that are conveyed from the VL to the motor cortex during visually
guided locomotion. We suggest that they have significant contribution.
142
6. REFERENCES
Adkins, R. J., Cegnar, M. R., & Rafuse, D. D. (1971). Differential effects of lesions of the anterior and posterior sigmoid gyri in cats. Brain Research, 30(2), 411-414.
Alink, A., Schwiedrzik, C. M., Kohler, A., Singer, W., & Muckli, L. (2010). Stimulus predictability reduces responses in primary visual cortex. The Journal of Neuroscience, 30(8), 2960-2966.
Amos, A., Armstrong, D. M., & Marple-Horvat, D. E. (1990). Changes in the discharge patterns of motor cortical neurones associated with volitional changes in stepping in the cat. Neuroscience Letters, 109(1), 107-112.
Andujar, J. É., & Drew, T. (2007). Organization of the projections from the posterior parietal cortex to the rostral and caudal regions of the motor cortex of the cat. Journal of Comparative Neurology, 504(1), 17-41.
Andujar, J. É., Lajoie, K., & Drew, T. (2010). A contribution of area 5 of the posterior parietal cortex to the planning of visually guided locomotion: limb-specific and limb-independent effects. Journal of Neurophysiology, 103(2), 986-1006.
Angaut, P. (1979) The cerebello-thalamic projection in the cat. In: J. Massion & K. Sasaki, (eds). Cerebro-Cerebellar Interactions (pp. 19-43). Elsevier, North-Holland.
Armer, M. C., Nilaweera, W. U., Dasgupta, N. M., Rivers, T. J., Beloozerova, I. N. (2011). Walking in the light: Responses of motor cortical neurons. Program No. 802.04. Society for Neuroscience. Washington DC. Online.
Armer, M. C., Nilaweera, W. U., Rivers, T. J., Dasgupta, N. M., & Beloozerova, I. N. (2013). Effect of light on the activity of motor cortex neurons during locomotion. Behavioural Brain Research, 250, 238-250.
Armstrong, D. M., & Drew, T. (1984a). Discharges of pyramidal tract and other motor cortical neurons during locomotion in the cat. The Journal of Physiology, 346(1), 471-495.
Armstrong, D. M., & Drew, T. (1984b). Locomotor‐related neuronal discharges in cat motor cortex compared with peripheral receptive fields and evoked movements. The Journal of Physiology, 346(1), 497-517.
Armstrong, D. M., & Drew, T. (1984c). Topographical localization in the motor cortex of the cat for somatic afferent responses and evoked movements. The Journal of Physiology, 350(1), 33-54.
Armstrong, D. M., & Drew, T. (1985a). Forelimb electromyographic responses to motor cortex stimulation during locomotion in the cat. The Journal of Physiology, 367(1), 327-351.
Armstrong, D. M., & Drew, T. (1985b). Electromyographic responses evoked in muscles of the forelimb by intracortical stimulation in the cat. The Journal of Physiology, 367(1), 309-326.
Armstrong, D. M., & Edgley, S. A. (1984). Discharges of nucleus interpositus neurons during locomotion in the cat. The Journal of Physiology, 351(1), 411-432.
143
Armstrong, D. M., & Marple-Horvat, D. E. (1996). Role of the cerebellum and motor cortex in the regulation of visually controlled locomotion. Canadian Journal of Physiology and Pharmacology, 74(4), 443-455.
Arshavskii, I. I., Arshavsky, Y., Gelʹfand, I. M., & Orlovskiĭ, G. N. (1986).Cerebellum and Rhythmical Movements (Vol. 13). Berlin, Heidelberg. Springer-Verlag.
Arshavsky, Y. I., Orlovsky, G. N., & Perret, C. (1988). Activity of rubrospinal neurons during locomotion and scratching in the cat. Behavioural Brain Research, 28(1), 193-199.
Asanuma, C., Thach, W. T., & Jones, E. G. (1983). Cytoarchitectonic delineation of the ventral lateral thalamic region in the monkey. Brain Research Reviews, 5(3), 219-235.
Asanuma, H., & Hunsperger, R. W. (1975). Functional significance of projection from the cerebellar nuclei to the motor cortex in the cat. Brain Research, 98(1), 73-92.
Aumann, T. D., Rawson, J. A., Finkelstein, D. I., & Horne, M. K. (1994). Projections from the lateral and interposed cerebellar nuclei to the thalamus of the rat: a light and electron microscopic study using single and double anterograde labelling. Journal of Comparative Neurology, 349(2), 165-181.
Avendano, C., Rausell, E., & Reinoso-Suarez, F. (1985). Thalamic projections to areas 5a and 5b of the parietal cortex in the cat: a retrograde horseradish peroxidase study. The Journal of Neuroscience, 5(6), 1446-1470.
Avendano, C., Rausell, E., Perez‐Aguilar, D., & Isorna, S. (1988). Organization of the association cortical afferent connections of area 5: a retrograde tracer study in the cat. Journal of Comparative Neurology, 278(1), 1-33.
Babb, R. S., Waters, R. S., & Asanuma, H. (1984). Corticocortical connections to the motor cortex from the posterior parietal lobe (areas 5a, 5b, 7) in the cat demonstrated by the retrograde axonal transport of horseradish peroxidase. Experimental Brain Research, 54(3), 476-484.
Babinski, J. (1901). Définition de l'hystérie. Masson et Cie, Éditeurs Libraires De L'Académie De Médecine 120, Boulevard Saint-Germain (6e).
Bastian, A. J., Zackowski, K. M., & Thach, W. T. (2000). Cerebellar ataxia: torque deficiency or torque mismatch between joints? Journal of Neurophysiology, 83(5), 3019-3030.
Batshelet E. (1981) Circular statistics in biology. Academic Press, New York.
Bays, P. M., Flanagan, J. R., & Wolpert, D. M. (2006). Attenuation of self-generated tactile sensations is predictive, not postdictive. PLoS Biology,4(2), 281.
Beer, R. F., Dewald, J. P., & Rymer, W. Z. (2000). Deficits in the coordination of multijoint arm movements in patients with hemiparesis: evidence for disturbed control of limb dynamics. Experimental Brain Research, 131(3), 305-319.
Beloozerova, I. N., & Sirota, M. G. (1984). Activity of neurons of the motosensory cortex during natural locomotion in the cat [in Russian]. Neirofiziologiia=Neurophysiology, 17(3), 406-408.
144
Beloozerova, I. N., & Sirota, M. G. (1985a). [Activity of neurons of the motor-sensory cortex of the cat during natural walking on the rungs of a horizontal ladder]. Neirofiziologiia= Neurophysiology, 18(4), 543-545.
Beloozerova, I. N., & Sirota, M. G. (1985b). [Activity of neurons of the motor-sensory cortex of the cat during natural locomotion while stepping over obstacles]. Neirofiziologiia= Neurophysiology, 18(4), 546-549.
Beloozerova, I. N., & Sirota, M. G. (1988). The role of motor cortex in control of locomotion. In: Stance and Motion. Facts and Concepts. Eds.: Gurfincel, V.S., Ioffe, M.E., Massion, J., Roll, J.P., pp. 163-176. Plenum press, New York,.
Beloozerova, I. N., & Sirota, M. G. (1993a). The role of the motor cortex in the control of accuracy of locomotor movements in the cat. The Journal of Physiology, 461(1), 1-25.
Beloozerova, I. N., & Sirota, M. G. (1993b). The role of the motor cortex in the control of vigor of locomotor movements in the cat. The Journal of Physiology, 461(1), 27-46.
Beloozerova, I. N., & Sirota, M. G. (1998). Cortically controlled gait adjustments in the cat. Annals of the New York Academy of Sciences, 860(1), 550-553.
Beloozerova, I. N., & Sirota, M. G. (2002). Activity of ventrolateral thalamus (VL) during locomotion. Program No. 28: 62. Society for Neuroscience. Washington DC. Online.
Beloozerova, I. N., & Sirota, M. G. (2003). Integration of motor and visual information in the parietal area 5 during locomotion. Journal of Neurophysiology, 90(2), 961-971.
Beloozerova, I. N., Farrell, B. J., Sirota, M. G., & Prilutsky, B. I. (2010). Differences in movement mechanics, electromyographic, and motor cortex activity between accurate and nonaccurate stepping. Journal of Neurophysiology, 103(4), 2285-2300.
Beloozerova, I. N., Nilaweera, W. U., Viana di Prisco, G., Sirota, M. G., Marlinski, V. (2011). Sparse locomotion-related activity of cortico-cortical projection from parietal area 5 to motor cortex. Program No. 803.08. Society for Neuroscience. Washington DC. Online.
Beloozerova, I. N., Sirota, M. G., & Swadlow, H. A. (2003). Activity of different classes of neurons of the motor cortex during locomotion. The Journal of Neuroscience, 23(3), 1087-1097.
Beloozerova, I. N., Sirota, M. G., Orlovsky, G. N., & Deliagina, T. G. (2005). Activity of pyramidal tract neurons in the cat during postural corrections. Journal of Neurophysiology, 93(4), 1831-1844.
Beloozerova, I. N., Sirota, M. G., Orlovsky, G. N., & Deliagina, T. G. (2006). Comparison of activity of individual pyramidal tract neurons during balancing, locomotion, and scratching. Behavioral Brain Research, 169(1), 98-110.
Biewener, A. A. (2003). Animal locomotion. Oxford University Press, New York.
Bishop, P. O., Burke, W., & Davis, R. (1962). The identification of single units in central visual pathways. The Journal of Physiology, 162(3), 409-431.
Bishop, P. O., Jeremy, D., & Lance, J. W. (1953). Properties of pyramidal tract. Journal of Neurophysiology, 16(5), 537-550.
Bloedel, J. R. (1992). Functional heterogeneity with structural homogeneity: how does the cerebellum operate? Behavioral and Brain Sciences, 15(04), 666-678.

145
Brodal, P. (1979). The pontocerebellar projection in the rhesus monkey: an experimental study with retrograde axonal transport of horseradish peroxidase. Neuroscience, 4(2), 193-208.
Brookhart, J. M., & Morris, R. E. (1948). Antidromic potential recordings from the bulbar pyramid of the cat. Journal of Neurophysiology, 11(4), 387-398.
Brooks, D. J. (1995). The role of the basal ganglia in motor control: contributions from PET. Journal of the Neurological Sciences, 128(1), 1-13.
Brown, T. G. (1911). The intrinsic factors in the act of progression in the mammal. Proceedings of the Royal Society of London. Series B, 84(572), 308-319.
Bubic, A., Von Cramon, D. Y., & Schubotz, R. I. (2010). Prediction, cognition and the brain. Frontiers in Human Neuroscience, 4:25.
Buneo, C. A., & Andersen, R. A. (2006). The posterior parietal cortex: sensorimotor interface for the planning and online control of visually guided movements. Neuropsychologia, 44(13), 2594-2606.
Caria, M. A., Kaneko, T., Kimura, A., & Asanuma, H. (1997). Functional organization of the projection from area 2 to area 4γ in the cat. Journal of Neurophysiology, 77(6), 3107-3114.
Carlsson, K., Petrovic, P., Skare, S., Petersson, K. M., & Ingvar, M. (2000). Tickling expectations: neural processing in anticipation of a sensory stimulus. Journal of Cognitive Neuroscience, 12(4), 691-703.
Cerminara, N. L., Edge, A. L., Marple-Horvat, D. E., & Apps, R. (2005). The lateral cerebellum and visuomotor control. Progress in Brain Research, 148, 213-226.
Chambers, W. W., & Liu, C. N. (1957). Cortico‐spinal tract of the cat. An attempt to correlate the pattern of degeneration with deficits in reflex activity following neocortical lesions. Journal of Comparative Neurology, 108(1), 23-55.
Chambers, W. W., & Sprague, J. M. (1955a). Functional localization in the cerebellum. I. Organization in longitudinal cortico‐nuclear zones and their contribution to the control of posture, both extrapyramidal and pyramidal. Journal of Comparative Neurology, 103(1), 105-129.
Chambers, W. W., & Sprague, J. M. (1955b). Functional localization in the cerebellum. II. Somatotopic organization in cortex and nuclei. AMA Archives of Neurology & Psychiatry, 74(6), 653-680.
Chambers, W. W., Liu, C. N., McCouch, G. P., & d'Aquili, E. (1966). Descending tracts and spinal shock in the cat. Brain, 89(2), 377-390.
Changizi, M. A., Hsieh, A., Nijhawan, R., Kanai, R., & Shimojo, S. (2008). Perceiving the present and a systematization of illusions. Cognitive Science,32(3), 459-503.
Chapin, J. K., & Woodward, D. J. (1981). Modulation of sensory responsiveness of single somatosensory cortical cells during movement and arousal behaviors. Experimental Neurology, 72(1), 164-178.
Chapin, J. K., & Woodward, D. J. (1982a). Somatic sensory transmission to the cortex during movement: gating of single cell responses to touch. Experimental Neurology, 78(3), 654-669.

146
Chapin, J. K., & Woodward, D. J. (1982b). Somatic sensory transmission to the cortex during movement: phasic modulation over the locomotor step cycle. Experimental Neurology, 78(3), 670-684.
Chapman, C. E., Jiang, W., & Lamarre, Y. (1988). Modulation of lemniscal input during conditioned arm movements in the monkey. Experimental Brain Research, 72(2), 316-334.
Chrachri, A., & Clarac, F. (1990). Fictive locomotion in the fourth thoracic ganglion of the crayfish, Procambarus clarkii. The Journal of Neuroscience,10(3), 707-719.
Clascá, F., Llamas, A., & Reinoso-Suárez, F. (2000). Cortical connections of the insular and adjacent parieto-temporal fields in the cat. Cerebral Cortex,10(4), 371-399.
Coquery, J. M. (1978). Role of active movement in control of afferent input from skin in cat and man. In Active touch (pp. 161-169). Pergamon Press New York.
Coulter, J. D. (1974). Sensory transmission through lemniscal pathway during voluntary movement in the cat. Journal of Neurophysiology, 37(5), 831-845.
Courtine, G., Gerasimenko, Y., van den Brand, R., Yew, A., Musienko, P., Zhong, H., ... & Edgerton, V. R. (2009). Transformation of nonfunctional spinal circuits into functional states after the loss of brain input. Nature Neuroscience,12(10), 1333-1342.
Courtine, G., Roy, R. R., Raven, J., Hodgson, J., Mckay, H., Yang, H., … and Edgerton, V. R. (2005). Performance of locomotion and foot grasping following a unilateral thoracic corticospinal tract lesion in monkeys (Macaca mulatta).Brain, 128(10), 2338-2358.
Craig, A. D. (2008). Retrograde analyses of spinothalamic projections in the macaque monkey: input to the ventral lateral nucleus. Journal of Comparative Neurology, 508(2), 315-328.
Crammond, D. J., & Kalaska, J. F. (1994). Modulation of preparatory neuronal activity in dorsal premotor cortex due to stimulus-response compatibility. Journal of Neurophysiology, 71(3), 1281-1284.
Criado, J. M., Heredia, M., Riolobos, A. S., Yajeya, J., & de la Fuente, A. (1997). Electrophysiological study of prefrontal neurons of cats during a motor task. Pflügers Archiv, 434(1), 91-96.
den Ouden, H. E., Daunizeau, J., Roiser, J., Friston, K. J., & Stephan, K. E. (2010). Striatal prediction error modulates cortical coupling. The Journal of Neuroscience, 30(9), 3210-3219.
Diamond, M. E. (1989). Organization of somatic sensory cortex: the detection of discrete topographic units and evidence for their integrative function. PhD dissertation, University of North Carolina at Chapel Hill.
Dickinson, M. H., Farley, C. T., Full, R. J., Koehl, M. A. R., Kram, R., & Lehman, S. (2000). How animals move: an integrative view. Science, 288(5463), 100-106.
Divac, I., LaVail, J. H., Rakic, P., & Winston, K. R. (1977). Heterogeneous afferents to the inferior parietal lobule of the rhesus monkey revealed by the retrograde transport method. Brain Research, 123(2), 197-207.

147
Drew, P. J., & Abbott, L. F. (2006). Extending the effects of spike-timing-dependent plasticity to behavioral timescales. Proceedings of the National Academy of Sciences, 103(23), 8876-8881.
Drew, T., & Doucet, S. (1991). Application of circular statistics to the study of neuronal discharge during locomotion. Journal of Neuroscience Methods,38(2), 171-181.
Drew, T., & Marigold, D. S. (2015). Taking the next step: cortical contributions to the control of locomotion. Current Opinion in Neurobiology,33, 25-33.
Drew, T., (1988). Motor cortical cell discharge during voluntary gait modification. Brain research, 457(1), 181-187.
Drew, T., (1993). Motor cortical activity during voluntary gait modifications in the cat. I. Cells related to the forelimbs. Journal of Neurophysiology, 70(1):179-99.
Drew, T., Jiang, W., & Widajewicz, W. (2002). Contributions of the motor cortex to the control of the hindlimbs during locomotion in the cat. Brain Research Reviews, 40(1), 178-191.
Drew, T., Jiang, W., Kably, B., & Lavoie, S. (1996). Role of the motor cortex in the control of visually triggered gait modifications. Canadian Journal of Physiology and pharmacology, 74(4), 426-442.
Dubuc, R., Brocard, F., Antri, M., Fénelon, K., Gariépy, J. F., Smetana, R., ... & Veilleux, D. (2008). Initiation of locomotion in lampreys. Brain Research Reviews, 57(1), 172-182.
Duysens, J., & Van de Crommert, H. W. (1998). Neural control of locomotion; Part 1: The central pattern generator from cats to humans. Gait and Posture, 7(2), 131-141.
Dykes, R. W., Rasmusson, D. D., & Hoeltzell, P. B. (1980). Organization of primary somatosensory cortex in the cat. Journal of Neurophysiology, 43(6), 1527-1546.
Efron, B., Tibshirani, R.J. (1993). An introduction to the bootstrap. Chapman & Hall, New York.
Eidelberg, E., & Yu, J. (1981). Effects of corticospinal lesions upon treadmill locomotion by cats. Experimental Brain Research, 43(1), 101-103.
Eidelberg, E., Walden, J. G., & Nguyen, L. H. (1981). Locomotor control in macaque monkeys. Brain, 104(4), 647-663.
Evarts, E. V. (1971). Activity of thalamic and cortical neurons in relation to learned movement in the monkey. International Journal of Neurology, 8(2), 321-326.
Evrard, H. C., & Craig, A. D. (2008). Retrograde analysis of the cerebellar projections to the posteroventral part of the ventral lateral thalamic nucleus in the macaque monkey. Journal of Comparative Neurology, 508(2), 286-314.
Fabre-Thorpe, M., & Levesque, F. (1991). Visuomotor relearning after brain damage crucially depends on the integrity of the ventrolateral thalamic nucleus. Behavioral Neuroscience, 105(1), 176.
Fang, P. C., Stepniewska, I., & Kaas, J. H. (2006). The thalamic connections of motor, premotor, and prefrontal areas of cortex in a prosimian primate (Otolemur garnetti). Neuroscience, 143(4), 987-1020.
148
Favorov, O. V., Nilaweera, W. U., Miasnikov, A. A., & Beloozerova, I. N. (2010). Profound activity of somatosensory responsive neurons in high subdivisions of SI cortex during simple locomotion. Society for Neuroscience, 178.15
Favorov, O. V., Nilaweera, W. U., Miasnikov, A. A., & Beloozerova, I. N. (2015). Activity of somatosensory-responsive neurons in high subdivisions of SI cortex during locomotion. The Journal of Neuroscience, 35(20), 7763-7776.
Fee, M. S., Mitra, P. P., & Kleinfeld, D. (1997). Central versus peripheral determinants of patterned spike activity in rat vibrissa cortex during whisking. Journal of Neurophysiology, 78(2), 1144-1149.
Felleman, D. J., & Van Essen, D. C. (1991). Distributed hierarchical processing in the primate cerebral cortex. Cerebral Cortex, 1(1), 1-47.
Fisher, N. I., (1993). Statistical analysis of circular data. Cambridge University Press. Cambridge, MA.
Fitzsimmons, N. A., Lebedev, M. A., Peikon, I. D., & Nicolelis, M. A. (2009). Extracting kinematic parameters for monkey bipedal walking from cortical neuronal ensemble activity. Frontiers in Integrative Neuroscience, 3,3.
Forssberg, H., Grillner, S., & Halbertsma, J. (1980a). The locomotion of the low spinal cat I. Coordination within a hindlimb. Acta Physiologica Scandinavica, 108(3), 269-281.
Forssberg, H., Grillner, S., Halbertsma, J., & Rossignol, S. (1980b). The locomotion of the low spinal cat. II. Interlimb coordination. Acta Physiologica Scandinavica, 108(3), 283-295.
Friel, K. M., Drew, T., & Martin, J. H. (2007). Differential activity-dependent development of corticospinal control of movement and final limb position during visually guided locomotion. Journal of Neurophysiology, 97(5), 3396-3406.
Fromm, C., & Evarts, E. V. (1982). Pyramidal tract neurons in somatosensory cortex: central and peripheral inputs during voluntary movement. Brain Research, 238(1), 186-191.
Fuller, J. H., & Schlag, J. D. (1976). Determination of antidromic excitation by the collision test: problems of interpretation. Brain Research, 112(2), 283-298.
Fulton, J. F., & Dow, R. S. (1937). The cerebellum: a summary of functional localization. The Yale Journal of Biology and Medicine, 10(1), 89.
Garcia-Rill, E., & Dubrovsky, B. (1971). Organization of visual input in cat motor-sensory cortex. Experimental Neurology, 33(3), 597-606.
Garcia-Rill, E., & Dubrovsky, B. (1974). Responses of motor cortex cells to visual stimuli. Brain Research, 82(2), 185-194.
Gardner, E. P., Ro, J. Y., Babu, K. S., & Ghosh, S. (2007). Neurophysiology of prehension. II. Response diversity in primary somatosensory (SI) and motor (MI) cortices. Journal of Neurophysiology, 97(2), 1656-1670.
Garraghty, P. E., Florence, S. L., & Kaas, J. H. (1990). Ablations of areas 3a and 3b of monkey somatosensory cortex abolish cutaneous responsivity in area 1. Brain Research, 528(1), 165-169.

149
Garraghty, P. E., Pons, T. P., & Kaas, J. H. (1990). Ablations of areas 3b (SI proper) and 3a of somatosensory cortex in marmosets deactivate the second and parietal ventral somatosensory areas. Somatosensory and Motor Research,7(2), 125-135.
Georgopoulos, A. P., Kalaska, J. F., Caminiti, R., & Massey, J. T. (1982). On the relations between the direction of two-dimensional arm movements and cell discharge in primate motor cortex. The Journal of Neuroscience, 2(11), 1527-1537.
Ghez, C., & Pisa, M. (1972). Inhibition of afferent transmission in cuneate nucleus during voluntary movement in the cat. Brain Research, 40(1), 145-151.
Ghosh, S. (1997). Cytoarchitecture of sensorimotor areas in the cat cerebral cortex. Journal of Comparative Neurology, 388(3), 354-370.
Ghosh, S. (1997a). Identification of motor areas of the cat cerebral cortex based on studies of cortical stimulation and corticospinal connections. Journal of Comparative Neurology, 380(2), 191-214.
Ghosh, S. (1997b). Comparison of the cortical connections of areas 4γ and 4δ in the cat cerebral cortex. Journal of Comparative Neurology, 388(3), 371-396.
Gibson, A. R., Hansma, D. I., Houk, J. C., & Robinson, F. R. (1984). A sensitive low artifact TMB procedure for the demonstration of WGA-HRP in the CNS. Brain Research, 298(2), 235-241.
Glickstein, M. (2000). How are visual areas of the brain connected to motor areas for the sensory guidance of movement? Trends in Neurosciences, 23(12), 613-617.
Glickstein, M., & Gibson, A. R. (1976). Visual cells in the pons of the brain. Scientific American, 235(5), 90.
Glickstein, M., Buchbinder, S., & Iii, J. L. M. (1998). Visual control of the arm, the wrist and the fingers: Pathways through the brain. Neuropsychologia, 36(10), 981-1001.
Glickstein, M., Gerrits, N., Kralj‐Hans, I., Mercier, B., Stein, J., & Voogd, J. (1994). Visual pontocerebellar projections in the macaque. Journal of Comparative Neurology, 349(1), 51-72.
Grillner, S. (1973). Locomotion in the spinal cat. In Control of Posture and Locomotion (pp. 515-535). Springer US.
Grillner, S. (1975). Locomotion in vertebrates: central mechanisms and reflex interaction. Physiol Rev, 55(2), 247-304.
Grillner, S. (2011). Control of locomotion in bipeds, tetrapods, and fish.Comprehensive Physiology.
Grillner, S., & Rossignol, S. (1978). On the initiation of the swing phase of locomotion in chronic spinal cats. Brain Research, 146(2), 269-277.
Grillner, S., & Zangger, P. (1979). On the central generation of locomotion in the low spinal cat. Experimental Brain Research, 34(2), 241-261.
Grillner, S., & Zangger, P. (1984). The effect of dorsal root transection on the efferent motor pattern in the cat's hindlimb during locomotion. Acta Physiologica Scandinavica, 120(3), 393-405.

150
Grofova, I., & Rinvik, E. (1974). Cortical and pallidal projections to the nucleus ventralis lateralis thalami. Anatomy and Embryology, 146(2), 113-132.
Guenther, E., & Zrenner, E. (1993). The spectral sensitivity of dark-and light-adapted cat retinal ganglion cells. The Journal of Neuroscience, 13(4), 1543-1550.
Hassler, R., & Muhs-Clement, K. (1964). Architektonischer Aufbau des sensomotorischen und parietalen Cortex der Katze. J. Hirnforsch, 6, 377-420.
Hendry, S. H. C., Jones, E. G., & Graham, J. (1979). Thalamic relay nuclei for cerebellar and certain related fiber systems in the cat. Journal of Comparative Neurology, 185(4), 679-713.
Hildebrand, M. (1965). Symmetrical gaits of horses. Science, 150(3697), 701-708.
Hollands, M. A., & Marple-Horvat, D. E. (1996). Visually guided stepping under conditions of step cycle-related denial of visual information. Experimental Brain Research, 109(2), 343-356.
Hollands, M. A., & Marple-Horvat, D. E. (2001). Coordination of eye and leg movements during visually guided stepping. Journal of Motor Behavior, 33(2), 205-216.
Hollands, M. A., Marple-Horvat, D. E., Henkes, S., & Rowan, A. K. (1995). Human eye movements during visually guided stepping. Journal of Motor Behavior, 27(2), 155-163.
Holmes, G. (1917). The symptoms of acute cerebellar injuries due to gunshot injuries. Brain, 40(4), 461-535.
Holmes, G. (1939). The cerebellum of man. Brain, 62(1), 1-30.
Hulliger, M., Dürmüller, N., Prochazka, A., & Trend, P. (1989). Flexible fusimotor control of muscle spindle feedback during a variety of natural movements. Progress in Brain Research, 80, 87-101.
Hultborn, H. (2006). Spinal reflexes, mechanisms and concepts: from Eccles to Lundberg and beyond. Progress in Neurobiology, 78(3), 215-232.
Hultborn, H., & Nielsen, J. B. (2007). Spinal control of locomotion–from cat to man. Acta Physiologica, 189(2), 111-121.
Hyvarinen, J. (1982). Parietal cortex of monkey and man. Studies of brain function. V.8, Springer-Verlag, Berlin, Heidelberg, New York.
Ilinsky, I. A., & Kultas-Ilinsky, K. (1984). An autoradiographic study of topographical relationships between pallidal and cerebellar projections to the cat thalamus. Experimental Brain Research, 54(1), 95-106.
Ito, S. I., Craig, A. D. (2003). Vagal input to lateral area 3a in cat cortex. Journal of Neurophysiology, 90(1), 143-154.
Iwamura, Y. (1998). Hierarchical somatosensory processing. Current Opinion in Neurobiology, 8(4), 522-528.
Iwamura, Y., Tanaka, M., Sakamoto, M., & Hikosaka, O. (1993). Rostrocaudal gradients in the neuronal receptive field complexity in the finger region of the alert monkey's postcentral gyrus. Experimental Brain Research,92(3), 360-368.

151
Jiang, W., Chapman, C. E., & Lamarre, Y. (1991). Modulation of the cutaneous responsiveness of neurones in the primary somatosensory cortex during conditioned arm movements in the monkey. Experimental Brain Research, 84(2), 342-354.
Jones, E. G., Coulter, J. D., & Hendry, S. H. C. (1978). Intracortical connectivity of architectonic fields in the somatic sensory, motor and parietal cortex of monkeys. Journal of Comparative Neurology, 181(2), 291-347.
Kaas, J. H., & Pons, T. P. (1988). The somatosensory system of primates. In Steklis H. P., (Ed.) Comparative Primate Biology. 4. Neurosciences. Alan R. Liss Inc. New York. pp 421-468.
Kaas, J. H., (1990). The somatosensory system. In Praxinos (Ed.) The Human Nervous System. Academic Press, New York. pp 813-844.
Kaas, J. H., (1993). The functional organization of somatosensory cortex in primates. Annals of Anatomy. 175(6), 509-518.
Kaas, J. H., Nelson, R. J., Sur, M., Dykes, R. W., & Merzenich, M. M. (1984). The somatotopic organization of the ventroposterior thalamus of the squirrel monkey, Saimiri sciureus. Journal of Comparative Neurology, 226(1), 111-140.
Kakei, S., & Shinoda, Y. (1990). Parietal projection of thalamocortical fibers from the ventroanterior-ventrolateral complex of the cat thalamus. Neuroscience Letters, 117(3), 280-284.
Kalaska, J. F. (1996). Parietal cortex area 5 and visuomotor behavior. Canadian Journal of Physiology and pharmacology, 74(4), 483-498.
Kalaska, J. F. (2009). From intention to action: motor cortex and the control of reaching movements. In Progress in Motor Control (pp. 139-178). Springer US.
Kleinfeld, D., & Deschênes, M. (2011). Neuronal basis for object location in the vibrissa scanning sensorimotor system. Neuron, 72(3), 455-468.
Klishko, A. N., Farrell, B. J., Beloozerova, I. N., Latash, M. L., & Prilutsky, B. I. (2014). Stabilization of cat paw trajectory during locomotion. Journal of Neurophysiology, 112(6), 1376-1391.
Koch, K. W., & Fuster, J. M. (1989). Unit activity in monkey parietal cortex related to haptic perception and temporary memory. Experimental Brain Research, 76(2), 292-306.
Kotchabhakdi, N., & Walberg, F. (1978). Cerebellar afferent projections from the vestibular nuclei in the cat: an experimental study with the method of retrograde axonal transport of horseradish peroxidase. Experimental Brain Research, 31(4), 591-604.
Kurata, K. (2005). Activity properties and location of neurons in the motor thalamus that project to the cortical motor areas in monkeys. Journal of Neurophysiology, 94(1), 550-566.
Kurtzer, I., Herter, T. M., & Scott, S. H. (2005). Random change in cortical load representation suggests distinct control of posture and movement. Nature Neuroscience, 8(4), 498-504.
Kuypers, H. G. J. M. (1964). The descending pathways to the spinal cord, their anatomy and function. Progress in Brain Research, 11, 178-202.
152
Lajoie, K., & Drew, T. (2007). Lesions of area 5 of the posterior parietal cortex in the cat produce errors in the accuracy of paw placement during visually guided locomotion. Journal of Neurophysiology, 97(3), 2339-2354.
Lajoie, K., Andujar, J. É., Pearson, K., & Drew, T. (2010). Neurons in area 5 of the posterior parietal cortex in the cat contribute to interlimb coordination during visually guided locomotion: a role in working memory. Journal of Neurophysiology, 103(4), 2234-2254.
Larsen, K. D., & Asanuma, H. (1979). Thalamic projections to the feline motor cortex studied with horseradish peroxidase. Brain Research, 172(2), 209-215.
Larsen, K. D., & McBride, R. L. (1979). The organization of feline entopeduncular nucleus projections: anatomical studies. Journal of Comparative Neurology, 184(2), 293-308.
Laurent, M., & Thomson, J. A. (1988). The role of visual information in control of a constrained locomotor task. Journal of Motor Behavior, 20(1), 17-37.
Lebedev, M. A., Denton, J. M., & Nelson, R. J. (1994). Vibration-entrained and premovement activity in monkey primary somatosensory cortex. Journal of Neurophysiology, 72(4), 1654-1673.
Leclerc, S. S., Avendano, C., Dykes, R. W., Waters, R. S., & Salimi, I. (1994). Reevaluation of area 3b in the cat based on architectonic and electrophysiological studies: regional variability with functional and anatomical consistencies. Journal of Comparative Neurology, 341(3), 357-374.
Liddell, E. G. T., & Phillips, C. G. (1944). Pyramidal section in the cat. Brain, 67(1), 1-9.
London, B. M., & Miller, L. E. (2013). Responses of somatosensory area 2 neurons to actively and passively generated limb movements. Journal of Neurophysiology, 109(6), 1505-1513.
Lundberg, A., & Oscarsson, O. (1962). Functional Organization of the Ventral Spino‐Cerebellar Tract in the Cat. IV. Identification of Units by Antidromic Activation from the Cerebellar Cortex. Acta Physiologica Scandinavica, 54(3‐4), 252-269.
Mackel, R., Iriki, A., & Brink, E. E. (1992). Spinal input to thalamic VL neurons: evidence for direct spinothalamic effects. Journal of Neurophysiology, 67(1), 132-144.
Marconi, B., Genovesio, A., Battaglia-Mayer, A., Ferraina, S., ... & Caminiti, R. (2001). Eye–hand coordination during reaching. I. Anatomical relationships between parietal and frontal cortex.Cerebral Cortex, 11(6), 513-527.
Marigold, D. S., & Drew, T. (2011). Contribution of cells in the posterior parietal cortex to the planning of visually guided locomotion in the cat: effects of temporary visual interruption. Journal of Neurophysiology, 105(5), 2457-2470.
Marigold, D. S., & Patla, A. E. (2008). Visual information from the lower visual field is important for walking across multi-surface terrain. Experimental Brain Research, 188(1), 23-31.
Marigold, D. S., Andujar, J. E, Lajoie, K. Drew, T. (2011). Motor planning of locomotor adaptations on the basis of vision: the role of the posterior parietal cortex. Progress in Brain Research, 188, 83-100.

153
Marlinski, V., Nilaweera, W. U., Zelenin, P. V., Sirota, M. G., & Beloozerova, I. N. (2012). Signals from the ventrolateral thalamus to the motor cortex during locomotion. Journal of Neurophysiology, 107(1), 455-472.
Marple‐Horvat, D. E., & Criado, J. M. (1999). Rhythmic neuronal activity in the lateral cerebellum of the cat during visually guided stepping. The Journal of Physiology, 518(2), 595-603.
Marple-Horvat, D. E., Amos, A. J., Armstrong, D. M., & Criado, J. M. (1993). Changes in the discharge patterns of cat motor cortex neurones during unexpected perturbations of on-going locomotion. The Journal of Physiology,462, 87.
Martin, J. H., & Ghez, C. (1985). Task-related coding of stimulus and response in cat motor cortex. Experimental Brain Research, 57(3), 427-442.
Martin, J. H., & Ghez, C. (1993). Differential impairments in reaching and grasping produced by local inactivation within the forelimb representation of the motor cortex in the cat. Experimental Brain Research, 94(3), 429-443.
Martin, J. H., Friel, K. M., Salimi, I., & Chakrabarty, S. (2007). Activity-and use-dependent plasticity of the developing corticospinal system. Neuroscience and Biobehavioral Reviews, 31(8), 1125-1135.
Matsushita, M., & Ikeda, M. (1970). Olivary projections to the cerebellar nuclei in the cat. Experimental Brain Research, 10(5), 488-500.
Mayer, N. H. (1997). Clinicophysiologic concepts of spasticity and motor dysfunction in adults with an upper motoneuron lesion. Muscle and Nerve, 20(S6), 1-14.
Mayer, N. H., Esquenazi, A., & Childers, M. K. (1997). Common patterns of clinical motor dysfunction. Muscle & Nerve, 20(S6), 21-35.
McCrea, D. A., & Rybak, I. A. (2008). Organization of mammalian locomotor rhythm and pattern generation. Brain Research Reviews, 57(1), 134-146.
McKenna, T. M., Whitsel, B. L., Dreyer, D. A., & Metz, C. B. (1981). Organization of cat anterior parietal cortex: relations among cytoarchitecture, single neuron functional properties, and interhemispheric connectivity. Journal of Neurophysiology, 45(4), 667-697.
Mesulam, M. M. (1982). Principles of horseradish peroxidase neurohistochemistry and their applications for tracing neural pathways-axonal transport, enzyme histochemistry and light microscopic analysis. In tracing neural connections with horseradish peroxidase (pp. 1-151). Wiley New York.
Metz, G. A., & Whishaw, I. Q. (2002). Cortical and subcortical lesions impair skilled walking in the ladder rung walking test: a new task to evaluate fore-and hindlimb stepping, placing, and co-ordination. Journal of Neuroscience Methods, 115(2), 169-179.
Mihaltchev, P., Archambault, P. S., Feldman, A. G., & Levin, M. F. (2005). Control of double-joint arm posture in adults with unilateral brain damage. Experimental Brain Research, 163(4), 468-486.
Miles, Ö. B., Cerminara, N. L., & Marple‐Horvat, D. E. (2006). Purkinje cells in the lateral cerebellum of the cat encode visual events and target motion during visually guided reaching. The Journal of Physiology, 571(3), 619-637.
154
Miller, S., & Van der Meche, F. G. A. (1976). Coordinated stepping of all four limbs in the high spinal cat. Brain Research, 109(2), 395-398.
Mori, A., Waters, R. S., & Asanuma, H. (1989). Physiological properties and patterns of projection in the cortico-cortical connections from the second somatosensory cortex to the motor cortex, area 4γ, in the cat. Brain Research, 504(2), 206-210.
Mountcastle, V. B. (1995). The parietal system and some higher brain functions. Cerebral Cortex, 5(5), 377-390.
Murray, S. O., Schrater, P., & Kersten, D. (2004). Perceptual grouping and the interactions between visual cortical areas. Neural Networks, 17(5), 695-705.
Mushiake, H., Inase, M., & Tanji, J. (1991). Neuronal activity in the primate premotor, supplementary, and precentral motor cortex during visually guided and internally determined sequential movements. Journal of Neurophysiology, 66(3), 705-718.
Na, J., Kakei, S., & Shinoda, Y. (1997). Cerebellar input to corticothalamic neurons in layers V and VI in the motor cortex. Neuroscience Research, 28(1), 77-91.
Nakano, K., Kohno, M., Hasegawa, Y., & Tokushige, A. (1985). Cortical and brain stem afferents to the ventral thalamic nuclei of the cat demonstrated by retrograde axonal transport of horseradish peroxidase. Journal of Comparative Neurology, 231(1), 102-120.
Nakano, K., Takimoto, T., Kayahara, T., Takeuchi, Y., & Kobayashi, Y. (1980). Distribution of cerebellothalamic neurons projecting to the ventral nuclei of the thalamus: an HRP study in the cat. Journal of Comparative Neurology, 194(2), 427-439.
Neafsey, E. J., Hull, C. D., & Buchwald, N. A. (1978). Preparation for movement in the cat. II. Unit activity in the basal ganglia and thalamus. Electroencephalography and Clinical Neurophysiology, 44(6), 714-723.
Nelson, R. J. (1987). Activity of monkey primary somatosensory cortical neurons changes prior to active movement. Brain Research, 406(1), 402-407.
Nieoullon, A., & Rispal-Padel, L. (1976). Somatotopic localization in cat motor cortex. Brain Research, 105(3), 405-422.
Niimi, K., Matsuoka, H., Yamazaki, Y., & Katayama, T. (1983). Thalamic afferents to the anterior and middle suprasylvian gyri in the cat traced with horseradish peroxidase. Journal fur Hirnforschung, 24(2), 173-187.
Nilaweera, W. U., Beloozerova, I. N. (2009). Neurons of lateral nucleus of cerebellum change their step-related frequency modulation when visual control of stepping is required. Program No. 35: 367. Society for Neuroscience. Washington DC. Online.
Olson, C. R., & Lawler, K. (1987). Cortical and subcortical afferent connections of a posterior division of feline area 7 (area 7p). Journal of Comparative Neurology, 259(1), 13-30.
Orlovskiĭ, G. N. (1970). Cerebellar influence on the reticulo-spinal neurons during locomotion. [In Russian]. Biofizika, 15(5), 894-901.
Orlovskiĭ, G. N. (1972). Activity of cerebellar nuclei neurons during locomotion. [In Russian]. Biofizika, 17(6), 1119-1126.

155
Orlovskiĭ, G. N., Deliagina, T. G., & Grillner, S. (1999). Neuronal control of locomotion: from mollusc to man. Oxford University Press.
Orlovsky, G. N. (1972a). Activity of vestibulospinal neurons during locomotion. Brain Research, 46, 85-98.
Orlovsky, G. N. (1972b). Activity of rubrospinal neurons during locomotion. Brain Research, 46, 99-112.
Orlovsky, G. N. (1972b). Activity of vestibulospinal neurons during locomotion. Brain Research, 46, 85-98.
Oscarsson, O. (1965). Functional organization of the spino- and cuneocerebellar tracts. Physiological Reviews, 45(3), 495-522.
Pearson, K. G. (1993). Common principles of motor control in vertebrates and invertebrates. Annual Review of Neuroscience, 16(1), 265-297.
Phillips, C. G., & Porter, R. (1977). Corticospinal neurons. Their role in movement. Monographs of the Physiological Society, (34), v-xii, 1-450.
Pons, T. P., & Kaas, J. H. (1985). Connections of area 2 of somatosensory cortex with the anterior pulvinar and subdivisions of the ventroposterior complex in macaque monkeys. Journal of Comparative Neurology, 240(1), 16-36.
Pons, T. P., Garraghty, P. E., Cusick, C. G., & Kaas, J. H. (1985). A sequential representation of the occiput, arm, forearm and hand across the rostrocaudal dimension of areas 1, 2 and 5 in macaque monkeys. Brain Research, 335(2), 350-353.
Porter, R., & Lemon, R. (1993). Corticospinal function and voluntary movement (No. 45). Oxford University Press, USA.
Prilutsky, B. I., Sirota, M. G., Gregor, R. J., & Beloozerova, I. N. (2005). Quantification of motor cortex activity and full-body biomechanics during unconstrained locomotion. Journal of Neurophysiology, 94(4), 2959-2969.
Prochazka, A., Hulliger, M., Trend, P., & Dürmüller, N. (1988). Dynamic and static fusimotor set in various behavioural contexts. In Mechanoreceptors: Development, Structure and Function, (pp. 417-430). New York: Plenum.
Pryor, K. (1975). Lads before the wind: Adventures in porpoise training. HarperCollins Publishers, New York.
Rao, R. P., & Ballard, D. H. (1999). Predictive coding in the visual cortex: a functional interpretation of some extra-classical receptive-field effects. Nature Neuroscience, 2(1), 79-87.
Reinoso-Suárez, F., & Kornmüller, A. E. (1961). Topographischer Hirnatlas der Katze: für experimental-physiologische Untersuchungen. Darmstadt: Von E. Merck AG.
Reitboeck, H. J. (1983). Fiber microelectrodes for electrophysiological recordings. Journal of Neuroscience Methods, 8(3), 249-262.
Renshaw, B. (1940). Activity in the simplest spinal reflex pathways. Journal of Neurophysiology, 3(5), 373-387.

156
Rinvik, E. (1968). The corticothalamic projection from the pericruciate and coronal gyri in the cat. An experimental study with silver-impregnation methods. Brain Research, 10(2), 79-119.
Rispal-Padel, L., & Grangetto, A. (1977). The cerebello-thalamo-cortical pathway. Topographical investigation at the unitary level in the cat. Experimental Brain Research, 28(1-2), 101-123.
Rivers, T. J., Shah, N. A., Sirota, M. G., Beloozerova, I. N. (2010). The relationship between vertical gaze shifts and stride cycle in freely walking cats. Program No. 36: 278.3. Society for Neuroscience. Washington DC. Online.
Rivers, T. J., Sirota, M. G., Guttentag, A. I., Ogorodnikov, D. A., Beloozerova, I. N. (2009). Gaze behaviors of freely walking cats. Program No. 35. 454.14. Society for Neuroscience. Washington DC. Online.
Rivers, T. J., Sirota, M. G., Guttentag, A. I., Ogorodnikov, D. A., Shah, N. A., & Beloozerova, I. N. (2014). Gaze shifts and fixations dominate gaze behavior of walking cats. Neuroscience, 275, 477-499.
Robertson, R. T. (1977). Thalamic projections to parietal cortex. Brain, Behavior and Evolution, 14(3), 161-184.
Robertson, R. T., & Cunningham, T. J. (1981). Organization of corticothalamic projections from parietal cortex in cat. Journal of Comparative Neurology, 199(4), 569-585.
Sakai, S. T., Inase, M., & Tanji, J. (1996). Comparison of cerebellothalamic and pallidothalamic projections in the monkey (Macaca fuscata): a double anterograde labeling study. Journal of Comparative Neurology, 368(2), 215-228.
Schmied, A., Benita, M., Conde, H., & Dorment, J. F. (1979). Activity of ventrolateral thalamic neurons in relation to a simple reaction time task in the cat. Experimental Brain Research, 36(2), 285-300.
Scott, S. H. (2008). Inconvenient truths about neural processing in primary motor cortex. The Journal of Physiology, 586(5), 1217-1224.
Seki, K., & Fetz, E. E. (2012). Gating of sensory input at spinal and cortical levels during preparation and execution of voluntary movement. The Journal of Neuroscience, 32(3), 890-902.
Selemon, L. D., & Goldman-Rakic, P. S. (1988). Common cortical and subcortical targets of the dorsolateral prefrontal and posterior parietal cortices in the rhesus monkey: evidence for a distributed neural network subserving spatially guided behavior. The Journal of Neuroscience, 8(11), 4049-4068.
Sherk, H., Fowler, G. A. (2001). Neural analysis of visual information during locomotion. Progress in Brain Research, 134, 247-264.
Sherman, S. M., & Guillery, R. W. (2001). Exploring the Thalamus (Vol. 312). San Diego: Academic Press.
Sherrington, C. S. (1906). The Integrative Action of the Nervous System. Yale University Press. New Haven, CT
Sherrington, C. S. (1910a) Remarks on the reflex mechanism of the step. Brain, 33, 1-28.

157
Sherrington, C. S. (1910b). Flexor‐reflex of the limb, crossed extension‐reflex, and reflex stepping and standing. The Journal of Physiology, 40(1-2), 28-121.
Sherrington, C. S., & Laslett, E. E. (1903). Observations on some spinal reflexes and the interconnection of spinal segments. The Journal of Physiology,29(1), 58-96.
Shik, M. L., & Orlovsky, G. N. (1976). Neurophysiology of locomotor automatism. Physiol Rev, 56(3), 465-501.
Shik, M. L., Severin, F. V., & Orlovsky, G.N. (1966). Control of walking and running by means of electrical stimulation of mid-brain. Biophysics-USSR, 11(4), 756.
Shin, H. C., Park, H. J., & Chapin, J. K. (1993). Differential phasic modulation of short and long latency afferent sensory transmission to single neurons in the ventroposterolateral thalamus in behaving rats. Neuroscience Research, 17(2), 117-125.
Shin, H. C., Park, H. J., & Chapin, J. K. (1994). Differential phasic modulation of short and long latency afferent sensory transmission to single neurons in the primary somatosensory cortex in behaving rats. Neuroscience Research, 19(4), 419-425.
Sirota, M. G., Di Prisco, G. V., & Dubuc, R. (2000). Stimulation of the mesencephalic locomotor region elicits controlled swimming in semi‐intact lampreys. European Journal of Neuroscience, 12(11), 4081-4092.
Sirota, M. G., Swadlow, H. A., & Beloozerova, I. N. (2005). Three channels of corticothalamic communication during locomotion. The Journal of Neuroscience, 25(25), 5915-5925.
Skinner, B. F. (1938). The behavior of organisms: An experimental analysis. Appleton-Century-Crofts Inc. New York.
Solomon, D. H., Barohn, R. J., Bazan, C., & Grissom, J. (1994). The thalamic ataxia syndrome. Neurology, 44(5), 810-810.
Soso, M. J., & Fetz, E. E. (1980). Responses of identified cells in postcentral cortex of awake monkeys during comparable active and passive joint movements. Journal of Neurophysiology, 43(4), 1090-1110.
Stein, J. F., & Glickstein, M. (1992). Role of the cerebellum in visual guidance of movement. Physiological Reviews, 72(4), 967-1017.
Steriade, M. (1995). Two channels in the cerebellothalamocortical system. Journal of Comparative Neurology, 354(1), 57-70.
Stout, E. E., & Beloozerova, I. N. (2012). Pyramidal tract neurons receptive to different forelimb joints act differently during locomotion. Journal of Neurophysiology, 107(7), 1890-1903.
Stout, E. E., & Beloozerova, I. N. (2013). Differential responses of fast‐and slow‐conducting pyramidal tract neurons to changes in accuracy demands during locomotion. The Journal of Physiology, 591(10), 2647-2666.
Strick, P. L. (1976). Activity of ventrolateral thalamic neurons during arm movement. Journal of Neurophysiology, 39(5), 1032-1044.
Strick, P.L. (1973). Light microscopic analysis of the cortical projection of the thalamic ventrolateral nucleus in the cat. Brain Research, 55(1):1-24.

158
Stuart, D. G., & Hultborn, H. (2008). Thomas Graham Brown (1882–1965), Anders Lundberg (1920–), and the neural control of stepping. Brain Research Reviews, 59(1), 74-95.
Symonds, L. L., & Rosenquist, A. C. (1984). Corticocortical connections among visual areas in the cat. Journal of Comparative Neurology, 229(1), 1-38.
Symonds, L. L., Rosenquist, A. C., Edwards, S. B., & Palmer, L. A. (1981). Projections of the pulvinar-lateral posterior complex to visual cortical areas in the cat. Neuroscience, 6(10), 1995-2020.
Takahashi, K. (1965). Slow and fast groups of pyramidal tract cells and their respective membrane properties. Journal of Neurophysiology, 28(5), 908-924.
Thach, W. T., Goodkin, H. P., & Keating, J. G. (1992). The cerebellum and the adaptive coordination of movement. Annual Review of Neuroscience, 15(1), 403-442.
Trendelenburg, W. (1911). Untersuchungen über reizlose vorübergehende Ausschaltung am Zentralnervensystem. Pflüger's Archiv für die gesamte Physiologie des Menschen und der Tiere, 137(11-12), 515-544.
Tsao, D. Y., & Livingstone, M. S. (2008). Mechanisms of face perception. Annual Review of Neuroscience, 31, 411.
Udo, M., Kamei, H., Matsukawa, K., & Tanaka, K. (1982). Interlimb coordination in cat locomotion investigated with perturbation. Experimental Brain Research, 46(3), 438-447.
Van Donkelaar, P., Stein, J. F., Passingham, R. E., & Miall, R. C. (1999). Neuronal activity in the primate motor thalamus during visually triggered and internally generated limb movements. Journal of Neurophysiology, 82(2), 934-945.
van Kan, P. L. E., Houk, J. C., & Gibson, A. R. (1993). Output organization of intermediate cerebellum of the monkey. Journal of Neurophysiology, 69(1), 57-73.
Van Kan, P. L., Gibson, A. R., & Houk, J. C. (1993). Movement-related inputs to intermediate cerebellum of the monkey. Journal of Neurophysiology, 69(1), 74-94.
Vaziri, S., Diedrichsen, J., & Shadmehr, R. (2006). Why does the brain predict sensory consequences of oculomotor commands? Optimal integration of the predicted and the actual sensory feedback. The Journal of Neuroscience, 26(16), 4188-4197.
Vicario, D. S., Martin, J. H., & Ghez, C. (1983). Specialized subregions in the cat motor cortex: a single unit analysis in the behaving animal. Experimental Brain Research, 51(3), 351-367.
Wallen, P., & Williams, T. L. (1984). Fictive locomotion in the lamprey spinal cord in vitro compared with swimming in the intact and spinal animal. The Journal of Physiology, 347(1), 225-239.
Weber, D. J., London, B. M., Hokanson, J. A., Ayers, C. A., Gaunt, R. A., Torres, R. R., ... & Miller, L. E. (2011). Limb-state information encoded by peripheral and central somatosensory neurons: implications for an afferent interface. Neural Systems and Rehabilitation Engineering, IEEE Transactions on, 19(5), 501-513.
159
Weyand, T. G., Updyke, B. V., & Gafka, A. C. (1999). Widespread distribution of visual responsiveness in frontal, prefrontal, and prelimbic cortical areas of the cat: an electrophysiologic investigation. Journal of Comparative Neurology,405(1), 99-127.
Widajewicz, W., Kably, B., & Drew, T. (1994). Motor cortical activity during voluntary gait modifications in the cat. II. Cells related to the hindlimbs. Journal of Neurophysiology, 72(5), 2070-89.
Wise, S. P., Di Pellegrino, G., & Boussaoud, D. (1992). Primate premotor cortex: dissociation of visuomotor from sensory signals. Journal of Neurophysiology, 68(3), 969-972.
Yakovenko, S., Krouchev, N., & Drew, T. (2011). Sequential activation of motor cortical neurons contributes to intralimb coordination during reaching in the cat by modulating muscle synergies. Journal of Neurophysiology, 105(1), 388-409.
Yen, C. T., Honda, C. N., & Jones, E. G. (1991). Electrophysiological study of spinothalamic inputs to ventrolateral and adjacent thalamic nuclei of the cat. Journal of Neurophysiology, 66(3), 1033-1047.
Yumiya, H., & Ghez, C. (1984). Specialized subregions in the cat motor cortex: anatomical demonstration of differential projections to rostral and caudal sectors. Experimental Brain Research, 53(2), 259-276.
Zelenin, P. V., Beloozerova, I. N., Sirota, M. G., Orlovsky, G. N., & Deliagina, T. G. (2010). Activity of red nucleus neurons in the cat during postural corrections. The Journal of Neuroscience, 30(43), 14533-14542.
Zelenin, P. V., Deliagina, T. G., Orlovsky, G. N., Karayannidou, A., Dasgupta, N. M., Sirota, M. G., & Beloozerova, I. N. (2011). Contribution of different limb controllers to modulation of motor cortex neurons during locomotion. The Journal of Neuroscience, 31(12), 4636-4649.


![Locomotion [2014]](https://img.dokumen.tips/doc/110x75/5564e3eed8b42ad3488b4e94/locomotion-2014.jpg)


