Embed Size (px)
Citation preview
The Implications of the National Greenhouse and EnergyReporting Act 2007 on Carbon Emissions Disclosure Practicesin Australia: 2005 to 2011
Author
Rayner, Rowena Ruth
Published
2015
Thesis Type
Thesis (PhD Doctorate)
School
Griffith Business School
DOI
https://doi.org/10.25904/1912/3584
Copyright Statement
The author owns the copyright in this thesis, unless stated otherwise.
Downloaded from
http://hdl.handle.net/10072/367883
Griffith Research Online
https://research-repository.griffith.edu.au

correlH1


The Implications of the National Greenhouse and Energy
Reporting Act 2007 on Carbon Emissions Disclosure Practices in
Australia: 2005 to 2011
Rowena Ruth Rayner
BBus (Hons 1) QUT
Department of Accounting, Economics and Finance
Griffith Business School (Brisbane, Nathan)
Griffith University
Submitted in fulfilment of the requirements of the degree of
Doctor of Philosophy
18 December, 2014


i
The Implications of the National
Greenhouse and Energy Reporting Act
2007 on Carbon Emissions Disclosure
Practices in Australia: 2005 to 2011
Abstract
Carbon emissions make a significant contribution to climate change and global
warming. The accounting standards, though, are silent on the treatment for carbon
emissions and disclosures. As a result, stakeholders, other than the Australian
Government, are reliant on voluntarily disclosed carbon emission information. This
thesis investigates voluntary carbon emission disclosure practices of firms set within a
carbon-based economy, Australia. Specially, this thesis notes the changes in voluntary
carbon emission disclosures over time, prior to the introduction of the National
Greenhouse and Energy Reporting (NGER) Act 2007 to post-legislation, 2005 to 2011.
In addition, this thesis also investigates the determinants of such disclosures.
A multi-theoretical framework incorporating legitimacy, signalling and
institutional theories support this thesis. The sample comprises of hand-collected and
manually-coded data from 170 Australian Securities Exchange (ASX) listed firms with
85 of these firms listed on the NGER register; the other 85 firms are control firms
chosen using matched-pair design. Content analysis is used to capture the changes in
voluntary carbon emission disclosures while logistic regression analysis is used to
investigate the determinants that contribute to these disclosures. Ordinary least squares

ii
regression results using the number of words and the number of sentences on voluntary
carbon emission disclosures are generally consistent with the logistic regression results.
This thesis finds voluntary carbon emission disclosures increased over the
period 2005 through to 2011. However, heavy emitting firms that later listed on the
NGER-registered voluntarily disclosed less carbon emission information during 2005
and 2006 than firms not required to register. Though, by 2008 registered firms’
propensity to voluntary disclose carbon emissions increased at a greater rate than other
firms. In addition, it is found sustainability reports convey carbon emission data more
than annual reports; however can be raised about the timeliness of information in such
reports are not produced annually, if they are produced at all.
NGER firms in the materials, energy and industrial sectors did make
significantly different voluntary carbon emission disclosures compared with NGER
firms not in these sectors. Industry association is a predictor of voluntary carbon
emission disclosures though this depends on the nature of the industry and the
industry’s propensity to disclose. In addition, assured carbon emissions data and
corporate governance are predictors for NGER firms. Firm size is a predictor of carbon
emission disclosures for both NGER and Non-NGER firms.
Decision rules and check lists are designed to overcome the limitation of
subjective assessments by one researcher. Nevertheless, this thesis is confined to the
Australian context that is based on archival data.
The multi-theoretical framework provides a suitable basis to interpret voluntary
carbon emission disclosures made by firms positioned within Australia’s carbon-based
economy. The practical implications highlight the assurance of carbon emissions is an
indicator that NGER firms are more likely to voluntarily disclose carbon emissions.

iii
These findings have implications for public policy formation, legislation and further
development of carbon accounting.
This thesis contributes to the very limited literature on voluntary carbon
emission disclosures made within the context of a carbon-based economy by
investigating the implications of the NGER Act 2007 on such disclosure practices. The
NGER Act 2007 has been a significant milestone in Australia’s quest towards carbon
emissions reduction. It was also a prelude to Australia’s carbon tax introduced by the
previous Labor government. To the best of my knowledge, this is the most
comprehensive study related to NGER Act 2007 offering a longitudinal perspective of
the changes in Australia’s carbon emission reporting via annual reports and
sustainability reports.
Keywords:
The National Greenhouse and Energy Reporting (NGER) Act 2007; carbon
emissions; voluntary carbon emission disclosures; climate change; externalities;
determinants; annual reports; sustainability reports

iv
Statement of Originality
This work has not previously been submitted for a degree or diploma in any
university. To the best of my knowledge and belief, the thesis contains no material
previously published or written by another person except where due reference is made
in the thesis itself.
(Signed)_____________________________
Name of Student

v
Acknowledgements
I gratefully acknowledge the guidance, support and dedication of my Supervisory team
Professor Chew Ng, Associate Supervisor and Associate Professor Reza Monem,
Principal Supervisor from the Department of Accounting, Finance and Economics,
Griffith Business School, Griffith University, Queensland throughout my PhD
candidature. Their unfailing support and patience has been highly valued throughout the
candidature process.
In addition, I appreciate the mentoring received from the following visiting academics
to Griffith University and mentors attending the 2012 AFAANZ Colloquium and
Conference:
Professor Carol Adams, Research Professor, Monash Sustainability Institute, Monash
University, Victoria
Dr Maria Balatbat, Centre for Energy & Environmental Markets, School of Accounting,
University of New South Wales, New South Wales
Professor Julie Cotter, Director, Australian Centre for Sustainable Business and
Development, University of Southern Queensland, Queensland
Professor Craig Deegan, School of Accounting, RMIT University, Victoria
Professor Ferdinand Akthar Gul, School of Business, Monash University, Malaysia
Professor Donald Stokes, Department of Accounting, Monash University, Victoria
Professor Carolyn Windsor, Honorary Adjunct Professor, Faculty of Business, Bond
University, Queensland
Specifically, I received constructive feedback and guidance under the mentoring skills
of Professor Craig Deegan and Dr Maria Balatbat at the 2012 AFAANZ Doctoral
Colloquium in Melbourne while presenting a paper on my research topic. Additionally,
I received valuable feedback from the Forum audience in 2012 when I presented a paper
at the AFAANZ Conference titled: Australia’s Roller Coaster Ride to a Carbon Tax.
Finally, I would like to acknowledge the love, patience and support received from my
husband John, two children, Rachael and Daniel, my mother Freda, my brother William
and a close friend Mrs Adrienne Dunn during my doctoral candidature. Their constant
love and support throughout the candidature journey has been highly cherished,
treasured and valued, thank you.

vi
Table of Contents
Abstract .............................................................................................................................. i
Statement of Originality .................................................................................................. iv
Acknowledgements .......................................................................................................... v
Table of Contents ............................................................................................................ vi
List of Figures .................................................................................................................. ix
List of Graphs .................................................................................................................. ix
List of Tables .................................................................................................................... x
List of Appendices .......................................................................................................... xii
List of Abbreviations ..................................................................................................... xiii
1 Introduction .............................................................................................................. 1
1.1 Purpose, Aim and Motivation of this Thesis ..................................................... 3
1.2 The Research Questions ..................................................................................... 4
1.3 Theoretical Framework, Scope and Methodology of this Thesis ...................... 6
1.4 Findings ............................................................................................................. 6
1.5 Research Limitations ......................................................................................... 7
1.6 Contribution of this Thesis ................................................................................ 8
1.7 The Direction of the Thesis ............................................................................... 9
2 Background: International and National Responses to Climate Change ................ 11
2.1 Introduction ...................................................................................................... 11
2.2 International Developments ............................................................................. 12
2.2.1 Transnational Organisations ..................................................................... 12
2.2.2 Kyoto Protocol and looking ahead ........................................................... 13
2.2.3 Voluntary Initiatives ................................................................................. 18
2.3 International Jurisdictions ................................................................................ 21
2.4 Australia ........................................................................................................... 27
2.4.1 Government .............................................................................................. 27

vii
2.5 Australian Regulatory Environment ................................................................ 32
2.5.1 Corporations Act and ASX listing rules ................................................... 33
2.5.2 State & Territories Environmental Legislation ........................................ 35
2.5.3 National Pollution Inventory and Energy Efficiency Opportunities Acts 36
2.5.4 National Greenhouse and Energy Reporting (NGER) Act ....................... 37
2.6 An alternative Market Mechanism – a Carbon Tax ......................................... 42
2.7 Australia’s approach under the Abbott Coalition Government ....................... 43
2.8 Carbon management, policy and reporting ...................................................... 43
2.9 Chapter Summary ............................................................................................ 44
3 Literature Review ................................................................................................... 46
3.1 Introduction ...................................................................................................... 46
3.2 Overview on Voluntary Disclosures ................................................................ 48
3.2.1 Overseas ................................................................................................... 48
3.2.2 Australia ................................................................................................... 58
3.3 Voluntary Disclosures on Carbon Emissions .................................................. 60
3.3.1 Overseas ................................................................................................... 60
3.3.2 Australia ................................................................................................... 67
3.4 Chapter Summary ............................................................................................ 85
4 Theoretical Framework and Development of the Thesis Hypotheses .................... 88
4.1 The Theoretical Framework ............................................................................. 88
4.1.1 Legitimacy Theory ................................................................................... 90
4.1.2 Institutional Theory .................................................................................. 92
4.1.3 Signalling Theory ..................................................................................... 94
4.2 Voluntary carbon emission disclosures and practices ..................................... 96
4.3 The Determinants of Voluntary Carbon Emission Disclosures ..................... 100
4.4 Chapter Summary .......................................................................................... 105
5 Sample Selection and Research Methodology ..................................................... 107
5.1 Introduction .................................................................................................... 107

viii
5.2 Sample Firms and Sample Selection ............................................................. 107
5.2.1 Sample Period ......................................................................................... 108
5.2.2 Treatment and Control Firms ................................................................. 109
5.2.3 Disclosure Avenues Investigated............................................................ 117
5.3 Voluntary Carbon Emission Disclosures ....................................................... 120
5.3.1 Content Analysis .................................................................................... 125
5.4 Determinants of Voluntary Carbon Emission Disclosures ............................ 132
5.4.1 The Thesis Models ................................................................................. 133
5.4.2 Independent Variables ............................................................................ 136
5.4.3 Control Variables .................................................................................... 137
5.5 Chapter Summary .......................................................................................... 147
6 Data Analysis, Results and Discussion ................................................................ 149
6.1 Introduction .................................................................................................... 149
6.2 Descriptive Statistics ...................................................................................... 151
6.2.1 Annual Reports - NGER & Non-NGER - Descriptive Statistics and
Frequencies ........................................................................................................... 151
6.2.2 Sustainability Reports - NGER & Non-NGER - Descriptive Statistics and
Frequencies ........................................................................................................... 161
6.3 Changes over time in Voluntary Carbon Emission Disclosures .................... 172
6.4 Validity Test of Results ................................................................................. 179
6.4.1 Independent Samples t-test ..................................................................... 179
6.4.2 Mann-Whitney z-test .............................................................................. 188
6.5 Testing significant differences in use between annual and sustainability reports
190
6.6 Determinants of Carbon Emission Disclosures ............................................. 196
6.6.1 Pearson and Spearman’s Rank Correlations ........................................... 196
6.6.2 Ordinary Least Squares Regression ........................................................ 203
6.6.3 Logistic Regression ................................................................................ 211

ix
6.7 Chapter Summary .......................................................................................... 216
7 Conclusion ............................................................................................................ 220
7.1 The purpose, aim and outline of the thesis .................................................... 220
7.2 A summary of the findings ............................................................................ 222
7.3 Theoretical and Practical Implications of the findings .................................. 224
7.4 Contributions ................................................................................................. 226
7.5 Limitations and Potential Future Research direction ..................................... 227
7.6 Chapter Summary .......................................................................................... 230
References .................................................................................................................... 232
List of Figures
Figure 5.1The Hierarchical Order of the keyword search ............................................ 131
List of Graphs
Graph 6.1 Frequency of VCEDs in Annual & Sustainability Reports - NGER & Non-
NGER ........................................................................................................................... 149

x
List of Tables
Table 5.1 The sample represents nine GICs sectors and seventeen industry groups ... 112
Table 6.1 The Percentage of firms providing voluntary carbon emission disclosures . 150
Table 6.2 Descriptive Statistics and Frequencies - NGER & Non-NGER Annual
Reports .......................................................................................................................... 152
Table 6.3 Descriptive Statistics and Frequencies – NGER & Non-NGER Sustainability
Reports .......................................................................................................................... 162
Table 6.4 NGER Sustainability Reports - Number produced & the actual number
containing VCEDs ........................................................................................................ 172
Table 6.5 Related-Samples Friedman's Two-Way Analysis of Variance of Changes in
the quantity of VCEDs - Annual Reports ..................................................................... 174
Table 6.6 Related-Samples Friedman's Two-Way Analysis of Variance of Changes in
the quantity of VCEDs - Sustainability Reports ........................................................... 177
Table 6.7 Independent Samples T-test comparing NGER & Non-NGER's Annual
Reports .......................................................................................................................... 180
Table 6.8 Independent Samples T-test comparing NGER & Non-NGER's Sustainability
Reports .......................................................................................................................... 182
Table 6.9 Two Independent Samples T-Test Pre-Post NGER & Non-NGER firms'
Annual & Sustainability Reports .................................................................................. 185
Table 6.10 Independent Samples T-test Pre-Post Change [(2011-2009)-(2007-2005)]
comparing NGER & Non-NGER firms' Annual & Sustainability Reports ................. 187
Table 6.11 Mann-Whitney z-test comparing Pre-NGER Changes with Post-NGER
Changes - NGER & Non-NGER firms ........................................................................ 189
Table 6.12 Summary of Hypotheses testing changes in Voluntary Carbon Emission
Disclosures ................................................................................................................... 190
Table 6.13 Comparing VCEDs between Annual & Sustainability Reports - NGER &
Non-NGER firms .......................................................................................................... 192
Table 6.14 NGER - Pearson Correlation (above the diagonal) and Spearman's Rank
Correlation (below the diagonal) Matrix ...................................................................... 197
xi
Table 6.15 Non-NGER - Pearson Correlation (above the diagonal) and Spearman's
Rank Correlation (below the diagonal) Matrix............................................................. 200
Table 6.16 Ordinary Least Squares Regression – V/DISC_Words ............................... 204
Table 6.17 Ordinary Least Squares Regression – LnV/DISC_Words .......................... 207
Table 6.18 Ordinary Least Squares Regression – V/DISC_Sentences ......................... 209
Table 6.19 Ordinary Least Squares Regression – LnV/DISC_Sentences ..................... 210
Table 6.20 Logistic Regression Analysis on the Determinants of Voluntary Carbon
Emission Disclosures - NGER & NonNGER (Model 3) and combined group (Model 4)
...................................................................................................................................... 213

xii
List of Appendices
Appendix 1 – Market Capitalisation ............................................................................. 258
Appendix 2 - Hackston and Milne's (1996) and Haque and Deegan's (2010) Checklists
...................................................................................................................................... 265
Appendix 3 - EITE ....................................................................................................... 266
Appendix 4 – Metals and Mining Industry ................................................................... 268
Appendix 5 – The Number of Annual and Sustainability Reports containing voluntary
carbon emissions information over the period 2005 through to 2011 .......................... 269
Appendix 6 – Descriptive Statistics – NGER & Non-NGER ...................................... 270
Appendix 7 – Friedman’s Test Mean Ranks – Keywords, Words, Sentences, Table,
Graphs and Figures ....................................................................................................... 274

xiii
List of Abbreviations
ASX Australian Securities Exchange
CDP Carbon Disclosure Project
CEO Chief Executive Officer
COAG Council of Australian Governments
CPRS Carbon Pollution Reduction Scheme
EITE Emissions-Intensive Trade-Exposed
ETS Emissions Trading Scheme
EU European Union
GEDO Greenhouse and Energy Data Office
GHG Greenhouse Gases
GICS Global Industry Classification Standard
GRI Global Reporting Initiative
IPCC Intergovernmental Panel on Climate Change
NGER National Greenhouse and Energy Reporting
NPI National Pollution Inventory
UK United Kingdom
UN United Nations
UNFCCC United Nations Framework Convention on Climate Change
US United States of America

1
1 Introduction
Just prior to the November, 2014 G20 summit held in Brisbane, Australia, the
US President Barack Obama and the Chinese President Xi Jinping announced in Bejing,
China, a bold strategy to reduce greenhouse gases (Whinnett 2014). The US and China,
the world’s heaviest polluters, make commitments to cut emissions and increase non-
fossil fuels (Whinnett 2014). In contrast, Australia’s Prime Minister, Tony Abbott, had
scrapped Australia’s carbon tax and argued against the topic of climate change being on
the G20 agenda (Viellaris & Meers 2014). However, the recently announced global
Green Climate Fund coincided with the G20 talks and aimed to coerce Australia into
accepting a more determined policy to tackle climate change rather than the existing
‘Direct Action Plan’ (Viellaris 2014).
The US-China agreement is welcomed as it is an agreement between the world’s
two largest polluting economies, a developed and a developing nation. At the
Copenhagen Conference of Parties in 2009, agreement stumbled amid the international
controversy surrounding the disparities between jurisdictions and different approaches
to cut carbon emission levels. At that stage the US did not commit to the Kyoto Protocol
as the free-rider affect was not addressed; large developing nations were not included in
the Protocol which threatened a wealth transfer between developed and fast developing
nations (Yoram 2010). It is hoped the US-China agreement will now put pressure on
other jurisdictions to reduce carbon emissions (Viellaris & Meers 2014).
Climate change is an increasing and significant challenge for the global
population especially because accounting for environmental externalities is difficult
(Deegan 2005). Externalities such as carbon emissions were at one stage considered
outside the firm’s responsibility (Andrew, Kaidonis & Andrew 2010). However, carbon

2
emissions are making a significant contribution to climate change. Subsequently, the
costs of global warming are increasingly being borne by all stakeholders. As a result,
the United Nations Framework Convention on Climate Change (UNFCCC), supported
by the research from the Intergovernmental Panel on Climate Change (IPCC),
established the Kyoto Protocol that mandated action on member countries.
Establishing an explicit price on fossil fuels is essential to drive change in
producer, investor and consumer behaviour to reduce carbon emission levels
(Organisation for Economic Development 2013; United Nations Framework
Convention on Climate Change 2010b). Even though firms require resources to produce
and survive within their operating environments (Pfeffer & Salancik 1978), incentives
are required to shift the focus away from fossil fuels. However, accounting standards
are silent on the treatment of carbon emission disclosures in the annual reports, despite
investors needing to understand the risks and opportunities that exist in a firm’s
operating environment. Basically, a re-examination of the accounting terms, policies
and standards are being conducted to accommodate the necessity to incorporate an
externality, carbon emission pollution (Mete, Dick & Moerman 2010). Nevertheless, in
spite of the delay in accounting guidance, there is an increasing demand on firms to
report climate change information (Global Reporting Initiative & KPMG 2007).
Pressures from changing societal expectations to disclose information on common
resources (water usage and air quality) are increasing (Deegan & Rankin 1996;
Hoffman 2006). Adverse media attention (Deegan, Rankin & Tobin 2002; Newson &
Deegan 2002), greater public scrutiny (Frost et al. 2005; Global Reporting Initiative &
KPMG 2007) and changing community attitudes (Newson & Deegan 2002) contribute
to changing societal expectations.

3
In 2007, the Australian government enacted the NGER Act 2007 mandating
reporting requirements to government, for firms once specific carbon emission
thresholds have been reached. This legislation is established to underlie a future
emissions trading scheme (ETS) and it also assists the Australian government to meet
its greenhouse gas (GHG) reporting commitments under the Kyoto Protocol
(Department of Climate Change and Energy Efficiency 2007). However, this legislation
does not mandate carbon emission disclosures in annual or sustainability reports
(Department of Climate Change and Energy Efficiency 2007). Subsequently,
managerial discretion gives flexibility as to the extent and nature of carbon emission
disclosures that are voluntarily released. Stakeholders remain reliant on voluntary
information. Therefore, not only understanding the level but also the determinants of
voluntary carbon emission disclosures, in the light of changing societal attitudes within
the confines of a carbon based economy, such as Australia, is important not only for
government but for all stakeholders.
1.1 Purpose, Aim and Motivation of this Thesis
The purpose of this thesis is to investigate voluntary carbon emission disclosure
practices of Australian firms in the light of changes in reporting regulations. Specially,
this thesis notes the changes in voluntary carbon emission disclosures over time, prior to
the introduction of the NGER Act 2007 to post-legislation, 2005 – 2011. In addition, this
thesis also investigates the determinants behind such disclosures. The motivation for
this thesis is to determine the implications of the NGER Act 2007, Australian legislation
external to the accounting standards, on voluntarily disclosed carbon emissions in the
annual reports and sustainability reports of Australian companies. The aim of this thesis
is to highlight whether the current regulatory environment has an implicit impact on the
voluntary reporting framework within which stakeholders are required to gauge the
risks and opportunities faced by Australian firms.

4
1.2 The Research Questions
Prior to the implementation of the NGER Act 2007, research noted an increasing
trend to voluntarily disclose greenhouse gas emissions (Adams & Frost 2007; Deegan
2002a; Haque & Deegan 2010; Simnett & Nugent 2007; Stanny 2010; Unerman &
Bennett 2004). This increasing trend was attributed to firms responding to changing
societal expectations (Adams & Frost 2007; Deegan 2002a); however, voluntary
disclosures lagged behind UK firms (Adams & Frost 2007), remained inconsistent
(Stanny 2010) and at a low level (Haque & Deegan 2010; Simnett & Nugent 2007).
Voluntary disclosures provided positive news to legitimize a firm’s presence (Deegan &
Rankin 1996) though the disclosures provided limited information on the risks and
opportunities that firms faced (Haque & Deegan 2010) subsequently raising questions
on the usefulness and questioned the usefulness of voluntary emission disclosures
(Simnett & Nugent 2007). However, the implementation of the NGER Act 2007
changed the operating environment of firms by mandating carbon emission reporting to
one stakeholder, government. Firms are now required to measure, monitor, record and
report carbon emissions once set emission thresholds have been met.
Despite these changes in the reporting environment, longitudinal studies
investigating the implications of the NGER Act 2007 on voluntary carbon emission
disclosures have been limited to date. Recent research into voluntary carbon emission
disclosures in Australia within the last few years predominately consists of a snap-shot
view (de Lange & Sidaway 2011; Hollindale, Kent & Routledge 2010; Perera & Jubb
2011; Purushothaman & Taplin 2011a, 2011b; Rankin, Windsor & Wahyuni 2011;
Simnett & Nugent 2007) centring around the years 2005, 2007 and 2009. Longitudinal
studies focussed on NGER’s pre-legislative years (Cowan & Deegan 2011; Cowan &
Gadenne 2005; Haque & Deegan 2010), or the years immediately surrounding the
implementation of the NGER Act 2007 (Choi, Lee & Pasros 2013; Hollindale 2012) or

5
focussed on firms not required to report under the NGER Act (Borghei & Leung 2013).
In contrast, the current research provides a longitudinal investigation covering the years
2005, prior to the NGER Act 2007 through to 2011, three years post-NGER Act
implementation. The significance of the period captures changes in voluntary carbon
emission disclosures from a point of no knowledge of the legislation to three years past
implementation and the introductory years. The research question is:
What are the changes over time in emissions-related voluntary disclosures by
Australian firms between pre- and post- NGER Act periods?
This thesis is further extended by investigating the determinants of voluntary
carbon emission disclosures. Prior research indicates a relationship exists between firm
size and voluntary environmental disclosures and between industry membership and
voluntary environmental disclosures (Choi, Lee & Pasros 2013; Deegan & Gordon
1996; Hackston & Milne 1996; Hollindale 2012; Hollindale, Kent & Routledge 2010;
Hossain, Perera & Rahman 1995; Murray et al. 2006; Patten 1992; Patten 2002; Rankin,
Windsor & Wahyuni 2011). The thesis identifies three industry sectors that participate
in emission-intensive activities and this are materials, industrials and energy sectors.
Each of these sectors is examined as predictor variables. In addition, the NGER Act
does not mandate assurance of carbon emissions data unless there is a potential breach
of the accuracy of the data (Clean Energy Regulator 2014b). However, firms do assure
carbon emission data which predominately occurs on a voluntary basis. Therefore the
presence of assured carbon emissions data is also considered as a predictor variable.
Investigation into the determinants of voluntary disclosures is warranted. The Research
question is:
What are the determinants of voluntary disclosures regarding carbon emissions
by Australian firms?

6
1.3 Theoretical Framework, Scope and Methodology of this Thesis
A multi-theoretical framework that is drawn from Positive Theory supports this
thesis. Positive Theory includes economic-based and systems-oriented theories (Deegan
2002b). Prior research suggests a multi-theoretical framework using complementing
theories (Cormier, Magnan & Van Velthoven 2005) provides a comprehensive
explanation for the research rather than the reliance on one theory (Gray, Kouhy &
Lavers 1995). The current research incorporates two systems-oriented theories
legitimacy and institutional theories and one economics-based theory, signalling theory
to support this thesis.
The scope of this thesis focusses on 170 ASX listed firms over the research
period 2005 to 2011. This period captures the pre- and post-NGER Act 2007.
Longitudinal studies of this nature, specially focussing on voluntary carbon emission
disclosures in Australia, are limited to date. The sample consists of two groups, 85
NGER firms listed on the NGER register and 85 Non-NGER firms. Non-NGER firms
are match-paired based on size and industry membership.
The sample comprises of hand-collected and manually-coded data. Content
analysis is used to capture the changes in voluntary carbon emission disclosures while
logistic regression analysis is used to investigate the determinants that contribute to
these disclosures.
1.4 Findings
The results indicate that voluntary carbon emission disclosures increased over
time during the period 2005 to 2011. In 2005 and 2006 NGER firms, heavy emitters,
tended to disclose less carbon emission information than Non-NGER firms. This
finding is consist with Clarkson, Li, Richardson and Vasvari (2008) who suggest poor
environmentally performing firms disclose less information or remained silent.

7
However, NGER firms’ propensity to voluntarily disclose carbon emissions increased
from 2008 onwards and this paralleled with a source of carbon emission data becoming
publicly available. Cunningham and Gadenne (2003) suggest that publicly-available
regulated environmental disclosures are an incentive for firms to report such related
disclosures in annual reports.
Further, sustainability reports, where available, are favoured more than annual
reports as an avenue through which to release carbon emission data. Brown and Deegan
(1998) and the Joint Committee on Corporations and Financial Services (2006) note the
acceptability of sustainability reports to convey voluntary environmental information is
growing and the number of firms using sustainability reports is increasing. Perera and
Jubb (2011) find a positive relationship between voluntary emission disclosures and the
presence of sustainability reports. However, questions can be raised about the timeliness
of information if these reports are not produced annually, if they are produced at all.
In addition, the findings also suggest firm size, assured carbon emission data,
corporate governance and industry association are predictors of voluntary carbon
emission disclosures for heavy emitters listed on the NGER register. Firm size is also a
predictor of carbon emission disclosure for Non-NGER firms.
1.5 Research Limitations
This thesis has a number of limitations. The research is limited to the first three
years post-NGER Act and extending this thesis past this point is not feasible in the
current study due to time constraints. In addition, investigating archival data retrieved
from the annual reports and sustainability reports limits the scope of the study.
Examining other paths of disclosures, such as instantaneous data retrieved from
websites, ASX announcements and commitments to voluntary reporting initiatives are
beyond the capacity of this research.

8
In addition, content analysis is exposed to a degree of subjectivity with the use
of only one researcher. To overcome the subjectivity inherent in the use of one
researcher, decision rules and check lists are designed. Furthermore, other theories may
also provide additional insights into voluntary carbon emission disclosures. Thus the
current theoretical framework cannot be considered as providing exclusive reasons for
voluntary carbon emission disclosures. Finally, this thesis is based within the context of
a carbon-based economy, Australia. The generalizability of the findings may be limited
to international jurisdictions operating within a similar carbon-based economy, for
example Canada.
1.6 Contribution of this Thesis
In spite of the limitations using archival data and confining this thesis within the
Australian context, this thesis does highlight that stakeholders cannot be reliant on all
heavy emitters’ voluntary carbon emission disclosures as a basis on which to allocate
financial resources. Even though this thesis notes voluntary carbon emission disclosures
have increased over the sample period, Non-NGER heavy emitting firms do not make
significantly different voluntary carbon emission disclosures from other firms. This is
despite the fact heavy emitting firms face higher risks due to the nature of their
activities.
Prior research highlights the inconsistences and incompleteness presented in
voluntary emission disclosures (Frost et al. 2005; Gray & Owen 1993; Mathews 2004;
Patten 2002; Wiseman 1982). Even though Freedman and Pattern (2004) find heavy
emitters incur greater negative responses, they find increased disclosures reduces the
negative impact. Likewise, Blacconiere and Patten (1994) find adverse reactions to
environmental disasters impact on share prices; however, the impact on the firm is
reduced with wide spread environmental disclosures. Conversely, Clarkson, Li,

9
Richardson and Vasvari (2008) find heavy polluters have a negative relationship with
voluntary emission disclosures. Nevertheless, it is expected that heavy emitters in the
materials, industrial and energy sectors coming under the EITE Assistance Programme
have incentives to reduce the negative impact. Appendix 3 lists emission-intensive
activities. The energy industry is the highest carbon emission producer in Australia and
is an essential service provider. The materials industry is involved with mining and
allied sectors. Firms in the industrial industry include capital goods, commercial &
professional services and the transport sector. Further, even though carbon emission
assurance is a voluntary undertaking, NGER firms that have made this commitment to
increase the credibility of their carbon emission data are more likely to voluntary
disclose. Nevertheless, a disparity of carbon emission information reduces the ability of
stakeholders to take action in stabilizing global warming. These findings make a
significant contribution to the voluntary disclosure literature.
1.7 The Direction of the Thesis
The structure of this thesis is organised as follows: Chapter 2 discusses the
background outlining the international and national responses to climate change and as
a result how the instance of climate change is influencing the necessity for carbon
emission disclosures in Australia. This chapter highlights the controversy surrounding
the appropriate action to take to reduce carbon emissions and subsequently to address
climate change.
Chapter 3 provides an overview of the voluntary disclosure literature and this
leads to a narrower focus and discussion about voluntary carbon emission disclosures in
Australia. Voluntary environmental disclosures provide one perspective of voluntary
disclosures and encompass a broad range of information about different aspects of the
10
environment. Voluntary carbon emission disclosures are a subset of voluntary
environmental disclosures and this is the focus of attention in this research.
Two systems-oriented theories, legitimacy and institutional, and one economic-
based theory, signalling provide a multi-theoretical structure surrounding this thesis
rather than the use of a single theory. The multi-theoretical framework provides the
basis for the thesis hypotheses which are presented in Chapter 4.
The sample size consists of 170 ASX listed firms with 85 NGER registered
firms and 85 firms not registered (Non-NGER). A longitudinal study is conducted
following changes in firms’ voluntary carbon emission disclosures made in annual and
sustainability reports over the research period 2005 to 2011. The models along with the
dependent and predictor variables are explained in Chapter 5.
Chapter 6 provides the data analysis, results and discussion. The first part of this
thesis employs content analysis technique. The second part of the thesis investigates the
determinants of voluntary carbon emissions disclosure and this is conducted through
mulit-variate analysis. Concluding remarks are presented in Chapter 7.

11
2 Background: International and
National Responses to Climate Change
2.1 Introduction
Carbon emissions consist of a collection of gases which include Carbon dioxide
(CO2), Methane (CH4), Nitrous oxide (N20), Hydrofluorocarbons (HFCs),
Perfluorocarbons (PFCs) and Sulphur hexafluoride (SF6) (United Nations 1998).
Carbon emissions are by-products of daily living and business activities but science
establishes that carbon emissions significantly contribute to global warming and climate
change (Stapleton et al. 2006; Stern 2007). A summary of the fifth assessment report
released on 27 September, 2013 states
“Warming of the climate system is unequivocal, and since the 1950s,
many of the observed changes are unprecedented over decades to millennia.
The atmosphere and ocean have warmed, the amounts of snow and ice have
diminished, sea level has risen, and the concentrations of greenhouse gases
have increased” (Intergovernmental Panel on Climate Change 2013).
Therefore the importance of quantifying, reporting and consequently reducing
emission levels is imperative. The adverse impact on the global community and the
necessity for businesses to negotiate the risks and opportunities underlie the importance
to respond.
This chapter outlines international developments and responses undertaken by
transnational organisations and jurisdictions to reduce carbon emissions. The global
responses include the establishment of the Kyoto Protocol and other voluntary
initiatives while individual jurisdictions implement national responses. Meanwhile
international debate is mirrored in Australia’s government, business and societal

12
interactions. Nevertheless, the Australian regulatory environment is changing and this is
placing renewed emphasis on financial reporting disclosures in Australia.
2.2 International Developments
2.2.1 Transnational Organisations
Internationally, organisations such as the United Nations (UN), the
Intergovernmental Panel on Climate Change (IPCC) and the Potsdam Institute are
committed to addressing global warming. This list is not exhaustive, though it is an
example of international commitment to reach a global consensus to act on climate
change.
At the UN Conference on Environment & Development in 1992, the United
Nations Framework Convention on Climate Change (UNFCCC) was adopted (United
Nations Framework Convention on Climate Change 2011a). This followed increasing
public awareness during the 1990s of the issue of climate change as noted by Kolk
(2008) (cited in Haque and Deegan 2010, p. 3). The UNFCCC’s goal is to put a stop to
detrimental human activities that impact on the earth’s climate system. One hundred and
ninety-four countries are party to this international environmental treaty, however there
is no mandate or enforcement under the treaty (United Nations 1992). The UNFCCC’s
work is based on scientific research assessed by the Intergovernmental Panel on Climate
Change (IPCC).
The IPCC is a scientific body that was established in 1989 by the United Nations
Environment Programme & World Meteorological Organisation (Intergovernmental
Panel on Climate Change 2010). IPCC assesses scientific work on climate change and is
the leading organisation in this field (Intergovernmental Panel on Climate Change
2010). The IPCC has released a series of reports outlining the adverse impact of global

13
warming if increased action to reduce greenhouse gases is not adopted (Haque &
Deegan 2010).
The Potsdam Institute for Climate Impact Research plays an active role in the
IPCC by providing interdisciplinary research into climate change and environmental
sustainability (Potsdam Institute for Climate Impact Research 2010). The Potsdam
Institute for Climate Impact Research is based in Germany and was established in 1992.
This institute partners the United Kingdom’s (UK) Tyndall Centre for Climate Change
Research, a member of the European Climate Forum and is involved with other
international initiatives (Potsdam Institute for Climate Impact Research 2010).
Nevertheless, multinational organisations initially opposed international
scientific evidence and efforts to control greenhouse gas emissions (Jeswani,
Wehrmeyer & Mulugetta 2008; Kolk & Levy 2001). Kolk (2008) (cited in Haque and
Deegan, 2010, p. 3) notes the energy-intensive sceptics aligned with lobby groups,
Global Climate Coalition and the Coalition for Vehicle Choice, to counter climate
change arguments posed by scientists. These sceptics included the paper and pulp,
chemicals, steel, coal, aluminium, oil and automobile industries, industries that are
sensitive to environmental regulations. In spite of the opposition, the UNFCCC needed
to guide the global community forward.
2.2.2 Kyoto Protocol and looking ahead
The UNFCCC held in Kyoto, Japan during December 1997 was significant as at
this conference the Kyoto Protocol was established and it mandated action on developed
member countries to reduce greenhouse gases. The Protocol came into force on 16
February, 2005 (United Nations Framework Convention on Climate Change 2010b).The
Protocol was adopted at the third session of the Conference of the parties (COP 3) and
was open for signatories from 16 March, 1998 to 15 March, 1999. During this time the

14
UN Headquarters attracted eighty-four signatories (United Nations Framework
Convention on Climate Change 2010d).
While the UNFCCC only encouraged jurisdictions to implement action, the
establishment of the Kyoto Protocol committed 37 industrialized countries, referred to
as Annex 1 countries and the European community to binding targets for cutting
greenhouse gases (United Nations Framework Convention on Climate Change 2010b).
These 37 developed countries made significant contributions to greenhouse gas
emissions over the last 150 years due to industrial activity (United Nations Framework
Convention on Climate Change 2010b). The Protocol outlined the requirements for
monitoring and recording carbon emission trades, which are submitted and reported
annually.
The Kyoto Protocol brought the issue of global warming into the arena of
commercialism, its visibility increased and commercial impact designated (Lohmann
2009). However, Lohmann (2009, p. 500) considers “the problem has been mistaken for
the solution”. Rather than integrating the issue of climate change into capital markets or
isolating it from these markets, Lohmann (2009) suggests the emphasis should shift to
the specific context and practices that contribute to global warming. Nevertheless, the
Kyoto Protocol did draw global attention to the importance of climate change and
endeavoured to engender transnational cooperation (Yoram 2010). International
cooperation is required to redress the negative impact of carbon emissions on climate
change (Yoram 2010).
The Protocol requires member countries to set and meet targets established
through national measures and the Protocol’s three recommended market mechanisms -
an emissions trading scheme (ETS), the Clean Development Mechanism and Joint
Implementation (United Nations Framework Convention on Climate Change 2010b).

15
An ETS is a ‘cap and trade’ mechanism where jurisdictions’ targets are referred to as
‘assigned amount units’ (United Nations Framework Convention on Climate Change
2013a). When a jurisdiction does not release emissions to the level allowed by the
assigned amount units, spare emission units are available to be sold to other
jurisdictions that have exceeded their emission target (United Nations Framework
Convention on Climate Change 2013a). This provides a flexible approach for
jurisdictions that have exceeded targets to balance excess emission levels. Effectively a
commodity is created and traded in a carbon market (United Nations Framework
Convention on Climate Change 2013a). Even though a number of gases are identified as
contributing to greenhouse gases, carbon is the principal greenhouse gas hence these
gases are collectively referred to as carbon or carbon-equivalent (United Nations
Framework Convention on Climate Change 2013a).
Alternative approaches, the Clean Development Mechanism and Joint
Implementation are ‘project-based’ mechanisms (MacKenzie 2009). Project-based
mechanisms are emission-reducing projects where a jurisdiction earns emission-
reducing credits by undertaking projects within other countries, for example, the
installation of solar panel generating systems in developing countries (United Nations
Framework Convention on Climate Change 2010a). The Clean Development
Mechanism is directed towards developing countries whereas Joint Implementation
projects are directed towards jurisdictions referred to as an Annex B Party on the Kyoto
Protocol list (United Nations Framework Convention on Climate Change 2010a,
2013b). Further, a compliance system was instigated under the Protocol to compel
countries to achieve their commitments. This approach overlooked the plausible
contribution that social classes, transnational organisations, international financial
institutions and multinational corporations also made to climate change (Lohmann
2009). Rather, emission sources were classified according to location hence

16
jurisdictions were held accountable for actions to address global warming (Lohmann
2009).
Essentially, the concept of an emissions trading scheme, the marketization of
climate policy, is derived from the core tenets of neoliberal ideology that has dominated
public policy during the last 25 years (Andrew, Kaidonis & Andrew 2010). Neoliberal
thinking supports the role of free markets in which governments play a small role by
providing the structure within which free markets operate (Andrew, Kaidonis &
Andrew 2010). Neoliberal thinking argues that a market, albeit an artificially structured
market, is necessary to correct what free markets initially failed to do, address
externalities imposed on the commons (Andrew, Kaidonis & Andrew 2010). One
advantage of an ETS is its perceived ability to achieve defined targets for emission
reductions within a fixed period of time (Metcalf 2009). However, achieving these set
targets comes at the expense of price volatility for carbon permits (Metcalf 2009).
Other mechanisms such as regulations, increasing publicly funded research and
development, removing fossil-fuel subsidies and imposing a carbon tax (MacKenzie
2009) are not explicitly suggested under the Kyoto Protocol.
In addition, the Protocol launched an Adaption Fund to financially assist
developing countries who are parties to the Protocol to adjust to climate change. This
fund finances adaption projects and is subsidized mainly from the Clean Development
Mechanism activities (United Nations Framework Convention on Climate Change
2010b). Globally, the Kyoto Protocol is considered a significant first step aimed at
stabilizing greenhouse gas emissions (United Nations Framework Convention on
Climate Change 2010b). However, the impending expiry of the Kyoto Protocol
increased the urgency for another international framework to further guide emissions
reductions (United Nations Framework Convention on Climate Change 2009). The
17
Kyoto Protocol was due to expire at the end of 2012 (the end of the first reporting
period, 2008 to 2012) at which time countries reported emissions to the UN Climate
Change Secretariat. The Protocol provides the underlying structure for future treaties
(United Nations Framework Convention on Climate Change 2010b), however a new
treaty that includes developing countries poses a stumbling block (Taylor 2009) hence
the Kyoto Protocol currently remains in force.
Countries are grappling with the responsibility to address climate change.
Countries are encouraged to take ownership of this global challenge despite
considerable differences existing between jurisdictions. The UNFCCC’s fifteenth
session of the Conference of the Parties (COP15) held in Copenhagen during 2009
highlighted the international controversy surrounding the disparities between
jurisdictions and different approaches to cut carbon emission levels. Developing
countries such as Brazil, India and China who are the large greenhouse gas emitters, did
not want the allocation of permits under an ETS to be based on current emission levels
(Yoram 2010). Rather heavily populated developing countries preferred the allocation
of permits on a per capita basis, consequently favouring national residents (Yoram
2010). However this fails to reduce emissions if the allocation of permits is allotted
according to current per capita levels of developed countries (Yoram 2010). A wealth
transfer is expected to occur between developed countries such as the USA and these
heavily populated developing countries. These are conditions the USA is unwilling to
submit to (Yoram 2010). In addition, James Hansen, a scientist from the National
Aeronautics and Space Administration opposed the use of a market mechanism, an
ETS, and called for the implementation of a carbon tax to achieve the necessary
emission reductions (Andrew et al., 2010).

18
Nevertheless, the Kyoto Protocol did significantly influence altering attitudes
towards climate change. Multinational organisations gradually reconsidered their
position from opposition to proactive responses (Kolk & Levy 2001). Haque and
Deegan (2010) consider the changing organisational attitudes evolved in three phases,
denial, gradual acceptance and proactive response. Proactive responses reflect the
neoliberalism thinking that the market would provide the solutions to climate change
(Andrew, Kaidonis & Andrew 2010). However, the ETS’s focus shifts the goal from
carbon reductions to profits (Andrew, Kaidonis & Andrew 2010). Carbon reductions are
a desirable outcome though they remain a secondary consideration, as it is not
fundamentally important through neoliberal thinking (Andrew, Kaidonis & Andrew
2010). An ETS opens the opportunity for free-riders, as long as someone else cuts
emissions (Andrew, Kaidonis & Andrew 2010). Yoram (2010) considers the Kyoto
Protocol failed as insufficient levels of global carbon emissions, only 8 per cent, are
subject to the boundaries set by the Protocol. The Kyoto Protocol does not include
developing countries hence emissions in these jurisdictions increase (Yoram 2010). The
USA did not commit to the Protocol as the free-rider effect was not addressed; all large
developing countries are not included (Yoram 2010). Sharing abatement costs between
jurisdictions has not been achieved (Yoram 2010). Neoliberal ideology continues to
underlie the approach transnational organisations and individual jurisdictions use to
address climate change.
2.2.3 Voluntary Initiatives
Voluntary international initiatives that have been established to aid a global
reporting environment include the Global Reporting Initiative (GRI), the Carbon
Disclosure Project and the Climate Disclosure Standards Board’s Climate Change
Reporting Framework. The GRI was launched in 1997 to provide a credible global
framework for sustainability reporting by all organisations (Rankin, Windsor &

19
Wahyuni 2011). This Initiative was supported by the UN Environment Programme and
works with the UN Global Compact, a voluntary corporate responsibility initiative, with
the view to achieving routine and comparable economic, environmental and social
reporting for organisations throughout the world (Clarkson et al. 2008; Cotter, Najah &
Wang 2011; Stausberg & Dohl 2010). Currently there are 8,700 organisations from 130
countries that are associated with this corporate responsibility initiative (United Nations
Global Compact 2011). Deegan and O’Neill (2011) note the GRI G3 Guidelines are
used as a measure of reliability and a comparison for good quality reporting to which
corporate social disclosures are assessed against. However, Deegan and O’Neill (2011)
contend that researchers are accepting the quality of guidelines without questioning the
relevance of disclosures to stakeholders. Consequently, Deegan and O’Neill investigate
this concern by researching one area, occupational health and safety disclosures. The
results question the ability of the GRI’s guidelines to reflect stakeholder relevance, an
indicator of quality disclosures (Deegan & O'Neill 2011). Nevertheless, the research is
not conclusive as a number of limitations reduce the generalisability of the findings
(Deegan & O'Neill 2011). However, Deegan and O’Neill (2011) call for the use of
caution with the application of the GRI G3 Guidelines in research as a benchmark
representing quality.
The Carbon Disclosure Project is one path organisations throughout the world
can use to disclose greenhouse gases, climate change strategies and water usage
(Carbon Disclosure Project 2011b). The Project provides a database of information for
businesses, investors and policy formation (Carbon Disclosure Project 2011a). The
Carbon Disclosure Project is an independent, not-for-profit organisation which holds the
largest database of primary data from corporations in relation to climate change (Carbon
Disclosure Project 2011a). Further, the Carbon Disclosure Project acts on behalf of 551
institutional investors that hold US$71 trillion in assets in 2011(Carbon Disclosure

20
Project 2011b). Hence the CDP reflects the growing interest from investor groups for
climate change-related information (Cotter, Najah & Wang 2011). Nevertheless,
voluntary disclosures provide incomplete information (Gray & Owen 1993; Kolk, Levy
& Pinkse 2008; Wiseman 1982). If market demand drives voluntary disclosures, the
incompleteness of disclosures may reflect insufficient demand (Leftwich 1980). For
example, the size of ethical investor groups within Australia may not be sufficiently
large to apply pressure to increase voluntary disclosed information (Haigh & Hazelton
2004).
The Climate Disclosure Standards Board (CSDB) was convened at the World
Economic Forum in 2007 in response to the call for increased clarity of climate change
information (Climate Disclosure Standard Board 2013). A consortium of eight
organisations supports the CDSB. These organisations are CERES, CDP, World
Resources Institute, World Economic Forum, World Council for Business and
Sustainable Development, The Climate Registry, The Climate Group and The
International Emissions Trading Association (Climate Disclosure Standard Board
2013). The Board consists of an Advisory Committee, Technical Working Group and
Secretariat that aim to incorporate climate change information into financial reporting
(Climate Disclosure Standard Board 2013). The CDSB aims to achieve this by
providing a forum, guidance and collaboration with accounting, business, regulatory
and stand setting professionals in a response to a call for standardised reporting and
transparent climate change information (Climate Disclosure Standard Board 2013). The
Board has developed the Climate Change Reporting Framework to provide reporting
guidance (Climate Disclosure Standard Board 2013). It does not introduce a new
standard though seeks to harmonise existing standards with research, analysis and good
practice (Climate Disclosure Standard Board 2013). The use of the Framework is
voluntary though the benefactors of this framework include investors, analysts,

21
government, stock exchanges, companies and accounting firms (Climate Disclosure
Standard Board 2013). However, the CDSB is a recent development and has not
achieved the recognition that the GRI Guidelines or the CDP currently hold despite
providing the underlying basis for the continued development of climate change-related
disclosures (Cotter, Najah & Wang 2011).
2.3 International Jurisdictions
United Kingdom of Great Britain and Northern Ireland and the Republic of Ireland
The United Kingdom of Great Britain and Northern Ireland (UK) became a
signatory to the Kyoto Protocol in 1998 and this was ratified in 2002 and came into
force in 2005 (United Nations Framework Convention on Climate Change 2011f). Both
Scotland and Wales are divisions of the UK (Blair & Bernard 1998). However, the
Republic of Ireland became independent from the UK in 1922 therefore independently
became a signatory to the Kyoto Protocol in 1998. The Republic of Ireland ratified their
commitment in 2002 and this came into force in 2005 (United Nations Framework
Convention on Climate Change 2010c). In 2002 the UK established the first ETS
(Carbonventures 2011) and in 2005 the European Union (EU) ETS was implemented in
the UK (The Government of the United Kingdom 2005). Nevertheless, debate arose as
not all UK members initially chose to follow the path of an ETS.
The Republic of Ireland (herein after referred as Ireland), a member of the UK,
established the Irish National Climate Change Strategy in 2000 and through a
consultation process considered the introduction of a carbon tax as the means through
which emissions could be cut (Stapleton et al. 2006). However, in 2004 Ireland rejected
the introduction of a carbon tax (Stapleton et al. 2006) and followed the path towards an
ETS. Despite the fact that Ireland changed its approach to reduce emissions, Ireland

22
had made commitments under the Kyoto Protocol to contain emissions to 13% above
1990 levels for the years 2008 to 2012 (Environment Protection Agency 2004). In spite
of these commitments, by 2002 Ireland had already breached its goal by 16%
(Environment Protection Agency 2004). This was comparable with Ireland’s economic
growth between 1995 and 2002 (Stapleton et al. 2006). As Stapleton et al. (2006)
indicate, if the market is left to its own devices the market will fail to meet expected
emission cuts. Pearce and Turner (1990) and Tietenberg (2007) argue that this is
sufficient basis for government intervention. Stapleton et al. (2006) suggest that a
carbon tax is a suitable method of government intervention. At the very least, Ireland
was not expected to reach its Kyoto commitments without changes to the current
approach (Stapleton et al. 2006). Participation though in the EU ETS will only cover
50% of the Irish economy’s carbon emissions, and this coupled with the ability to buy
and sell permits suggest an ETS is not expected to provide significant reductions in the
short-term (Stapleton et al. 2006).
There are many reasons proposed as to why a carbon tax would not be
appropriate. For example, a carbon tax would not produce a significant reduction in
emissions; adverse effects on the economy and society would occur; proponents
advocate alternative methods such as an ETS as a better method to cut emissions;
households will be burdened and the increase in oil prices occurring will provide a
dampener on demand (Stapleton et al. 2006). One wonders though, what role the
broader UK community played in moving Ireland’s decision towards an ETS, especially
when economic literature strongly inferred government intervention could play a
significant role in reducing carbon emissions (Stapleton et al. 2006). A well designed
carbon tax gives the government the opportunity to ensure the polluter fully accounts
for the externalities produced during production (Stapleton et al. 2006). Stapleton et al.
(2006) suggest funds raised through taxes can be directed to Ireland’s policy initiatives

23
rather than the purchase of carbon credits and the resulting outflow of capital from the
jurisdiction; hence Stapleton et al. question Ireland’s changed direction.
Meanwhile, the British Government commissioned the Stern Report which was
released on 30 October, 2006 (The UK Treasury 2007). The 700 page report was
significant due to its comprehensive study on economic issues of climate change.
However, the report was greeted with mixed reaction. These events highlight the
controversy embroiled within the UK, surrounding the choice of method to reduce
emissions.
The United States of America (US)
The US became a signatory to the Kyoto Protocol in 1998; however this country
is yet to ratify the Protocol (United Nations Framework Convention on Climate Change
2011g). The US being the largest carbon emitter, has not pledged reductions in
emissions at a national level (Stiglitz 2006). A contentious issue and stumbling block
had been the lack of requirement for developing nations, particularly China to
participate in a deal to cut emissions. However, a recent US-China agreement has been
reached to place constraints on greenhouse gases (Berners-Lee 2014). These two nations
are now making meaningful commitments to cut emissions, by establishing combined
targets and introducing enforcement. The goal is the US to cut emissions by 27% by
2025 and China to reach peak emissions by 2030 (Berners-Lee 2014).
Nevertheless, to date without national regulatory enforcement and targets, US
firms currently use voluntary international and domestic reporting guidelines (US
Environmental Protection Agency 2011), and participate in mandatory reporting under
the Western Climate Initiative (US Environmental Protection Agency 2009) or the
Regional Greenhouse Gas Initiative (Australian Government 2012). Andrew et al.
(2010) note 23 US states operate under these schemes. In addition, standardized carbon

24
data collected by the U.S. Environmental Protection Agency and the California Air
Resources Board will soon be publicly available to interested parties (Griffin & Sun
2012).
However, the US’s schemes have not operated without controversy, seeing
dramatic price fluctuations for oxides of nitrogen. In 1999, prices in the Ozone
Transport Commission’s north eastern states were around $8,000 per ton falling to
$1,000-$2,000 per ton, then jumping again in 2003 before dropping back to $2,000 per
ton (Metcalf 2009). The EPA’s Acid Rain Program saw prices fluctuate from $900 per
ton of oxides of sulphur to $1,600 per ton in 2005 (Metcalf 2009). Likewise the
California Regional Clean Air Incentives Market saw prices rising from just under
$5,000 per ton to $90,000 per ton in 2000 (Metcalf 2009). Political support was eroded,
constituent dissatisfaction increased with the uncertainty and volatility of permit prices
and the California Regional Clean Air Incentives Market Regulators relaxed the permit
cap (Metcalf 2009). In addition, the fossil fuel lobby in the USA destabilised potential
national action towards climate change that resulted with government opposing a
national carbon reduction program (Vasi 2007).
Canada
The Kyoto Protocol was signed by the Canadians in 1998, ratified in 2002 and
finally coming into force in 2005 (United Nations Framework Convention on Climate
Change 2011d). Prior to Canada being a signatory to the Protocol, the Voluntary
Challenge and Registry provided one path that environmental interest could be signalled
to stakeholders (Brouhle & Ramirez Harrington 2010). However, by 2004 the reporting
regime had changed to a mandatory reporting environment and the Mandatory
Greenhouse Gas Reporting Program (Brouhle & Ramirez Harrington 2010). By 2007
five American states initiated the Western Climate Initiative to reduce greenhouse gases
25
with four Canadian Provinces joining the Initiative by 2008 (Western Climate Initiative
2011). A cap-and-trade program is due to commence in 2012 through this Initiative
(Western Climate Initiative 2011).
European Union (EU)
The EU became a signatory to the Kyoto Protocol in 1998 and this was ratified
in 2002 and came into force in 2005 (United Nations Framework Convention on
Climate Change 2011e). The EU made a commitment to reduce emissions by 8% below
1990 levels during 2008 to 2012 (Stapleton et al. 2006). In 2005 the EU introduced
what is the largest ETS, with the aim of establishing a global carbon market to avoid
incompatibilities between domestic ETS’s that were being developed (Braun 2009). A
pilot phase from 2005 to 2007 proceeded the first commitment period 2008 to 2012
(Skjaerseth & Wettestad 2008), the first reporting period under the Kyoto Protocol. The
EU’s emissions reductions were to be achieved using a pooled basis where member
states were assigned different targets, for example Ireland was allotted a target of 13%
above the 1990 levels (Stapleton et al. 2006). Tradeable allowances were allocated to
firms for greenhouse gas emissions. In 2009, Europe’s emission levels were 11 per cent
below 1990 levels and on track to meet the EU’s target of 20 per cent reduction by 2020
(CPA Australia 2009). Nevertheless the scheme was not without issues, with more
allowances being issued than necessary, resulting in a drop in the carbon price
(Skjaerseth & Wettestad 2008).
An ETS is synonymous with price volatility and uncertainty (Metcalf 2009). The
EU’s ETS has seen the price of carbon permits fluctuate from highs of 32.90 euros
collapsing to 8.20 euros compounding the difficulties for businesses to plan long-term
investments (Metcalf 2009). In addition, a sharp increase in gas prices removed
incentive for electricity producers to transfer from coal to gas resulting in only modest

26
abatement achievements during the period 2005-2006 (MacKenzie 2009). In addition,
the EU ETS emissions in 2008 exceeded the set ‘cap’ by 145 million tonnes (Carbon
Market Data 2009). This fact suggests government intervention is necessary to support
the success of an ETS to reduce emissions (Andrew, Kaidonis & Andrew 2010).
Meanwhile the success of the EU’s ETS results in mixed reactions (Skjaerseth &
Wettestad 2008). Suspicion exists. The right-wing dislikes emissions caps and the left-
wing opposes the use of the market to attempt to reduce emissions (MacKenzie 2009).
Questions are raised about the capability of the market to successfully achieve
abatement (MacKenzie 2009). The carbon market is an experiment in action
(MacKenzie 2009). Design flaws are evident and the necessity to increase its efficiency
is essential to be able to include a carbon market with a suite of tools to effectively
combat climate change and to counter opponents to the scheme (MacKenzie 2009).
Nevertheless, 27 European countries have participated in an ETS (Andrew, Kaidonis &
Andrew 2010).
New Zealand
New Zealand became a signatory to the Kyoto Protocol in 1998 and ratified the
Protocol in 2002 and this came into force in 2005 (United Nations Framework
Convention on Climate Change 2011c). However, it was not until 2009 that New
Zealand established an ETS (New Zealand Government 2009). A number of factors
such as a change of government in 2008, the global recession and Australia announcing
a Carbon Pollution Reduction Scheme had influences on the development of an ETS
(Bougen 2009). Legislation was successfully passed prior to the Copenhagen Summit;
hence New Zealand was seen to take action on climate change while retaining the clean
image of their tourism and food and beverage industries (Bougen 2009).
27
2.4 Australia
This thesis focusses on the period 2005 to 2011. This period is significant as it
highlights the changing social attitudes towards action on climate change. The changing
social attitudes are set within the background context of government’s neoliberal
political views. The ideologies of neoliberalism espouse belief in the free markets with
only minimal government intervention to oversee the markets (Andrew, Kaidonis &
Andrew 2010). Government’s role is to provide the institutional framework that
supports a legal system, property rights, free trade and free markets (Andrew, Kaidonis
& Andrew 2010). It was evident that the Australian Government took a neoliberal view
to action on climate change.
2.4.1 Government
Howard Years
The Howard Government was a Liberal-National Coalition which held office
from 3 March, 1996 until it was defeated on 24 November, 2007 (Australian Electoral
Commission 2011). It was the second longest government under one prime minister in
Australia’s political history and covered four terms (Australian Electoral Commission
2010). The conservative Howard Government was reluctant to address the issue of
climate change. Despite Howard’s lack of support for the Kyoto Protocol, he did
establish a task group to investigate the issue.
The Howard Government in 2006 established a Task Group on Emissions
Trading chaired by Dr Peter Shergold. The Shergold Report recommended that
government set a cap limiting greenhouse gas emissions and outlined a cap-and-trade
model to be implemented. On 17 July, 2007 following the release of the report, the
Prime Minister John Howard announced that a ‘cap-and-trade’ ETS would be
introduced in Australia to aid the reduction of domestic greenhouse gases (Wilson

28
2007). The market was expected to regulate the reduction of emissions despite the fact
that the markets do not account for pollution and consequently the impact of climate
change (Wilson 2007). Nevertheless, Government would set the ‘cap’ and oversee the
mechanisms of an ETS (Andrew, Kaidonis & Andrew 2010).
The Council of Australian Governments, an intergovernmental forum consisting
of the prime minister and state, territory and local government ministers, agreed that an
efficient underlying reporting mechanism would be required, a national greenhouse and
energy reporting system (Department of Climate Change 2009). The National
Greenhouse and Energy Reporting (NGER) Act 2007 received assent in Parliament on
28 September, 2007 (Department of Climate Change and Energy Efficiency 2007).
However, businesses remained confused and uncertain about the path ahead.
The Rudd Government
In 2007, leading up to the federal elections, Kevin Rudd and the Labor Party
took global warming and action on climate change as a major political platform in the
then forthcoming elections (Gilby 2008). The Labor Party won the majority in the
House of Representatives and took office on 3 December, 2007 (AustralianPolitics.com
2010). The Party’s success was due in part to Labor’s policies aligning with the
changing social attitudes towards climate change (Jacobs & Lodhia 2011). Social
attitudes were now being reflected at a national level (Rankin, Windsor & Wahyuni
2011). Within a few days of being in office Kevin Rudd commenced reform by
immediately ratifying the Kyoto Protocol (Jacobs & Lodhia 2011; Lawrence 2009).
Commitments were made to reduce emissions to 60% of 2000 levels by the year 2050
(Mete, Dick & Moerman 2010). The ratification came into force in 2008 (United
Nations Framework Convention on Climate Change 2011b). This action was greeted

29
with applause from the post-Kyoto talks that were being held at the Bali conference at
that time (The Age 3 December, 2007).
Government policy was required to provide a framework to sustain an efficient
transition to a low carbon economy while providing the signals and incentives for
businesses to compete efficiently in the domestic and overseas markets. To establish
public policy the government commissioned the Garnaut Report to guide its path
(Jacobs & Lodhia 2011). The Garnaut Climate Change Review was an independent
study by economist Professor Ross Garnaut. The final report was delivered to the Prime
Minister in 2008 (Garnaut 2008). After the Australian Government assessed the Garnaut
Review, the government came to the conclusion that an economy-wide carbon signal
would be the main method of delivering emissions abatement in Australia. This view
was in keeping with the Garnaut Review and the preceding Shergold and Stern reports
(Kelly 2010) and prevailing neoliberal ideology (Andrew, Kaidonis & Andrew 2010).
The Green and White Papers and the Australian Energy Resource Assessment
followed the NGER Act 2007. These reports and papers were designed to establish the
basis for a Carbon Pollution Reduction Scheme (CPRS) which Kevin Rudd proceeded
to introduce (Lawrence 2009). The CPRS represented the Australian version of an ETS.
However, it was knocked back three times in the Senate and then delayed with the
pending federal elections in 2010. McKinsey & Company (2009) noted that despite a
government having the potential to reduce emissions; it was another matter for a
government to reach agreement on the appropriate policies, especially in a carbon
intensive economy such as Australia with a heavy dependence on fossil fuels for
domestic use and export (Mete, Dick & Moerman 2010).
The introduction of a CPRS in Australia was a controversial issue as opponents
promote the benefits of coal. The importance of coal underpinning the Australian

30
economy, and the standard of living of constituents has been well expounded in the
media and reflected in election polling. On 21 August, 2010 the federal elections were
held, this time with Julia Gillard leading the Labor Party. The final election statistics
were published on 17 September, 2010 (Mackerras 2010). Australia had a hung
parliament with Labor securing the balance of power with support from the Greens and
two independents to form a government. Mackerras (2010), a visiting fellow in political
science at the Australian Defence Force Academy interpreted the results as representing
the division between mining and non-mining Australia. Significant controversy
surrounding the implementation of an Australian ETS has continued.
Nevertheless, it was not until 2011 that the Labor Government announced the
introduction of a carbon price mechanism (Australian Labor Party 2011), a two stage
plan starting with a fixed price from 1 July, 2012. The fixed price precedes the
introduction of an ETS which is expected to commence within three to five years of this
date (Australian Labor Party 2011). The internalisation of an externality into business
operations that previously was not accounted for had commenced. An ETS has
implications for current reporting practices.
The Opposition Party
To emphasise the political controversy surrounding the introduction of an ETS,
diverse opinions existed on both sides of government on the appropriate action to
implement. These diverse opinions were particularly evident coming from the federal
opposition. Malcolm Turnbull was the leader of the Coalition from September 2008
until 1 December, 2009 (Parliament of Australia 2011). After receiving the go-ahead
from his party, he negotiated improvements in the impending legislation on the CPRS
with the Rudd Government (Turnbull 2009). As a member of the Liberal Party he
believed in market forces (Turnbull 2010) and strongly believed that an ETS was the

31
cheapest method to reduce carbon emissions (Turnbull 2010). However, dissidents
within his own party ranks and opposition from the Nationals to follow his leadership
were seen as attempts to gain votes without providing a real political direction on
climate change (Hewson 2010; Oakes 2009). A party room vote removed Malcolm
Turnbull as leader of the opposition and replaced him with Tony Abbott who won by
one vote (Balogh 2009). The Liberals continued on with a secret ballot to reverse the
climate change agreement that had been reached between Turnbull and the Government
(Balogh 2009).
The new opposition leader, Tony Abbott disputed the choice of method to
reduce carbon emissions. Tony Abbott and the Federal Opposition’s alternative plan
was the Climate Change Policy Action that could achieve results through energy
efficiency in buildings, transport and industry lowering carbon emissions to acceptable
levels (The Coalition 2010). This included tree plantings, funding electricity generators
and lowering emissions in resource sectors, storing carbon underground and providing
incentives for solar power and research into algae storing carbon (The Coalition 2010).
This would be financed by the establishment of an ‘Emissions Reduction Fund’ which
was expected to cost $3.2 billion. The fund would provide incentives while not
imposing an emission cap or penalties for business (Rodgers 2010). This approach was
contrary to Parry and Pizer’s (2007) views that government action was needed to drive
the transition to a low carbon economy, rather than the government providing little
guidance and leaving actions solely to the market to deal with the issue. However
debate about the advantages and disadvantages of a carbon tax as an alternative policy is
not significantly evident (Andrew, Kaidonis & Andrew 2010). Introducing a new tax is
an issue for any political party founded on neoliberal ideology of small government and
low taxes (Andrew, Kaidonis & Andrew 2010; Yoram 2010), regardless of whether
they hold power or not. Historically, markets fail to address the issue of climate change

32
(Andrew, Kaidonis & Andrew 2010). The verdict is still out on whether an ETS can
contain global warming by 2 degrees centigrade and it is unknown how the bottom line
will be impacted (MacKenzie 2009).
2.5 Australian Regulatory Environment
Nevertheless, the importance of mandatory disclosures is increasing due to
changing societal expectations and the need for firms to account for environmental
performance and economic activity. In the absence of disclosures stakeholders incur the
cost while the polluters benefit.
Voluntary disclosing carbon emissions information means firms incur costs to
do so. To provide the information, firms adopt some form of measurement, a process to
monitor and to publish the data. These systems require financial input to establish. In
addition, there is the cost of proprietary property depending on the type of information
disclosed (Fishman & Hagerty 2003). So there is incentive for some firms not to
disclose. These firms have the incentive to earn higher profits if they do not incur the
costs of voluntary disclosing (Fishman & Hagerty 2003). However, firms will disclose
when the marginal benefits outweigh the marginal costs (Fishman & Hagerty 2003).
Nevertheless, the voluntary disclosures can be questioned if the data is not consistent
and comparable across and between industries.
Under mandatory disclosure the choice whether to disclose or not is removed.
Firms are required to disclose and incur the costs to disclose (Fishman & Hagerty
2003). It is expected then that mandatory disclosures would be opposed by firms while
relevant stakeholder groups would support the introduction of mandatory disclosures
(Fishman & Hagerty 2003). The debate between business and government over the
introduction of a scheme to reduce carbon emissions and to provide the required
disclosures highlights opposition by firms, due in part to increasing costs. However,

33
mandatory disclosures are more likely to occur when the information or the form of
information is difficult to understand (Fishman & Hagerty 2003). For example, it is
difficult to compare carbon emissions as per one million dollars of production with
passenger seats or per tonne of production. Consistency in reported data permits
relevant stakeholders to compare data across industries, within industries and between
countries, addressing the needs of financial markets and government obligations. If
disclosures are mandatory, the polluter has incentive to reduce their level of pollution
which reduces the costs borne by stakeholders. Therefore the importance of mandatory
disclosures has changed over time and increased.
2.5.1 Corporations Act and ASX listing rules
Mandatory disclosures in the Director’s Report were introduced in Australia
during 1998 when the Corporations Law was amended to include section 299(1)(f)
(Cowan & Gadenne 2005).This was later revised in 2002 as the Corporations Act 2001
(Cth) (Cowan & Gadenne 2005; Frost 2007). Section 299(1)(f) (Commonwealth of
Australia 2011, p. 42) states:
‘if the entity’s operations are subject to any particular and
significant environmental regulation under a law of the Commonwealth or
of a State or Territory – give details of the entity’s performance in relation
to environmental regulation.’
The Australian Securities and Investment Commission (ASIC) enforces the
Corporations Act 2001 and penalties up to A$200,000 for non-compliance apply under
section 344 (Commonwealth of Australia 2011). Poor environmental practices led to the
introduction of s299(1)(f) and it was found that mandatory reporting did provide
positive economic, environmental or organisational benefits (Cowan & Gadenne 2005).
Mandatory reporting also provided impetus for firms to improve their environmental

34
policies (Cowan & Gadenne 2005). However, the Corporations Act 2001 did not
specifically refer to the issue of climate change (Cotter, Najah & Wang 2011).
Even though the terminology of this legislation was considered ambiguous by
some without the clarification of words such as ‘significant’ and ‘details’, others
regarded it as a flexible approach to reporting (Cowan & Gadenne 2005). Nevertheless
s299(1)(f) was considered controversial due to its ambiguous nature and therefore
opposition came from both industry and government (Frost 2007). Further, section 299
was problematic as this legislation stimulated a standardised reply without improving
the usefulness or comparability of disclosed information (Adams & Frost 2007). In spite
of the issues surrounding section 299, Frost (2007) found evidence that mandatory
reporting did increase disclosures.
In 2003 the Australian Stock Exchange introduced the Principles of Good
Corporate Governance and Best Practice Recommendations (Australian Securities
Exchange 2011). Ten Principles were listed under the initial guidelines which were
reduced to eight Principles when the second edition was released in 2007(Australian
Stock Exchange 2006). The second edition was amended in 2010 (Australian Securities
Exchange 2011). However, the Principles offer little guidance for disclosing
environmental information or carbon emissions other than recommendations made
under ‘Principle 3: Promote ethical and responsible decision-making’, ‘Principle 7:
Recognise and manage risk’ and defining ‘Material business risks’ under the Glossary
(ASX Corporate Governance Council 2007).
Even though the Principles outline areas of business risk, the scope of the risk,
how risks should be disclosed and exactly what is disclosed for environmental
information and carbon emissions are not presented (Cotter, Najah & Wang 2011).
Reference has been made to the materiality of business risks though there is no

35
guidance on ‘significant’ environmental information as defined by the Corporations
Act. No guidance is offered in the Principles, on whether significant environmental
information should be disclosed to stakeholders. Only if significant environmental
information meets the ‘materiality’ threshold will it be disclosed. Many stakeholders
directly bear the material risks of the firm without knowledge about the impact of
significant environmental information.
2.5.2 State & Territories Environmental Legislation
Traditionally the States provide the main environmental regulations and
enforcement through statutory bodies - state environmental protection authorities. The
Victorian Environmental Protection Authority administers the Environment Protection
Act 1970 (Victorian Government 1970). This was subsequently followed by Western
Australia in 1971 with the introduction of an Environmental Protection Authority
(Environmental Protection Authority 2011). This comes under the authority of the
Western Australian legislation – the Environmental Protection Act 1986. The
responsibilities of the New South Wales Department of Environment, Climate Change
and Water are derived from a number of pieces of state legislation including -
Protection of the Environment Administration Act 1991 (Department of Climate Change
and Water 2011). South Australia commenced with an Environmental Protection
Authority which was established under the Environment Protection Act 1993
(Environmental Protection Authority South Australia 2011). The following year
Queensland, Tasmania and the Northern Territory all followed suit with their respective
legislation. However, to ensure consistent national representation between the States,
the Council of Australian Government established the National Environment Protection
Council in 2001 (National Environment Protection Council 2011b). It was established
under the National Environment Protection Council Act 1994 (National Environment
Protection Council 2011a) and led the way for further legislation.

36
2.5.3 National Pollution Inventory and Energy Efficiency Opportunities Acts
The National Environment Protection Measures were initiated between the
Commonwealth, State and Territories to protect and manage the environment and
address the concerns of the community about toxic substances (Australian Government
2011b). This legislative framework was the basis for The National Environmental
Protection (National Pollution Inventory) Measure which was the first piece of
legislation that established national objectives for the environment (Australian
Government 2011b). After extensive consultation throughout the community, industries
and government, the National Pollution Inventory (NPI) was established by the National
Environment Protection Council and came into force in 1998 (Australian Government
2011b).
Companies were expected to report on thirty-six of the initial ninety reportable
substances in the first two voluntary reporting periods (Cowan & Deegan 2011).
Mandatory reporting finally commenced in 2001 and full details of ninety substances
were expected to be reported (Cowan & Deegan 2011). In 2011, the NPI lists 93
substances which are required to be measured, monitored and reported (Australian
Government 2011a). The importance of this legislation is to increase industry
awareness, gauge improvements in reducing toxic substances, encourage the use of
cleaner technology, increase environmental quality, address the public’s right-to-know
and aid government environmental policies decisions (Australian Government 2011a).
The legislation did not provide penalties for pollution; rather government relied on
adverse public reaction to encourage operational changes (Howes 2001). However, even
though this information was made publicly available, Ernst & Young (2003) suggested
investors were unlikely to know about this data. Further legislation was established.

37
The Energy Efficiency Opportunities Act 2006 was effected from 1 July, 2006
(Australian Government 2006). The aim of this legislation was to identify and evaluate
energy-efficiency opportunities that arose for firms and then to encourage the
implementation of those opportunities (Australian Government 2006). The emphasis of
this legislation was not on pollution control, rather encouraging the adoption of energy-
efficient practices. However, the reporting environment continued to evolve during
2006 with the mooting of ideas that were eventually outlined in the NGER Act.
2.5.4 National Greenhouse and Energy Reporting (NGER) Act
The establishment of the NGER Act 2007 introduced mandatory corporate
reporting for greenhouse gas emissions on corporations to government from 1 July,
2008 (Rankin, Windsor & Wahyuni 2011). These corporations and/or individual
facilities are likely to be heavy emitters of greenhouse gases and are therefore obliged to
report emission data to government. Prior research for example, has established the
chemical, oil, electricity, steel and paper industries as heavy polluting industries that are
highly sensitive to environmental legislation (Patten 2002). The onus falls to
corporations to register under the Act when emissions exceed set threshold limits.
Penalties apply for failure to register if the corporation meets or exceeds the reporting
thresholds (Department of Climate Change and Energy Efficiency 2012).
Essentially, corporations are required to measure and record emissions data long
before any liability to report occurs. Therefore the reporting implications of the Act on
corporations include the accurate measuring, monitoring, recording and archiving of
data for a period of at least five years as well as the reporting of the data. The reporting
function of information gathered under this uniform reporting regime is used to inform
both government in their policy making, and the Australian public. The information
reported under the Act also supports Australia’s international reporting responsibilities

38
and assists other programs and activities introduced by the Commonwealth, State and
Territory governments. Part of the aim is to avoid the duplication of reporting between
the jurisdictions (Department of Climate Change and Energy Efficiency 2007). The Act
is intended to provide a foundation for an ETS by outlining the reporting requirements
for emissions data (Department of Climate Change and Energy Efficiency 2007). These
requirements are subject to periodic reviews and the first review is due to commence 30
June, 2016 and to be completed by the 31 December, 2018 (Department of Climate
Change and Energy Efficiency 2012). However the NGER Act does not mandate
climate change disclosures in annual or sustainability reports (Cotter, Najah & Wang
2011).
The National Greenhouse and Energy Reporting Act 2007 define liable and
controlling corporations that have reporting obligations. Liable corporations are those
controlling corporations that have reached the reporting thresholds outlined by the Act.
Controlling corporations are those that have the authority to implement both operating
and environmental policies (Department of Climate Change and Energy Efficiency
2012). A controlling corporation that has been incorporated in Australia includes a
group that consists of the controlling corporation and its subsidiaries. Otherwise if the
corporation has not been incorporated in Australia, then subsidiaries are not included
(Department of Climate Change and Energy Efficiency 2012).The purpose is to capture
greenhouse gas data from corporations that are directly operating within the Australian
jurisdiction.
The reporting threshold in the first reporting year 2008/2009 is the carbon
dioxide equivalent of 125 Kt CO2-e equivalent carbon emissions or the consumption
and/or production of 500 TJ of energy. This threshold is lowered to 87.5 Kt CO2-e
equivalent carbon emissions or consumption and/or production of 350 TJ of energy in

39
the second reporting year (Department of Climate Change and Energy Efficiency 2012).
These are the first two implementation years of the reporting requirements outlined by
the Act. The third year and thereafter, the reporting threshold is reduced to 50 Kt CO2-e
equivalent carbon emissions or the consumption and/or production of 200 TJ of energy
which captures a larger number of corporations releasing carbon emissions (Department
of Climate Change and Energy Efficiency 2012).
Carbon emissions include emissions that are directly and indirectly released by a
corporation and are defined as Scope 1 and Scope 2 emissions respectively. Scope 1
emissions are directly released whereas Scope 2 emissions are indirectly released
through the purchase of goods and services, such as electricity, heating cooling and
steam, produced by other corporations. Scope 2 emissions for one corporation are Scope
1 emissions for another (Clean Energy Regulator 2012b). Thresholds also include
energy production and energy consumption and are set at 500 terajoules or more for
2008/2009, 350 terajoules or more for 2009/2010 and 200 terajoules or more from
2010/2011 and thereafter (Department of Climate Change and Energy Efficiency 2012).
The reporting obligations also extend to facilities that have reached 25
kilotonnes or more carbon dioxide equivalent or 100 terajoules or more in energy
production or consumption for the reporting period (Department of Climate Change and
Energy Efficiency 2012). The definition of a facility, as outlined by the Act, is an action
or series of actions that forms a single task or operation that includes the emission of
greenhouse gases, energy production or consumption (Department of Climate Change
and Energy Efficiency 2012). Therefore once the corporation/facility has reached the
reporting thresholds in a reporting period, also known as the trigger year, the
corporation/facility has an obligation to report to the NGER register.
40
The Act defines greenhouse gases as: carbon dioxide, methane, nitrous oxide,
sulphur hexafluoride, a specified hydrocarbon, a specified perfluorocarbon or a
prescribed gas (Department of Climate Change and Energy Efficiency 2012). The
emissions of all the different contributing designated fuels and gases are expressed as
kilotonnes of carbon dioxide equivalent by the application of a conversion factor
outlined in the Act. (Department of Climate Change and Energy Efficiency 2012). In
other words, greenhouse gases are converted to the equivalent amount of global
warming carbon dioxide (Clean Energy Regulator 2012b). The measurement of carbon
emissions Scope 1 & 2, energy production and consumption may be determined by the
Minister to meet the reporting requirements of the Act (Department of Climate Change
and Energy Efficiency 2012).
As a consequence of the reporting obligations, the onus falls on corporations to
maintain records to enable the corporation to report accurately and to provide evidence
to the Regulator that the corporation has met its obligations. Civil penalties apply for
failure to register, to report accurately, to maintain records for a period of five years
following the end of the reporting year and other relevant conditions outlined in the Act
(Department of Climate Change and Energy Efficiency 2012). In addition, if the
regulator considers the corporation in any way has contravened the regulations then an
audit can be instigated for all or part of the reporting obligations. The regulator can
appoint officers to monitor reporting compliance (Department of Climate Change and
Energy Efficiency 2012). Audit requirements are not stipulated though the onus to
report accurately falls to the corporation or civil penalties apply (Department of Climate
Change and Energy Efficiency 2012).
In addition, the Act also supports the Clean Energy Act 2011 by requiring
registration, reporting and recording of information (Department of Climate Change and

41
Energy Efficiency 2012). Essentially, the Act provides a single national reporting
framework and an avenue to distribute information to stakeholders (Department of
Climate Change and Energy Efficiency 2007). In summation, the information available
through the register provides greenhouse gas data reported by the corporations to
government. Data is measured using methods agreed on by the Regulator and captures a
diverse sample of firms from a diverse range of industries. Data reported under the
NGER Act provides a reliable measure of environmental performance.
A number of key dates are listed under the NGER Act 2007. The end of each
reporting period is 30 June. Corporations reaching the reporting threshold by this date
are required to register as a reporting corporation by 31 August, if they have not
previously done so. The due date for reports to be submitted to the regulator is 31
October. The regulator then has the responsibility to publish the greenhouse gas
emissions, energy consumption and production data by the 28 February in the following
year (Department of Climate Change and Energy Efficiency 2012) on the Clean Energy
Regulator’s website. Information released on the website is an avenue where the public,
investors, and other stakeholders can access data. However, corporations can make an
application to restrict information being published due to the information possessing
commercial value or trade secrets (Department of Climate Change and Energy
Efficiency 2012). In these cases, government receives greenhouse gas data to meet the
government’s reporting obligations though the information is restricted to others.
Deregistration occurs when it is unlikely that the controlling corporation will meet the
reporting threshold for the current reporting period and the next two reporting years
(Department of Climate Change and Energy Efficiency 2012).
Australia’s international reporting obligations outlined under the Kyoto Protocol
commenced in the first reporting period 2008 to 2012. These steps led the way for the

42
Government to introduce a Bill in Parliament to establish an Australian ETS - the
Carbon Pollution Reduction Scheme. Further preliminary steps towards an ETS soon
followed. NGER data will be the basis to determine obligations under a future ETS.
2.6 An alternative Market Mechanism – a Carbon Tax
Another available option to reach renewable energy targets and cut emissions is
the introduction of a carbon tax. A carbon tax is the simplest method of enforcing a toll
on emissions (Garnaut 2008; Yoram 2010). Both an ETS and a carbon tax are market
based approaches that provide incentives for firms to develop alternatives to current
fuels and processes and in this regard have advantages over regulation (Yoram 2010). A
carbon tax is straightforward to implement and does not require governments to make
discretionary decisions on who are allowed to emit thereby avoiding the political
pressures that create economic distortion (Garnaut 2008). Taxation systems already
exist in developed countries. A carbon tax is more visible and transparent, the revenues
raised can be channelled back into society and government stands accountable for the
collection and distribution of revenues (Andrew, Kaidonis & Andrew 2010; Bluffstone
2003). Brook and Kelly (2009) are of the opinion that a carbon tax provides greater
transparency, is more direct and easier to forecast.
The carbon tax focusses on reducing emissions by taxing quantities. However,
the effectiveness of the tax depends on the efficiency of the jurisdiction’s administration
(Bluffstone, 2003) and remains a challenge for a government operating within
neoliberal ideology (Yoram 2010). A discussion about a carbon tax as an alternative
mechanism to reduce emissions does not figure prominently in Australian political
deliberations (Brook & Kelly 2009).
In addition, Garnaut (2008) does not expect a carbon tax to produce abatement
outcome, though expects it will increase compatibility issues with carbon prices

43
between different jurisdictions. Regardless of whether it is a carbon tax or cap-and-trade
system, the introduction of carbon pricing raises the issue of border adjustments against
countries that do not implement immediate action. Border adjustments raise concerns
regarding the introduction of costly protectionism and trade tariffs (Bhagwati, 2004).
Ultimately, government intervention is required regardless of the approach adopted,
whether an ETS or carbon tax (Andrew, Kaidonis & Andrew 2010).
2.7 Australia’s approach under the Abbott Coalition Government
The Liberal National Coalition won the federal election in 2013. The climate
change policy platform offered by the Coalition Government is the Climate Change
Policy Action plan (The Coalition 2010). The plan offers incentives that rely on
technology advances to reduce greenhouse gases rather than penalties or emission caps
(Rodgers 2010). Tony Abbott’s focus is clearly on production and economic growth
rather than climate change issues.
At the G20 summit held in Brisbane, Mr Abbott discouraged the inclusion of
climate change talks on the G20 agenda (Viellaris & Meers 2014). However in light of
the recent US-China agreement the Abbott Government instead faced pressure to take
tougher action on climate change (Viellaris 2014).
2.8 Carbon management, policy and reporting
Currently, no accounting standard is available that mandates carbon emission
reporting requirements despite sustainability and carbon accounting are growth areas in
the accounting discipline (Birt 2014). However, the need to implement carbon reduction
programs and increase carbon emission reporting is being driven by the demands of
institutional investors, the need to create value in capital markets and the influence of
contracting and operational incentives for carbon management (Hartmann, Perrego &
Young 2013). Even though carbon accounting can identify cost savings and

44
opportunities, difficulties arise in the quality of reporting when there is a lack of
standard methodologies, the lack of environmental expertise by accounting auditors and
when difficulties arise, assessing environmental costs and valuing liabilities
(Ratnatunga & Jones 2012). As a result, significant financial implications occur with
the uncoordinated approaches, divergent practices and conflicting views regarding
carbon accounting (Ascui & Lovell 2011; 2012; Burritt, Schaltegger & Zvezdov 2011).
Haigh and Shapiro (2012) consider potential investment opportunities sourced from
carbon reports are not yet realised by investors. Therefore this thesis focusses on
identifying the changes in voluntary carbon emission reporting over time and the
determinants behind these voluntary disclosures within the changing regulatory
environment in Australia.
2.9 Chapter Summary
The impact of carbon emissions on the global community has generated rigorous
debate on the appropriate action for countries and firms to initiate. An underlying theme
of this debate, both internationally and nationally, is the reporting of emissions as a
basis for organisational, national and international policy implementation to reduce
carbon emissions and address global warming and climate change. Consequently, the
Australian regulatory environment is changing and is placing a new focus on reporting
disclosures to support Australia’s international reporting obligations, to contribute
action on climate change and provide a basis for a potential carbon market. Inevitably,
regardless of the path taken to cut carbon emissions or utilise offset mechanisms, timely
and accurate reporting disclosures will lie at the basis of measuring and gauging
progress. The NGER Act 2007 provides the reporting framework for firms to report to
government; however, it does not address the informational requirements of investors.
Nevertheless, the influence of regulatory reporting is expected to spill over to voluntary
disclosures in the annual and stand-alone reports. Likewise the disclosures in the annual

45
reports will assist investors to gauge the risks faced, the opportunities available and the
adaptabilities of firms in a carbon constraint environment. The following chapters
position this thesis in context of voluntary disclosure literature and the theories that are
used to explain motivations to voluntarily disclose.

46
3 Literature Review
3.1 Introduction
Voluntary disclosures are the release of a firm’s economic, social and
environmental information to its stakeholders when such information is not required by
any regulation (Deegan 1995). Various channels convey voluntary information such as:
stand-alone reports, voluntary reporting initiatives such as the CDP, websites and
annual reports (Simnett & Nugent 2007). The voluntary nature of disclosures and the
numerous methods available to disclose are two factors that contribute to the varied
range of research on voluntary disclosure.
Accordingly, prior research is extensive and offers wide-ranging explanations
for voluntary disclosures depending on the theoretical perspective or the analytical
method applied. For example, Reid and Toffel (2009) identify shareholders’
engagement with the firm and the threat of regulatory intervention as factors that
contribute to a firm increasing its voluntary disclosures. Reid and Toffel (2009) develop
the findings by using the theory of social activism and organisational change and the
application of regression analysis. Alternatively, a firm may partake in corporate
socially-responsible reporting by voluntarily disclosing environmental information, as it
is perceived that the firm will accrue benefits by doing so (Branco & Rodrigues 2006).
Branco and Rodrigues come to this conclusion by applying a qualitative analysis to the
relationship between corporate social responsibility reporting and the acquisition of
intangible resources such as employee skills and morale and corporate reputation. The
research is informed through the use of a resource-based perspective, legitimacy and
stakeholder theories. This example lightly touches on the various contexts and diverse
research questions that drive investigation within the field of voluntary disclosures
(Cotter, Lokman & Najah 2011).

47
A single theory to guide research into voluntary disclosures has not been
established. Consequently, a large number of theories used either singularly or in
unison, have been applied in different contexts in an attempt to understand the complex
nature of these types of disclosures. The diverse range of theories, apart from those
already mentioned, also include voluntary disclosure theory, collective shareholder
engagement, information asymmetry, institutional theory and popular theories such as
legitimacy, stakeholder, signalling, proprietary cost, political economy of accounting
and agency (Cotter, Lokman & Najah 2011). As is evident, the choice of one specific
theory to provide a comprehensive explanation for voluntary disclosures currently does
not exist.
Hence the purpose of this review of the literature is to provide a brief overview
of the voluntary disclosure literature and specifically, voluntary carbon emission
disclosures, to highlight the varied nature of research, the theories and methods used.
Common and emerging themes are explored to identify discrepancies in current
research.
The next section commences with an international focus on voluntary
disclosures followed by research conducted within Australia. However, the current
research specifically looks at one aspect of voluntary disclosures, carbon emissions;
hence a narrower focus is then presented, one which deals with voluntary carbon
emissions disclosure occurring overseas followed by research with an Australian
context. The interest in voluntary carbon emission disclosures in Australia is growing,
especially as Australia is traditionally a carbon economy. Investor knowledge about a
firm’s carbon emissions will help guide the direction for capital investment. Even so,
research to date remains limited. The chapter concludes with a brief summary.

48
3.2 Overview on Voluntary Disclosures
3.2.1 Overseas
Work on voluntary disclosures commenced in the 1960s and 1970s (Buzby
1975), however early studies provide mixed results in identifying an underlying
explanatory variable for voluntary disclosures. Buzby (1975) believes Cerf (1961)
conducted the first empirical research into factors attributable to disclosures. Cerf’s
research indicates positive relationships exist between listing status, asset size and the
number of stockholders and voluntary disclosures. The main explanatory variable Cerf
notes is asset size (Cerf 1961). Singhvi and Desai (1971) extend Cerf’s research though
find their results differ. Singhvi and Desai (1971) suggest listing status is the
explanatory variable rather than asset size.
Since the commencement of research into voluntary disclosures many reasons
are offered to explain why firms disclose information. Reasons include: to achieve the
appearance of doing the socially acceptable thing (Friedman 1962), to manage the
firm’s relevant public image (Evan & Freeman 1988; Neu, Warsame & Pedwell 1998;
Roberts 1992; Ullmann 1985), to counter threats to the firm’s legitimacy (Patten 1992),
to demonstrate accountability and responsibility (Donaldson & Preston 1995; Freeman
& Reed 1983; Hasnas 1998) and to reduce the cost of capital (Cho & Patten 2007; Lev
& Penman 1990). In addition, prior literature suggests motivations for voluntary
disclosures also include reducing transaction costs, avoiding adverse selection by
shareholders and reducing potential legal costs associated with negative stock price
responses to earnings announcements (Lang & Lundholm 1993; Skinner 1994). Further,
research finds that voluntary disclosures are associated with larger firms (Gray & Owen
1993) that are subject to increased scrutiny (Allen 1993) and this results in only general
details (Wiseman 1982) or positive news (Allen 1993). Subsequently, prior research

49
highlights a diverse range of explanations for voluntary disclosures emphasizing the
scope for continuing research.
In addition, prior research notes voluntary disclosures tend to be inconsistent
and incomplete, effectively reducing the comparability of disclosures between firms
(Gray & Owen 1993; Wiseman 1982). In spite of this, evidence also indicates voluntary
disclosures are increasing (Unerman & Bennett 2004). Firms use voluntary disclosures
as a strategy to attract investors (Bewley & Yue 2000; Hossain, Perera & Rahman
1995).
Hossain, Perera and Rahman (1995) analysis a sample of 55 firms listed on the
New Zealand Stock Exchange within the theoretical framework of agency theory to
investigate the relationship between firm characteristics and disclosures. Cross-sectional
regression finds firm size, leverage and foreign listing status are significantly related to
voluntary disclosures whereas auditor type and assets-in-place are not significantly
associated with voluntary disclosures (Hossain, Perera & Rahman 1995).
Bewley and Yue (2000) use five firm-specific factors, suggested by voluntary
disclosure theory, to investigate 188 Canadian firms and to explain voluntary
disclosures regarding general and financial environmental information. These five
factors are outsiders’ knowledge about environmental problems, the firm’s tendency to
pollute and political sensitivity while auditor quality and financial performance are
selected as control variables (Bewley & Yue 2000). The findings indicate three of these
factors, outsiders’ knowledge about environmental problems, the propensity to pollute
and political exposure are positively related to increased general voluntary
environmental disclosures, though financial environmental information is less
influenced by voluntary disclosure factors (Bewley & Yue 2000).

50
Nevertheless, the lack of evidence of a significant connection between
environmental performance and disclosures in past research motivated Patten (1992).
Patten (1992) considers the lack of evidence to be a concern as the socio-political
theories argue that disclosures are a function of pressures arising from public exposure.
Walden and Schwartz (1997) define public pressures as pressures arising from social
changes and the regulatory environment. Consequently, Patten identifies problems in
the design of previous research such as minimal control of additional influencing
factors, inadequate sample sizes and suitable indicators of environmental performance.
Subsequently, Patten (2002) investigates the relationship between environmental
performance and environmental disclosures on toxic releases made by 131 US firms in
the 1990 annual reports. The study provides a snap-shot view of the data. Patten
compares figures published in the Environmental Protection Agency’s 1988 Toxics
Release Inventory released in 1990, with information available in the 1990 annual
reports. The Toxics Release Inventory provides an independent source of data to
benchmark environmental disclosures made in the annual reports.
Patten (2002) notes in previous studies such as Deegan and Gordon (1996),
Hackston and Milne (1996) and Patten (1992) that size and industry type are factors
associated with environmental disclosures. Consequently, Patten (2002) controls for the
variables firm size and industry classification.
The socio-political theories suggest firms with low environmental performance
are expected to provide more environmental disclosures as a result of greater exposure
to the public (Patten 2002). However, Patten (2002) notes that a lack of significant
results in prior research consistently occurred. In contrast, Patten (2002) contends that a
negative association exists between environmental performance and voluntary
disclosure. The findings are consistent with Patten’s conjecture and indicate a negative
51
relationship between performance and disclosures; however, the results also indicate
non-environmentally sensitive industries are affected more by the toxics release data
than environmentally sensitive industries (Patten 2002).
However, Patten’s research has limitations as the Toxic Release Inventory
publishes delayed information. A company’s 1988 toxic release data was publicly
available in 1990. Even though Patten investigates voluntary disclosures in the 1990
annual reports, voluntary disclosures occurring in 1988 or 1989 annual reports are not
included. Sensitive industries may have already released information to investors prior
to the publication of the Toxic Release Inventory (Patten 2002). Therefore, by the time
the data was available through the Inventory it may not have added new information for
the stakeholders (Patten 2002). Patten also suggests the delay in releasing the
information encourages non-sensitive, low environmentally-performing firms to delay
disclosures and these firms are only compelled to disclose information with the
publication of the Toxic Release Inventory. Therefore non-sensitive industries appear to
be influenced more by the release of the Inventory. However, additional weight would
have been lent to this conjecture if the 1988 and 1989 annual reports were also checked.
Therefore, to take into consideration the weaknesses Patten identifies in prior
research, the current research controls for firm size. Further, a larger sample size is
selected that results in a total of 170 firms, thus capturing a diverse range of industries.
Two further weaknesses identified in Patten’s research are: (1) time-delayed
information represented on the Toxic Release Inventory and (2) the narrow focus using
one year’s annual reports. Therefore, each of these weaknesses is addressed.
This thesis uses data released under the NGER Act. Firms are required to submit
the data by 31 October if the reporting period ends on 30 June. This data is publicly

52
available from 28 February in the following year. Annual reports are released from 30
June onwards and the carbon emissions data becomes available during the subsequent
period after the annual reports are released1. There is not a time delay of a couple of
years before the information is publicly available as experienced by Patten in his
research. Therefore, incentive exists for both sensitive and non-sensitive industries to
voluntarily disclose carbon emissions data within the current reporting period. In
addition, the current research is a longitudinal study in contrast with the temporal view
undertaken by Patten.
Research by Murray, Sinclair, Power and Gray (2006) and Clarkson, Yue,
Richardson and Vasvari (2008) extend the environmental voluntary disclosure
literature. Murray et al. (2006) investigate the relationships between share returns and
voluntary environmental and social disclosures of the UK’s top 100 companies over a
period of ten years, 1988 to 1997. The opportunity to investigate how the financial
markets can encourage social and environmental disclosures motivates the research.
Murray et al. (2006) consider that the financial markets can either pose a barrier or
present an opportunity to align the firm with the concept of sustainability. The financial
markets do have an opportunity to redress the currently inadequate social and
environmental disclosures made by the firm (Murray et al., 2006). Therefore the annual
reports are investigated as annual reports specifically target investors (Murray et al.
2006).
The variables, industry and size are controlled as prior research associates these
factors with environmental and social voluntary disclosures (Murray et al. 2006). The
research considers both cross-sectional and longitudinal data. Longitudinal data offers
the opportunity to detect relationships that are more evident over a longer period of time
1 Even though there is not a similar compulsion for sustainability reports to be released on an
annual basis as annual reports, the importance of sustainability reports is growing and therefore included
in this study.

53
(Murray et al. 2006). The relationships are tested to ascertain a linear relationship using
Pearson Correlation coefficients and tested for non-linear relationships using chi-
squared tests over corporate social responsibility disclosures. Sensitivity analysis and
the use of high confidence intervals are also used to recheck and provide plausible
evidence. The findings are consistent with prior research, no association between share
returns and disclosures are identified. However, the researchers did notice that an
average of high and low returns is related to an average of high and low disclosures. A
theoretical explanation is not offered for this phenomenon.
However, Murray et al.’s research focusses on the years 1988 to 1997, a period
of time during which the concept of climate change and global warming is in its
infancy. In contrast, the current research focusses on a recent period, 2005 to 2011 in
which understanding of the climate change issue is significantly increasing and the
concerns of institutional investors are mounting. Therefore, this research takes these
points into consideration in its investigation of factors that contribute to voluntary
carbon emission disclosures.
Clarkson, et al (2008) research 191 US companies, providing a snap-shot
view of environmental disclosures made in 2003. These researchers are motivated
by the mixed results that exist in prior environmental performance and
environmental disclosures studies. Notably, Clarkson et al. highlight Patten’s
(2002) research that attributes prior mixed results to deficiencies in research design
such as insufficient measures of performance and disclosure, the absence of control
on other influential factors relating to disclosures and insufficient sample selection.
Hence Clarkson et al. are inspired to revisit the relationship between environmental
performance and disclosures, to address past issues and specifically, to test
competing predictions from economics, voluntary disclosure theory (Verrecchia

54
1983) and socio-political theories, such as legitimacy, stakeholder and political
economy theories (Patten 2002).
The economic disclosure theory and voluntary disclosure theory suggests
that there is a positive relationship between environmental performance and
voluntary environmental disclosures (Verrecchia 1983). This is based on the
concept of superior environmentally-performing firms using environmental
performance indicators that inferior firms find difficult to replicate (Clarkson et al.
2008). This concept is worthy to note, as it potentially offers an explanation for
Murray et al.’s findings where average high and low returns are related to average
high and low disclosures. Nevertheless, to contrast with voluntary disclosure
theory, Clarkson et al. select legitimacy, stakeholder and political economy theories
suggesting a negative relationship exists between performance and voluntary
disclosures and this negative relationship is attributable to political and social
pressures the firm confronts (Clarkson et al. 2008).
The research includes a content analysis index that is based on the Global
Reporting Initiative guidelines for sustainability reporting. The content analysis
index records “soft” and “hard” claims (Clarkson et al. 2008). Soft claims are
unverifiable statements that socio-political theories are more apt in explaining
whereas verifiable hard claims are consistently interpreted using economic
disclosure theories (Clarkson et al. 2008). Hard disclosures consist of verifiable
measures, indicators and industry benchmarks that are hard to invent and
potentially expose firms to litigation if information is not honest (Clarkson et al.
2008). The research is extended using ordinary least squares regression. The focus
is on five heavily polluting industries. The findings indicate the economics
disclosure theory provides consistent predictions whereas the use of socio-political

55
theories is inconsistent. However, socio-political theories provide explanations for
data that economics disclosure theories cannot (Clarkson et al. 2008).
A couple of approaches are drawn from Clarkson et al.’s research. Similar to
Clarkson et al.’s ‘soft’ and ‘hard’ disclosures, the content analysis part of the current
research is consistent with identifying ‘soft’ and ‘hard’ disclosures reported in annual
and sustainability reports. In the current research ‘soft’ disclosures are general
qualitative statements. ‘Hard’ disclosures are verifiable statements such as financial
quantitative, non-financial quantitative or specific qualitative statements. This
approach assists the understanding of disclosure patterns occurring around the
introduction of the NGER Act 2007. In addition, to understand the complex relationship
between environmental performance and environmental voluntary disclosures, Clarkson
et al. use a combination of economics and socio-political theories. A combination of
theories has a greater potential to predict and provide a comprehensive explanation
about the relationship (Clarkson et al. 2008). Hence the current research adopts this
view. However, signalling theory instead of voluntary disclosure theory represents the
socio-economic approach while two socio-political theories provide a micro (legitimacy
theory) and macro (institutional) perspective rather than the legitimacy, stakeholder and
political economy theories adopted by Clarkson et al.
However, Clarkson et al.’s research focusses on a temporal view of the
firms’ website content. The information on websites is dynamic and has the
potential to change without the reader being aware of when or what changes are
posted. This reduces the reproducibility of research as website content cannot be
verified. In contrast, the current research specifically looks at voluntary carbon
emission disclosures in annual and sustainability reports within the Australian
context to ascertain the implications of the NGER Act 2007 on disclosures. The
requirement to produce annual reports is legislated ensuring information in annual

56
reports is consistent within a set period and over time. Even though sustainability
reports are not mandated, sustainability reports are in general, more in line with the
structure of annual reports rather than the dynamic content of websites. Despite the
fact the data in these reports is classified as archival information, this format
overcomes the uncertainty that surrounds the timing of information on websites.
Therefore a focus on annual and sustainability reports in the current research
overcomes the reproducibility issues associated with research into website content.
However, the focus on website content in research remains topical. Petcharat
and Mula’s (2013) research focusses on the investigation of website content to examine
the environmental and social reporting practices of 52 Thai companies that respond to
the CDP. The results suggest voluntary disclosures do not fully reflect environmental
performance (Petcharat & Mula 2013). However, environmental reporting is more likely
to occur when environmental exposures come to light (Petcharat & Mula 2013). These
results motivate Petcharat and Mula (2013) to develop a sustainability financial
reporting system that can be incorporated within a company’s accounting framework to
guide corporate social responsible reporting. The motivation to develop a sustainability
financial reporting system reflects the increased recognition and importance of social
and environmental information. The research is viewed through legitimacy and
stakeholder theories. Weaknesses of the research include the sample size; a focus on 52
companies reduces the generalisability to other Thai companies and the dynamic nature
of website content reduces the reproducibility of research. The use of other disclosure
paths such as the annual and sustainability reports may allow the inclusion of a greater
number of Thai companies that report to the CDP. Including archival data increases the
population from which to draw the sample and reduces the limitations imposed by the
sole use of websites.

57
The interest in strengthening corporate social responsibility reporting remains a
focus in research. Tay, Sultana and Van der Zahn (2013) call for regulators to revise
corporate social responsibility reporting in Singapore after their research suggests
corporate social responsibility disclosures are used as a legitimising tool when technical
indicator signal breaches occur. Disclosures are a reactive response to share price
volatility rather than representing valued social and environmental information on their
own merit. Further, the findings suggest that investors should not place significant
weight on corporate social responsibility disclosures made in annual reports of
Singaporean companies when making investment decisions (Tay, Sultana & Van der
Zahn 2013). The credibility of these disclosures is questionable. However, the
generalisability of the findings is limited as the research focusses on one country
Singapore, one disclosure method (annual reports) and the investigation of only two
technical trading indicators (Tay, Sultana & Van der Zahn 2013).
In summary, prior research indicates that firms have a wide range of motives for
making voluntary disclosures in spite of disclosures remaining inconsistent and
incomplete. Equally, a diverse range of theoretical perspectives are used to complement
the diverse motives to disclose. The use of one dominant theory is not a common thread
throughout prior research. In some cases, the theoretical perspective is not explicitly
stated. In addition, it is evident that prior research highlights the fact that voluntary
disclosures are increasing. Nevertheless, a lack of evidence persists between the
relationship of environmental performance and voluntary disclosures. The credibility of
disclosures remains questionable.
These facts emphasise the importance of the research design, understanding the
context of the research and the theoretical perspective framing the questions under
investigation. Gray (2010) stresses the importance of understanding the divergence
in accounting practices between reporting and actual environmental sustainability.

58
The companies’ desire to report environmental sustainability underpins the quality
of disclosures (Gray 2010). Therefore understanding this distinction sheds further
light on the motivation and variation in disclosures (Gray 2010). Accordingly,
research in Australia also contributes to the understanding of reporting motivations
and disclosure practices.
3.2.2 Australia
Traditional corporate social responsibility reporting in Australia has occurred
intermittently since the 1950s (Guthrie & Parker 1989) with disclosures increasing over
time (Deegan & Gordon 1996; Gibson & O'Donovan 2007; Guthrie & Parker 1989).
Corporate social responsibility reporting or sustainability reporting as it is becoming
known, is voluntarily provided in Australia (Godfrey et al. 2006b). Sustainability
reporting includes the provision of information based on economic, social and
environmental performance (Frost et al. 2005). However, the overall level of disclosure
is low with inconsistencies and gaps occurring (Frost et al. 2005), and this reduces the
ability of investors to easily make comparisons (Godfrey et al. 2006b). Nevertheless, the
increasing voluntary disclosures, specifically environmental disclosures, reflect
organisational responses to changes in societal expectations (Adams & Frost 2007).
However, disclosures mainly emanate from larger firms (Kent, Kwong & Marshall
1997) or environmentally sensitive firms (Deegan & Gordon 1996) providing positive
disclosures (Deegan & Rankin 1996). These findings are consistent with international
evidence.
Other motivations offered by prior Australian research include: to advertise
awards (Deegan & Carrol 1993), to meet legal requirements (Deegan 2000) and
industry requirements (Deegan & Blomquist 2001), to counter potential legislative
disclosure regulations (Deegan 2002b; Guthrie & Parker 1990) and threats to the firm’s

59
legitimacy (Deegan, Rankin & Tobin 2002; Deegan, Rankin & Voght 2000), to meet
borrowing demands (Deegan 2002b), to attract capital (Deegan 2002b) and to be seen as
a good corporate citizen (Deegan 2005). The reasons for disclosure are many and varied
and are not exclusive, with many possible motivations working in unison to influence
the decision to disclose (Deegan 2002b). Many of these reasons are interrelated (Deegan
2002b). Australian evidence is consistent with international results.
In addition, Guthrie and Parker (1990) in a comparative international analysis
find Australia lags behind social disclosures made in the United Kingdom (UK) and the
United States of America (USA). Further, Guthrie and Parker find disclosures are
generally reactive rather than proactive (Guthrie & Parker 1990). In a later study,
focussing on the year 2003, Adams and Frost (2007) find voluntary environmental
disclosures continue to lag behind and are considerably lower than environmental
reporting conducted by British companies. Environmental disclosures in sustainability
and annual reports are the focus of this investigation.
Nevertheless, a constant theme in the research approach is evident. Similar to
Clarkson et al.’s research design discussed earlier, Gibson and O’Donovan label the
different types of disclosures. Categorizing the types of disclosures contributes to the
strength of the research design. Gibson and O’Donovan’s (2007) study covers the
period 1983 to 2003 and investigates 41 Australian companies that represent eight
industry groups. To clearly outline the scope of environmental reporting and the types
of information disclosed, Gibson and O’Donovan (2007) categorise the voluntary
disclosures into financial, quantifiable non-financial and descriptive disclosures. The
purpose of this categorisation is to explore methods to define the type of disclosures and
provide foundation data for future research (Gibson & O'Donovan 2007). The
categorisation of voluntary disclosed information is designed to assist the understanding

60
about the manner of disclosures, the relevance of information in the current reporting
environment and associations with environmental performance. Gibson and O’Donovan
acknowledge that this categorisation does not offer a definition for ‘quality disclosures’
though they consider this categorisation does provide a basis for this work. Identifying
quantifiable non-financial disclosures potentially contributes to ascertaining quality
disclosures. Therefore relating to Gibson and O’Donovan’s categorisation, carbon
emissions data in the current research is classified as quantifiable non-financial
disclosures.
Australian research indicates results are generally consistent with international
findings. However the research also indicates that voluntary disclosures within the
Australian context tend to be reactive and lag behind overseas patterns. In addition, the
categorising of voluntary disclosures is a consistent theme in research design.
However the current research focusses on voluntary carbon emission
disclosures, a narrower perspective on voluntary disclosures. Therefore an overview of
research focussing on voluntary carbon emission disclosures overseas and in Australia
follows.
3.3 Voluntary Disclosures on Carbon Emissions
3.3.1 Overseas
Climate change introduces challenges to the global community that necessitate a
cooperative effort by individuals, businesses and governments to address (Reid &
Toffel 2009). In the process of countering this climate change challenge, firm’s
information on carbon emissions, strategies, risks and opportunities is required (Reid &
Toffel 2009). However, pollution emitted from facilities has drawn the attention of
researchers over a lengthy period of time and includes the work by Spicer (1978),
Wiseman (1982), Mathews (2004), Lorraine, Collison and Power (2004), Freedman and

61
Patten (2004), Reid and Toffel (2009), Stanny (2010), Cotter and Najah (2011), Najah
and Cotter (2012) and Griffin, Lont and Sun (2012). The recent increasing urgency
arousing interest in pollution emitted from facilities has also motivated transnational
organisations and professional accounting bodies such as the Global Reporting Initiative
and KPMG to conduct environmental disclosure surveys, to better understand the
existing response to the climate change phenomenon.
Spicer (1978) conducts a longitudinal study covering the years 1968 to 1973.
Spicer’s research focusses on disclosures of air and water pollutants from 18 pulp and
paper companies based in the USA. The findings suggest better pollution control
records are associated with high profitability, high price/earnings ratios, large size, low
systematic risk and lower total risk (Spicer 1978). However, Spicer (1978) finds the
associations reduce over time, possibly due to public pressure resulting in legislation.
The small sample size of 18 companies is a limitation of this study and reduces the
generalisability of the findings. Wiseman (1982) later conducts a similar study.
Wiseman (1982) investigates the annual reports of 26 companies that are heavy
polluters drawn from the steel, oil, and pulp and paper industries in the USA. The
research period covers the years 1972, 1974 and 1976. The findings suggest the
environmental disclosures are lacking in detail and the disclosures are not representative
of the firms’ environmental performance (Wiseman 1982). The research is limited by a
small sample size and a focus on sensitive industries which also reduce the
generalisability of the study.
Mathews (2004) reviews two empirical research articles and provides a
commentary on: Lorraine, Collison and Power (2004) and Freedman and Patten
(2004) and their findings on the effects of environmental data on the capital
markets. Briefly, Lorraine, Collison and Power (2004) investigate the effect of good

62
and bad news regarding environmental performance on the value of share prices.
Specifically, fines imposed by the UK Environmental Authority and various awards
received between the years 1995 and 2000 are investigated. The results suggest that
the stock market responds to the imposition of fines on the firm while other
environmental performance news or industry membership did not provide
conclusive evidence explaining market reactions (Lorraine, Collison & Power
2004). The research utilizes an event study approach in a cross-sectional analysis of
the data. However, the UK Environmental Authority was in its implementation
stages during this period and the small sample size represents limitations on the
study (Lorraine, Collison & Power 2004).
Freedman and Patten’s (2004) objective is to evaluate the market impact of the
United States’ President George Bush’s unexpected announcement to amend the Clean
Air Act of 1970. The research focusses on the market reaction towards heavy polluters
as identified in the Toxic Release Inventory (TRI) data. In addition, Freedman and
Patten (2004) also investigate the effect on environmental disclosures after taking into
consideration the market reaction to Bush’s announcement. The findings indicate that
the worse polluting companies incurred greater negative reaction from the market
(Freedman & Patten 2004). Also, Freedman and Patten find, companies that provide
less environmental information in the 10-K reports incur a greater negative market
reaction (Freedman & Patten 2004). Freedman and Patten (2004) consider that the TRI
information provide a quasi-regulatory approach; however, greater environmental
disclosures lessen the negative market impact of Bush’s unexpected announcement and
lessened the quasi-regulatory approach the TRI information potentially provides. The
research includes a cross-sectional analysis centring around 12 June, 1989, the press
conference date where Bush made the unexpected announcement to change the Clean
Air Act.

63
Mathews (2004) places his commentary on these two papers within the
context of the changing nature of research and the evolving reporting environment.
For example, Mathews notes that environmental research has moved forward from
word and sentence counts to research that is informed by theory and the potential
variety of intervening variables. Mathews also notes that environmental voluntary
disclosures initially were minimal and mainly positive news and this pattern of
disclosures has evolved to a point where disclosures are increasingly influenced by
additional regulations and recommended voluntary disclosure guidelines.
In reviewing the first article, Mathews (2004) considers that Lorraine et al.’s
research is exploratory in nature and is limited by the small sample size and
inconclusive findings. Mathews (2004) acknowledges Lorraine et al.’s main
contribution is to broaden the UK methodology approach used by accounting
researchers. In reviewing the second article Mathews notes Freedman and Patten’s
research uses a larger sample size however one industry (pulp and paper) is heavil y
represented in the study. Further, issues that Mathews notes are that the data
provides a snap-shot view rather than a longitudinal study; the focus of the research
is on dichotomous rather than continuous variables and in addition, Mathews
questions the conclusions that Freedman and Patten offer.
Mathews (2004) concludes from these two research articles that the
empirical research on its own does not provide guidance in changing organisational
behaviour or how to encourage firms to provide transparent disclosures regarding
performance. Mathews (2004) suggests that environmental disclosures should
follow the path of financial disclosures that have a conceptual framework and
standards, and where the data is subject to rigorous assurances. In the interim,
Mathews (2004) recommends that data reported to government bodies should be
mandated data in the annual reports.

64
In 2007, the Global Reporting Initiative and KPMG (2007) conducted a survey
and found companies provide more information on climate change-related business
opportunities rather than the risks companies faced. Basic information such as carbon
emissions, acknowledging the issue of climate change, reduction targets and statements
from the chairman and/or chief executive officer were released. When financial
information is provided it relates to savings or positive returns rather than quantifying
the risks in dollar amounts. The results suggest that the low level of reporting risks is
associated with firms seeing opportunities in preference to the risks in climate change,
or firms considering risks are outside the scope of their planning (Global Reporting
Initiative & KPMG's Global Sustainability Services 2007). Alternatively managers have
not identified, quantified or explored the impact of climate change on their firms
(Global Reporting Initiative & KPMG's Global Sustainability Services 2007).
Nevertheless, research identifies external factors that influence firms to extend
voluntary discloses about carbon data.
Reid and Toffel (2009) consider two external influences, shareholder activism
and the threat of regulation on greenhouse gases. Reid and Toffel (2009) use an
extension on social activism and organisational change to interpret the results. The
findings indicate where firms are targeted by shareholder resolutions and the regulatory
environment remains uncertain, firms are more inclined to voluntarily supply material
to the CDP (Reid & Toffel 2009). In addition, Reid and Toffel (2009) note that spill
over effects occur with non-targeted firms. This finding is consistent with Patten’s
(1992) research investigating the Alaskan Oil Spill. Future research needs to incorporate
both private and public stakeholders (Reid & Toffel 2009). The current research
acknowledges the importance of both private and public stakeholders and therefore this
thesis interprets the results through three theories, legitimacy, signalling and
institutional, to capture the diverse nature of stakeholders and their influences.

65
Stanny (2010) turns attention to the influence of institutional investors and the
resulting disclosures made through the CDP. The research investigates the voluntary
greenhouse gas emission disclosures made by US S&P 500 firms between the years,
2006 – 2008. The findings indicate the disclosures increase between 2006 and 2008,
however there are significant differences between the types of disclosures (Stanny
2010). Legitimacy and institutional theories in unison explain the cross-sectional
differences and temporal changes (Stanny 2010). However, a limitation of the research
is a focus on the CDP that only requests non-firm specific data without considering the
indirect influence of the US regulatory environment on such disclosures. This is a point
raised by Reid and Toffel (2009) to ensure that both public as well as private
stakeholders are considered in future research. Nevertheless, the importance of
institutional investors remains topical in research.
Cotter and Najah (2011) investigate the influence of institutional investors on
climate change-related disclosures. The results indicate three key activities are
associated with organisational responses to institutional investor needs (Cotter & Najah
2011). These activities are participation in the CDP, the extent of participation in the
CDP survey and the communication to investors about the firm’s participation in the
Project (Cotter & Najah 2011). Stakeholder theory underlies this research and evidence
suggests the institutional investors do have a positive influence on voluntary carbon
disclosures (Cotter & Najah 2011). However, Cotter and Najah (2011) acknowledge a
limitation of the research is the focus on large global companies that most likely already
make climate change disclosures due to their visibility, and have already made a
commitment to the CDP. A comparison with large companies that do not report to the
CDP is not presented.

66
Climate change, a carbon-constraint world and mixed results from prior research
into voluntary disclosures motivate Najah and Cotter (2012) to investigate voluntary
carbon disclosures using socio-political and economic based theories. Specifically the
focus is on carbon risk management disclosures made through the CDP to investor and
non-investor stakeholders. The findings indicate carbon disclosures are positively
associated with carbon risk management (Najah & Cotter 2012). However Najah and
Cotter (2012) suggest investors are not using this information as the findings indicate
that carbon climate change disclosures are not reflected in lower costs of equity capital,
increased market value or provide additional information for non-investor stakeholders.
However, participation in the CDP is voluntary and the extent of participation is
flexible. This voluntary and flexible approach to disclosures may influence the value
that stakeholders place on the CDP information. Deegan and O’Neill (2011) suggest the
relevance of the data to stakeholders is an important consideration. However the
research focusses on large global companies providing a snap-shot view of one year
which limits the generalisability of the findings.
In contrast, Griffin, Lont and Sun (2012) find evidence that investors do value
greenhouse gas emission disclosures. The research acknowledges investors and analysts
seek carbon emission information while firms and insurance agents are concerned about
proprietary costs and litigation (Griffin, Lont & Sun 2012). Griffin, Lont and Sun
(2012) focus on Canadian and USA firms, investigating information reported in the
CDP and 8-K filings. Evidence that supports the findings suggests investors do use CDP
data to value the firm (Griffin, Lont & Sun 2012). Further, evidence indicates that stock
prices also reflect non-disclosed carbon emission values indicating that the share price
reflects estimates available from other sources (Griffin, Lont & Sun 2012). In addition,
an event study highlights the stock market’s reaction to climate change data in the 8-K
filings (Griffin, Lont & Sun 2012). In contrast with Griffin, Lont and Sun’s market-

67
based perspective, the current research uses the macro-approach capturing the
institutional structure, specifically the NGER Act and its implications on voluntary
carbon emission discloses in annual and sustainability reports.
Mixed and varied results continue to dominate international empirical and
theoretical driven research. Reid and Toffel (2009) view their findings through a
theoretical framework and suggest that shareholder interest and an uncertain operating
environment influence voluntary emission disclosures, while Stanny (2010) notes
voluntary greenhouse gas disclosures are increasing despite these disclosures remaining
inconsistent. Stanny’s research also uses a theoretical framework, and so do Cotter and
Najah. Cotter and Najah (2011) suggest that firms do respond to the influence of
institutional investors through the use of the CDP. Even though Najah and Cotter (2012)
note that voluntary climate change-related disclosures are positively associated with
carbon risk management, evidence indicates investors are not using this information. In
contrast, Griffin, Lont and Sun’s (2012) empirical evidence suggests investors do value
voluntary greenhouse gas disclosures. The mixed and varied results that research
provides, highlights the continuing complex nature of voluntary disclosures.
3.3.2 Australia
The number of national environmental regulations introduced in Australia has
increased over time. These regulations require reporting on emissions data other than
greenhouse gases – National Pollution Inventory (NPI), the identification of energy
efficiencies - Energy Efficiencies Opportunities Act 2006 and specific data on
greenhouse gas emissions - NGER Act 2007. As a result of increased legislation and
changing societal expectations, it is expected that these changes are also reflected in
disclosure practices. In addition, regulatory changes provide a fertile background
stimulating research, specifically research focussing on voluntary carbon emissions

68
disclosures in Australia. Research includes Cunningham and Gadenne (2003), Simnett
and Nugent (2007), Hollindale, Kent & Routledge (2010), Young (2010), Lodhia and
Martin (2011), Green and Li (2011), Lodhia (2011), Martinov-Bennie (2012), Rankin,
Windsor and Wahyuni (2011), Haque and Deegan (2010), Cowan and Deegan (2011),
de Lange and Sidaway (2011), Purushothaman and Taplin (2011a, 2011b), Cowan and
Tyler (2011), Perera and Jubb (2011), Cotter, Najah and Wang (2011) and Hollindale
(2012), Qian (2012), Borghei and Leung (2013) and Choi, Lee and Pasaros (2013).
Cunningham and Gadenne (2003) investigate the usefulness of regulated
external environmental reporting as a driver for voluntary environmental disclosures
and the usefulness of such disclosures in the annual report. Cunningham and Gadenne
specifically focus on the NPI during its implementation period (1998-2000), the first
piece of legislation requiring emissions reporting. This data is examined and compared
with the voluntary disclosures made in annual reports by 25 Australian companies
registered with the NPI. The research findings suggest that publicly-available regulated
environmental disclosures are an incentive for firms to report NPI-related information in
the annual report (Cunningham & Gadenne 2003). However, the research also finds that
specific environmental disclosures, as required by the NPI, do not result in a significant
increase in the amount of general voluntary environmental disclosures during the period
under investigation (Cunningham & Gadenne 2003). Positive disclosures in the annual
reports remain high which is consistent with prior literature, while the usefulness of the
disclosures remains questionable (Cunningham & Gadenne 2003). However the
limitations of the study reduce the generalisability of the findings. The sample size is
small, using data from the implementation stage of the NPI provides an incomplete
picture and increasing the categories in content analysis increases the subjectivity
inherently associated with this approach (Cunningham & Gadenne 2003). In contrast,
the current research uses a larger sample size of 170 firms over a longer timeframe to

69
capture changes between 2005 and 2011 encompassing the pre-, implementation and
post-period of the NGER Act 2007. This avoids the inevitable issues associated with
researching a new reporting regimen during its implementation stages. Nonetheless, the
concerns Cunningham and Gadenne raise regarding the usefulness of voluntary
emission disclosures are reiterated by Simnett and Nugent.
Simnett and Nugent (2007) find only 139 out of 1,485 Australian Securities
Exchange (ASX) listed companies made some disclosures on carbon emissions in 2005.
The snapshot view of disclosure trends in 2005 indicates voluntary disclosures are at a
low level, suggesting that reliance cannot be placed on voluntary carbon emission
disclosures (Simnett & Nugent 2007). Hence in response to Simnett and Nugent’s
recommendations for future research, this longitudinal study offers additional insights
on why some Australian companies disclose and others do not.
Hollindale, Kent and Routledge (2010) investigate the quality of greenhouse gas
emission disclosures in the 2007 annual reports. The quality of greenhouse gas
disclosures are assessed by benchmarking disclosures against a modified version of
Griffin, Lont and Sun’s index that is based on the GRI G3 guidelines (Hollindale, Kent
& Routledge 2010). However, Deegan and O’Neill (2011) recommend caution in
applying guidelines without questioning whether the disclosures are relevant to
investors. Nevertheless, Hollindale, Kent and Routledge’s research uses legitimacy
theory and focusses on the influence of good corporate governance on greenhouse gas
disclosures. A number of corporate governance characteristics are examined. However,
the results indicate the main influence that reduces unverifiable disclosures in the annual
reports is the presence of an environmental committee (Hollindale, Kent & Routledge
2010). A large firm size is also associated with quality greenhouse gas emission
disclosures while firm performance is positively related to unverifiable disclosures

70
(Hollindale, Kent & Routledge 2010). However, the R2
in the regression model indicates
that these factors only explain 13% of disclosures, hinting that other factors also
contribute to voluntary disclosures. Hollindale, Kent and Routledge conclude improved
corporate governance will have a positive impact on voluntary greenhouse gas
disclosures (Hollindale, Kent & Routledge 2010). Nevertheless, the Board’s willingness
to disclose (Gray 2010) will have an influence on the extent of corporate governance
oversight. However, limitations of the research suggest further investigation is
warranted. Limitations include the focus on one year, 2007 that provides a snap-shot
view. This year is prior to the introduction of the NGER Act that introduces legislative
changes, changes that may have potentially stimulated disclosures. In addition, the
research did not include sustainability reports which are often used in conjunction with
annual reports to relay information about the firm. Further, the research does not
consider the broader institutional environment within which the firm operates.
The challenges are evident for research, for businesses and governments in
Australia and other jurisdictions to provide a local solution to an international concern
(Young 2010). Drawing on an assurance and auditing background, Young raised
questions about operational and organisational boundaries, GHG ownership, accounting
for contractors’ emissions and GHG emissions from underground mining (Young
2010). On the other hand, Lodhia and Martin (2011) researched the corporations and
stakeholders’ submissions to the NGER policy paper that outlined concerns.
Lodhia and Martin (2011) use agenda-setting theory and content analysis to
investigate the submissions to the NGER policy paper. Corporations’ response focussed
on the NGER policy paper and concerns regarding the close link with a future emissions
trading scheme. However, submissions by other stakeholders expressed concerns over
climate change and carbon emissions (Lodhia & Martin 2012). Nonetheless, the NGER

71
Act was regarded as a success as reporting to government provided a method by which
firms were held accountable for their carbon emissions (Lodhia & Martin 2012).
The NGER Act though did not mandate audits on carbon emissions. A key issue
is the carbon emission data is subject to measurement uncertainties (Green & Li 2011).
As a result of Green and Li’s (2011) survey, the authors conclude a lack of common
understanding exists between GHG assurers and shareholders regarding the GHG
assurance assignment. Shareholders rate the importance of auditor responsibility highly
while assurers emphasise the importance of the auditing skills (Green & Li 2011).
Regardless, Lodhia (2011) considers the NGER Act provides a basis for continuing
accounting research into social and environmental issues. Martinov-Bennie (2012)
believes the governance framework will strengthen and continue to evolve around
carbon emission disclosures especially with the introduction of future pricing systems.
Rankin, Windsor and Wahyuni (2011) provide a snapshot view of greenhouse
gas disclosure practices during 2007 and investigate the motivations of Australian firms
to voluntarily disclose. The research highlights the Australian firms’ preparedness to
disclose carbon emissions prior to the introduction of the NGER Act 2007. Specifically,
links between voluntary disclosures and environmental management systems (EMS),
the existence of an environment committee, whether the chief executive officer is a
member of the environment committee, firm size and industry membership, are
investigated. The findings indicate that EMS that are certified, firm size and industry
sensitivity are all positively related to voluntary greenhouse gas disclosures (Rankin,
Windsor & Wahyuni 2011). However, the research only provides a view at one point in
time. In contrast, the current research takes a longitudinal view from 2005 to 2011. The
determinants that underlie voluntary carbon emission disclosures are investigated within
the context of the changing regulatory environment with the introduction of the NGER

72
Act 2007. Other pre-NGER Act research focussing on climate change-related
disclosures include Haque and Deegan.
Haque and Deegan (2010) research voluntary climate change disclosures and
related governance practices of five major energy-intensive Australian companies from
1992 until 2007. This period is prior to the introduction of legislation, the NGER Act
2007. The focus of attention in their research is to identify the procedures and policies
firms use to address climate change-related issues. The findings indicate an increasing
trend in the number of climate change disclosures though the rate of disclosures remains
low (Haque & Deegan 2010). Haque and Deegan (2010) consider the changing
organisational attitudes to scientific evidence are evolving from the initial position of
denial, to gradual acceptance and then to proactive responses. Disclosures are aligning
with the stance the firm takes regarding climate change at a given point in time. Firms
are in different stages of transition and this may reflect the low level of disclosures
(Haque & Deegan 2010). Nevertheless, Haque and Deegan (2010) suggest disclosures
are driven by a number of factors: the Kyoto Protocol 1997, CDP, and Global Reporting
Initiative, carbon trading and pricing and economic impacts. However, the disclosures
provide limited information on the companies’ risks and opportunities (Haque &
Deegan 2010). Selecting only five large energy-intensive companies from the ASX’s
top 100 list reduces the generalisability of the findings. The sectors covered by Haque
and Deegan’s research include the mining, manufacturing and electricity, gas and oil
sectors. The Service and Construction and Agriculture, Forestry and Fisheries sectors
are not included though these are also identified by the Department of Climate Change
and Energy Efficiency as main sectors contributing to carbon emissions in Australia
(Australian Government 2010). Haque and Deegan’s research is mainly descriptive,
exploring the types of climate change-related disclosures to provide a background for
future research. Haque and Deegan’s (2010) research is in contrast with the current

73
research. The current research investigates changes in voluntary carbon emission
disclosures over a seven year period surrounding the introduction of the NGER Act,
whereas Haque and Deegan’s research is prior to the introduction of the NGER Act.
The current research also uses a larger sample size drawn from a diverse range of
industries to increase the generalisability of the findings.
Cowan and Deegan (2011) research voluntary emission disclosures in Australia
during the implementation period (1998-2000) of the NPI. Cowan and Deegan (2011)
find firms do make reactive disclosures to the introduction of the NPI in the annual
reports, suggesting specific regulations do have an effect on voluntary emission
disclosures. The findings are consistent with prior research investigating annual report
disclosures that indicate a firm may disclose information to legitimise the firm’s
operations within the community in which it operates (Deegan & Rankin 1996; Deegan,
Rankin & Voght 2000; Patten 1992). These findings are within the context of
legitimacy theory which provides a reasonable explanatory framework for reactive
behaviour (Cowan & Deegan 2011). Further, Cowan and Deegan (2011) find the
voluntary disclosures do not represent a precise reflection of the environmental
operations of firms. The findings suggest that even though regulation could result in an
increase in voluntary emission disclosures in annual reports, disclosures are still
expected to be inconsistent and minimal (Cowan & Deegan 2011). Inconsistent and
minimal information may reflect a legitimacy gap, therefore to check the influence of
legislation over time, Cowan and Deegan (2011) call for further research to examine
voluntary emission disclosures in regard to the NGER Act 2007. In addition, Cowan and
Deegan (2011) suggest research that includes the pre- and post-NGER periods may
provide additional evidence shedding light on potential legitimacy gaps and the success
of voluntary emissions disclosures to address these gaps.

74
Even though there are similarities between the Cowan and Deegan’s (2011)
research and this study, both researching Australian voluntary emissions disclosures,
there are a number of differences between the two studies. These differences include
different research methods: a mix of qualitative and quantitative analysis is used in the
current research as opposed to qualitative content analysis that is used in the Cowan and
Deegan’s study; a different focus, the current research investigates reporting under the
NGER Act as opposed to Cowan and Deegan reporting under the NPI; a different
theoretical framework, this thesis uses multiple theories to provide a comprehensive
understanding of the information collected from the NGER data rather than relying only
on legitimacy theory to view the research.
De Lange and Sidaway (2011) explore the reporting changes that occur after the
NGER Act 2007 was implemented. Two research questions are proposed to assist this
investigation. The first research question presented is “Does the release of (negative)
environmental information about a company pose a potential threat to the company’s
legitimacy?” (de Lange & Sidaway 2011, p. 3). The second research question proposed
is “Does legislative change regulating specific companies also drive change in the
voluntary environmental disclosure behaviour of their non-regulated competitors?” (de
Lange & Sidaway 2011, p. 3). The findings from this research suggest companies: 1. Do
not consider data released on the NGER register as a legitimacy threat and 2. An
industry-wide effect occurs where the legislation has a knock-on effect towards
companies in the same industries, even though they are not specifically regulated.
However, a number of limitations are associated with this research as 2009 is the
introductory year of the NGER Act. Inconsistent methods are implemented by reporting
firms. This encouraged the Greenhouse and Energy Data Office (GEDO) to consider
educating firms further in appropriate methods. This thesis uses matched-pair
companies with 20 regulated and 20 non-regulated companies. However, the inability to

75
match companies precisely weakens the comparative analysis. The authors are cautious
about generalising the findings due to the use of a small sample size of 20 companies.
The research also focusses on the quantity of voluntary environmental disclosures rather
than on the nature or quality of such disclosures.
Similarities are evident between de Lange and Sidaway’s (2011) research and
this current study. The changes in voluntary disclosures surrounding the introduction of
the NGER Act in Australia are the focus of attention in both studies. Both studies use
qualitative and quantitative research methods sourcing data from the NGER register and
the annual reports. However, the current research turns attention to the determinants of
voluntary carbon emissions disclosures whereas de Lange and Sidaway (2011)
investigate the industry-wide effects of regulation on voluntary disclosures made by
companies not directly affected by the legislation. Further, this research uses a
longitudinal study from 2005 to 2011 with a sample size of 170 firms, and this also
includes sustainability reports. This is in contrast with de Lange and Sidaway’s (2011)
research using a snap shot view of 20 companies.
Purushothaman and Taplin’s (2011a) research using content analysis
investigates Australian auditors’ perspectives of climate change during 2009. The
findings highlight diverse reactions that ranged from reactive to proactive responses to
climate change (Purushothaman & Taplin 2011a). Proactive auditors are positively
associated with the firm’s level of carbon awareness. In addition, the findings suggest
that existing knowledge and skills of auditors could assist auditors to include green
audits within their repertoire (Purushothaman & Taplin 2011a). Benefits also flow to the
firm, government and other stakeholders as the NGER data is verified by the audit
profession and audit costs can be contained using one auditor for both financial
statements and emissions data (Purushothaman & Taplin 2011a). However, the sample

76
size of 15 auditors is a limitation of this study. Also a cross-sectional perspective
provides a narrow focus in this investigation. These limitations reduce the
generalisability of the study.
Purushothaman and Taplin’s research is similar to the current research as the
NGER register and carbon emissions in Australia are investigated. However,
Purushothaman and Taplin use content analysis on data obtained from 2009 whereas
this research uses a mixed methods approach over a longitudinal period.
Purushothaman and Taplin (2011b) also research the influence of carbon
regulation and the ratification of the Kyoto Protocol on online emission and energy
disclosures made by 400 ASX listed companies. A disclosure index is designed based
on the Global Reporting Initiative to examine the periods 2005 to 2007 and 2007 to
2009. These time periods represent pre and post ratification of the Kyoto Protocol and
regulations, NGER Act 2007 and The Energy Efficiency Opportunities Act
(Purushothaman & Taplin 2011b). Legitimacy theory provides the underlying
framework for this research. The findings suggest regulations and the ratification are
not a catalyst for Australian companies to increase carbon disclosures (Purushothaman
& Taplin 2011b). However, defining the pre and post periods in the research is difficult.
The Energy Efficiency Opportunities Act was introduced in 2006, the Kyoto Protocol
was ratified in 2007 and the NGER Act was implemented in 2008. The introduction of
the Energy Efficiency Opportunities Act occurs in the research’s pre period while the
NGER Act occurs in the post period therefore overlapping between the periods occurs
and no distinct pre and post period can be established. This limits the generalisability of
the findings. Purushothaman and Taplin’s (2011b) research and the current study are
both longitudinal studies that incorporate the impact of the NGER Act. However, in
contrast, the attention of this study focusses on annual and sustainability reports and the

77
introduction of one piece of legislation, the NGER Act. This study does not investigate
websites or three separate events. Research is further extended by incorporating the
theoretical perspective of a number of theories.
Cowan and Tyler’s (2011) research investigates the applicability of an evolving
multi-theoretical model to explain voluntary carbon emissions disclosure practices by
Australian firms. The findings, based on legitimacy and stakeholder theories, suggest
theories explaining disclosures evolve over time as the context of organisational
operations change (Cowan & Tyler 2011). Cowan and Tyler (2011) source content from
the NGER register and investigate annual reports and stand-alone reports. However, the
research is limited by using a small sample size of 16 companies that reduces the
generalisability of the findings. Nevertheless, Cowan and Tyler (2011) present a case
encouraging the use of multiple theories to provide comprehensive explanation in
research. Even though Cowan and Tyler refer to an evolving multi-theoretical model,
multiple theories collectively and simultaneously may provide a comprehensive
overview of reporting practices. This approach is adopted in this research.
Perera and Jubb (2011) investigate voluntary emission disclosures made by
Australian companies registered under the NGER Act 2007 to ascertain whether NGER
data is voluntarily disclosed in annual and sustainability reports during 2009. The
research is viewed using two theories, agency and legitimacy theories, and provides a
cross sectional analysis of 2008/2009 compared with 2006/2007. The research uses a
sample size of 71 ASX listed firms and the findings suggest relationships exist between
disclosures and emission levels, the presence of a sustainability report and association
with specific industries (Perera & Jubb 2011). However, Perera and Jubb (2011)
acknowledge the limitations of the study include the small sample size. Perera and Jubb
recommend the use of a larger sample size and a longitudinal study for future research.

78
This current research does use a larger sample size of 170 firms over a longer
timeframe, 2005 through to 2011. In addition, the current research uses a comparison
between 85 treatment and 85 control firms to track changes and determine differences
between reporting and non-reporting firms, pre and post NGER Act 2007. Using the
first three years’ implementation of the legislation overcomes the recording and
reporting issues that exist in the initial implementation phase in 2009. The current
research uses three theories, legitimacy, signalling and institutional theories to position
the thesis within a broader context that also captures the macro perspective in contrast
with Perera and Jubb’s narrower micro-view using agency and legitimacy theories only.
Cotter, Najah and Wang (2011) examine current legislative requirements for
reporting climate change disclosures, the guidance that is available and the growing
need for consistency in climate change information. The research focusses on one
Australian energy company that has achieved awards from the GRI and CDP for its
response to climate change and for its level of disclosures. Proprietary Cost Theory,
Legitimacy Theory, Voluntary Disclosure Theory and Stakeholder theory inform the
research. Even though the company provides NGER-related information in the
sustainability reports, results indicate the company responds at a lower level to the ASX
Guidance Note 10 (Cotter, Najah & Wang 2011). Australian legislative reporting
requirements are limited and do not include issues such as climate change; hence
specific climate change disclosures made to investors are not mandated in Australia.
Cotter et al. (2011) highlight four available options that potentially could redress the
current lack of reporting requirements. These options include the adoption of the SEC
disclosure requirements, maintenance of the current state where firms respond to
institutional investor demands through the CDP, provision of a disclosure framework
for climate change-related issues and the Climate Disclosure Standards Board’s Climate
Change Reporting Framework (Cotter, Najah & Wang 2011). However, the research is

79
based on one Australian company which limits the generalisablility of the findings.
Further research using a larger sample size investigating the disclosure practices of
firms would lend weight to Cotter et al.’s recommendations.
Hollindale (2012) researches the quality of greenhouse gas emission disclosures
made by Australian companies listed on the ASX for the years 2007 and 2009. The
research focusses on annual and sustainability reports surrounding the introduction of
the NGER Act 2007. The purpose of the research is to investigate changes between these
two points in time (Hollindale 2012). The research uses a sample size of 1,776
companies in 2007 and 1,853 companies in 2009 (Hollindale 2012). Hollindale’s
content analysis’s disclosure index is developed based on Clarkson et al.’s (2008) index
to lend validity for the measurement of disclosure quality. In addition to the content
analysis, further investigation includes Multiple, Tobit, Linear and Logistic regressions.
The findings suggest that disclosures do improve between the two years for specific
companies, however the results could not be generalised across the broader population
(Hollindale 2012). Hollindale (2012) further suggests the motivation underlying
voluntary disclosures is consistent with companies that are either large, listed on a
foreign exchange, whose assets are older or who are seeking debt finance. Further,
companies that are either highly leveraged, currently underperforming (even though the
companies are valued in the eyes of the stock market) or which operate within a less
competitive product market also are motivated to voluntary disclose information
(Hollindale 2012). Hollindale’s research is similar to this current research as it also
investigates the greenhouse gas emission disclosures made by ASX listed companies.
Both pieces of research centre on changes in voluntary disclosures that are potentially
influenced by the introduction of the NGER Act 2007. However, despite the similarities
between the two pieces of research, significant differences remain.

80
Hollindale’s research focusses on two specific years, 2007 and 2009. These
years represent: 1. the reporting year prior to the NGER legislation being passed
through Parliament; and 2. the first reporting year under the new legislation. Essentially,
the research captures a snap-shot view of these two specific years. In contrast, the
current research is a longitudinal study that captures the preceding years from 2005 and
extends to 2011, three years after the NGER legislation implementation. To gain a
greater insight into the effect of a specific event such as the impact of the NGER
legislation on reporting practices, noting the changes that occur over the extended
period enhances the observations. For example, in 2005 discussion about the NGER
legislation did not exist. In 2006 legislation was mooted by the Council of Australian
Governments which signalled the possible future path that the Federal Government may
take. In 2007 the legislation was enacted in Parliament establishing the future carbon
emission reporting requirements to government. Even though Hollindale selects 2007 to
contrast with 2009, rumblings about future reporting requirements are present in 2007.
Firms are aware of pending legislation and therefore had incentive to take a proactive
stance and include carbon data in annual or sustainability reports. A greater contrast is
achieved using data extending from 2005 instead of a snap-shot view just of 2007. The
year 2008 commences the reporting process with the first annual figures released to
government in 2009. The year 2009 was the implementation year and as such faced
hurdles with the introduction of a new reporting process both by government and the
individual businesses. Therefore to overcome the reporting issues arising in the first
year, this thesis covers the first three years under the NGER Act hence extending the
research out to 2011.
Further differences between the two pieces of research include the sample size.
Hollindale (2012) selects the full range of publicly ASX-listed companies for the two
years, 1,776 companies in 2007 and 1,853 companies in 2009. The research reveals 218

81
companies disclose in 2007 with the remaining 1,558 companies noted as non-
disclosing companies. Hollindale (2012) notes 390 disclosing companies with 1,463
non-disclosing companies in 2009. In contrast, the current research selects 170 firms, 85
treatment firms that report under NGER and 85 control firms that do not. Where
possible the firms are matched by size and per ASX-listed sectors. This captures
similarities between firms that are directly affected by the legislation with those who are
not immediately affected. The total number of firms used in this research represents
9.8% of the 1,776 total publicly listed companies identified by Hollindale for 2007 and
9.4% in 2009.
In addition, Hollindale (2012) focusses on the ‘quality’ of disclosures by
developing a disclosure index in the content analysis part of the research. However,
there is currently no mandatory requirement to provide carbon emission disclosures,
anything can be disclosed. This is despite the best efforts of environmental
stakeholders and sound organisational environmental performers collaborating to
establish the Global Reporting Initiative to provide a globally acceptable carbon
emission disclosure guideline (Clarkson et al. 2008). Even though the Global
Reporting Initiative has come a long way since the first publication of
comprehensive guidelines in 2002, further work is still required and is currently
under way (Ballou, Heitger & Landes 2006). Hence a globally accepted set
checklist of what constitutes ‘quality’ carbon emission disclosures does not
currently exist. In contrast, the content analysis of this research focusses
specifically on carbon emissions data and related disclosures to capture the broad
range of carbon related information that is voluntary disclosed over a seven year
period, rather than comparing it to a potential benchmark that is still a work in
progress.

82
The theoretical frameworks for each piece of research also differ. Hollindale’s
(2012) research is viewed through the lens of socio-economic and wealth maximisation
theories. Hollindale (2012) acknowledges the choice of theories is a limitation of the
research. In contrast, the current research uses systems-orientated and socio-economic
theories to capture the micro (legitimacy theory), macro (institutional theory) and socio-
economic (signalling theory) view of the operating environment and its influence on
firms. This theoretical approach may limit the thesis though it views the research within
context of the operating environment. As highlighted, significant differences exist
between Hollindale’s research and the current research, despite the similarities between
the two.
Research also investigates carbon efficiency of NGER registered firms (Qian
2012). Qian (2012) finds that carbon efficiency is not consistent between the different
greenhouse gas emission scopes, 1 and 2 and between industries. Government targets
emission reductions in Scope 1 emissions with the introduction of a carbon tax though
Qian questions the omission of Scope 2 from the tax (Qian 2012). Scope 1 emissions
are the direct emissions created by the firm, for example burning coal to produce energy
(Qian 2012). Scope 2 emissions are indirectly created, such as purchasing electricity
that is generated by another firm (Qian 2012). Environmentally sensitive industries tend
to produce more scope 1 emissions whereas both environmentally sensitive and non-
environmentally sensitive firms may have high scope 2 emissions (Qian 2012). The
study covers two years, 2008/09 and 2009/10 and incorporates a measure that equates
an economic value to the production of carbon emissions. Legitimacy theory frames the
research (Qian 2012). Qian’s research focusses on whether the NGER Act makes
improvements in carbon efficiency. Qian, however does not highlight whether operating
revenue or net profit after tax figures, the two financial measures, are taken from
consolidated financial statements or Australian results. The carbon emissions data under

83
investigation is collected from the NGER data. This is specifically relating to Australian
activities. In contrast, the consolidated financial statements include information from all
subsidiaries, located within and outside Australia. It is unclear from which financial
statements the two financial measures are derived, therefore this is a potential limitation
of the results. In addition, an investigation into voluntary disclosures is not included in
the empirical research which may offer further insights and explanations into the results.
In contrast with the current research, Qian does not look into the implications of the Act
on voluntary carbon emission disclosures.
Borghei and Leung (2013), investigate voluntary greenhouse gas emission
disclosures made by non-registered NGER Australian companies on financial
performance. The research covers the period 2009 to 2011. The approach is based on an
accounting perspective rather than a market-based perspective and a cost-benefit
framework guides the research. The results from the content analysis and cross-sectional
regression suggest the quality and quantity of disclosures are positively associated with
the accounting-based proxies, return on assets and return on equity (Borghei & Leung
2013).
Borghei and Leung (2013) find the adjusted R2 for each accounting-based
measure, return on assets (ROA), return on equity (ROE) and return on sales (ROS) is
0.265, 0.199 and 0.181 respectively. These results are consistent with prior research
(Borghei & Leung 2013). Borghei and Leung (2013) suggest greenhouse gas
disclosures contribute 26.5% of the explanations for the ROA ratio and 19.9% for ROE
ratio; however disclosures are not significant for return on sales. It appears consumers
are not using greenhouse gas disclosures to value products as yet. Understandably the
control variables, revenue and expenses are significantly correlated to each of the
accounting-based measures; however revenue and expenses are also significantly

84
correlated with greenhouse gas disclosures as indicated by the table of Pearson
correlations. This suggests these three variables are not mutually exclusive. Since there
is a strong relationship between revenue and greenhouse gas disclosures, and expenses
and greenhouse gas disclosures, these influences could also be exerting an impact on
greenhouse gas disclosures and the ROA and ROE ratios. Consequently, the results
cannot provide a strong argument purely based on a cost-benefit analysis for non-
registered NGER Australian companies to voluntary disclose greenhouse gases. This
suggests research needs to look further than a cost-benefit analysis perspective.
Choi, Lee and Psaros (2013) investigate voluntary carbon emission disclosures
in annual and sustainability reports of the largest 100 Australian companies listed on the
ASX between 2006 and 2008. The findings suggest voluntary disclosures had increased
over the period (Choi, Lee & Pasros 2013). The authors considered the NGER Act did
enhance voluntary carbon emission disclosures even though the Act was not operative
at that stage (Choi, Lee & Pasros 2013). Further, the results suggest that the level of
carbon emissions, firm size and corporate governance were predictors of voluntary
carbon emission disclosures (Choi, Lee & Pasros 2013). In addition, Choi et al (2013)
find industry association is positively related with voluntary disclosures. However, the
variable industry association included energy, transportation, materials and utilities
classifying these industries as emission-intensive trade-exposed (Choi, Lee & Pasros
2013). Including these industries together reduced the ability to distinguish between the
different industries and their voluntary disclosures. In contrast, this thesis separately
identifies the materials, energy, industrial and ‘others’ shedding light on the specific
emission-intensive industries that voluntary disclosed and those that did not. Further,
the current research is a longitudinal study that covers a seven year period that examines
the differences in disclosures between NGER registered firms and Non-NGER firms
pre- and post-NGER Act strengthening the robustness of the findings.

85
Nevertheless, the Australian research surrounding the NGER Act 2007 is still
limited to date. Prior research uses either a small sample size and/or takes a temporal
view of the legislation’s impact on firm’s carbon emission disclosure patterns. In
contrast, the current research uses a larger sample size and undertakes a longitudinal
investigation of the impact of the legislation. The introduction of Australian legislation
in 2007 and its potential future expansion and the growing awareness of the risks
associated with climate-change cannot be ignored. Even though firms may have a desire
to suppress climate change risks rather than ignore the risks, it is clear the current
economic environment has changed since 2007 due to climate change issues. Therefore
the thesis is positioned within the organisational operating context by viewing the
results through both micro and macro system-oriented theories and a socio-economic
theory.
3.4 Chapter Summary
Prior literature into voluntary disclosures is extensive both internationally and in
Australia. The types of research, multiple theories and methods provide diverse scope.
Research evolved from investigating the quantity of disclosures to include a variety of
theoretical frameworks. Single or multi-theoretical frameworks have been explored in
prior literature. In addition, research categorised the types of disclosures to ascertain
the quality of the disclosures (Clarkson et al. 2008; Gibson & O'Donovan 2007).
However, an exclusive explanation behind voluntary disclosures or one set of reasons to
disclose was not forthcoming. A single theoretical framework did not offer an exclusive
interpretation. Prior research acknowledges there are many reasons to disclose; reasons
that work in unison and which are not exclusive (Deegan 2002b). Questions have also
been raised about the mixed results. Patten (2002) noted inconsistencies in prior
research that countered the expectations of the socio political theories. He considered

86
that poor performance measures, controls and sample selection contributed to these
irregularities.
A common thread in research is the use of cross-sectional studies based on small
sample sizes that focus on content analysis. Findings suggest disclosures tend to be
general in nature, providing positive news rather than disclosing the operational risks
the firms face. Studies also note voluntary disclosures are inconsistent and incomplete
that tend to be intermittent and reactive (Guthrie & Parker 1989). Disclosures have a
tendency to remain low and environmental performance does not equal voluntary
environmental disclosures, which raises questions about the usefulness of the
information (Cunningham & Gadenne 2003; Simnett & Nugent 2007). Further, the
worst polluters received the greatest negative reaction (Freedman & Patten 2004). Not
surprisingly, research documented that firms within Australia, a carbon-based economy,
lagged behind the level of voluntary environmental disclosures that are made overseas
(Adams & Frost 2007; Guthrie & Parker 1990).
Even though climate change and global warming increases firm’s visual
environmental presence, these concerns to date are not successfully transferred to
international accounting standard reporting requirements in the annual reports or other
media. This is in spite of environmental stakeholder calls for objective measures to
distinguish between good and poor environmental performers (Clarkson et al. 2008).
Nevertheless, the changing regulatory environment within Australia provides
motivation and stimulation to investigate the implications of legislation on voluntary
carbon emission disclosures. In Australia, legislation requiring the reporting of
emissions was limited to the NPI until the NGER Act 2007 was legislated. Longitudinal
studies on the NGER Act and associated research into voluntary carbon emission
disclosures and the determinants to disclose are limited to date. Through the use of a

87
longitudinal study, a large sample size and a multi-theoretical framework that is based
on socio-political and economic-based theories, this thesis captures changes in
voluntary carbon emission disclosures made by firms operating within a carbon-based
economy. This thesis is extended by investigating the determinants, including the
assurance of carbon emissions, a requirement that is associated with changes in the
regulatory environment. This thesis compares and contrasts a treatment group with a
control group over time. The next chapter develops the multi-theoretical framework.

88
4 Theoretical Framework and
Development of the Thesis Hypotheses
Even though the Commonwealth Government mandates the reporting of carbon
emissions via the NGER Act 2007, the NGER Act does not require any reporting other
than to one stakeholder, the government (Cotter, Najah & Wang 2011). The NGER Act
is in response to government’s need-to-know, therefore its presence possibly enhances
pressures on firms to voluntarily disclose carbon emissions. Voluntary disclosures are a
significant communication tool for managers to report to stakeholders (Deegan 2005). A
firm has a number of stakeholders apart from government, such as investors, creditors,
suppliers, industry bodies, insurers, employees, consumers, media, analysts, interest
groups and the public (Deegan 2005). However, voluntary disclosures permit wide
discretion for managers (Bewley & Yue 2000) and are associated with minimal or good
news disclosures rather than providing extensive informative information (Deegan &
Rankin 1996). Therefore to understand the implications of the NGER Act 2007 on
disclosure practices, this thesis draws from a number of theories to define the research
framework and to provide insights behind the motivation to voluntarily disclose.
4.1 The Theoretical Framework
A Positive Theory approach helps to understand the larger social system within
which firms exist. Positive Theory encompasses economic-based and systems-oriented
theories (Deegan 2002b) such as legitimacy, stakeholder, institutional and signalling
theories. As the systems-based theories overlap, it is recommended that using a
combination of theories may provide greater insight into why managers voluntarily
disclose information (Deegan 2002b). McWilliams, Siegel and Wright (2006) consider
the theory selection, methods and analysis associated with corporate social
responsibility are still developing. This suggests, the theoretical framework and

89
methods available to investigate voluntary carbon emission disclosures, one aspect of
corporate social responsibility remains diverse. Hence the objective of this research is
to draw on both systems-based and economic-based theories in unison to provide a
comprehensive explanation of voluntary disclosures and the determinants to disclose.
“Society, politics and economics are inseparable and economic
issues cannot meaningfully be investigated in the absence of considerations
about the political, social and institutional framework in which the
economic activity takes place. It is argued that by considering the political
economy a researcher is better able to consider broader (societal) issues
which impact how an firm operates, and what information it elects to
disclose” (Deegan & Unerman 2006).
As a result, this research draws on a combination of an economic-based theory,
signalling theory and socio-political theories, legitimacy and institutional. Using these
three theories in unison increases the explanatory power and understanding of the
phenomenon under investigation and extends existing research by gaining a greater
understanding of changes over time in voluntary carbon emission disclosures and the
determinants to disclose. The approach is consistent with prior research. Chen and
Roberts (2010) adopt a multi-theoretical view to acknowledge the dynamic operating
environment within which firms exist (Chen & Roberts 2010). Clarkson, Yue,
Richardson and Vasvari (2008) consider the operating environment of firms and adopt
an economic based theory and socio-political theories to frame their research. Cormier,
Magnan and Velthoven (2005) consider a multi-theoretical approach offers greater
insight than a single theory. Hence this research uses legitimacy, institutional and
signalling theories as the multi-theoretical framework to understand voluntary carbon

90
emission disclosures and the determinants to disclose that are made between 2005 and
2011.
4.1.1 Legitimacy Theory
Legitimacy theory considers that the firm continually strives to achieve the
norms within the boundaries that society establishes and this implies that a ‘social
contract’ exists (Deegan 2005). A social contract, regardless of whether it is implicit
(social expectations) or explicit (legal arrangements) (Deegan 2007), exists between the
firm and stakeholders/society (Shocker & Sethi 1973). As a consequence, stakeholders
provide pressures on firms to maintain the ‘social contract’ (Deegan 2007). However,
the terms of the social contract may be misinterpreted and society may react by
revoking the social contract, infringing on the firm’s continuation (Deegan 2007).
Therefore legitimacy is regarded as a resource by the firm (Dowling & Pfeffer
1975; O'Donovan 2002). The firm’s existence is dependent on achieving this resource
within society (Dowling & Pfeffer 1975; O'Donovan 2002). However, legitimacy is a
malleable resource that the firm can influence through voluntary disclosures (Deegan
2007). Voluntary disclosures are a tool that can be used to influence society’s
perception of the firm to influence society’s perception to a point where society accepts
that the firm’s presence and actions are in line with society’s values and norms (Deegan
2007).
The concept of legitimacy is dynamic. Society’s attitudes are continually
evolving due to the dynamic nature of the societal environment where values, beliefs
and norms are established and change over time. The notions of time and place underlie
the firm’s actions to legitimise their presence within the existing social system (Deegan
2007). Prior research suggests:

91
“Legitimacy is a generalised perception or assumption that the
actions of an entity are desirable, proper, or appropriate within some
socially constructed system of norms, values, beliefs, and definitions”
(Suchman 1995, p. 574).
Nevertheless, society’s perceptions change because of a number of reasons:
community expectations change (Lindblom 1994), certain events occur that have a
bearing on formal operations or industry (Patten 1992) or a legitimacy gap exists where
the manager does not believe there is a lack of disclosure (Deegan 2002b). Certainly
where the firm has undertaken remedial action, altering public perceptions cannot be
effective without disclosures (Cormier & Gordon 2001). However, if voluntary
disclosures are sufficient to calm societal fears then Deegan (2002b) suggests that
legitimising practices may permit the firm to continue operating even though that firm
may have an adverse impact on some groups within society. Puxty (1991) considers that
social progress can be adversely affected by the legitimising actions of firms. However,
“an organization may diverge dramatically from societal norms yet retain legitimacy
because the divergence goes unnoticed” (Suchman 1995, p. 574). The firm may appear
to be conforming to the social norms though in reality it is not. Hence, legitimacy is a
measure of society’s attitudes to the firm (Deegan 2007).
The continually changing bounds and norms of the social environment require
the firm to stay attuned to society’s attitudes and respond accordingly in order to meet
societal expectations and to maintain relevance and legitimacy. Therefore legitimacy
theory describes a predominantly reactive response to changes in the economic, social
or political environment (O'Donovan 2002). The ability of the firm to maintain
congruency with the social contract correlates with the firm’s growth and survival
(Deegan 2002b).

92
Chen and Roberts (2010) consider that while legitimacy theory emphasises the
firm’s focus on aligning its value systems with society’s, it does not explain how this
process is achieved, whereas institutional theory offers the explanation that firms adopt
established structures, rules and norms to legitimate the organisational presence.
Legitimacy and institutionalisation theories are closely entwined (Tilling & Tilt 2010).
Deegan (2007) considers institutional theory complements legitimacy theory.
At the heart of legitimacy theory is the notion of social contract. As cultures,
norms, and values vary across societies, the social contract under which firms operate
will be different from the one in another country. What is legitimate in one society may
not be legitimate in another society. The growing concerns of climate change and its
relation with carbon emissions may have changed the social contract of firms operating
in Australia. They might feel the pressure of disclosing carbon emissions in an
environmentally conscious Australian society.
4.1.2 Institutional Theory
Earlier research by DiMaggio and Powell (1983) contribute to the institutional
theory literature and increases the understanding of the homogenous conformation of
firms. DiMaggio and Powell (1983, p. 147) argue
“the causes of bureaucratization and rationalization have changed”,
and continuing, “Today, however, structural change in organizations seems
less and less driven by competition or by the need for efficiency”.
DiMaggio and Powell (1983) investigate the concept of organisational
homogeneity and the factors that contribute to similarities between firms. Powerful
influences such as the state, competition and professions contribute to homogeneity
(DiMaggio & Powell 1983). “Institutional isomorphic change” (DiMaggio & Powell

93
1983, p. 150) occurs as organisational homogeneity evolves. DiMaggio and Powell
(1983) describe three methods of isomorphic change: a) coercive isomorphism; b)
mimetic isomorphism; and c) normative isomorphism. The structure of the environment
within which the firm exists influences organisational change (Vasi 2007).
Coercive isomorphism occurs when political influences increase and issues arise
with legitimacy (DiMaggio & Powell 1983). Societal expectations (the firm’s legitimate
presence), political authority and centralized pressures are factors that contribute to
coercive isomorphism (DiMaggio & Powell 1983). When a firm adopts standard
responses to uncertainty, this reflects mimetic isomorphism. Mimetic isomorphism is
where a firm often models its actions on another successful firm from the same industry
(DiMaggio & Powell 1983). Professionalization is associated with normative
isomorphism (DiMaggio & Powell 1983). Members of specific industries or work
arenas attempt to align processes and methods of production or behaviour with an
established organisational norm that defines the industrial autonomy. Normative
pressures arise both externally and internally to the firm (Zucker 1987). External
pressures may originate from state requirements and/or industry procedures, while
internal pressures arise from organisational structures that are in place (Zucker 1987).
Forces and pressures lead the firm to align with its institutional environment;
institutional isomorphism (Zucker 1987). The goal is to legitimise the firm’s activities
and to ensure the survival of the firm (Zucker 1987). Establishing the firm’s legitimacy
therefore is also a key feature of institutional theory (Deegan 2002b). Depending on the
institutional structures surrounding the firm, firms will conform to external pressures
(Deegan 2002b). Firms conform to the ‘norms’ existing around the firm’s operations
(Deegan 2002b).

94
Jacobs and Lodhia (2011) indicate that structure and agency are important
considerations in sustainability reporting. The researchers consider institutional context
within which a firm is situated will have a bearing on a firm’s response to changes in its
operating environment (Douglas 1986). Therefore they adopt institutional theory in their
research.
Hoffman (1999) concludes that the institutional structures that govern firms and
society are significant forces that can be applied to address environmental issues. The
release of carbon emissions is a significant environmental issue coming to the fore since
the turn of the 21st century. The current research investigates the implications of the
NGER Act, an institutional structure. However, Chen and Roberts (2010) consider
legitimacy theory and institutional theory do not offer comprehensive explanations
behind the motivations to disclosure. Hence signalling theory is included in the
theoretical framework.
Institutional Theory helps us understand how organisational practice of one firm
can spread to other firms in the same industry and across different industries. While
legitimacy theory references to the society as a whole, institutional theory considers
individual firms, industries and sectors as the focus of its analysis. In this sense,
legitimacy theory and institutional theory are to some extent convergent with each
other. On the other hand, while legitimacy theory may not explain the process through
which the social contract of legitimacy of a firm changes, the institutional theory
focusses on the processes through which organisational practices evolve.
4.1.3 Signalling Theory
Signalling theory seeks to explain how information asymmetry is reduced
between informed and uninformed parties (Morris 1987). Potentially, adverse
consequences can arise for the firm if uninformed parties miss-value the firm – adverse

95
selection (Akerlof 1970). Signalling theory considers that disclosures are used to reduce
information asymmetry that exists between managers and stakeholders (Sun et al. 2010)
to reduce potentially negative views about the firm and increase the value of the firm
within the minds of stakeholders (Alvarez, Sanchez & Dominguez 2008). Signalling
theory relies on the assumption that information asymmetry exists, as management
holds valuable inside information compared with stakeholders about the firm (Peirson et
al. 2006). Signalling theory also suggests that profitable firms will supply the market
with additional and superior data (Bini, Dainelli & Giunta 2011). Firms seeking
resources from stakeholders have incentive to provide details on firm performance
(Bini, Dainelli & Giunta 2011). However, to achieve the credibility of the signal in the
eyes of stakeholders, the signal must not be easy and costless to replicate (Godfrey et al.
2006a; Morris 1987; Spence 1973).
Managers will signal to stakeholders through the reports and accounts,
regardless, of whether it is good news (expected profitability), neutral news (to avoid
negative suspicions) or bad news (to maintain credibility) (Godfrey et al. 2006a). Hence
signalling theory argues that firms will supply more information than what is demanded
(Godfrey et al. 2006a). However signals do not necessarily provide quality reporting
(Gray 2005) and the long-term credibility of the firm will be impacted if performance
does not align with the signal (Godfrey et al. 2006a).
Traditionally, environmental sustainability has not been a core focus of business
(Jacobs & Lodhia 2011). Resources that create external costs such as water usage and
pollutants, air contaminants and land degradation have been ignored as these resources
did not come under the direct control of the firm (Deegan 2005). These resources have
historically been overlooked in voluntary disclosures due to the difficulty in valuing the
external costs (Deegan 1995). Firms did not have an explicit mandate to focus on the

96
environment (Jacobs & Lodhia 2011). Nevertheless, with scientific evidence underlying
the urgency to value a finite resource, the earth’s atmosphere, accounting for the
negative impacts made, by carbon emission releases into the atmosphere is imperative.
Domestic and international pressures for action are increasing and influencing
changes in the political and institutional environment. Economic, social and political
changes reflect societal expectations corresponding with the knowledge carbon
emissions contribute to greenhouse gases, climate change and global warming (Garnaut
2008; Stern 2007). The legitimacy of the firm’s presence is being challenged. However,
firms’ scepticism regarding the science cannot go un-noted, though gradually the firm’s
acceptance of the evidence is occurring (Haque & Deegan 2010), or at least, there is
acknowledgement of the shift in public sentiment and the subsequent changes to the
firm’s operating environment and the social contract. Subsequently, firms are signalling
changes that are being made to reduce carbon emissions.
Therefore the focus in this research is on the application of legitimacy,
institutional and signalling theories to provide the framework through which to view
voluntary carbon emissions disclosures. There are direct and indirect pressures on firms
to convey information to stakeholders regarding the firm’s carbon emissions.
4.2 Voluntary carbon emission disclosures and practices
Prior research indicates that voluntary carbon emission disclosures have
remained at a low level (Adams & Frost 2007; Cunningham & Gadenne 2003; Frost et
al. 2005) which raises concerns about the usefulness of the information (Simnett &
Nugent 2007). Even though Haque and Deegan note an increasing trend to voluntary
disclose carbon emissions across the research period 1992 to 2007, they also consider
disclosures remained low. Nevertheless, the evidence relating to these studies occurred

97
prior to changes in the regulatory reporting environment. Choi, Lee and Pasros’ (2013)
research provides continuing evidence disclosures are increasing.
Once carbon emission thresholds are reached, firms are required to report
carbon emissions data to government. An extract of the data is made publicly available.
The NGER Act 2007 though, does not mandate carbon emission disclosures in annual
and stand-alone reports; therefore it is assumed firms are aligning activities to meet
stakeholders’ values and expectations. Socio-political theories suggest, disclosures
increase when firms’ public exposure increases (Patten 2002). Therefore, it is expected
that the quantity of voluntary carbon emission disclosures will increase over the
research period. As a result, the current research investigates the changes in voluntary
carbon emission disclosures in a longitudinal study covering a seven year timeframe
that encompasses the implementation of the NGER Act.
The growing concerns about climate change in Australia and its relation with
carbon emissions likely changed the social contract of firms operating in Australia. It is
possible that firms came under increasing social pressure to disclose carbon emissions.
Thus, legitimacy theory would predict that voluntary carbon emission in Australia
increased over time. Institutional theory would also make similar predictions because
voluntary carbon emission by one firm in an industry creates a pressure as well as an
opportunity for other firms in the same industry to disclose their carbon emissions data.
Thus, the first hypothesis is:
H1a: The extent of voluntary carbon emission disclosures has
increased over the years 2005 to 2011.
Prior research into voluntary disclosures surrounding the introduction of the
National Pollution Inventory (NPI) legislation suggest publicly-available regulated

98
environmental disclosures are a motivation for firms to voluntarily disclose in the
annual report (Cunningham & Gadenne 2003). Cowan and Deegan (2011) note reactive
disclosures did appear in the annual reports with the introduction of the NPI, suggesting
specific regulations do have an effect on voluntary emission disclosures. Patten (1992)
suggests when firms perceive a threat to their legitimacy, such as an adverse
environmental event, or in this case a threat of a legitimacy gap being exposed through
the release of carbon emission data on the government website, there will be an increase
in environmental disclosures. In addition, Patten’s (1992) findings suggest that there are
flow-over effects to other companies not directly affected by the adverse environmental
event. Even so, it is expected that NGER reporting firms will voluntarily disclose
carbon emissions more than Non-NGER firms. Both legitimacy theory and institutional
theory would suggest that NGER firms are more likely to disclose carbon emissions
related data voluntarily more than Non-NGER firms. This is likely because NGER firms
are under more social pressure than Non-NGER firms and incidence of institutional
practice of carbon emissions disclosure is likely to be more prevalent in NGER firms
than Non-NGER firms.
The hypothesis is:
H1b: There is a difference in carbon-related voluntary disclosures in
annual reports between NGER reporting firms and Non-NGER firms.
Socially-responsible corporate reporting appears in many reports, other than the
annual reports (Unerman 2000). The acceptance of sustainability reports as an avenue to
convey voluntary environmental information is advancing (Brown & Deegan 1998;
Joint Committee on Corporations and Financial Services 2006) with the number of
firms producing a sustainability report increasing. Therefore extending the investigation
to include sustainability reports is important despite the fact that sustainability reports

99
are not mandated. There is the expectation that NGER firms will voluntary disclose
carbon emissions more than Non-NGER firms in sustainability reports. Signalling
theory would suggest that the firms which are more proactive in carbon emissions
disclosure will also disclose more carbon emissions data in their sustainability reports to
provide a positive signal to their stakeholders. They would like to be perceived as good
corporate citizens by making greater disclosure in sustainability reports.
The hypothesis is:
H1c: There is a difference in carbon-related voluntary disclosures in
sustainability reports between NGER reporting firms and Non-NGER firms.
Firms that reach the government’s carbon emission reporting threshold are
required to register under the NGER Act. These firms are heavy emitters. Bewley and
Yue (2000) find three factors, outsiders’ knowledge about environmental problems, the
propensity to pollute and political exposure are positively related to increased general
voluntary environmental disclosures. Freedman and Patten (2004) note the worse
polluting companies incur greater negative reaction from the market. Therefore it is
expected that NGER-registered firms will voluntarily disclose carbon emissions data in
annual and sustainability reports pre- and post- legislation more than firms not required
to register under the NGER Act.
The hypothesis is:
H1d: Firms that are required to report under NGER Act will have more
voluntary carbon emission disclosures in annual and sustainability reports
pre- and post-NGER legislation than firms that are not required to report
under the NGER Act.

100
Haque and Deegan (2010) also note the increase use of sustainability reports to
convey carbon emission information over the period 2002 to 2007. Sustainability
reports are becoming a popular avenue to voluntarily provide environmental
information. To investigate the growing importance of sustainability reports the current
research considers whether disclosures are the same in annual reports and sustainability
reports for each NGER and Non-NGER firms.
The hypothesis is:
H2: There is a difference between voluntary carbon emission
disclosures made in annual reports from voluntary carbon emission
disclosures made in the sustainability reports for NGER and Non-NGER
firms.
The evolving perceptions of stakeholders and the changing context of values,
norms and beliefs provide the opportunity to view firms’ voluntary carbon
emissions disclosures in light of changing social expectations. However, broadening
the understanding of the determinants of voluntary disclosures on carbon emissions
will indicate how well-adapted Australian firms are with their dynamic
environment.
4.3 The Determinants of Voluntary Carbon Emission Disclosures
There are direct and indirect pressures on firms to convey information to
stakeholders regarding carbon emission levels and to reduce the imbalance of
information between informed and uninformed parties. When there are discrepancies of
information between managers and stakeholders, managers will make voluntary
disclosures to inform stakeholders that the firm is socially responsible and in an
economically sound position (Alvarez, Sanchez & Dominguez 2008; Sun et al. 2010) or

101
management is in control (Gray 2005). For example, management signals the firm is
taking specific action, such as undertaking corporate social responsibility (Gray 2005);
or voluntary disclosures are made to strategically signal adjustments firms are making
to changes in the operating environment while highlighting the ability of management
to negotiate social or environmental risks (Gray 2005).
As such, the role of the environment has taken a more prominent position in the
minds of stakeholders with the increasing awareness of climate change and specifically
the impact of carbon emissions, a previously undocumented externality. The importance
of environmental performance is growing to the extent that stakeholders are requiring
more information than just the financial statements to ascertain the quality of
management and their ability to reduce carbon emissions. This is evident by the
development of voluntary initiatives encouraging disclosures such as the CDP. The
effects of climate change on the firm present physical and operational risks for a firm’s
management. The firm faces damage to its reputation if management is perceived not to
respond to the pressures of changing societal expectations.
Managers hold inside knowledge about the firm’s capability to adapt and operate
efficiently within a carbon-constraint environment. Some firms are capable of
responding quickly and adapt in a more efficient manner compared with other firms.
However stakeholders such as investors do not have inside knowledge to accurately
gauge the firm’s capabilities. The incentive to reduce the costs of capital, avoid adverse
lobbying, reduce the adverse impact on reputation, reduce the cost of additional
regulation on monitoring, recording and reporting, provides the motivation for the firm
to communicate its superior ability to adapt to a low-carbon environment.
Firms emitting a high level of carbon emissions are not necessarily restricted to
one type of industry however high emitting firms may predominately represent certain

102
industries, such as the materials, energy and industrial industries. High emitting firms
face potentially higher operating costs due to measuring, monitoring, reporting,
reputational risks, regulatory/political costs and increases to the cost of capital. Hence it
is expected that high emitting firms will approach voluntary carbon emission
disclosures in a consistent manner across time and within the industry. If a high emitting
firm does not voluntary disclose in a manner consistent with other similar high emitting
firms, investors may interpret this as a signal for bad news (Alvarez, Sanchez &
Dominguez 2008).
In addition, industry guidelines do influence voluntary disclosure practices that
members adopt, as the firms within the same industry face the same volatility,
instability and complexity (Alvarez, Sanchez & Dominguez 2008). For example, the
transportation and energy industries that Alvarez et al. examine tend to disclose
information to reduce political costs and to avoid the impression that a lack of
information is an adverse signal (Alvarez, Sanchez & Dominguez 2008). Alvarez et al.
(2008) note that sensitive industries tend to be more visible and face higher political
costs; therefore these industries have incentives to send signals to divert costs.
Godfrey, Hodgson, Holmes and Tarca (2006a) consider the proprietary costs
associated with environmental disclosures are small despite the firm’s strategy possibly
being useful to other firms within the industry. In addition, voluntary environmental
disclosures have the potential to increase the firm’s socially responsible reputation
(Godfrey et al. 2006a). For example, Blacconiere and Patten (1994) find the adverse
reaction to the Bhopal disaster in India results in falling share prices; however the
impact on share prices is less for firms that make widespread environmental disclosures.
Therefore firms in high emitting industries such as the energy, materials and industrial
sectors are expected to voluntarily disclose carbon emissions more than other industries.

103
As already discussed earlier, both institutional theory and legitimacy theory would
suggest that energy, materials and industrial sectors would voluntary disclose more
carbon emissions data than firms in other sectors. Firms in these sectors are not only
likely to be under greater social pressure (hence, legitimacy threat) but also in these
sectors there will be higher incidence of voluntary carbon disclosures due to the nature
of these industries. (i.e., these industries are heavy emitters of carbon).
The hypothesis is:
H3: Firms in the energy, materials and industrial sectors will
voluntarily disclose carbon emissions more than other sectors.
Nevertheless, there are accounting implications associated with carbon markets
such as determining the value of carbon emission allowances, identifying assets and
liabilities and acknowledging the risks and uncertainties (Bebbington & Larrinaga-
Gonzalez 2008). Nonetheless, a carbon market translates environmental concerns to
economic activity by placing a cost on an activity that was once free (Bebbington &
Larrinaga-Gonzalez 2008). In order for carbon markets to function efficiently, credible
information is required. However, the NGER Act, Australia’s reporting foundation for a
carbon market, does not require reported data to be audited unless evidence indicates
that the firm contravenes the Act (Department of Climate Change and Energy
Efficiency 2012). Notwithstanding, the choice to establish the integrity of the
information and therefore obtain assurance is a voluntary undertaking. Discretionary
signals and the relaying of information potentially place the firm in an advantageous
position by influencing societal views about the firm. Nevertheless the signal requires
credibility prior to investors valuing the importance of the information (Herbig 1996;
Spence 1973). Credibility is established when the signal is not easily duplicated by
poorer performing firms. If the integrity of the signal is weak, the firm incurs penalties

104
(Gray 2005). Therefore the assurance of carbon emission data increases the integrity of
the signal sent to stakeholders. Firms with assured carbon emissions data have
incentives to voluntarily disclose credible carbon emissions information.
The hypothesis is:
H4: Firms with assured carbon emissions will voluntarily disclose
more carbon emissions information than firms that do not have carbon
emissions data assured.
The establishment of the carbon market is not a naturally-occurring phenomenon
(Kolk, Levy & Pinkse 2008). Rather the carbon market has been established through
political and institutional arrangements that are defined by legal and bureaucratic
structures outlining the rights and rules of operation (Kolk, Levy & Pinkse 2008). The
institutional arrangement surrounding the reporting of carbon emissions is growing. The
standardised information that is required provides a mechanism for accountability while
certain performance levels can be demanded, benchmarked and compared, rewarding
participants with reputational benefits (Kolk, Levy & Pinkse 2008). NGER firms are
heavy emitters that have reached the government’s carbon emission reporting threshold
and as a result are more likely to engage in carbon markets. Further, where firms have
an obligation under the NGER Act to report, then it is expected that these firms will
voluntarily disclose more carbon emissions data post-NGER than pre-NGER period. In
addition, it is expected potential legitimacy threats will have a flow-on effect (Patten
1992) to Non-NGER firms which are expected to follow a similar pattern.
The Hypothesis is:
H5a: There is a difference in the mean of the Pre-NGER Change and
the mean of the Post-NGER Change of NGER/Non-NGER firms

105
Standardized reporting of carbon emissions data to government is an
institutional structure applied to an environmental issue – carbon emissions. Hence this
research looks at the implications of the NGER Act on firms’ response to these
institutional changes and the implications that these changes have on voluntarily
disclosed carbon emissions. As a result, it is expected that differences exist between
NGER firms conforming to institutional structures and Non-NGER firms.
The Hypothesis is:
H5b: There is a difference in the mean change of the Pre-Post-Change
NGER Period for NGER firms and the mean change in the Pre-Post-Change
NGER Period for Non-NGER firms regarding carbon emissions-related
voluntary disclosures in the annual and sustainability reports
In addition, it is expected that changes will also be reflected in the method of
disclosures, such as keywords, words, sentences, graphs, tables and figures. Differences
are expected between pre-NGER changes and post-NGER changes for both NGER and
Non-NGER firms.
The Hypothesis is:
H5c: The NGER and Non-NGER firms’ use of keywords, words,
sentences, graphs, tables and figures are not the same across the means of the
Pre-NGER Changes in comparison with the means of the Post-NGER Changes
4.4 Chapter Summary
Research by Cormier et al (2005) suggest environmental disclosures are not the
product of a single force that can be encompassed within a single theory. Rather,
environmental disclosures have multidimensional influences with complementary
stimuli suggesting complementary theories in unison provide a comprehensive view

106
(Cormier, Magnan & Van Velthoven 2005). Therefore this research adopts a Positive
Theory approach by using systems-orientated theories, legitimacy and institutional
theories and an economics-based theory signalling to provide insights on the
implications of the NGER Act 2007 on voluntary carbon emission disclosures and the
determinants behind such disclosures. The combination of theories is used to provide in-
depth insights that otherwise could not encapsulate a comprehensive view.
This thesis investigates changes in voluntary carbon emission disclosures
between 2005 and 2011. The determinants behind these disclosures include industry
association, the assurance of carbon emissions, good corporate governance and firm
size. A comparison of changes in voluntary carbon emission disclosures pre-NGER
legislation with post-NGER legislation is also generated.
The next chapter outlines the sample selection, size and period under
investigation. Explanations of the dependent and predictor variables are also included
and the discussion continues with the analytical approach used in this thesis.

107
5 Sample Selection and Research
Methodology
5.1 Introduction
The objective of this thesis is to investigate changes in voluntary carbon
emission disclosures that have occurred over time and to note differences between the
periods before and after the introduction of the NGER Act 2007. Further, this research is
extended by investigating the determinants that contribute to changes in voluntary
carbon emission disclosures made between 2005 and 2011.
The chapter discusses the sample firms and sample selection, the sample period
capturing pre- and post-NGER periods, and discussion on the treatment and control
firms, as well as the available disclosure avenues through which firms voluntarily
disclose carbon emissions. The discussion continues with voluntary carbon emission
disclosures and the content analysis approach. The thesis models used to investigate the
determinants of voluntary carbon emission disclosures are introduced followed by
details on the predictor variables. Both independent and control variables are examined.
5.2 Sample Firms and Sample Selection
This thesis adopts an exploratory approach as there are no mandated guidelines
that stipulate the type or amount of carbon emissions information that is to be disclosed
in any reports to stakeholders. Firms have flexibility in discussing climate change and
carbon emissions while stakeholders are dependent on these disclosures. Therefore, this
thesis investigates voluntary carbon emission disclosures in the annual and
sustainability reports of 170 ASX listed companies in a longitudinal study covering a
seven year period from 2005 through to 2011 inclusive. This thesis adopts two
approaches, content and regression analyses to investigate voluntary carbon emission

108
disclosures by comparing two groups over time, comparing pre- and post-NGER
voluntary carbon emission disclosures for each group and identifying the underlying
determinants to disclose.
The 170 ASX listed companies consist of 85 firms that are listed on the NGER
register (NGER firms) and 85 firms not included on the NGER register (Non-NGER
firms). These firms represent 17 industry groups. Firms registered under the NGER Act
have reached the reporting threshold requirements and therefore are obliged to report to
government. The industry groups these firms cover include the Materials; Energy; Food,
Beverage & Tobacco; Transport; Real Estate; Utilities; Retailing and Commercial &
Professional Services sectors. Other sectors represented include Banks; Capital Goods;
Food & Staples Retailing; Media; Insurance; Healthcare Equipment & Services;
Telecommunications Services; Consumer Services and Pharmaceuticals.
The sample selection includes identifying publicly listed firms registered under
the NGER Act 2007. In addition publicly-listed firms not listed in the NGER register but
belonging to the same industries as the NGER firms, are match-paired by market
capitalization where possible. Secondary data is obtained from annual and sustainability
reports, the NGER register and the ASX for the period 2005 through to 2011. A total of
1,190 annual reports and 296 sustainability reports are investigated to specifically
evaluate voluntary carbon emission disclosures and the motivators to disclose. The use
of a larger sample size of 170 firms increases the generalizability of the findings.
5.2.1 Sample Period
This thesis timeframe commences from 2005 in the Pre-NGER period, and
extends past the implementation phase of the legislation (year 1 and year 2) to include
the first three reporting years up to 2011 in the post-NGER period. In 2005 knowledge
about the future legislation did not exist. However, the concept of a reporting

109
framework and the subsequent potential legislation that led to the NGER Act was
mooted during 2006, legislation was enacted in 2007 and the Act commenced in 2008.
Therefore firms’ awareness about the pending legislation did increase during the pre-
NGER period, 2005 through to 2008.
The period 2009 to 2011 is the post-NGER period. The NGER Act 2007 came
into force on 1 July, 2008 with 30 June, 2009 being the end of the first mandatory
reporting year (Department of Climate Change and Energy Efficiency 2007). The
timeframe in the thesis is significant as it permits the comparison between the pre- and
post-NGER periods’ voluntary carbon emissions disclosures and the identification of
changes over time.
5.2.2 Treatment and Control Firms
Prior Australian research investigating environmental disclosures using content
analysis have generally used small sample sizes. For example, Cowan and Deegan’s
(2011) study uses a sample size of 25 companies and investigates a two year period,
Deegan and Rankin (1996) investigate 20 companies over 3 years and Frost, Jones,
Loftus and van der Laan (2005) investigate 25 companies over a six week period. In
contrast, Rankin, Windsor and Wahyuni (2011) use empirical analysis to investigate a
snapshot view of 271 companies’ environmental disclosures.
Prior research focusses on heavy polluters with an emphasis on electricity
generation, paper, steel, oil and chemical industries (Cowen, Ferreri & Parker 1987;
Hackston & Milne 1996; Patten 1991; Patten 2002). However, the Department of
Climate Change and Energy Efficiency identified Electricity, Gas and Water (37%),
Primary Industries [includes Agriculture, Forestry and Fisheries (18.8%) and Mining
(11.6%)] (30.4%), Manufacturing (12.8%), Services, Construction and Transport
(10.7%) and Residential (9.3%) as the major Australian sectors contributing to

110
Australia’s greenhouse gases (Australian Government 2010, p. 2). Each of these
industries is captured in the NGER register.
As at 13 December, 2011, 825 entities are listed on the NGER register (Clean
Energy Regulator 2012a). Only 420 out of the 825 reporting entities actually had
information publicly released by the Clean Energy Regulator (Australian Government
Clean Energy Regulator 2012). An application to restrict the publication of data due to
commercial sensitivity is a viable option for corporations (Department of Climate
Change and Energy Efficiency 2012). Further, the NGER register’s population frame
consists of proprietary limited companies, miscellaneous entities, limited companies not
listed on the ASX and ASX listed companies. Firms that are not listed on the ASX and
did not have annual reports available through the Connect 4, Aspect Huntley
FinAnalysis and Aspect Annual Reports Online Databases are removed from the
sample. Entities removed from the total of 420 available entities include 214 Proprietary
Limited companies, 54 miscellaneous entities2, 46 Limited companies that are not listed
on the ASX and 17 companies that did not have a full set of annual reports available
through the databases. This results in 89 ASX listed NGER firms in 2011.
In addition to these 89 NGER firms, 87 Non-NGER firms are sourced for
comparison. In this research, this is the preferred approach rather than comparing the
NGER firms to a base year. A comparison between NGER and Non-NGER firms
increases the likelihood that the firms experience similar external operating conditions
each year. A list of ASX registered firms are generated from the Aspect Huntley
FinAnalysis Database. All NGER registered firms are removed from the list. Non-
NGER ASX listed firms are selected from the remaining list.
2 Miscellaneous Entities includes partnerships, postal corporation, water corporations, waste
corporations, hydro-electric corporations, electrical utilities, councils, trusts, government organisations,
universities, co-operatives, NL and health corporations.

111
The criteria for the Non-NGER firms require ASX listing, not being under
obligation to report under the Act and are similar in size in terms of market
capitalisation within the same industry classification. This provides a matched-pair
design where possible between the NGER and Non-NGER firms. This thesis uses a
final sample size of 170 ASX listed firms in a longitudinal study, to investigate changes
in, and determinants of, voluntary carbon emission disclosures. A larger number of
observations over a longer time frame increases the expectation to improve the ability to
predict and explain such disclosures. When certain conditions are met then predictions
can be made (Deegan 2005). The 17 industry groups used in this thesis are listed in
Table 5.1. All the ASX listed firms are included in Appendix 1 along with the industry
group, ASX listing code and market capitalisation.

112
Table 5.1 The sample represents nine GICs sectors and seventeen industry groups
Sector Industry Group NGER Firms NGER Percentage Non-NGER Firms
Non-NGER
Percentage
Energy Energy 7 8.2% 7 8.2%
Materials Materials 30 35.3% 30 35.3%
Industrials Capital Goods 5 5.9% 5 5.9%
Commercial & Professional Services 5 5.9% 5 5.9%
Transportation 5 5.9% 5 5.9%
Consumer Discretionary Consumer Services 2 2.4% 2 2.4%
Media 2 2.4% 2 2.4%
Retailing 3 3.5% 3 3.5%
Consumer Staples Food & Staples Retailing 2 2.4% 1 1.1%
Food, Beverage & Tobacco 6 7.1% 6 7.1%
Health Care Health Care Equipment & Services 2 2.4% 2 2.4%
Pharmaceut’ls, Biotechnology & Life Sciences 1 1% 1 1.1%
Financials Banks 4 4.7% 4 4.7%
Insurance 2 2.4% 2 2.4%
Real Estate 6 7.1% 6 7.1%
Telecom’ication Services Telecommunication Services 1 1% 1 1.1%
Utilities Utilities 2 2.4% 3 3.5%
Total Companies 85 100% 85 100%
List adapted from the Standard & Poors and MSCI Barra GICs Structure (Standard & Poors & MSCI Barra 2008).

113
The initial sample size of 176 ASX listed firms is reduced to a final sample size
of 170 firms. After further investigation, two NGER firms, Redbank Energy Limited
and SP Australia Networks did not have a full set of annual reports available for the
seven years. These firms are removed from the sample. These firms are from the
Utilities industry group. This reduced the number of NGER firms under the Utilities
industry group from 4 to 2. In addition, the two firms APA Group and Dexus Property
Group are removed from the Non-NGER firms as these firms are found to report under
the NGER Act. This information is identified through voluntary disclosures released in
the annual or sustainability reports and not through the NGER register. This raises the
possibility that not all NGER registered ASX listed firms are identified through the
register, and this possibility may consequently limit the generalizability of the findings.
This left 87 NGER firms and 85 Non-NGER firms. To match the total number
of NGER firms with the total number of Non-NGER firms another two NGER firms are
removed. The smallest NGER firm in the Real Estate industry group which did not have
a match-pair is removed resulting in the Real Estate industry group being represented by
6 NGER and 6 Non-NGER firms (refer to Table 5.1). Likewise the smallest NGER firm
in the Food & Staples Retailing industry group is removed. It was not a matched-pair
with a Non-NGER firm. After these adjustments, the GICs industry group, “Food &
Staples Retailing” contained two NGER firms and one Non-NGER firm. Even though a
matched-pair in size and industry is targeted for each NGER firm, these two GICs
Industry Groups, the Utilities group and the Food & Staples Retailing group, are not
evenly represented (please refer to Table 5.1).
As can be seen from Table 5.1, the main sectors represented by the sample are
Materials followed by Energy and Real Estate. These three sectors represent a total of
50.6% of the sample size. In total, eight sectors each have four or more firms

114
represented. These eight sectors represent 80% of the total 170 firms (68 NGER and 68
Non-NGER firms) and consist of Materials; Energy; Real Estate; Food, Beverage &
Tobacco; Transportation; Commercial & Professional Services; Capital Goods and
Banking sectors.
The remaining 20% of the firms represent the last nine sectors. Two of these
sectors consist of only one NGER and one Non-NGER firm each. To concentrate only
on the main sectors would eliminate investigation into the industry sensitivity
determinant and the rich insights that this provides. However, it cannot be considered
that one company is representative of its sector; as a result this thesis assembled the
industry groups into four main parts: Materials, Energy, Industrials and others. This
approach captures a general overview of current trends across the 17 industry groups.
The Global Industry Classification Standard (GICs) provides consistency and
the basis for the match-paired design employed in this thesis. The GICs is recognised
worldwide and this standard is used in the Aspect Huntley Annual Reports Online
Database and the ASX. Using the matched-pair design (Selvanathan et al. 2000) ensures
that all companies with similar characteristics are used for comparison and reduces the
influence of extraneous variables (Zikmund 2003).
To address the size selection, this research adopts the Barber and Lyon’s (1997)
process to match firm size. Similar sized Non-NGER firms are identified when the Non-
NGER firms fall in the 70 to 130 percentage range of the NGER firms’ market value of
equity for firms within the same industry (Barber & Lyon 1997). The 70 to 130
percentage range is an acceptable method to determine size (Barber & Lyon 1997). In
this research the 70 to 130 percentage range is based on the 2011 market capitalisation.
When difficulties arose in matching sizes, such as in the case of the banks where the
largest four Australian banks reported under the NGER Act, then by default the next

115
four largest companies that had annual reports available for the period are selected. In
these cases it is impossible to match firm size. As a result, the inability to fully use the
matched-pair design provides limitations in this thesis.
Each firm is exclusively categorised as either a NGER or a Non-NGER firm and
is counted only once. This process overcomes sampling frame error. These adjustments
resulted in 85 NGER and 85 Non-NGER firms. The total sample size of 170 firms
represents 7.86% of the total of 2,162 companies listed on the ASX as at 2 October,
2012 (Australian Securities Exchange 2012).
Each NGER firm is given a unique identifying number for the ease of data
analysis. The identifying number is issued in order of the GICs Industry group as
follows: Materials; Energy; Real Estate; Food; Transportation; Commercial &
Professional Services; Capital Goods; Banks; Utilities; Food & Staples Retailing;
Retailing; Media; Health Care Equipment & Services; Consumer Services; Insurance;
Pharmaceuticals and Telecommunication Services. Further, the identifying number is
issued in order of the market capitalisation for each firm in each GICs Industry Group.
For example, BHP is the largest company as per market capitalisation in the Materials
group during 2011 and is given the number NGER_1_11, while Navigator Resources
Limited is the smallest company as per market capitalisation in Materials hence is
issued with the identifying number NGER_30_11. The last two digits represents the
relevant year. Likewise the remaining firms in each GICs Industry Group are arranged
according to market capitalisation within the GICs Industry Group and numbered
accordingly. A corresponding identifying number is used to highlight the matching
Non-NGER firm. For example, the matched-pair firm for Navigator Resources Limited,
NGER_30_11 is Ashburton Minerals Limited, Non-NGER_30_11. Where similar sized
firms could not be identified, corresponding numbers could not be given to the Non-

116
NGER firms, the control group. These firms are recorded as Non-NGER No Match.
However, each industry is represented by a similar number of Non-NGER firms as
NGER registered firms where possible. Likewise, a corresponding ID number is issued
to firms with sustainability reports to facilitate the ease of association to the relevant
firm. For example, BHP Billiton Limited’s Sustainability Report is identified by
S/R_NGER_1_11. Table 5.2 lists the total number of NGER firms, as per industry
group, in the right-hand column. The two columns on the left indicate the number of
Non-NGER firms in each industry group that matched or did not match in size with the
NGER firms.

117
Table 5.2 The total number of NGER and Non-NGER firms used in this thesis as per GICs
Industry Group
GICs Industry Group NGER match No match
Number short in
the GICs group
Total
NGER
Companies
Materials 19 11
30
Energy 2 5
7
Real Estate 3 3
6
Food 3 3
6
Transportation 1 4
5
Commercial & Professional
Services 3 2
5
Capital Goods 4 1
5
Banks 0 4
4
Utilities 1 1
2
Food & Staples Retailing 0 1 2 3
Retailing 0 3
3
Media 1 1
2
Health Care, Equipment &
Services 2 0
2
Consumer Services 2 0
2
Insurance 2 0
2
Pharmaceuticals 0 1
1
Telecommunication
Services 0 1
1
Totals 42 41 2 85
5.2.3 Disclosure Avenues Investigated
Disclosure avenues that are available through which a firm releases information
to stakeholders include: annual reports, sustainability reports, websites, media releases
and stock exchange announcements. Even though media releases and stock exchange
announcements are material in nature, these disclosure avenues do not provide in depth
information on carbon emissions and therefore will not be investigated. The content of
websites will also not be investigated despite the potential timeliness, scope,
interactivity and real-time information that is available (Craven & Martson 1999; Frost
et al. 2005; Patten & Crampton 2004). The inability to determine when information is
118
released on websites increases the difficulty to determine the relevance of the data to a
given period of time. In addition, accessing past website releases are beyond the
capabilities of this research. This approach is consistent with Cowan and Deegan
(2011). It is acknowledged however that a focus only on the annual and sustainability
reports does overlook the potential value provided by the websites.
Annual reports traditionally have been the avenue used to investigate
environmental information disclosed to shareholders (Brown & Deegan 1998; Cowan &
Deegan 2011; Deegan, Rankin & Tobin 2002; Deegan, Rankin & Voght 2000;
O'Donovan 2002; Tilling & Tilt 2010). Even though annual reports are historical in
nature the reports do convey both financial and non-financial information.
Lang and Lundholm (1993) find the annual reports are a suitable avenue to
investigate disclosures. Deegan and Rankin (1997) verified the importance of annual
reports as a medium through which to disclose environmental news. Their research
found statistically significant results that led to the conclusion that stakeholders place
importance on environmental information in the annual reports. Therefore it would be
expected that annual reports do provide emission disclosures to investors.
Nevertheless, Unerman (2000) noted that socially-responsible corporate
reporting is appearing in many reports, other than the annual reports. The popularity of
sustainability reports as an avenue to convey voluntary environmental information is
evolving (Brown & Deegan 1998; Joint Committee on Corporations and Financial
Services 2006) with the number of firms producing a sustainability report growing.
However there are issues with the sustainability reports. The reports are not consistently
produced annually, not all firms produce a report (Stubbs, Higgins & Milne 2013) and
in some cases the reports are released bi-annually reducing the timeliness of information

119
to the investor (Frost et al. 2005; Haque & Deegan 2010; Simnett & Nugent 2007). For
example, released reports may refer to two or more years earlier than the current period.
A constraint on reliable information is the timeliness of the information. The Macquarie
Pocket Dictionary defines the word timely as meaning ‘happening at a suitable or right
time; opportune’ (Blair & Bernard 1998, p. 1088). If voluntary disclosures on carbon
emissions are being delayed, then the delay could impact on the relevance of the
information for the investor. Haque and Deegan (2010) found inconsistent production of
sustainability reports occurred over the research period 1992 to 2007 and finally
confined the use of sustainability reports in their research to the period 2002 onwards.
Nevertheless, despite the delay and inconsistency of the sustainability reports, these
reports are developing as a source of environmental information. Prior research suggests
discrete reports do provide additional information (Frost et al. 2005; Patten & Crampton
2004). Therefore sustainability reports are also investigated to determine the extent and
types of carbon emissions information that is being voluntarily disclosed.
Sustainability Reports for the years 2005 to 2011 are sourced from the Corporate
Register, Sustainability Disclosure Database (GRI), Osiris Database and company
websites. A search of the CorporateRegister.com website revealed 22 NGER firms
produced a sustainability report in 2005 and this number increased to 42 by 2011. The
use of the CorporateRegister.com to access sustainability reports has previously been
conducted by Cowan and Deegan (2011). Table 5.3 outlines the number of
sustainability reports produced by 85 NGER and 85 Non-NGER firms over the thesis
period.

120
Table 5.3 The number of Sustainability Reports produced by 85 NGER and 85 Non-NGER firms
2005 - 2011
2005 2006 2007 2008 2009 2010 2011
NGER firms 22 27 30 36 39 43 42
Non-NGER firms 5 6 9 9 9 9 10
Each firm’s sustainability report is assessed and coded manually. Voluntary
carbon emission disclosures do not have a set format or required method for
presentation to allow a comparison of data either across the years, within an industry or
across different industries. In addition, firms from different industries use different
methods to portray the firm’s progress in reducing carbon emissions. For instance the
Real Estate industry (Mirvac Limited, Stockland Corporation Limited) focusses on
achieving higher NABER ratings. A higher rating indicates a lower emissions level in
comparison with industry standards. Alternatively, the transport industry frequently
refers to emission reductions in terms of lowering emissions per passenger kilometres
(Qantas Airways Limited). As a result, the use of a diverse range of methods does not
permit easy comparability between firms and between industries.
5.3 Voluntary Carbon Emission Disclosures
Investigating the period 2005 to 2011 highlights changes in voluntary carbon
emission disclosures between pre- and post-NGER periods. The approach is
exploratory, rather than a comparison of actual disclosures with what ‘should’ be
disclosed, as set out by established voluntary disclosure guidelines such as the Global
Reporting Initiative, CDP or the ISO Standards. Therefore a disclosure index is not
established.
The first part of this research uses content analysis (Krippendorff 1980) to
develop a comprehensive view of the extent and type of voluntary carbon emission

121
disclosures during the research period. Content analysis is a multipurpose technique that
can either be used to infer implications of the findings or to provide a description of
data under investigation (Holsti 1969). The purpose of content analysis within the
context of this research is to provide a description of voluntary carbon emissions
disclosures thereby outlining the changes in disclosures over time.
A checklist, decision rules and a list of the type of disclosures, are developed to
guide the thesis. This approach is consistent with Hackston and Milne (1996) adapting
an interrogation instrument and checklist from the work of Ng (1985) and Ernst and
Ernst (1978). Hackston and Milne’s checklist provides an exhaustive list of criteria for
the content analysis of their research. Consequently, to follow their example this
research develops a checklist that utilises Hackston and Milne’s environment theme,
one part of their environmental disclosure checklist. However, an adaption to the
environment theme is necessary. The importance of carbon emissions as an
environmental pollutant is recognised more today than in 1996. Certainly, since the
early 1990’s the awareness about climate change has steadily grown.
Haque and Deegan (2010) also develop a checklist, a table outlining climate
change-related governance issues identifying eight general issues that include Board
Oversight, Senior Management Engagement and Responsibility, Research and
Development, Corporate Reputation, Carbon Pricing and Trading,
Reporting/Benchmarking, Potential Liability Reduction and Emissions Accounting.
Specifically, the Emission Accounting issue identifies eight specific issues (Haque &
Deegan 2010).
The original ten items on Hackston and Milne’s (1996) environmental pollution
checklist along with Haque and Deegan’s (2010) eight items on specific Emission
Accounting issues are presented in Appendix 2. These checklists are used to develop a

122
checklist for the current research which is presented in Table 5.4 capturing information
on voluntary carbon emission disclosures.

123
Table 5.4 Carbon Emission Disclosure Checklist and Decision Rules
Carbon Emission Disclosure Checklist Decision Rules
1. Disclosures quantifying direct/indirect carbon emissions 1. The Directors’ Report is not checked as environmental information
appearing in the Directors’ Report is mandated under the Corporations
Act 2001 (Cth) s299 (1)(f)
2. Control of carbon emissions from business operations and abatement
identified by capital outlays, operating costs and research &
development expenses into new technologies;
2. Disclosures are required to be explicitly stated not implied
3. Specific policies exist for the development of renewable energy sources 3. Disclosures are identified by time – past/present/future
4. Statements highlighting emissions from operations will or has been
reduced;
4. Disclosures are also classified by content – specific/general
5. Emission prevention; 5. Disclosures are classified by mood – positive/negative/neutral news
6. Reference to the National Greenhouse and Energy Reporting data; 6. Information is categorised as non/financial quantitative or qualitative
7. Reference to the Greenhouse and Energy Reporting Office and Clean
Energy Regulator;
7. If a sentence identifies with more than one characteristic within a group
such as stating both positive and negative aspects, then the sentence will
be aligned with the main characteristic
8. Carbon emission savings and offsets are calculated and disclosed 8. Graphs, tables and figures are recorded separately from the word and
sentence count and are counted once based on the main characteristics.
9. A baseline year has been established to benchmark future progress in
carbon emission reductions
9. In addition, where tables and graphs show a number of years such as the
preceding years/the current year/future years, the table/graph is recorded
as “present” rather than past or future, because the table/graph positions
the present year in terms of its overall progress.
10. Set targets are in place for carbon emission reductions 10. Sentences duplicated in different sections of the annual and sustainability
reports will be recognised for each occurrence. Even though additional
repeated sentences do not add further information, the quantity of
disclosures highlights the importance the firm places on climate change
and carbon emissions. Krippendorff (1980) suggests the quantity of
disclosures is an important indicator of the importance of the subject.
Therefore noting the changes in quantities of voluntary carbon emission
disclosures over 2005 to 2011 is expected to provide an indicator of the
growing importance of carbon emissions.

124
Table 5.4 Carbon Emission Disclosure Checklist and Decision Rules Continued
Carbon Emission Disclosure Checklist Decision Rules
11. Assurance processes on carbon emissions data provides data verification 11. A research hierarchy is followed. Keywords are searched in the
following order: ‘carbon’, ‘emission’, ‘greenhouse’, ‘gas’, ‘GHG’,
‘Climate Change’, ‘Global Warming’, ‘NGER’ and ‘National
Greenhouse and Energy Reporting’. The keywords are selected in order
of the research hierarchy. If the same keyword that has been identified
appears in the sentence more than once, the number of entries is counted.
Other keywords are not counted because the sentence has already been
captured by the first identified keyword in the hierarchy. The number of
words is counted in each sentence the keyword appears.
12. Supply chain solutions are in place to reduce carbon emissions 12. When keywords are used in a different context other than carbon
emissions and greenhouse gas pollutants, the keyword is ignored. For
example when ‘emission’ is identified within the context of ‘dust
emissions’, the keyword ‘emission’ is not relevant. The context of the
keywords to capture carbon emissions and greenhouse gas pollutants is
important to this investigation.
13. Specific areas are not covered by the keyword search. For example,
keywords identified in headings and/or the glossaries are not included in
the count. Keywords in the glossary are associated with meanings of
words and do not provide information on the firm’s emission reductions.
Likewise keywords used in headings are providing direction for the
reader rather than providing precise statistics or information about
emissions reduction. Information on emission reductions is provided in
the text that follows. Other areas that are not included are references to
the Global Reporting Initiative, CDP, ISO Standards, discussions about
the carbon tax or Australia’s Clean Energy Future Legislation. Refer to
Table 5.5 for a list of definitions to assist the interpretation of each
keyword within the thesis context.
14. The thesis also notes if emissions are quantified in the annual and
sustainability reports and whether this information matches the data
released by the Clean Energy Regulator.

125
In addition to the checklist, decision rules are also established to guide the thesis
and to provide a consistent interpretation (Table 5.4). The work of Hackston and Milne
(1996) provides the basis for the decision rules in this research and are designed in
consultation between the author and the supervisors. However, the decision rules are
inherently subjective in nature and are therefore a limitation of this thesis. Table 5.5
presents keyword definitions used in the thesis.
Table 5.5 Keyword Definitions used within this thesis context
Keyword Definition within this thesis context
Emission The by-product of production – gases that contribute to identified
carbon dioxide equivalents in the atmosphere
Carbon Carbon as referring to carbon dioxide
Greenhouse Greenhouse as referring to greenhouse gases
Gas The by-product of production - gases that contribute to identified
carbon dioxide equivalents in the atmosphere.
Climate Change Refers to the extreme short- and long-term weather conditions induced
by greenhouse gases.
Global Warming The adverse impact of greenhouse gases.
GHG Greenhouse Gas
NGER National Greenhouse and Energy Reporting
National Greenhouse and
Energy Reporting
A phrase to capture references to the Act, register, scheme or process
5.3.1 Content Analysis
A requirement of content analysis is to establish the recording units and the
units of measurement. The units of measurement can include the number of words,
sentences, pages, page percentage and percentage of total disclosures (Cowan & Deegan
2011). However, the single word is the smallest unit that is generally used (Holsti 1969)
and the safest unit to quantify the content analysis (Krippendorff 1980). Even though
the use of the single word captures the word under investigation, the words need to be
placed within context (Holsti 1969). Sentences provide the meaning to the words

126
(Hackston & Milne 1996; Unerman 2000). Therefore this research uses sentences as the
recording unit and the number of words as the unit of measurement. This approach
follows the pattern adopted by Cowan and Deegan (2011). The data can be captured
either by the number of disclosures or the extent of disclosures (Haque & Deegan
2010). The aim of the content analysis is to highlight the changes that have occurred
over time and within the context of the changing regulatory environment.
The content analysis identifies the nature of voluntary carbon emission
disclosures, as reported in the annual and sustainability reports. Four groups of
descriptors are used to capture the characteristics of the sentences providing a broad
overview of the ‘nature of disclosures’ (decision rules No. 3, 4, 5, & 6 in Table 5.4).
These groups identify disclosures by referring to the time period, classifying by content
and mood, and categorising by quantitative/qualitative characteristics. The Table 5.6
sets out the nature of disclosures and their meaning within the context of this research.

127
Table 5.6 Definitions of words used to determine the Nature of Voluntary Carbon Emissions
Disclosures
Word Meaning
Past Events occurring in previous financial years; past events have a greater potential to be
verified (Clarkson et al. 2008)
Present Events occurring in the current financial year
Future Events expected to occur in future financial years; future expectations are unverifiable
(Clarkson et al. 2008)
General Information that does not describe how or present strategies or discusses focus areas;
general references tend to be unverifiable (Clarkson et al. 2008)
Specific Information is provided on how, on strategies and/or focus areas; specific information
is verifiable (Clarkson et al. 2008)
Positive news Information that portrays the firm in a good light, presents business opportunities –
products, services, technology, reputation, brand and energy efficiency (Global
Reporting Initiative & KPMG's Global Sustainability Services 2007)
Negative news Information about business risks, adverse conditions and negative events such as the
increased cost of energy (Global Reporting Initiative & KPMG's Global
Sustainability Services 2007)
Neutral News Information that is neither positive or negative news
Financial
quantitative
Information quantified in dollar amounts
Non-financial
quantitative
Information quantified in non-financial terms, it may refer to percentages, weights or
quantities
Qualitative Information qualitatively presented
The time period, content, mood, and the quantitative/qualitative characteristics
(Table 5.6) are selected to describe the nature of disclosures and to reduce the
classification ambiguity that potentially exists coding data in content analysis. For
example, the time group classifies the sentence into past, present or future. The past
refers to events that occurred prior to the current financial year. The present is
concerned with statements about the current financial year, while future refers to
forecasts and events still expected to happen.
The content group refers to whether the information is general or specific in
nature. Specific content provides information on the firm’s approaches, strategies and/or
focus areas whereas general content does not provide this information. The mood group
contain three categories to classify the sentence. For example the sentence could
provide positive or negative news about the firm or alternatively does not express an

128
emotion thereby providing a neutral view. The last group contains
quantitative/qualitative characteristics. Sentences either provide quantified information
where dollar amounts (financial quantitative) or percentages or weights (non-financial
quantitative) are presented or qualified information that provides a narration without
amounts representing costs, percentages or weights. When the nature of disclosures are
identified the results are recorded in an excel spreadsheet.
The year 2011 is used for a pilot study to develop the checklists, decision rules
and definitions that are applied over the complete sample and for the entire timeframe.
This process follows Milne and Adler’s (1999) suggestion to initially use a pilot study
to establish the coding to be used in this thesis, when the use of two or more coders is
not available.
Annual reports are initially gathered through the Connect 4 Database. The
keywords used in the initial research include: emission, emissions, carbon, greenhouse,
gas, climate, warming, CO, GHG and NGER. These words are considered suitable to
capture the theme under investigation and are based on the thesis hypotheses. Haque
and Deegan (2010) used a number of keywords to inform their investigation into
climate change-related practices, which included “climate change”, “global warming”,
“greenhouse gas”, “emissions” “carbon” and “CO2”. Therefore it seemed reasonable
that these and similar keywords would be appropriate in the current research. The
theme investigated is voluntary carbon emissions disclosures.
To check the reliability of the collection method, each keyword is entered in a
separate search using one sample company, BlueScope Limited’s annual report for
2011. The thesis results produced 51 entries in total for all the keywords. Five of these
entries referred to an abbreviated form of ‘company’ rather the abbreviated form of
‘carbon dioxide’ therefore when the search highlights ‘CO’, and ‘CO’ represents the

129
word company, it is ignored. When the same keyword searches are entered collectively
without using Booleans, the search produced zero results. When the keyword searches
are entered using the ‘or’ Boolean the search produced 51 entries (46 entries plus five
entries for the search term ‘CO’ appearing as the abbreviation for ‘company’).
To provide an additional check on the reliability of the collection method a
different sample company, BHP Billiton’s annual report for 2011 is used. A keyword
search using the above ten identified keywords are processed using the Boolean ‘or’.
The search revealed 26 entries for all the keywords. A separate keyword search was
completed to confirm the accuracy of the number of entries. Once again it is noted that
when the keywords appear but do not relate to the meaning as presented above, then the
keyword entry is ignored. The keywords that appear in this search included ‘gas’,
‘climate’ and ‘CO’. The 18 entries referring to ‘gas’ referred to the product, oil & gas,
shale gas and did not refer to carbon emissions, a by-product of production. One entry
appears for climate as in the economic climate rather than the context of climate change.
Seven entries appeared for ‘CO’ such as co-funding, co-investment and the abbreviated
form of ‘company’. Therefore each of these results is ignored as the results are not
within the context of the meaning of the word as used in this analysis. Therefore it
appeared that BHP Billiton did not discuss the adverse impact of carbon dioxide
equivalents on the earth’s atmosphere identified by these keywords in their 2011 annual
reports.
It was further noted that the search on Adelaide Brighton Ltd, a company that
produces cement and is therefore a heavy emitter, produced no results. This warranted a
further manual investigation using a PDF search on the annual report that reveals 44 hits
for the keywords. The absence of results using the Connect 4 Database also occurs for
several other corporations when actual data is identified using the PDF search.

130
Therefore the decision is made to manually use the search and find feature in the PDFs.
This method is unlike the approach Haque and Deegan (2010) adopted. Their research
uses the search facility in both Connect 4 and DatAnalysis databases. When PDF
searches are not available in scanned annual reports, for example Foster’s 2005 Annual
Report, manual checks are carried out. This affected a minimal number of searches in
annual reports.
In addition, further adjustments to the initial keyword list are required for the
search, for example ‘emission’ is used instead of using both ‘emission’ and ‘emissions’.
Both terms appear in the search and when only the word ‘emissions’ is searched, all the
words ‘emission’ are overlooked. The keyword ‘emission’ captured both forms. A
validity check is conducted by searching ‘emission’ and ‘emissions’ separately and then
using a combined search. The results are compared to check that the search captured the
same information.
Other adjustments included extending the keyword ‘climate’ to include the
phrase ‘climate change’ and ‘warming’ is extended to ‘global warming’ to capture the
keywords in context. The keyword search on ‘CO’ is dropped. It was not possible to
include ‘CO2’ in the PDF keyword search therefore ‘CO’ is adopted. However, this
approach noted each entry where the letters ‘c’ and ‘o’ appears together. The ‘CO’
keyword did not add to the search function. The phrase ‘National Greenhouse and
Energy Reporting’ is also included. It is expected that by using this phrase references to
the Act and/or register will be identified.
Therefore the final keywords used in the thesis are: ‘carbon’, ‘emission’,
‘greenhouse’, ‘gas’, ‘GHG’, ‘climate change’ ‘global warming’, ‘NGER’ and ‘National
Greenhouse and Energy Reporting’. The search progresses in a hierarchical order using
the search terms as presented above and appear in Figure 5.1.

131
Figure 5.1The Hierarchical Order of the keyword search
The aim in using the keyword search is to identify direct discussions on ‘carbon’
and ‘emission’ and extensions of these words where applicable. The next group of
keywords in the search, captures discussions about ‘greenhouse’, ‘gas’ or ‘GHG’ hence
broadening the net to identify references to carbon emissions. A further extension of the
search then includes ‘climate change’ and ‘global warming’ to capture any
acknowledgement of the overall effects of carbon emissions. Since the NGER Act 2007
is specifically under investigation in this research, the search could not be complete
without including the search terms ‘NGER’ or ‘National Greenhouse and Energy
Reporting’.
These words, abbreviations and phrases are used in relation to carbon dioxide
and the adverse changing atmospheric conditions surrounding the earth. When a
particular keyword or phrase appears in the text it is counted as one entry. For example
if the word ‘emission’ appears three times in three separate sentences in the annual
report or sustainability report it is counted as three entries.
Carbon, Emission
Greenhouse, Gas, GHG
Climate Change, Global Warming
NGER

132
However, where a number of keywords appear together in the same sentence for
example, ‘carbon’, ‘emission’, ‘greenhouse’, ‘gas’ and ‘GHG’, then the first keyword
only is recognised, ‘carbon’ in this example. Also the number of times the keyword
appears is noted, even though the sentence is only counted once. The sentence is not
recognised for each of the other keywords to avoid the same sentence being counted
numerous times.
The first part of the thesis is exploratory in nature using descriptive content
analysis to investigate the voluntary carbon emission disclosures and changes that
occurred between pre- and post- NGER Act periods (2005 – 2011). The annual reports
and sustainability reports are examined for 170 ASX listed firms, 85 firms reporting
under the NGER Act and 85 firms that do not. The PDF search and find feature is used
to manually conduct the search based on a checklist, decision rules, keywords and the
nature of disclosures that are designed to guide the search. Descriptive statistics,
Friedman Tests to test for non-linear relationships, Two Independent Samples t-tests,
Mann-Whitney z-tests, Wilcoxon Signed-Rank Tests, Sign Tests and Marginal
Homogeneity Tests are used to explore the data and to validate the findings. In
addition, the use of content analysis enables themes to be codified (Holsti 1969).
Codifying assists the research to be extended using quantitative analysis (Hackston &
Milne 1996).
5.4 Determinants of Voluntary Carbon Emission Disclosures
Content analysis however does not explain the reasons behind the observed
changes in voluntary carbon emission disclosures. Content analysis in this research is
used as a tool to observe and describe the changes. To extend the thesis, the
determinants that underlie voluntarily disclosed carbon emissions are investigated using
regression analyses. The independent variables investigated as the determinants of

133
voluntary carbon emission disclosures are the pre- and post-NGER periods, industry
association, and whether the carbon emissions are assured. Prior research also indicates
an association between corporate governance, leverage, free cash flow, economic
performance, economic risks and size with voluntary disclosures. Therefore these
variables are also included. Further discussion on the predictor variables follows the
models.
5.4.1 The Thesis Models
Empirical analysis extends this thesis by using regression models to investigate
the determinants of voluntary carbon emissions disclosures and the analyses answers the
second research question. The thesis uses four proxies for voluntary carbon emission
disclosures. The three continuous dependent variables, V/DISC_Keywords,
V/DISC_Words and V/DISC_Sentences are investigated using the ordinary least squares
regressions while the binary dummy variable V/DISC is analysed using logistic
regression.
The regression analyses are conducted on NGER firms, Non-NGER firms and a
combination of NGER and Non-NGER firms. Logistic regression analysis
accommodates the nonmetric attributes of the binary dependent variable (Hair Jr. et al.
2006). It handles both metric and nonmetric independent variables overcoming the
multivariate assumptions of normality that are required for multiple discriminant
analysis (Hair Jr. et al. 2006). Therefore, logistic regression analysis is used to
investigate the relationships between the independent variables and the dependent
variable V/DISC. Further, the use of both Pearson and Spearman’s rank correlations
validates the correlation analysis.

134
The ordinary least squares analysis is run separately for each dependent variable,
V/DISC_Keywords, V/DISC_Words and V/DISC_Sentence. The model is presented
below.
Model 1:
V/DISC_Keywords (V/DISC_Words, V/DISC_Sentence) =
α0 + α1PrePost_NGERit + α2Industry_Energyit + α3Industry_Materialsit
+ α4Industry_Industrialsit + α5CEASSURit + α6FREE_CF_TOT_ASSTit +
α7MKTBK_AVER_5YRSit + α8SD/ROA_5YRSit + α9LOG_SIZEit + α10LEVit +
α11Gov_Dummyit + εit
V/DISC_Keywords are the number of times the keywords (carbon, emission,
greenhouse, gas, GHG, Climate Change, Global Warming, NGER and National
Greenhouse and Energy Reporting) are recorded; V/DISC_Words are the number of
words used in each sentence identified by keywords; V/DISC_Sentence are the number
of sentences; PrePost_NGERit is a dummy variable that takes the value of one if the
years are Post-NGER: 2009, 2010 and 2011 otherwise zero if the years are Pre-NGER:
2005, 2006, 2007 and 2008; Industry_Energyit is a dummy variable that takes the value
of one if the firm belongs to the energy industry otherwise zero; Industry_Materialsit is
a dummy variable that takes the value of one if the firm belongs to the materials
industry, otherwise zero; Industry_Industrialsit is a dummy variable that takes the value
of one if the firm belongs to the industrials industry, otherwise zero; each of the year
variables; CEASSURit is a dummy variable that takes the value of one where the carbon
emission data is assured otherwise zero; FREE_CF_TOT_ASSTit measures the firm’s
free cash flow and is free cash flow scaled by total assets; MKTBK_AVER_5YRSit
measures the financial performance and is the firm’s market to book ratio averaged over
the preceding 5 years; SD/ROA_5YRSit measures economic risks and is the standard
deviation of the firm’s return on assets over the preceding 5 years; LOG_SIZEit is the

135
natural logarithm of firm size based on market capitalisation; LEVit is total liabilities
divided by total assets; Gov_Dummy is a dummy variable that takes the value of one
when CORP_GOV_SCOREit is 0.05 or above, otherwise zero; (the
CORP_GOV_SCOREit is a score based on (BD/Indep_Dummy + Duality + Envir/Com
+ EC/CEO-member + ECOM/INDEP_DUMMY)/5 and takes a value of one otherwise a
zero); and εit is the error term. Each of the variables is expected to have a positive
coefficient except for the year variables 2005 through to 2008 and the variable
SD/ROA_5YRSit which are expected to have negative coefficients. Model 1 is extended
with the use of interaction variables to distinguish between NGER and Non-NGER
firms. Model 2 reflects these changes.
Model 2:
V/DISC_Keywords (V/DISC_Words, V/DISC_Sentence) =
α0 + α1NGER_NonNGERit + α2PrePost_NGERit + α3Industry_Energyit +
α4Industry_Materialsit + α5Industry_Industrialsit + α6CEASSURit +
α7FREE_CF_TOT_ASSTit + α8MKTBK_AVER_5YRSit + α9SD/ROA_5YRSit +
α10LOG_SIZEit + α11LEVit + α12Gov_Dummyit +
α13NGER_NonNGER*PrePost_NGERit + εit
where NGER_NonNGERit is a dummy variable that takes the value of one if the
firm is a NGER firm otherwise zero and this allows the comparison between the NGER
and Non-NGER firms. The interaction variable introduced into model 2 to test whether
systematic differences exist between the NGER and Non-NGER firms is
NGER_NonNGER*PrePost_NGERit and εit is the error term. All the other variables are
previously defined.
The investigation also uses logistic regression analysis and the dependent
variable V/DISC. Model 1 in the logistic regression uses the same predictor variables as
the OLS regression’s model 1. The logistic regression model 1 is expanded in model 2

136
using the interaction variables used in the OLS regression’s model 2. These models
follow:
Model 3:
V/DISCit = α0 + α1PrePost_NGERit + α2Industry_Energyit +
α3Industry_Materialsit + α4Industry_Industrialsit + α5CEASSURit +
α6FREE_CF_TOT_ASSTit + α7MKTBK_AVER_5YRSit + α8SD/ROA_5YRSit +
α9LOG_SIZEit + α10LEVit + α11Gov_Dummyit + εit
Model 4:
V/DISCit = α0 + α1NGER_NonNGERit + α2PrePost_NGERit +
α3Industry_Energyit + α4Industry_Materialsit + α5Industry_Industrialsit +
α6CEASSURit + α7FREE_CF_TOT_ASSTit + α8MKTBK_AVER_5YRSit +
α9SD/ROA_5YRSit + α10LOG_SIZEit + α11LEVit + α12Gov_Dummyit +
α13NGER_NonNGER*PrePost_NGERit + εit
Each of the above variables has previously been defined. Further, discussion regarding
the independent variables follows.
5.4.2 Independent Variables
PrePost NGER and the Year variables
The PrePostNGER independent variable distinguishes between voluntary carbon
emission disclosures made prior to and after the introduction of the NGER Act 2007. A
dummy variable of one is allotted to the Post-NGER years (2009, 2010 and 2011)
otherwise a zero is given to the Pre-NGER years (2005, 2006, 2007 and 2008). To
further extend the investigation into the time period, a value of one is also given for
each dummy variable representing each year. For example, the independent dummy
variable YR_2005 is allotted a value of one if the disclosures are made in 2005
otherwise a zero and YR_2006 is given a value of one if disclosures are made in 2006,
otherwise a zero. This pattern is consistently followed for the years 2007, 2008, 2009
and 2010. 2011 is the default year when the preceding years are zero. It is expected

137
voluntary carbon emission disclosures will occur more in the post NGER years.
Therefore a positive coefficient is expected for the Post-NGER years.
Assurance of Carbon Emissions Data
Carbon emission assurance is conducted by firms registered as greenhouse and
energy auditors under the NGER Act 2007 (Department of Climate Change and Energy
Efficiency 2007). NGER auditors are engaged for non-technical and NGER technical
audits ensuring compliance with the NGER Act 2007 and are used when there is a
suspected breach of the legislation or used as a general compliance strategy (Clean
Energy Regulator 2014a), otherwise audits are not mandated. Even though the Big-4
auditors are included in the Greenhouse and Energy Auditors list, the list is not
exclusive to accounting firms (Clean Energy Regulator 2014a).
Likewise, carbon emission audits on voluntary disclosures are not mandated.
However, it is expected when a firm’s carbon emission information is audited it is most
likely the firm will acknowledge this fact and voluntarily disclose carbon emissions in
the annual or sustainability reports. This is signalling the credibility of the voluntary
carbon emission disclosures to readers of the annual and sustainability reports. The
proxy used in this research for the assurance of carbon emissions is CEASSUR, a
dummy variable giving the value of one when the carbon emissions data is assured
otherwise zero. A positive coefficient is expected between CEASSUR and voluntary
carbon emission disclosures. The representative data for the following control variables
introduced to the models are sourced from the annual and sustainability reports.
5.4.3 Control Variables
Corporate Governance
138
Kent and Monem (2008) and Beekes and Brown (2006) consider the strength of
corporate governance reflects company aspiration to attain transparency and high-
quality reporting. The incentive for firms to incorporate good corporate governance
practices is to access capital markets in more favourable financial terms than otherwise
would be available. Doidge, Karolyi and Stulz (2007) find the circumstances where
good corporate governance is evident includes situations when firms need external
finance, had the opportunities for growth or where investors obtained higher state
protection, for example in common-law jurisdictions such as Australia. However, there
is a balance between the advantages and disadvantages of corporate governance.
Corporate governance costs include implementing or improving governance
mechanisms such as engaging highly reputable external auditors or selecting
independent directors that will not only increase financial costs but will also require
commitments of management’s time (Doidge, Karolyi & Stulz 2007). Regardless,
Doidge et al (2007) consider that the costs to improve corporate governance are less for
larger firms, and therefore they expect larger firms to have better corporate governance.
Further, Doidge et al (2007) suggest that firm characteristics are more useful in
explaining governance in firms from better economically-developed countries than from
developing countries. Therefore, it is expected that firm characteristics will be useful in
explaining governance in Australian firms. The link between good corporate
governance practices and disclosures is also noted elsewhere.
Eng and Mak (2003) investigate the board composition and ownership structure,
that reflect corporate governance attributes and the relationship with voluntary
disclosures. Their research centres on firms listed on Singapore’s stock exchange where
there had been increasing calls for improved corporate governance and financial
disclosure. Significantly, Singapore’s intentions are to be recognised as a reputable

139
Asian financial centre (Eng & Mak 2003). Subsequently, the government acknowledges
that corporate governance and disclosure are important for shareholder protection. The
findings suggest debt, managerial ownership and independent directors are substitutes
for corporate governance (Eng & Mak 2003).
In Australia, the ASX Corporate Governance Council (2010) established the
Corporate Governance Principles and Recommendations in 2003. The amendments in
2010 updated these non-mandatory guidelines. The aim is to improve access to
international capital markets and stimulate investor confidence for ASX listed firms
(ASX Corporate Governance Council 2010). Corporate governance guidelines outline
how risks are gauged and evaluated, organisational performance is optimised and
objectives are set. Effectively, good corporate governance aims to add value, establish
accountability and control mechanisms comparable with the level or risk the firm is
exposed to (ASX Corporate Governance Council 2010). The ASX Corporate
Governance Council’s (2010) recommendations set out eight core principles that are not
mandatory though do provide a reference point. The aim is to achieve good corporate
governance practices.
Essentially the ASX Corporate Governance Council highlights that sound
corporate governance is evidenced by the structure of the board of directors, the
presence of an audit committee and the presence of committees and control systems to
manage risks. It is believed the ASX Corporate Governance Council’s Corporate
Governance Principles and Recommendations have addressed the requirements of the
providers of financial resources, the shareholders. However, Deegan (2005) considers
this is a narrow focus. Nevertheless, prior research uses these recommendations to
outline good corporate governance practices. Two general areas, identified in Haque &
Deegan’s (2010) climate change-related governance disclosure classification scheme

140
identifies Board Oversight and Senior Management Engagement and Responsibility as
contributing to quality reporting. These two general areas of good corporate governance
practices relate to ASX Corporate Governance Principle 1. The findings suggest that
corporate governance is a key predictor of voluntary carbon emissions disclosures.
Kent and Monem (2008) suggest that the principles most likely to be associated
with voluntary environmental disclosures are: to provide a basis for the functions of
management and oversight, to encourage responsibility and ethics in decision-making,
to encourage balanced and timely disclosures, to encourage the recognition and
management of risk, and to encourage the acknowledgement of stakeholders.
The current research takes into consideration the ASX’s corporate governance
principles including the independent composition of the board of directors, and the
chairman/CEO Duality. The presence of an environmental committee suggests
management is recognising and attempting to manage the carbon emission risk. Further,
the composition of the environmental committee and whether the CEO is a member of
the environmental committee reflects the existing internal control. The independence of
the environmental committee is also considered. Good corporate governance has been
linked to increased voluntary disclosures (Eng & Mak 2003; Ho & Wong 2001).
The board of directors is a major internal control mechanism over the actions of
management (Fama & Jensen 1983). Haque and Deegan (2010) identify board oversight
as a function that contributes to quality reporting. Hence, the number of non-executive
directors determines the independence of the board. Where the independence of the
board is greater than 50%, it is considered that the board is independent. The majority
composition of the board being independent directors relates to Principle 2 of the
Corporate Governance Principles and Recommendations (ASX Corporate Governance
Council 2010).

141
Likewise, separation of the roles of the CEO and chairman improves the
effectiveness of the oversight function of the board (Cadbury Committee 1992; Jensen
1993). The board independence tends to decrease with the increased bargaining power
of the CEO (Hermalin & Weisbach 1998). The perceived ability of the CEO is a
reflection of organisational performance (Hermalin & Weisbach 1998), therefore it is
expected in high performance firms the role of the CEO and chairperson are combined
(Monem 2012). Even though the selection of outsiders to sit on the board will increase
the independence of the board (Linck, Netter & Yang 2008), the presence of CEO
duality would suggest the board size will be limited to lower outside influence and
lower monitoring costs (Monem 2012). The separation of the CEO and chairman is
recommended in Principle 2 (ASX Corporate Governance Council 2010) and therefore
included in the corporate governance structure.
A reflection of the board’s commitment to reduce greenhouse gases and
legitimise the firm’s operations is the establishment of an environmental committee
(Kent & Monem 2008; Milne & Patten 2002). Specifically, the independence of the
committee, frequency of meetings and committee size are expected to contribute to the
effectiveness of the board’s commitment to the environment.
The existence of an environmental committee enhances the internal framework
that underlies the measurement and reporting of carbon emissions. It is more likely that
an environmental committee would encourage voluntary disclosures to legitimise
organisational activity by aligning with societal expectations (Ashforth & Gibbs 1990;
Lindblom 1994). The ASX Corporate Governance Principles and Recommendations do
not outline the requirements for an environmental committee. However, Principle 7
refers to internal control and risk management. Hence it is expected that an
environmental committee would contribute to these factors.

142
Further, the CEO’s presence on the environmental committee contributes to the
firm’s level of commitment to reduce carbon emissions. The CEO’s presence reflects
the value senior management places on the environment and the importance of reducing
carbon emissions (Rankin, Windsor & Wahyuni 2011). The CEO’s presence on the
Environmental Committee increases senior management’s capacity to ascertain the
threat of changes to the firm’s legitimacy, manage stakeholders and signal intentions
(Rankin, Windsor & Wahyuni 2011). Therefore the size, independence, meeting
frequency and the active presence of the CEO on the environmental committee signals
the capacity and the effectiveness of the firm to voluntarily disclose carbon emissions.
To remain consistent with the board’s measure of independence, where the
independence of the environmental committee is 50% or greater, it is considered that the
environmental committee will be regarded as independent. The activity of the
committee is reflected in the number of meetings held throughout the year.
The strength of corporate governance will be evaluated on the aggregated
governance score. The corporate governance score is defined by:
Corporate Governance Score =
(BdIndep_Dummy + Duality + Environmental Committee + EC/CEO-
member + ECOMINDEP_DUMMY)/5
Where:
BdIndep_Dummy =
the Board independence is measured by a dummy variable and given
the value of one when 50% of the board of directors are independent
Duality =

143
a dummy variable given the value of one when the roles of the
chairman and CEO are separate
Environmental Committee =
a dummy variable given the value of one when an environment
committee exists
EC/CEO-member =
a dummy variable of one when the CEO is a member of the
Environment Committee
ECOMINDEP_DUMMY =
a dummy variable of one when 50% of the Environmental
Committee members are independent.
A positive coefficient is expected between the level of voluntary carbon
emissions disclosures and firms that have strong corporate governance in place. The
strength of the corporate governance is signalled by the composition of the board of
directors, duality of the chairman/CEO, the presence of an environmental committee,
the composition of the environmental committee and whether the CEO is a member of
the environment committee.
Leverage
The next control variable is leverage (LEV). Chow and Wong-Boren (1987) find
that firms which are highly leveraged do disclose more information. Creditors can
increase the cost of capital when the risks to their claims rise (Kent & Monem 2008) as
reputational risk, fines and penalties increase creditors’ risk (Deegan & Rankin 1996). It
is expected that firms will disclose information to reduce information asymmetry and
the cost of capital (Kent & Monem 2008). Hence the creditors’ influence is expected to
increase with the level of debt held by the firm (Roberts 1992). It is expected that

144
leverage has a positive association with voluntary carbon emissions disclosures.
Therefore to control for the level of equity financing, the ratio of debt to total assets
(LEV) is utilised.
Free Cash Flow
It is expected that the profitability of the firm is associated with increased
benefits made to managers (Adams & Ferreira 2007; Raheja 2005). As benefits increase
for managers, there is the expectation that the number of independent directors will rise
to enhance the monitoring role of the board (Adams & Ferreira 2007; Raheja 2005).
Hence a positive relationship is expected between the number of independent directors
and voluntary emissions disclosures. A useful proxy to control for the effects of
monitoring managerial benefits is free cash flow (Jensen 1986) as the cash flow
represents available funds that can be used to for monitoring. Free cash flow is
measured by the operating cash flow scaled by Total Assets (FREE_CF_TOT_ASST).
Financial Performance
Further, the performance of the firm may influence voluntary disclosures. Kent
and Monem (2008) consider that high financial performing firms are more inclined to
use triple bottom line reporting hence economic performance is controlled. Mills and
Gardner (1984) consider it is not a random act to socially disclose activities. Rather,
disclosures occur when firm performance is favourable to investors. To control for
potential profitability effects in this research, the market to book ratio averaged over the
preceding five years (MKT/BK_5YRS) (Core, Holthausen & Larcker 1999), is utilized.
Hackston and Milne (1996) consider an average over the previous five years provides a
more reliable measure than measures based on one year. To remain consistent with
Mills and Gardner’s (1984) and Kent and Monem’s (2008) respective research, it is

145
expected that performance will be positively associated with increasing voluntary
emissions disclosures.
Economic Risks
Economic risks contribute to a volatile operating environment that can reduce
financial performance. As a result, firms are more likely to turn their attention to
financial survival rather than providing environmental disclosures (Roberts 1992).
Therefore the research includes an accounting-based measure, the standard deviation of
return on assets averaged over the preceding 5 years (SD/ROA_5YRS) to control for
economic risks (Bini, Dainelli & Giunta 2011; Core, Holthausen & Larcker 1999). As
the risks increase voluntary disclosures will decrease; therefore it is expected that a
negative coefficient exists between rising economic risks and voluntary emissions
disclosures.
Size
The next control variable introduced is size (LOG_SIZE). Rankin et al (2011)
find that firm size is positively related to voluntary greenhouse gas disclosures. They
use the natural logarithm of market capitalisation as an indicator of size. Larger firms
have a higher visual presence within society, have the potential to have a greater effect
on the environment and possibly have a higher percentage of shareholders interested in
the firm’s environmental impact (Cho & Patten 2007; Cowen, Ferreri & Parker 1987;
Lang & Lundholm 1993; Patten 2002; Rankin, Windsor & Wahyuni 2011). These
factors suggest that larger firms are subject to greater examination by stakeholders
(Rankin, Windsor & Wahyuni 2011). In addition, prior research establishes a positive
relationship between the size of a firm and disclosures (Alciatore & Dee 2006; Bhuiyan
& Biswas 2007; Bini, Dainelli & Giunta 2011; Freedman & Jaggi 2005; Hackston &

146
Milne 1996; Kent & Monem 2008; Pahuja & Bhatia 2010; Patten 1991, 1992; Patten
2002). Therefore to remain consistent with prior research, this study expects that a
positive relationship exists between size and voluntary carbon emissions disclosures.
Hence, the firm’s size will be controlled. Hackston and Milne (1996) note a number of
measures have been used to indicate size, for example an index rank, total asset value,
employee numbers and sales volume. They also note that there are no theoretical
reasons to adopt any one type of measure (Hackston & Milne 1996). Therefore to be
consistent with Rankin, Windsor and Wahyuni’s research, size will be represented by
the natural logarithm of market capitalisation.

147
Industry Classification
Prior research has established an association between industry classification and
voluntary disclosures. For example, Deegan and Gordon (1996) and Cowen et al (1987)
find firms from environmentally sensitive industries do provide more environmental
information than firms that are not environmentally sensitive. Patten (2002) finds a
positive relationship exists between size, industry and voluntary environmental
disclosures. Bini et al (2011) controlled the variables - size, industry, risk, and legal
context. Therefore to be consistent with prior research the current study controls for
industry classification.
Further, to extend the investigation into the industry classification, different
types of industries are separated into four categories: Materials, Energy, Industrials and
others. Materials and energy industries are associated with emission-intensive activities
and represent 43.5% of the sample. Proxies for materials, energy and industrials are
Industry_Materials, Industry_Energy and Industry_Industrials respectively. Each
dummy variable is given a value of one otherwise zero. A positive coefficient is
expected.
5.5 Chapter Summary
This thesis sample consists of 170 ASX listed companies. Half of these firms
reported under the NGER Act 2007 and the other half did not. This permitted a
comparison between the NGER (treatment) and Non-NGER (control) firms in a
longitudinal study covering the period 2005 through to 2011 inclusive. This thesis
manually investigates the annual and sustainability reports.
This thesis uses a mixed approach to broaden the insights available from the
data. The initial stage of the thesis using content analysis investigates changes in

148
voluntary carbon emission disclosures made by Australian firms that occurred over
time, the differences between pre- and post-NGER Act 2007 and differences between
NGER and Non-NGER firms. The correlation matrix and regression analyses extend the
thesis and investigate the determinants of voluntary carbon emission disclosures.
The dependent variable, voluntary carbon emission disclosures, is measured
using three continuous dependent variables and one dummy variable. Previous research
has identified the predictor variables: corporate governance, leverage, free cash flow,
financial performance, economic risks, firm size, the presence of an environmental
committee and industry classification and these variables are controlled in the current
research. The independent variables investigated are disclosures made pre- and post-
NGER, industry association, and the assurance of voluntary carbon emission
disclosures. The next chapter presents the data analysis, results and discussion.

i
6 Data Analysis, Results and Discussion
6.1 Introduction
A preliminary investigation reveals that an increase of voluntary carbon
emission disclosures has occurred over the research period 2005 to 2011. Graph 6.1
highlights the frequency increase of voluntary carbon emission disclosures in annual
and sustainability reports between 2005 and 2011 for both NGER and Non-NGER
firms.
Graph 6.1 Frequency of VCEDs in Annual & Sustainability Reports - NGER & Non-NGER
Even though the end of the first reporting period after the implementation of the
NGER Act was 2009, NGER firms that are required to report in any of the first three
years (2009, 2010 and 2011) are also traced from 2005. Generally, the number of firms
that voluntarily disclose carbon emissions information increased over time for both
NGER and Non-NGER firms. Table 6.1 highlights the level of voluntary carbon
emission disclosures in percentages.
0
10
20
30
40
50
60
70
2005 2006 2007 2008 2009 2010 2011
Nu
mb
er
of
Re
po
rts
Years
NGER_AR
Non-NGER_AR
NGER_SR
Non-NGER_SR

150
Table 6.1 The Percentage of firms providing voluntary carbon emission disclosures
NGER Non-NGER
Year AR SR AR SR
2005 25% 22% 8% 4%
2006 39% 31% 12% 6%
2007 49% 34% 14% 8%
2008 65% 40% 22% 7%
2009 67% 41% 33% 7%
2010 61% 49% 32% 7%
2011 69% 47% 34% 9%
Total number of NGER & Non-NGER firms 85
85
In 2005, 25% (8%) of the NGER (Non-NGER) firms voluntarily disclosed
carbon emissions in the annual reports and this increased to 69% (34%) of NGER (Non-
NGER) firms by 2011. Likewise, a notable increase is observed in the sustainability
reports for NGER (Non-NGER) firms with 22% (4%) disclosing in 2005 increasing to
47% (9%) by 2011 (Table 6.1). Refer to Appendix 5 for the number of annual and
sustainability reports containing voluntary carbon emissions information over the period
2005 through to 2011.
To analyse the changes in disclosures, the number of keywords and word,
sentence, graph, table and figure counts are used to quantify the information. The
analyses commence using descriptive statistics and frequencies to explore the available
data in both the annual and sustainability reports. Changes in voluntary carbon emission
disclosures occurring over time are investigated using Friedman Tests. The validity of
the test results are supported by the Independent Samples t-test and Mann-Whitney z-
tests. Differences occurring between the annual reports and sustainability reports are

151
investigated using the Wilcoxon Signed-Ranks Tests, Sign Tests and Marginal
Homogeneity Tests.
The second stage of the thesis investigates the determinants that underlie the
observed changes in voluntary carbon emission disclosures. Pearson and Spearman’s
Rank Correlations highlight the associations between the predictor variables and the
dependent variables. One proxy, a dummy dependent variable that represent the
dependent variable, voluntary carbon emission disclosures, is used to investigate the
influence of the predictor variables on the dependent variables.
6.2 Descriptive Statistics
The descriptive statistics and frequencies for NGER and Non-NGER firms’
annual reports and NGER and Non-NGER firms’ sustainability reports are investigated
separately. The descriptive statistics and frequencies use keywords, words, sentences,
graphs, tables and figures to capture changes over time.
6.2.1 Annual Reports - NGER & Non-NGER - Descriptive Statistics and
Frequencies
The descriptive statistics summarise voluntary carbon emissions disclosures
between 2005 and 2011. For example, the mean keywords in the annual reports
increased for both NGER and Non-NGER firms between 2005 and 2011. Keywords are
carbon, emission, greenhouse, gas, GHG, Climate Change, Global Warming, NGER
and National Greenhouse and Energy Reporting. These keywords are used to capture
words, sentences, graphs, tables and figures in the reports. The descriptive statistics and
frequencies for NGER and Non-NGER firms’ annual reports for the research period are
presented in Table 6.2.

152
Table 6.2 Descriptive Statistics and Frequencies - NGER & Non-NGER Annual Reports
NGER Non-NGER
Statistic 2005 2006 2007 2008 2009 2010 2011 2005 2006 2007 2008 2009 2010 2011
Keywords
Mean 0.96 2.31 5.87 7.13 8.73 7.13 6.42 0.27 0.40 0.55 0.99 1.19 1.25 1.76
Median 0.00 0.00 0.00 2.00 2.00 2.00 2.00 0.00 0.00 0.00 0.00 0.00 0.00 0.00
Std Deviat 2.35 4.77 12.59 12.26 20.24 15.23 10.58 1.11 1.47 2.12 2.48 2.42 3.37 3.90
Minimum 0 0 0 0 0 0 0 0 0 0 0 0 0 0
Maximum 13 25 87 76 134 100 52 8 9 15 12 11 26 23
Frequencies:
100-149 1 1
50-99 1 1 3 3 1
1-49 21 33 41 54 53 49 58 7 10 12 19 28 27 29
0 64 52 43 30 28 32 26 78 75 73 66 57 58 56
N 85 85 85 85 85 85 85 85 85 85 85 85 85 85
[Table 6.2 Continues]

153
[Table 6.2 Continued]
NGER
Non-NGER
Statistic 2005 2006 2007 2008 2009 2010 2011 2005 2006 2007 2008 2009 2010 2011
Total Word Count
Mean 20.45 50.19 122.71 142.87 161.93 139.85 122.69 6.12 9.52 14.51 21.87 26.99 27.68 33.12
Median 0.00 0.00 0.00 40.00 50.00 32.00 44.00 0.00 0.00 0.00 0.00 0.00 0.00 0.00
Std Deviat 50.47 96.10 267.29 245.14 312.34 290.23 202.67 23.93 33.41 53.32 55.09 54.37 70.23 73.13
Minimum 0 0 0 0 0 0 0 0 0 0 0 0 0 0
Maximum 285 496 1823 1583 1623 1825 987 164 191 377 294 272 490 423
Frequencies:
>250 2 6 15 16 15 12 14 2 1 1 2 2
200-249 3 3 3 4 2 1 1 1 2
150-199 2 2 6 2 3 4 1 2 3 2 2 3
100-149 4 4 5 4 8 6 6 2 2 6 1 4
50-99 6 8 7 11 15 14 15 4 2 4 4 6 9 5
1-49 9 10 12 15 14 13 17 2 6 4 8 11 11 12
0 64 52 44 30 28 33 27 78 75 73 66 58 59 57
N 85 85 85 85 85 85 85 85 85 85 85 85 85 85
[Table 6.2 Continues]

154
[Table 6.2 Continued]
NGER
Non-NGER
Statistic 2005 2006 2007 2008 2009 2010 2011 2005 2006 2007 2008 2009 2010 2011
Total Sentence Count
Mean 0.81 1.94 4.66 5.71 6.02 5.33 4.88 0.25 0.36 0.51 0.80 0.95 1.02 1.49
Median 0.00 0.00 0.00 2.00 2.00 1.00 2.00 0.00 0.00 0.00 0.00 0.00 0.00 0.00
Std Deviat 1.89 3.77 10.27 10.03 11.73 11.09 7.84 1.06 1.29 1.88 2.02 1.99 2.79 3.39
Minimum 0 0 0 0 0 0 0 0 0 0 0 0 0 0
Maximum 10 20 72 65 64 75 40 8 8 13 9 11 22 20
Frequencies:
>5 4 13 21 27 25 22 23 1 3 2 5 6 4 11
3-4 7 7 6 11 10 13 14 2 2 3 4 5 7 4
1-2 10 13 14 17 22 17 21 4 5 7 10 16 15 13
0 64 52 44 30 28 33 27 78 75 73 66 58 59 57
N 85 85 85 85 85 85 85 85 85 85 85 85 85 85
[Table 6.2 Continues]

155
[Table 6.2 Continued]
NGER
Non-NGER
Statistic 2005 2006 2007 2008 2009 2010 2011 2005 2006 2007 2008 2009 2010 2011
Total Graphs
Mean 0 0.05 0.08 0.20 0.32 0.27 0.18 0 0 0 0.02 0.01 0.01 0
Median 0 0.00 0.00 0.00 0.00 0.00 0.00 0 0 0 0.00 0.00 0.00 0
Std Deviat 0 0.21 0.28 0.67 1.03 0.98 0.64 0 0 0 0.15 0.11 0.11 0
Minimum 0 0 0 0 0 0 0 0 0 0 0 0 0 0
Maximum 0 1 1 5 8 8 4 0 0 0 1 1 1 0
Frequencies:
>5 1 1 1 0
3-4 0 1 1 2
1-2 4 7 10 12 11 6 2 1 1
0 85 81 78 74 71 72 77 85 85 85 83 84 84 85
N 85 85 85 85 85 85 85 85 85 85 85 85 85 85
[Table 6.2 Continues]

156
[Table 6.2 Continued]
NGER
Non-NGER
Statistic 2005 2006 2007 2008 2009 2010 2011 2005 2006 2007 2008 2009 2010 2011
Total Tables
Mean 0.04 0.06 0.20 0.14 0.34 0.21 0.28 0 0.01 0 0.01 0.02 0.01 0.05
Median 0.00 0.00 0.00 0.00 0.00 0.00 0.00 0 0.00 0 0.00 0.00 0.00 0.00
Std Deviat 0.19 0.28 0.61 0.44 1.62 0.60 0.67 0 0.11 0 0.11 0.22 0.11 0.21
Minimum 0 0 0 0 0 0 0 0 0 0 0 0 0 0
Maximum 1 2 4 2 13 4 4 0 1 0 1 2 1 1
Frequencies:
>5 2
3-4 1 0 1 1
1-2 3 4 10 9 8 12 16 1 1 1 1 4
0 82 81 74 76 75 72 68 85 84 85 84 84 84 81
N 85 85 85 85 85 85 85 85 85 85 85 85 85 85
[Table 6.2 Continues]

157
[Table 6.2 Continued]
NGER
Non-NGER
Statistic 2005 2006 2007 2008 2009 2010 2011 2005 2006 2007 2008 2009 2010 2011
Total Figures
Mean 0.01 0.01 0.04 0.07 0.06 0.04 0.05 0.01 0.01 0.01 0.01 0 0.01 0.02
Median 0.00 0.00 0.00 0.00 0.00 0.00 0.00 0.00 0.00 0.00 0.00 0 0.00 0.00
Std Deviat 0.11 0.11 0.19 0.30 0.24 0.19 0.26 0.11 0.11 0.11 0.11 0 0.11 0.15
Minimum 0 0 0 0 0 0 0 0 0 0 0 0 0 0
Maximum 1 1 1 2 1 1 2 1 1 1 1 0 1 1
Frequencies:
1-2 1 1 3 5 5 3 3 1 1 1 1 1 2
0 84 84 82 80 80 82 82 84 84 84 84 85 84 83
N 85 85 85 85 85 85 85 85 85 85 85 85 85 85

158
As can be seen in the descriptive statistics and frequencies set out in Table 6.2,
in 2005 the mean NGER (Non-NGER) keywords are 0.96 (0.27) increasing to 6.42
(1.76) by 2011. The use of NGER keywords peaked in 2009 (mean 8.73) before
dropping back in 2011 (mean 6.42) whereas keywords consistently increased, albeit at a
lower level over the period, for Non-NGER firms. The keywords’ standard deviation
though is high, indicating wide variance around the mean for both NGER and Non-
NGER firms. The median for each year is lower than the mean, indicating that a small
number of firms are using a larger number of keywords resulting in the data being
positively skewed and this pattern is consistent for both groups. The trend to voluntarily
disclose carbon emissions is increasing in the annual reports for NGER and Non-NGER
firms. This increasing trend may reflect the growing awareness by firms and the general
community about the impact of anthropoid activity on climate change.
Evidence of a similar pattern is observed for the total word count and total
sentence count for both groups and total graphs for NGER firms (Table 6.2). The use of
graphs does not appear to be a principal method of conveying information for Non-
NGER firms. NGER firms’ use of words, sentences and graphs increased between the
years 2005 and 2011. In each case the mean reached a peak in 2009 (mean word count
161.93; mean sentence count 6.02; mean graphs 0.32) before dropping back in 2011
(mean word count 122.69; mean sentence count 4.88; mean graphs 0.18). The data is
positively skewed with the mean higher than the median in each year. There is a lot of
variance around the mean for the total word count for both groups and total sentence
count for NGER firms. However, the standard deviation is not widely varied for NGER
and Non-NGER graphs indicating that a symmetrical distribution across the sample
exists for the use of graphs.

159
NGER firms’ use of tables and figures also increased over the 2005 – 2011
period and reflects a similar pattern as noted for graphs (Table 6.2). The variance
around the mean for each is minimal suggesting the use of tables and figures is
consistent across the treatment group. Overall, voluntary carbon emissions disclosures
in annual reports for NGER firms increased between 2005 and 2011.
Non-NGER firms’ use of tables and figures reflects minimal usage (Table 6.2).
In 2005 and 2007 tables were not used. For each of the remaining years 2006, 2008,
2009, 2010 and 2011 the means for ‘total tables’ are 0.01, 0.01, 0.02, 0.01 and 0.05
respectively. The mean for the use of figures for each year is 0.01 except for 2011 when
the mean is 0.02 and in 2009 figures are not used at all. To summarise, Non-NGER
firms mainly conveyed information through words and sentences with minimal use of
graphs, tables and figures.
The thesis also investigates the number of firms voluntarily disclosing carbon
emissions, the level of quantified carbon emissions and for NGER firms whether
voluntary disclosures reflect emissions data released by the GEDO. The details are set
out in Appendix 6, Table 1.
Table 6.2, above, also includes the frequency counts taken from the annual
reports for each of the variables Keywords, Total Words, Total Sentences, Total Tables,
Total Graphs and Total Figures for both NGER and Non-NGER firms. The frequencies
are generated from SPSS and the ranges calculated manually.
Appearance of keywords in annual reports generally increased overtime,
evidenced by the number of firms providing zero information in 2005; 64 firms did not
voluntarily disclose carbon emissions data and this number decreased to 26 firms by
2011. The number of NGER (Non-NGER) firms using the frequency of keywords, 1-49

160
times increased from 21 (7) in 2005 to 58 (29) by 2011. In addition, the propensity for
NGER firms to use keywords at higher rates 50-99 words or more appeared from 2007
onwards whereas none of the Non-NGER firms had this level of disclosure. Clearly
NGER firms disclosed at a higher rate than Non-NGER firms.
A similar trend appears for Total Words and Total Sentences for both NGER
and Non-NGER firms and Total Graphs, Total Tables and Total Figures for NGER
firms (Table 6.2 above). In 2005, NGER (Non-NGER) firms disclosed using 1-49
words, 9 times (2 times), 50-99 words, 6 times (4 times), 100-149 words, 4 times (0
times) and over 250 words, 2 times (0 times). This pattern changed by 2011, NGER
(Non-NGER) firms used 1-49 words, 17 times (12 times), 50-99 words, 15 times (5
times), 100-149 words, 6 times (4 times), 150-199 words, 4 times (3 times), 200- 249
words, 2 times (2 times) and over 250 words, 14 times (2 times).
This trend is consistent with the use of sentences. NGER (Non-NGER) firms
used 1-2 sentences in 2005 to convey carbon emissions information 10 times (4 times)
and this increased to 21 (13) times by 2011 (Table 6.2). In addition, in 2005, NGER
(Non-NGER) firms also disclosed using 5 or more sentences, 4 (1) times and this
increased to 23 (11) times by 2011. NGER and Non-NGER firms’ increasing propensity
to voluntary disclose carbon emissions is evident in the increased level of disclosures
recorded by keywords, total words and total sentences between 2005 and 2011. Overall,
NGER firms inclined to disclose more carbon emission information than Non-NGER
firms. The increasing awareness of climate change, influential stakeholders such as
auditors and institutional investors, changing regulatory reporting requirements, the
threat of regulation and a potential legitimacy threat may have all influenced these
increasing levels of voluntary carbon emission disclosures.

161
In addition, NGER firms used graphs to convey carbon emission information
over an extended number of years, 2006 to 2011 and at a greater number each year than
Non-NGER firms (Table 6.2). Non-NGER firms used graphs minimally. Only two Non-
NGER firms provided one graph in 2008, and one firm in each 2009 and 2010, the
implementation and introductory years of the NGER Act.
The use of tables appears to be a favoured method by NGER firms through
which to convey carbon emissions data (Table 6.2). In 2005, three (zero) NGER (Non-
NGER) firms provided at least one table and this increased to sixteen (four) NGER
(Non-NGER) firms by 2011. At least one NGER firm presented tables at least three
times or more in 2007, 2010 and 2011. In contrast, only one Non-NGER firm provided
a table in each year 2006, 2008, 2009 and 2010. By 2011 this had increased to only four
Non-NGER firms providing a table in the annual report.
Figures capture information in the annual reports that are not captured by graphs
or tables; however figures appear to be minimally used over the period 2005 through to
2011 for both NGER and Non-NGER firms (Table 6.2). The use of figures does not
appear to be a popular means through which to convey carbon emission information.
Discussion on the sustainability reports follows.
6.2.2 Sustainability Reports - NGER & Non-NGER - Descriptive Statistics and
Frequencies
The descriptive statistics for NGER’s (Non-NGER) sustainability reports as set
out in Table 6.3 below reveals mean keywords increased from 32.11 (20.33) in 2005 to
56.06 (30.00) in 2011.

162
Table 6.3 Descriptive Statistics and Frequencies – NGER & Non-NGER Sustainability Reports
NGER Non-NGER
Statistic 2005 2006 2007 2008 2009 2010 2011 2005 2006 2007 2008 2009 2010 2011
Keywords
Mean 32.11 25.72 51.61 53.33 55.28 49.83 56.06 20.33 10.00 33.33 14.67 27.67 56.00 30.00
Median 8.00 17.00 37.50 38.00 46.50 36.50 51.51 28.00 9.00 39.00 17.00 21.00 72.00 31.00
Std Deviat 48.64 30.46 54.60 45.56 38.13 33.50 47.59 17.79 10.57 9.82 7.77 23.71 43.28 7.55
Minimum 0 0 1 4 7 15 6 0 0 22 6 8 7 22
Maximum 142 109 171 164 155 156 188 33 21 39 21 54 89 37
Frequencies:
150-199 3 1 1 1 2
100-149 3 1 1 4 3 1 1
50-99 2 3 4 6 10 11 8
1-49 14 22 19 23 21 29 29 3 5 7 6 6 6 8
0 2 1 2 2 2 1 1 2 2 1
No SRs 64 58 56 51 48 43 45 80 79 77 77 77 78 77
N 85 85 85 85 85 85 85 85 85 85 85 85 85 85
[Table 6.3 Continues]

163
[Table 6.3 Continued]
NGER Non-NGER
Statistic 2005 2006 2007 2008 2009 2010 2011 2005 2006 2007 2008 2009 2010 2011
Total Word Count
Mean 554.50 428.67 995.94 927.00 976.78 858.83 828.44 389.33 153.00 575.67 241.67 547.00 1113.00 431.00
Median 153.00 248.50 695.00 669.50 933.00 693.50 629.00 572.00 193.00 606.00 292.00 377.00 1398.00 378.00
Std Deviat 884.72 579.84 1226.44 886.37 676.06 602.02 709.86 337.39 137.44 181.42 220.85 557.78 941.43 155.43
Minimum 0 0 29 39 66 229 41 0 0 381 0 94 62 309
Maximum 2598 2015 4637 3306 2727 2704 2470 596 266 740 433 1170 1879 606
Frequencies:
>250 7 12 19 26 30 35 29 2 1 4 4 3 3 6
200-249 2 2 1 2 2 1 1
150-199 1 2 2 2 2 3 1 1
100-149 1 2 4 1 2 2 2 1 1
50-99 4 5 3 2 2 1 3 1 2 1 2 1
1-49 4 3 2 1 2 1 1
0 2 1 3 1 2 1 1 3 2 1
No SRs 64 58 56 51 48 43 45 80 79 77 77 77 78 77
N 85 85 85 85 85 85 85 85 85 85 85 85 85 85
[Table 6.3 Continues]

164
[Table 6.3 Continued]
NGER Non-NGER
Statistic 2005 2006 2007 2008 2009 2010 2011 2005 2006 2007 2008 2009 2010 2011
Total Sentence Count
Mean 21.33 16.72 36.78 34.83 37.28 31.89 34.06 15.00 5.00 23.00 8.00 18.00 39.00 17.33
Median 5.50 10.50 29.00 24.50 36.50 27.00 24.50 22.00 6.00 22.00 11.00 12.00 49.00 15.00
Std Deviat 32.37 21.37 42.16 33.07 22.87 19.48 28.03 13.00 4.58 4.58 7.00 17.78 32.19 4.93
Minimum 0 0 1 2 4 7 2 0 0 19 0 4 3 14
Maximum 94 78 150 127 94 85 103 23 9 28 13 38 65 23
Frequencies:
>5 11 19 25 32 32 41 34 2 4 5 4 4 4 7
3-4 4 4 2 1 1 1 2 0 1 1 0 2 2 0
1-2 4 3 2 1 1 0 3 1 0 1 1 0 0 1
0 2 1 0 0 3 0 1 2 1 1 3 2 1 0
No SRs 64 58 56 51 48 43 45 80 79 77 77 77 78 77
N 85 85 85 85 85 85 85 85 85 85 85 85 85 85
[Table 6.3 Continues]

165
[Table 6.3 Continued]
NGER Non-NGER
Statistic 2005 2006 2007 2008 2009 2010 2011 2005 2006 2007 2008 2009 2010 2011
Total Graphs
Mean 1.50 1.44 1.33 2.11 2.50 2.11 2.94 0.67 0 0.33 0.33 1.67 2.33 2.00
Median 0.00 0.00 1.00 2.00 2.00 1.00 1.50 0.00 0 0.00 0.00 0.00 3.00 2.00
Std Deviat 2.83 2.83 2.09 1.71 2.57 2.47 3.78 1.16 0 0.58 0.58 2.89 2.08 2.00
Minimum 0 0 0 0 0 0 0 0 0 0 0 0 0 0
Maximum 11 11 9 5 11 10 12 2 0 1 1 5 4 4
Frequencies:
>5 2 2 2 5 3 4 4 0 1
3-4 2 2 2 8 9 10 4 0 2 2
1-2 5 9 13 12 16 16 12 1 2 1 1 1 2
0 12 14 12 9 9 12 20 4 6 6 7 6 4 4
No SRs 64 58 56 51 48 43 45 80 79 77 77 77 78 77
N 85 85 85 85 85 85 85 85 85 85 85 85 85 85
[Table 6.3 Continues]
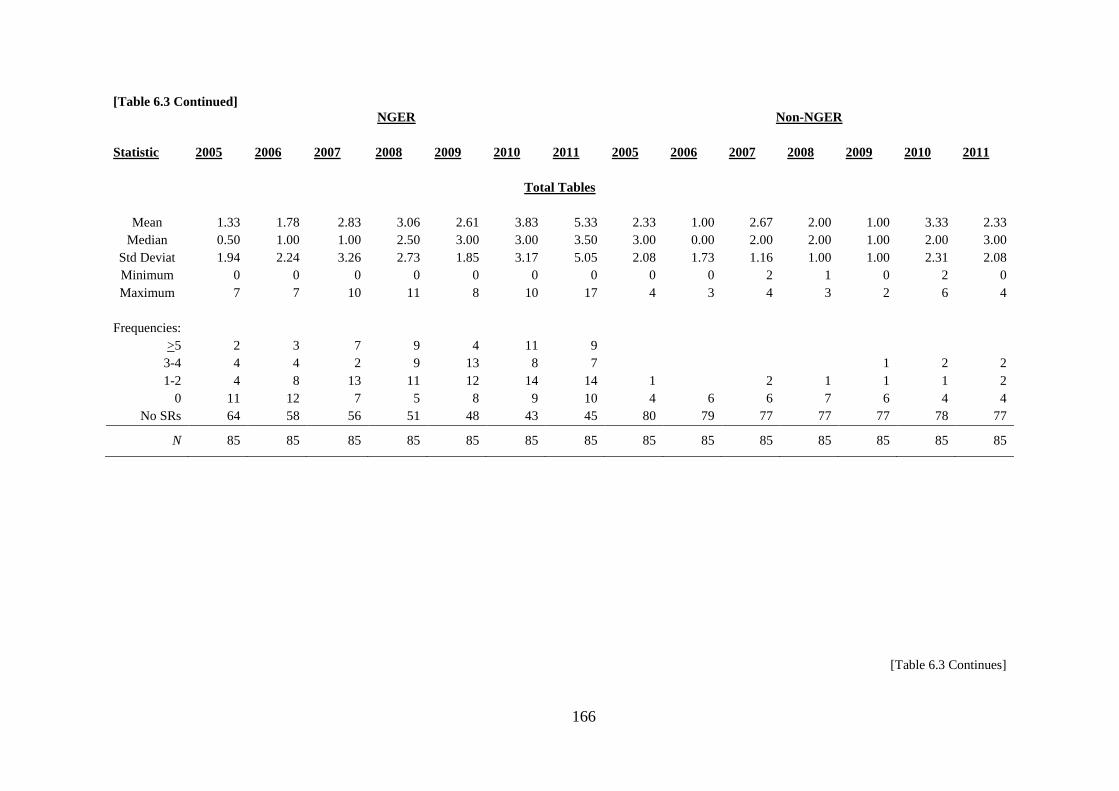
166
[Table 6.3 Continued]
NGER Non-NGER
Statistic 2005 2006 2007 2008 2009 2010 2011 2005 2006 2007 2008 2009 2010 2011
Total Tables
Mean 1.33 1.78 2.83 3.06 2.61 3.83 5.33 2.33 1.00 2.67 2.00 1.00 3.33 2.33
Median 0.50 1.00 1.00 2.50 3.00 3.00 3.50 3.00 0.00 2.00 2.00 1.00 2.00 3.00
Std Deviat 1.94 2.24 3.26 2.73 1.85 3.17 5.05 2.08 1.73 1.16 1.00 1.00 2.31 2.08
Minimum 0 0 0 0 0 0 0 0 0 2 1 0 2 0
Maximum 7 7 10 11 8 10 17 4 3 4 3 2 6 4
Frequencies:
>5 2 3 7 9 4 11 9
3-4 4 4 2 9 13 8 7 1 2 2
1-2 4 8 13 11 12 14 14 1 2 1 1 1 2
0 11 12 7 5 8 9 10 4 6 6 7 6 4 4
No SRs 64 58 56 51 48 43 45 80 79 77 77 77 78 77
N 85 85 85 85 85 85 85 85 85 85 85 85 85 85
[Table 6.3 Continues]

167
[Table 6.3 Continued]
NGER Non-NGER
Statistic 2005 2006 2007 2008 2009 2010 2011 2005 2006 2007 2008 2009 2010 2011
Total Figures
Mean 0.06 0.06 0.33 0.17 1.28 0.39 0.89 0 0 0.33 0.33 0 0 0.33
Median 0.00 0.00 0.00 0.00 0.00 0.00 0.00 0 0 0.00 0.00 0 0 0.00
Std Deviat 0.24 0.24 0.59 0.38 2.68 0.70 1.50 0 0 0.58 0.58 0 0 0.58
Minimum 0 0 0 0 0 0 0 0 0 0 0 0 0 0
Maximum 1 1 2 1 11 2 7 0 0 1 1 0 0 1
Frequencies:
>5 2 2 1 4
3-4 3 3 1
1-2 1 2 7 5 11 11 8 2 1 2
0 20 25 22 27 21 27 27 5 6 6 7 8 7 6
No SRs 64 58 56 51 48 43 45 80 79 77 77 77 78 77
N 85 85 85 85 85 85 85 85 85 85 85 85 85 85

168
In Table 6.3 above, the mean keywords are consistently higher than the median
for NGER firms each year indicting the data is positively skewed. A small number of
NGER firms are providing on average more information than the median. Further, the
standard deviation for both NGER and Non-NGER firms is high indicating wide
variance around the mean.
However, Non-NGER firms show an erratic use of keywords over the research
period. Non-NGER mean keywords in 2005 is 20.33, dropping back to 10.00 in 2006,
before increasing to 33.33 mean keywords in 2007. In 2008, keywords again drop back
to 14.67 before increasing to 27.67 mean keywords in 2009, peaking in 2010 (56 mean
keywords) and then dropping back to 30 mean keywords in 2011. This trend may reflect
the evolving political controversy, debate and uncertainty surrounding government
action to address climate change over this period. This trend is consistent for total word
count, total sentence count and tables in the sustainability reports of Non-NGER firms.
For NGER firms the mean total word count (Table 6.3) increases from 2005
(554.50) to 2011 (828.44), and peaking in 2007 (995.94). In September, 2007 the
NGER Act was legislated and mandated carbon emission reporting requirements to
government. Voluntary carbon emission disclosures in 2007 were high and possibly
could be seen as an attempt to counter the regulatory threat. By 2008 the NGER Act
was implemented and the reporting requirements known. Disclosures dropped from the
2007 high of 995.94 mean total words to 927.00 mean words in 2008. The 30 June,
2009 was the end of the first reporting period and subsequently the mean total words
increased to 976.78. Increased public awareness and potential legitimacy threats existed
with the release of the government’s carbon emissions data. However, in 2010 political
controversy and debate surrounding methods to tackle climate change continued.
Political uncertainty increased with a minority government gaining power by making a

169
carbon tax compromise as a consequence of achieving support from the Greens Party
and independents. NGER firms’ voluntary carbon emission disclosures dropped to
858.83 mean words in 2010 and further declined to 828.44 mean words by 2011. NGER
firms’ mean words remain higher than the median indicating a small number of firms
are using a larger number of words resulting in the data being positively skewed. In
addition, there is also wide variance around the mean total words in each year. NGER
firms’ standard deviation in 2006 is 579.84 (the lowest variance indicated) and in the
following year 2007 it is 1226.44 (the highest variance). It is also interesting to note that
the mean total word counts for each year are considerably higher in NGER firms’
sustainability reports than in the annual reports, highlighting the increased use of the
sustainability reports to convey carbon emissions information. A similar pattern to the
mean total word count is observed for the mean total sentence count.
There is a slight increase in NGER firms’ use of graphs between 2005 (mean
1.50) and 2011 (mean 2.94) though there is wide variance around the mean indicated by
a high standard deviation (Table 6.3). In contrast, there is a larger increase in the use of
tables over the same period for NGER firms. In 2005 the mean table count is 1.33
increasing to 5.33 mean tables in 2011. However, the standard deviation remained high
indicating wide variance for the use of tables. Non-NGER firms used graphs and tables
to a lesser extent as information is predominately presented via words and sentences.
Figures did not appear to be a popular method for either NGER or Non-NGER firms to
convey carbon emissions information in the sustainability reports.
Table 6.3 includes the frequency counts in sustainability reports for each of the
variables under investigation. The ranges are calculated manually and generated through
SPSS. Both NGER and Non-NGER firms disclosed the listed keywords more frequently
over time. The number of NGER (Non-NGER) firms using keywords 1-49 times

170
increased from 14 (3) in 2005 to 29 (8) by 2011. NGER firms also used keywords 50 or
more times consistently over the research period whereas this did not occur for Non-
NGER firms. It is clear NGER firms used keywords at a higher rate than Non-NGER
firms.
A similar trend noted for keywords also appeared for total words and total
sentences (Table 6.3). In 2005, NGER (Non-NGER) firms made disclosures at the rate
of 1-49 words, 4 times (1 time), and above 250 words, 7 times (2 times). By 2011 these
disclosures changed. Even though the use of words in the 1-49 word count remained
low, 2 times (1 time) the word count above 250 increased to 29 times (6 times).
In 2005, NGER (Non-NGER) firms provided sentence counts predominately at a
rate of 5 or above, 11 times (2 times) increasing to 34 times (7 times) by 2011. It is clear
that NGER firms consistently disclosed more carbon emission information using words
and sentences than Non-NGER firms.
The introduction of graphs appears to be an increasing method to convey carbon
emissions information for NGER and Non-NGER firms in sustainability reports. This is
particularly noted around the implementation year, 2008, and introductory years, 2009,
2010 and 2011 of the NGER Act. The use of tables also appears to be a popular method
to convey carbon emission information in sustainability reports though NGER firms
favoured the use of tables more than Non-NGER firms. Further, figures capture
information in the sustainability reports that are not captured by graphs or tables;
however the use of figures appears to be the least favourable method to convey carbon
emission information for both NGER and Non-NGER firms.
Sustainability reports are also examined to investigate the number of firms
voluntarily disclosing carbon emissions, the level of quantified carbon emissions and

171
for NGER firms whether voluntary disclosures reflect emissions data released by the
GEDO. The details are set out in Appendix 6 Table 2.
It is noted that the number of NGER (Non-NGER) firms not producing
sustainability reports declined from 64 (80) in 2005 to 45 (77) in 2011. “The steady
growth in reporting – especially in the last decade or so has been as much about
standalone reports as it has about increasing the data in the annual report. The bulk of
the increase in reporting has been of a voluntary nature and has, consequently it seems,
been dominated by larger companies in the more obviously ‘developed’ western
nations” (Gray 2005, p. 12). The raw data supports Gray’s observation; there is an
increasing use of the sustainability report over the research period by NGER firms.
Table 6.4 highlights the number of NGER sustainability reports produced each year and
the actual number of sustainability reports containing voluntary carbon emission
disclosures showing NGER firms’ increasing trend to use sustainability reports.
Consequently, information conveyed through the sustainability report also needs to be
considered in carbon emission research.

172
Table 6.4 NGER Sustainability Reports - Number produced & the actual number containing
VCEDs
2005 2006 2007 2008 2009 2010 2011
No. of Sustainability Reports 21 27 29 34 37 42 40
No. of Sustainability Reports voluntarily disclosing
carbon emissions
19 26 29 34 35 42 40
In 2005, 21 out of 85 NGER firms produced a sustainability report and this
increased to 40 out of 85 NGER firms by 2011 (Table 6.4). Further, the majority of
sustainability reports voluntarily reported carbon emissions information. For example,
in 2007, 2008, 2010 and 2011, all NGER sustainability reports in those years
voluntarily disclosed carbon emissions information. Subsequently, the sustainability
reports are included in the current research. Adopting the approach to investigate
voluntary disclosures in both the annual and sustainability reports maintains a consistent
pattern with prior research and enables comparison of research findings.
6.3 Changes over time in Voluntary Carbon Emission Disclosures
To identify changes in the quantity of disclosures for both NGER and Non-
NGER firms for the years 2005 through to 2011, a Friedman Test is used. A Friedman
Test is a non-parametric test used to examine related samples. This test is used when the
data is nominal or ordinal in nature and the normal distribution cannot be established for
the data (Cavana, Delahaye & Sekaran 2001).
The Related-Samples Friedman Tests’ Two-Way Analysis of Variance of
Changes in the quantity of voluntary carbon emission disclosures are conducted on
NGER and Non-NGER firms’ annual reports (Table 6.5) and sustainability reports
(Table 6.6) for the period 2005 – 2011. The Mean Ranks for each of the NGER and
Non-NGER firms’ keywords, words, sentences, graphs, tables and figures that appear in
the annual reports and sustainability reports are also presented in graph format and

173
appear in Appendix 7. The purpose of this investigation is to identify changes over time
in voluntary carbon emission disclosures.
The results (reported in Table 6.5) of the Friedman Test on the sample of NGER
(Non-NGER) firms’ annual reports indicate at the significance level of 0.05, a
significant increase in voluntary carbon emissions disclosures is identified by the
variables keywords N = 85, X2
= 82.40, df = 6, p = 0.00, (N = 85, X2
= 58.12, df = 6, p =
0.00); words N = 85, X2 = 81.66, df = 6, p = 0.00, (N = 85, X
2 = 48.91, df = 6, p = 0.00);
and sentences N = 85, X2 = 78.89; df = 6, p = 0.00, (N = 85, X
2 = 51.10; df = 6, p =
0.00); and NGER firms’ graphs N = 85, X2 = 34.37, df = 6, p = 0.00 and tables N = 85,
X2 = 19.76, df = 6, p = 0.00. The results for Non-NGER firms’ graphs (N = 85, X
2 =
8.67, df = 6, p = 0.19) and tables (N = 85, X2 = 9.91, df = 6, p = 0.13) are not significant,
likewise as for the results for NGER and Non-NGER firms’ figures N = 85, X2
= 6.72,
df = 6, p = 0.35, (N = 85, X2
= 2.47, df = 6, p = 0.87).
NGER firms mainly convey information through keywords, words, sentences,
graphs and tables in the annual reports. Non-NGER firms predominately use keywords,
words and sentences. The Friedman Test results for NGER and Non-NGER firms’
annual reports indicate hypothesis 1a is supported for each of the disclosure methods
except NGER firms’ use of figures and Non-NGER firms’ use of graphs, tables and
figures. Changes did occur in the quantity of disclosures made in the annual reports over
the period 2005 – 2011.

174
Table 6.5 Related-Samples Friedman's Two-Way Analysis of Variance of Changes in the quantity of VCEDs - Annual Reports
2005 2006 2007 2008 2009 2010 2011
NGER Non-
NGER
NGER Non-
NGER
NGER Non-
NGER
NGER Non-
NGER
NGER Non-
NGER
NGER Non-
NGER
NGER Non-
NGER
Keywords
Mean 2.70 3.46 3.28 3.58 3.98 3.71 4.54 4.02 4.64 4.33 4.35 4.32 4.52 4.59
Chi-Sq 82.40 58.12
Df 6 6
Asymp. Sig 0.00 0.00
Words
Mean 2.68 3.48 3.29 3.62 3.98 3.72 4.54 4.05 4.70 4.34 4.37 4.29 4.44 4.49
Chi-Sq 81.66 48.91
Df 6 6
Asymp. Sig 0.00 0.00
Sentences
Mean 2.71 3.50 3.32 3.61 3.99 3.74 4.51 4.01 4.64 4.34 4.35 4.28 4.48 4.53
Chi-Sq 78.89 51.10
Df 6 6
Asymp. Sig 0.00 0.00
Graphs
Mean 3.66 3.98 3.82 3.98 3.91 3.98 4.08 4.06 4.28 4.02 4.21 4.02 4.03 3.98
Chi-Sq 34.37 8.67
Df 6 6
Asymp. Sig 0.00 0.19

175
Table 6.5 Related-Samples Friedman's Two-Way Analysis of Variance of Changes in the quantity of VCEDs - Annual Reports Continued
2005 2006 2007 2008 2009 2010 2011
NGER Non-
NGER
NGER Non-
NGER
NGER Non-
NGER
NGER Non-
NGER
NGER Non-
NGER
NGER Non-
NGER
NGER Non-
NGER
Tables
Mean 3.72 3.95 3.78 3.99 4.06 3.95 3.97 3.99 4.06 3.99 4.14 3.99 4.28 4.12
Chi-Sq 19.76 9.91
Df 6 6
Asymp. Sig 0.00 0.13
Figures
Mean 3.92 4.00 3.92 4.00 4.00 4.00 4.09 4.00 4.08 3.96 4.00 4.00 4.00 4.04
Chi-Sq 6.72 2.47
Df 6 6
Asymp. Sig 0.35 0.87
Definitions of the variables: Keywords are carbon, emission, greenhouse, gas, GHG, Climate Change, Global Warming, NGER, National Greenhouse and
Energy Reporting and these keywords are identified in this order. Words are the number of words in a sentence identified by a keyword. Sentences are the number of
sentences that have been identified by a keyword. Graphs are identified by one of the keywords and each graph is counted as one. Tables are identified by one of the
keywords and each table is counted as one. Figures are identified by one of the keywords and each figure is counted as one.

176
The results (reported in Table 6.6) of the Friedman Test on the sample of NGER
firms’ sustainability reports indicates, at a significance level of 0.05, a significant
increase in voluntary carbon emissions disclosures is identified by the variables:
keywords N = 18, X2
= 28.11, df = 6, p = 0.00, words N = 18, X2 = 27.26, df = 6, p =
0.00, sentences N = 18, X2 = 24.90; df = 6, p = 0.00, tables N = 18, X
2 = 27.23, df = 6,
p = 0.00 and figures N = 18, X2
= 19.60, df = 6, p = 0.00. However, the results do not
indicate a significant increase in the use of graphs for NGER firms N = 18, X2 = 10.79,
df = 6, p = 0.10 suggesting that NGER firms’ quantity use of graphs in sustainability
reports has not changed over the 2005 – 2011 period. The Friedman Test results
highlight changes in the methods used to convey carbon emission information in
sustainability reports for NGER firms. The results indicate hypothesis 1a is supported
for each of the disclosure methods except for the use of graphs. Changes did occur in
the quantity of disclosures over the period 2005 – 2011.
In contrast, the Friedman Test results for Non-NGER firms’ sustainability
reports does not support hypothesis 1a indicating significant changes did not occur in
the quantity of disclosures made through Non-NGER sustainability reports. The results
of the Friedman Test on the Non-NGER firms’ sustainability reports are not significant:
keywords (N = 3, X2
= 8.75, df = 6, p = 0.19), words (N = 3, X2 = 8.16, df = 6, p = 0.23),
sentences (N = 3, X2 = 8.52; df = 6, p = 0.20), graphs (N = 3, X
2 = 6.69, df = 6, p =
0.35), tables (N = 3, X2 = 4.96, df = 6, p = 0.13) and figures (N = 85, X
2 = 2.47, df = 6, p
= 0.87).

177
Table 6.6 Related-Samples Friedman's Two-Way Analysis of Variance of Changes in the quantity of VCEDs - Sustainability Reports
2005 2006 2007 2008 2009 2010 2011
NGER Non-
NGER
NGER Non-
NGER
NGER Non-
NGER
NGER Non-
NGER
NGER Non-
NGER
NGER Non-
NGER
NGER Non-
NGER
Keywords
Mean 2.25 3.83 2.72 1.50 4.14 5.50 4.44 2.67 5.17 4.33 4.89 5.67 4.39 4.50
Chi-Sq 28.11 8.75
Df 6 6
Asymp. Sig 0.00 0.19
Words
Mean 2.61 3.50 2.56 1.50 4.28 5.33 4.61 3.00 5.28 4.33 4.94 5.67 3.72 4.67
Chi-Sq 27.26 8.16
Df 6 6
Asymp. Sig 0.00 0.23
Sentences
Mean 2.64 3.83 2.58 1.50 4.22 5.33 4.44 2.67 5.28 4.33 4.78 5.67 4.06 4.67
Chi-Sq 24.90 8.52
Df 6 6
Asymp. Sig 0.00 0.20
Graphs
Mean 3.25 3.67 3.47 2.67 3.69 3.33 4.64 3.33 4.83 4.33 4.17 5.33 3.94 5.33
Chi-Sq 10.79 6.69
Df 6 6
Asymp. Sig 0.10 0.35
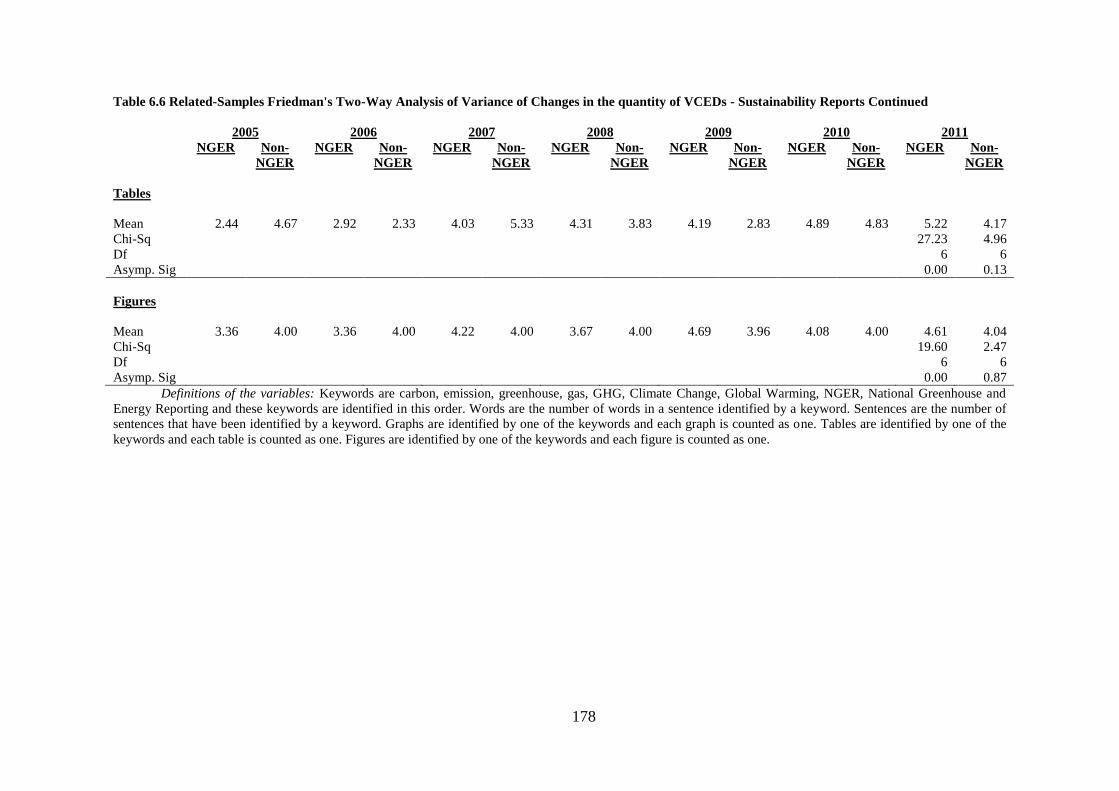
178
Table 6.6 Related-Samples Friedman's Two-Way Analysis of Variance of Changes in the quantity of VCEDs - Sustainability Reports Continued
2005 2006 2007 2008 2009 2010 2011
NGER Non-
NGER
NGER Non-
NGER
NGER Non-
NGER
NGER Non-
NGER
NGER Non-
NGER
NGER Non-
NGER
NGER Non-
NGER
Tables
Mean 2.44 4.67 2.92 2.33 4.03 5.33 4.31 3.83 4.19 2.83 4.89 4.83 5.22 4.17
Chi-Sq 27.23 4.96
Df 6 6
Asymp. Sig 0.00 0.13
Figures
Mean 3.36 4.00 3.36 4.00 4.22 4.00 3.67 4.00 4.69 3.96 4.08 4.00 4.61 4.04
Chi-Sq 19.60 2.47
Df 6 6
Asymp. Sig 0.00 0.87
Definitions of the variables: Keywords are carbon, emission, greenhouse, gas, GHG, Climate Change, Global Warming, NGER, National Greenhouse and
Energy Reporting and these keywords are identified in this order. Words are the number of words in a sentence identified by a keyword. Sentences are the number of
sentences that have been identified by a keyword. Graphs are identified by one of the keywords and each graph is counted as one. Tables are identified by one of the
keywords and each table is counted as one. Figures are identified by one of the keywords and each figure is counted as one.

179
Taking into consideration the results of the descriptive statistics and the
Friedman tests, hypothesis 1a is supported. However, hypothesis 1d is partly supported.
Firms that are required to report under the NGER Act do not have more voluntary
carbon emissions disclosures in annual and sustainability reports pre-legislation than
firms that are not required to report under the NGER Act. However, NGER firms do
have more voluntary carbon emission disclosures in the annual and sustainability
reports post-legislation.
The descriptive statistics and frequencies clearly indicate that the NGER firms in
the years 2005 and 2006 prior to enactment of the NGER Act 2007 provided minimal
voluntary carbon emission disclosures in the annual and sustainability reports. It
appears that changing societal attitudes influenced the increase of large emitters’
voluntary carbon emissions disclosures from 2006 onwards.
6.4 Validity Test of Results
6.4.1 Independent Samples t-test
To further increase the validity of the thesis results, an Independent Samples t-
test is also used. Independent Samples t-tests examine the means of two groups with
different observations to assess whether the two groups are significantly different from
each other. The tests are used to make inferences about nominal or ordinal data. When
the population standard deviation is unknown, the t-test is selected and an assumption is
made that the two groups are taken from normal distributions (Zikmund 2003). The
Independent Samples t-test is conducted using the means of keywords, words,
sentences, graphs, tables and figure data taken from NGER and Non-NGER’s annual
reports to check whether the two groups are significantly different. The results are
presented in Table 6.7.

180
Table 6.7 Independent Samples T-test comparing NGER & Non-NGER's Annual Reports
2005 2006 2007 2008 2009 2010 2011
Keywords
t-statistic 2.47 3.52 3.84 4.53 3.41 3.48 3.81
Df 168 168 168 168 168 168 168
Sig. (2-tailed) 0.02 0.00 0.00 0.00 0.00 0.00 0.00
Total Words
t-statistic 2.37 3.69 3.660 4.44 3.92 3.46 3.83
Df 168 168 168 168 168 168 168
Sig. (2-tailed) 0.02 0.00 0.00 0.00 0.00 0.00 0.00
Total Sentences
t-statistic 2.41 3.65 3.67 4.42 3.93 3.47 3.66
Df 168 168 168 168 168 168 168
Sig. (2-tailed) 0.02 0.00 0.00 0.00 0.00 0.00 0.00
Total Graphs
t-statistic 0 2.04 2.75 2.37 2.73 2.42 2.54
Df 168 168 168 168 168 168 168
Sig. (2-tailed) 0 0.04 0.01 0.02 0.01 0.02 0.01
Total Tables
t-statistic 1.75 1.43 3.01 2.63 1.80 3.03 3.10
Df 168 168 168 168 168 168 168
Sig. (2-tailed) 0.08 0.15 0.00 0.01 0.07 0.00 0.00
Total Figures
t-statistic 0.00 0.00 1.01 1.70 2.29 1.01 0.71
Df 168 168 168 168 168 168 168
Sig. (2-tailed) 1.00 1.00 0.32 0.09 0.02 0.31 0.48
As can be seen from Table 6.7, the Independent Samples t-test for keywords
from 2005 to 2011 indicate that there is significant difference between the average
keywords for NGER firms and Non-NGER firms at the 95% confidence interval of the
difference, and this difference is not due to chance alone. The t-statistics for word,
sentences and graphs reflect this same pattern indicating that a difference exists between
NGER and Non-NGER firms’ voluntary carbon emission disclosures in the annual

181
reports. The exception is 2005 when NGER and Non-NGER firms did not produce
graphs.
However, the use of tables shows a mixed result, with no significant increase in
2005, 2006 and 2009. The results highlight the increased use of tables in the annual
reports during 2007, 2008, 2010 and 2011.
Further, the t-test results for the use of Figures indicate for the majority of years,
there is no significant variance between the two groups. The exception is in 2009 (t-
statistic = 2.29, df = 168, p = 0.02) which is the first reporting year under the NGER
Act. These results indicate NGER and Non-NGER firms are significantly different.
Even though voluntary carbon emission disclosures increased for both NGER and Non-
NGER firms between 2005 and 2011, overall, the disclosures increased at a higher rate
in the NGER firms’ annual reports than Non-NGER firms. This results in significant
differences between NGER and Non-NGER firms. Thus the hypothesis 1b is supported.
Nevertheless, it is also important to compare the means of the keywords, words,
sentences, graphs, tables and figures from the NGER and Non-NGER sustainability
reports over the research period. The use of sustainability reports to convey
environmental information has increased over time (Haque & Deegan 2010). In
addition, these reports are frequently used in conjunction with annual reports.
As can be seen from the sustainability reports presented in Table 6.8, the
Independent Samples t-test for keywords 2008 and 2009 indicate at the 95% confidence
interval of the difference, there is significant difference between the average keywords
for NGER firms and Non-NGER firms.

182
Table 6.8 Independent Samples T-test comparing NGER & Non-NGER's Sustainability Reports
2005 2006 2007 2008 2009 2010 2011
Keywords
t-statistic 0.83 1.35 1.47 2.94 2.41 0.48 0.97
Df 24 31 35 40 43 47 46
Sig. (2-tailed) 0.41 0.19 0.15 0.01 0.02 0.63 0.34
Total Words
t-statistic 0.74 1.14 1.35 2.70 2.32 0.20 1.15
Df 24 31 35 40 43 47 46
Sig. (2-tailed) 0.47 0.26 0.19 0.01 0.03 0.85 0.25
Total Sentences
t-statistic 0.76 1.23 1.35 2.87 2.63 0.35 1.19
Df 24 31 35 40 43 47 46
Sig. (2-tailed) 0.46 0.23 0.19 0.01 0.01 0.73 0.24
Total Graphs
t-statistic 0.85 1.28 1.53 2.38 1.44 0.96 0.39
Df 24 31 35 40 43 47 46
Sig. (2-tailed) 0.40 0.21 0.14 0.02 0.16 0.34 0.70
Total Tables
t-statistic 0.14 0.98 1.09 2.21 2.17 .72 .27
Df 24 31 35 40 43 47 46
Sig. (2-tailed) 0.89 0.34 0.28 0.03 0.04 0.48 0.79
Total Figures
t-statistic 0.48 0.64 0.26 0.77 1.55 1.41 1.03
Df 24 31 35 40 43 47 46
Sig. (2-tailed) 0.64 0.53 0.80 0.45 0.13 0.16 0.31
These two years correspond with severe drought conditions Australia was
experiencing, and the implementation year (2008) and the end of the first reporting year
(2009) of the NGER legislation. Initially, the t-test for keywords did not indicate any
significant differences between the two groups between 2005 and 2007 when Australia
was experiencing rainfall deficiencies. However as the drought extended over 2008 and
2009, the reality of climate change was high in the minds of firms and the community,

183
potentially contributing to the increase in voluntary carbon emission disclosures in the
sustainability reports during these two years.
During 2010 and 2011, easing rainfall was received and the urgency of
addressing climate change was reduced. Disclosures in the sustainability reports of
NGER firms did not represent significant variance from Non-NGER firms’ disclosures
this period.
The t-statistics for Word, Sentences, Graphs and Tables reflect this same pattern
and indicate that a significant difference exists between NGER and Non-NGER firms’
voluntary carbon emission disclosures in the sustainability reports for the years 2008
and 2009. The exception to this pattern relates to the use of graphs in 2009 where the t-
statistic does not indicate a significant difference between the two groups. The increased
voluntary carbon emission disclosures are mainly conveyed through keywords, words,
sentences and tables during that year.
Further, there is no significant variance between the two groups in the use of
figures for each year. The t-statistics for 2005, 2006, 2007, 2008, 2009, 2010 and 2011
show the p value is greater than 0.05, indicating that there is no significant difference
between NGER and Non-NGER firms’ use of figures during the period 2005 to 2011.
Overall, the voluntary carbon emission disclosures increased in the sustainability
reports during the years 2008 and 2009, otherwise there was no significant difference
between 2005, 2006, 2007, 2010 or 2011 in the sustainability reports. Hypothesis 1c is
not supported for the years 2005 to 2007 and 2010 and 2011.
The Two Independent Samples t-test is also used to compare the changes in the
pre-NGER period with the changes in the post-NGER period in NGER and Non-NGER
firms’ annual and sustainability reports.

184
The Independent samples t-test is used to investigate the differences between the
mean of the pre-NGER change and post-NGER change of NGER and Non-NGER firms
to assess whether any significant differences exists. A confidence interval between the
two groups is 95%. The Independent samples t-test for NGER firms is conducted using
keyword, word, sentence, graphs, tables and figure data. The results are presented for
pre-post NGER changes for the two groups in Table 6.9.

185
Table 6.9 Two Independent Samples T-Test Pre-Post NGER & Non-NGER firms' Annual &
Sustainability Reports
Pre-Post-NGER Change
NGER Non-NGER
Keywords
t-statistic -3.29 -2.21
Df 168 168
Sig. (2-tailed) 0.00 0.03
Total Words
t-statistic -4.44 -3.04
Df 168 168
Sig. (2-tailed) 0.00 0.00
Total Sentences
t-statistic -4.10 -2.55
Df 168 168
Sig. (2-tailed) 0.00 0.01
Total Graphs
t-statistic -1.81 0.00
Df 168 168
Sig. (2-tailed) 0.07 1.00
Total Tables
t-statistic -0.64 -1.27
Df 168 168
Sig. (2-tailed) 0.53 0.21
Total Figures
t-statistic -0.99 -1.42
Df 168 168
Sig. (2-tailed) 0.33 0.16
Noted above in Table 6.9, the significance value of the test is less than 0.05 for
keywords (t-statistic = -3.29, df = 168, p = 0.00), total words (t-statistic -4.44, df = 168,
p = 0.00) and total sentences (t-statistic = -4.10, df= 168, p = 0.00) indicating the mean
difference between the pre- and post-NGER change is significant and this occurrence is
not due to chance alone. The remaining variables - total graphs (t-statistic = -1.81, df =
168, p = 0.07), total tables (t-statistic = 0-.64, df = 168, p = 0.53) and total figures (t-

186
statistics = -0.99, df = 168, p = 0.33), have a significance value greater than 0.01 and
therefore it is assumed that these variables have equal variance between the pre- and
post-NGER change. The difference between the mean pre-NGER change and mean
post-NGER change for NGER firms occurs with the use of keywords, words, and
sentences rather than tables, graphs and figures.
The results of the t-test for Non-NGER firms indicate for keywords (t-statistic =
-2.21, df = 168, p = 0.03), words (t-statistic = -3.04, df 168, p = 0.00), and sentences (t-
statistic = -2.55, df 168, p = 0.01) there is significant difference between the pre-NGER
change and post-NGER change for Non-NGER firms. The significance value for total
graphs (t-statistic = 0.00, df = 168, p = 1.00), total tables (t-statistic = -1.27, df = 168, p
= 0.21) and total figures (t-statistic = -1.42, df 168, p = 0.16) are above the value .01
indicating that there is equal variance between the pre-NGER change and post-NGER
change for these variables. Overall the findings indicate that significant changes
occurred between the mean pre-NGER change and post-NGER change for Non-NGER
firms using keywords, total words and total sentences rather than graphs, tables and
figures. This pattern is consistent with the results of the two independent samples t-test
used on pre-NGER change and post-NGER change for NGER firms. Hypothesis 5a is
supported.
The Independent Samples t-test also compares the change in the mean post-
NGER period minus the change in the pre-NGER period of NGER and Non-NGER
firms’ annual and sustainability reports to determine whether the two groups are
significantly different. The Independent Samples t-test is conducted using the change in
mean keyword, change in mean total word count and the change in mean total sentence
count for both the NGER and Non-NGER firms. The results are presented in Table
6.10.

187
Table 6.10 Independent Samples T-test Pre-Post Change [(2011-2009)-(2007-2005)] comparing
NGER & Non-NGER firms' Annual & Sustainability Reports
Keywords
t-statistic -2.95
Df 168
Sig. (2-tailed) 0.00
Total Words
t-statistic -3.88
Df 168
Sig. (2-tailed) 0.00
Total Sentences
t-statistic -3.77
Df 168
Sig. (2-tailed) 0.00
The Independent Samples t-test for change in the mean keywords (t-statistic = -
2.95, df = 168, p = 0.00), for the change in mean words (t-statistic = -3.88, df = 168, p =
0.00) and for the change in the mean sentences (t-statistic = -3.77, df = 168, p = 0.00)
between NGER and Non-NGER firms indicate at the 95% confidence interval of the
difference significant changes occurred. H5b is supported.
In summary, the Independent Samples t-test is conducted on the annual reports
and sustainability reports for both NGER and Non-NGER firms. The t-test is also used
to investigate the pre-post NGER change for NGER and Non-NGER firms separately.
Finally the differences in the mean changes of the three variables keywords, words and
sentences indicate significant differences exist between NGER and Non-NGER firms.

188
6.4.2 Mann-Whitney z-test
The Mann-Whitney z-test, a rank-sum test, is a non-parametric test that makes
no assumptions about the normality of the population distribution (Zikmund 2003). This
is an alternative test to the Independent Samples t-test and compares the differences in
two sample means to identify significant differences in the two population means
(Zikmund 2003). Each observation is assigned to a group that is identified by its
relevant population; then the observations are assigned a rank order and all the
observations are treated as one set of observations (Zikmund 2003). The Mann-Whitney
z-test is used to examine whether the NGER and Non-NGER firms’ keywords, words,
sentences, graphs, tables and figures are the same across the means of the pre-NGER
changes in comparison with the means of the post–NGER changes, and to determine
whether significant differences exist in the population means represented by these two
periods.
The test indicates at the significance level of 0.05, there is significant difference
for NGER firms between keywords, words, sentences, and graphs between the pre-
NGER changes and post-NGER changes (Table 6.11). Likewise for Non-NGER firms,
there is significant difference between keywords, words and between the pre-NGER
changes and post-NGER changes.

189
Table 6.11 Mann-Whitney z-test comparing Pre-NGER Changes with Post-NGER Changes -
NGER & Non-NGER firms
NGER Non-NGER
Keywords
z-statistic 2,182.50 3,102.50
Total N 170 170
Sig. (2-sided test) 0.00 0.00
Total Words
z-statistic 2,060.50 3,017.50
Total N 170 170
Sig. (2-sided test) 0.00 0.00
Total Sentences
z-statistic 2,153.50 3,102.50
Total N 170 170
Sig. (2-sided test) 0.00 0.00
Total Graphs
z-statistic 2,531.00 3,570.00
Total N 170 170
Sig. (2-sided test) 0.00 0.56
Total Tables
z-statistic 3,328.50 3,527.50
Total N 170 170
Sig. (2-sided test) 0.30 0.31
Total Figures
z-statistic 3,250.50 3,527.50
Total N 170 170
Sig. (2-sided test) 0.10 0.16
However, as shown in the above table the test highlights that there is no
significant variance for the NGER firms’ use of tables and figures between the pre-
NGER changes and post-NGER changes. Likewise, similar results occur for Non-
NGER firms’ use of graphs, tables and figures, indicating no significant change have
occurred from the pre- to post-NGER period. Overall there is significant difference

190
between changes pre-NGER and changes post-NGER of voluntary carbon emission
disclosures for NGER firms’ use of keywords, words, sentences and graphs and Non-
NGER firms’ use of keywords, words and sentences. Therefore, H7c is supported for
NGER and Non-NGER firms. These findings are consistent with the results of the
Independent Samples t-test. Table 6.12 summarises the testing results of voluntary
carbon emission disclosures.
Table 6.12 Summary of Hypotheses testing changes in Voluntary Carbon Emission Disclosures
Hypotheses Outcome
H1a supported
H1b supported
H1c Supported in part
H1d supported in part
H5c Supported
6.5 Testing significant differences in use between annual and sustainability
reports
The non-parametric test, Wilcoxon Signed-Rank Test, is used to identify
significant differences in the use of the dependent variable, voluntary carbon
emission disclosures, which occur between two related samples, the annual and
sustainability reports. The results in the Sign Test and Marginal Homogeneity Test
are used to validate the findings from the Wilcoxon Signed-Ranks Test. The normal
distribution of the population cannot be assumed; therefore the t-test is not used. The
data is quantitative in nature. The test is separately conducted for NGER and Non-
NGER firms.
The Wilcoxon Signed-Ranks Test tests the hypothesis that the mean of the
variables (Keywords, Sentences and Words) sourced from the NGER (Non-NGER)
annual reports is the same as the mean of these variables sourced from the NGER
(Non-NGER) sustainability reports. The Wilcoxon Signed-Ranks Test assesses the
mean ranks, the sum of ranks, the negative and positive ranks and the ties to take

191
into consideration the magnitude and direction of the differences between the
negative and positive ranks. The Wilcoxon Signed-Ranks Test results presented in
the Table 6.13 are based on negative ranks.
A significant difference is indicated for NGER firms between keywords,
sentences and words with higher voluntary carbon emission disclosures occurring in
the NGER sustainability reports than annual reports for the years 2005 through to
2011. The Z-score for keywords for each year is: 2005 (Z = -3.66, p < 0.00), 2006 (Z
= -4.08, p < 0.00), 2007 (Z = -3.85, p < 0.00), 2008 (Z = -4.69, p < 0.00), 2009 (Z =
-4.15, p < 0.00), 2010 (Z = -5.00, p < 0.00) and 2011 (Z = -4.85, p < 0.00) at the
significance level of 0.01. Hypothesis 2 is supported for NGER firms. The mean of
the variables are not the same between the annual reports and sustainability reports.
Sustainability reports appear to be the preferred medium for NGER firms to
voluntarily disclose carbon emissions. Similar results occur for the use of sentences
and words, not discussed here.

192
Table 6.13 Comparing VCEDs between Annual & Sustainability Reports - NGER & Non-NGER firms
2005 2006 2007 2008 2009 2010 2011
NGER N/NGER NGER N/NGER NGER N/NGER NGER N/NGER NGER N/NGER NGER N/NGER NGER N/NGER
a. Keywords
Wilcoxon Signed Ranks Test - Z score -3.66 -1.10 -4.08 -2.03 -3.85 -2.38 -4.69 -2.03 -4.15 -1.86 -5.00 -2.20 -4.85 -2.38
(Sig.) (0.00) (0.27) (0.00) (0.04) (0.00) (0.02) (0.00) (0.04) (0.00) (0.06) (0.00) (0.03) (0.00) (0.02)
Sign Test - Z score * * * * -3.97 * -4.97 * -3.72 * -5.62 * -4.90 *
(Sig.) (0.00) (0.00) (0.00) (0.00) (0.00)
Marginal Homogeneity Test - Std.
MH score
-2.51
-1.37
-3.06
-1.68
-3.09
-2.16
-4.21
-1.98
-4.03
-1.64
-4.48
-1.81
-3.93
-2.42
(Sig.) (0.01) (0.17) (0.00) (0.09) (0.00) (0.03) (0.00) (0.05) (0.00) (0.10) (0.00) (0.07) (0.00) (0.02)
b. Sentences
Wilcoxon Signed Ranks Test - Z score -3.61 -1.10 -3.58 -2.07 -3.75 -2.38 -4.47 -1.70 -4.15 -1.86 -4.83 -2.02 -4.44 -2.38
(Sig.) (0.00) (0.27) (0.00) (0.04) (0.00) (0.02) (0.00) (0.090) (0.00) (0.06) (0.00) (0.04) (0.00) (0.02)
Sign Test - Z score * * * * -4.23 * -4.18 * -3.72 * -5.44 * -4.48 *
(Sig.) (0.00) (0.00) (0.00) (0.00) (0.00)
Marginal Homogeneity Test - Std.
MH score
-2.47
-1.33
-2.78
-2.14
-2.86
-2.21
-4.04
-1.84
-4.03
-1.58
-4.30
-1.75
-3.81
-2.38
(Sig.) (0.01) (0.18) (0.01) (0.03) (0.00) (0.03) (0.00) (0.07) (0.00) (0.12) (0.00) (0.08) (0.00) (0.02)
c. Words
Wilcoxon Signed Ranks Test - Z score -3.58 -1.10 -3.75 -2.02 -3.84 -2.38 -4.55 -1.86 -4.05 -1.69 -5.07 -1.99 -4.48 -2.38
(Sig.) (0.00) (0.27) (0.00) (0.04) (0.00) (0.02) (0.00) (0.06) (0.00) (0.09) (0.00) (0.05) (0.00) (0.02)
Sign Test - Z score * * -2.69 * -4.99 * -4.87 * -3.83 * -5.71 * -4.48 *
(Sig.) (0.01) (0.00) (0.00) (0.00) (0.00) (0.00)
Marginal Homogeneity Test - Std.
MH score
-2.41
-1.33
-2.76
-2.14
-2.82
-2.17
-4.00
-1.89
-3.94
-1.48
-4.27
-173
-3.79
-2.38
(Sig.) (0.02) (0.18) (0.07) (0.03) (0.01) (0.03) (0.00) (0.06) (0.00) (0.14) (0.00) (0.08) (0.00) (0.02)
*If the sum of the negative and positive differences are 26 or more the Sign Test produces a Z statistic otherwise it does not.

193
A significant difference also occurs for Non-NGER firms’ keywords (Table
6.13) in the years 2006 (Z = -2.03, p < 0.04), 2007 (Z = -2.38, p < 0.02), 2008 (Z = -
2.03, p < 0.04), 2010 (Z = -2.20, p < 0.03) and 2011 (Z = -2.38, p < 0.02) at the
significant level of 0.05 indicating higher voluntary carbon emission disclosures are
made in sustainability reports than annual reports for Non-NGER firms over these
years. Hypothesis 2 is supported for each of these years for Non-NGER firms. The
trend is similar for the use of sentences and words over the same years except for
2008, where a significant difference does not occur for the use of and words
between Non-NGER’s annual and sustainability reports.
The Sign Test (Table 6.13) is based on the number of positive and negative
differences between the variables (keywords, sentences and words) in the annual
reports and sustainability reports of NGER firms and Non-NGER firms over the
period 2005 to 2011. The test is conducted on a matched-pair sample. Only the
number of positive and negative differences is counted rather than the size of the
differences. The data is quantitative and the normality of the population distribution
is unknown. The Sign Test does not take into consideration the magnitude of the
differences and hence it is not as powerful a test as the Wilcoxon Signed-Ranks
Test.
A binominal distribution is used. When the positive and negative differences
between the NGER annual reports and sustainability reports are equal, the results of
the tests are not significant. When the sum of the negative and positive differences
is less than 26, a Z statistic is not produced. This is highlighted in the table for the
NGER years 2005 and 2006 Panel a. Keywords and Panel b. Sentences and only in
2005 for Words in Panel c.

194
The results are significant for words in 2006 (Z = -2.69, p < 0.01) and for the
remaining years, indicating significant differences did occur in voluntary carbon
emission disclosures between the annual reports and sustainability reports of NGER
firms. The results are similar for keywords and sentences from 2007 onwards. The
sustainability reports are used to voluntarily convey carbon emission information
more than the annual reports for the years 2007 through to 2011. The results of the
Sign Test are consistent with the Wilcoxon Signed-Ranked Test.
Likewise, the Sign Test is also conducted on the Non-NGER firms however,
a Z statistic is not produced for each year as the sum of the negative and positive
differences are below 26. Results are reported in Table 6.13. The use of
sustainability reports by Non-NGER firms is low in comparison with NGER firms
and therefore the small quantity of sustainability reports for each year restricts the
results.
The Marginal Homogeneity Test examines the marginal distributions of each
variable taken from two related samples to check whether systematic differences
exist between the samples (Table 6.13). The variables of interest in the above table
are keywords, sentences and words and whether each of these variables has the same
marginal distribution between the annual reports and sustainability reports. The
Marginal Homogeneity Test is used in conjunction with the Wilcoxon Signed-
Ranked Test as the data is continuous in nature.
As the table indicates, NGER firms’ Std. MH Statistic is significant at the
significance level of 0.05 in 2005 for each of the variables keywords, sentences, and
words. For the years 2006 through to 2011 the significance level is 0.01 for the use
of keywords. The annual reports and sustainability reports of NGER firms do not

195
have the same marginal distribution. Therefore hypothesis 2 is supported. These
findings are consistent with the results of the Wilcoxon Signed Ranks Test.
In contrast, Non-NGER firms’ Std. MH Statistic shows mixed results. The
test is significant at the significance level of 0.05 for the variable keywords in 2007,
2008, and 2011. However, for the years 2005, 2006, 2009 and 2010, the Std. MH
Statistic is not significant. Hypothesis 2 is supported for the years 2007, 2008 and
2011. The Non-NGER annual and sustainability reports do not have the same
marginal distribution during these years.
The results of the Non-NGER’s keywords are consistent with the results for
the variables, sentences and words, except in the years 2006 and 2008. Non-NGER
firms increased voluntary carbon emission disclosures in sustainability reports using
sentences and words during 2006. The use of sentences and words were not
significantly different between annual and sustainability reports in 2008.
The combination of the Wilcoxon Signed-Ranks Test, Sign Test and the
Marginal Homogeneity Test suggest NGER firms voluntarily disclose carbon
emissions in sustainability reports more than annual reports. Hypothesis 2 is
supported for NGER firms. The use of sustainability reports increased at a higher
rate over the research period for NGER firms in comparison with Non-NGER firms.
Even though Non-NGER firms’ use of sustainability reports did increase, the overall
number of sustainability reports that were produced remained low. The low number
of sustainability reports for Non-NGER firms contributed to mixed results for these
firms.

196
6.6 Determinants of Carbon Emission Disclosures
6.6.1 Pearson and Spearman’s Rank Correlations
Both the Pearson (a parametric test) and the Spearman’s Rank (non-parametric
test) correlations are conducted on the NGER and Non-NGER firms to identify
associations between the explanatory variables and the dependent variables. Even
though the Spearman’s Rank Correlations are suitable when the normality of the
distribution cannot be assumed, using both parametric and non-parametric correlations
increases the robustness of the results.
The Pearson and Spearman’s Rank correlation matrices indicate that a number
of significantly positive correlations exist between the explanatory variables and the
dependent variables for both NGER and Non-NGER firms. The results are set out in
Table 6.12 for 585 NGER firm years and in Table 6.13 for 595 Non-NGER firm years.
A positively significant relationship exists between NGER (Table 6.12) and
Non-NGER firms’ (6.13) independent variable PrePost_NGER and the dependent
variables V/DISC, V/DISC_Keywords, V/DISC_Words and V/DISC_Sentences at the
significance level of 0.01. This significant relationship is also indicated by the
Spearman’s rank correlation. PrePost_NGER is a dummy variable that gives value of
one to the post implementation years of the NGER Act and therefore this association is
expected in light of the increasing trend to voluntary disclose carbon emissions.

197
Table 6.14 NGER - Pearson Correlation (above the diagonal) and Spearman's Rank Correlation (below the diagonal) Matrix
V1 V2 V3 V4 V5 V6 V7 V8 V9 V10 V11 V12 V13 V14 V15 V16 V17
V1 1 .404** .434** .434** .213** .060 .033 .024 .068 .214** .047 .079 -.105* .213** .010 .259** .307**
V2 .909** 1 .967** .967** .131** .130** -.009 .159** .041 .546** -.009 .000 -.022 .181** -.034 .160** .191**
V3 .901** .987** 1 .990** .122** .129** -.025 .168** .037 .533** -.008 .012 -.02 .204** -.032 .185** .209**
V4 .902** .991** .995** 1 .118** .124** -.017 .158** .051 .536** -.007 .011 -.023 .197** -.031 .180** .201**
V5 .213** .208** .198** .200** 1 .000 .000 .000 .000 .123** -.028 -.046 -.054 -.012 -.077 .097* .058
V6 .060 .098* .090* .094* .000 1 .318** .783** -
.313**
.145** -.047 .192** .345** -.068 -.105* .181** .112**
V7 .033 .063 .050 .056 .000 .318** 1 -
.221**
-
.139**
.005 -.012 .024 .001 .107** -.06 .133** .028
V8 .024 .062 .065 .068 .000 .783** -
.221**
1 -
.342**
.152** -.04 .165** .384** -
.150**
-.083* .065 .088*
V9 .068 .078 .072 .077 .000 -
.313**
-
.139**
-
.342**
1 .038 -.012 -
.112**
-
.120**
-
.189**
.011 .050 -.008
V10 .214** .335** .326** .326** .123** .145** .005 .152** .038 1 -.007 -.013 .031 .059 -.028 .133** .173**
V11 -.001 .016 .033 .028 .005 -.069 -.027 -.073 .055 .051 1 .04 -.024 .074 -.004 -.022 .007
V12 .036 .024 .026 .024 -.078 .209** .007 .202** -
.126**
.001 .085* 1 .127** .347** .230** -.008 .007
V13 .034 .065 .070 .077 .022 .480** .070 .488** -.097* .120** .004 .225** 1 -
.353**
-.086* -.064 -
.157**
V14 .189** .213** .201** .196** -.018 -.052 .121** -
.149**
-
.199**
.037 .134** .378** -
.342**
1 .103* .124** .294**
V15 .072 .056 .061 .064 -
.152**
-
.184**
-
.148**
-
.174**
.311** -.009 .106** .073 -
.154**
-.053 1 -.059 -.027
V16 .259** .271** .268** .261** .097* .181** .133** .065 .050 .133** .064 -.090* .044 .124** .003 1 .637**
V17 .335** .358** .354** .349** .071 .178** .078 .109** -.007 .181** .098* .015 -.043 .316** -.004 .738** 1
Legend: V1 – V/DISC (Voluntary Disclosures = 1), V2 – V/DISC_Keywords , V3 – V/DISC_Words and V4 – V/DISC_Sentences (Voluntary Disclosures captured by
keywords, words and sentences), V5 – PrePost_NGER (Post-NGER = 1), V7 – Industry_Energy, V8 – Industry_Materials and V9 – Industry_Industrials (Energy,
Materials & Industrials Industries = 1), V10 – CEASSUR (Assured Data = 1, V11 Free_CF_Total_Asst (FCF Scaled by Total Assets), V12 – MKTBK_AVER_5YRS
(MKT/BK aver over 5 years), V13 – SDROA_5YRs (Standard Deviation of ROA over 5 years), V14 – LOG_SIZE (The natural Logarithm), V15 – LEV (Total
Liabilities/Total Assets), V17 - CORP_GOV_SCORE = (BD/Indep_Dummy+Duality+Envir/Com+EC/CEO_member+ECOM/INDEP_DUMMY)/5 if ENVIR/COM
= 1) * Significant at the 0.05 level (two-tailed test), ** Significant at the 0.01 level (two-tailed test).

198

199
In Table 6.12 no significant relationship exists between Industry_Energy and the
dependent variables. These findings are consistent with Non-NGER firms (Table 6.13).
The lack of association between the energy industry and voluntary carbon emission
disclosures is consistent with the findings in Haque and Deegan (2010).

200
Table 6.15 Non-NGER - Pearson Correlation (above the diagonal) and Spearman's Rank Correlation (below the diagonal) Matrix
V1 V2 V3 V4 V5 V6 V7 V8 V9 V10 V11 V12 V13 V14 V15 V16 V17
V1 1 .655** .677** .647** .220** -.137** .045 -.168** -.016 .133** .054 -.069 -.077 .390** .020 .091* .192**
V2 .985** 1 .969** .988** .161** -.013 .078 -.058 -.061 .121** .037 -.05 -.052 .352** .043 .001 .157**
V3 .971** .987** 1 .968** .146** -.022 .076 -.066 -.054 .143** .036 -.062 -.053 .356** .066 .007 .174**
V4 .971** .988** .998** 1 .151** -.014 .072 -.057 -.055 .125** .035 -.057 -.051 .347** .05 .000 .156**
V5 .220** .222** .207** .210** 1 .000 .000 .000 .000 -.062 -.036 .059 -.004 .096* -.065 .045 .101*
V6 -.137** -.123** -.116** -.117** .000 1 .341** .841** -.406** -.015 -.172** .086* .159** -.176** -.258** .04 -.002
V7 .045 .06 .062 .061 .000 .341** 1 -.221** -.139** -.021 .007 .072 .161** .148** -.066 -.05 -.123**
V8 -.168** -.162** -.156** -.156** .000 .841** -.221** 1 -.342** -.003 -.183** .047 .071 -.267** -.230** .07 .068
V9 -.016 -.026 -.019 -0.02 .000 -.406** -.139** -.342** 1 -.033 .101* -.110* -0.065 -.024 .042 -.02 -.077
V10 .133** .144** .151** .147** -.062 -.015 -.021 -.003 -.033 1 -.001 -.036 -0.011 -.011 .036 .062 .061
V11 .074 .072 .065 .065 -.003 -.352** -.118** -.298** .262** -.017 1 -.037 -.171** -.171** .030 -.06 -.03
V12 -.091* -.075 -.079 -.081 .083 .302** .125** .239** -.169** -.034 -.100* 1 .150** .150** .065 -.115* -.133**
V13 -.289** -.288** -2.84** -.285** -.028 .598** .119** .552** .117** -.094* -.246** .276** 1 -.145** -.027 -.04 -.04
V14 .399** .413** .410** .413** .102* -.172** .153** -.267** -.032 .101* .195** .250** -.369** 1 .04 .043 .209**
V15 .167** .178** .179** .173** -.002 -.489** -.131** -.432** .236** .089* .286** -.085 -.349** .207** 1 .01 -.034
V16 .091* .07 .073 .074 .045 .04 -.049 .07 -.018 .062 -.014 -.098* -.043 .045 .100* 1 .291**
V17 .196** .201** .213** .214** .093* .002 -.127** .075 -.101* .074 -.027 -.107* -.151** .211** .08 .346** 1
Legend: V1 – V/DISC (Voluntary Disclosures = 1), V2 – V/DISC_Keywords , V3 – V/DISC_Words and V4 – V/DISC_Sentences (Voluntary Disclosures captured by
keywords, words and sentences), V5 – PrePost_NGER (Post-NGER = 1), V7 – Industry_Energy, V8 – Industry_Materials and V9 – Industry_Industrials (Energy,
Materials & Industrials Industries = 1), V10 – CEASSUR (Assured Data = 1, V11 Free_CF_Total_Asst (FCF Scaled by Total Assets), V12 – MKTBK_AVER_5YRS
(MKT/BK aver over 5 years), V13 – SDROA_5YRs (Standard Deviation of ROA over 5 years), V14 – LOG_SIZE (The natural Logarithm), V15 – LEV (Total
Liabilities/Total Assets), V17 - CORP_GOV_SCORE = (BD/Indep_Dummy+Duality+Envir/Com+EC/CEO_member+ECOM/INDEP_DUMMY)/5 if ENVIR/COM
= 1) * Significant at the 0.05 level (two-tailed test), ** Significant at the 0.01 level (two-tailed test).

201
Consequently, the NGER firms’ Industry_Materials variable has a positively
significant weak correlation with the dependent variables V/DISC_Keywords,
V/DISC_Words and V/DISC_Sentences at the significance level of 0.01. There is no
significant relationship appearing between Materials and the dependent variable V/DISC
for NGER firms (Table 6.12). In contrast, Non-NGER firms have a weak significant
negative correlation with V/DISC suggesting Non-NGER firms (Table 6.13) in the
materials industry are less likely to voluntary disclose carbon emissions. There is no
significant correlation between the independent variable Industry_Industrials and the
dependent variables for voluntary carbon emission disclosures for NGER (Table 6.12)
and Non-NGER firms (Table 6.13).
The independent variable CEASSUR, as indicated by both the Pearson’s
Correlation and Spearman’s Rank correlation, has a significantly strong positive
correlation with the dependent variables V/DISC, V/DISC_Keywords, V/DISC_Words
and V/DISC_Sentences at the significance level of 0.01 for NGER firms (Table 6.12).
Even though Non-NGER firms (Table 6.13) have a positive correlation, the association
is weaker. Nevertheless, the correlation does intimate CEASSUR is a predictor of
voluntary disclosures. Interestingly, the NGER and Non-NGER firms’ free cash flow,
financial performance and debt are not significantly correlated with voluntary carbon
emission disclosures. Evidence of no association between financial performance and
debt is in contrast with Hollindale (2012) and Hollindale et al’s (2010) observations.
The variable Log_Size has a positively significant correlation with the four
dependent variables V/DISC, V/DISC_Keywords, V/DISC_Words and
V/DISC_Sentences for both NGER (Table 6.12) and Non-NGER firms (Table 6.13)
though the association is stronger for the Non-NGER firms than NGER firms. The
positive correlation is consistent with prior research identifying firm size as a predictor

202
variable for voluntary emission disclosures (Choi, Lee & Pasros 2013; Deegan &
Gordon 1996; Hackston & Milne 1996).
Firms face economic risks however there is a weak negative correlation between
NGER firms (Table 6.12) and V/DISC at the significance level of 0.05. The variable
SDROA_5YRS is not significant with the other dependent variables for NGER firms or
any dependent variables for Non-NGER firms (Table 6.13). This observation is
consistent with prior literature noting firms provided minimal information on risks
(Global Reporting Initiative & KPMG's Global Sustainability Services 2007; Haque &
Deegan 2010).
The correlation matrices indicate that NGER (Table 6.12) and Non-NGER firms
(Table 6.13) have significantly positive correlations between CORP_GOV_SCORE and
the dependent variables V/DISC, V/DISC_Keywords, V/DISC_Words and
V/DISC_Sentences at the significance level of 0.01. The association though appears
stronger for NGER firms than Non-NGER firms. The correlations between these
variables are noted in prior research (Choi, Lee & Pasros 2013) and subsequently, are
expected.
In summary, assured carbon emission disclosures appears to have a positive
correlation with voluntarily disclosed carbon data for NGER firms only. No association
is evident for Non-NGER firms. In addition, Pre-Post NGER, firm size and corporate
governance have positive associations with voluntary carbon emission disclosures for
both NGER and Non-NGER firms. No association is evident between firms in the
energy and industrial industries and voluntary carbon emission disclosures.

203
6.6.2 Ordinary Least Squares Regression
One of the aims of this thesis is to investigate the determinants that are behind
firms’ motivation to voluntarily disclose carbon emissions; regression analysis is used
to capture the relationships between the predictor variables and the outcome variable.
In the content analysis stage of the research, keywords were used to guide the
focus of the analysis, with words as the unit of measurement and sentences providing
meanings to the words. The ordinary least squares regression estimates are calculated
for NGER (treatment), Non-NGER (control) and a combination of both the treatment
and control firms using the dependent variables V/DISC_Words and V/DISC_Sentences.
The two proxies measure the same dependent variable, voluntary carbon emission
disclosures. The Adjusted R2 for each of the NGER and Non-NGER regression
estimates are similar. Further, the dependent variables are not normally distributed. The
test of normality on the dependent variable V/DISC_Words indicates the dependent
variable is not normally distributed for both models: model 1 NGER firms (Shapiro-
Wilk z-statistic = 0.05; p-value = 0.00), and Non-NGER firms (Shapio-Wilk z-statistic =
0.42; p-value- 0.00) and model 2: combined firms (Shapiro-Wilk z-statistic = 0.40; p-
value = 0.00). Therefore, the natural log of V/DISC_Words and V/DISC_Sentences are
also regressed using the same predictor variables. The additional analysis adds to the
robustness for each of the ordinary least squares regressions. In addition, a logistic
regression analysis using the dependent variable V/DISC augments the analysis.
The ordinary least squares regression estimates are based on a total sample of
558 firm years for NGER firms (Model 1), 529 firm years for Non-NGER firms (Model
1) and 1,087 firm years for the combined (Model 2). In Table 6.16, the regression
estimates indicate that overall, model 1 for V/DISC_Words, explains 34 per cent
(NGER) and 17 per cent (Non-NGER) of the variance in the dependent variable. The

204
explanatory ability of model 2 is 34 per cent of the variance in the dependent variable.
These results are comparable with other studies into voluntary carbon emission
disclosures. Hollindale (2012) reported an Adjusted R2 of 0.22 for the 2007 sample and
0.35 for the 2009 sample.
Table 6.16 Ordinary Least Squares Regression – V/DISC_Words
Exp Sign
NGER
coefficient
t-statistic
(p-value)
Model 1
Non-NGER
coefficient
t-statistic
(p-value)
Model 1
Combined
coefficient
t-statistic
(p-value)
Model 2
Intercept ? -653.93
-5.49 (0.00)
-192.68
-7.42 (0.00)
-379.64
-7.39 (0.00)
NGER_NonNGER + 17.61
1.28 (0.20)
PrePost_NGER + 29.30
1.74 (0.08)
14.45
3.12 (0.00)
16.43
1.27 (0.20)
Ind_Energy + 8.45
0.27 0.79)
13.07
1.46 (0.14)
8.72
0.51 (0.61)
Ind_Materials + 94.94
4.40 (0.00)
60.9
1.06 (0.29)
50.31
4.58 (0.00)
Ind_Industrials + 83.19
3.29 (0.00)
-1.93
-0.28 (0.78)
38.41
2.86 (0.00)
CEASSUR + 470.69
13.14 (0.00)
80.29
2.61 (0.01)
459.15
18.03 (0.00)
FREE_CF_TOT_ASST + 18.91
0.61 (0.54)
.070
0.35 (0.73)
3.06
0.57 (0.57)
MKTBK_AVER_5YRS + -12.46
-2.16 (0.03)
-2.02
-3.03 (0.00)
-3.06
-1.80 (0.07)
SDROA_5YRS - 80.91
0.51 (0.61)
0.32
0.34 (0.73)
1.57
0.62 (0.54)
LOG_SIZE + 32.15
5.78 (0.00)
10.22
7.71 (0.00)
18.92
7.19 (0.00)
LEV + -0.25
-0.13 (0.90)
2.13
2.04 (0.04)
-0.78
-0.06 (0.95)
Gov_Dummy + 12.36
0.49 (0.63)
11.44
2.30 (0.02)
9.31
0.83 (0.41)
NGER_NonNGER*PrePost_NGER + 13.00
0.72 (0.47)
F-statistic (p-value) 26.60 (0.00) 10.89 (0.00) 44.23 (0.00)
Adjusted R2 0.34 0.17 0.34
Legend: NGER_NonNGER is a dummy variable that takes the value of 1 if the companies are
NGER registered otherwise zero. The PrePost_NGER variable is a dummy variable that gives a value of 1
for the years 2009, 2010 & 2011 otherwise zero. The industry variables, Industry_Energy,
Industry_Materials and Industry_Industrials are dummy variables that take the value of 1 if the firm
belongs to the respective industry otherwise zero. CEASSUR is a dummy variable if the firm’s carbon
emissions have been audited. FREE_CF_TOT_ASST is free cash flow scaled by total assets.
MKT/BK_AVER_5YRS is the market to book ratio averaged over the preceding 5 years. SD/ROA_5YRS is
the standard deviation for return on assets over the preceding 5 years. LOG_SIZE is the natural logarithm
of the firm’s market capitalisation. LEV is the total debt divided by total assets. Gov_Dummy is a dummy

205
variable based on an aggregate score for corporate governance. When the corporate governance score
equals 0.5 or above the variable takes a value of one otherwise zero.
The variable PrePost_NGER identifies whether NGER and Non-NGER firms
make significantly more voluntary carbon emissions disclosures in one period or the
other. The two periods identified are the pre (pre-NGER) and post (post-NGER)
implementation of the NGER Act 2007. Table 6.16 highlights that NGER firms (t-
statistic = 1.74; p-value = 0.08) made significantly more disclosures after the
implementation of the NGER Act 2007. This is at the statistically significant level of 0.1
with the expected positive sign. Likewise, Non-NGER firms (t-statistic = 3.12; p-value
0.00) also made more voluntary disclosures post-NGER period and this is statistically
significant at the 0.01 level. Thus, hypothesis 5a is supported.
The three variables Industry_Energy, Industry_Materials and
Industry_Industrials are industries associated with emission-intensive trade-exposed
activities. Viewing the three industries separately assists to identify the disclosure
practices of heavy emitters. NGER firms (t-statistic = 4.40; p-value = 0.00) in the
materials sector are disclosing significantly more carbon emissions information than
NGER firms not in the materials sector. This is significant at the 0.01 level with the
predicted positive sign. This is in contrast with Non-NGER firms in the materials sector
that do not make significantly different disclosures from other Non-NGER firms. The
combined group indicates firms in the materials sector are making significantly more
disclosures than firms not in this sector.
A similar pattern is noted for NGER firms (t-statistic = 3.29; p-value = 0.00) in
the industrial sector making significantly more disclosures than NGER firms in other
industries. However, Non-NGER firms in the industrial sector are not making
significantly different disclosures from other firms. Interestingly though, firms
associated with the energy sector do not make significantly different disclosures from

206
firms not in the energy sector. This pattern is consistent for NGER, Non-NGER and the
combined group. Hypothesis 3 is supported in part for NGER firms in the materials and
industrial industries.
The variable CEASSUR for NGER firms (t-statistic = 13.14; p-value = 0.00)
and Non-NGER firms (t-statistic = 2.61; p-value = 0.01) are statistically significant at
the 0.01 level with the predicted positive sign (Table 6.16). The results suggest that
when carbon emissions are assured, both NGER and Non-NGER firms are more likely
to voluntarily disclose carbon emissions. It appears that firms voluntarily disclosing
assured carbon emissions are signalling to stakeholders that management is in control
measuring, recording, monitoring and reporting carbon emissions. Thus, hypothesis 4 is
supported.
However, as the financial performance (Mktbk Ratio) of NGER and Non-NGER
firms improves the less likely these firms are to voluntarily disclose carbon emissions.
This pattern is evident for NGER firms (t-statistic = -2.16; p-value = 0.03) and Non-
NGER firms (t-statistic = -3.03; p-value = 0.00) at the 0.05 and 0.01 levels respectively,
with a negative sign. This finding is opposite to the predicted positive sign. It appears
that as firms’ legitimacy is not under threat, firms do not have an incentive to
significantly disclose voluntary carbon emissions information.
The current research is consistent with prior literature that identifies firm size as
a determinant of voluntary disclosures. The variable LOG_SIZE is statistically
significant across the three samples with the positive predictive sign at the statistically
significant level of 0.01.Larger firms have a higher visibility and therefore these firms
have incentive to voluntarily disclose carbon emissions. On the other hand, it appears
that for Non-NGER firms the level of debt (t-statistic = 2.04; p-value = 0.04) and the

207
strength of corporate governance (t-statistic = 2.30; p-value = 0.02) are likely to be the
drivers for Non-NGER firms rather than NGER firms.
However, the dependent variable V/DISC_Words is not normally distributed and
a log transformation created a new dependent variable, LnV/DISC_Words. The analysis
using the same predictor variables was run on the new dependent variable. The results
are presented in Table 6.17.
Table 6.17 Ordinary Least Squares Regression – LnV/DISC_Words
Exp Sign
NGER
coefficient
t-statistic
(p-value)
Model 1
Non-NGER
coefficient
t-statistic
(p-value)
Model 1
Combined
coefficient
t-statistic
(p-value)
Model 2
Intercept ? 1.16
1.33 (0.18)
2.10
1.81 (0.07)
1.91
2.79 (0.01)
NGER_NonNGER + 0.24
1.33 (0.18)
PrePost_NGER + -0.07
-0.57 (0.57)
0.07
0.39 (0.70)
0.09
0.48 (0.63)
Ind_Energy + 0.35
1.64 (0.10)
0.54
1.99 (0.05)
0.41
2.35 (0.02)
Ind_Materials + 0.63
3.95 (0.00)
0.37
1.64 (0.10)
0.54
4.07 (0.00)
Ind_Industrials + 0.39
2.32 (0.02)
-0.07
-0.28 (0.78)
0.23
1.67 (0.10)
CEASSUR + 1.35
6.85 (0.00)
0.32
0.64 (0.52)
1.35
7.54 (0.00)
FREE_CF_TOT_ASST + 0.59
1.56 (0.12)
0.06
0.24 (0.81)
0.18
0.79 (0.43)
MKTBK_AVER_5YRS + -0.12
-3.01 (0.00)
0.00
-0.01 (0.99)
-0.3
-1.55 (0.12)
SDROA_5YRS - -1.62
-0.78 (0.44)
-6.14
-2.62 (0.01)
-4.35
-2.80 (0.01)
LOG_SIZE + 0.16
3.87 (0.00)
0.08
1.55 (0.12)
0.10
3.21 (0.00)
LEV + -0.01
-0.44 (0.66)
0.04
1.64 (0.10)
-0.01
-0.34 (0.73)
Gov_Dummy + 0.04
0.17 (0.87)
0.35
1.36 (0.18)
0.15
0.95 (0.35)
NGER_NonNGER*PrePost_NGER + -0.13
-0.58 (0.56)
F-statistic (p-value) 9.75 (0.00) 2.59 (0.01) 10.30 (0.00)
Adjusted R2 0.24 0.13 0.22
Legend: CV = Coefficient; NGER_NonNGER is a dummy variable that takes the value of 1 if
the companies are NGER registered otherwise zero. The PrePost_NGER variable is a dummy variable
that gives a value of 1 for the years 2009, 2010 & 2011 otherwise zero. The industry variables,
Industry_Energy, Industry_Materials and Industry_Industrials are dummy variables that take the value of

208
1 if the firm belongs to the respective industry otherwise zero. CEASSUR is a dummy variable if the
firm’s carbon emissions have been audited. FREE_CF_TOT_ASST is free cash flow scaled by total assets.
MKT/BK_AVER_5YRS is the market to book ratio averaged over the preceding 5 years. SD/ROA_5YRS is
the standard deviation for return on assets over the preceding 5 years. LOG_SIZE is the natural logarithm
of the firm’s market capitalisation. LEV is the total debt divided by total assets. Gov_Dummy is a dummy
variable based on an aggregate score for corporate governance. When the corporate governance score
equals 0.5 or above the variable takes a value of one otherwise zero.
The log transformation results, presented in Table 6.17, are consistent with the
results reported in Table 6.16. The variables Ind_Materials, Ind_Industrials, CEASSUR
and LOG_SIZE remain positively significant in the NGER model 1 while the
MKTBK_AVER_5YRS is negatively associated with voluntarily disclosed carbon
emissions. One notable difference is the variable Ind_Energy that is now significantly
positive for both NGER (t-statistic = 1.64; p-value = 0.10) and Non-NGER (t-statistic =
1.99; p-value = 0.05) at the 0.10 and 0.05 significant levels, respectively. However, to
further test the robustness of the regression the proxy, V/DISC_Sentences, for the
dependent variable voluntary carbon emission disclosures was also analysed. The
results are presented in Table 6.18.

209
Table 6.18 Ordinary Least Squares Regression – V/DISC_Sentences
Exp Sign
NGER
coefficient
t-statistic
(p-value)
Model 1
Non-NGER
coefficient
t-statistic
(p-value)
Model 1
Combined
coefficient
t-statistic
(p-value)
Model 2
Intercept ? -24.36
-5.30 (0.00)
-7.82
-7.40 (0.00)
-14.47
-7.28 (0.00)
NGER_NonNGER + 0.77
1.44 (0.15)
PrePost_NGER + 1.02
1.57 (0.12)
0.60
3.15 (0.00)
0.68
1.36 (0.17)
Ind_Energy + 0.60
0.49 (0.62)
0.46
1.28 (0.20)
0.48
0.72 (0.47)
Ind_Materials + 3.52
4.22 (0.00)
0.27
1.15 (0.25)
1.88
4.42 (0.00)
Ind_Industrials + 3.51
3.59 (0.00)
-0.09
-0.34 (0.74)
1.64
3.16 (0.00)
CEASSUR + 18.37
13.28 (0.00)
2.71
2.16 (0.03)
17.85
18.10 (0.00)
FREE_CF_TOT_ASST + 0.69
0.58 (0.57)
0.03
0.36 (0.72)
0.11
0.53 (0.60)
MKTBK_AVER_5YRS + -0.46
-2.05 (0.04)
-0.08
-2.95 (0.00)
-0.11
-1.74 (0.08)
SDROA_5YRS - 2.74
0.45 (0.66)
0.01
0.37 (0.71)
0.06
0.58 (0.56)
LOG_SIZE + 1.20
5.59 (0.00)
0.42
7.70 (0.00)
0.72
7.05 (0.00)
LEV + -0.01
-0.13 (0.89)
0.07
1.73 (0.08)
-0.01
-0.10 (0.92)
Gov_Dummy + 0.45
0.46 (0.65)
0.40
1.97 (0.05)
0.35
0.80 (0.43)
NGER_NonNGER*PrePost_NGER + 0.35
0.50 (0.62)
F-statistic (p-value) 26.52 (0.00) 10.15 (0.00) 43.99 (0.00)
Adjusted R2 0.34 0.16 0.34
Legend: CV = Coefficient; NGER_NonNGER is a dummy variable that takes the value of 1 if
the companies are NGER registered otherwise zero. The PrePost_NGER variable is a dummy variable
that gives a value of 1 for the years 2009, 2010 & 2011 otherwise zero. The industry variables,
Industry_Energy, Industry_Materials and Industry_Industrials are dummy variables that take the value of
1 if the firm belongs to the respective industry otherwise zero. CEASSUR is a dummy variable if the
firm’s carbon emissions have been audited. FREE_CF_TOT_ASST is free cash flow scaled by total assets.
MKT/BK_AVER_5YRS is the market to book ratio averaged over the preceding 5 years. SD/ROA_5YRS is
the standard deviation for return on assets over the preceding 5 years. LOG_SIZE is the natural logarithm
of the firm’s market capitalisation. LEV is the total debt divided by total assets. Gov_Dummy is a dummy
variable based on an aggregate score for corporate governance. When the corporate governance score
equals 0.5 or above the variable takes a value of one otherwise zero.
It is noted that the results presented in Table 6.18 are consistent with the results
in Table 6.16 for V/DISC_Words. The four variables, Industry_Materials,
Industry_Industrials, CEASSUR and LOG_SIZE are significantly positive while the
MKTBK_AVER_5YR remains significantly negative. To maintain consistency in the

210
analysis a log transformation was carried out on the dependent variable
V/DISC_Sentences and the new variable computed. The results, presented in Table 6.19
are consistent with those reported in Table 6.18.
Table 6.19 Ordinary Least Squares Regression – LnV/DISC_Sentences
Exp Sign
NGER
coefficient
t-statistic
(p-value)
Model 1
Non-NGER
coefficient
t-statistic
(p-value)
Model 1
Combined
coefficient
t-statistic
(p-value)
Model 2
Intercept ? -1.78
-2.16 (0.03)
-2.27
-2.06 (0.04)
-1.48
-2.26 (0.3)
NGER_NonNGER + 0.30
1.74 (0.08)
PrePost_NGER + -0.06
-0.50 (0.62)
0.15
0.89 (0.38)
0.15
0.78 (0.44)
Ind_Energy + 0.43
2.11 (0.04)
0.36
1.41 (0.16)
0.42
2.57 (0.01)
Ind_Mat + 0.63
4.15 (0.00)
0.29
1.35 (0.18)
0.51
4.08 (0.00)
Ind_Indust + 0.44
2.70 (0.01)
-0.16
-0.71 (0.48)
0.25
1.89 (0.06)
CEASSUR + 1.32
7.02 (0.00)
0.16
0.35 (0.73)
1.31
7.64 (0.00)
FREE_CF_TOT_ASST + 0.60
1.65 (0.10)
0.05
0.23 (0.82)
0.19
0.86 (0.39)
MKTBK_AVER_5YRS + -0.11
-2.92 (0.00)
-0.01
-0.49 (0.63)
-0.04
-1.95 (0.05)
SDROA_5YRS - -1.75
-0.88 (0.38)
-4.86
-2.19 (0.03)
-3.79
-2.55 (0.01)
LOG_SIZE + 0.14
3.76 (0.00)
0.14
2.80 (0.01)
0.11
3.62 (0.00)
LEV + -0.2
-0.98 (0.33)
0.04
1.53 (0.13)
-0.01
-0.81 (0.42)
Gov_Dummy + -0.03
-0.14 (0.89)
0.20
0.83 (0.41)
0.09
0.60 (0.55)
NGER_NonNGER*PrePost_NGER + -0.18
-0.81 (0.42)
F-statistic (p-value) 10.37 (0.00) 2.73 (0.00) 11.06 (0.00)
Adjusted R2 0.25 0.14 0.24
Legend: CV = Coefficient; NGER_NonNGER is a dummy variable that takes the value of 1 if
the companies are NGER registered otherwise zero. The PrePost_NGER variable is a dummy variable
that gives a value of 1 for the years 2009, 2010 & 2011 otherwise zero. The industry variables,
Industry_Energy, Industry_Materials and Industry_Industrials are dummy variables that take the value of
1 if the firm belongs to the respective industry otherwise zero. CEASSUR is a dummy variable if the
firm’s carbon emissions have been audited. FREE_CF_TOT_ASST is free cash flow scaled by total assets.
MKT/BK_AVER_5YRS is the market to book ratio averaged over the preceding 5 years. SD/ROA_5YRS is
the standard deviation for return on assets over the preceding 5 years. LOG_SIZE is the natural logarithm
of the firm’s market capitalisation. LEV is the total debt divided by total assets. Gov_Dummy is a dummy
variable based on an aggregate score for corporate governance. When the corporate governance score
equals 0.5 or above the variable takes a value of one otherwise zero.

211
6.6.3 Logistic Regression
A binary logistic regression analysis is conducted to further examine the
determinants of voluntary disclosures. The proxy used for the dependent variable,
voluntary carbon emission disclosures, is the binary dummy variable V/DISC. Since the
dependent variable is a categorical variable, logistic regression analysis is a suitable
method to investigate the determinants to voluntary disclosure. The regression model 3
investigates 558 NGER firm years (treatment) and 529 Non-NGER firm years (control).
Model 4 investigates 1,087 firm years for the combined sample (Table 6.20).
To test the reliability of model fit with the regression data, the Hosmer and
Lemeshow test is used. Observations are grouped into comparable sets and the statistic
is generated based on these groupings. This statistic determines the goodness-of-fit for
model 3 and 4 and whether these models explain the data adequately. When the Hosmer
and Lemeshow test significance value is less than 0.05, the test shows the model is a
poor fit with the data. The Hosmer and Lemeshow test results in the regression analyses
for model 3, NGER data (X2 statistic with 8 degrees of freedom = 21.36 with a p-value
of 0.01) and NonNGER data (X2 statistic with 8 degrees of freedom = 16.66 with a p-
value of 0.03) suggest the model is not adequately fitting the data. The test statistic for
model 4 showing the combined data (X2 statistic with 8 degrees of freedom = 17.17 with
a p-value of 0.03) gives a similar result. Nevertheless, the combination of ordinary least
squares regressions and logistic regressions collectively provide robustness behind the
consistent results using three different proxies.
The coefficient of determination R2 statistic used in linear regression
summarizes the proportion of variance in the dependent variable associated with the
predictor variables. The statistic shows larger R2 values explain more of the variation in
the model. A fully explained model has a value of one. In contrast with linear

212
regression, logistic regression models that have a categorical dependent variable are
unable to generate a single coefficient of determination R2 statistic. Therefore, three
Pseudo R2statistics are approximated for the logistic regression models and these are
Cox and Snell’s R2, Nagelkerke’s R
2 and the McFadden -2Log Likelihood. However, a
limitation of the Cox and Snell’s R2 is that the maximum value is less than one. The
Nagelkerke’s R2 though, is an adjusted version of the Cox & Snell that allows the full
range of values zero to one. The best model is represented by the largest R2 statistic
when models based on the same data are compared. The McFadden’s R2 -2 Log
Likelihood provides an additional Pseudo R2.
Therefore the approximations for the coefficient of determination R2 statistic
used in the logistic regression analysis are: the -2 Log likelihood statistics, 667.72
(NGER), 418.56 (Non-NGER) and 1119.11 (Combined); the Cox & Snell R Square’s
approximation of the variance in the dependent variable associated with the independent
variable 16% (NGER), 26% (NonNGER) and 27% (Combined); and the Nagelkerke R2
statistic that provides the better interpretation of the variance in the dependent variable,
V/DISC that is associated with the independent variables. The percentage variance in the
dependent variable V/DISC is explained by 22%, 39% and 37% by the independent
variables for the NGER, Non-NGER and combined groups respectively.
The logistic regression analysis, presented in Table 6.20, also generates figures
for the intercept and full models that show how well the models are predicting the data
before and after the analysis has been done. The intercept model produces a naïve
prediction which is reported in a Classification Table. A Classification Table is also
produced based on the full model after the analysis has been done. The classification
percentage indicating how well the full models are predicting the data is 66% (NGER),
81% (Non-NGER) and 72% (Combined) of the cases.

213
Table 6.20 Logistic Regression Analysis on the Determinants of Voluntary Carbon Emission
Disclosures - NGER & NonNGER (Model 3) and combined group (Model 4)
Model 3
NGER
Sample
(N = 558)
Model 3
Non-NGER
Sample
(N = 529)
Model 4
Combined
Sample
(N = 1,087)
Exp
Sign
Coefficient
Wald Statistic
(p-value)
Coefficient
Wald Statistic
(p-value)
Coefficient
Wald Statistic
(p-value)
Intercept ? -5.82
16.80 (0.00)
-13.31
52.64 (0.00)
-8.70
75.18 (0.00)
NGER_NonNGER + 0.71
8.89 (0.00)
PrePost_NGER + 0.90
21.96 (0.00)
1.34
27.32 (0.00)
1.19
25.40 (0.00)
Industry_Energy + 0.65
3.28 (0.07)
0.12
0.07 (0.79)
0.53
3.61 (0.06)
Industry_Materials + 0.56
5.20 (0.02)
-0.19
0.31 (0.58)
0.37
3.78 (0.05)
Industry_Industrials + 1.06
13.48 (0.00)
0.07
0.04 (0.84)
0.68
10.23 (0.00)
CEASSUR + 2.94
8.14 (0.00)
21.46
0.00 (1.00)
3.38
10.75 (0.00)
FREE_CF_TOT_ASST + 0.00
0.00 (1.00)
-0.16
0.36 (0.55)
-0.08
0.16 (0.69)
MKTBK_AVER_5YRS + 0.06
0.74 (0.39)
-0.08
4.09 (0.04)
-0.03
0.79 (0.37)
SDROA_5YRS - -2.62
1.00 (0.32)
-5.44
5.17 (0.02)
-4.48
8.57 (0.00)
LOG_SIZE + 0.20
9.33 (0.00)
0.58
42.73 (0.00)
0.33
44.94 (0.00)
LEV + 0.00
0.04 (0.84)
0.00
0.00 (1.00)
0.01
0.08 (0.77)
Gov_Dummy + 0.87
9.27 (0.00)
0.39
1.90 (0.17)
0.68
11.75 (0.00)
NGER_NonNGER*PrePost_NGER + -0.25
0.65 (0.42)
Hosmer and Lemeshow test: X2 statistics (8 df)
(p-value)
21.36
(0.01)
16.66
(0.03)
17.17
(0.03)
Correct classification percentage by model 65.6 80.9 71.8
-2 log likelihood of model 667.72 418.56 1119.11
Cox & Snell R Square 0.16 0.26 0.27
Nagelkerke (1991) 0.22 0.39 0.37
Legend: CV = Coefficient; NGER_NonNGER is a dummy variable that takes the value of 1 if
the companies are NGER registered otherwise zero. The PrePost_NGER variable is a dummy variable
that gives a value of 1 for the years 2009, 2010 & 2011 otherwise zero. The industry variables,
Industry_Energy, Industry_Materials and Industry_Industrials are dummy variables that take the value of
1 if the firm belongs to the respective industry otherwise zero. CEASSUR is a dummy variable if the
firm’s carbon emissions have been audited. FREE_CF_TOT_ASST is free cash flow scaled by total assets.
MKT/BK_AVER_5YRS is the market to book ratio averaged over the preceding 5 years. SD/ROA_5YRS is
the standard deviation for return on assets over the preceding 5 years. LOG_SIZE is the natural logarithm
of the firm’s market capitalisation. LEV is the total debt divided by total assets. Gov_Dummy is a dummy
variable based on an aggregate score for corporate governance. When the corporate governance score
equals 0.5 or above the variable takes a value of one otherwise zero.

214
The variable NGER_NonNGER (Wald-statistic = 8.89; p-value = 0.00) is
significant at the 0.01 level in model 4, Table 6.20. This variable is used in model 4 to
compare disclosures differences between NGER and Non-NGER firms. NGER firms
are significantly more likely to voluntary disclose carbon emissions.
The variable PrePost_NGER is statistically significant at the 0.01 level with a
positive sign across the three groups. NGER (Wald-statistic = 21.96; p-value = 0.00)
and Non-NGER firms (Wald-statistic = 27.32; p-value = 0.00) are voluntarily disclosing
more carbon emission information after the implementation of the NGER Act 2007 than
before the introduction of the legislation. The results are consistent with the ordinary
least squares regressions. Thus hypothesis 5a is supported.
The analysis for NGER firms’ three variables Industry_Energy,
Industry_Materials and Industry_Industrials are all positively significant at the 0.10,
0.05 and 0.01 significant levels respectively. This is in contrast with insignificant results
for Non-NGER firms. This pattern is consistent with the ordinary least squares results in
Table 6.19. The energy sector is Australia’s highest carbon emitter and essential service
provider (Australian Government 2009). Many firms in the materials sector are
associated with mining activities which are recognised as emission-intensive activities.
The industrial sector comprises of three subsectors: capital goods, commercial &
professional services and transportation. Non-NGER firms in these industries are not
exposed to public scrutiny to the same extent as NGER firms. Non-NGER firms’ results
are comparable with lower level of disclosures made by NGER firms prior to the NGER
Act 2007. Hypothesis 3 is supported for NGER firms in the industrial sector.
The independent variable CEASSUR, in Table 6.20, is insignificant for Non-
NGER firms. However, CEASSUR has a significantly positive effect on NGER firms’
likelihood to voluntarily disclose carbon emission data (Wald-statistic = 8.14, p-value =
215
0.00) which is statistically significant at the 0.01 level and has the predictive positive
sign. The results suggest that when carbon emissions are assured, NGER firms are more
likely to voluntary disclose carbon emissions than NGER firms that do not have their
carbon emissions assured. It appears that when NGER firms do have carbon emission
data assured they are signalling to stakeholders that they are measuring, recording,
monitoring and reporting carbon emissions. Hypothesis 4 is supported for NGER firms
only.
The size of the firm does have a significantly positive effect for NGER (Wald-
statistic = 9.33; p-value = 0.00), Non-NGER (Wald-statistic = 42.73; p-value = 0.00)
and the combined group (Wald Statistic = 44.94; p-value = 0.00) to voluntarily disclose
carbon emissions. This result is consistent with prior literature that identifies firm size
as a determinant of voluntary disclosures (Deegan & Gordon 1996; Hackston & Milne
1996; Hollindale 2012; Hollindale, Kent & Routledge 2010; Hossain, Perera & Rahman
1995; Murray et al. 2006; Patten 1992; Patten 2002; Rankin, Windsor & Wahyuni
2011). Large firms have a higher visible presence and therefore these firms have
incentive to voluntary disclose carbon emissions.
The control variable Gov_Dummy is given the value of one if the aggregate
corporate governance score is greater than 0.5. The corporate governance score reflects
the independence of the Board, chairman/CEO duality, the presence of an
environmental committee, the independence of the environment committee members
and whether the CEO is a member of the environmental committee. Each of these
factors are seen to strengthen corporate governance surrounding carbon emissions and
highlights the importance the firm places on disclosing carbon emissions information to
stakeholders. The Gov_Dummy variable in Table 6.20 for corporate governance is
significant for NGER firms (Wald-statistic = 9.27; p-value = 0.00) at the 0.01

216
significance level with a positive coefficient. Therefore corporate governance is a
predictor of voluntary carbon emission disclosures for NGER firms. This is in contrast
with insignificant results for Non-NGER firms.
The two variables measuring financial performance (MKTBK_AR_5YRS) and
economic risks (SDROA_5YRS) are not significant for NGER firms however for Non-
NGER firms these two variables are significant with a negative coefficient (Table 6.20).
This indicates as Non-NGER firms’ financial performance improves or economic risks
increase, Non-NGER firms are less likely to voluntarily disclose carbon emissions. This
is in comparison with other Non-NGER firms facing increased economic risks.
NGER and Non-NGER firms appear to have increased voluntary carbon
emission disclosures after the implementation of the NGER Act, 2007. Further, the
analysis is consistent with prior research indicating the size of the firm is a predictor of
voluntary carbon emission disclosures.
Firms engaged in emission-intensive activities include the energy, materials and
industrial sectors. The energy, material and industrial sectors make significantly
different disclosures from firms not in these respective industries. However, in contrast
Non-NGER firms’ results are insignificant. This reflects the lack of willingness by Non-
NGER heavy emitters that are not exposed to public scrutiny to the same extent as
NGER firms to disclose carbon emissions data.
6.7 Chapter Summary
This thesis is a longitudinal study that investigates the implications of the NGER
Act on Australian firms’ propensity to voluntarily disclose carbon emissions data over
the period 2005 to 2011. The year 2005 is three years prior to the year in which NGER
Act became effective and the year 2011 is three years after the implementation of the

217
NGER Act. This thesis uses both parametric and non-parametric tests on NGER and
Non-NGER firms’ data contained in annual and sustainability reports.
This thesis explored the data using descriptive statistics, frequencies, Friedman
tests and Independent Samples t-tests. The findings indicate voluntary carbon emission
disclosures increased in the annual reports for both NGER and Non-NGER firms and in
the sustainability reports for NGER firms during the sample period. Further, significant
differences exist between NGER and Non-NGER firms voluntary disclosures made in
annual reports. However, the only significant differences occurring between NGER and
Non-NGER firms’ voluntary carbon emission disclosures, in sustainability reports
appeared during the two years 2008 and 2009. The year 2008 was the implementation
year of the NGER Act while 2009 was the first reporting year. This period also
paralleled severe drought conditions that Australia was experiencing at the time.
NGER firms voluntarily provided minimal carbon emission information during
2005 and 2006 though this significantly increased from 2008 onwards. Disclosures
increased for both NGER and Non-NGER firms over the research period however
NGER firms increased the quantity of disclosures at a higher rate than Non-NGER
firms, post 2006. Significant disclosure differences occurred between NGER and Non-
NGER firms and between NGER’s pre- and post- periods and between Non-NGER’s
pre- and post- periods.
The Wilcoxon Signed-Rank Test was used to investigate the differences in use
between the annual and sustainability reports. NGER firms voluntarily disclosed carbon
emissions in sustainability reports more than in annual reports for the years 2005 to
2011. However, the results for the Non-NGER firms are not as clearly defined. The
results for Non-NGER firms indicate significant differences between the annual and
sustainability reports from 2006 onwards with the exception of 2009. However, only a
218
small number of Non-NGER firms produced sustainability reports and this limited
meaningful results. Meanwhile, the Mann-Whitney z-tests recorded the changing use of
different methods (keywords, words, sentences, graphs, tables and figures) to convey
carbon emission information in the reports over the research period.
Correlation matrices identified relationships between the explanatory and
dependent variables for NGER and Non-NGER firms. The assurance of carbon
emissions data, firm size, and corporate governance are associated with the dependent
variable.
Ordinary least square regressions using V/DISC_Words and V/DISC_Sentences
as the dependent variables suggest that NGER firms associated with the materials and
industrial sectors voluntarily disclose more carbon emissions information than NGER
firms not in these sectors. In contrast, NGER firms make significantly more disclosures
than Non-NGER firms. Firm size is a predictor variable for voluntary carbon emission
disclosures across the three samples. Firm’s financial performance (Mktbk ratio) is
negatively associated with voluntary carbon emission disclosure. Further, the results
using the natural log for V/DISC_Words and V/DISC_Sentences show similar results
though firms in the energy industry now appear to be significantly positive.
Logistic regression analysis extends the thesis by exploring the determinants
behind NGER and Non-NGER firms’ voluntary carbon emission disclosure practices.
NGER firms’ industry association is a determinant of voluntary carbon emission
disclosures. However, industry association depends on the particular sector and the
sector’s propensity to disclose. Nevertheless, the assurance of carbon emissions data is a
predictor for NGER firms’ voluntary disclosures. Further, firm size and the strength of
corporate governance are also determinants for NGER firms while firm size is the main
predictor variable for Non-NGER firms to voluntarily disclose carbon emissions.

219
Empirical findings in this thesis are consistent with the predictions of legitimacy
theory, institutional theory and signalling theory. The complex nature of carbon
emissions disclosure suggests that all these theories could be applied in explaining
carbon emissions disclosures of NGER and Non-NGER firms. Specifically, the research
findings explain how legitimacy surrounding carbon emissions has changed over time,
2005 to 2011 in Australia. The research findings also explain the process through which
institutional theory predicts specific organisational practice (carbon emissions
disclosure in this case) spreads across firms and industries. However, signalling theory
had somewhat limited support from the findings of this study. It could be due to the
negative perceptions of carbon emissions and signalling theory’s focus on positive
news.

220
7 Conclusion
This thesis provides the international and national context influencing the
introduction of the NGER Act 2007 and contributes to the voluntary carbon emissions
disclosure literature, by providing a longitudinal perspective highlighting the continuous
challenge encouraging firms to further increase carbon emissions disclosures. The next
section reiterates the purpose, aim and the thesis methodology. Section 7.2 outlines the
results and Section 7.3 provides the practical and theoretical implications of the thesis.
The contribution is presented in Section 7.4 with Section 7.5 outlining the limitations of
the thesis and direction for future research. The summary remarks and the concluding
paragraph are provided in Section 7.6.
7.1 The purpose, aim and outline of the thesis
Prior research noted an increasing trend for firms to voluntarily disclose carbon
emissions (Adams & Frost 2007; Haque & Deegan 2010; Simnett & Nugent 2007). This
was attributed to firms’ responding to changing societal expectations (Adams & Frost
2007; Deegan 202a) despite the consideration that Australian firms’ voluntary
disclosures were low (Haque & Deegan 2010; Simnett & Nugent 2007) and lagged
behind UK firms (Adams & Frost 2007). Certainly, the usefulness of voluntary carbon
emission disclosures were questioned (Simnett & Nugent 2007) when voluntary
disclosures focussed on positive news (Deegan & Rankin 1996). Nevertheless, the
operating environment of Australian firms changed with the introduction of the NGER
Act 2007 with the requirement to report to one stakeholder, the government. However,
research into voluntary carbon emission disclosures in Australia within the last few
years predominately focussed on a snap-shot view of the data as a basis for
observations (Choi, Lee & Pasros 2013; de Lange & Sidaway 2011; Hollindale 2012;

221
Hollindale, Kent & Routledge 2010; Perera & Jubb 2011; Rankin, Windsor & Wahyuni
2011; Simnett & Nugent 2007). Subsequently, the purpose of this longitudinal study is
to firstly, understand the changes and level of voluntary carbon emission disclosures
and secondly, the determinants of such disclosures by investigating a period of time that
is indicative of significant changes in attitudes towards climate change. The context of
the study is significant given the implications of the NGER Act in a carbon based
economy such as Australia. The first research question: ‘What are the changes overtime
in emissions-related voluntary disclosures by Australian firms between pre- and post-
NGER Act periods?’ guides the initial part of the research. The findings support
evidence that voluntary carbon emission disclosures did increase in the annual reports
for both NGER and Non-NGER firms while disclosures increased in sustainability
reports for NGER firms. NGER firms’ propensity to disclose increased at a greater rate
than Non-NGER firms. These increasing trend to voluntary disclose carbon emissions
is consistent with the findings by Adams & Frost (2007) and Haque & Deegan (2010).
The analysis is extended with an investigation into the determinants that
contribute to changes in voluntarily disclosed carbon emissions. Prior research identifies
the firm size and industry membership as contributing factors to voluntary carbon
emission disclosures (Choi, Lee & Pasros 2013; Hollindale 2012; Rankin, Windsor &n
Wahyuni 2011). Specifically, the Australian government outlines emission-intensive
activities which encompass a number of sectors including materials, industrials and
energy sectors. In addition, the assurance of carbon emissions data is not mandated
(Clean Energy Regulator 2014b) however the option to obtain voluntary assurance is
available. Therefore the investigation into the determinants behind disclosures is
warranted and the second research question: ‘What are the determinants of voluntary
disclosures regarding carbon emissions by Australian firms?’ guides the second part of

222
the research. The findings indicate the assurance of carbon emissions data, firm size,
and corporate governance are predictors for NGER firms’ voluntary carbon emission
disclosures. Industry membership is also a determinant of voluntary carbon emission
disclosures however a firm’s industry association depends on the sector’s willingness to
disclose. Firm size is the predictor variable for Non-NGER firms. These findings are
consistent with prior research (Choi, Le & Pasros 2013, Deegan & Gordon 1996;
Hollindale 2012; Hollindale, Kent & Routledge 2010; Hossain, Perera & Rahman 1995;
Patten 2002 Rankin, Windsor&Wahyuni 2011). This thesis is also framed by three
theoretical concepts with the purpose of interpreting content and information over and
above the use of a single theory and a cross-sectional analysis.
The sample comprises of 85 NGER registered firms representing the treatment
group and 85 Non-NGER firms as the control group. The two groups are pair-matched
by size and industry where possible in spite of the NGER firms in general being larger
firms. Both the annual and sustainability reports are investigated. The research period is
significant as the period commences in 2005, prior to any knowledge about the future
National Greenhouse and Energy Reporting Act 2007 and extends past the
implementation phase to include the first three reporting years under the Act to 2011.
The theoretical framework is drawn from three theories: legitimacy, signalling and
institutional. Each theory provides insights that are not captured by the other two
theories and overcomes the limitation of using a single theory to provide a
comprehensive understanding behind the motivation to voluntarily disclose carbon
emissions.
7.2 A summary of the findings
The findings indicate that NGER and Non-NGER firms did increase voluntary
carbon emission disclosures over the research period 2005 to 2011. Specifically, it is

223
found that during the pre-NGER period, 2005 and 2006 NGER firms tend to voluntary
disclose carbon emissions less than Non-NGER firms however this changed from 2008
onwards when NGER firms’ propensity to disclose increased at a greater rate than Non-
NGER firms during the post-NGER period. There were significant differences between
the quantity of voluntary disclosures between NGER and Non-NGER firms in the pre-
NGER period and post-NGER period. NGER firms’ level of disclosure in 2005 and
2006 is consistent with Clarkson et al.’s (2008) observation that poorer environmental
performing firms tend to remain silent. Since NGER firms are heavy carbon emitters
that met the reporting threshold to government, they faced the government’s intention to
publicly disclose NGER firms’ carbon emissions on the Department of Climate
Change’s website. A source to verify carbon emission disclosures subsequently became
available to stakeholders. Firms reacted by signalling and legitimatised their presence
by increasing voluntary carbon emission disclosures in the annual reports and
sustainability reports.
Further, the findings suggest that, where available, sustainability reports are used
more than annual reports to voluntarily convey carbon emissions information. This is
consistent with prior research (Deegan & Haque 2009; Haque & Deegan 2010). Even
though the use of sustainability reports is growing, not all firms produce a sustainability
report or produce this report on an annual basis. When the information in sustainability
reports refers to the previous two years or earlier, the disclosures are at best archival in
nature. As a result it is questionable to rely on historical information via sustainability
reports to make timely decisions.
In addition, the findings suggest the firm size, assured carbon emissions,
corporate governance and industry association are predictors of voluntarily disclosed

224
carbon emissions in the annual reports and sustainability reports for NGER firms. Firm
size is the main predictor for Non-NGER firms.
Assured carbon emission data increases the credibility of voluntarily disclosed
information and this provides an incentive for NGER firms to voluntary disclose carbon
emissions information. Though assured carbon emissions data did not appear to be an
incentive for Non-NGER firms. Further, the strength of corporate governance is a
predictor for NGER firms to voluntarily disclose carbon emissions. Industry association
also appears to be a predictor for NGER firms. The materials, energy and industrial
sectors are involved in emission-intensive activities, therefore as the NGER firms
within these industries are increasingly exposed to public scrutiny, industry association
is a predictor variable. Notably, though industry association is not a predictor for Non-
NGER firms suggesting increased public exposure may contribute to this difference.
The firm’s financial performance and the risks NGER firms face do not appear
to be predictors of voluntary carbon emission disclosures. When a firm’s economic
performance is high, the firm is overvalued and its legitimacy is not under threat. This is
consistent with Wallace and Naser’s (1995) findings that suggest there is no relationship
between voluntary disclosures and profitability though contrary to Bini et al.’s (2011)
results. However, there is a significantly negative relationship between disclosures and
financial performance and disclosures and risks Non-NGER firms face. When
performance increases or risks rise, Non-NGER firms are less likely to voluntary
disclose carbon emissions.
7.3 Theoretical and Practical Implications of the findings
Theoretical implications of this thesis suggest that the use of a single theory
limits the interpretative framework within which to develop an understanding of the
phenomena under investigation. The combination of socio-political, economics-based

225
and institutional theories overcomes the limitations of using a single theory and
provides the scope within which to increase the understanding of why ASX firms
voluntarily disclose carbon emissions. NGER firms’ legitimacy is potentially under
threat with legislation introducing reporting requirements to government once
greenhouse gas thresholds are met; hence actions are coerced and voluntary disclosures
signalled to stakeholders to legitimise the firm’s presence and indicate management is
under control.
A number of practical implications are highlighted in this thesis. Challenges
remain encouraging firms to further increase voluntary carbon emissions disclosures.
The assurance of carbon emissions is a predictor for NGER firms to voluntary
disclosure carbon emissions. In addition and consistent with prior research, firm size
has an influence on voluntary carbon emission disclosures. Firms assure carbon
emission disclosures once they reach a specific size. This will provide a stimulus for
large firms to voluntarily disclose their carbon emissions. Further, mandating carbon
emission disclosures in the annual reports for heavy emitting firms will ensure that all
stakeholders will have a basis from which to make informed financial decisions that
includes scarce atmospheric resources. As a result, the thesis has practical implications
for public policy formation and for the structuring of the regulatory framework. The
markets cannot make informed decisions without consistent and reliable information.
Even though the public awareness about the impact of carbon emissions on
global warming is increasing, the level of disclosures appears to remain low for some
firms. Indeed, governments, regulators and accounting standard setters have noted the
minimal availability of useful environmental disclosures in annual and sustainability
reports (Clarkson et al. 2008). Certainly, heavy emitting firms have incentive to avoid a
potential legitimacy threat by not voluntarily disclosing carbon emissions more than

226
other firms. However, risk aversion raises questions about the firm and information
asymmetry places investors at a disadvantage and exposes the company to mis-
valuation. Further, when the economic performance of firms are high and a legitimacy
threat is not imminent, firms do not have an incentive to voluntary disclose carbon
emissions more than other firms.
The practical implications of this thesis provide evidence of changes in
voluntary disclosures from 2005 to 2011 and the determinants that drove those
disclosures. Nevertheless the thesis also highlights the challenges faced by regulators
and policy makers to encourage firms to voluntary disclose important and useful carbon
emissions data short of implementing an international accounting standard to mandate
disclosures. The context of this research focusses on a carbon-based economy, Australia
and as a result the practical implications of the research can be generalized to
encompass similar carbon-based economies such as Canada.
7.4 Contributions of the Study
This thesis makes a significant contribution to the voluntary carbon emission
disclosure literature through the use of a longitudinal study that incorporates both
content and empirical analyses and a multi-theoretical framework. No previous studies
have incorporated an investigation over a seven year period surrounding the
introduction of the National Greenhouse and Energy Reporting Act 2007. The thesis
highlights uncoordinated approaches to voluntary carbon emission disclosures with
variation between nil and extensive reporting as highlighted by Ratnatunga and Jones
(2012) and Burritt, Schaltegger and Zvezadov (2011). Even though voluntary carbon
emission disclosures have increased over the research period, reporting consistency
remains absent. As a result, this thesis extends the climate change accounting literature.

227
This thesis extends both the Australian literature and the international literature
on voluntary carbon emission reporting. Within the Australian context, the thesis
extends the findings of Hollindale (2012) who investigates greenhouse gas emission
disclosures by ASX companies over the years 2007 to 2009. This thesis also extends
the work of Rankin, Windsor and Wahyuni (2011) who investigate the motivations of
greenhouse gas reporting only around 2007. This study also extends research by Haque
and Deegan (2010) who investigated the motivations of voluntary carbon emission
disclosures of five major Australian companies before the NGER Act. With its
longitudinal analysis of 85 NGER firms and 85 Non-NGER firms over the period 2005
to 2011, this thesis documents the change over time in the voluntary carbon emission
disclosures in Australia surrounding the NGER Act.
This thesis also contributes to the international literature on voluntary carbon
emissions disclosure. Unlike prior studies which investigated voluntary carbon emission
disclosure of specific industries (e.g. Clarkson, Yue, Richardson and Vasvari, 2008) and
other studies (e.g. Stanny, 2010) which investigated voluntary greenhouse gas emission
disclosures in general, this thesis undertook both content analysis and empirical analysis
and identified some drivers of voluntary carbon emission disclosures. More importantly,
unlike most studies in Australia and overseas, this thesis adopted a matched-pair design.
7.5 Limitations and Potential Future Research direction
The limitations of this thesis include investigating archival data available from
annual reports and sustainability reports. Even though firms’ voluntary carbon emission
disclosures are not confined to these reports, investigating other avenues of disclosures
are beyond the scope of this study. This thesis does not include real-time data associated
with websites. Websites have the potential to offer timeliness, scope, interactivity and
information supplied on a rolling basis for investors. Websites also offer additional
228
insights and presentations may be more easily portrayed in a digital format however,
verification of the content, the initial publication date, tracking consequential data
changes and the ability to continually have access to the sources are beyond the scope of
this research. Further, this thesis does not include ASX announcements and
commitments to voluntary reporting initiatives like the CDP or other discretionary paths
of communication. Firms may have a preference to disclose carbon emission data via
these other avenues.
Other theories may also provide additional insights into voluntary carbon
emission disclosures and therefore the current theoretical framework cannot be
considered as providing an exclusive explanation of voluntary carbon emission
disclosures. Further, the content analysis includes a degree of subjective assessment due
to only one researcher analysing the data. Nevertheless decision rules are designed to
reduce the degree of subjectivity inherent with the use of one researcher. In addition,
this thesis is limited to the first three years post-NGER Act and extending the thesis past
this point is not feasible in the current study due to time constraints. Furthermore, this
thesis is confined within the Australian context limiting the generalizability of the
findings to international jurisdictions.
The sample size consists of 170 ASX listed firms, 85 firms are NGER registered
and 85 Non-NGER firms are utilized in a matched-pair design. However, the inability to
fully utilize the matched-pair design is a limitation of the study. For example, the four
largest banks are NGER registered and by default the largest Non-NGER banks are
selected even though they are not a matched-pair with the NGER registered banks.
A further limitation of the thesis includes the inability to provide an equivalent
number of firms in the industry groups Utilities and Food & Staples Retailing. Even
though 17 industry sectors are included in the thesis, the majority of firms investigated

229
belong to three main sectors Materials, Energy and Industrials which limits the broad
generalisability of the findings.
Finally, NGER firms have the option to request the withdrawal of carbon
emissions data submitted under the NGER Act 2007 from publication. Therefore the
sample is a sub-set of NGER ASX listed firms who agree to make their emissions data
publicly available. There is a possibility that firms captured in the Non-NGER group
include firms that are actually registered under NGER Act though choose to restrict
public disclosure of their emissions data. Unless these firms acknowledge their
commitments under the NGER Act 2007 in some form these firms cannot be identified.
This is a limitation of the thesis.
Scope remains available for future research. Overcoming the existing constraints
imposed by website data is an area for future research, especially in a carbon-constraint
future and the move away from paper-based products. This research focusses on one
aspect of the institutional environment; the implications of one piece of Australian
legislation on voluntary carbon emission disclosures whereas within the macro
institutional setting a number of pressures working in unison most likely provide the
external pressures on firms to voluntarily disclose carbon emissions.
Further, this research does not incorporate pressures arising from a firm’s
relevant stakeholders. Even though the concept of establishing a firm’s legitimacy with
a broad range of stakeholders is considered, specifically researching identified
stakeholders that have influence over the firm is not the focus of this thesis. Therefore
incorporating a research model using stakeholder theory may be better able to address
this micro analysis. A resource-based analysis may also provide additional insight.

230
7.6 Chapter Summary
The presence of the NGER Act 2007 does appear to indirectly enhance the
pressure on firms to increase voluntarily disclosed carbon emissions. Even though
voluntary carbon emission disclosures have increased over the research period 2005
through to 2011, voluntary carbon emission disclosures are not forthcoming from all
firms. Indirect pressure via legislation to provoke disclosures and potential public
scrutiny clearly though are not sufficient to motivate all heavy emitters to disclose their
associated level of carbon emission information to stakeholders; thereby limiting
stakeholders’ ability to gauge the firm’s capabilities. This raises concerns about firms’
abilities to manage carbon emissions and demonstrate sustainable business processes
(Adams & Frost 2007). Relying on public scrutiny and pressure to encourage firms to
reduce carbon emissions will fall short if information is not credible or readily
accessible in the first place. Mandating assured carbon emission disclosures in the
annual reports for all firms associated with the materials, energy and industrial
industries will move a long way forward in addressing this information discrepancy.
Carbon emissions are making significant contributions to climate change and
with a disparity of information limits stakeholders, investors, institutional investors,
policy makers, regulators and standard setters to take appropriate action to stabilize
global warming. It does not matter how much pragmatic, moral, cognitive legitimacy
is conferred (Suchman 1995), stakeholders appeased and compromises made (Freedman
1984), resources secured (Pfeffer & Salancik 1978) and structures are conformed to
(DiMaggio & Powell 1983), unless the conditions imposed by the natural environment
to maintain or preserve atmospheric conditions are achieved, by reducing carbon
emissions, long-term consequences will be incurred by society as a whole. Reducing

231
carbon emissions is vital as the option of a financial bailout is not feasible, unlike the
Global Financial Crisis (Organisation for Economic Development 2013).

i
References
Adams, CA & Frost, G 2007, 'Managing Social and Environmental Performance: Do
Companies have Adequate Information?', Australian Accounting Review, vol. 17, no. 3,
pp. 2-11.
Adams, R & Ferreira, D 2007, 'A theory of friendly boards', Journal of Finance, vol. 62,
no. 1, pp. 217-50.
Akerlof, GA 1970, 'The Market for "Lemons": Quality Uncertainty and the Market
Mechanism', The Quarterly Journal of Economics, vol. 84, no. 3, pp. 488-500.
Alciatore, ML & Dee, CC 2006, 'Environmental disclosures in the oil and gas industry,
Environmental Accounting: Commitment or Propaganda', Advances in Environmental
Accounting and Management, vol. 3, pp. 49-75.
Allen, B 1993, 'Making room for the environment in annual reports', Chartered
Accountants Journal of New Zealand, vol. 72, no. 7, p. 61.
Alvarez, IG, Garcia Sanchez, IM & Dominguez, LR 2008, 'Voluntary and Compulsory
Information Disclosed Online. The effect of industry concentration and other
explanatory factors', Online Information Review, vol. 32, no. 5, pp. 596-622.
Andrew, J, Kaidonis, MA & Andrew, B 2010, 'Carbon tax: Challenging neoliberal
solutions to climate change', Critical Perspectives on Accounting, vol. 21, no. 7, pp.
611-8.
Ascui, F & Lovell, H 2011, ‘As Frames Collide: Making Sense of Carbon Accounting’,
Accounting, Auditing & Accountability Journal, vol. 24, no. 8, pp. 978-999.
Ascui, F & Lovell, H 2012, ‘Carbon Accounting and the Construction of Competence’,
Journal of Cleaner Production, vol. 36, pp. 48-59.
Ashforth, BE & Gibbs, BW 1990, 'The Double-Edge of Organizational Legitimation',
Organization Science, vol. 1, no. 2, pp. 177-94.
ASX Corporate Governance Council 2007, Corporate Governance Principles and
Recommendations, viewed 1 August, 2011,
<http://asx.ice4.interactiveinvestor.com.au/ASX0701/Corporate%20Governance%20Pri
nciples/EN/body.aspx?z=1&p=-1&v=1&uid=>.
ASX Corporate Governance Council 2010, Corporate Governance Principles and
Recommendations with 2010 Amendments, 2nd edn, ASX, Sydney.

233
Australian Electoral Commission 2010, Prime Ministers and Opposition Leaders,
viewed March 2, 2011,
<http://www.aec.gov.au/Elections/Australian_Electoral_History/pm.htm>.
Australian Electoral Commission 2011, Election Dates (1901 to Present) - House of
Representatives, Australian Electoral Commission,
<http://www.aec.gov.au/Elections/Australian_Electoral_History/hor_dates.htm>.
Australian Government 2006, Energy Efficiency Opportunities Act 2006
Department of Resources Energy and Tourism, Canberra.
Australian Government 2009, Tracking to Kyoto and 2020, Department of Climate
Change and Energy Efficiency, Canberra.
Australian Government 2010, Australian National Greenhouse Accounts National
Inventory by Economic Sector 2009-10, Canberra.
Australian Government 2011a, About the NPI, viewed 2 August, 2011,
<http://www.npi.gov.au/about-npi>.
Australian Government 2011b, Development of the NPI National Environment
Protection Measure (NPI NEPM) viewed 2 August, 2011,
<http://www.npi.gov.au/about-npi/development-npi-nepm>.
Australian Government 2012, Working together for a clean energy future - United
States of America, Canberra, 9 November, 2012
<http://www.cleanenergyfuture.gov.au/why-we-need-to-act/what-others-are-
doing/united-states-of-america/>.
Australian Government Clean Energy Regulator 2012, Greenhouse and Energy
information 2010-2011, Australian Government, viewed 24 May, 2012,
<http://www.cleanenergyregulator.gov.au/NGER/Published-information/Published-
NGER-data/Reported-greenhouse-and-energy-information-by-year/Greenhouse-and-
energy-information-2010-11>.
Australian Government Clean Energy Regulator 2013, Emissions-intensive trade-
exposed activity summaries, viewed 17 September 2013,
http://www.cleanenergyregulator.gov.au/RET/Scheme-participants-and-
industry/Industry-assistance/Industry-assistance-published-information/Emissions-
intensive-trade-exposed-activity-summaries

234
Australian Labor Party 2011, Multi Party Climate Change Committee Carbon Price
Mechanism, Australian Labor, <http://www.alp.org.au/agenda/environment/carbon-
price-mechanism/>.
Australian Securities Exchange 2011, Corporate Governance, viewed 1 August, 2011,
<http://www.asx.com.au/governance/corporate-governance.htm>.
Australian Securities Exchange 2012, The Official List (Listed Companies), viewed 2
October, 2012, <http://asx.com.au/asx/research/listedCompanies.do >.
Australian Stock Exchange 2006, Media Release - ASX Corporate Governance Council
review of the Principles of Good Corporate Governance and Best Practice
Recommendations, viewed 1 August, 2011,
<http://www.asxgroup.com.au/media/PDFs/mr20061102_review_corporate_governance
_principles.pdf>.
AustralianPolitics.com 2010, Rudd Labor Government 2007 -, AustralianPolitics.com,
<http://australianpolitics.com/executive/rudd/>.
Ballou, B, Heitger, DL & Landes, CE, Adams, M 2006, 'The Future of Corporate
Sustainability Reporting', Journal of Accountancy, vol. 202, no. 6, pp. 65 - 74.
Balogh, S 2009, 'Abbot to put Libs on War footing - Labor warned of tougher stance in
election stoush', The Courier Mail, December 2.
Barber, BM & Lyon, JD 1997, 'Detecting long-run abnormal stock returns: The
empirical power and specification of test statistics', Journal of Financial Economics,
vol. 43, no. 3, pp. 341-72.
Bebbington, J & Larrinaga-Gonzalez, C 2008, 'Carbon Trading: Accounting and
Reporting Issues', European Accounting Review, vol. 17, no. 4, pp. 697-717.
Beekes, W & Brown, P 2006, 'Do Better-Governed Australian Firms Make More
Informative Disclosures?', Journal of Business Finance & Accounting, vol. 33, no. 3 &
4, pp. 422-50.
Berners-Lee, M 2014, US-China deal shows all that effort to tackle climate change
might actually be worth it, Lancaster University, viewed 11 December, 2014,
<http://theconversation.com/us-china-deal-shows-all-that-effort-to-tackle-climate-
change-might-actually-be-worth-it-34163>.

235
Bewley, K & Yue, L 2000, 'Disclosure of Environmental Information by Canadian
Manufacturing Companies: A Voluntary Disclosure Perspective', Advances in
Environmental Accounting & Management, vol. 1, pp. 201-26.
Bhuiyan, MHU & Biswas, PK 2007, 'Corporate Governance and Reporting: An
Empirical Study of the Listed Companies in Bangladesh', Journal of Business Studies,
vol. XXVIII, no. 1, pp. 1-32.
Bini, L, Dainelli, F & Giunta, F 2011, 'Signalling theory and voluntary disclosure to the
financial market. Evidence from the profitability inidicators published in the annual
report. ', paper presented to 34th EAA Annual Congress, Rome, 20-22 April, 2011.
Birt, J, Chalmers, K & Byrne, S 2014, Accounting: Business Reporting for Decision
Making, (4th
Edn), John Wiley & Sons, Incorporated, Milton
Blacconiere, WG & Patten, DM 1994, 'Environmental disclosures, regulatory costs, and
changes in firm value', Journal of Accounting and Economics, vol. 18, no. 3, pp. 357-
77.
Blair, D, (ed.) & Bernard, J, (ed.) 1999, Macquarie Pocket Dictionary, 3rd edn, John
Wiley & Sons Australia, Ltd, Milton, Queensland.
Bluffstone, RA 2003, 'Environmental Taxes in Developing and Trasnsition Economies',
Public Finance and Management, vol. 3, no. 1, pp. 143-75.
Borghei, Z & Leung, P 2013, 'Voluntary Greenhouse Gas Emission Disclosure - Impact
on Accounting-Based Performance', paper presented to Accounting & Finance
Association of Australia and New Zealand Conference, Perth, WA, 7-9 July, 2013.
Bougen, C 2009, 'Emissions trading in New Zealand', InFinance no. 5, pp. 49-51.
Branco, MC & Rodrigues, LL 2006, 'Corporate Social Responsibility and Resource-
Based Perspectives', Journal of Business Ethics, vol. 69, no. 2, pp. 111-32.
Braun, M 2009, 'The evolution of emissions trading in the European Union - The role of
policy networks, knowledge and policy entrepreneurs', Accounting, Organizations and
Society, vol. 34, no. 3-4, pp. 469-87.
Brook, B & Kelly, T 2009, Greenhouse Tax Versus Greenhouse Cap and Trade - The
Debate We Never Had, viewed 7 November, 2012 <http://bravenewclimate.com/2009/-
2/14/carbon-tax-or-cap-and-trade-the-debate-we-never-had/>.

236
Brouhle, K & Harrington, DR 2010, 'GHG Registries: participation and performance
Under the Canadian Voluntary Climate Challenge Program', Environ Resource Econ,
vol. 47, no.4, pp. 521-48.
Brown, N & Deegan, C 1998, 'The public disclosure of environmental performance
information - a dual test of media agenda setting theory and legitimacy theory',
Accounting and Business Research, vol. 29, no. 1, pp. 21-41.
Burritt, RL, Schaltegger, S & Zvezdov, D 2011, ‘Carbon Management Accounting:
Explaining Practice in Leading German Companies’, Australian Accounting Review,
vol. 21, no. 1, pp 80-98.
Buzby, SL 1975, 'Company Size, Listed Versus Unlisted Stocks, and the Extent of
Financial Disclosure', Journal of Accounting Research, vol. 13, no. 1, pp. 16-37.
Cadbury Committee 1992, Report of the Committee on the Financial Aspects of
Corporate Governance (Sir Adrian Cadbury, chair), Gee and Company Ltd, London.
Carbon Disclosure Project 2011a, Home Page, viewed March 8, 2011,
<https://www.cdproject.net/en-US/Pages/HomePage.aspx>.
Carbon Disclosure Project 2011b, What we do?, viewed March 8, 2011,
<https://www.cdp.net/en-US/Pages/About-Us.aspx>.
Carbon Market Data 2009, Press Release: Carbon Data Market publishes key figures
on the European Union's Emissions Trading Scheme for the year 2008, viewed 14
November, 2012, <http://www.environmental-expert.com/news/carbon-market-data-
publishes-key-figures-on-the-european-emissions-trading-scheme-for-the-year-2008-
48291>.
Carbonventures 2011, UK Emissions Trading Scheme, viewed 29 July, 2011,
<http://www.carbonventures.com/policy/article.php?list=UK%20Emissions%20Trading
%20Scheme&id=4470&link=UK%20Emissions%20Trading%20Scheme>.
Cavana, RY, Delahaye, BL & Sekaran, U 2001, Applied Business Research: Qualitative
and Quantitative Methods, John Wiley & Sons, Inc., Milton, Queensland.
CERES 2009, Climate Risk Disclosure in SEC Filings: An Analysis of 10-K reporting
by Oil and Gas, Insurance, Coal,Transportation and Electric Power companies,
CERES & Environmental Defense Fund, viewed 25 September, 2013,
<http://www.ceres.org/resources/reports/climate-risk-disclosure-2009/view>.
Cerf, AR 1961, Corporate Reporting and Investment Decisions, The University of
California Press, Berkeley, California.

237
Chen, JC & Roberts, RW 2010, 'Toward a More Coherent Understanding of the
Organization - Society Relationship: A Theoretical Consideration for Social and
Environmental Accounting Research', Journal of Business Ethics, vol. 97,no. 4, pp.
651-65.
Cho, CH & Patten, DM 2007, 'The role of environmental disclosures as tools of
legitimacy: A research note', Accounting, Organizations and Society, vol. 32, no. 7–8,
pp. 639-47.
Choi, BB, Lee, D & Pasros, J 2013, 'An analysis of Australian company carbon
emission disclosure', Pacific Accounting Review, vol. 25, no. 1, pp. 58-79.
Chow, CW & Wong-Boren, A 1987, 'Voluntary Financial disclosure by Mexican
corporations', The Accounting Review, vol. 62, no. 3, pp. 533-41.
Clarkson, PM, Li, Y, Richardson, GD & Vasvari, FP 2008, 'Revisiting the relation
between environmental performance and environmental disclosure: An empirical
analysis', Accounting, Organizations and Society, vol. 33, no. 4–5, pp. 303-27.
Clean Energy Regulator 2012a, Extract of NGER Register, Australian Government,
viewed 1/10/2012, <http://www.cleanenergyregulator.gov.au/National-Greenhouse-and-
Energy-Reporting/NGER-reporters/How-to-register/National-Greenhouse-and-Energy-
Register/Extract-of-NGER-Register/Pages/default.aspx>.
Clean Energy Regulator 2012b, Understanding the NGER data Greenhouse Gas
Emissions, Australian Government, viewed 7 September, 2012,
<http://www.cleanenergyregulator.gov.au/National-Greenhouse-and-Energy-
Reporting/Publication-of-NGER-data/Pages/default.aspx >.
Clean Energy Regulator 2014a, National Greenhouse and Energy Reporting NGER
audits and auditors, Australian Government, viewed 1 July, 2014,
<http://www.cleanenergyregulator.gov.au/National-Greenhouse-and-Energy-
Reporting/Auditors/Pages/default.aspx>.
Clean Energy Regulator 2014b, National Greenhouse and Energy Reporting, About the
NGER Scheme, The Australian Government, viewed 8 February, 2014,
<http://www.cleanenergyregulator.gov.au/About-the-National-Greenhouse-and-Energy-
Reporting-scheme>.
Climate Disclosure Standard Board 2013, Climate Change Reporting Framework,
viewed 26 September, 2013, <http://www.cdsb.net/>.

238
Commonwealth of Australia 2011, Corporations Act 2001 Act no. 50 of 2001 as
amended, Canberra,
<http://www.comlaw.gov.au/ComLaw/Legislation/ActCompilation1.nsf/0/824E693928
5CC8CACA25780E00810B8C/$file/Corps2001Vol02_283AA601DJ_WD02.pdf>.
Core, JE, Holthausen, RW & Larcker, DF 1999, 'Corporate Governance, Chief
Executive Officer Compensation, and Firm Performance', Journal of Financial
Economics, vol. 51, no. 3, pp. 371-406.
Cormier, D & Gordon, IM 2001, 'An examination of social and environmental reporting
strategies', Accounting, Auditing & Accountability Journal, vol. 14, no. 5, pp. 587-617.
Cormier, D, Magnan, M & Van Velthoven, B 2005, 'Environmental Disclosure Quality
in Large German Companies: Economic Incentives, Public Pressures or Institutional
Conditions?', European Accounting Review, vol. 14, no. 1, pp. 3-39.
Cotter, J, Lokman, N & Najah, MM 2011, 'Voluntary disclosure research: Which theory
is relevant?', Journal of Theoretical Accounting Research, vol. 6, no. 2, pp. 77-95.
Cotter, J & Najah, MM 2012, 'Institutional investor influence on global climate change
disclosure practices', Australian Journal of Management, vol. 37, no. 2, pp. 169-87.
Cotter, J, Najah, MM & Wang, SS 2011, 'Standardized reporting of climate change
information in Australia', Sustainability Accounting, Management and Policy Journal,
vol. 2, no. 2, pp. 294-321.
Cowan, S & Deegan, C 2011, 'Corporate disclosure reactions to Australia’s first
national emission reporting scheme', Accounting & Finance, vol. 51, no. 2, pp. 409-36.
Cowan, S & Gadenne, D 2005, 'Australian corporate environmental reporting: a
comparative analysis of disclosure practices across voluntary and mandatory disclosure
systems', Journal of Accounting & Organizational Change, vol. 1, no. 2, pp. 165-79.
Cowan, S & Tyler, M 2011, 'The Applicability of Evolving Multi-Theoretical Model to
Predict and Explain Emission Disclosures: An Exploratory Study', paper presented to
Accounting & Finance Association of Australia and New Zealand Conference, Darwin,
3-5 July, 2011.
Cowen, SS, Ferreri, LB & Parker, LD 1987, 'The Impact of Corporate Characteristics
on Social Responsibility Disclosure: A Typology and Frequency-Based Analysis',
Accounting, Organizations and Society, vol. 12, no. 2, pp. 111-22.
CPA Australia 2009, 'To cap or tax?', Intheblack, vol. 79, no. 10, pp. 46-8.

239
Craven, BM & Martson, CL 1999, 'Financial Reporting on the Internet by Leading UK
Companies', European Accounting Review, vol. 8, no. 2, pp. 321-33.
Cunningham, S & Gadenne, D 2003, 'Do Corporations Perceive Mandatory Publication
of Pollution Information for Key Stakeholders as a Legitimacy Threat?', Journal of
Environmental Assessment Policy and Management, vol. 5, no. 4, pp. 523-49.
de Lange, P & Sidaway, S 2011, 'Voluntary Environmental Disclosures in the Annual
Report: The Impact of the National Greenhouse & Energy Reporting Act', paper
presented to Accounting & Finance Association of Australia and New Zealand
Conference, Darwin, 3-5 July, 2011.
Deegan, C 1995, Australian Financial Accounting A Practical, Conceptual and
Theoretical Analysis, 1st edn, Richard D. Irwin, Artarmon.
Deegan, C 2000, Australian Financial Accounting, McGraw Hill Book Company,
Sydney, New South Wales.
Deegan, C 2002a, Australian Financial Accounting, 3rd
edn., McGraw Hill Book
Company, Sydney, New South Wales.
Deegan, C 2002b, 'Introduction: The legitimising effect of social and environmental
disclosures - a theoretical foundation', Accounting, Auditing & Accountability Journal,
vol. 15, no. 3, pp. 282-311.
Deegan, C 2005, Australian Financial Accounting, 4th edn, McGraw-Hill Australia Pty
Limited, North Ryde, New South Wales.
Deegan, C 2007, 'Organizational legitimacy as a motive for sustainability reporting', in J
Bebbington, B O'Dwyer & J Unerman (eds), Sustainability Accounting and
Accountability, Routledge London.
Deegan, C & Blomquist, C 2001, 'Stakeholder influence on corporate reporting: an
exploration of the interaction between the World Wide Fund for nature and the
Australian minerals industry', paper presented to Third Asian Pacific Interdisciplinary
Research in Accounting Conference, Adelaide.
Deegan, C & Carroll, G 1993, 'An analysis of the incentives for Australian firms to
apply for reporting excellence awards', Accounting and Business Research, vol. 23, no.
91, pp. 219-27.

240
Deegan, C & Gordon, B 1996, 'A study of the environmental disclosure policies of
Australian corporations', Accounting and Business Research, vol. 26, pp. 187-99.
Deegan, C & Haque, S 2009, ' An exploration of corporate climate change-related
governance practices and related disclosures - evidence from Australia ', paper
presented to 2009 AFAANZ Conference, Adelaide.
Deegan, C & O'Neill, S 2011, 'The GRI's Sustainability Reporting Guidelines:
Promoting Accountability to Stakeholders or Insitutionlising Corporate Social PR?',
paper presented to Accounting & Finance Association of Australia and New Zealand
Conference, Darwin, 3-5 July, 2011.
Deegan, C & Rankin, M 1996, 'Do Australian Companies Report Environmental News
Objectively? An Analysis of Environmental Disclosures by Firms Prosecuted
Successfully by the Environmental Protection Authority', Accounting, Auditing and
Accountability Journal, vol. 9, no. 2, pp. 50-67.
Deegan, C & Rankin, M 1997, 'The Materiality of Environmental Information to Users
of Accounting Reports', Accounting, Auditing and Accountability Journal, vol. 10, no.
4, pp. 562-83.
Deegan, C, Rankin, M & Tobin, J 2002, 'An examination of the corporate social and
environmental disclosures of BHP from 1983-1997', Accounting, Auditing &
Accountability Journal, vol. 15, no. 3, pp. 312-43.
Deegan, C, Rankin, M & Voght, P 2000, 'Firms' disclosure reactions to major social
incidents: Australian evidence', Accounting Forum, vol. 24, no. 1, pp. 101-30.
Deegan, C & Unerman, J 2006, Financial accounting theory, European edn, McGraw-
Hill UK, London.
Department of Climate Change 2009, National Greenhouse and Energy Reporting
Streamlining Protocol, Australian Government, <http://www.climatechange.gov.au/>.
Department of Climate Change and Energy Efficiency 2007, National Greenhouse and
Energy Act 2007, Australian Government, Canberra.
Department of Climate Change and Energy Efficiency 2012, National Greenhouse and
Energy Reporting Act 2007 no. 175 as amended Australian Government, Canberra.
Department of Climate Change and Water 2011, Legislation, New South Wales
Government, viewed January 27, 2011,
<http://www.environment.nsw.gov.au/legislation/>.

241
DiMaggio, PJ & Powell, WW 1983, 'The Iron Cage Revisited: Institutional
Isomorphism and Collective Rationality in Organizational Fields', American
Sociological Review, vol. 48, no. 2, pp. 147-60.
Doidge, C, Karolyi, GA & Stulz, RM 2007, 'Why do countries matter so much for
corporate governance?', Journal of Financial Economics, vol. 86, no. 1, pp. 1-39.
Donaldson, T & Preston, LE 1995, 'The Stakeholder Theory of the Corporation:
Concepts, Evidence, and Implications', Academy of Management Review, vol. 20, no. 1,
pp. 65-91.
Doran, K & Quinn, E 2009, 'Climate change risk disclosure: a sector by sector analysis
of SEC 10-K filings from 1995-2008', North Carolina Journal of International Law and
Commercial Regulation, vol. 34, no. 3, pp. 721-67.
Douglas, M 1986, How Institutions Think, Syracuse University Press, New York.
Dowling, J & Pfeffer, J 1975, 'Organisational Legitimacy: Social Values and
Organisational Behavior', Pacific Sociological Review, vol. 18, no. 1, pp. 122-36.
Eng, LL & Mak, YT 2003, 'Corporate governance and voluntary disclosure', Journal of
Accounting and Public Policy, vol. 22, no. 4, pp. 325-45.
Environment Protection Agency 2004, Ireland's Environment 2004, viewed 20
November, 2012
<http://www.epa.ie/downloads/pubs/indicators/soe2004/EPA_state%20of%20the%20en
vironment_report_2004_summary.pdf>.
Environmental Protection Authority 2011, About the EPA, The Government of Western
Australia, viewed January 27, 2011,
<http://www.epa.wa.gov.au/AbouttheEPA/abouttheEPA/Pages/default.aspx?cat=About
%20the%20EPA&url=AbouttheEPA/abouttheEPA>.
Environmental Protection Authority South Australia 2011, Our organisation - EPA
Board, South Australian Government, viewed January 27, 2011,
<http://www.epa.sa.gov.au/about_epa/our_organisation/epa_board>.
Ernst & Ernst 1978, Social Responsibility Disclosure, 1978 Survey, Ernst & Ernst,
Cleveland, OH.
Ernst & Young 2003, The Materiality of Environmental Risk to Australia's Finance
Sector, Canberra.

242
Evan, W & Freeman, RE 1988, 'A stakeholder theory of the modern corporation:
Kantian capitalism', in T Beauchamp & N Bowie (eds), Ethical Theory and Business,
3rd edn, Prentice Hall, Englewood Cliffs, NJ, pp. 75-93.
Fama, EF & Jensen, M 1983, 'Agency Problems and Residual Claims', Journal of Law
and Economics, vol. 26, no. 2, pp. 327-49.
Fishman, MJ & Hagerty, KM 2003, 'Mandatory Versus Voluntary Disclosure in
Markets with Informed and Uninformed Customers', Journal of Law, Economics &
Organization, vol. 19, no. 1, pp. 45-63.
Freedman, M & Jaggi, B 2005, 'Global warming, commitment to the Kyoto Protocol,
and accounting disclosures by the largest global public firms from polluting industries',
The International Journal of Accounting, vol. 40, pp. 215-32.
Freedman, M & Patten, DM 2004, 'Evidence on the pernicious effect of financial report
environmental disclosure', Accounting Forum, vol. 28, no. 1, pp. 27-41.
Freedman, RE 1984, Strategic Management: A Stakeholder Approach, Pitman, Boston,
MA.
Freeman, RE & Reed, DL 1983, 'Stockholders and Stakeholders: A New Perspective on
Corporate Governance', California Management Review, vol. 25, no. 3, pp. 88-106.
Friedman, M 1962, Capitalism and Freedom, University of Chicago, Chicago, IL.
Frost, G 2007, 'The Introduction of Mandatory Environmental Reporting Guidelines:
Australian Evidence', Abacus, vol. 43, no. 2, pp. 190-216.
Frost, G, Jones, S, Loftus, J & Van Der Laan, S 2005, 'A Survey of Sustainability
Reporting Practices of Australian Reporting Entities', Australian Accounting Review,
vol. 15, no. 1, pp. 89-96.
Garnaut, R 2008, Garnaut Climate Change Review, Garnaut Climate Change Review,
<http://www.garnautreview.org.au/domino/Web_Notes/Garnaut/garnautweb.html>.
Gibson, K & O'Donovan, G 2007, 'Corporate Governance and Environmental
Reporting: an Australian study ', Corporate Governance, An International Review, vol.
15, no. 5, pp. 994-56.

243
Gilby, P 2008, 'Power and National Politics: VCE National Politics Units 3 and 4', in
Federal Election 2007 VCE National Politics and Power, 2nd edn, Victorian
Association of Social Studies Teachers Inc., Carlton.
Global Reporting Initiative & KPMG's Global Sustainability Services 2007, Reporting
the business implications of climate change in sustainability reports, viewed 26
September, 2012, <https://www.globalreporting.org/resourcelibrary/Reporting-on-the-
Business-Implications-of-Climate-Change-in-Sustainability-Reports.pdf>.
Global Reporting Initiative & KPMG 2007, Reporting the business implications of
climate change in sustainability reports, Global Reporting Initative and KPMG's Global
Sustainability Services
Godfrey, J, Hodgson, A, Holmes, S & Tarca, A 2006a, Accounting Theory, 6th edn,
John Wiley & Sons Australia, Milton.
Godfrey, J, Hodgson, A, Holmes, S & Tarca, A 2006b, 'Social and environmental
reporting', in Accounting Theory, 6th edn, John Wiley & Sons Australia, Ltd, Milton,
pp. 630-64.
Gray, R 2005, 'Taking a long view on what we now know about social and
environmental accountability and reporting', Electronic Journal of Radical
Organisation Theory, vol. 9, pp. 1-31.
Gray, R 2010, 'Is accounting for sustainability actually accounting for sustainability ...
and how would we know? An exploration of narratives of organisations and the planet',
Accounting, Organizations and Society, vol. 35, no. 1, pp. 47-62.
Gray, R, Kouhy, R & Lavers, S 1995, 'Corporate social and environmental reporting: A
review of the literature and a longitudinal study of UK disclosure', Accounting, Auditing
& Accountability Journal, vol. 8, no. 2, pp. 47-77.
Gray, R & Owen, DL 1993, 'The rocky road to reporting', Certified Accountant, March,
pp. 36-9.
Green, W & Li, Q 2011, 'GHG reporting under spotlight', Charter, vol. 82, no. 5, pp.
52-3.
Griffin, PA, Lont, DH & Sun, Y 2012, 'The Relevance to Investors of Greenhouse Gas
Emission Disclosures', Working Paper.
Griffin, PA & Sun, Y 2012, 'Going Green: Market Reaction to CSR Newswire
Releases', Working Paper.

244
Guthrie, J & Parker, L 1990, 'Corporate Social Disclosure Practice: A comparative
International Analysis', Advances in Public Interest Accounting, vol. 3, pp. 159-76.
Guthrie, J & Parker, LD 1989, 'Corporate Social Reporting; A Rebuttal of Legitimacy
Theory', Accounting and Business Research, vol. 19, no. 76, pp. 343-52.
Hackston, D & Milne, MJ 1996, 'Some determinants of social and environmental
disclosures in New Zealand companies', Accounting, Auditing & Accountability
Journal, vol. 9, no. 1, pp. 77-108.
Haigh, M & Hazelton, J 2004, 'Financial Markets: A Tool for Social Responsibility?',
Journal of Business Ethics, vol. 52, no. 1, pp. 59-71.
Haigh, M & Shapiro, MA 2012, ‘Carbon Reporting: does it matter?’, Accounting,
Auditing & Accountability Journal, vol. 25, no. 1, pp. 106-125.
Hair Jr., JF, Black, WC, Babin, BJ, Anderson, RE & Tatham, RL 2006, Multivariate
Data Analysis, Pearson Prentice Hall, New Jersey, USA.
Haque, S & Deegan, C 2010, 'An Exploration of Corporate Climate Change-related
Governance Practices and Related Disclosures: Evidence from Australia', Australian
Accounting Review, vol. 20, no. 4, pp. 317-33.
Hartman, F, Perego, P & Young, A 2013, ‘Carbon Accounting: Challenges for Research
in Management Control and Performance Measurement’, Abacus, vol. 49, no. 4,
pp.539-563.
Hasnas, J 1998, 'The Normative Theories of Business Ethics: A Guide for the
Perplexed', Business Ethics Quarterly, vol. 8, no. 1, pp. 19-42.
Herbig, P 1996, 'Market signalling: a review', Management Decision, vol. 34, no. 1, pp.
35-45.
Hermalin, B & Weisbach, M 1998, 'Endogenously chosen Boards of Directors and their
monitoring of the CEO', American Economic Review, vol. 88, pp. 96-118.
Hewson, J 2010, Climate loses political game, Australian Broadcasting Corporation,
<http://www.abc.net.au/unleashed/stories/s2812572.htm >.
Ho, SSM & Wong, KS 2001, 'A study of the relationship between corporate governance
structures and the extent of voluntary disclosure', Journal of International Accounting,
Auditing & Taxation, vol. 10, no. 2, pp. 139-56.

245
Hoffman, AJ 1999, 'Institutional evolution and change: environmentalism and the U.S.
chemical industry', Academy of Management Journal, vol. 42, no. 4, pp. 351-71.
Hoffman, AJ 2006, Getting Ahead of the Curve: Corporate Strategies that Address
Climate Change, Prepared for the Pew Center on Global Climate Change, viewed 26
September, 2012, <http://www.c2es.org/docUploads/PEW_CorpStrategies.pdf>.
Hollindale, JL 2012, 'Voluntary disclosure of GHG emission information by Australian
Companies', Doctor of Philiosophy thesis, Bond University.
Hollindale, JL, Kent, P & Routledge, J 2010, 'Corporate Governance and the Quality of
Greenhouse Gas Emission Disclosures', paper presented to 23rd Asia Pacific
Conference, Beijing, China, 16 December, 2010.
Holsti, O 1969, Content Analysis for the Social Sciences and Humanities, Addison-
Wesley Publishing, London.
Hossain, M, Perera, MHB & Rahman, AR 1995, 'Voluntary Disclosure in the Annual
Reports of New Zealand Companies', Journal of International Financial Management
and Accounting, vol. 6, no. 1, pp. 69-87.
Howes, M 2001, 'What's Your Poison? The Australian National Pollutant Inventory
versus the US Toxics Release Inventory', Australian Journal of Political Science, vol.
36, no. 3, pp. 529-52.
Intergovernmental Panel on Climate Change 2010, Intergovernmental Panel on Climate
Change, viewed 30 October 2010, <http://www.ipcc.ch/organization/organization.htm>.
Intergovernmental Panel on Climate Change 2013, Summary for Policymakers, viewed
30 September, 2013, <http://www.climatechange2013.org/images/uploads/WGIAR5-
SPM_Approved27Sep2013.pdf>.
Jensen, M 1986, 'Agency costs of free cash flow, corporate finance, and takeovers',
American Economic Review, vol. 76, pp. 323-9.
Jensen, M 1993, 'The Modern Industrial Revolution, Exit, and the Failure of Internal
Control Systems', The Journal of Finance, vol. 48, no. 3, pp. 831-80.
Jeswani, HK, Wehrmeyer, W & Mulugetta, Y 2008, 'How warm is the corporate
response to climate change? Evidence from Pakistan and the UK', Business, Strategy
and the Environment, vol. 17, no. 1, pp. 46-60.

246
Joint Committee on Corporations and Financial Services 2006, Joint Committee on
Corporations and Financial Services, Reference: Corporate responsibility,
Commonwealth of Australia, viewed 18 September, 2012,
<http://parlinfo.aph.gov.au/parlInfo/download/committees/commjnt/9110/toc_pdf/4587-
2.pdf;fileType=application/pdf#search=%22Parliamentary+Joint+Committee+Corporati
ons+Securities+2006+corporate%202000s%22>.
Jones, S (ed.) & Ratnatunga, J (ed.) 2012, Contemporary Issues in Sustainability
Accounting, Assurance and Reporting, Emerald Insight, Bingley.
Kelly, P 2010, 'Climate goals unviable amid policy disarray', The Weekend Australian,
May 1-2.
Kent, P, Kwong, E & Marshall, B 1997, 'Social responsibility and environmental
disclosures: Evidence from Australian chemical companies', Accountability and
Performance, vol. 3, no. 2.
Kent, P & Monem, R 2008, 'What Drives TBL Reporting: Good Governance or Threat
to Legitimacy?', Australian Accounting Review, vol. 18, no. 4, pp. 297-309.
Kolk, A 2008, 'Developments in corporate responses to climate change in the past
decade', in B Hansjurgens & R Antes (eds), Climate change, sustainability development
and risk: An economic and business view, Physica Publishers Heidelberg/New York.
Kolk, A & Levy, D 2001, 'Winds of Change: Corporate strategy, climate change and Oil
multinationals', European Management Journal, vol. 19, no. 5, pp. 501-9.
Kolk, A, Levy, D & Pinkse, J 2008, 'Corporate Responses in an Emerging Climate
Regime: The Institutionalization and Commensuration of Carbon Disclosure', The
European Accounting Review, vol. 17, no. 4, pp. 719-45.
Krippendorff, K 1980, Content Analysis: An Introduction to its Methodology, Sage,
London.
Lang, M & Lundholm, R 1993, 'Cross-Sectional Determinants of Analyst Ratings of
Corporate Disclosures', Journal of Accounting Research, vol. 31, no. 2, pp. 246-71.
Lawrence, P 2009, 'Australian climate policy and the Asia Pacific partnership on clean
development and climate (APP). From Howard to Rudd: continuity or change?',
International Environmental Agreements : Politics, Law and Economics, vol. 9, no. 3,
pp. 281-99.

247
Leftwich, R 1980, 'Market Failure Fallacies and Accounting Information', Journal of
Accounting and Economics, vol. 2, no. 3, pp. 193-211.
Lev, B & Penman, S, H. 1990, 'Voluntary Forecast Disclosure, Nondisclosure, and
Stock Prices', Journal of Accounting Research, vol. 28, no. 1, pp. 49-76.
Linck, JS, Netter, JM & Yang, T 2008, 'The determinants of board structure', Journal of
Financial Economics, vol. 87, pp. 308-28.
Lindblom, CK 1994, 'The implications of organisational legitimacy for corporate social
performance and disclosure', paper presented to Critical Perspectives on Accounting
Conference, New York.
Lodhia, S 2011, 'The Australian National Greenhouse and Energy Reporting Act and its
implications for accounting practice and research: A mini-review ', Journal of
Accounting & Organizational Change, vol. 7, no. 2, pp. 190-8.
Lodhia, S & Jacobs, K 2013, ‘The practice turn in environmental reporting: A Study
into current practices in two Australian commonwealth departments’, Accounting,
Auditing & Accountability Journal,vol. 26, no. 4, pp. 595-615.
Lodhia, S & Martin, N 2012, 'Stakeholder responses to the National Greenhouse and
Energy Reporting Act: An agenda setting perspective', Accounting, Auditing &
Accountability Journal, vol. 25, no. 1, pp. 126-45.
Lohmann, L 2009, 'Toward a different debate in environmental accounting: The cases
of carbon and cost-benefit', Accounting, Organizations and Society, vol. 34, no. 3-4, pp.
499-534.
Lorraine, NHJ, Collison, DJ & Power, DM 2004, 'An analysis of the stock market
impact of environmental performance information ', Accounting Forum, vol. 28, no. 1,
pp. 7-26.
MacKenzie, D 2009, 'Making things the same: Gases, emission rights and the politics of
carbon markets', Accounting, Organizations and Society, vol. 34, no. 3–4, pp. 440-55.
Mackerras, M 2010, 'Governed by a bare margin for error', The Weekend Australia,
October 16-17.
Martinov-Bennie, N 2012, 'Greenhouse gas emissions reporting and assurance:
reflections on the current state', Sustainability Accounting, Management and Policy
Journal, vol. 3, no. 2.

248
Mathews, MR 2004, 'A commentary on Lorraine, Collison and Power and Freedman
and Patten: how far does empirical research assist in the drive to regulate environmental
disclosures?', Accounting Forum, vol. 28, pp. 81-6.
McGraw Hill Financial 2014, S & P Dower Jones Indices, viewed 4 February, 2014,
<http://au.spindices.com/search/?query=Global+Industries+Classification+Standards&S
earch=SEARCH&Search=SEARCH#>.
McKinsey & Company 2009, Pathways to a low-carbon economy: version 2 of the
global greenhouse gas abatement cost curve, McKinsey & Company
McWilliams, A, Siegel, DS & Wright, PM 2006, 'Guest Editors' Introduction Corporate
Social Responsibility: Strategic Implications', Journal of Management Studies, vol. 43,
no. 1, pp. 1022-2380.
Metcalf, GE 2009, 'Cost Containment in Climate Change Policy: Alternative
approaches to mitigating price volatility', Virginia Tax Review, vol. 29, pp. 381-405.
Mete, P, Dick, C & Moerman, L 2010, 'Creating institutional meaning: Accounting and
taxation law perspectives of carbon permits', Critical Perspectives on Accounting, vol.
21, pp. 619-30.
Mills, DL & Gardner, MJ 1984, 'Financial Profiles and the Disclosure of Expenditures
for Socially Responsible Purposes', Journal of Business Research, vol. 12, no. 4, pp.
407-24.
Milne, M & Adler, R 1999, 'Exploring the reliability of social and environmental
disclosures content analysis', Accounting, Auditing & Accountability Journal, vol. 12,
pp. 237-56.
Milne, MJ & Patten, DM 2002, 'Securing organisational legitimacy: An experimental
decision case examining the impact of environmental disclosures', Accounting, Auditing
& Accountability Journal, vol. 15, no. 3, pp. 372-405.
Monem, R 2012, 'Determinants of Board Structure: Evidence from Australia',
Forthcoming in Journal of Contemporary Accounting and Economics.
Morris, RD 1987, 'Signalling, Agency Theory and Accounting Policy Choice',
Accounting and Business Research, vol. 18, no. 69, pp. 47-56.
Murray, A, Sinclair, D, Power, D & Gray, R 2006, 'Do financial markets care about
social and enviromental disclosure?', Accounting, Auditing & Accountability Journal,
vol. 19, no. 2, pp. 228-55.
249
Najah, MM & Cotter, J 2012, 'Are climate change disclosures an indicator of superior
climate change risk management?'.
National Environment Protection Council 2011a, About Us, viewed January 27, 2011,
<http://www.ephc.gov.au/about-us>.
National Environment Protection Council 2011b, Welcome to the National Environment
Protection Council website, viewed January 27, 2011,
<http://www.ephc.gov.au/node/4>.
Neu, D, Warsame, H & Pedwell, K 1998, 'Managing public impressions: environmental
disclosures in annual reports', Accounting Organizations and Society, vol. 23, no. 3, pp.
265-82.
New Zealand Government 2009, 'Climate Change Response (Moderated Emissions
Trading) Amendment Act 2009'.
Newson, M & Deegan, C 2002, 'Global expectations and their association with
corporate social disclosure practices in Australia, Singapore, and South Korea', The
International Journal of Accounting, vol. 37, pp. 183-213.
Ng, LW 1985, 'Social responsibility disclosures of selected New Zealand companies for
1981, 1982 and 1983', Occasional paper, no. 54, Massey University, Palmerston North.
O'Donovan, G 2002, 'Environmental Disclosures in the Annual Report - Extending the
Applicability and Predictive Power of Legitimacy Theory', Accounting, Auditing and
Accountability, vol. 15, no. 3, pp. 344-71.
Oakes, L 2009, 'Eyeing off the end game', The Courier Mail, October 3-4.
Organisation for Economic Development 2013, Countries should make carbon pricing
the cornerstone of climate policy, says OECD, viewed 11 October, 2013,
<http://www.oecd.org/newsroom/>.
Origin Energy Limited 2011, Aspiring Always to Lead. Strategy Performance Growth
Sustainability Report 2011, Origin Limited.
Pahuja, A & Bhatia, BS 2010, 'Determinants of Corporate Governance Disclosures:
Evidence from Companies in Northern India', The IUP Journal of Corporate
Governance, vol. IX, no. 3, pp. 69-88.
250
Parliament of Australia 2011, Biography for Turnbull, the Hon. Malcolm Bligh,
Parliament of Australia
<http://parlinfo.aph.gov.au/parlInfo/search/display/display.w3p;query=Id%3A%22hand
book%2Fallmps%2F885%22>.
Parry, IWH & Pizer, WA 2007, 'Combating Global Warming', Regulation, vol. 30, no.
3, pp. 18-22.
Patten, DM 1991, 'Exposure, legitimacy, and social disclosure', Journal of Accounting
and Public Policy, vol. 10, pp. 297-308.
Patten, DM 1992, 'Intra-Industry Environmental Disclosures in Response to the Alaskan
Oil Spill: A Note on Legitimacy Theory', Accounting, Organizations and Society, vol.
17, no. 5, pp. 471-5.
Patten, DM 2002, 'The relation between environmental performance and environmental
disclosure: a research note', Accounting, Organizations and Society, vol. 27, pp. 763-73.
Patten, DM & Crampton, W 2004, 'Legitimacy and the Internet: An examination of
corporate web page environmental disclosures', Advances in Environmental Accounting
and Management, vol. 2, pp. 31-57.
Pearce, D & Turner, RK 1990, Economics of Natural Resources and the Environment,
The John Hopkins University Press, Baltimore.
Peirson, G, Brown, R, Easton, S, Howard, P & Pinder, S 2006, Business Finance, 9th
edn, McGraw Hill, North Ryde.
Perera, L & Jubb, C 2011, 'Voluntary Disclosures by National Greenhouse Energy Act-
affected Listed Companies', Deakin University. Working Paper
Petcharat, N & Mula, JM 2013, 'Towards a Conceptual Model for Sustainability
Financial Reporting System', paper presented to Accounting & Finance Association of
Australia and New Zealand Perth, WA.
Pfeffer, J & Salancik, GR 1978, The External Control of Organizations: A Resource
Dependence Perspective, Harper and Row, New York.
Potsdam Institute for Climate Impact Research 2010, Potsdam Institute for Climate
Impact Research, viewed October 30, 2010, <http://www.pik-potsdam.de/>.
251
Prado-Lorenzo, J-M, Rodríguez-Domínguez, L, Gallego-Álvarez, I & García-Sánchez,
I-M 2009, 'Factors influencing the disclosure of greenhouse gas emissions in companies
world-wide', Management Decision, vol. 47, no. 7, pp. 1133-57.
Purushothaman, M & Taplin, R 2011a, 'How Green are Climate Change Issues?: An
Auditor's Perspective', paper presented to Accounting & Finance Association of
Australia and New Zealand Conference, Darwin, 3-5 July, 2011.
Purushothaman, M & Taplin, R 2011b, 'A Pre and Post Analysis of the Impact of
Carbon Regulation & Ratification of the Kyoto Protocol: An Australian Perspective',
paper presented to Accounting & Finance Association of Australia and New Zealand
Conference, Darwin, 3-5 July, 2011.
Puxty, AG 1991, 'Social Accountability and Universal Pragmatics', in M Neimark, B
Merino & T Tinker (eds), Advances in Public Interest Accounting, JAI Press Inc, vol. 4,
pp. 35-45.
Qian, W 2012, 'An exploratory study of carbon efficiency in Australian NGER
reporting companies', paper presented to Accounting & Finance Australia and New
Zealand Conference, Melbourne, 3-5 July, 2012.
Raheja, C 2005, 'Determinants of board size and composition: A theory of corporate
boards', Journal of Financial and Quantitative Analysis, vol. 40, pp. 283-306.
Rankin, M, Windsor, C & Wahyuni, D 2011, 'An Investigation of Voluntary Corporate
Greenhouse Gas Emissions Reporting in a Market Governance System: Australian
Evidence', Accounting, Auditing & Accountability Journal, vol. 24, no. 8, pp. 1037-70.
Reid, EM & Toffel, MW 2009, 'Responding to Public and Private Politics: Corporate
Disclosure of Climate Change Strategies', Strategic Management Journal, vol. 30, pp.
1157-78.
Roberts, RW 1992, 'Determinants of Corporate Social Responsibility Disclosure: An
Application of Stakeholder Theory', Accounting, Organizations and Society, vol. 17, no.
6, pp. 595-612.
Rodgers, E 2010, Coalition plan "will push up emissions", Australian Broadcasting
Corporation, <http://www.abc.net.au/news/stories/2010/02/04/2809697.htm>.
Rose, T 2009, 'Climate Change Opportunities', InFinance, no. 3, pp. 48-50.
Selvanathan, A, Selvanathan, S, Keller, G & Warrack, B 2000, Australian Business
Statistics, 2nd edn, Nelson Thomson Learning, Melbourne.

252
Shocker, AD & Sethi, SP 1973, 'An approach to incorporating societal preferences in
developing corporate action strategies', California Management Review, pp. 97-105.
Simnett, R & Nugent, M 2007, 'Developing an assurance standard for carbon emissions
disclosures', Australian Accounting Review, vol. 17, no. 2, pp. 37-47.
Singhvi, SS & Desai, HB 1971, 'An Empirical Analysis of the Quality of Corporate
Financial Disclosure', The Accounting Review, vol. January, pp. 129-38.
Skinner, D 1994, 'Why Firms Voluntarily Disclose Bad News', Journal of Accounting
Research, vol. 32, no. 1, pp. 38-60.
Skjaerseth, JB & Wettestad, J 2008, 'Implementing EU emissions trading: success or
failure?', Int Environ Agreements, vol. 8, pp. 275-90.
Spence, AM 1973, 'Job market', Quarterly Journal of Economics, vol. 87, no. 3, pp.
355-79.
Spicer, BH 1978, 'Investors, Corporate Social Performance and Information Disclosure:
An Empirical Study', The Accounting Review, vol. LIII, no. 1, pp. 94-111.
Standard & Poors & MSCI Barra 2008, GICS Structure, 5 November, 2012,
<http://www.aspectfinancial.com.au.libraryproxy.griffith.edu.au/af/home?xtm-
licensee=annualreportsonline>.
Stanny, E 2010, 'Voluntary Disclosures by US Firms to the Carbon Disclosure Project',
Sonoma State University, unpublished working paper.
Stapleton, M, Lenihan, H, Killian, S, O'Sullivan, B & Business, K 2006, 'The Irish
Carbon Tax: A Lost Opportunity?', Social Responsibility Journal, vol. 2, no. 1, pp. 23-
34.
Stausberg, M & Dohl, G 2010, 'GRI and UN Global Compact Forge New Alliance',
viewed July 8, 2010, <http://www.unglobalcompact.org/news/50-06-24-2010>.
Stern, N 2007, The Economics of Climate Change The Stern Review, Cambridge
University Press, Cambridge.
Stiglitz, JE 2006, 'Chapter 6 - Saving the Planet', in Making Globalization Work, W.W.
Norton & Company, New York, pp. 161-86.

253
Stubbs, W, Higgins, C & Milne, MJ 2013, 'Why Do Companies Not Produce
Sustainability Reports?', Business Strategy and the Environment, vol. 22, pp. 456-70.
Suchman, MC 1995, 'Managing legitimacy: Strategic and institutional approaches',
Academy of Management Review, vol. 20, no. 3, pp. 571-610.
Sun, N, Salama, A, Hussainey, K & Habbash, M 2010, 'Corporate Environmental
Disclosure, Corporate Governance and Earnings Management', Managerial Auditing
Journal, vol. 25, no. 7, pp. 679-700.
Tay, CL, Sultana, N & Van der Zahn, M 2013, 'Signal Breaches in Technical Trading
Indicators and Corporate Social Responsibility Disclosures in Singapore', paper
presented to Accounting & Finance Association of Australia and New Zealand, Perth,
WA, 7-9 July, 2013.
Taylor, L 2009, 'Two big guns steal the show', The Weekend Australian, December 12-
13.
The Age 2007, Rudd ratifies Kyoto, The Age, December, 3,
<http://www.theage.com.au/>.
The Coalition 2010, Direct Action Plan, Liberal Party, <http://www.liberal.org.au/>.
The Government of the United Kingdom 2005, EU Emissions Trading Scheme Draft
Amendment to the Greenhouse Gas Emissions Trading Scheme Regulations The
Greenhouse Gas Emissions Trading Scheme (Amendment) Regulations 2006 Regulatory
Impact Statement, Department of Environment Food and Rural Affairs London.
The UK Treasury 2007, HM Treasury Annual Report and Accounts 2006-2007, The UK
Government, London.
Tietenberg, T 2007, Environmental Economics and Policy, 5th edn, Addison- Wesley,
New York.
Tilling, MV & Tilt, CA 2010, 'The edge of legitimacy Voluntary social and
environmental reporting in Rothmans' 1956-1999 annual reports', Accounting, Auditing
& Accountability Journal, vol. 23, no. 1, pp. 55-81.
Turnbull, M 2009, Amendments to the CPRS, 31 July, 2011,
<http://www.malcolmturnbull.com.au/media/archives/amendments-to-the-cprs/>.

254
Turnbull, M 2010, Turnbull: why I will vote for Rudd's CPRS Australian Broadcasting
Corporation, <http://www.abc.net.au/unleashed/stories/s2813351.htm>.
Ullmann, AA 1985, 'Data in Search of a Theory: A Critical Examination of the
Relationships among Social Performance, Social Disclosure, and Economic
Performance of U.S. Firms', The Academy of Management Review, vol. 10, no. 3, pp.
540-57.
Unerman, J 2000, 'Methodological issues - Reflections on quantification in corporate
social reporting content analysis', Accounting, Auditing & Accountability Journal, vol.
13, no. 5, pp. 667-80.
Unerman, J & Bennett, M 2004, 'Increased stakeholder dialogue and the internet:
towards greater corporate accountability or reinforcing capitalist hegemony?',
Accounting, Organizations and Society, vol. 29, pp. 685-707.
United Nations 1992, United Nations Framework Convention on Climate Change
United Nations, <http://unfccc.int/resource/docs/convkp/conveng.pdf>.
United Nations 1998, Kyoto Protocol To the United Nations Framework Convention on
Climate Change, viewed 21 January 2011,
<http://unfccc.int/resource/docs/convkp/kpeng.pdf>.
United Nations Framework Convention on Climate Change 2009, Fact sheet: 10
frequently asked questions about the Copenhagen deal, United Nations Framework
Convention on Climate Change,
<http://unfccc.int/files/press/fact_sheets/application/pdf/10_faqs_copenhagen_deal.pdf>
.
United Nations Framework Convention on Climate Change 2010a, Clean Development
Mechanism (CDM), viewed September 22, 2010,
<http://unfccc.int/kyoto_protocol/mechanisms/clean_development_mechanism/items/27
18.php>.
United Nations Framework Convention on Climate Change 2010b, Kyoto Protocol,
United Nations Framework Convention on Climate Change,
<http://unfccc.int/kyoto_protocol/items/2830txt.php>.
United Nations Framework Convention on Climate Change 2010c, List of Annex 1
parties to the Convention, viewed September 1, 2010,
<http://unfccc.int/parties_and_observers/parties/annex_i/items/2774.php>.

255
United Nations Framework Convention on Climate Change 2010d, Status of
Ratification of the Kyoto Protocol, viewed 21 June, 2010,
<http://unfccc.int/playground/items/5524txt.php>.
United Nations Framework Convention on Climate Change 2011a, Fact sheet: An
introduction to the United Nations Framework Convention on Climate Change
(UNFCCC) and its Kyoto Protocol, viewed 28 July, 2011,
<http://unfccc.int/press/fact_sheets/items/4978.php>.
United Nations Framework Convention on Climate Change 2011b, Parties & Observer
States - Australia, United Nations Framework Convention on Climate Change,
<http://maindb.unfccc.int/public/country.pl?country=AU>.
United Nations Framework Convention on Climate Change 2011c, Parties & Observer
States - New Zealand, viewed 28 July, 2011,
<http://maindb.unfccc.int/public/country.pl?country=NZ>.
United Nations Framework Convention on Climate Change 2011d, Parties & Observers
- Canada, viewed 28 July, 2011,
<http://maindb.unfccc.int/public/country.pl?country=CA>.
United Nations Framework Convention on Climate Change 2011e, Parties & Observers
- European Union, viewed 28 July, 2011,
<http://maindb.unfccc.int/public/country.pl?country=EU>.
United Nations Framework Convention on Climate Change 2011f, Parties & Observers
- United Kingdom of Great Britian and Northern Ireland, viewed 28 July, 2011,
<http://maindb.unfccc.int/public/country.pl?country=GB>.
United Nations Framework Convention on Climate Change 2011g, Parties & Observers
- United States of America, viewed 28 July, 2011,
<http://maindb.unfccc.int/public/country.pl?country=US>.
United Nations Framework Convention on Climate Change 2013a, International
Emissions Trading, viewed 30 September, 2013,
<www.unfccc.int/kyoto_protocol/mechanisms/emissions_trading/items/2731.php >.
United Nations Framework Convention on Climate Change 2013b, Joint
Implementation (JI), viewed 30 September, 2013, <www.unfccc.int/kyoto-
protocol/mechanisms/joint-implementation/items/1674.php>.
United Nations Global Compact 2011, Overview of the UN Global Compact, viewed 29
July, 2011, <http://www.unglobalcompact.org/AboutTheGC/index.html>.

256
US Environmental Protection Agency 2009, Determining Adequate Greenhouse Gas
Emission Estimation Methods for Mandatory Reporting Under the Western Climate
Initiative Cap-and-Trade Programme
US Environmental Protection Agency,
<http://www.epa.gov/ttnchie1/conference/ei18/session7/fields.pdf>.
US Environmental Protection Agency 2011, What is the EPA doing about climate
change?, US Environmental Protection Agency,
<http://climatechange.supportportal.com/>.
Vasi, IB 2007, 'Thinking Globally, Planning Nationally and Acting Locally: Nested
Organizational Fields and the Adoption of Environmental Practices', Social Forces, vol.
86, no. 1, pp. 113-35.
Verrecchia, RE 1983, 'Discretionary Disclosure', Journal of Accounting and Economics,
vol. 5, pp. 179-94.
Victorian Government 1970, Environmental Protection Act 1970, Environmental
Protection Authority Victoria, Melbourne.
Viellaris, R 2014, 'Heat is on Australia for climate fund cash', The Sunday Mail, 16
November, 2014.
Viellaris, R & Meers, D 2014, 'Abbott aversion to climate talks thwarted by US-China
deal', The Courier Mail, 14 November, 2014.
Wallace, RSO & Naser, K 1995, 'Firm-Specific Determinants of the
Comprehensiveness of Mandatory Disclosure in the Corporate Annual Reports of Firms
Listed on the Stock Exchange of Hong Kong', Journal of Accounting & Public Policy,
vol. 14, no. 4, pp. 311-68.
Western Climate Initiative 2011, Western Climate Initiative - Milestones, Western
Climate Initiative, <http://www.westernclimateinitiative.org/milestones>.
Whinnett, E 2014, 'China Shock Deal on Climate', The Courier Mail, 13 November,
2014.
Wilson, N 2007, 'What a national emissions trading scheme could mean for tax',
International Tax Review, p. 1, viewed June 15, 2010,
<http://www.internationaltaxreview.com/?Page=10&PUBID=35&ISS=24353&SID=69
7458&TYPE=20>.

257
Wiseman, J 1982, 'An evaluation of environmental disclosures made in corporate annual
reports', Accounting, Organizations and Society, vol. 7, no. 1, pp. 53-63.
Yoram, M 2010, 'Tax Policy Analysis of Climate Change', Tax Law Review, vol. 64, no.
1, pp. 63-98.
Young, A 2010, 'Greenhouse gas accounting: global problem, national policy, local
fugitives', Sustainability Accounting, Management and Policy Journal, vol. 1, no. 1, pp.
89-95.
Zikmund, WG 2003, Business Research Methods, 7th edn, Thomson South-Western,
Mason, Ohio.
Zucker, LG 1987, 'Institutional Theories of Organization', Annual Review of Sociology,
vol. 13, pp. 443-64.

258
Appendix 1 – Market Capitalisation
Table 1 lists NGER firms and their market capitalisation range of 70%-130% and the equivalent matched-pair Non-NGER firm.
Table 1: NGER and Non-NGER Firms’ Market Capitalisation and the 30% range used to match Non-NGER with NGER firms.
NGER - ID ASX
Listing
Code
Mkt Cap –
28/3/12
Millions
Mkt Cap –
25/10/12
Millions
70%-130% range Non-NGER - ID ASX
Listing
Code
Mkt Cap –
25/10/12
Millions
GICs Industry Group - Materials (30 NGER Companies and 30 Non-NGER Companies)
NGER_1 BHP 110,193 77,135.1 - 143,250.9
NGER_2 RIO 24,951 17,465.7 - 32,436.3
NGER_3 NCM 20,264 14,184.8 – 26,343.2
NGER_4 FMG 13,233 9,263.1 - 17,202.9
NGER_5 AMC 9,363 6,554.1 – 12,171.9
NGER_6 ORI 9,349 6,544.3 – 12,153.7
NGER_7 IPL 5,293 3,705.1 – 6,880.9 Non-NGER_7 JHX 4,022
NGER_8 MCC 4,836 - 3,385.2 – 6,286.8
NGER_9 ILU 4,166 2,916.2 – 5,415.8 Non-NGER_9 FBU 3,930
NGER_10 BLD 2,796 1,957.2 – 3,634.8
NGER_11 OZL 2,561 1,792.7 – 3,329.3
NGER_12 ABC 2,007 1,404.9 – 2,609.1 Non-NGER_12 PNA 2,058
NGER_13 AWC 2,293 1,605.1 – 2,980.9
NGER_14 SGM 1,912 1,338.4 – 2,485.6
NGER_15 BSL 1,674 1,171.8 – 2,176.2 Non-NGER_15 EVN 1,451
NGER_16 BKW 1,661 1,162.7 – 2,159.3 Non-NGER_16 PRU 1,181
NGER_17 NUF 1,515 1,060.5 - 1,969.5 Non-NGER_17 LYC 1,166
NGER_18 RSG 1,194 835.8 – 1,552.2 Non-NGER_18 MML 1,116
NGER_19 OST 1,087 760.9 – 1,413.1 Non-NGER_19 SDL 1,097
NGER_20 SBM 1,054 737.8 – 1,370.2 Non-NGER_20 CGX 925
NGER_21 MGX 779 545.3 – 1,012.7 Non-NGER_21 DML 848
NGER_22 GRR 311 217.7 – 404.3 Non-NGER_22 ALK 333
NGER_23 SAR 291 203.7 – 378.3 Non-NGER_23 AQP 272

259
Table 1: NGER and Non-NGER Firms’ Market Capitalisation and the 30% range used to match Non-NGER with NGER firms - Continued
NGER - ID ASX
Listing
Code
Mkt Cap –
28/3/12
Millions
Mkt Cap –
25/10/12
Millions
70%-130% range Non-NGER - ID ASX
Listing
Code
Mkt Cap –
25/10/12
Millions
NGER_24 PEM 253 177.1 – 328.9 Non-NGER_24 BTR 207
NGER_25 NGF 180 126 – 234 Non-NGER_25 ATR 153
NGER_26 PAN 154 107.8 – 200.2 Non-NGER_26 EML 149
NGER_27 GNS 135 94.5 – 175.5 Non-NGER_27 AOH 142
NGER_28 KZL 95 66.5 – 123.5 Non-NGER_28 AGS 100
NGER_29 PSH 6 4.2 – 7.8 Non-NGER_29 AGY 6
NGER_30 NAV 4 2.8 – 5.2 Non-NGER_30 ATN 2
Non-NGER No Match ZIM 936
Non-NGER No Match SPH 635
Non-NGER No Match GBG 442
Non-NGER No Match SMM 434
Non-NGER No Match GDO 432
Non-NGER No Match IMD 308
Non-NGER No Match GRY 266
Non-NGER No Match TRY 421
Non-NGER No Match TGS 242
Non-NGER No Match EQX 211
Non-NGER No Match RMS 134
GICs Industry Group – Energy (7 NGER Companies and 7 Non-NGER Companies)
NGER_31 WPL 28,795 20,156.5 – 37,433.5
Nger_32 ORG 12,521 8,764.7 – 16,277.3 Non-NGER_32 OSH 10,050
NGER_33 STO 11,256 7,879.2 – 14,632.8
NGER_34 CTX 4,492 3,444.4 – 5,839.6
NGER_35 NHC 3,612 2,528.4 – 4,695.6
NGER_36 SOL 3,279 2,295.3 – 4,262.7
NGER_37 GCL 1,660 - 1,162 – 2,158 Non-NGER_37 AUT 1,746
Non-NGER No Match KAR 1,288

260
Table 1: NGER and Non-NGER Firms’ Market Capitalisation and the 30% range used to match Non-NGER with NGER firms - Continued
NGER - ID ASX
Listing
Code
Mkt Cap –
28/3/12
Millions
Mkt Cap –
25/10/12
Millions
70%-130% range Non-NGER - ID ASX
Listing
Code
Mkt Cap –
25/10/12
Millions
Non-NGER No Match AQA 1,111
Non-NGER No Match PDN 991
Non-NGER No Match ERA 706
Non-NGER No Match DLS 577
GICs Industry Group – Real Estate (6 NGER Companies and 6 Non-NGER Companies)
NGER_38 WDC 23,578 16,504.6 – 30,651.4
NGER_39 SGP 7,599 5,319.3 – 9,878.7 Non-NGER_39 GMG 6,816
NGER_40 GPT 6,201 4,340.7 – 8,061.3 Non-NGER_40 -
REMOVED
DXS 4,742
NGER_41 MGR 5,206 3,644.2 – 6,767.8
NGER_42 LLC REMOVED 4,991 3,493.7 – 6,488.3
NGER_43 THG 307 - 214.9 – 399.1 Non-NGER_43 CWP 305
NGER_44 CNP 38 26.6 – 49.4 Non-NGER_44 FLK 35
Non-NGER No Match IOF 1,823
Non-NGER No Match ALZ 1,690
Non-NGER No Match CQR 1,169
GICs Industry Group – Food, Beverage & Tobacco (6 NGER Companies and 6 Non-NGER Companies)
NGER_45 FGL 10,457 - 7,319.9 – 13,594.1
NGER_46 CCL 10,319 7,223.3 – 13,414.7
NGER_47 GNC 2,777 1,943.9 – 3,610.1
NGER_48 RIC 360 252 – 468 Non-NGER_48 AAC 428
NGER_49 WCB 207 144.9 – 269.1 Non-NGER_49 TGR 215
NGER_50 ELD 114 79.8 – 148.2 Non-NGER_50 WBA 81
Non-NGER No Match AVG 68
Non-NGER No Match SHV 66
Non-NGER No Match FNP 58
GICs Industry Group – Transportation (5 NGER Companies and 5 Non-NGER Companies)
NGER_51 TOL 3,026 2,118.2 – 3,933.8

261
NGER_52 QAN 3,001 2,100.7 – 3,901.3
Table 1: NGER and Non-NGER Firms’ Market Capitalisation and the 30% range used to match Non-NGER with NGER firms - Continued
NGER - ID ASX
Listing
Code
Mkt Cap –
28/3/12
Millions
Mkt Cap –
25/10/12
Millions
70%-130% range Non-NGER - ID ASX
Listing
Code
Mkt Cap –
25/10/12
Millions
NGER_53 VAH 1,027 718.9 – 1,335.1
NGER_54 REX 143 100.1 – 185.9
NGER_55 LAU 33 23.1 – 42.9 Non-NGER_55 SCC 25
Non-NGER No Match SYD 6,067
Non-NGER No Match AIX 1,837
Non-NGER No Match CLX 83
Non-NGER No Match CHR 21
GICs Industry Group – Commercial & Professional Services (5 NGER Companies and 5 Non-NGER Companies)
NGER_56 DOW 1,544 1,080.8 – 2,007.2
NGER_57 TPI 1,475 1,032.5 – 1,917.5
NGER_58 TSE 840 588 – 1,092 Non-NGER_58 SAI 801
NGER_59 SPT 634 - 443.8 – 824.2 Non-NGER_59 CAB 675
NGER_60 PMP 71 49.7 – 92.3 Non-NGER_60 ARA 64
Non-NGER No Match SEK 2,312
Non-NGER No Match MMS 956
GICs Industry Group – Capital Goods (5 NGER Companies and 5 Non-NGER Companies)
NGER_61 LEI 6,128 4,289. – 7,966.4
NGER_62 SVW 2,179 1,525.3 – 2,832.7 Non-NGER_62 MND 1,868
NGER_63 CSR 877 613.9 – 1,140.1 Non-NGER_63 CDD 1,098
NGER_64 BKN 817 571.9 – 1,062.1 Non-NGER_64 ASL 859
NGER_65 PPX 33 23.1 – 42.9 Non-NGER_65 NOD 26
Non-NGER No Match SST 775
GICs Industry Group – Banks (4 NGER Companies and 4 Non-NGER Companies)
NGER_66 CBA 91,852 64,296.4 - 119,407.6
NGER_67 WBC 77,855 54,498.5 - 101,211.5
NGER_68 ANZ 69,567 48,696.9 – 90,437.1
NGER_69 NAB 59,498 41,648.6 - 77,347.4
Non-NGER No Match BEN 3,214

262
Non-NGER No Match BOQ 2,306
Table 1: NGER and Non-NGER Firms’ Market Capitalisation and the 30% range used to match Non-NGER with NGER firms - Continued
NGER - ID ASX
Listing
Code
Mkt Cap –
28/3/12
Millions
Mkt Cap –
25/10/12
Millions
70%-130% range Non-NGER - ID ASX
Listing
Code
Mkt Cap –
25/10/12
Millions
Non-NGER No Match WBB 245
Non-NGER No Match HOM 70
GICs Industry Group – Utilities (2 NGER Companies and 3 Non-NGER Companies)
NGER_70 AEJ REMOVED 4,749 3,324.3 – 6,173.7 Non-NGER _70 -
REMOVED
APA 3,794
NGER_71 SPN REMOVED 3,539 2,477.3 – 4,600.7
NGER_72 ENV 1,367 956.9 – 1,777.1
NGER_73 ENE 507 354.9 – 659.1 Non-NGER_73 EWC 606
Non-NGER No Match DUE 2,277
Non-NGER No Match PTR 4
GICs Industry Group – Food & Staples Retailing (2 NGER Companies and 1 Non-NGER Company)
NGER_74 WOW 35,808 25,065.6 – 46,550.4
NGER_75 WES 34,827 24,378.9 – 45,275.1
NGER_76 MTS REMOVED 3,258 2,280.6- 4,235.4
Non-NGER No Match RLA 1
GICs Industry Group – Retailing (3 NGER Companies and 3 Non-NGER Companies)
NGER_77 HVN 2,087 1,460.9 – 2,713.1
NGER_78 SUL 1,759 1,231.3 - 2,286.7
NGER_79 DJS 1,374 961.8 – 1,786.2 Non-NGER_79 WTF 999
Non-NGER No Match PMV 916
Non-NGER No Match ARP 758
GICs Industry Group –Media (2 NGER Companies and 2 Non-NGER Companies)
NGER_80 AHD 1,106 774.2 – 1,437.8
NGER_81 FXJ 964 674.8 – 1,253.2 Non-NGER_81 SWM 1,233
Non-NGER No Match SKT 1,595
GICs Industry Group – Health Care Equipment & Services (2 NGER Companies and 2 Non-NGER Companies)
NGER_82 SHL 5,162 3,613.4 – 6,710.6 Non-NGER_82 RMD 6,131
NGER_83 RHC 4,738 3,316.6 - 6,159.4 Non-NGER_83 COH 4,061

263
Table 1: NGER and Non-NGER Firms’ Market Capitalisation and the 30% range used to match Non-NGER with NGER firms - Continued
NGER - ID ASX
Listing
Code
Mkt Cap –
28/3/12
Millions
Mkt Cap –
25/10/12
Millions
70%-130% range Non-NGER - ID ASX
Listing
Code
Mkt Cap –
25/10/12
Millions
GICs Industry Group – Consumer Services (2 NGER Companies and 2 Non-NGER Companies)
NGER_84 TAH 2,084 1,458.8 – 2,709.2 Non-NGER_84 SKC 1,788
NGER_85 AAD 515 360.5- 669.5 Non-NGER_85 DMP 674
GICs Industry Group - Insurance (2 NGER Companies and 2 Non-NGER Companies)
NGER_86 AMP 13,626 9,538.2 – 17,713.8 Non-NGER_86 QBE 16,299
NGER_87 SUN 12,441 8,708.7 – 16,173.3 Non-NGER_87 IAG 9,625
GICs Industry Group – Pharmaceuticals (1 NGER Company and 1 Non-NGER Company)
NGER_88 CSL 23,404 16,382.8 - 30,425.2
Non-NGER No Match MSB 1,729
GICs Industry Group – Telecommunication Services (1 NGER Company and 1 Non-NGER Company)
NGER_89 TLS 50,145 35,101.5 – 65,188.5
Non-NGER No Match 1,873

264
Referring to Table 1, the identification number for NGER firms is allocated
based on the 2011 data in the order of Materials; Energy; Real Estate; Food, Beverages
& Tobacco; Transportation; Commercial & Professional Services; Capital Goods;
Banks; Utilities; Food & Staples Retailing; Retailing; Media; Health Care Equipment &
Services; Consumer Services; Insurance; Pharmaceuticals and Telecommunication
Services sectors. The largest firm in the Materials sector commences with the first ID
number and the following firms within that sector are numbered in descending order
according to their market capitalisation. The numbering is continuous through each of
the following sectors with the largest firm for each sector receiving the first ID number
for that sector. The year component, the last two digits of the ID number changes to
match the specific year, for example NGER_15_05 identifies BSL in 2005. The match-
paired Non-NGER firm for BSL is Non-NGER_15_05 identifying EVN as the match-
paired firm and EVN’s data refers to the year 2005. When there is no match for a NGER
firm, the Non-NGER space is left blank. Where there are no matches for Non-NGER
firms, Non-NGER No Match is recorded.

265
Appendix 2 - Hackston and Milne's (1996) and Haque and Deegan's (2010) Checklists
Environmental Pollution Theme Checklist (Hackston & Milne 1996) Emission Accounting Issues (Haque & Deegan 2010)
1. Disclosures quantifying carbon emissions 1. The company measures, records and publicly reports direct/indirect carbon
emissions
2. Pollution control in the course of business operations and pollution
abatement identified by capital outlays, operating costs and research
& development expenses;
2. Carbon emission savings and offsets are calculated and publicly disclosed
3. Statements promoting the company as non-polluting or is in
compliance with laws and regulations;
3. The company has established an emissions baseline year to gauge future
trends in emission production
4. Statements highlighting pollution from operations will or has been
reduced;
4. Targets to reduce emissions are set
5. Environmental repair or protection during the course of production or
the use of natural
5. Third party assurance on carbon emission data
6. Environmental repair or protection during the course of production or
the use of natural resources such as reforestation or land reclamation
6. Policies are in place to purchase/develop renewable energy for business
operations
7. Conserving natural resources by recycling paper, water, glass, metals
and oils;
7. Carbon emission reductions are set for the supply chain
8. Selecting recycled materials for use; 8. Product labelling provides information on carbon emission reductions that
have been achieved
9. The efficient use of materials in production;
10. Commitments to anti-litter initiatives; and waste prevention

266
Appendix 3 - EITE
Table 1: Emissions-intensive trade-exposed activities
High EITE Activities Moderate EITE Activities
Production of bulk flat glass Production of glass containers
Production of methanol Production of white titanium dioxide (TiO2) pigment
Production of dry pelletised carbon black Integrated production of lead and zinc
Production of silicon Production of high purity ethanol
Smelting zinc Tissue paper manufacturing
Manufacture of newsprint Production of carbamide (urea)
Aluminium smelting Production of polyethylene
Production of magnesia Production of iron ore pellets
Dry pulp manufacturing Production of liquefied natural gas
Cartonboard manufacturing Production of magnetite concentrate
Packaging and industrial paper manufacturing Production of ceramic floor and wall tiles
Printing and writing paper manufacturing Manufacture of reconstituted wood-based panels
Alumina refining Production of hydrogen peroxide
Manufacture of carbon steel from cold ferrous feed Production of nickel
Production of clinker Production of helium
Production of copper
Production of ethene (ethylene)
Production of fused alumina
Integrated iron and steel manufacturing
Production of lime
Production of manganese
Petroleum refining
Production of sodium carbonate (soda ash) and sodium
bicarbonate
Production of synthetic rutile
Production of ammonium nitrate
Production of ammonia
Production of glass beads
Production of sodium silicate glass

267
High EITE Activities Moderate EITE Activities
Production of polymer grade propene (polymer grade propylene)
Production of rolled aluminium
Production of chlorine gas and sodium hydroxide (caustic soda)
solution
Production of coke oven coke
Production of fused zirconia
Production of dried distillers grains with solubles

268
Appendix 4 – Metals and Mining Industry
Table 1: NGER and Non-NGER firms that belong to the 'Metals and Mining' Industry
NGER Non-NGER
BHP Billiton Limited PanAust Limited
BlueScope Steel Limited Evolution Mining Limited
Rio Tinto Limited Perseu Mining Limited
Newcrest Mining Limited Lynas Corporation Limited
Fortescue Metal Group Limited Medusa Mining Limited
Macarthur Coal Limited Sundance Resources Limited
Iluka Resources Limited CGA Mining Limited
Oz Minerals Limited Discovery Metals Limited
Alumina Limited (Qld) Alkane Resources Limited
Sims Metal Management Limited Aquarius Platinum Limited
Resolute Mining Limited Blackthorn Resources Limited
OneSteel Limited Elemental Minerals Limited
St Barbara Limited Altona Mining Limited
Mount Gibson Iron Limited Alliance Resources Limited
Grange Resources Limited Argosy Minerals Limited
Saracen Mineral Holdings Ashburton Minerals Limited
Perilya Limited Zimplats Holdings Limited
Norton Goldfields Limited Shpere Minerals Limited
Panoramic Resources Limited Gindalbie Metals Ltd
Kagara Limited Gold One International Limited
Navigator Resources Limited Imdex Limited
Gryphon Minerals Limited
Troy Resources Limited
Equatorial Resources Limited
Ramelius Resources Limited

269
Appendix 5 – The Number of Annual and Sustainability Reports containing
voluntary carbon emissions information over the period 2005 through to 2011
Table 1: Annual and Sustainability Reports containing Voluntary Carbon Emission Disclosures
2005
2006
2007
2008
2009
2010
2011
Total # annual reports each year
NGER_AR
21
33
42
55
57
52
59
85
Non-NGER_AR
7
10
12
19
28
27
29
85
NGER_SR
19
26
29
34
35
42
40
Non-NGER_SR
3
5
7
6
6
6
8
Total 50
74
90
114
126
127
136

270
Appendix 6 – Descriptive Statistics – NGER & Non-NGER
The thesis also investigates the number of firms voluntarily disclosing carbon emissions, the level of quantified carbon emissions
and for NGER firms whether voluntary disclosures reflect emissions data released by the GEDO.
Table 1: - Descriptive Statistics for NGER & Non-NGER firms’ Annual Report Voluntary Carbon Emissions Disclosures 2005 – 2011
NGER Non-NGER
Statistics 2005 2006 2007 2008 2009 2010 2011 2005 2006 2007 2008 2009 2010 2011
Voluntary carbon emissions information reported in the Annual Report
Mean .25 .39 .49 .65 .67 .62 .69 .08 .12 .14 .22 .33 .32 .34
Median .00 .00 .00 1.00 1.00 1.00 1.00 .00 .00 .00 .00 .00 .00 .00
Std Deviat .434 .490 .503 .481 .473 .487 .464 .277 .324 .350 .419 .473 .468 .477
Minimum 0 0 0 0 0 0 0 0 0 0 0 0 0 0
Maximum 1 1 1 1 1 1 1 1 1 1 1 1 1 1
Quantified Carbon Emissions information in the Annual Report
Mean .06 .07 .09 .16 .19 .25 .26 0 .01 .04 .06 .02 0 .08
Median .00 .00 .00 .00 .00 .00 .00 0 .00 .00 .00 .00 0 .00
Std Deviat .237 .258 .294 .373 .393 .434 .441 0 .108 .186 .237 .152 0 .277
Minimum 0 0 0 0 0 0 0 0 0 0 0 0 0 0
Maximum 1 1 1 1 1 1 1 0 1 1 1 1 0 1
Whether Voluntary Carbon Emissions information matches the NGER Data
Mean 0 0 0 0 .02 .01 .06 N/A N/A N/A N/A N/A N/A N/A
Median 0 0 0 0 .00 .00 .00 N/A N/A N/A N/A N/A N/A N/A
Std Deviat 0 0 0 0 .152 .108 .237 N/A N/A N/A N/A N/A N/A N/A
Minimum 0 0 0 0 0 0 0 N/A N/A N/A N/A N/A N/A N/A
Maximum 0 0 0 0 1 1 1 N/A N/A N/A N/A N/A N/A N/A
The findings suggest a disproportionate number of NGER firms in 2005 and 2006 and Non-NGER firms over the research period are voluntarily reporting
minimal information in the annual report in comparison with the total sample. NGER firms’ voluntary carbon emission disclosures markedly increased from 2007
onwards. Quantified carbon emissions remain low for both groups. Further, evidence suggests NGER firms are not disclosing comparative carbon emissions data with
figures released under the NGER.

271
Each of these dummy variables, recorded in Table 1, is recorded as one when
evidence of disclosures occurs otherwise a zero is allotted. The findings suggest a
disproportionate number of NGER firms in 2005 and 2006 and Non-NGER firms over
the research period are voluntarily reporting minimal information in the annual report in
comparison with the total sample. NGER firms’ voluntary carbon emission disclosures
markedly increased from 2007 onwards. Quantified carbon emissions remain low for
both groups. Further, evidence suggests NGER firms are not disclosing comparative
carbon emissions data with figures released under the NGER Act in the annual reports.
The standard deviation for each of these variables indicates minimal variance around the
mean over the research period indicating firms across the sample consistently provided
minimal quantified data, and for NGER firms, minimal matching data with the NGER
figures.

272
Sustainability reports are also examined to investigate the number of firms voluntarily disclosing carbon emissions, the level of
quantified carbon emissions and for NGER firms whether voluntary disclosures reflect emissions data released by the GEDO. The details
are set out in Table 2.
Table 2: - Descriptive Statistics for NGER & Non-NGER firms’ Sustainability Report Voluntary Carbon Emissions Disclosures 2005 – 2011
NGER Non-NGER
Statistics 2005 2006 2007 2008 2009 2010 2011 2005 2006 2007 2008 2009 2010 2011
Voluntary carbon emissions information reported in the Sustainability Report
Mean .89 .94 0 0 0 0 0 .67 .67 0 0 0 0 0
Median 1.00 .99 0 0 0 0 0 1.00 1.00 0 0 0 0 0
Std Deviat .323 .236 0 0 0 0 0 .577 .577 0 0 0 0 0
Minimum 0 0 0 0 0 0 0 0 0 0 0 0 0 0
Maximum 1 1 0 0 0 0 0 1 1 0 0 0 0 0
Quantified Carbon Emissions information in the Sustainability Report
Mean .61 .78 .72 .94 .83 .89 .89 .33 .3 0 0 0 0 0
Median 1.00 1.00 1.00 1.00 1.00 1.00 1.00 .00 .00 0 0 0 0 0
Std Deviat .502 .428 .461 .236 .383 .323 .323 .577 .577 0 0 0 0 0
Minimum 0 0 0 0 0 0 0 0 0 0 0 0 0 0
Maximum 1 1 1 1 1 1 1 1 1 0 0 0 0 0
Whether Voluntary Carbon Emissions information matches the NGER Data
Mean 0 0 0 0 .06 .17 .17 N/A N/A N/A N/A N/A N/A N/A
Median 0 0 0 0 .00 .00 .00 N/A N/A N/A N/A N/A N/A N/A
Std Deviat 0 0 0 0 .236 .383 .383 N/A N/A N/A N/A N/A N/A N/A
Minimum 0 0 0 0 0 0 0 N/A N/A N/A N/A N/A N/A N/A
Maximum 0 0 0 0 1 1 1 N/A N/A N/A N/A N/A N/A N/A
The findings suggest where NGER and Non-NGER firms produced sustainability reports, voluntary carbon emission disclosures occurred in some form. A
dummy variable of one was given. As a result the descriptive statistics show no variance over the 2007 - 2011 period. Consequently statistics are not generated. NGER
firms’ quantification of carbon emission in sustainability reports increased between 2005 (0.61 mean) and 2011 (mean 0.89) though carbon emission disclosures that
matched the NGER data remained low over the first three years of reporting (2009 – 2011).

273
As can be seen in Table 2 above, a dummy variable is used for each variable
recording whether carbon emission information is reported, whether the carbon
emission information is quantified and whether the carbon emissions information
matches the NGER data in the sustainability reports. When voluntary disclosures are
recorded a one is given otherwise a zero. The findings suggest NGER firms’
quantification of carbon emission in sustainability reports increased between 2005 (0.61
mean) and 2011 (mean 0.89) though carbon emission disclosures that matched the
NGER data remained low over the first three years of reporting (2009 – 2011).

274
Appendix 7 – Friedman’s Test Mean Ranks – Keywords, Words, Sentences, Table,
Graphs and Figures
Further information is gained from the graphs comparing the Mean Ranks for
each of the NGER and Non-NGER firms’ keywords, words, sentences, graphs, tables
and figures that appear in the annual reports and sustainability reports. This information
is set out in the following graphs. The NGER firms’ use of keywords significantly
increased above Non-NGER firms’ use of keywords from 2006 onwards (Graph 1).
Graph 1 Friedman's Test Mean Rank for Keyword for NGER and Non-NGER firms' annual
reports 2005 - 2011
This period corresponds with legislation being mooted by the COAG in 2006
and later enacted in Parliament in 2007. NGER firms’ use of keywords remained above
Non-NGER firms until 2010 when the use of NGER keywords paralleled Non-NGER
firms’ use of keywords. Graph 2 compares the results of the Friedman’s Test Mean
Rank for Words for NGER and Non-NGER firms.
0
0.5
1
1.5
2
2.5
3
3.5
4
4.5
5
2005 2006 2007 2008 2009 2010 2011
NGER ARs Mean RankKeywords
Non-NGER ARs MeanRank Keywords

275
Graph 2 Friedman's Test Mean Rank for Words for NGER and Non-NGER firms' annual reports
2005 - 2011
A similar pattern, as outlined by the keyword results, is noted for Mean Rank for
Words. This pattern remains consistent with the Mean Rank for Sentences (Graph 3)
and Graphs (Graph 4).
Graph 3 Friedman's Test Mean Rank for Sentences for NGER and Non-NGER firms' annual
reports 2005 - 2011
0
0.5
1
1.5
2
2.5
3
3.5
4
4.5
5
2005 2006 2007 2008 2009 2010 2011
NGER ARs Mean RankWords
Non-NGER ARs MeanRank Words
0
0.5
1
1.5
2
2.5
3
3.5
4
4.5
5
2005 2006 2007 2008 2009 2010 2011
NGER ARs Mean RankSentences
Non-NGER ARs MeanRank Sentences

276
As indicated in Graph 4, NGER firms’ use of graphs outpaced Non-NGER firms
from 2008 onwards though dropped back to Non-NGER firms’ approximate output of
graphs by 2011.
Graph 4 Friedman's Test Mean Rank for Graphs for NGER and Non-NGER firms' annual reports
2005 - 2011
A comparison of the Mean Rank for Tables is presented in Graph 5.
Graph 5 Friedman's Test Mean Rank for Table for NGER and Non-NGER firms' annual reports
2005 - 2011
3.3
3.4
3.5
3.6
3.7
3.8
3.9
4
4.1
4.2
4.3
4.4
2005 2006 2007 2008 2009 2010 2011
NGER ARs Mean RankGraphs
Non-NGER ARs MeanRank Graphs
3.4
3.5
3.6
3.7
3.8
3.9
4
4.1
4.2
4.3
4.4
2005 2006 2007 2008 2009 2010 2011
NGER ARs Mean RankTables
Non-NGER ARs MeanRank Tables

277
The above graph indicates the use of tables increased significantly from 2006
onwards by NGER firms and remained above Non-NGER firms’ use of tables except in
the implementation year of the NGER Act, 2008.
A comparison of the Friedman’s Test Mean Rank for Figures is presented in
Graph 6.
Graph 6 Friedman's Test Mean Rank for Figures for NGER and Non-NGER firms' annual reports
2005 - 2011
The use of figures by NGER firms started to increase from the period 2006
onwards until 2010, though in 2011 the use of figures dropped below the Non-NGER
firms’ use. Overall, the above graphs portray a significant increase in voluntary
disclosures in the annual reports by NGER reporting firms in comparison with Non-
NGER firms from 2006 onwards.
Graphs comparing the Mean Ranks for each of the NGER and Non-NGER
keywords, words, sentences, graphs, tables and figures taken from the sustainability
reports are set out below in Graphs 7, 8, 9, 10, 11 and 12.
3.8
3.85
3.9
3.95
4
4.05
4.1
4.15
2005 2006 2007 2008 2009 2010 2011
NGER ARs Mean RankFigures
Non-NGER ARs MeanRank Figures

278
Graph 7 Friedman's Test Mean Rank for Keyword for NGER and Non-NGER firms' sustainability
reports 2005 - 2011
The Graph 7 compares the NGER and Non-NGER firms’ sustainability reports’
keyword mean ranks. NGER firms’ mean rank for keywords steadily increased over the
period. NGER firms are large, heavy emitters that are more visual to stakeholders and as
a result, more sensitive to changing societal attitudes to climate change. This may
reflect NGER firms’ steadily increased use of keywords. Even though Non-NGER firms
are smaller in size, are not heavy emitters and do not have as high a visual profile, the
uncertainty surrounding pending legislation in 2007 may have contributed to higher use
of keywords in Non-NGER sustainability reports during 2007. Again in 2010 the mean
keywords increased above the NGER mean rank keywords before dropping back to a
similar level in 2011. The introduction of a carbon tax may have introduced a
legitimacy threat to Non-NGER firms subsequently influencing Non-NGER firms to
increase the use of keywords above NGER firms during 2010. A similar pattern is noted
in the following graphs for the Mean Rank for Words (Graph 8), Sentences (Graph 9),
Graphs (Graph 10) and Tables (Graph 11).
0
1
2
3
4
5
6
2005 2006 2007 2008 2009 2010 2011
NGER SRs KeywordMean Rank
Non-NGER SRsKeyword Mean Rank

279
Graph 8 Friedman's Test Mean Rank for Words for NGER and Non-NGER firms' sustainability
reports 2005 - 2011
Graph 9 Friedman's Test Mean Rank for Sentences for NGER and Non-NGER firms'
sustainability reports 2005 - 2011
0
1
2
3
4
5
6
2005 2006 2007 2008 2009 2010 2011
NGER SRs Mean RankWords
Non-NGER SRs MeanRank Words
0
1
2
3
4
5
6
2005 2006 2007 2008 2009 2010 2011
NGER SRs Mean RankSentences
Non-NGER SRs MeanRank Sentences

280
Graph 10 Friedman's Test Mean Rank for Graphs for NGER and Non-NGER firms' sustainability
reports 2005 - 2011
Graph 10 highlights the changes in the use of graphs in the sustainability reports.
NGER firms’ sustainability reports tend to use graphs more than Non-NGER firms up
to 2009 when NGER firms’ use of graphs decreased below Non-NGER firms. NGER
firms consistently increased the use of tables between 2005 and 2011 (Graph 11)
however, Non-NGER firms’ use of tables was more flexible with changing levels of
usage fluctuating between each year.
Graph 11 Friedman's Test Mean Rank for Tables for NGER and Non-NGER firms' sustainability
reports 2005 - 2011
0
1
2
3
4
5
6
2005 2006 2007 2008 2009 2010 2011
NGER SRs Mean RankGraphs
Non-NGER SRs MeanRank Graphs
0
1
2
3
4
5
6
2005 2006 2007 2008 2009 2010 2011
NGER SRs Mean RankTables
Non-NGER SRs MeanRank Tables

281
As indicated in Graph 12, Non-NGER firms are consistently using figures over
the period. Even though NGER firms’ use of figures increases over the research period
the trend tends to be more erratic.
Graph 12 Friedman's Test Mean Rank for Figures for NGER and Non-NGER firms' sustainability
reports 2005 - 2011
The results of the Friedman Tests mean ranks for keywords, words, sentences,
graphs, tables and figures that compare the NGER and the Non-NGER firms’ combined
annual and sustainability reports follow in Graphs 13, 14, 15, 16, 17 and 18.
0
0.5
1
1.5
2
2.5
3
3.5
4
4.5
5
2005 2006 2007 2008 2009 2010 2011
NGER SRs Mean RankFigures
Non-NGER SRs MeanRank Figures

282
Graph 13 Friedman's Test Mean Rank for Keyword for NGER and Non-NGER firms’ combined
annual and sustainability reports 2005 - 2011
As indicated in Graph 13, the mean rank keywords for NGER firms increased
significantly above Non-NGER firms from 2007 until 2011. The NGER Act was
legislated in 2007 reflecting the growing importance for heavy emitters to internalise an
externality, carbon emissions. The increased use of keywords by NGER firms (heavy
emitters) paralleled society’s increasing awareness and the requirement to report carbon
emissions’ data to the government.
Graph 14 Friedman's Test Mean Rank for Word Count for NGER and Non-NGER firms’
combined annual and sustainability reports 2005 - 2011
0
1
2
3
4
5
6
2005 2006 2007 2008 2009 2010 2011
NGER Keyword MeanRank
Non-NGER KeywordMean Rank

283
The mean rank for word count for NGER firms (Graph 14) follows a similar
trend as the mean rank for keyword. This pattern continues for each of the remaining
variables shown in Graphs 15, 16, 17 and 18.
Graph 15 Friedman's Test Mean Rank for Sentence Count for NGER and Non-NGER firms’
combined annual and sustainability reports 2005 - 2011
Graph 16 Friedman's Test Mean Rank Graphs for NGER and Non-NGER firms’ combined annual
and sustainability reports 2005 - 2011
0
1
2
3
4
5
6
2005 2006 2007 2008 2009 2010 2011
NGER Sentence CountMean Rank
Non-NGER SentenceCount Mean Rank
0
0.5
1
1.5
2
2.5
3
3.5
4
4.5
5
2005 2006 2007 2008 2009 2010 2011
NGER Graphs MeanRank
Non-NGER GraphsMean Rank

284
Graph 17 Friedman's Test Mean Rank Tables for NGER and Non-NGER firms’ combined annual
and sustainability reports 2005 - 2011
Graph 18 Friedman's Test Mean Rank Figures for NGER and Non-NGER firms’ combined annual
and sustainability reports 2005 - 2011
Figures are not used in 2006 by Non-NGER firms or in 2007 by NGER firms,
Graph
0
0.5
1
1.5
2
2.5
3
3.5
4
4.5
5
2005 2006 2007 2008 2009 2010 2011
NGER Tables MeanRank
Non-NGER TablesMean Rank
0
0.5
1
1.5
2
2.5
3
3.5
4
2005 2006 2007 2008 2009 2010 2011
NGER Figures MeanRank
Non-NGER FiguresMean Rank

285
Appendix 8 – Logistic Regression Classification Tables and the ‘Proportional by Chance Accuracy Criteria’
Block 0 - Predicted Proportional by Chance
Accuracy Criteria #
Block 1 - Predicted
NGER VDISC Percentage VDISC Percentage
Observed 0 1 Correct Observed 0 1 Correct
Step 0 VDISC 0 0 250 0.0 Step 1 VDISC 142 108 56.8
1 0 308 100.00 84 224 72.7
Overall Percentage 55.2 64.4% 65.6
Non-NGER
Step 0 VDISC 0 405 0 100.00 Step 1 VDISC 380 25 93.8
1 124 0 0.0 76 48 438.7
Overall Percentage 76.6 80.1% 80.9
Combined
Step 0 VDISC 0 655 0 100.00 Step 1 VDISC 521 134 79.5
1 432 0 0.0 172 260 60.2
Overall Percentage 60.3 65.1% 71.8
# Calculation of the Proportional by Chance Accuracy Criteria
Block 0 is the evaluation of the predicted percentage prior to logistic regression analysis and Block 1 is the evaluation of the predicted percentage after the analysis. Based on the
Block 0 - Predicted figures the following totals are calculated for each NGER, Non-NGER and Combined:
1. Total number of firm years that did not disclose (VDISC 0) divided by the total sample (VDISC 0 + 1)
2. Total number of firm years that did disclose (VDISC 1) divided by the total sample (VDISC 0 + 1)
3. The answers in step 1 and 2 are each squared and then added together
4. This gives the ‘Proportional by Chance Accuracy Rate’
5. The answer in step 5 is then multiplied by 1.25 to calculate the ‘Proportional by Chance Accuracy Criteria’.
If the Block 1 – Predicted Overall Percentage in the ‘Predicted Percentage Correct’ column is higher than the ‘Proportional by Chance Accuracy Criteria’ then the criteria for the
classification is satisfied and the recommended accuracy improvement rate is met highlighting the strength of the logistic regression analysis.

286