Embed Size (px)
Citation preview

Correlations between Energy and Displacement Demands for Performance-Based Seismic
Engineering
FABRIZIO MOLLAIOLI,1 SILVIA BRUNO,1 LUIS DECANINI,1 and RODOLFO SARAGONI2
Abstract—The development of a scientific framework for
performance-based seismic engineering requires, among other
steps, the evaluation of ground motion intensity measures at a
site and the characterization of their relationship with suitable
engineering demand parameters (EDPs) which describe the per-
formance of a structure. In order to be able to predict the damage
resulting from earthquake ground motions in a structural system, it
is first necessary to properly identify ground motion parameters
that are well correlated with structural response and, in turn, with
damage. Since structural damage during an earthquake ground
motion may be due to excessive deformation or to cumulative
cyclic damage, reliable methods for estimating displacement
demands on structures are needed. Even though the seismic per-
formance is directly related to the global and local deformations of
the structure, energy-based methodologies appear more helpful in
concept, as they permit a rational assessment of the energy
absorption and dissipation mechanisms that can be effectively
accomplished to balance the energy imparted to the structure.
Moreover, energy-based parameters are directly related to cycles of
response of the structure and, therefore, they can implicitly capture
the effect of ground motion duration, which is ignored by con-
ventional spectral parameters. Therefore, the identification of
reliable relationships between energy and displacement demands
represents a fundamental issue in both the development of more
reliable seismic code provisions and the evaluation of seismic
vulnerability aimed at the upgrading of existing hazardous facili-
ties. As these two aspects could become consistently integrated
within a performance-based seismic design methodology, under-
standing how input and dissipated energy are correlated with
displacement demands emerges as a decisive prerequisite. The aim
of the present study is the establishment of functional relationships
between input and dissipated energy (that can be considered as
parameters representative of the amplitude, frequency content and
duration of earthquake ground motions) and displacement-based
response measures that are well correlated to structural and non-
structural damage. For the purpose of quantifying the EDPs to be
related to the energy measures, for comprehensive range of ground
motion and structural characteristics, both simplified and more
accurate numerical models will be used in this study for the esti-
mation of local and global displacement and energy demands.
Parametric linear and nonlinear time-history analyses will be per-
formed on elastic and inelastic SDOF and MDOF systems, in order
to assume information on the seismic response of a wide range of
current structures. Hysteretic models typical of frame force/dis-
placement behavior will be assumed for the local inelastic cyclic
response of the systems. A wide range of vibration periods will be
taken into account so as to define displacement, interstory drift and
energy spectra for MDOF systems. Various scalar measures related
to the deformation demand will be used in this research. These
include the spectral displacements, the peak roof drift ratio, and the
peak interstory drift ratio. A total of about 900 recorded ground
motions covering a broad variety of condition in terms of frequency
content, duration and amplitude will be used as input in the
dynamic analyses. The records are obtained from 40 earthquakes
and grouped as a function of magnitude of the event, source-to-site
condition and site soil condition. In addition, in the data-set of
records a considerable number of near-fault signals is included, in
recognition of the particular significance of pulse-like time histo-
ries in causing large seismic demands to the structures.
1. Introduction
Research on performance-based seismic engi-
neering poses many challenges, among them being
the need for a reliable procedure to predict structural
damage and collapse as a function of the earthquake
ground motion intensity. A large source of variability
in seismic performance assessment arises from sim-
plification in defining earthquake intensity relative
to the proper damaging consequences of ground
motions on structures.
Usually, the intensity of ground shaking and the
demand on structures have been characterized using
parameters such as peak ground acceleration as well
as strength-based parameters such as response spec-
trum ordinates (e.g., pseudo-spectral acceleration),
1 Sapienza University of Rome, Rome, Italy. E-mail:
[email protected] University of Chile, Santiago, Chile.
Pure Appl. Geophys. 168 (2011), 237–259
� 2010 Birkhauser / Springer Basel AG
DOI 10.1007/s00024-010-0118-9 Pure and Applied Geophysics

that represent the maximum amplitude of shaking for
structures with specified natural periods and damping
ratios.
Various studies suggested that improved perfor-
mance parameters, such as deformation and energy
demands, could be considered explicitly during seis-
mic design (FAJFAR and GASPERSIC, 1996; PRIESTLEY
and CALVI, 1997; TERAN-GILMORE, 1996, 1998; KRA-
WINKLER et al., 1999; LEELATAVIWAT et al., 1999;
BERTERO and BERTERO, 2002).
Actually, having been considered in recent design
guidelines, the displacement-based approach is more
familiar (WHITTAKER et al., 1998; BOMMER and
ELNASHAI, 1999; GUPTA and KRAWINKLER, 2000;
MIRANDA, 2000, 2001; BORZI et al., 2001; MIRANDA
and ASLANI, 2002; DECANINI et al., 2003; KRAWINKLER
et al., 2003); on the contrary there is a considerably
lesser amount of research on the advancement of an
energy-based methodology (BERTERO and UANG,
1992; FAJFAR and VIDIC, 1994; TERAN-GILMORE, 1998;
LEELATAVIWAT et al., 1999; CHAI and FAJFAR, 2000;
BERTERO and BERTERO, 2002; AKBAS and SHEN, 2002;
LEELATAVIWAT et al., 2009), that is mainly focused on
satisfying the energy balance equation using a
monotonically increasing deformation approach.
However, it has long been recognized that to
understand the demands placed on structures during
earthquakes one might also employ an energy-based
approach, especially in assessing the damage poten-
tial of ground motions (AKIYAMA, 1985; DECANINI and
MOLLAIOLI, 1998, 2001; MANFREDI, 2001; KALKAN and
KUNNATH, 2007, 2008).
Energy-based methodologies, beyond the poten-
tiality of designing earthquake-resistant structures by
balancing energy demands and supplies, allow one
to characterize the different types of time histories
(impulsive, periodic, with long-duration pulses, etc.)
which may correspond to an earthquake ground
shaking properly, considering the dynamic response
of a structure simultaneously (MOLLAIOLI et al.,
2006).
Since energy is a cumulative measure of ground
shaking, it also captures duration effects. In fact, it is
well known that a certain amount of seismic damage
can be due not only by the maximum response such
as force or lateral displacement, but also by inelastic
excursions below the maximum response. Therefore,
energy demand parameters can be considered as
reliable tools to use in seismic hazard analysis, for
selecting earthquake scenarios, and designing a sim-
ulated earthquake for many types of engineering
analyses (CHAPMAN, 1999; CHOU and UANG, 2000;
GHOSH and COLLINS, 2002; HAO 2002; HORI and INOUE,
2002; REINOSO et al., 2002; RIDDELL and GARCIA,
2002; ORDAZ et al., 2003; TRIFUNAC, 2008). Finally,
using the energy concept and the energy balance
equation allows one to optimize the design and
detailing and to select strategies and techniques for
innovative control or protective systems, such as base
isolation and passive energy dissipation devices, in
the earthquake-resistant design of new structures or in
the seismic retrofitting of existing buildings.
Energy-based demand can be also considered as a
useful link between the characterization of the seis-
mic hazard based on available databases, containing
data collected by existing networks, with that based
on modelling techniques developed from the knowl-
edge of the seismic source process and of the
propagation of seismic waves, which can realistically
simulate the ground motion associated with a given
earthquake scenario (DECANINI et al., 1999; PANZA
et al., 2000, 2001, 2003a, b.
In order to characterize the damage potential of
earthquake ground motion it is, therefore, necessary
to properly evaluate the degree of correlation
between energy demand parameters, herein consid-
ered as indexes of the seismic hazard at a given site,
with structural response parameters, such as dis-
placement and drift demands, that are representative
of damage suffered by structures.
The fundamental steps of an energy-based meth-
odology approach to the seismic demand evaluation
for structures can be summarized in Fig. 1. Ground
motion time histories, which may include both
ground motion records (comprising accelerograms
recorded in both ordinary and special site conditions
such as on soft soil, in the near field, with long-
duration pulses), and broad-band synthetic accelero-
grams, all characterized by an appropriate set of
ground motion parameters, are used to perform
dynamic analyses on SDOF and/or MDOF systems.
Systems response to the energy and deformation
demands imposed by the dynamic excitation and
dependent on the hysteretic behavior, involving
238 F. Mollaioli et al. Pure Appl. Geophys.
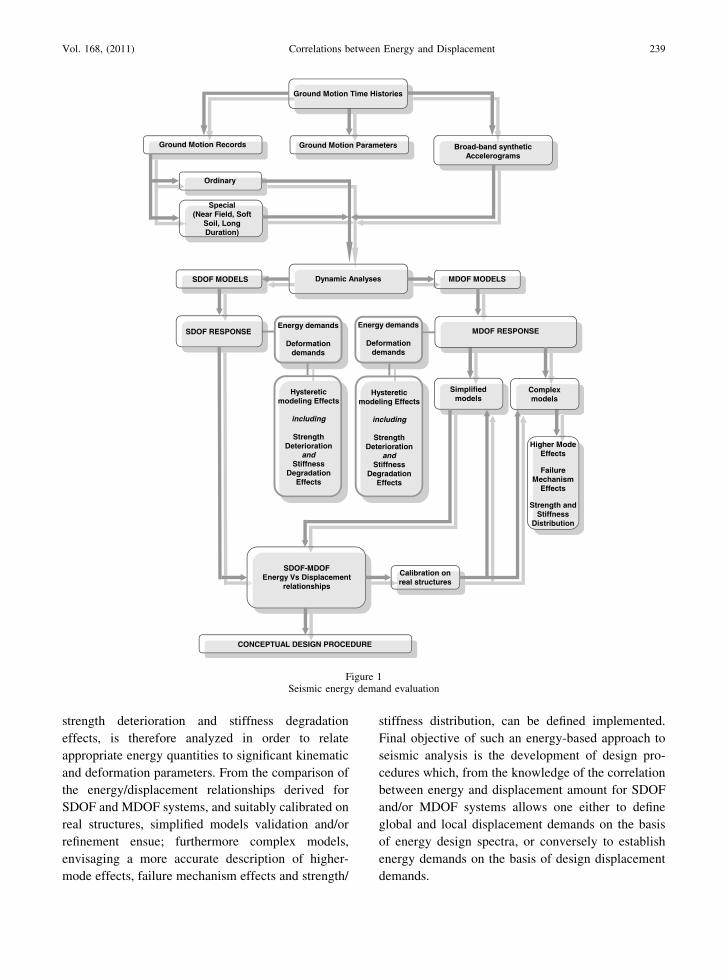
strength deterioration and stiffness degradation
effects, is therefore analyzed in order to relate
appropriate energy quantities to significant kinematic
and deformation parameters. From the comparison of
the energy/displacement relationships derived for
SDOF and MDOF systems, and suitably calibrated on
real structures, simplified models validation and/or
refinement ensue; furthermore complex models,
envisaging a more accurate description of higher-
mode effects, failure mechanism effects and strength/
stiffness distribution, can be defined implemented.
Final objective of such an energy-based approach to
seismic analysis is the development of design pro-
cedures which, from the knowledge of the correlation
between energy and displacement amount for SDOF
and/or MDOF systems allows one either to define
global and local displacement demands on the basis
of energy design spectra, or conversely to establish
energy demands on the basis of design displacement
demands.
Dynamic Analyses
SDOF RESPONSE
Simplified models
Higher Mode Effects
Failure
Mechanism Effects
Strength and
Stiffness Distribution
Calibration on real structures
CONCEPTUAL DESIGN PROCEDURE
Ground Motion Records Ground Motion Parameters
Special (Near Field, Soft
Soil, Long Duration)
Ordinary
SDOF MODELS MDOF MODELS
Hysteretic modeling Effects
including
Strength
Deterioration and
Stiffness Degradation
Effects
Energy demands
Deformation demands
Hysteretic modeling Effects
including
Strength
Deterioration and
Stiffness Degradation
Effects
SDOF-MDOF Energy Vs Displacement
relationships
Energy demands
Deformation demands
Ground Motion Time Histories
Broad-band synthetic Accelerograms
MDOF RESPONSE
Complex models
Figure 1Seismic energy demand evaluation
Vol. 168, (2011) Correlations between Energy and Displacement 239

In the present paper, the characterization of the
correlations between energy and displacement
demands of linear and nonlinear single-degree-of-
freedom (SDOF) and multi-degree-of-freedom
(MDOF) systems, representative of actual framed
structures, is investigated. A simplified MDOF model
is used so as to provide concise results on the seismic
behaviour of the different structural systems sub-
jected to such a large number of strong motion
records. A stiffness-degrading hysteretic model is
used to represent the cyclic behavior of the frames in
each story.
In such analyses, the influence of source-to-site-
distance, magnitude, soil class, and ground motion
features (severity, duration, amplitude and frequency
content) on earthquake input and hysteretic energy as
well as their distribution in building systems, is
examined.
Dynamic analyses are performed by subjecting the
SDOF and MDOF systems to a large set of earthquake
records, representative of different scenario earth-
quakes, including near-fault ground motions.
2. Simplified Modeling of MDOF Systems
Several research papers have assessed the energy
and displacement demands in single-degree-of-free-
dom (SDOF) systems. Quite the reverse, only little
attention was devoted to energy analyses for multi-
story building structures (CHOU and UANG, 2003;
DECANINI et al., 2000; ESTES and ANDERSON, 2002;
SHEN and AKBAS, 1999; LEELATAVIWAT, et al., 2002);
therefore, a broad extension of the evaluation of such
demands to multi-degree-of-freedom (MDOF) sys-
tems is essentially needed.
As a matter of fact, there is a pressing requirement
to carry out analytical and experimental studies on
the possibility to consider the results obtained from
analysis of SDOF systems also applicable to MDOF
systems. Therefore, since real structures, and partic-
ularly frame building structures, can effectively be
represented as MDOF systems, it is necessary to
develop reliable methods for (1) evaluating how
SDOF spectra for a given parameter can be affected
by the MDOF response of real structures and (2)
modifying the spectra obtained for SDOF systems so
that the effects of MDOF systems behaviour are taken
into account.
It must be stressed that nonlinear dynamic anal-
yses of three-dimensional MDOF systems, besides
requiring computational effort and time consump-
tion, are founded on many assumptions involving
many uncertainties, the reliability of the predicted
performance is questionable and very difficult to
ascertain. The main uncertainty factors include the
reliability of the model adopted and its dynamic
characteristics, particularly in its nonlinear range
of behaviour, and the dynamic characteristics of
the ground motion. Nevertheless, simplified MDOF
models, such as stick models with one degree
of freedom per floor, or even equivalent SDOF
models, can successfully be adopted to represent
low, medium and high-rise frame structures having
sufficiently regular configuration and structural lay-
out, with evident advantages in the accomplishment
of a considerable number of dynamic analyses and of
a wide-ranging parametric studies in reasonably
extended lapses of time. Simplified models usually
consider two-dimensional shear elements with only
one translational degree of freedom per floor. For-
mulation of such simplified models requires the
knowledge of the structure’s reactive mass, lateral
stiffness, vibration mode shape and frequency, and
the lateral strength-displacement constitutive rela-
tion for each story. In the case of low-rise structures
with regular configuration and structural layout in
both plan and height, equivalent SDOF models may
even be adopted.
Since the objective of the present research is
to carry out the assessment of both energy and
displacement demands in multi-degree-of-freedom
(MDOF) systems, for the need of generality of the
results and hence of the conclusions, the MDOF
systems selected as representative of structural frame
models are not intended to correspond to specific
structures. Instead, a simplified model was used in
this study for the estimation of the dynamic responses
to different ground motions, so that the sensitivity of
results to different mechanical properties can be
readily evaluated. Dynamic analyses were performed
using an equivalent discrete shear-type model (ESTM
model), which allowed a relatively simple procedure
in the integration of the equation of the motion
240 F. Mollaioli et al. Pure Appl. Geophys.
(DECANINI et al., 2002, 2004). The effectiveness of the
ESTM model was also validated by comparing the
results with those derived from more detailed non-
linear time histories analyses (MURA, 2003; DECANINI
et al., 2004). The implementation of a simplified
modeling permitted us to achieve a spectral repre-
sentation of energy and displacement demands at
both global and local level and to perform an exten-
sive parametric investigation on different structures.
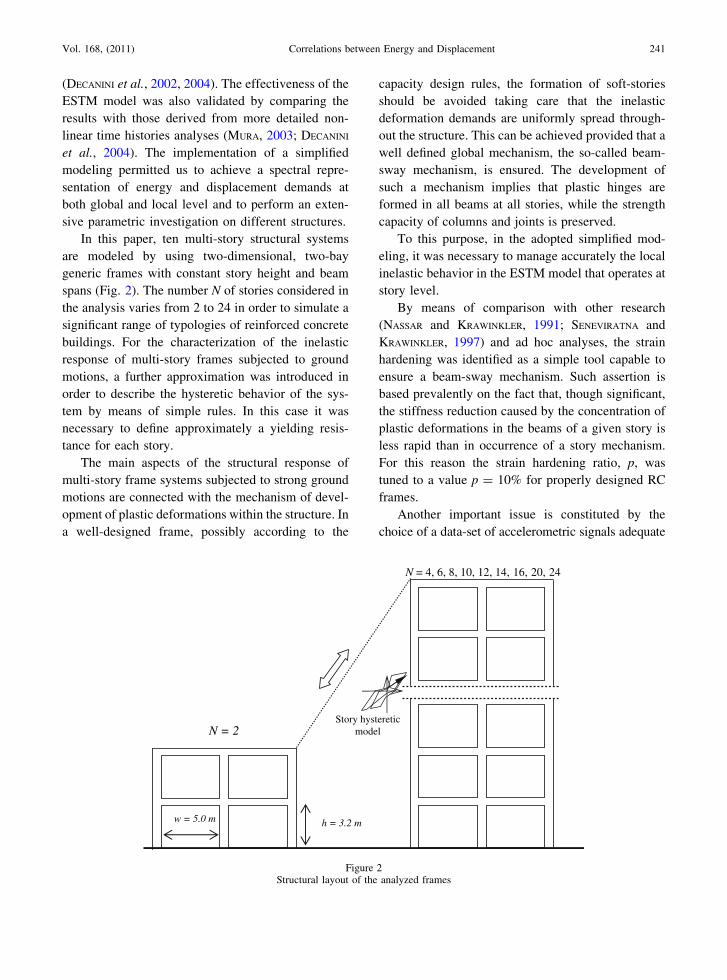
In this paper, ten multi-story structural systems
are modeled by using two-dimensional, two-bay
generic frames with constant story height and beam
spans (Fig. 2). The number N of stories considered in
the analysis varies from 2 to 24 in order to simulate a
significant range of typologies of reinforced concrete
buildings. For the characterization of the inelastic
response of multi-story frames subjected to ground
motions, a further approximation was introduced in
order to describe the hysteretic behavior of the sys-
tem by means of simple rules. In this case it was
necessary to define approximately a yielding resis-
tance for each story.
The main aspects of the structural response of
multi-story frame systems subjected to strong ground
motions are connected with the mechanism of devel-
opment of plastic deformations within the structure. In
a well-designed frame, possibly according to the
capacity design rules, the formation of soft-stories
should be avoided taking care that the inelastic
deformation demands are uniformly spread through-
out the structure. This can be achieved provided that a
well defined global mechanism, the so-called beam-
sway mechanism, is ensured. The development of
such a mechanism implies that plastic hinges are
formed in all beams at all stories, while the strength
capacity of columns and joints is preserved.
To this purpose, in the adopted simplified mod-
eling, it was necessary to manage accurately the local
inelastic behavior in the ESTM model that operates at
story level.
By means of comparison with other research
(NASSAR and KRAWINKLER, 1991; SENEVIRATNA and
KRAWINKLER, 1997) and ad hoc analyses, the strain
hardening was identified as a simple tool capable to
ensure a beam-sway mechanism. Such assertion is
based prevalently on the fact that, though significant,
the stiffness reduction caused by the concentration of
plastic deformations in the beams of a given story is
less rapid than in occurrence of a story mechanism.
For this reason the strain hardening ratio, p, was
tuned to a value p = 10% for properly designed RC
frames.
Another important issue is constituted by the
choice of a data-set of accelerometric signals adequate
N = 2
N = 4, 6, 8, 10, 12, 14, 16, 20, 24
h = 3.2 m w = 5.0 m
Story hysteretic model
Figure 2Structural layout of the analyzed frames
Vol. 168, (2011) Correlations between Energy and Displacement 241

to represent the major characteristics of the seismic
demand on the analyzed structures.
Recorded ground motions covering a broad vari-
ety of condition in terms of frequency content,
duration and amplitude were appositely selected. In
addition, from the recognition of the particular sig-
nificance of pulse-like time histories in causing large
energy and displacement demands to the structures, a
considerable number of near-fault signals was inclu-
ded in the data-set of records, taking into account the
presence of both forward and backward directivity
effects.
3. Correlation of Damage Measures to ground
motion parameters
Estimates of the seismic performance of structures
has conventionally been based on taking the pseudo-
spectral acceleration into account, among a variety of
ground motion parameters. However, it is now widely
recognized that performance predictions traditionally
based on pseudo-spectral acceleration are subject of a
great deal of variability, which in turn requires con-
siderable effort to obtain results with a satisfactory
level of confidence. This is the reason why, in the
present study, the capability of various ground
motion Intensity Measures in predicting deformation
levels for a structure has preliminarily been investi-
gated, in order to identify parameters providing the
best levels of correlation to structural damage mea-
sures. Further developments may involve improving
vector hazard capabilities, since the nonlinear
response of many structures is described by multiple
Intensity Measures (LUCO et al., 2005).
A series of MDOF systems, described through the
ESTM models introduced in the previous section and
representative of frame buildings of various heights
and ductilities, were subjected to a large number
(about 900) of strong ground motions recorded during
40 past and recent earthquakes (Table 1). Such
records represent a significant variety of seismic
conditions in terms of magnitude, source-to-site dis-
tance, fault mechanism. In particular, strong ground
motions include near-source and ordinary ground
motions, recorded at distances, Df, less than and
greater than 5 km from the causative fault,
respectively; besides, they are grouped according to
the EC8 four soil classes, A, B, C, D (with stiffness
decreasing from A, rock or firm soil, to D, soft soil),
and to two magnitude intervals, 5.4 B Mw B 6.2 and
6.5 B Mw B 7.1. Several ground motion parameters
or intensity measures such as, for instance, peak
ground acceleration, PGA, peak ground velocity,
PGV, arias intensity, IA, Housner intensity, IH, spec-
tral acceleration, Sa, input energy-equivalent velocity,
defined as VEI¼
ffiffiffiffiffiffiffiffiffiffiffiffiffi
2Ei=mp
(where Ei is the input
energy and m the system mass) were preliminarily
been evaluated for each record. Then, ground motion
parameters were related to the maximum interstory
drift, IDImax, chosen as representative structural
damage index, measured through the nonlinear
dynamic analyses of the MDOF systems.
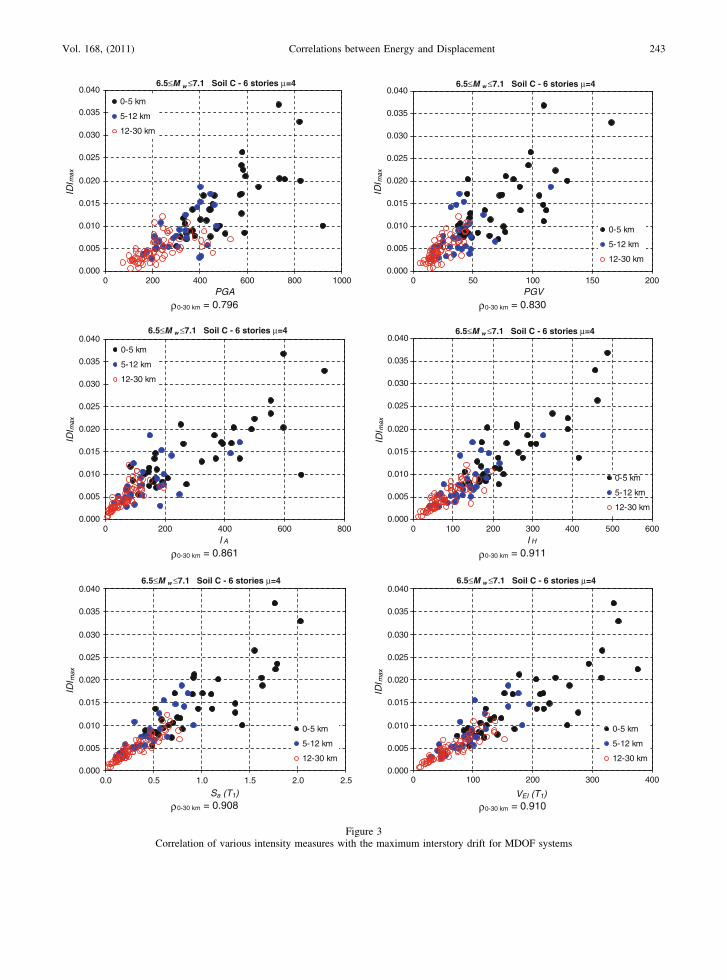
The extent of the correlation between the struc-
tural response index and ground motion intensity
measures can be appreciated observing the relation-
ships between these variables graphically (Figs. 3, 4).
Data points shown on each plot result from nonlinear
dynamic analyses with the selected ground motion
Table 1
Earthquakes list
Earthquake Year Mw Earthquake Year Mw
Livermore 1980 5.4 Dinar 1995 6.2
Friuli 11-09-1976
16.35.01
1976 5.5 Managua,
Nicaragua
1972 6.2
Lazio-Abruzzo 1984 1984 5.5 Morgan Hill 1984 6.2
Sicilia Sud Orientale
1990
1990 5.6 Friuli, Italy 1976 6.5
Umbria 1984 1984 5.6 Imperial Valley 1979 6.5
Coyote Lake 1979 5.7 Kozani 1995 6.5
Mammoth Lakes 1980 5.7 Borrego Mtn 1968 6.6
NE of Banja Luka
(Bosnia)
1981 5.7 San Fernando 1971 6.6
Umbria-Marche 1997 5.7 Northridge 1994 6.7
Norcia (Valnerina) 1979 5.8 Superstition Hills
(B)
1987 6.7
San Salvador 1986 5.8 Gazli, USSR 1976 6.8
Westmorland 1981 5.8 Nahanni, Canada 1985 6.8
Athens (Greece) 1999 5.9 Spitak, Armenia 1988 6.8
Kalamata (Greece) 1986 5.9 Erzincan, Turkey 1992 6.9
Basso Tirreno 1978 1978 6 Irpinia, Italy 1980 6.9
Friuli 15-09-1976
09.21.18
1976 6 Kobe 1995 6.9
N. Palm Springs 1986 6 Loma Prieta 1989 6.9
Umbria-Marche 1997 6 Montenegro (YU) 1979 6.9
Whittier Narrows 1987 6 Cape Mendocino 1992 7
Parkfield 1966 6.1 Imperial Valley 1940 7
242 F. Mollaioli et al. Pure Appl. Geophys.
0.000
0.005
0.010
0.015
0.020
0.025
0.030
0.035
0.040
0 200 400 600 800 1000 PGA
ID I
0- 5 km
5- 12 km
12- 30 km
0-30 km = 0.796
0.000
0.005
0.010
0.015
0.020
0.025
0.030
0.035
0.040
0 5 0 100 150 200 PGV
ID I
0- 5 km
5- 12 km
12- 30 km
0-30 km = 0.830
0.000
0.005
0.010
0.015
0.020
0.025
0.030
0.035
0.040
0 200 400 600 800 I A
ID I
0- 5 km
5- 12 km
12- 30 km
0-30 km = 0.861
0.000
0.005
0.010
0.015
0.020
0.025
0.030
0.035
0.040
0 100 200 300 400 500 600 I H
ID I
0- 5 km
5- 12 km
12- 30 km
0-30 km = 0.911
0.000
0.005
0.010
0.015
0.020
0.025
0.030
0.035
0.040
0. 0 0 .5 1. 0 1 .5 2. 0 2 .5
Sa (T1)
ID I
0- 5 km
5- 12 km
12- 30 km
0-30 km = 0.908
6.5≤M w ≤7.1 Soil C - 6 stories μ=4
6.5≤M w ≤7.1 Soil C - 6 stories μ=4
6.5≤M w ≤7.1 Soil C - 6 stories μ=4
6.5≤M w ≤7.1 Soil C - 6 stories μ=4
6.5≤M w ≤7.1 Soil C - 6 stories μ=4
6.5≤M w ≤7.1 Soil C - 6 stories μ=4
0.000
0.005
0.010
0.015
0.020
0.025
0.030
0.035
0.040
0 100 200 300 400
VEI (T1)
ID I
0- 5 km
5- 12 km
12- 30 km
0-30 km = 0.910
max
max
max
max
max
max
ρ ρ
ρρ
ρ ρ
Figure 3Correlation of various intensity measures with the maximum interstory drift for MDOF systems
Vol. 168, (2011) Correlations between Energy and Displacement 243
0.000
0.002
0.004
0.006
0.008
0.010
0.012
0.014
0.016
0.018
0 5 0 100 150 200 250
V EI ( T 1 )
ID I
0- 5 km
5- 12 km
12- 30 km
0-30 km = 0.911
0.000
0.002
0.004
0.006
0.008
0.010
0.012
0.014
0.016
0.018
0.020
0 5 0 100 150 200
V EI ( T 1 )
ID I
0- 5 km
5- 12 km
12- 30 km
0-30 km = 0.912
0.000
0.002
0.004
0.006
0.008
0.010
0.012
0.014
0.016
0.018
0 100 200 300 400 500 600 AV EI (0 -4 s )
ID I
0- 5 km
5- 12 km
12- 30 km
0-30 km = 0.833
0.000
0.002
0.004
0.006
0.008
0.010
0.012
0.014
0.016
0.018
0.020
0 100 200 300 400 500 600 AV EI (0 -4 s )
ID I
0- 5 km
5- 12 km
12- 30 km
0-30 km = 0.958
0.000
0.002
0.004
0.006
0.008
0.010
0.012
0.014
0.016
0.018
0 10000 20000 30000 40000
A EI (0 -4 s )
ID I
0- 5 km
5- 12 km
12- 30 km
0-30 km = 0.812
5.4≤M w≤6.2 Soil C - 12 stories μ=4
5.4≤M w ≤6.2 Soil C - 12 stories μ=4
5.4≤M w ≤6.2 Soil C - 4 stories μ=4
5.4≤M w ≤6.2 Soil C - 4 stories μ=4 5.4≤M w ≤6.2 Soil C - 12 stories μ=4
5.4≤M w ≤6.2 Soil C - 4 stories μ=4
0.000
0.002
0.004
0.006
0.008
0.010
0.012
0.014
0.016
0.018
0.020
0 10000 20000 30000 40000
A EI (0 -4 s )
ID I
0- 5 km
5- 12 km
12- 30 km
0-30 km = 0.952
max
max
max
max
max
max
ρρ
ρ ρ
ρρ
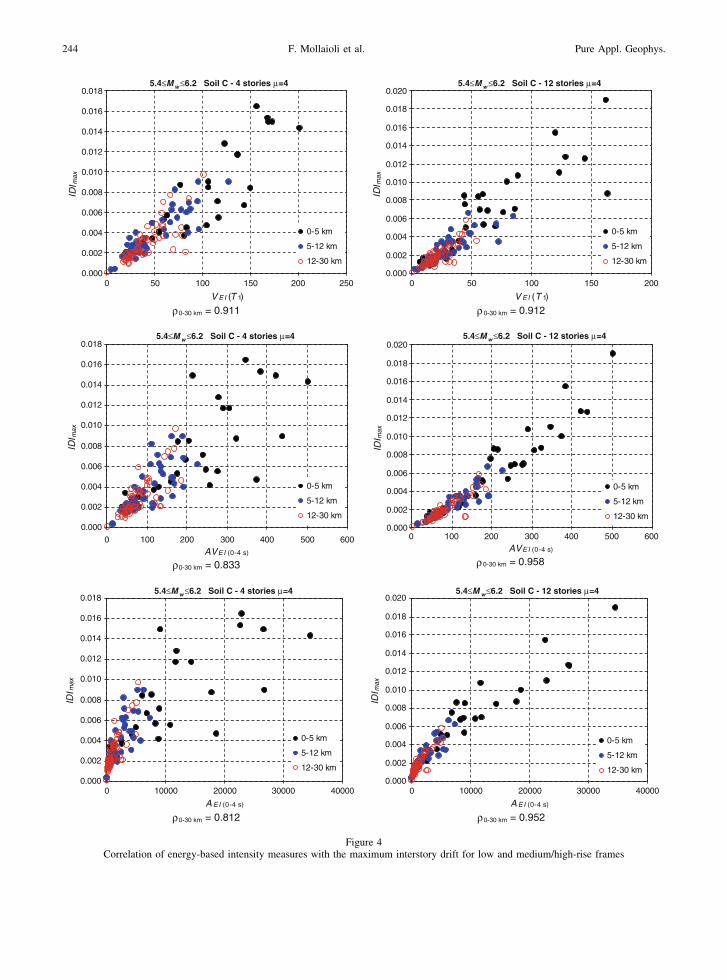
Figure 4Correlation of energy-based intensity measures with the maximum interstory drift for low and medium/high-rise frames
244 F. Mollaioli et al. Pure Appl. Geophys.

records. Diagrams in Fig. 3 refer, for instance, to
medium-rise structures (6 story-buildings) with duc-
tility ratio l = 4, on intermediate soil, type C.
Relevant analyses were performed with ground
motions recorded from events with magnitudes 6.5 B
Mw B 7.1, and at various intervals of distance from
the causative fault; the correlation coefficient
q0–30 km, also indicated, refers to the entire interval of
considered distances. Conventional intensity mea-
sures, such as PGA and PGV, do not appear to exhibit
satisfactory correlation with the chosen damage
measure.
The correlation level increases slightly in case the
Arias intensity, IA, is taken into account; considerable
scatter persists for records obtained in near-fault
conditions. Better results are instead obtained as long
as Housner Intensity, IH, spectral acceleration corre-
sponding to the fundamental period T1, Sa(T1), and
input energy-equivalent velocity at T1, VEIT1ð Þ, are
considered. Pseudo-spectral acceleration, Sa(T1), one
of the most widely adopted spectral quantitities,
appears to constitute in this case an effective intensity
measures. However, being a displacement-based
parameter, it only reflects the effects of amplitude and
does not allow one to take the influence of the ground
motion duration into account. Therefore, its strong
correlation with structural response is limited to cases
of moderately inelastic systems, whose behaviour is
governed by the fundamental mode of vibration; the
contributions to the response from higher modes of
vibration can be significant under such circumstances
(BAZZURRO and CORNELL, 2002).
Effects of inelasticity and ground motion duration
that are overlooked by the more conventional spectral
parameters are instead implicitly captured by IH and
VEIT1ð Þ. In particular, the input energy-equivalent
velocity, being an energy-based ground motion
parameter, is directly related to the number and
amplitudes of the cycles of oscillator response: hence,
it conveys information on the ground motion dura-
tion, reflecting cumulative effects by virtue of the
integration over time that is involved in their
computation.
Figure 4 shows the correlation of some significant
energy-based ground motion parameters, namely
VEIT1ð Þ, already introduced, the area of the VEI
spectrum in the range of periods between 0 and 4.0 s,
AVEI 0�4s, and the area of the Ei spectrum in the same
range of periods, AEI0�4s. Plots refer to 4-story (left
side) and 12-story frames (right side), moderately
inelastic (l = 4), on soil of Class C. A marked
improvement in the correlation strength can be
observed for high-rise buildings in comparison with
low-rise buildings; at the same time, the considerable
dispersion affecting the results obtained with near-
source ground motions appears significantly reduced
for buildings of the former typology.
4. Relationships between Energy and Displacement
Demand
The identification of reliable relationships between
energy and displacement demands represents a funda-
mental issue in both the development of more reliable
seismic code provisions and the evaluation of seismic
vulnerability aimed to the upgrading of existing haz-
ardous facilities.
Even though the seismic performance of a struc-
ture is directly related to the global and local
deformations of the structure, the energy balance
formulation appears much more effective in concept,
as it permits a rational assessment of the energy
absorption and dissipation mechanisms that can be
effectively accomplished to balance the energy
imparted to the structure. As the two aspects could
become consistently integrated within a performance-
based seismic design methodology, understanding
how input and dissipated energy are correlated with
displacement demands emerges as a decisive pre-
requisite.
For SDOF systems, FAJFAR (1992), and FAJFAR and
VIDIC (1994) proposed a non-dimensional parameter,
c, defined by the following formula:
c ¼ffiffiffiffiffiffiffiffiffiffiffiffi
EH=mp
xdð1Þ
where EH is the dissipated hysteretic energy, m is the
mass of the system, x is the natural circular fre-
quency and d is the maximum displacement of the
system. This expression, which represents a normal-
ization of the dissipated hysteretic energy, can be
read as the ratio between two equivalent velocity
amounts. The above relationship was introduced by
Vol. 168, (2011) Correlations between Energy and Displacement 245

FAJFAR and GASPERSIC (1996) in the so-called N2
method, i.e. a nonlinear methodology for the two-
dimensional seismic analysis of reinforced concrete
buildings vibrating predominantly in the first mode,
both in the elastic and in inelastic range. As also
shown by DECANINI et al. (2000), there exists a stable,
approximately parabolic relationship between global
displacement (herein named roof displacement, droof)
demand and hysteretic energy, EH, demand for
equivalent single-degree-of-freedom (ESDOF) sys-
tems. Such ESDOF systems were modeled by
assuming an assigned time-independent global
deflection shape for the lateral displacements of the
structure, thus restricting its dynamic response to the
first vibration mode only.
More stable quantities than that obtained with the
c parameter can be yielded by setting a relation
between the square root of the input energy and the
displacement. As a matter of fact input energy, EI,
represents an effective tool in the characterization of
the seismic demands; moreover, it constitutes a very
stable parameter, scarcely depending on the hyster-
etic properties of the structure. A new parameter, f,
was then defined as follows (TERAN-GILMORE, 1996,
1998):
f ¼ffiffiffiffiffiffiffiffiffiffiffi
EI=mp
xdð2Þ
where EI is the input energy, m is the mass of the
system, x is the natural circular frequency and d is
the maximum displacement of the system. In partic-
ular, it was found that the quantity above is more
stable than that expressed by c (DECANINI and Mollaioli
2001; DECANINI et al., 2000).
As a general rule, methods based on the analysis of
the dynamic response of SDOF or ESDOF systems
permit one to obtain a quite good evaluation of global
displacement and energy demands. However, as they
neglect significant effects on the seismic response of
multistory frames due to higher modes, they cannot be
used for the estimation of local energy and displace-
ment demands; besides, it should be considered that
the local seismic behavior is also strongly affected by
the particular characteristics of the strong ground
motions. Therefore, in order to extend the character-
ization of the relationships between energy and
displacement demands to multi-degree-of-freedom
(MDOF) systems, in the present work two further
pairs of parameters are defined, one that relates input
or hysteretic energy with global displacements, the
other that correlates energy quantities with interstory
drifts.
The first two parameters, f0 and c0, respectively
depending on the input energy, EI and on the dissi-
pated hysteretic energy, EH, can be directly derived
by utilizing modified expressions of formulae derived
for the SDOF systems, Eqs. 2 and 1 in that order, as
f0 ¼ffiffiffiffiffiffiffiffiffiffiffi
EI=mp
x1droof
ð3Þ
c0 ¼ffiffiffiffiffiffiffiffiffiffiffiffi
EH=mp
x1droof
ð4Þ
where m is the total mass of the system, x1 is the
fundamental frequency, and droof is the top displace-
ment. The definition of the second two parameters, c00
and f00, required instead further modifications of
Eqs. 2 and 1 respectively. Substitution of the global
displacement, d, with the inter-story drift, Dmax, in
Eqs. 2 and 1 leads to the following expressions:
f00 ¼ffiffiffiffiffiffiffiffiffiffiffi
EI=mp
x1 � N � Dmax
¼ffiffiffiffiffiffiffiffiffiffiffi
EI=mp
x1 � N � h � IDImax
ð5Þ
c00 ¼ffiffiffiffiffiffiffiffiffiffiffiffi
EH=mp
x1 � N � Dmax
¼ffiffiffiffiffiffiffiffiffiffiffiffi
EH=mp
x1 � N � h � IDImax
ð6Þ
where N is the number of stories, h is the story height
and IDImax ¼ Dmax=h is the maximum interstory drift
index. The quantities above have proved (MURA,
2003) to be capable of yielding the best results in
terms of statistical stability with regard to the char-
acteristics of the ground motion records considered.
Introducing the coefficient of distortion, COD,
defined as the ratio of the maximum interstory drift
index, IDImax, to the average interstory drift index,
IDIavg (TERAN-GILMORE, 1998), in Eqs. 5 and 6 and
considering frame structures having the same height
in all stories, so that the total height of the frame and
the maximum interstory drift index are expressed by
H ¼ Nh ð7aÞ
IDImax ¼ COD � IDIavg ¼ CODdroof
Hð7bÞ
which implies
246 F. Mollaioli et al. Pure Appl. Geophys.

N � h � IDImax ¼ H � IDImax ¼ COD � droof ð8Þ
lead to the following relationships:
f00 ¼ f0
CODð9Þ
c00 ¼ c0
CODð10Þ
From an operational point of view, once the corre-
lations between these parameters and structural
quantities, such as the fundamental period, are known
(for instance, through regression analysis), seismic
performance indexes (i.e., the maximum interstory
drift and the top displacement) can directly be
derived (Fig. 5). In cases for which it is reasonable to
resort to SDOF systems in the simplified modelling of
low-rise buildings, in particular, the top displacement
can be approximated with the maximum oscillator
displacement.
5. Influence of Ground Motion and Structure
Characteristics on Energy-Based Parameters
To the purpose of assessing the influence of
structural and nonstructural (i.e., peculiar to the
ground motion) features on the seismic behavior, a
series of SDOF systems were subjected to a total of
45 records chosen from the whole data set in order to
represent different seismic conditions in terms of
magnitude, source-to-site distance, fault mechanism.
In particular, this subset of strong ground motions
includes near-source and ordinary ground motions,
recorded at distances, Df, less than and greater than
5 km from the causative fault, respectively. In
Table 2 the selected time histories are listed, while in
Fig. 6 the distribution of the records according to
magnitude, Mw, and the closest distance from the
surface projection of the fault rupture, Df, is shown.
Generally the shapes of the spectra of the inter-
story drift index, IDI, defined as the inter-story dis-
placement normalized by the story height, are more
influenced by the signal energy content than the
displacement spectra. This circumstance emerges
from the comparison between energy and drift spec-
tra, which indicate both spectral coincidence of
periods where the maximum values are attained and
agreement in the general trend. In contrast, similar
correspondences are not recognizable in the dis-
placement spectra shapes. This should mean that a
strong energy demand imposed to a structural system
does not necessarily cause a strong top displacement,
Figure 5Energy parameters for the evaluation of seismic performance
Vol. 168, (2011) Correlations between Energy and Displacement 247

while a strong local deformation demand is quite
likely to occur.
The trend to assume the same shape of the input
energy spectra is confirmed by the frequent coinci-
dence of periods between energy and drift peaks and
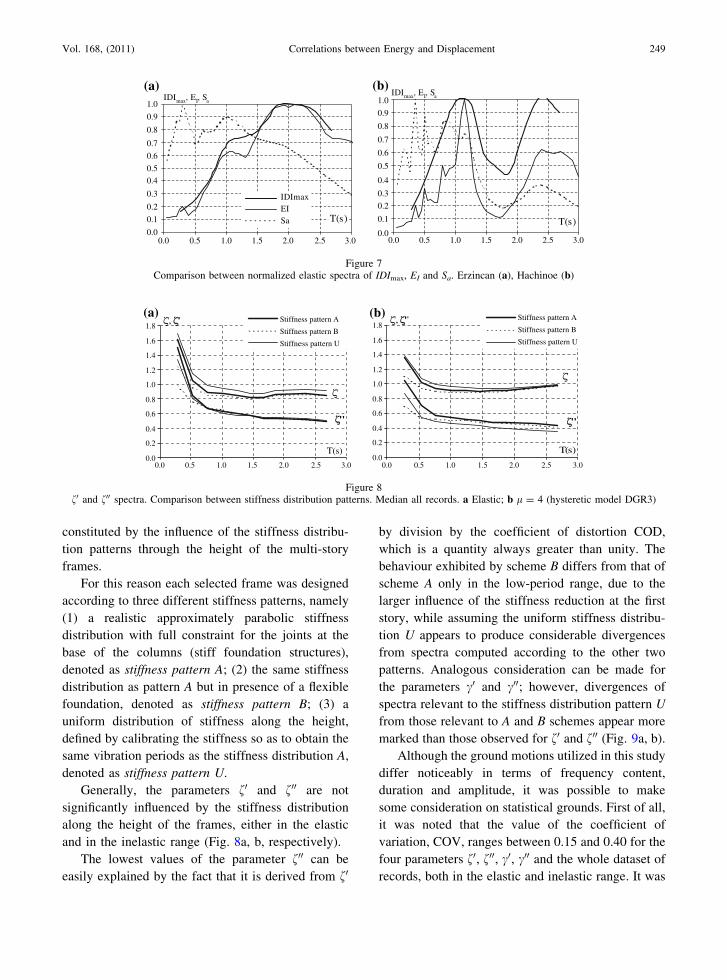
valleys. In Fig. 7 the spectral shapes of the maximum
interstory drift, IDImax, estimated in this study, are
compared to the spectral shapes, relevant to SDOF
systems, of the input energy, EI and the acceleration,
Sa. The spectra were computed for ground motions of
very different characteristics. More specifically Erzin-
can (Fig. 7a) represents a typical forward directivity
pulse-like time history, while Hachinoe (Fig. 7b) stands
for a far-field long duration record.
However, the maximum drift is greatly influenced
by both the amount of energy input and the way the
energy is imparted to the structure. A greater rate of
input in the energy demand time history influences
strongly the drift demand for pulse-like time histories
in comparison with long duration motions, which of
course could impart the same amount of energy to the
structure, but in a longer time. As a matter of fact,
near-fault records could induce a lower number of
cycles in the structure than far-field ones, but with a
higher energy content. This circumstance can account
for a larger concentration of the drift demand.
5.1. Influence of the Stiffness Distribution Pattern
One aspect of the dependency of the selected
parameters for the quantification of the seismic
demands in terms of energy and displacement on
structural properties of the considered frames is
Table 2
Strong motions employed for SDOF systems analysis
Earthquake Year Mw Recording Station PGA (cm/s2) Earthquake Year Mw Recording Station PGA (cm/s2)
Imperial Valley 1940 7.0 El Centro Array #9 342 Loma Prieta 1989 6.9 Capitola 463
Tokachi-Oki 1968 7.9 HachinNS 312 Landers 1992 7.3 Lucerne # 713
Tokachi-Oki 1968 7.9 HachinEW 206 Landers 1992 7.3 Joshua Tree # 278
Friuli 1976 6.5 Tolmezzo 348 Erzincan 1992 6.7 Erzincan 505
Romania 1977 7.5 Bucharest-BRI 202 Northridge 1994 6.7 Rinaldi Receiving Sta # 822
Tabas, Iran 1978 7.4 Tabas 835 Northridge 1994 6.7 Sylmar - Olive View FF 827
Montenegro 1979 6.9 Bar-Skupstina Opstine 356 Northridge 1994 6.7 Newhall - Fire Sta 579
Montenegro 1979 6.9 Petrovac-Hotel Oliva 446 Northridge 1994 6.7 Santa Monica City Hall 866
Montenegro 1979 6.9 Ulcinj-Hotel Olimpic 236 Kobe 1995 6.9 Kobe University 285
Imperial Valley 1979 6.5 El Centro Array #7 454 Kobe 1995 6.9 KJMA 806
Imperial Valley 1979 6.5 Agrarias 217 Kobe 1995 6.9 Takatori 599
Imperial Valley 1979 6.5 Bonds Corner 760 Kobe 1995 6.9 Port Island (0 m) 309
Imperial Valley 1979 6.5 Calexico Fire Station 270 Dinar 1995 6.4 Dinar 345
Imperial Valley 1979 6.5 EC Meloland Overpass FF 291 Kocaeli 1999 7.4 Sakarya 369
Imperial Valley 1979 6.5 El Centro Array #6 431 Kocaeli 1999 7.4 Yarimca 342
Irpinia 1980 6.8 Calitri 153 Kocaeli 1999 7.4 Duzce-Met. 351
Cile 1985 7.8 Llolleo 698 Duzce 1999 7.1 Duzce-Met. 525
Messico 1985 8.1 Secretaria com. & tran. 168 Duzce 1999 7.1 Bolu 807
Nahanni 1985 6.8 Site 1 1,075 ChiChi 1999 7.6 TCU129 991
San Salvador 1986 5.8 Geotech Investig Center 681 ChiChi 1999 7.6 TCU052 341
Superstitn Hills 1987 6.5 Parachute Test site 446 ChiChi 1999 7.6 TCU068 555
Loma Prieta 1989 6.9 Los Gatos Pres. Center 552 ChiChi 1999 7.6 TCU065 799
Loma Prieta 1989 6.9 Corralitos 617
0
50
100
150
200
250
300
350
400
450
5.5 6.0 6.5 7.0 7.5 8.0 8.5M w
Df (k
m)
Figure 6Magnitude versus minimum distance to the causative fault
248 F. Mollaioli et al. Pure Appl. Geophys.
constituted by the influence of the stiffness distribu-
tion patterns through the height of the multi-story
frames.
For this reason each selected frame was designed
according to three different stiffness patterns, namely
(1) a realistic approximately parabolic stiffness
distribution with full constraint for the joints at the
base of the columns (stiff foundation structures),
denoted as stiffness pattern A; (2) the same stiffness
distribution as pattern A but in presence of a flexible
foundation, denoted as stiffness pattern B; (3) a
uniform distribution of stiffness along the height,
defined by calibrating the stiffness so as to obtain the
same vibration periods as the stiffness distribution A,
denoted as stiffness pattern U.
Generally, the parameters f0 and f00 are not
significantly influenced by the stiffness distribution
along the height of the frames, either in the elastic
and in the inelastic range (Fig. 8a, b, respectively).
The lowest values of the parameter f00 can be
easily explained by the fact that it is derived from f0
by division by the coefficient of distortion COD,
which is a quantity always greater than unity. The
behaviour exhibited by scheme B differs from that of
scheme A only in the low-period range, due to the
larger influence of the stiffness reduction at the first
story, while assuming the uniform stiffness distribu-
tion U appears to produce considerable divergences
from spectra computed according to the other two
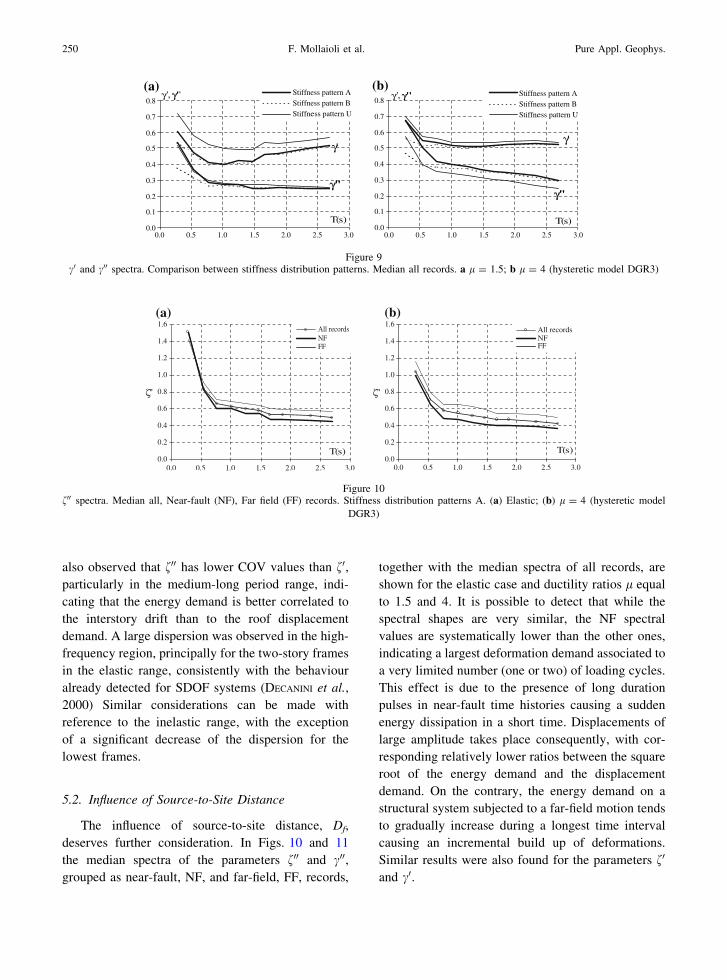
patterns. Analogous consideration can be made for
the parameters c0 and c00; however, divergences of
spectra relevant to the stiffness distribution pattern U
from those relevant to A and B schemes appear more
marked than those observed for f0 and f00 (Fig. 9a, b).
Although the ground motions utilized in this study
differ noticeably in terms of frequency content,
duration and amplitude, it was possible to make
some consideration on statistical grounds. First of all,
it was noted that the value of the coefficient of
variation, COV, ranges between 0.15 and 0.40 for the
four parameters f0, f00, c0, c00 and the whole dataset of
records, both in the elastic and inelastic range. It was
0.0
0.1
0.2
0.3
0.4
0.5
0.6
0.7
0.8
0.9
1.0
0.0
0.1
0.2
0.3
0.4
0.5
0.6
0.7
0.8
0.9
1.0
T(s)
IDImaxEISa
IDImax, EI, Sa
IDImaxEISa
0.0 0.5 1.0 1.5 2.0 2.5 3.00.0 0.5 1.0 1.5 2.0 2.5 3.0
T(s)
IDImax, EI, Sa
(a) (b)
Figure 7Comparison between normalized elastic spectra of IDImax, EI and Sa. Erzincan (a), Hachinoe (b)
T(s)
ζ', ζ''
ζ''
ζ'
0.0
0.2
0.4
0.6
0.8
1.0
1.2
1.4
1.6
1.8
0.0
0.2
0.4
0.6
0.8
1.0
1.2
1.4
1.6
1.8
0.0 0.5 1.0 1.5 2.0 2.5 3.00.0 0.5 1.0 1.5 2.0 2.5 3.0
T(s)
ζ', ζ'' Stiffness pattern A
Stiffness pattern B
Stiffness pattern U
Stiffness pattern A
Stiffness pattern B
Stiffness pattern U
ζ''
ζ'
(a) (b)
Figure 8f0 and f00 spectra. Comparison between stiffness distribution patterns. Median all records. a Elastic; b l = 4 (hysteretic model DGR3)
Vol. 168, (2011) Correlations between Energy and Displacement 249
also observed that f00 has lower COV values than f0,particularly in the medium-long period range, indi-
cating that the energy demand is better correlated to
the interstory drift than to the roof displacement
demand. A large dispersion was observed in the high-
frequency region, principally for the two-story frames
in the elastic range, consistently with the behaviour
already detected for SDOF systems (DECANINI et al.,
2000) Similar considerations can be made with
reference to the inelastic range, with the exception
of a significant decrease of the dispersion for the
lowest frames.
5.2. Influence of Source-to-Site Distance
The influence of source-to-site distance, Df,
deserves further consideration. In Figs. 10 and 11
the median spectra of the parameters f00 and c00,grouped as near-fault, NF, and far-field, FF, records,
together with the median spectra of all records, are
shown for the elastic case and ductility ratios l equal
to 1.5 and 4. It is possible to detect that while the
spectral shapes are very similar, the NF spectral
values are systematically lower than the other ones,
indicating a largest deformation demand associated to
a very limited number (one or two) of loading cycles.
This effect is due to the presence of long duration
pulses in near-fault time histories causing a sudden
energy dissipation in a short time. Displacements of
large amplitude takes place consequently, with cor-
responding relatively lower ratios between the square
root of the energy demand and the displacement
demand. On the contrary, the energy demand on a
structural system subjected to a far-field motion tends
to gradually increase during a longest time interval
causing an incremental build up of deformations.
Similar results were also found for the parameters f0
and c0.
T(s)
γ', γ''
γ''
γ'
0.0
0.1
0.2
0.3
0.4
0.5
0.6
0.7
0.8
0.0
0.1
0.2
0.3
0.4
0.5
0.6
0.7
0.8
0.0 0.5 1.0 1.5 2.0 2.5 3.00.0 0.5 1.0 1.5 2.0 2.5 3.0
T(s)
γ', γ''
γ''
γ'
(a) (b) Stiffness pattern AStiffness pattern BStiffness pattern U
Stiffness pattern AStiffness pattern BStiffness pattern U
Figure 9c0 and c00 spectra. Comparison between stiffness distribution patterns. Median all records. a l = 1.5; b l = 4 (hysteretic model DGR3)
T(s)
ζ ''
All recordsNFFF
0.0
0.2
0.4
0.6
0.8
1.0
1.2
1.4
1.6
0.0
0.2
0.4
0.6
0.8
1.0
1.2
1.4
1.6
0.0 0.5 1.0 1.5 2.0 2.5 3.0 0.0 0.5 1.0 1.5 2.0 2.5 3.0
T(s)
ζ ''
All recordsNFFF
(a) (b)
Figure 10f00 spectra. Median all, Near-fault (NF), Far field (FF) records. Stiffness distribution patterns A. (a) Elastic; (b) l = 4 (hysteretic model
DGR3)
250 F. Mollaioli et al. Pure Appl. Geophys.

5.3. Influence of the Hysteretic Model
A stiffness-degrading hysteretic model was then
adopted to simulate the cyclic behavior of the frames
in each story. Many hysteretic models were proposed
to predict the nonlinear behavior of reinforced con-
crete structural systems. Such models are typically
characterized by control parameters, which govern the
shape of the generated loops, that have to be calibrated
from observed experimental testing. Moreover, in
highly nonlinear material like reinforced concrete the
system characteristics are recurrently altered by either
degradation of strength and stiffness or apparent
pinching of loops resulting from repeated opening and
closing of cracks. Consequently, most computational
algorithms included in several codes generally utilize
simplified piece-wise, linear hysteretic macro-models
which relate force and deformation or moment and
curvature in the inelastic range. Such macro-models
have the advantage of capturing the global behavior in
an equivalent sense without resorting to complex
finite element discretization.
The force–deformation behavior in concrete struc-
tures is influenced by many factors such as the nature
of the response and the level of the reinforcement
detailing. In such cases, it is necessary to include more
than one type of degrading behavior to model the
expected response. Two extreme patterns of behavior
can be considered: stable flexural response, character-
istic of well-detailed, well-confined flexural elements,
and severely degraded response, likely to be observed in
shear-critical elements such as inadequately reinforced
concrete joints and poorly confined short columns or
coupling beams.
Thus, on the basis of the aforementioned consid-
eration, six hysteretic models were selected, namely
the elastic-perfectly plastic model, EPP, introduced
as a term of comparison, and five degrading models,
DGR1-5 (Table 3).
The hysteresis model used in this study, repre-
sented in Fig. 12, utilizes several control parameters
that establish the rules for inelastic loading reversals.
Stiffness degradation is modeled as a function of
0.0
0.1
0.2
0.3
0.4
0.5
0.6
0.7
0.8
0.9
0.0
0.1
0.2
0.3
0.4
0.5
0.6
0.7
0.8
0.9
0.0 0.5 1.0 1.5 2.0 2.5 3.0 0.0 0.5 1.0 1.5 2.0 2.5 3.0
T(s)
γ''
All recordsNFFF
T(s)
γ''
All recordsNFFF
(a) (b)
Figure 11c00 spectra. Median all, Near-fault (NF), Far field (FF) records. Stiffness distribution patterns A. (a) l = 1.5; (b) l = 4 (hysteretic model
DGR3)
Table 3
Characteristic of the hysteretic models used in this study
EPP
DGR1 Reloading stiffness degradation
DGR2 Reloading stiffness degradation, strain hardening ratio p = 10%
DGR3 Reloading and unloading stiffness degradation, strain hardening ratio p = 10%
DGR4 Reloading and unloading stiffness degradation, pinching effect, strain hardening ratio p = 10%
DGR5 Reloading and unloading stiffness degradation, strength degradation, strain hardening ratio p = 10%
Vol. 168, (2011) Correlations between Energy and Displacement 251

ductility, strength deterioration is modeled as a
function of both dissipated energy and ductility and
pinching is modeled by two independent parameters
to control the degree of pinching.
The constitutive law is controlled by four param-
eters, namely p, a, b, c. The parameter p, the strain
hardening ratio introduced above, controls the post-
yielding stiffness and is set equal to 0.1; a is related
to the unloading stiffness; b controls the strength
degradation; c controls the pinching effect due to
closing cracks during the reloading phase. If a tends
to infinity there is no stiffness degradation during the
unloading phase; the value a = 2 represents a mean
value. For b = 0 there is no strength degradation due
to energy dissipation; the value b = 0.1 corresponds
to a mean value for which this effect is quite
reasonable, as for larger values it can lead to
unrealistic results or produce numerical instability.
For c = 1 there is no pinching, while c = 0 corre-
sponds to the maximum pinching effect; c = 0.5 can
be considered a realistic values even though it leads
to quite significant effect. It is also possible to note
that, unless caused by secondary effects on more
internal cycles, the DGR1 and DGR2 models corre-
spond to the Clough model without and with strain
hardening, respectively, while the DGR3 model
matches the Takeda model.
The influence of the hysteretic behaviour is
generally not significant, though with some excep-
tions. In Figs. 13 and 14 the median spectra of the
parameters f0, f00 and c0, c00, respectively, are shown
for a ductility ratio l = 4. The trend of the degrading
models is substantially different from that of the EPP
model, particularly for the parameters f00 and c00. This
can be attributed the fact that in a degrading
hysteretic behaviour the maximum displacement is
directly related to the amplitude of the instantaneous
oscillation rather than to a residual cumulated
displacement, as it usually occurs for the EPP model.
The spectra corresponding to the degrading mod-
els DGR3, DGR4 and DGR5 are very close in the
whole period range and for the various ductility
ratios.
As it was observed for the influence of the
stiffness distribution pattern, in the high frequency
range the parameters f0, f00 and c0, c00 exhibit the
maximum spectral values, that tend to attenuate as
the ductility increases. This effect is prevalent for the
parameters f0 and f00. For example, as far as f0 is
concerned, it could be mainly attributable to the way
the absolute input energy is defined, and therefore can
be explained in the light of behavior of SDOF
systems. In fact, for SDOF systems in the elastic case
the input energy tends to the value PGV2�
2, where
PGV is the peak ground velocity, for T ? 0.
Consequently its square root moves to PGV�ffiffiffi
2p
,
while the displacement d tends quickly to 0 so as
xd ¼ 2pd=T tends to 0. The analogy with the
behavior of MDOF systems comes out as soon as
one recognizes that the input energy and the
displacement d mentioned above correspond, apart
from a participation factor raised to the first and to the
second power, respectively, to the quantities droof and
EI in Eq. 3. In the inelastic range for the lowest
periods there is a slight energy modification while the
displacement amplification is significant (Rd ? l for
T ? 0) and therefore the values of f0 and f00 are
lesser.
Finally, it was observed that f0 and f00 spectra are
not much influenced by the ductility ratio, while c0
R
u
Ry
-Ry
-uy
uy
α Ry
-α Ry
k0 p k0
Figure 12Tipical cyclic behavior of the four parameter hysteretic model
252 F. Mollaioli et al. Pure Appl. Geophys.
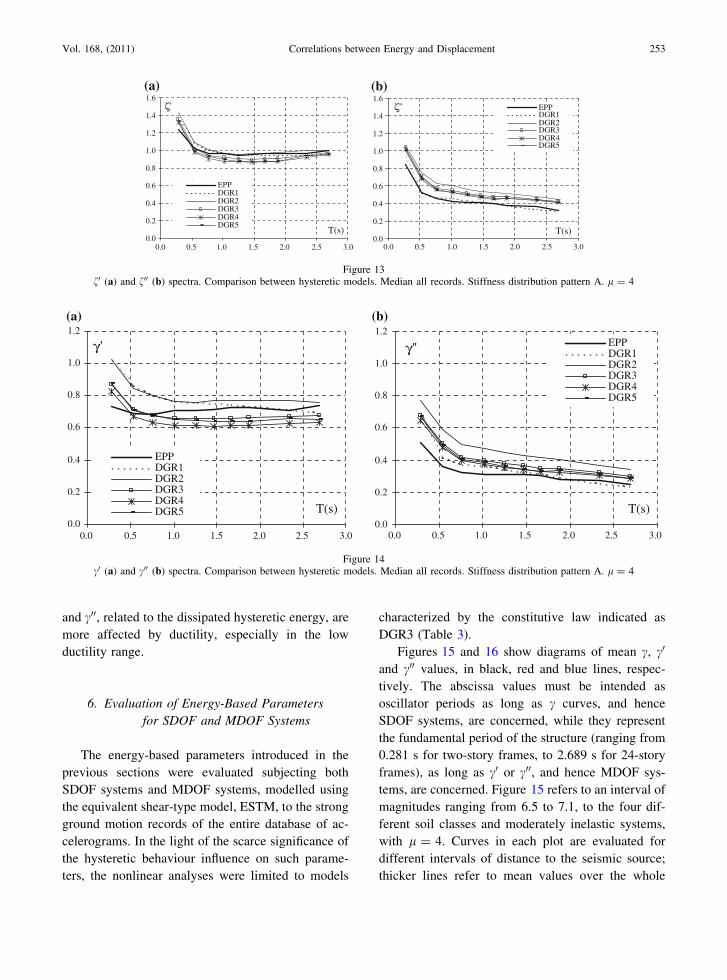
and c00, related to the dissipated hysteretic energy, are
more affected by ductility, especially in the low
ductility range.
6. Evaluation of Energy-Based Parameters
for SDOF and MDOF Systems
The energy-based parameters introduced in the
previous sections were evaluated subjecting both
SDOF systems and MDOF systems, modelled using
the equivalent shear-type model, ESTM, to the strong
ground motion records of the entire database of ac-
celerograms. In the light of the scarce significance of
the hysteretic behaviour influence on such parame-
ters, the nonlinear analyses were limited to models
characterized by the constitutive law indicated as
DGR3 (Table 3).
Figures 15 and 16 show diagrams of mean c, c0
and c00 values, in black, red and blue lines, respec-
tively. The abscissa values must be intended as
oscillator periods as long as c curves, and hence
SDOF systems, are concerned, while they represent
the fundamental period of the structure (ranging from
0.281 s for two-story frames, to 2.689 s for 24-story
frames), as long as c0 or c00, and hence MDOF sys-
tems, are concerned. Figure 15 refers to an interval of
magnitudes ranging from 6.5 to 7.1, to the four dif-
ferent soil classes and moderately inelastic systems,
with l = 4. Curves in each plot are evaluated for
different intervals of distance to the seismic source;
thicker lines refer to mean values over the whole
T(s)
ζ'
EPPDGR1DGR2DGR3DGR4DGR5
0.0
0.2
0.4
0.6
0.8
1.0
1.2
1.4
1.6
0.0
0.2
0.4
0.6
0.8
1.0
1.2
1.4
1.6
0.0 0.5 1.0 1.5 2.0 2.5 3.00.0 0.5 1.0 1.5 2.0 2.5 3.0
T(s)
ζ'' EPPDGR1DGR2DGR3DGR4DGR5
(a) (b)
Figure 13f0 (a) and f00 (b) spectra. Comparison between hysteretic models. Median all records. Stiffness distribution pattern A. l = 4
0.0
0.2
0.4
0.6
0.8
1.0
1.2
T(s)
γ'
EPPDGR1DGR2DGR3DGR4DGR5
0.0
0.2
0.4
0.6
0.8
1.0
1.2
0.0 0.5 1.0 1.5 2.0 2.5 3.00.0 0.5 1.0 1.5 2.0 2.5 3.0
T(s)
γ'' EPPDGR1DGR2DGR3DGR4DGR5
(a) (b)
Figure 14c0 (a) and c00 (b) spectra. Comparison between hysteretic models. Median all records. Stiffness distribution pattern A. l = 4
Vol. 168, (2011) Correlations between Energy and Displacement 253

range of distances. Figure 16 refers to an interval of
magnitudes ranging from 5.4 to 6.2; the left-side
diagram shows values determined with near-fault
records, while the right-side one refers to the whole
data set.
It appears that the parameter c may provide a
satisfactory estimation for c0. In the low to medium-
period range, from the definition of c and c0, Eqs. 1
and 4, respectively, values of droof are slightly greater
than d; the reverse occurs as the fundamental period
6.5 ≤ M w ≤ 7.1 - DGR3 - μ = 4 - Soil A 6.5 ≤ M w ≤ 7.1 - DGR3 - μ = 4 - Soil B
6.5 ≤ M w ≤ 7.1 - DGR3 - μ = 4 - Soil C
0-5 km5-12 km12-30 km
30-80 km0-80 km
0-5 km5-12 km12-30 km
30-80 km0-80 km
0-5 km5-12 km12-30 km30-80 km0-80 km
0-5 km5-12 km12-30 km30-80 km0-80 km
6.5 ≤ M w ≤ 7.1 - DGR3 - μ = 4 - Soil D
0.0
0.2
0.4
0.6
0.8
1.0
1.2
1.4
0.0 0.5 1.0 1.5 2.0 2.5 3.0 3.5 4.0T (s)
0.0 0.5 1.0 1.5 2.0 2.5 3.0 3.5 4.0T (s)
0.0 0.5 1.0 1.5 2.0 2.5 3.0 3.5 4.0T (s)
0.0 0.5 1.0 1.5 2.0 2.5 3.0 3.5 4.0T (s)
0.0
0.2
0.4
0.6
0.8
1.0
1.2
1.4
γ, γ
' , γ"
γ, γ
' , γ"
γ, γ
' , γ"
0.0
0.2
0.4
0.6
0.8
1.0
1.2
1.4
0.0
0.2
0.4
0.6
0.8
1.0
1.2
1.4γ,
γ' ,
γ"
’ ”
Figure 15c, c0 and c00: Soils A, B, C, D; DGR3, l = 4, 6.5 B Mw B 7.1
5.4 ≤ M w ≤ 6.2 - DGR3 - μ = 4 - 0-5 km
0.0
0.2
0.4
0.6
0.8
1.0
1.2
1.4
0.0 0.5 1.0 1.5 2.0 2.5 3.0 3.5 4.0
T (s)
Soil A
Soil B
Soil C
Soil D
5.4 ≤ M w ≤ 6.2 - DGR3 - μ = 4 - 0-80 km
0.0
0.2
0.4
0.6
0.8
1.0
1.2
1.4
0.0 0.5 1.0 1.5 2.0 2.5 3.0 3.5 4.0T (s)
Soil A
Soil B
Soil C
Soil D
γ γ’ γ”
Figure 16c, c0 and c00: near-fault and ordinary records; DGR3, l = 4, 5.4 B Mw B 6.2
254 F. Mollaioli et al. Pure Appl. Geophys.

of the MDOF system increases. This can be explained
in light of the fact that the deflection of a MDOF
system representative of low-rise buildings is pre-
vailingly governed by the first-mode shape, and of the
reduced stiffness in comparison with that of a SDOF
system with period, T, coincident with the MDOF
system fundamental period, T1. On the contrary, the
dynamic behaviour of high-rise buildings is affected
by higher modes, especially in the case of near-fault
records, and maximum displacement may not neces-
sarily be attained at the top-story level. Corres-
pondingly, d tends to exceed droof in the medium to
high-period range, providing a conservative estimation
for the latter.
Curves relevant to the parameter c00 always lie
below those relevant to c and c0; while they originate
in proximity of these curves, they tend to diverge
rapidly as the fundamental period of the structure
increases. Besides, all c00 curves lie far below the line
c00=1, which can be interpreted, according to the
definition given in Eq. 6, to the ratio of two velocity
quantities. This indicates scarce correlation between
dissipated energy, EH, and IDImax, perfect correlation
being attained as the velocity value expressed as a
function of the dissipated energy, numerator of Eq. 6,
equals the velocity value expressed as a function of
the displacement, denominator of Eq. 6.
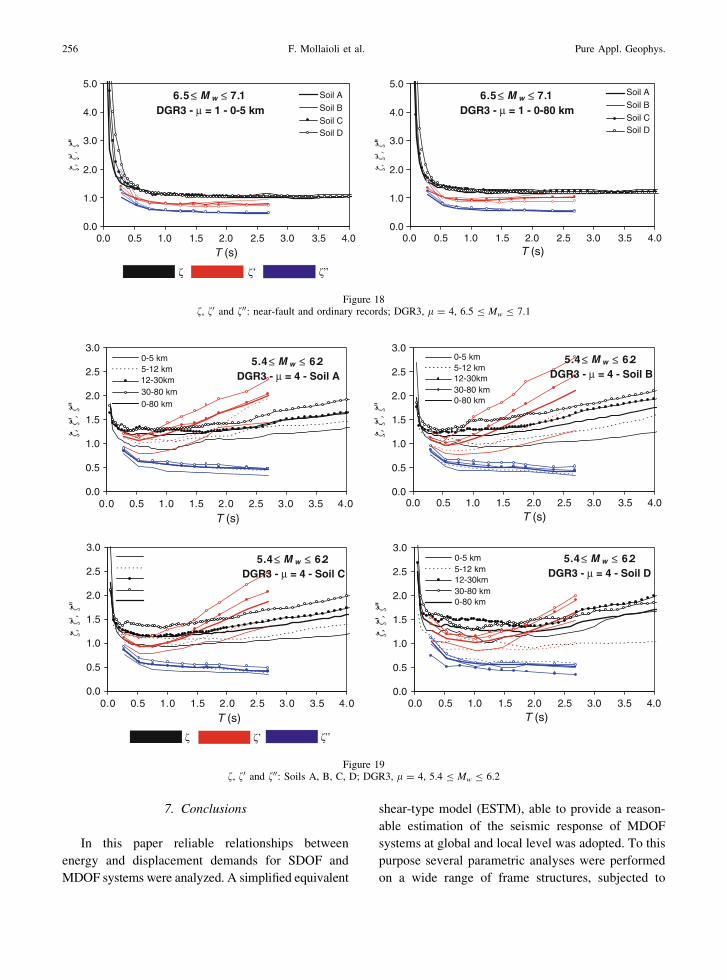
Figures 17, 18, 19, 20 refer to the parameters f, f0
and f00. The trend appears more regular in the elastic
range (Figs. 17, 18). As far as the inelastic behaviour
is concerned, a behaviour similar to that observed for
c and c0 can be observed for f and f0, respectively.
However, differently from the case of c00, curves
relevant to the parameter f00, though decreasing
beyond the low-period range, appear to assume a
stable trend as the fundamental period of the structure
increases, indicating that, according to Eq. 5, input
energy is better correlated to the damage measure
represented by maximum interstory drift than dissi-
pated energy.
5.4 ≤ M w ≤ 6.2DGR3 - μ = 1 - Soil A
0.0
1.0
2.0
3.0
4.0
5.0
0.0 0.5 1.0 1.5 2.0 2.5 3.0 3.5 4.0T (s)
0-5 km
5-12 km
12-30 km
30-80 km
0-80 km
0-5 km
5-12 km
12-30 km
30-80 km
0-80 km
0-5 km5-12 km12-30 km
30-80 km
0-80 km
0-5 km5-12 km12-30 km
30-80 km
0-80 km
5.4 ≤ M w ≤ 6.2DGR3 - μ = 1 - Soil B
0.0
1.0
2.0
3.0
4.0
5.0
0.0 0.5 1.0 1.5 2.0 2.5 3.0 3.5 4.0T (s)
5.4 ≤ M w ≤ 6.2DGR3 - μ = 1 - Soil C
0.0
1.0
2.0
3.0
4.0
5.0
0.0 0.5 1.0 1.5 2.0 2.5 3.0 3.5 4.0T (s)
5.4 ≤ M w ≤ 6.2DGR3 - μ = 1 - Soil D
0.0
1.0
2.0
3.0
4.0
5.0
0.0 0.5 1.0 1.5 2.0 2.5 3.0 3.5 4.0T (s)
’ ”
Figure 17f, f0 and f00: Soils A, B, C, D; DGR3, l = 1, 5.4 B Mw B 6.2
Vol. 168, (2011) Correlations between Energy and Displacement 255
7. Conclusions
In this paper reliable relationships between
energy and displacement demands for SDOF and
MDOF systems were analyzed. A simplified equivalent
shear-type model (ESTM), able to provide a reason-
able estimation of the seismic response of MDOF
systems at global and local level was adopted. To this
purpose several parametric analyses were performed
on a wide range of frame structures, subjected to
6.5 ≤ M w ≤ 7.1DGR3 - μ = 1 - 0-5 km
0.0 0.5 1.0 1.5 2.0 2.5 3.0 3.5 4.0
T (s)0.0 0.5 1.0 1.5 2.0 2.5 3.0 3.5 4.0
T (s)
6.5 ≤ M w ≤ 7.1DGR3 - μ = 1 - 0-80 km
0.0
1.0
2.0
3.0
4.0
5.0
0.0
1.0
2.0
3.0
4.0
5.0Soil A
Soil B
Soil CSoil D
Soil A
Soil B
Soil CSoil D
’ ”
Figure 18f, f0 and f00: near-fault and ordinary records; DGR3, l = 4, 6.5 B Mw B 7.1
5.4 ≤ M w ≤ 6.2DGR3 - μ = 4 - Soil A
5.4 ≤ M w ≤ 6.2DGR3 - μ = 4 - Soil B
5.4 ≤ M w ≤ 6.2DGR3 - μ = 4 - Soil C
0.0 0.5 1.0 1.5 2.0 2.5 3.0 3.5 4.0
T (s)
0.0 0.5 1.0 1.5 2.0 2.5 3.0 3.5 4.0
T (s)
0.0 0.5 1.0 1.5 2.0 2.5 3.0 3.5 4.0T (s)
0.0 0.5 1.0 1.5 2.0 2.5 3.0 3.5 4.0T (s)
0-5 km5-12 km12-30km 30-80 km0-80 km
0-5 km5-12 km12-30km 30-80 km0-80 km
0-5 km5-12 km12-30km 30-80 km0-80 km
5.4 ≤ M w ≤ 6.2DGR3 - μ = 4 - Soil D
0.0
0.5
1.0
1.5
2.0
2.5
3.0
0.0
0.5
1.0
1.5
2.0
2.5
3.0
0.0
0.5
1.0
1.5
2.0
2.5
3.0
0.0
0.5
1.0
1.5
2.0
2.5
3.0
’ ”
Figure 19f, f0 and f00: Soils A, B, C, D; DGR3, l = 4, 5.4 B Mw B 6.2
256 F. Mollaioli et al. Pure Appl. Geophys.

recorded ground motions of different characteristics
in order to provide a spectral representation of the
seismic demands.
Preliminary correlation analysis were carried out
to assess the higher degree of correlation of energy-
based parameters to appropriate damage measures, in
comparison with conventional spectral parameters.
Subsequently, the extension of the characterization of
the relations between energy and displacement
demands from SDOF systems to MDOF systems was
achieved by introducing two pairs of indices that
relate input energy and dissipated hysteretic energy to
both roof displacement and inter-story drift. Such
expressions could be interpreted as the ratios between
equivalent velocities.
On the basis of the above mentioned simplified
methodology, it was possible to assess the effects of
the stiffness distribution patterns along the height of
the structures and the hysteretic models characteriz-
ing the cyclic behavior of the simplified MDOF
models on the examined parameters. As far as the
hysteretic behaviour is concerned, it was found that
its influence is generally not important for the
degrading models, in the whole period range and for
various ductility ratios; on the contrary, the EPP
model exhibits a trend significantly divergent from
the former ones. The influence of the stiffness dis-
tributions through the height of the multi-story frames
is not particularly significant. However, it was pos-
sible to detect a certain deviation of the uniform
stiffness pattern in comparison to theparabolic stiff-
ness distribution schemes.
The fact that the results obtained do not appre-
ciably depend either on the hysteretic model for
degrading systems, or on the usually employed
stiffness distribution schemes, indicates the possibil-
ity to reduce the complexity of the problem when
extending the methodology to a broader set of
structural systems and strong motions records.
Finally, nonlinear analyses performed subjecting
SDOF and MDOF systems to a considerable number
of appropriately selected recorded ground motions,
allowed us to point out the degree of correlation of
energy parameters based on the dissipated energy and
on the input energy to the chosen damage measures.
As far as energy parameters incorporating SDOF
systems maximum displacement and MDOF systems
top-story max displacement are concerned, results
show that modelling low-rise buildings resorting to
SDOF systems gives satisfactory estimation of the
maximum displacement demand. For medium to
high-rise structures. Conversely, results obtained for
SDOF and MDOF systems diverge significantly, also
appearing markedly affected by factors such as soil
stiffness and distance to the causative fault. As far as
energy parameters involving the maximum interstory
drift ratio as damage measure are concerned, they
appear much less affected by soil-site conditions.
Besides, the degree of correlation between energy
and displacement quantities is noticeably more stable
in the where case input energy rather than energy
dissipated by hysteresis is considered, in comparison
with the simplified, in particular, the top displace-
ment can be approximated with the maximum
6.5 ≤ M w ≤ 7.1DGR3 - μ = 4 - 0-5 km
0.0
0.5
1.0
1.5
2.0
2.5
3.0
0.0 0.5 1.0 1.5 2.0 2.5 3.0 3.5 4.0
T (s)0.0 0.5 1.0 1.5 2.0 2.5 3.0 3.5 4.0
T (s)
0.0
0.5
1.0
1.5
2.0
2.5
3.0Soil A
Soil B
Soil C
Soil D
Soil A
Soil B
Soil C
Soil D
6.5 ≤ M w ≤ 7.1DGR3 - μ = 4 - 0-80 km
’ ”
Figure 20f, f0 and f00: near-fault and ordinary records; DGR3, l = 4, 6.5 B Mw B 7.1
Vol. 168, (2011) Correlations between Energy and Displacement 257

oscillator displacement. Further developments may
involve, provided that the correlations between these
parameters and structural quantities are formally
obtained via appropriate regression analyses, the
establishment of methodologies allowing one to
predict the seismic performance of structures through
damage indexes (such as the maximum interstory
drift and the top displacement) directly by the so-
obtained correlation equations.
Acknowledgments
The financial support of the Ministry of the Instruc-
tion, University and Research of Italy (MIUR) is
gratefully acknowledged.
REFERENCES
AKBAS, B. and SHEN, J. (2002), Energy approach in performance-
based earthquake resistant design (PB-EQRD). In 12th Euro-
pean Conference on Earthquake Engineering Paper Reference
043 (Elsevier, Amsterdam).
AKIYAMA, H. (1985), Earthquake-Resistant Limit-State Design for
Buildings (University of Tokyo Press, Tokyo).
BAZZURRO, P. and CORNELL, C. A. Vector-valued probabilistic
seismic hazard analysis (VPSHA). In Proceedings of the Seventh
U.S. National Conference on Earthquake Engineering (Boston,
MA 2002).
BERTERO, V. V. and UANG, C. M. Issues and future directions in the
use of energy approach for seismic-resistant design of structures.
In Nonlinear Seismic Analysis of Reinforced Concrete Buildings
(Elsevier, Amsterdam 1992), pp. 3–22.
BERTERO R. D. and BERTERO V. V. (2002), Performance-based
seismic engineering: the need for a reliable conceptual
comprehensive approach, Earthq. Eng. Struct. Dyn. 31, 627–
652.
BOMMER, J. J. and ELNASHAI, A. S. (1999), Displacement spectra for
seismic design, J. Earthq. Eng. 3(1) 1–32, Imperial College Press.
BORZI, B., CALVI, G. M., ELNASHAI, A. S., FACCIOLI, E. and BOMMER,
J. J. (2001), Inelastic spectra for displacement-based seismic
design, Soil Dyn. Earthq. Eng. 21, 47–61.
CHAI, Y. H. and FAJFAR, P. (2000), A procedure for estimating input
energy spectra for seismic design J. Earthq. Eng. 4(4), 539–561.
CHAPMAN, M. C. (1999), On the use of elastic input energy for
seismic hazard analysis, Earthq. Spectra 15(4), 607–635.
CHOU, C. C. and UANG, C. M. (2000), Establishing absorbed energy
spectra an attenuation approach, Earthq. Eng. Struct. Dyn. 29,
1441–1455.
CHOU, C. C and UANG, C. M. (2003), A procedure for evaluating
seismic energy demand of framed structures, Earthq. Eng. Struct.
Dyn. 32, 229–244.
DECANINI, L., MOLLAIOLI, F. and MURA A. Shear-beam model for the
prediction of the response of MDOF systems subjected to severe
earthquake ground shaking. In 12th European Conference on
Earthquake Engineering, paper 055 (Elsevier Science Ltd.,
London 2002).
DECANINI, L. and MOLLAIOLI, F. (1998), Formulation of elastic
earthquake input energy spectra, Earthq. Eng. Struct. Dyn. 27,
1503–1522.
DECANINI, L., MOLLAIOLI, F., PANZA, G., F. and ROMANELLI, F.
(1999), The realistic definition of the seismic input: an applica-
tion to the Catania area, In Earthquake Resistant Engineering
Structures II, (eds. Oliveto G. and Brebbia C. A.) (WIT press,
Boston), pp. 425–434.
DECANINI, L. D., MOLLAIOLI, F., SARAGONI, R. (2000), Energy and
displacement demands Imposed by near-source ground motions,
In Proceedings of the 12th World Conference on Earthquake
Engineering, January 29–February 4, (New Zealand, 2000),
paper 1136/6/A.
DECANINI, L., LIBERATORE, L. and MOLLAIOLI, F. (2003), Charac-
terization of displacement demand for elastic and inelastic SDOF
systems, Soil Dyn. Earthq. Eng. 23, 455–471.
DECANINI, L. D. and MOLLAIOLI, F. (2001), An energy-based meth-
odology for the assessment of the seismic demand, Soil Dyn.
Earthq. Eng. 21, 113–137.
DECANINI, L., MOLLAIOLI, F. and MURA, A. Simplified shear-type
model for the evaluation of the influence of ductility and stiffness
distribution patterns on multi-story structures, In XI Italian
National Conference ‘‘L’ingegneria Sismica in Italia’’, (Genova,
Italy, January 25–29 2004).
ESTES, K. R. and ANDERSON, J.C. (2002), Hysteretic energy demands
in multistory buildings. In 7th US NCEE (Boston). EERI
(Earthquake Engineering Research Institute), Oakland.
FAJFAR, P. (1992), Equivalent ductility factors taking into account
low-cycle fatigue, Earthq. Eng. Struct. Dyn. 21, 837–848.
FAJFAR, P. and GASPERSIC, P. (1996), The N2 method for the seismic
damage analysis of RC buildings, Earthq. Eng. Struct. Dyn. 25,
31–46.
FAJFAR, P. and VIDIC, T. (1994), Consistent inelastic design spectra:
hysteretic and input energy, Earthq. Eng. Struct. Dyn. 23, 523–
537.
GHOSH, S., COLLINS, K. R. (2002), Application of uniform hazard
energy spectra in reliability based seismic design. In 7th US
NCEE (Boston) EERI (Earthquake Engineering Research
Institute), Oakland.
GUPTA, A. and KRAWINKLER, H. (2000), Estimation of seismic drift
demands for frame structures, Earthq. Eng. Struct. Dyn. 29,
1287–1305.
HAO, T. Y. (2002), Energy of earthquake response: Recent devel-
opments, ISET J. Earthq. Technol. Paper No. 416, 39(1–2), 21–
53.
HORI, N. and INOUE, N. (2002), Damaging properties of ground
motions and prediction of maximum response of structures based
on momentary energy response Earthq. Eng. Struct. Dyn. 31,
1657–1679.
KALKAN, E. and KUNNATH, S. K. (2007), Effective cyclic energy as a
measure of seismic demand, J. Earthq. Eng. 11(5), 725–751.
KALKAN, E. and KUNNATH, S. K. (2008), Relevance of absolute and
relative energy content in seismic evaluation of structures, Adv.
Struct. Eng. 11(1), 1–18.
KRAWINKLER, H., MEDINA, R., MIRANDA, M. and AYOUB, A. (1999),
Seismic demands for performance-based design. In Proceedings
of the U.S.-Japan Workshop on Performance-Based Earthquake
Engineering Methodology for Reinforced Concrete Building
Structures, PEER Report 1999/10 (September 13, Maui, Hawaii).
258 F. Mollaioli et al. Pure Appl. Geophys.

KRAWINKLER, H., MEDINA, R. and ALAVI, B. (2003), Seismic drift
and ductility demands and their dependence on ground motions,
Eng. Struct. 25, 637–653.
LEELATAVIWAT, S., GOEL, S. C. and STOJADINOVIC, B. (1999), Toward
performance-based seismic design of structures. Earthq. Spectra
15(3), 435–461.
LEELATAVIWAT, S., GOEL, S. C. and STOJADINOVIC, B. (2002),
Energy-based seismic design of structures using yield mechanism
and target drift, J. Struct. Eng. 128(8), 1046–1054.
LEELATAVIWAT, S., SAEWON, W. and GOEL, S.C. (2009), Application
of energy balance concept in seismic evaluation of structures,
J. Struct. Eng. 135(2), 113–121.
LUCO, N., MANUEL, L., BALDAVA, S. and BAZZURRO, P. (2005),
Correlation of damage of steel moment-resisting frames to a
vector-valued ground motion parameter set that includes energy
demands, In USGS Award Final Report. (http://erpweb.er.usgs.
gov/reports/abstract/2003/sc/03hqgr0057.pdf).
MANFREDI, G. (2001), Evaluation of seismic energy demand,
Earthq. Eng. Struct. Dyn. 30, 485–499.
MIRANDA, E. (2000), Inelastic displacement ratios for structures on
firm sites, J. Struct. Eng., ASCE, 126(10), 1150–1159.
MIRANDA, E. (2001), Estimation of inelastic deformation demands
of SDOF systems, J. Struct. Eng., ASCE, 127(9), 1005–1012.
MIRANDA, E. and ASLANI, H. (2002), Approximate peak interstory
drift demands in buildings during earthquakes, In 7th US NCEE
(Boston).
MOLLAIOLI, F., BRUNO, S., DECANINI, L. and PANZA, G. F. (2006),
Characterization of the dynamical response of structures to dam-
aging pulse-type near-fault ground motions, Meccanica 41, 23–46.
MURA A. (2003), Sulla valutazione del potenziale di danno in termini
di spostamenti e di energia sui sistemi a piu gradi di liberta soggetti
ad eccitazione sismica (in Italian), Ph.D. Dissertation, Department
of Structural and Geotechnical Engineering, University of Rome
‘‘La Sapienza’’, Italy.
NASSAR, A. A. and KRAWINKLER H. (1991), Seismic demands for
SDOF and MDOF systems. In John A. Blume Earthquake
Engineering Center Report No. 95, Department of Civil
Engineering, Stanford University.
ORDAZ, M., HUERTA, B. and REINOSO E. (2003), Exact computation
of input-energy spectra from Fourier amplitude spectra, Earthq.
Eng. Struct. Dyn. 32, 597–605.
PANZA, G. F., ROMANELLI, F. and VACCARI F. (2000), Realistic
modelling of waveforms in laterally heterogeneous anelastic
media by modal summation, Geophys. J. Int. 143, 1–20.
PANZA, G. F., ROMANELLI, F. and VACCARI, F. (2001), Seismic wave
propagation in laterally heterogeneous anelastic media: theory
and applications to the seismic zonation, Adv. Geophys. Aca-
demic press, 43, 1–95.
PANZA, G. F., ROMANELLI, F., VACCARI, F., DECANINI, L. and
MOLLAIOLI, F. (2003a), Perspectives of innovative approaches in
seismic hazard evaluation. In SEE4 Fourth International Con-
ference of Earthquake Engineering and Seismology, 12–14 May
2003 Tehran, Islamic Republic of Iran (CD).
PANZA, G. F., ROMANELLI, F., VACCARI, F., DECANINI, L. and
MOLLAIOLI, F. (2003b), Seismic ground motion modelling and
damage earthquake scenarios: A bridge between seismologist
and seismic engineers. In OECD/NEA Workshop on The Relation
between Seismological Data and Seismic Engineering, 16–18
October 2002, Istanbul Turkey, NEA/CSNI/R(2003)18, 241–
266.
PRIESTLEY, M. J. N. and CALVI, G. M. (1997), Concepts and pro-
cedures for direct displacement-based design and assessment. In
Seismic Design Methodologies for the Next Generation of Codes
(eds. FAJFAR and KRAWINKLER) (Balkema, Rotterdam 1997).
REINOSO, E., HUERTA, B. and ORDAZ, M. (2002), Energy of strong
ground motion and structural response. In 12th European Con-
ference on Earthquake Engineering, Paper Reference 160
(Elsevier Science Ltd., London).
RIDDELL, R. and GARCIA, J. E. (2002), Hysteretic energy spectrum
and earthquake damage. In 7th US NCEE (Boston).
SENEVIRATNA, G. D. P. K. and KRAWINKLER, H. (1997), Evaluation of
inelastic MDOF effects for seismic design, (ed. John A. Blume)
Earthquake Engineering Center Report No. 120, Department of
Civil Engineering, Stanford University.
SHEN, J. and AKBAS, B. (1999), Seismic energy demand in steel
moment frames, J. Earthq. Eng. 3(4), 519–559.
TERAN-GILMORE, A. (1996), Performance-based earthquake-resis-
tant design of framed buildings using energy concepts, Ph.D.
Dissertation, Department of Civil Engineering, University of
California at Berkeley, 1996.
TERAN-GILMORE, A. (1998), A parametric approach to perfor-
mance-based numerical seismic design, Earthq. Spectra 14, 3.
TRIFUNAC, M. D. (2008), Energy of strong motion at earthquake
source, Soil Dyn. Earthq. Eng. 28, 1–6.
WHITTAKER, A., CONSTANTINOU, M. and TSOPELAS, P. (1998), Dis-
placement estimates for performance-based seismic design,
ASCE J. Struct. Eng. 124(8), 905–912.
(Received May 2, 2009, accepted October 22, 2009, Published online April 9, 2010)
Vol. 168, (2011) Correlations between Energy and Displacement 259