Embed Size (px)
Citation preview

CORRELATION BETWEEN BRAND LOYALTY AND
IMPULSE BUYING ON SARIWANGI TEA PT. UNILEVER
By:
Yoshua Wira Atmaja ID No: 011200800065
A thesis presented to the Faculty of Economics President University
in partial fulfillment of the requirements for Bachelor Degree in Economics Major in International Business
President University Cikarang Baru
Bekasi, Indonesia January 2012

i
THESIS ADVISER
RECOMMENDATION LETTER
This thesis entitled “CORRELATION BETWEEN BRAND LOYALTY AND
IMPULSE BUYING ON SARIWANGI TEA PT. UNILEVER.” Prepared and
submitted by Yoshua Wira Atmaja in partial fulfillment of the requirements for the
degree of Bachelor Degree in Economics - Major in Management – International
Business, has been reviewed and found to have satisfied the requirements for a thesis
fit to be examined. We therefore recommend this thesis for Oral Defense.
Cikarang, Indonesia, 11 January 2012
Acknowledged by: Recommended by:
Irfan Habsjah, MBA, CMA. Ir. Erny Estiurlina Hutabarat, MBA.
Head of Management Study Program Thesis Advisor

ii
PANEL OF EXAMINERS
APPROVAL SHEET
Herewith, the Panel of Examiners declare that the thesis entitled “CORRELATION
BETWEEN BRAND LOYALTY AND IMPULSE BUYING ON SARIWANGI
TEA PT. UNILEVER” submitted by Yoshua Wira Atmaja majoring in
(Management – International Business), faculty of Economics was assessed and
approved to have passed the Oral Examination on March 6th, 2012.
Chair - Panel of Examiner
Aditia Rusmawan, M.Sc.
Chairman
Ir. Erny Estiurlina Hutabarat, MBA
Examiner 1
Drs. Jozef Raco, MSc., M.A.
Examiner 2

iii
DECLARATION OF ORGINALITY
I declare that this thesis, entitled “CORRELATION BETWEEN BRAND
LOYALTY AND IMPULSE BUYING ON SARIWANGI TEA PT. UNILEVER”
is, to the best of my knowledge and belief, an original piece of work that has not been
submitted, either in whole or in part, to another university to obtain a degree.
Jakarta, Indonesia, 13th January 2012
Yoshua Wira Atmaja

iv
ABSTRACT
This study is about to analyze consumer behavior about Brand Loyalty and Impulse buying for buying Sariwangi Tea in indomaret west boulevard, Kelapa Gading, North Jakarta. This study aims to determine the relationship with brand loyalty on consumer impulse buying Sariwangi tea. In general, brand loyalty and consumer impulse buying Sariwangi tea is good. In this study used primary data obtained from questionnaires directly to the 50 (fifty) customers who purchase tea products Sariwangi. The questionnaire consisted of various statements about consumers' assessment of brand loyalty and impulse buying. Having tested the validity and reliability, followed by a descriptive analysis, test the product moment correlation and hypothesis testing using the test Z. The purpose of testing is to determine which items are statements that could represent the brand loyalty and impulse buying consumer minds between brand loyalty with impulse buying on Sariwangi tea products. The suggestions are given for brand loyalty is a factor as the producer PT Unilever Tea Sariwangi should be to keep doing new innovations, given the competition in this industry are very tight with the emergence of new arrivals and maintaining product quality assessed both by consumers and create loyal towards the brand. As for impulse buying factor that was considered quite good, PT Unilever more attention to the attitudes of consumers and create better strategies so that when consumers in any condition they are still buying or choosing Sariwangi tea.

v
ACKNOWLEDGEMENT
First of all I would like to thank to the greatest Tuhan Yesus Kristus for the blessing
and gave me the strength to finish this thesis. I would like to deliver my appreciation
to all people that always given me support to finish my study in President University,
especially to:
1. All of my family, my mom, my dad. Thank you for the support and love that
given to me.
2. My thesis adviser, Miss Erny Hutabarat for her patience to give me direction,
advices, supports to finish this thesis.
3. My Girlfriend Wendy for accompanied me during the thesis consultation.
4. All of my dormitory and President Universiy friends: Havel Arnold, Denny
Halim, Christian Jonathan, Dewa Arya, Derian Muljadi, Dennis Gazali, Daniel
Suryajaya, Roy Aurick, Justin Ryvan, Christian Andreas, Albert Japri, Adiputra,
Andreas Christian Sukiman, and XuChangkuan.
5. My Sugar Free band Rizky Fauzi, Fransiskus Felix, and Rinaldy.
6. My Mailto Band Denny, Adi, Teddy, Thero, Andrew, aki, Anis.
7. Committee of Farewell & Gathering International Business 24-11-2011 for the hot
and rocks party.
8. All of my friends in other majors which i cannot mention one by one.
Regards,
Yoshua Wira Atmaja

vi
TABLE OF CONTENT
Title .................................................................................................................................. Thesis Advisor Recommendation Sheet ...................................................................... i Panel of Examination Approval Sheet ....................................................................... ii Declaration of Originality .......................................................................................... iii Abstract ........................................................................................................................ iv Acknowledgement ........................................................................................................ v Table of Contents ........................................................................................................ vi List of Tables ............................................................................................................. viii List of Figures .............................................................................................................. ix Chapter I Introduction .................................................................................................................... 1 1.1 Background Of Study .............................................................................................. 1 1.2 Company Profile ...................................................................................................... 3 1.3 Problems Identified .................................................................................................. 4 1.4 Statement Of Problem .............................................................................................. 4 1.5 Research Objectives ................................................................................................. 4 1.6 Significance Of The Study ....................................................................................... 4 1.7 Theoretical Framework ............................................................................................ 5 1.8 Scope And Limitation .............................................................................................. 6 1.9 Hypothesis................................................................................................................ 6 1.10 Definition Of Terms ............................................................................................... 6 Chapter II Literature Review ........................................................................................................... 7 2.1 Marketing ................................................................................................................. 7 2.2 Brand ........................................................................................................................ 7 2.3 Brand Loyalty .......................................................................................................... 9 2.4 Purchase ................................................................................................................. 14 2.5 Impulse Buying ...................................................................................................... 14 Chapter III Methodology ................................................................................................................ 17 3.1 Research Method ................................................................................................... 17 3.2 Research Instruments ............................................................................................. 17 3.2.1 Dimensions and Indicators of Brand Loyalty ....................................... 18 3.2.2 Dimensions and Indicators of impulse Buying ..................................... 19 3.3 Sampling Design .................................................................................................... 20 3.3.1 Population ............................................................................................. 20 3.3.2 Sample ................................................................................................... 20 3.3.3 Data ....................................................................................................... 21 3.4 Data Collection Techniques And Data Processing Techniques ............................. 21 3.4.1 Data Collection Techniques .................................................................. 21 3.4.2 Data Processing Techniques ................................................................. 22 3.4.3 Data Analysis Techniques ..................................................................... 26 3.5 Hypothesis Testing ................................................................................................. 29 3.6 Limitations ............................................................................................................. 29

vii
Chapter IV Analysis Of Data And Interpretation Of Result ........................................................... 30 4.1 Qualitative Analysis ............................................................................................... 30 4.1.1 Qualitative Analysis Of Brand Loyalty ............................................... 31 4.1.2 Qualitative Analysis Of Impulse Buying ............................................. 38 4.1.3 Correlation Coefficient ........................................................................ 44 4.2 Test Of Hypotheses ................................................................................................ 45 Chapter V Conclusion And Recommendation .............................................................................. 47 5.1 Conclusion ............................................................................................................. 47 5.2 Recommendation ................................................................................................... 48 References ................................................................................................................... 49 Appendix ..................................................................................................................... 51

viii
List Of Tables
Table 3.1 Questionnaire Indicators For Brand Loyalty ............................................... 18 Table 3.2 Questionnaire Indicators For Impulse Buying ............................................. 19 Table 3.3 Likert Scale .................................................................................................. 22 Table 3.4 Test Result Validity of Brand Loyalty Questionnaire Variables ................. 24 Table 3.5 Test Result Validity of Impulse Buying Questionnaire Variables .............. 25 Table 3.6 Measurement Criteria .................................................................................. 27 Table 4.1 Distribution Respondent By Gender ............................................................ 33 Table 4.2 Distribution Respondent By Age ................................................................. 33 Table 4.3 Questionnaire about Brand Loyalty 1 .......................................................... 34 Table 4.4 Questionnaire about Brand Loyalty 2 .......................................................... 35 Table 4.5 Questionnaire about Brand Loyalty 3 .......................................................... 35 Table 4.6 Questionnaire about Brand Loyalty 4 .......................................................... 36 Table 4.7 Questionnaire about Brand Loyalty 5 .......................................................... 36 Table 4.8 Questionnaire about Brand Loyalty 6 .......................................................... 37 Table 4.9 Questionnaire about Brand Loyalty 7 .......................................................... 37 Table 4.10 Questionnaire about Brand Loyalty 8 ........................................................ 38 Table 4.11 Questionnaire about Brand Loyalty 9 ........................................................ 38 Table 4.12 Questionnaire about Brand Loyalty 10 ...................................................... 39 Table 4.13 Questionnaire about Brand Loyalty 11 ...................................................... 39 Table 4.14 Questionnaire about Brand Loyalty 12 ...................................................... 40 Table 4.15 Questionnaire about Brand Loyalty 13 ...................................................... 40 Table 4.16 Questionnaire about Impulse Buying 1 ..................................................... 41 Table 4.17 Questionnaire about Impulse Buying 2 ..................................................... 41 Table 4.18 Questionnaire about Impulse Buying 3 ..................................................... 42 Table 4.19 Questionnaire about Impulse Buying 4 ..................................................... 42 Table 4.20 Questionnaire about Impulse Buying 5 ..................................................... 43 Table 4.21 Questionnaire about Impulse Buying 6 ..................................................... 43 Table 4.22 Questionnaire about Impulse Buying 7 ..................................................... 44 Table 4.23 Questionnaire about Impulse Buying 8 ..................................................... 44 Table 4.24 Questionnaire about Impulse Buying 9 ..................................................... 45 Table 4.25 Questionnaire about Impulse Buying 10 ................................................... 45 Table 4.26 Table Summary Of Responses Of Sariwangi Brand Loyalty Variables .... 46 Table 4.27 Table Summary Of Responses Of Sariwangi Impulse Buying Variables . 47

ix
List Of Figures
Figure 1.1 Theoretical Framework .............................................................................. 19 Figure 3.1 Interval ........................................................................................................ 27 Figure 3.2 Correlation Coefficient Spearmen .............................................................. 28 Figure 3.3 Z Formula ................................................................................................... 29 Figure 4.1 Correlation Coefficient Result .................................................................... 45 Figure 4.2 Hypothesis .................................................................................................. 46

1
Chapter 1
INTRODUCTION
1.1 Background of the study It's been popping up a lot of instant food and beverage products. Development of
mature products is increasing rapidly from time to time. There are always
innovations that made these companies so that consumers remain loyal to use the
product. As a country that also produces tea, not a few people who have habits of
drink hot or cold tea.
Among many other tea products, Sariwangi is one product that is consumed by the
Indonesian community. Proved by Sariwangi successfully rejuvenated the
declining Indonesian leaf tea market. Tea bag segment has increase of its share in
last 4 years primarily on account of very aggressive conversion drive undertaken
by Sariwangi from packet tea to tea bags. Some activity to increase of usership of
Sariwangi done by building through tea consumption increase of moment, recipes,
tea & health campaigns and other experiential activity. Sariwangi is the only tea
brand That tide up the Indonesian archipelago, and consistently Communicate the
warm of togetherness. One of its activity is "Warmer Sariwangi Closer (closer is
warmer) in 2005. In 2006, Sariwangi held Sariwangi Car Mudik Where We help
family in getting "real" connected amongst the nuclear family has a ritual of the
WHO home village every year. We facilitate the 'process' through Car Mudik
Sariwangi. In 2006 & 2007 Sariwangi got ICSA (Indonesia Customer Satisfaction
Award) held by SWA and Frontier. In 2006, the Consumer Packaging Awarded
Sariwangi Branding Award as "Gold" category, conducted by SWA magazine,
Mix magazine, Landor, dm Associates, and Imago School of Modern Advertising.
http://www.unilever.co.id/brands/foodsbrands/Sariwangi/
One effort to retain customers is through the effort to increase customer loyalty
towards the brands they consume. customer loyalty to the brand will be the key to
success for the company to compete, both in the short and long term.

2
Although consumers already believe in one particular brand, but it is not
uncommon consumers do not buy these brands, but buy another brand. This is
caused by an impulse purchase. impulse purchases can be described as a choice
made on the spot because of strong positive feelings about an object. There are
several reasons consumers buy goods outside the plan. consumers might be
affected by the ads that he watched before, attractive packaging, displays a
prominent, the desire to try new stuff, cheap prices or sales promotion girl
persuasion.
For consumers who have brand loyalty to a particular item, may rarely make
impulse buying, especially consumers who always make a list of what items
should be bought and really needed. consumers are satisfied with a particular
product, is likely to continue buying and using the product. advantage of
consumers would recommend these products to other consumers. sense of
satisfaction itself is a level of one's feelings after comparing the performance
(results) that he felt compared to his expectations.
Some people have been doing research on the same topic, as has been done by
Lilik Triana and Ghina Noeraini (2006), entitled "RELATIONSHIP WITH
IMPULSE BUYING A BRAND LOYALTY (Case Study On Student STEI
Sunsilk Shampoo Users)". This study aims to know the relationship between
brand loyalty with impulse buying, the respondents were 71 people who use
Sunsilk shampoo for 1 year.
Based on the descriptions and the reasons above, the authors are interested to
elaborate on this thesis with the title,” Correlation between brand loyalty and
impulse buying on Sariwangi tea.”

3
1.2 Company Profile PT Unilever Indonesia Tbk (the company) was founded on December 5, 1933 as
Zeepfabrieken NV Lever by deed. 33 made by Tn.A.H. Van Ophuijsen, notary in
Batavia. This deed was approved by the Governor-General Van Negerlandsch-
indie with a letter of No.. 14 on December 16, 1933, registered at the Raad van
Justitie at Batavia with No. 302 on December 22, 1933 and published in Javasche
Courant on January 9, 1934 Supplement. 3.
Made by the notary Ny. Kartini Mulyadi dated July 22, 1980, the company name
was changed to PT Unilever Indonesia. By deed no. 92 made by the notary Mr.
Mudofir Hadi, SH dated June 30, 1997, the company name was changed to PT
Unilever Indonesia Tbk. This deed was approved by the Minister of Justice with
No decision. C2-1.049HT.01.04TH.98 dated February 23, 1998 and published in
the State. 2620 May 15, 1998 Supplement. 39. The Company is engaged in the
production of soaps, detergents, toothpaste, margarine, vegetable oils and foods
made from milk, ice cream, food and beverages of tea and cosmetic products.
As approved at the Annual General Meeting of the Company on June 13, 2000,
which stated in notarial. 82 made by the notary Singgih Susilo, SH dated June 14,
2000, the company also acts as the primary distributor and provides marketing
research services. This deed was approved by the Minister of Law and Legislation
(formerly the Minister of Justice) of the Republic of Indonesia with the decision
No.. C-18482HT.01.04-TH.2000.
On 22 November 2000, the company entered into an agreement with PT Pelangi
Indah Grace, to establish a new company namely PT Anugrah Lever (PT AL)
engaged in the manufacture, development, marketing and sales of soy sauce, chili
sauce and other sauces with trademark Bango, Parkiet and Sakura and other
brands on the basis of company's license to PT AL.

4
1.3 Problems Identified In this thesis writer identify factors that cause purchase of Sariwangi tea product.
The factors identified base on two variables which is Brand Loyalty and Impulse
Buying.
1.4 Statement of the Problem As for the problems that can be identified based on brand loyalty research topics
relationship with impulse buying:
1. What factors that influenced Brand Loyalty?
2. What factors that influenced Impulse Buying?
3. How is the Correlation between Brand Loyalty and Impulse Buying?
1.5 Research Objectives Purpose of making of this research are:
1. To analyze the factors that influence brand loyalty.
2. To analyze the factors that influence impulse buying.
3. To analyze whether there is a relationship between brand loyalty toward
impulse buying.
1.6. Significance of the Study
The benefits to authors of a study on the relationship with the impulse buying of
brand loyalty:
1. For the company
Can provide information concerning the application packaging strategies that
need to be improved and can be used as a material consideration in decisions to
improve company performance.
2. The other side
Can provide useful information if you want to give the topic the brand loyalty
relationship with impulse buying.
5
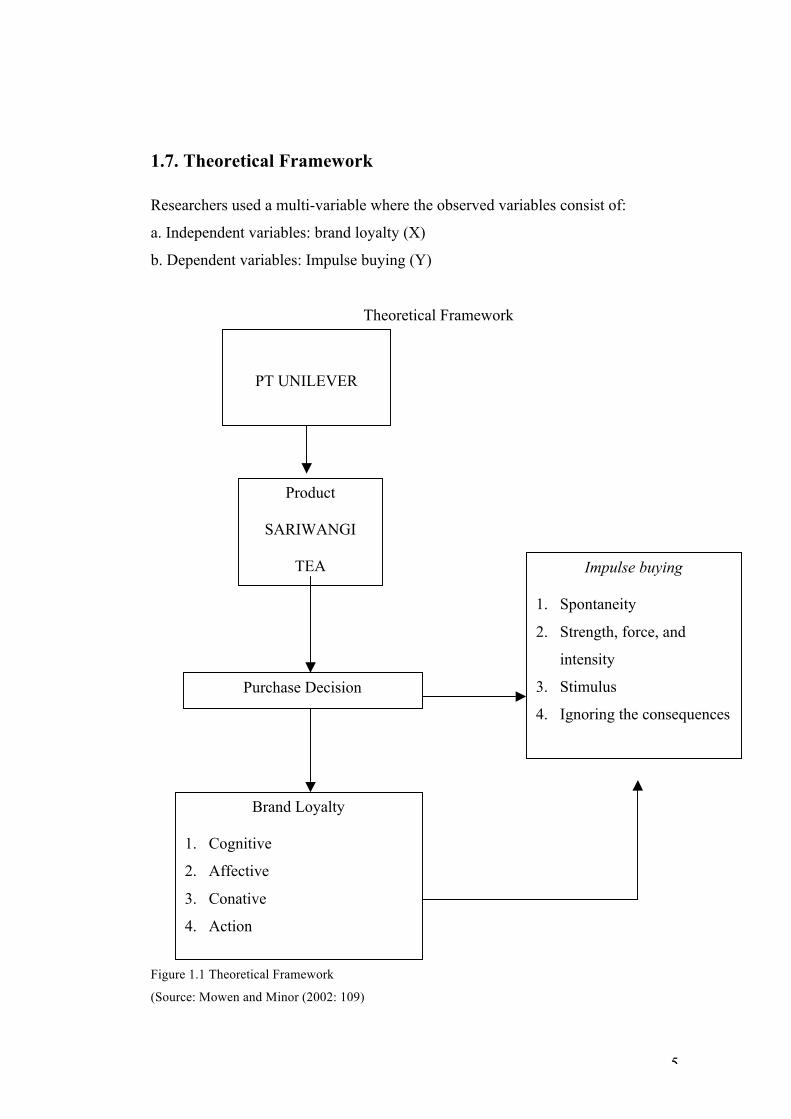
1.7. Theoretical Framework
Researchers used a multi-variable where the observed variables consist of:
a. Independent variables: brand loyalty (X)
b. Dependent variables: Impulse buying (Y)
Theoretical Framework
Figure 1.1 Theoretical Framework
(Source: Mowen and Minor (2002: 109)
Product
SARIWANGI
TEA
Purchase Decision
Impulse buying
1. Spontaneity
2. Strength, force, and
intensity
3. Stimulus
4. Ignoring the consequences
Brand Loyalty
1. Cognitive
2. Affective
3. Conative
4. Action
PT UNILEVER

6
1.8 Scope and Limitation Based on the limitations that will be contained in this study such as time, cost and
manpower available, writer use 50 respondents from total 80 population
customers who buy Sariwangi Tea, and located in Indomaret West Boulevard,
Kelapa Gading, North Jakarta.
1.9 Hypothesis The hypothesis is basically an assumption or conjecture while that may be true,
and is often used as a basis for decision making or problem solving or to base
further research. Presumption or assumption as a hypothesis is also an abstract
data remains to be substantiated. However, because of the possibility could be
wrong, and when will be used as a basis for decision-making should be tested in
advance using research data. Based on the background of the problem and the
existing framework, the authors hypothesized in this thesis are:
Ho: There is no correlation between brand loyalty and impulse buying on
consuming Sariwangi Tea.
Ha: There is a correlation between brand loyalty and impulse buying on
consuming Sariwangi Tea.
1.10 Definition Of Terms A detailed explanation of specific terms used in the study are:
Brand Loyalty: The situation in which a consumer generally buys the same
manufacturer-originated product or service repeatedly over time rather than
buying from multiple suppliers within the category.
Impulse Buying: Impulse buying is an attitude or behavior of consumers in
making purchasing decisions without a plan.

7
Chapter 2
LITERATURE REVIEW
2.1 Marketing Increasingly strict business sense requires the company to always pay attention to
the field of marketing. Since marketing is recognized as a key to success, many
companies began to think of a good marketing concept.
According to Kotler (2001: 9) definition of marketing is "a social process in which
individuals and groups obtain what they need and want by creating, offering and
freely exchanging products of value with others".
Meanwhile, according to Lamb, Hair, McDaniel (2001: 6) "marketing is a process
of planning and running the concept, pricing, promotion and distribution of ideas,
goods and services to create exchanges that can satisfy individual and
organizational objectives".
From some marketing definitions above, it can be concluded that the core of
marketing activities is a process of exchange or transfer of products from the
producer to the consumer or can also be interpreted as satisfying targeted
customers with a superior bid.
2.2 Brand Brand (brand) is a name, term, sign, symbol, design or combination of these
things are intended to identify goods or services from a person or group of sellers
and to differentiate it from competitors' products, (Kotler, 2000: 460).
Meanwhile, according to Terence. A. Shimp (2003: 8): "The brand is a name,
term, sign, symbol, design, or a combination of the whole that are intended to
identify goods or services from a seller or group of sellers, to be distinguished
from its competitors".
A good brand makes consumers feel satisfied with the choices he has made, to
buy and use. A good brand will always be on the minds of consumers so as to
make the consumer always remember the brand when going to need a product or
8
service. Brand has an important role to identify a product, a misconception of
consumers towards the brand will be fatal and cause the consumer can not capture
the value and purpose of existing brands. Basically a brand is also a seller's
promise to consistently give privileges, benefits, and certain services to the buyer.
Brand is a complex symbol of a product and can provide 6 meanings, namely:
1. Attribute
Brand gives an overview of the nature of the products of the brand itself and
reminiscent of certain attributes.
Example: Helpless high resistance, expensive, upscale.
2. Benefit
Attributes of a brand must be translated in the form benefits both in terms of
function and emotion.
Example: high-endurance attributes can be translated to mean that the product
uses high quality materials compared to other products.
3. Value
Brand also says something about the product, the manufacturer or brand owner,
and customer value ..
Example: Mercedes is always synonymous with a highly capable car, with a high
security level, as well as a great prestige.
4. Culture
Brand also represents a certain culture.
Example: Mercedes can describe the culture of the German state that completely
orderly, efficient, and high quality.
5. Personality
Brand also reflects the personality of the wearer ..
Example: use a classy Mercedes symbolizes the personality of the wearer.

9
6. User
Brand can indicate the type of consumers who buy or use these products.
Example: an overview of the consumers who use the Mercedes is a top executive
who is old and not a student who is still young.
According to Philips Kotler (2002: 461) there are 4 levels of brand:
1. Brand Awareness (brand awareness)
2. Brand Acceptability (acceptance brand)
3. Brand Preference (brand preferences)
4. Brand Loyalty (brand loyalty)
2.3 Brand Loyalty Brand loyalty is formed through a learning process, ie a process where the
consumer through his experience trying to find a brand that best suited him, in a
sense the product of the brand can give satisfaction to the expectations and needs.
Consumers are continuously trying different brands before finding a brand that
truly fits.
Customer satisfaction will remain an important part in brand loyalty. Usually
result in brand loyalty and repeat buying recommended buying. If consumers are
satisfied with the performance of a brand will continue to buy brand, use it and
even tell others of the advantages the brand based on consumer experiences in
using the trademark. If consumers are satisfied with a particular brand and often
buy the product then can be said that a high level of brand loyalty, on the contrary,
if consumers are not too satisfied with a particular brand and tend to buy products
with different brand then the low level of brand loyalty. Satisfaction of consumer
needs to be maintained and enhanced in order to create and maintain loyalty to the
brand.
Like what was said by J. Paul Peter and Jerry C. Olson (1999: 161), viewed from
the perspective of the marketing strategy of brand loyalty is a very important
concept. Especially in a market with very low growth rate but has a very strict

10
level of competition, the existence of consumers who are loyal to the brand is
needed so the company can survive.
According to Aaker (1995), quoted by Ali Hasan in his book "Marketing" (2008:
79) states that customer loyalty to the brand is one of the brand assets, which
indicates a high value of loyalty, because to build a lot of challenges to be faced
and the need a very long time.
Meanwhile, according to John C. Mowen and Michael Minor (2002: 109), the
wisdom of a customer shows a positive attitude towards a brand, is committed to a
particular brand, and intend to continue to buy them in the future.
There are two approaches to understanding brand loyalty:
1. behavioral approach
See behavioral approach to the purchase of brand loyalty based on brand.
A. A series of brand choice (brand-choicesequence)
Example:
If A, B, C, D, F are the brands in a particular product group, category brand
loyalty may use the classification of brown in the purchase of the following
sequence:
1. Loyalty is an integral (undivided loyalty): AAAAAA
2. Loyalias the integral (devided loyalty): ABABAB
3. Loyalty is not stable (unstable loyalty): AAABBB
4. Without loyalty (no loyalty): ABCDEF
Above sequence is modified by Mowen and Minor (2002: 109) as follows:
1. Loyalty as the integral (devided loyalty): AAAAAAAA
2. Loyalty is an integral (undivided loyalty): AAABBAABBB
3. The transition from time to time (occasional switches): AABAAACAADA
4. Loyalty switch (switch loyalty): AAAABBB
5. Indifference brand: ABDCBACD

11
B. Proportion of purchase
Example:
Loyalty of the two brands will indicate the proportion of purchases devoted to
the two brands in a particular group, three brand loyalty, and so on.
C. Brand Preference
This method uses a psychological commitment or statement of preference.
Brand loyalty is considered to be considered a "positive attitude" towards a
particular product.
D. Brand Commitment
Brand commitment is defined as emotional participation in a brand within a
product category. (Beatty, Kahle, and Homer, 1988, quoted by Ali Hasan
(2008: 94)). When more than 50 percent of consumer purchases of a particular
brand for a period of time, then the consumer is said to be loyal to the brand.
2. Approach to attitude
This approach determines the brand loyalty based on consumer attitudes and
behavior.
A consumer is said to have brand loyalty if he delayed the purchase or look for
another brand, if the desired brand is not available at the place of purchase.
indicators:
a. (no loyalty)
If the attitudes and repeat purchase behavior of customers are equally weak,
then loyalty is not formed.
b. (spurious loyalty)
Weak attitude with a high repeat purchase patterns, this type of situation is
marked by the influence of non-attitudes toward behavioral factors, such as

12
subjective norms and situational factors.
Example: a strategic product placement on shelves, the location of outlets in
shopping centers, or discount factor.
c. (latent loyalty)
This situation occurs when a strong stance with a weak pattern of repeat
purchase.
Example: a person's positive attitude towards a particular restaurant, but he is
still looking for another restaurant to be a variation on account of price or
preference for a variety of foods.
d. (loyalty)
This situation is an ideal situation that most expected the marketers, where
consumers are positive about the product or the manufacturer with purchase of
repeated consistently.
In general, the number of stages that can be incorporated into a limited scale
loyalty. A discussion of the loyalty scale is more focused on the elements of stage
sampeled the following scale:
a. Cognitive Stage:
Consumers use a base of information that forces point to one brand over other
brands. For example, a supermarket are consistently offer lower prices than
existing competitors. This information is enough to force consumers to always
shop at the supermarket.
b. Affective stage
Attitude is a function of expectations in the initial period of purchase and is a
function of the previous attitude of satisfaction in the next period plus. The
emergence of affective loyalty is driven by factors of satisfaction. But not
ensure loyalty.
13
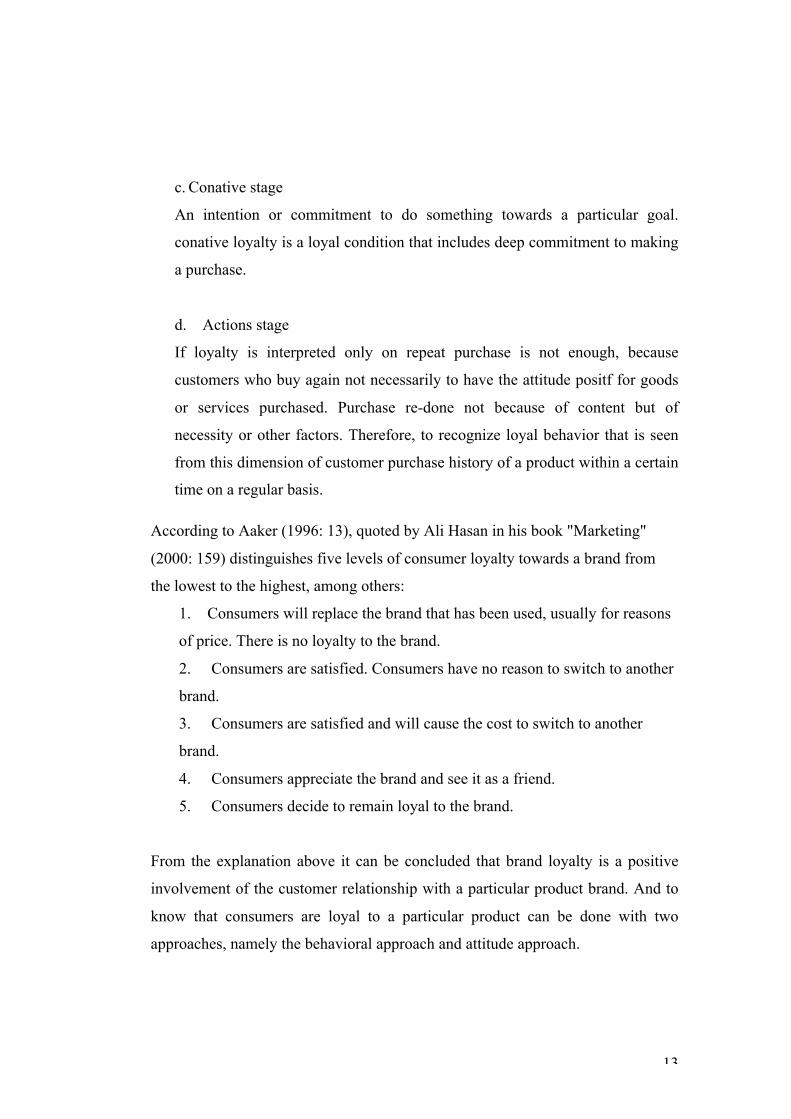
c. Conative stage
An intention or commitment to do something towards a particular goal.
conative loyalty is a loyal condition that includes deep commitment to making
a purchase.
d. Actions stage
If loyalty is interpreted only on repeat purchase is not enough, because
customers who buy again not necessarily to have the attitude positf for goods
or services purchased. Purchase re-done not because of content but of
necessity or other factors. Therefore, to recognize loyal behavior that is seen
from this dimension of customer purchase history of a product within a certain
time on a regular basis.
According to Aaker (1996: 13), quoted by Ali Hasan in his book "Marketing"
(2000: 159) distinguishes five levels of consumer loyalty towards a brand from
the lowest to the highest, among others:
1. Consumers will replace the brand that has been used, usually for reasons
of price. There is no loyalty to the brand.
2. Consumers are satisfied. Consumers have no reason to switch to another
brand.
3. Consumers are satisfied and will cause the cost to switch to another
brand.
4. Consumers appreciate the brand and see it as a friend.
5. Consumers decide to remain loyal to the brand.
From the explanation above it can be concluded that brand loyalty is a positive
involvement of the customer relationship with a particular product brand. And to
know that consumers are loyal to a particular product can be done with two
approaches, namely the behavioral approach and attitude approach.

14
2.4 Purchase One of the consumer behavior in the search for a product that is purchase. Once
the consumer takes an item and consumers seeking information about the product
you are looking for, then the consumer decides to purchase the needed products.
Consumers decide which alternative will be selected and possibly a replacement if
needed, then he will make a purchase.
Engel Blackwell and Miniard (1995), quoted by Ujang Sumarwan his book
entitled "Consumer Behavior" (2004: 310) reveal the purchase of products or
services that are performed by consumers can be classified into 3 types of
purchases:
1. Purchase a fully planned.
Consumers determine the choice of products and brands long before the
purchase is made.
2. Purchase a half-planned
Consumers already know wants to buy a product before entering the store /
supermarket, but he did not know what brand will be bought until he could
obtain complete information from the clerk or display in a store / supermarket.
3. Unplanned purchases
Consumers buy a product without premeditation. The desire to buy only
comes after they were in the store.
2.5 Impulse Buying Have you ever bought items that are not planned for when shopping?. Initially
wanted to buy the products A, but when you come home to find a shopping bag
filled with some of the product B. This is called impulse buying, which is an
unplanned purchase decision. The purchase occurred because the consumer is
stimulated by various factors. Impulse buying is also called consumtivisme. Both

15
are like a dark and humid room for the growth of mold, and mildew that is
impulse buying or buying appetite and keep buying.
According to John C. Mowen and Michael Minor (2002: 10), impulse buying is
the act of buying a previously not recognized consciously as a result of a
consideration, or purchase intention formed before entering the store. In plain
english, impulsive buying is an impulse that suddenly full of strength, to survive
and not planned to buy something directly without considering the consequences.
Impulsive purchases are very closely related to compulsive consumption is
defined as a response to uncontrolled impulse, the desire to acquire, use, or
experience a feeling, or activity that leads individuals to repeatedly engage in
behaviors that ultimately harm the individual or others.
Purchase by seeking diversity refers to the spontaneous tendency of consumers to
buy brand new products, although they continued to express their satisfaction with
the old brand. Consumers are doing it is because consumers are trying to reduce
their saturation of the old brand and try to buy new brands.
According to James E. Engel, Roger D. Blackwell and Paul W. Miniard (2006:
91), impulse buying occurs suddenly, often the desire is very strong and persistent
unexpectedly. Impulse buying is a pleasure that is difficult and is stimulated by
emotional conflict. And leads to reduced consequences.
There are several reasons consumers buy goods outside the plan. Consumers
might be affected by the ads that she saw earlier, the packaging is attractive, the
desire to try new stuff, cheap prices, layout, product completeness, persuasive
sales promotion girl (SPG), and sales promotion.
Impulse buying several characteristics, namely:
1. Spontaneity.
Unpredictable and motivating to instantly purchase, directly responding to
visual stimuli of goods, the goods-sold.
2. Strength and intensity of coercion.
Can motivate to take action immediately.
3. stimulus
The urge to buy all of a sudden is often accompanied by emotional character.

16
4. ignoring the consequences
Buying suddenly become very attractive and the consequences to be
overlooked.
Impulse buying by Private Basu (1995: 21) can be divided into:
a. Suggestion buying, the purchase without a plan and based on the advice of
others.
b. Reminder buying, the purchase of the first plan is not based on memory alone.
Consumer loyalty to brands is a top priority for the company, the company should
be able to maintain the level of consumer loyalty to the brand they created. There
are several factors that can maintain a level of consumer loyalty to brands, among
others, the quality of these products, either from taste, benefits, forms, colors, and
price.
Impulse buying is an attitude or behavior of consumers in making purchasing
decisions without a plan. The decision was made because of consumers by various
factors, such as ads in the media, the desire to try the product or brand new, it's a
good sales pitch from the discounts offered or because the persuasion of sales
promotion, or because the laying of strategic goods or products within the store.
To be able to find the fit between brand loyalty with impulse buying, then we
will analyze every statement that there would then tested the validity and
reliability. Then proceed with the descriptive analysis, correlation test, and test
hypotheses. For more details in a systematic framework can be depicted in
diagrammatic form, the relationship between brand loyalty with impulse buying at
PT Unilever, the product Sariwangi Tea.

17
Chapter 3
METHODOLOGY
3.1 Research Method In conducting the study, the type of research used is descriptive quantitative
research, where researchers try to define and identify a number of data obtained in
the field of the facts related to the problem that aims to give a clear picture of the
object of research.
According Sugiyono (2005: 83)"This study is a descriptive study conducted to
determine the value of independent variable, either one or more variables
(independent), without making comparisons or connect with other variables.”
Researchers used data types are data quantitative, quantitative research refers to
the systematic empirical investigation of social phenomena via statistical,
mathematical or computational techniques. The objective of quantitative research
is to develop and employ mathematical models, theories and/or hypotheses
pertaining to phenomena
.
3.2 Research Instrument Writer try to divine factor based on the theory mentioned above about Brand
loyalty and Impulse Buying. And use 50 Respondent from 80 Population in
Indomaret West Boulevard, Kelapa Gading, North Jakarta.
3.2.1 Dimensions and indicators of brand loyalty
Each factor of Brand Loyalty will be divide into several section to create
questions for questionnaire.

18
Table 3.1
Questionnaire Indicators for Brand Loyalty
3.2.2 Dimensions and indicators of Impulse buying
Variables Dimensions Indicators No
Brand Loyalty
(X)
1. Cognitive 2. Affective
− The brand has good quality − The brand has competitive
cost − The brand has a advantage − The brand give satisfaction − The Brand has the
involvement to customer − Consumers have a preference
for the brand − Consumers have the
consistency of the brand − Consumers have expectations
about the brand
1 2
3, 4 5 6 7 8 9
2. Conative 3. Action
− Consumers have a commitment to the brand is to make the purchase again
− Consumers have the
consistency of the brand in consuming
− Consumers have the hope that more of the brand
− Consumers have a
commitment to a brand − Consumers regularly purchase
action − Stable prices resulted
consumers regularly purchase
10
11
12
13
14
15

19
Each factor of Impulse Buying will be divide into several section to create
questions for questionnaire.
Table 3.2
Questionnaire Indicators for Impulse Buying
Variables Dimensions Indicators No
Impulse buying
(Y)
1. Spontaneity 2. Strength and
intensity of coercion
− The situation is not unexpected
− The motivation for immediate purchase
− Influenced by a visual form such products
− The motivation is influenced
by circumstances − Perform immediate actions
are influenced by circumstances
1 2 3 4 5
3. Stimulus 4. Ignore the
consequences
− Purchase of a sudden because
of the urge to have a good − Influenced by the state of
consumer psychology − Purchase suddenly become
very attractive − Measures purchases made
without forethought
6 7,8 9 10

20
3.3 Sampling Design Writer identify and choose sample from the population that give the best feedback
about Sariwangi Tea, and analize the data given with validity testing to know
wich not valid question must be remove.
3.3.1 Population
According to Kuncoro (2003:103) "Population is the complete element, which is
usually a person, object, transaction, or occurrence in which we are interested to
learn it or make the object of research.
Meanwhile, according to Sugiyono (2003:72) is the generalization of the
population consisting of objects or subjects that have certain qualities and
characteristics that set by the researchers to learn then drawn conclusions.
As for the population in this study are the customer who know and consuming
Sariwangi tea product that live in Kelapa Hibrida area, Kelapa Gading.
3.3.2 Sample
Sample is a subset of the population units (Kuncoro 2003:103). Samples taken
must be completely representative or representative of this research.
Researchers took 50 (fifty) neighbors around who knew and still consume
Sariwangi Tea, this is based on the opinion and Sofyan Singarimbun Masri
Effendi (1995:171), namely the number of samples must be greater than or equal
to 30.
In this study, the withdrawal is done using non-probability methods or non-
random, which is a way that is based that all elements of the population do not
necessarily have the same opportunities to be elected as members of the sample.
And among some way contained in this method is purposive sampling technique,
ie the sample is addressed only to consumers who know and never consume
Sariwangi Tea.

21
3.3.3 Data
To obtain such data can be done by collecting it in two ways, namely:
1. Primary Data
The data obtained by field survey using all the original data collection methods
(Kuncoro, 2003:127)
2. Secondary Data
Secondary data is primary data obtained further and presented either by primary
data collectors or others (Omar, 2003:130). Authors in getting secondary data by
studying books and literature related to research problems. Moreover, the authors
also do a direct citation of the theories that are the foundation in the writing of this
thesis, where the writing is directly done by reading books and literature related to
research problems.
3.4 Data Collection Techniques And Data Processing Techniques In this section writer try to explain the process of data gathered. All of the data
that collected from the questionnaires will be tested in validity and reliability
method.
3.4.1 Data Collection Techniques
The data obtained were collected in several ways, namely:
1. The research literature (Research library)
This study aimed to obtain data that is theoretical, which is done by collecting the
materials from which the authors follow the lecture notes during lectures. In
addition, also carried by reading books, literature-literature, and some results of
research conducted at this time as a basis for comparison in the discussion, this
course is limited to books that have anything to do with the problems discussed.

22
2. Questionnaire
In this study, techniques of data collection is done by using a questionnaire. The
questionnaire is a list of questions prepared in writing, addressed to the
respondent (Mudrajad Kuncoro, 2003:155). The questionnaire was conducted
with a check list on how to give answers that are considered most appropriate.
The writer to spread the questionnaire to 50 respondents directly. This meant that
the authors obtain accurate data.
3.4.2 Data Processing Techniques
Data processing technique used is to perform measurements of the independent
variables (independent) and the dependent variable (dependent). The meter used is
to use a Likert scale and is calculated by using SPSS. Likert scale used to measure
attitudes, opinions and perceptions of a person or group of people about the
phenomenal social (Sugiyono, 2002: 86). To fill the Likert scale (Sugiyono, 2002:
87) in the instrument of research has provided an alternative answer to the point
answer is worth 1 to 5 alternatives tailored to the selected answer for each
question. The five ratings were given powder as follows:
Tabel 3.3 Likert Scale
Point Appraisal 5 Strongly agree (SS)
4 Agree (S)
3 Fair (R)
2 Disagree (TS)
1 Strongly disagree(STS) (Sugiyono, 2002: 88)

23
The main data collection techniques in the study was conducted by distributing
questionnaires to a population that is considered representative. The questionnaire
used is to be closed, the respondent may have only one answer. Provided for each
question in the questionnaire obtained and then made the analysis in order to be a
picture that helps in problem solving. Measuring instrument used was a Likert
scale, which further scale is used to obtain information from respondents on the
variables studied.
The results of questionnaires that have been collected directly into SPSS version
16.0 for windows. The whole question and the answers tested beforehand to
determine the level of validity and its reliability.
a. Validity Test
Test validity is the extent to which a measuring device that can measure what you
want done (Omar, 2003: 179). Valid means that the research could be used to
measure what should be measured (Sugiyono, 2003: 109). This test shows the
level of functioning ability of the measuring device in order to deliver what the
principal regulator of the target. Gauges at the validity of this study using the
product moment correlation technique.
According Singgih (2002: 277) the validity of the data can be inferred based on
the decision:
1. If a positive result, and the results r> r table, then the data is valid.
2. If r is a positive result, and the results r <r table, then the data is invalid.
The trial is using the 20 cases, then df = 15-2 = 13, with a significance level of 5%
is obtained for r tables 0.2992.
24
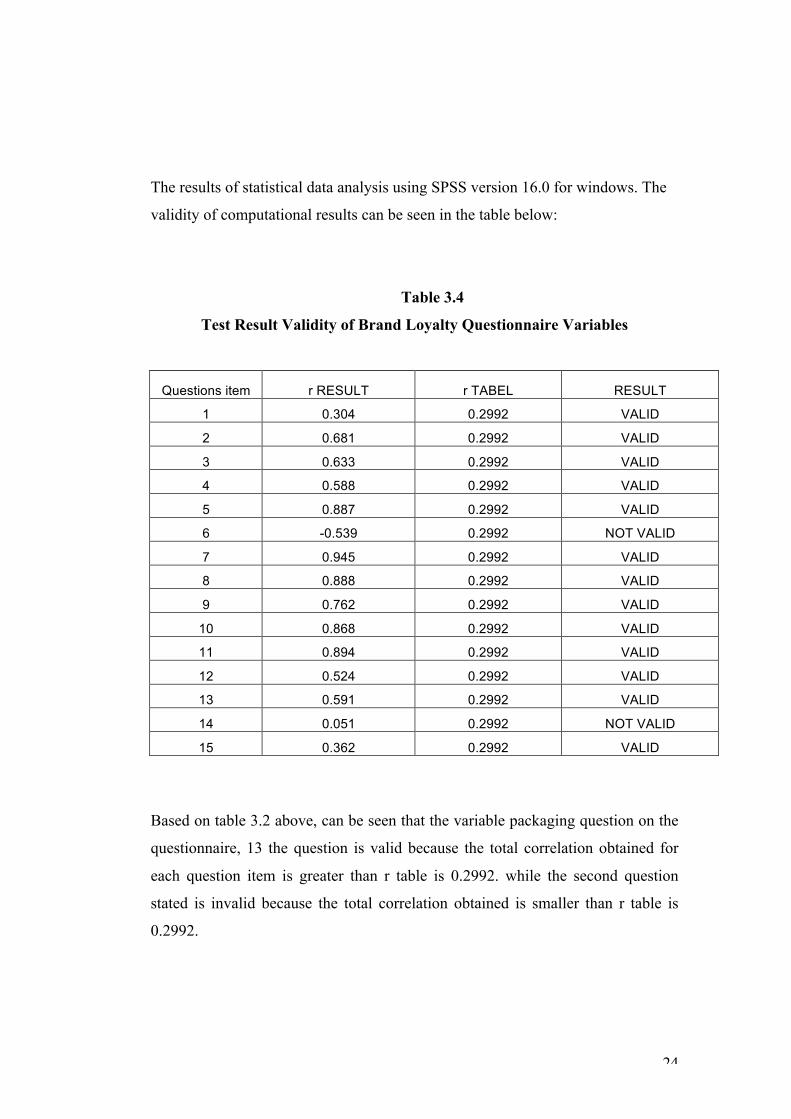
The results of statistical data analysis using SPSS version 16.0 for windows. The
validity of computational results can be seen in the table below:
Table 3.4
Test Result Validity of Brand Loyalty Questionnaire Variables
Questions item r RESULT r TABEL RESULT
1 0.304 0.2992 VALID
2 0.681 0.2992 VALID
3 0.633 0.2992 VALID
4 0.588 0.2992 VALID
5 0.887 0.2992 VALID
6 -0.539 0.2992 NOT VALID
7 0.945 0.2992 VALID
8 0.888 0.2992 VALID
9 0.762 0.2992 VALID
10 0.868 0.2992 VALID
11 0.894 0.2992 VALID
12 0.524 0.2992 VALID
13 0.591 0.2992 VALID
14 0.051 0.2992 NOT VALID
15 0.362 0.2992 VALID
Based on table 3.2 above, can be seen that the variable packaging question on the
questionnaire, 13 the question is valid because the total correlation obtained for
each question item is greater than r table is 0.2992. while the second question
stated is invalid because the total correlation obtained is smaller than r table is
0.2992.

25
Table 3.5
Test Results Questionnaire Variable Impulse Buying
Based on table 3.3 above, can be seen that out of 10 questions on the
questionnaire variables Impulse Buying, all declared valid because the total
correlation acquired for each question is greater than r table is 0.2992.
b. Reliability test
Reliability test is a measurement and analysis of data on whether the
appropriateness of the data is used in a study. While a questionnaire, said reliable
if someone answers to questions are consistent or in other words stable over time.
In this study, calculations performed with the statistical reliability Cronbach
Alpha. If the value of Cronbach Alpha measure what is to be measured. To
interpret reliability correlation coefficient is determined using the following
criteria:
a. Between 0.800 to 1.000 = Very High
b. Between 0.600 to 0.800 = High
c. Between 0.400 to 0.600 = High Enough
d. Between 0.200 to 0.400 = Low
e. Between 0.000 to 0.200 = Very Low
(Source: Sugiyono, 2003: 183)
Questions item r RESULT r TABEL RESULT 1 0.628 0.2992 VALID 2 0.773 0.2992 VALID 3 0.328 0.2992 VALID 4 0.550 0.2992 VALID 5 0.574 0.2992 VALID 6 0.493 0.2992 VALID 7 0.408 0.2992 VALID 8 0.644 0.2992 VALID 9 0.699 0.2992 VALID
10 0.834 0.2992 VALID

26
Based on the calculation of statistical data processed SPSS 16.0 for windows that
look at the attachment reliability of the results obtained for each variable as
follows:
1. The variable X
Price coefficients for the variables of brand loyalty is very high coefficient of
0.867 included.
2. Variable Y
Price coefficients for the variables of impulse buying is a very high coefficient of
0.858 included.
3.4.3 Data Analysis Techniques
Based on the nature of this study, which describes a descriptive and hypothesis
testing, which has processed the data presented in tabular form and further
analyzed using statistical infernsial. Statistical data analysis performed with SPSS
version 16.0 for windows.
In accordance with the purpose of this study, the analysis method used in this
study are:
a. Descriptive analysis
Knowing the results of questionnaires of brand loyalty variables and variable
impulse buying into the form of a table is determined based on research criteria
which can be calculated through the highest and lowest values. (Hussein Omar,
2000: 171).

27
Total Score from each question will be assessed in measurement criteria. After a
known distance, then the grouping can be made with the weight and measure the
value of classification intervals with the formula:
Highest Score – Lowest Score Interval =
Total
Figure 3.1 Interval
Highest Score, 50 x 5 = 250
Lowest Score, 50 x 1 = 50
Interval = 250-50/5 = 40
Based on the cumulative total is obtained, then the results of the study respondents
can be grouped as follows:
Table 3.6
Measurement criteria
Interval Class Point 211-250 Very Good 171-210 Good 131-170 Quite Good 91-130 Bad 50-90 Extremely Bad
(resourches: Husein Umar 2000: 171)

28
b. Analysis of the Correlation Coefficient
The coefficient of correlation in the index or number that is used to measure the
degree of relationship, including power relations and forms of the relationship
(Iqbal Hasan, 2002: 99). The correlation coefficient is a coefficient which states
whether or not a strong relationship between X and Y are denoted by r. To
measure the relationship between two ordinal variables, then the most appropriate
way is by using the Spearman Rank (Kuncoro, 2003: 201).
Symbol of the magnitude of correlation is called the correlation coefficient r. To
calculate the correlation coefficient r then used Spearman correlations with the
following formula:
Figure 3.2 Correlation Coefficient Spearmen
r = Correlation Coefficient spearmen
n = Number of Rank
d = The difference between the two distributions ranking
Correlation coefficient values ranged from -1 to +1. The larger the value of the
correlation coefficient will be the stronger relationship between the variables X
and Y, and also conversely the smaller the value of the coefficient of correlation is
weaker is the relationship between variables X and Y.
6 Σ d2
r = 1 - n (n2 – 1)

29
3.5 Hypothesis testing To find significant or not significant relationships between variables it is
necessary to test hypotheses as follows (Hasan, 2002: 123):
H0: There is no relationship between brand loyalty with impulse buying.
Ha: There is a relationship between brand loyalty with impulse buying.
If statistics count Z <Z table then H0 is accepted (Ha) was rejected.
If statistics count Z> Z table H0 is rejected (Ha) accepted.
To perform hypothesis testing then used the formula Z as follows:
Figure 3.3 Z Formula
Z count: Testing the correlation coefficient for large samples (n> 30)
n: Number of samples
r: The level of correlation
Decision to perform hypothesis testing is done by comparing the count statistic (Z
count) with statistical tables (Z tables), if:
Compute Z <Z table = Ho and Ha accepted rejected.
Z count> Z table = Ho is rejected and Ha accepted.
Z test performed with the following hypothesis:
Ho: There is no significant relationship between brand loyalty with impulse
buying..
Ha: There is a significant relationship between brand loyalty with impulse buying.
3.6 Limitations Due to limited space and limited time, writer take 50 respondents. Writer face
constraints which hard to have the permissions to give the questionnaire to
customer who buy Sariwangi Tea at Indomaret, Kelapa Gading.
Z count = r . √ n – 1

30
Chapter 4
ANALYSIS OF DATA AND INTERPRETATION OF
RESULTS
4.1 Quantitative Analysis This thesis uses a qualitative method of collecting data from questionnaires and
analyzed by spss for windows. In the discussion in this category, there are some
picture of the respondents who filled out questionnaires through the profile of
respondents. Profile description is as follows:
Table 4.1
Distribution respondent by gender Gender Frequency Percentage
Man 28 56%
Woman 22 44%
Total 50 100%
From table 4.1 above shows that the number of respondents male sex as many as
28 people or equal to 56%. While female respondents 22 people or equal to 44%.
This shows the male respondents more than female respondents.
Table 4.2
Distribution of Respondents by Age
Age Number Percentage
20-30 10 20%
>30 40 80%
Total 50 100%
In table 4.2 shows that respondents aged between 20-30 years, 10 people with
percentages 20%, while respondents aged over 30 years as many as 40 people
with the percentage of 80%.

31
4.1.1 Qualitative Analysis Of Brand Loyalty
The following are results from 50 respondents to the questionnaire regarding the
determination of the packaging.
Description: SS (Strongly Agree), S (Agree), R (Fair), TS (Disagree), STS
(Strongly Disagree).
Table 4.3
Do you think Sariwangi have good Quality. Response number Frequency Percentage Point Category
SS 5 6 12% 30
S 4 27 54% 108
R 3 13 26% 39
TS 2 2 4% 4
STS 1 2 4% 2
Total 50 100% 183 Good
From Table 4.3 shows that six respondents or 12% said strongly agree, 27
respondents or 54% agreed, and 13 respondents or 26% expressed fair, 2 or 4% of
respondents disagreed that states and 2 or 4% of respondents stated strongly
disagree . From the above results can be seen that Sariwangi tea has good quality
into either category.

32
Table 4.4
Sariwangi have competitive price with other Brands Response Number Frequency Percentage Point Category
SS 5 4 8% 20
S 4 21 42% 84
R 3 24 48% 72
TS 2 0 0 0
STS 1 1 2% 1
Total 50 100% 177 Good
From table 4.4 shows that 4 or 8% of respondents stated strongly agreed, 21
respondents or 42% agreed, 24 or 48% of respondents expressed fair, and only 1
or 2% of respondents stated strongly disagree. From the above results can be seen
that Sariwangi tea has competitive prices with other brands in its class included in
category good.
Table 4.5
Do you think Sariwangi have good benefits
Response Number Frequency Percentage Point Category SS 5 0 0 0 S 4 28 56% 112 R 3 22 44% 66
TS 2 0 0 0 STS 1 0 0 0 Total 50 100% 178 Good
From Table 4.5 shows that 28 respondents or 56% agree and 22 respondents or
46% said fair. From the above results indicate that Sariwangi tea has good
benefits included in either category.

33
Table 4.6
Do you think Sariwangi have more benefits from other brand
Response Number Frequency Percentage Point Category SS 5 2 4% 10 S 4 14 28% 56 R 3 31 62% 93
TS 2 2 4% 4 STS 1 1 2% 1 Total 50 100% 164 Quite Good
From Table 4.6 shows that 2 or 4% of respondents stated strongly agreed, 14
respondents or 28% agree, 31 respondents or 68% said fair, 2 or 4% of
respondents claimed not agree, and only 1 or 2% of respondents stating strongly
disagree. From the above results indicate that Sariwangi have more benefits than
other brands included in the category of class is quite good.
Table 4.7
Do you think Sariwangi gives satisfaction
Response Number Frequency Percentage Point Category SS 5 0 0 0 S 4 29 58% 116 R 3 13 26% 39
TS 2 8 16% 16 STS 1 0 0 0 Total 50 100% 171 Good
From Table 4.7 shows that 29 respondents or 58% agree, 13 respondents or 26%
expressed fair, and 8 respondents or 16% disagree. This indicates that Sariwangi
gave the satisfaction included into either category.

34
Table 4.8
Do You like Sariwangi Tea
Response Number Frequency Percentage Point Category SS 5 3 6% 15 S 4 29 58% 116 R 3 15 30% 45
TS 2 2 4% 4 STS 1 1 2% 1 Total 50 100% 181 Good
From Table 4.8 that 3 or 6% of respondents stated strongly agreed, 29 respondents
or 58% agreed, 15 or 30% of respondents fair, 2 respondents $ 4 states did not
agree, and only 1 or 2% of respondents who stated strongly disagree. This
indicates that the statement whether you liked Sariwangi included in either
category.
Table 4.9
Do you will purchase Sariwangi again
Response Number Frequency Percentage Point Category SS 5 0 0 0 S 4 34 68% 136 R 3 13 26% 39
TS 2 0 0 0 STS 1 3 6% 3 Total 50 100% 178 Good
From Table 4.9 looks 34 or 68% of respondents agreed, 13 respondents or 26%
expressed fair, and 3 or 6% of respondents stated strongly disagree. From the
above results indicate that making a purchase Sariwangi again included in either
category.
35
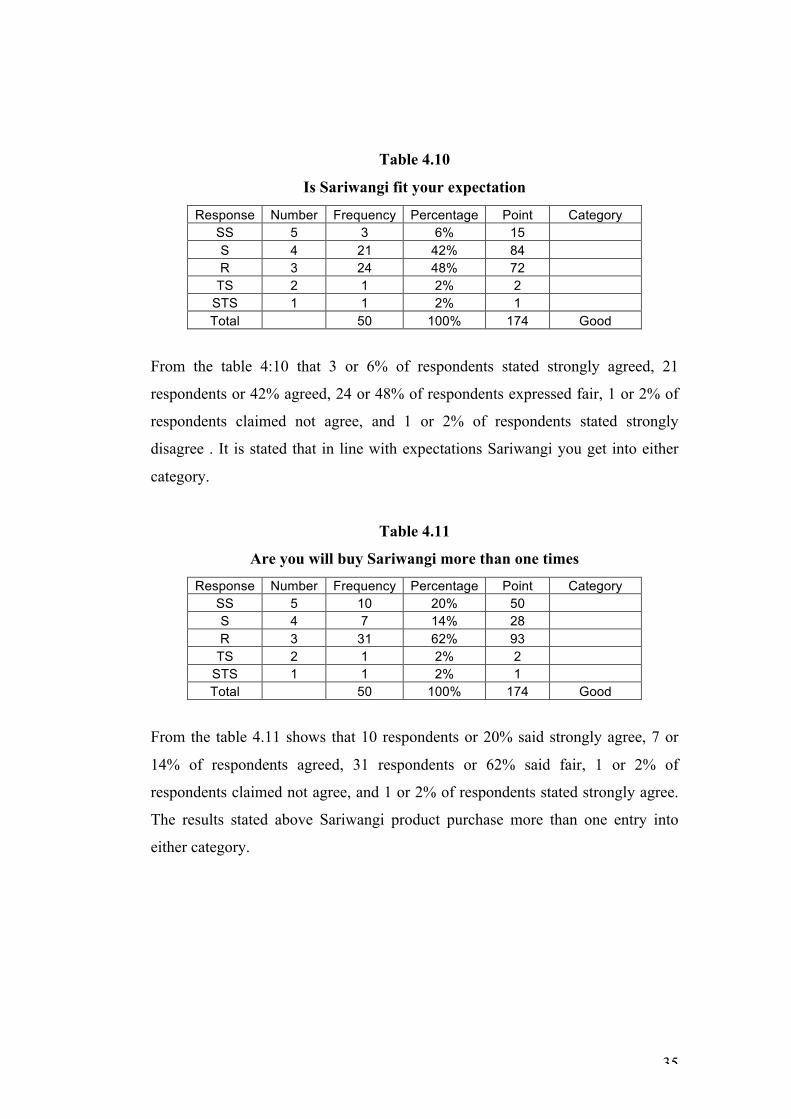
Table 4.10
Is Sariwangi fit your expectation
Response Number Frequency Percentage Point Category SS 5 3 6% 15 S 4 21 42% 84 R 3 24 48% 72
TS 2 1 2% 2 STS 1 1 2% 1 Total 50 100% 174 Good
From the table 4:10 that 3 or 6% of respondents stated strongly agreed, 21
respondents or 42% agreed, 24 or 48% of respondents expressed fair, 1 or 2% of
respondents claimed not agree, and 1 or 2% of respondents stated strongly
disagree . It is stated that in line with expectations Sariwangi you get into either
category.
Table 4.11
Are you will buy Sariwangi more than one times
Response Number Frequency Percentage Point Category SS 5 10 20% 50 S 4 7 14% 28 R 3 31 62% 93
TS 2 1 2% 2 STS 1 1 2% 1 Total 50 100% 174 Good
From the table 4.11 shows that 10 respondents or 20% said strongly agree, 7 or
14% of respondents agreed, 31 respondents or 62% said fair, 1 or 2% of
respondents claimed not agree, and 1 or 2% of respondents stated strongly agree.
The results stated above Sariwangi product purchase more than one entry into
either category.

36
Table 4.12
Do you always buy Sariwangi
Response Number Frequency Percentage Point Category SS 5 5 10% 25 S 4 21 42% 84 R 3 21 42% 63
TS 2 3 6% 6 STS 1 0 0 0 Total 50 100% 178 Good
From the table 4.12 shows that 5 or 10% of respondents stated strongly agreed, 21
respondents or 42% agreed, and 21 respondents or 42% expressed fair, and 3 or
6% of respondents who disagree. From the above results can be known that you
always buy the product Sariwangi into either category.
Table 4.13
You buy Sariwangi about the healthy
Response Number Frequency Percentage Point Category SS 5 5 10% 25 S 4 6 12% 24 R 3 32 64% 96
TS 2 2 4% 4 STS 1 5 10% 5 Total 50 100% 154 Quite Good
From the table shows that 5 or 10% of respondents stated strongly agree, 6 or 12%
of respondents agreed, and 32 respondents or 64% expressed fair, 2 or 4% of
respondents stating disagree, 5 respondents or 10% said strongly disagree . From
the above results can be known Sariwangi to health in the category of pretty good.

37
Table 4.14
When you have the necessity of a tea beverage product, you will only buy
Sariwangi Response Number Frequency Percentage Point Category
SS 5 0 0% 0 S 4 24 48% 96 R 3 14 28% 42
TS 2 7 14% 14 STS 1 5 10% 5 Total 50 100% 157 Quite Good
From the table shows that 24 respondents or 48% agree, then 14 or 28% of
respondents expressed fair, 7 or 14% of respondents stating disagree, 5
respondents or 10% said strongly disagree. From the above results can be known
when the consumer has a need for a tea, consumers will only buy Sariwangi in the
category of pretty good.
Table 4.15
If the price of Sariwangi unstable, you will buy another brand
Response Number Frequency Percentage Point Category SS 5 0 0 0 S 4 15 30% 60 R 3 24 48% 72
TS 2 10 20% 20 STS 1 1 2% 1 Total 50 100% 153 Quite Good
From the table shows that 15 respondents or 30% agree, then 24 or 48% of
respondents expressed fair, 10 respondents or 20% said do not agree, and only 1
or 2% of respondents who stated strongly disagree. From the above results can be
known if the price is not stable Sariwangi consumers will buy other tea products
which fall into this category quite Good.

38
4.1.2 Qualitative Analysis Of Impulse Buying
Table 4.16
In the case of unexpected situation, do You will buy Sariwangi
Response Number Frequency Percentage Point Category SS 5 5 10% 25 S 4 11 22% 44 R 3 16 32% 48
TS 2 12 24% 24 STS 1 6 12% 6 Total 50 100% 147 Quite Good
From table 4.16 5 respondents or 10% said strongly agree, 11 respondents or 22%
agree, 16 respondents or 32% fair, 12 respondents or 24% disagreed, and 6
response expressed strongly disagree. This can be seen that the purchase of
products Sariwangi in unforeseen circumstances in the category of pretty good.
Table 4.17
If your tea out of stock, you will buy Sariwangi
Response Number Frequency Percentage Point Category SS 5 2 4% 10 S 4 23 46% 92 R 3 15 30% 45
TS 2 10 20% 20 STS 1 0 0 0 Total 50 100% 167 Quite Good
Based on the table 4.17, 2 or 4% of respondents stated strongly agreed, 23
reponsden or 46% agree, 15 respondents or 30% said fair, and 10 respondents or
20% disagree. This suggests that consumers purchase Sariwangi while supplies
run out pretty well in the category.

39
Table 4.18
Visual forms of Sariwangi make you interested to buy
According to the table shows that 9 respondents or 18% said strongly agree, 8 or
16% of respondents agreed, 19 respondents or 38% fair, and 14 respondents or
28% disagree. This suggests that the visual form of Sariwangi make consumers
interested in buying in the category of pretty good.
Table 4.19
If the Store Only Sells Sariwangi, you will buy that product
Based on the table 4.19 looks 14 or 28% of respondents stated strongly agreed, 22
respondents or 44% agree, 13 respondents expressed fair, and 1 or 2% of
respondents strongly disagreed saying. This showed that the targeted consumers
shop only sells tea Sariwangi show into either good category.
Response Number Frequency Percentage Point Category SS 5 9 18% 45 S 4 8 16% 32 R 3 19 38% 57
TS 2 14 28% 28 STS 1 0 0 0 Total 50 100% 162 Quite Good
Response Number Frequency Percentage Point Category SS 5 14 28% 70 S 4 22 44% 88 R 3 13 26% 39
TS 2 0 0 0 STS 1 1 2% 1 Total 50 100% 198 Good

40
Table 4.20 You buy Sariwangi because of the promotion
Response Number Frequency Percentage Point Category
SS 5 8 16% 40 S 4 27 54% 108 R 3 11 22% 33
TS 2 2 4% 4 STS 1 2 4% 2 Total 50 100% 187 Good
According to the table shows that 8 or 16% of respondents stated strongly agreed,
27 respondents or 54% agree, 11 respondents or 22% fair, 2 or 4% of respondents
claimed not agree, and 2 or 4% of respondents stated strongly agree. This
indicates that the purchase due to the promotional offer Sariwangi into either good
category.
Table 4.21 When you need a tea product In a sudden, then you'll choose Sariwangi
Response Number Frequency Percentage Point Category
SS 5 0 0 0 S 4 27 54% 108 R 3 14 28% 42
TS 2 9 18% 18 STS 1 0 0 0 Total 50 100% 168 Quite Good
Based on the table 4.21 looks 27 or 54% of respondents agreed, 14 or 28% of
respondents expressed fair, and 9 respondents or 18% disagree. This suggests that
while the need toothpaste suddenly, then the consumer will buy Sariwangi
included in the category quite good.

41
Table 4.22 You choose Sariwangi because of interest with prize offered
Response Number Frequency Percentage Point Category
SS 5 10 20% 50 S 4 18 36% 72 R 3 19 38% 57
TS 2 2 4% 4 STS 1 1 2% 1 Total 50 100% 184 Good
From the table shows that 10 respondents or 20% said strongly agree, 18
respondents or 36% agreed, 19 or 38% of respondents expressed fair, 2 or 4% of
respondents claimed not agree, and only 1 or 2% of respondents stating strongly
disagree. This indicates that the purchase Sariwangi because tempted by the
lottery or prize offered in the category of good.
Table 4.23
When you want to buy tea product, you will buy Sariwangi
Based on the table 4.23 looks 24 or 48% of respondents agreed, 25 or 50% of
respondents expressed fair, and the remaining 1 or 2% of respondents disagree.
This suggests that while consumers want to buy tea products, consumers will buy
Sariwangi included in either good category.
Response Number Frequency Percentage Point Category SS 5 0 0 0 S 4 24 48% 96 R 3 25 50% 75
TS 2 1 2% 2 STS 1 Total 50 100% 173 Good

42
Table 4:24 Buying Sariwangi suddenly, making something very interesting for you
From the table above shows that 11 respondents or 22% agree, 8 or 16% of
respondents expressed fair, 24 respondents or 48% stated not agree, checkers 7
respondents or 14% said strongly disagree. This suggests that when consumers
purchase tea Sariwangi require entry into the category of tea is not good.
Table 4:25
See Sariwangi products in the store, you will buy without previously thought
Response Number Frequency Percentage Point Category SS 5 4 8% 20 S 4 19 38% 76 R 3 18 36% 54
TS 2 9 18% 18 STS 1 0 0 0 Total 50 100% 168 Quite Good
Based on the table 4:25 seen that 4 or 8% of respondents stated strongly agreed,
19 respondents or 38% agreed, 18 or 36% of respondents expressed fair, and 9
respondents or 18% disagree. This indicates that the purchase Sariwangi without
any forethought into the category of pretty good.
Response Number Frequency Percentage Point Category SS 5 0 0 0 S 4 11 22% 44 R 3 8 16% 24
TS 2 24 48% 48 STS 1 7 14% 7 Total 50 100% 123 Not Good

43
Here is the recapitulation or summary of the responses to the dimensions and
indicators of brand loyalty and impulse buying of Sariwangi at PT Unilever
Limited.
Table 4:26
Table Summary of Responses of Sariwangi Brand Loyalty Variables
Based on the results of consumer research 50 respondents Sariwangi products can
be seen that the brand loyalty variable has a mean of 170.92, the value is included
in Good category.
Variable Dimention Indicator Point Category
Brand Loyalty
(X)
1.Cognitive
The brand has good quality 183 Good The brand has competitive cost 177 Good The brand has a advantage 178 Good The brand has a advantage 164 Quite Good
2.Affective
The brand give satisfaction 171 Good The Brand has the involvement to customer 181 Good Consumers have the consistency of the brand 178 Good Consumers have expectations about the brand 174 Good
3.Conative
Consumers have a commitment to the brand is to make the purchase again 174 Good
Consumers have the consistency of the brand in consuming
178 Good
Consumers have the hope that more of the brand 154 Quite Good
4. Action Consumers have a commitment to a brand 157 Quite Good Stable prices resulted consumers regularly purchase 153 Quite Good
AVERAGE
2222/13 = 170,92
Good

44
Table 4:27
Table Summary of Responses For Variable Value Impulse Buying on Sariwangi tea
Variable Dimention Indicator Point Category
Impulse Buying (Y)
1.Spontaneity
The situation is not unexpected 147 Quite Good
The motivation for immediate purchase 167 Quite Good
Influenced by a visual form such products 162 Quite Good
2.Strength
and intensity of coersion
The motivation is influenced by circumstances 198 Good Perform immediate actions are influenced by 187 Good
3. Stimulus
Purchase of a sudden because of the urge to have a good 168 Quite
Good Influenced by the state of consumer psychology 184 Good Influenced by the state of consumer psychology 173 Good
4. Ignore the consequences
Purchase suddenly become very attractive 123 Not Good
Measures purchases made without forethought 168 Quite Good
AVERAGE 1677/10 = 167.7
Quite Good
Based on the results of consumer research 50 respondents Sariwangi products can
be seen that the variable impulse buying has an average of 167.7, the value is
included in the category quite good.
4.1.3 Correlation Coefficient
To specify a quantity expressed strong or weak relationship between the variables
of brand loyalty with variable impulse buying on the product Sariwangi,
performed the calculation using the product moment correlation coefficient
Spearman's product moment's that spearman correlation with processed with the
program SPSS 16.0 for windows as follows:

45
Correlations
Brand
Loyalty Impulse Buying
Spearman's rho Brand Loyalty Correlation Coefficient 1.000 .520** Sig. (2-tailed) . .000 N 50 50 Impulse Buying Correlation Coefficient .520** 1.000 Sig. (2-tailed) .000 . N 50 50 ** Correlation is significant at the 0.01 level (2-tailed). Figure 4.1 Correlation Coefficient Results
From the calculation of the correlation of test results obtained r count = 0520 then
there is a significant relationship between brand loyalty with impulse buying.
Therefore it can be said to be the relationship between brand loyalty by impulse
buying have a fairly high correlation and positive.
4.2 Tests of Hypotheses Decision rule requires the search for the critical value for the z statistic from the
normal table. Because the test performed two-way then the probability o.05 on
two sides by 0025. The area between zero and the critical value in the table Z is
0.5000-0.025 or 0475, so the critical value of z is 1.96. Decision rule is do not
reject H0 if the z statistic value between -1.96 and +1.96 or reject H0 when
outside that interval.

46
Hypothesis rejected Hypothesis rejected
Hypothesis accepted
Z -1,96 0 1,96 Figure 4.2 Hypothesis
To further investigate the truth of the results of analysis have been
described can be performed hypothesis testing with z test (because the sample
used more than 30) as follows:
Z count = r . √n-1
= 0,520 x √50-1
= 0,520 x 7 = 3.64
Have been obtained by calculating z 3.64. Since the calculated z value lies in the
rejection region, then H0 is rejected otherwise. Means at the 0.05 level, there is a
positive relationship between brand loyalty with impulse buying.

47
Chapter 5
CONCLUSIONS AND RECOMMENDATIONS
5.1 Conclusion Based on the description, discussion, and analysis has been carried out by research
in the four previous chapters, the authors then take a few conclusions are as
follows:
1. Factors of Brand Loyalty can be seen from its level which is:
a. Consumer want to find the product.
b. Consumer feel satisfied about the product.
c. Consumer buy the product more than one time.
d. Consumer are not likely replace the product.
2. Impulse buying can be seen on the product Sariwangi of consumer
characteristics such as spontaneity, the power of coercion or emotion, stimulation
consumers in realizing the desire of a good. Judging from the results of the overall
research on impulse buying variable Sariwangi products into the grading scale
average 167.7 which is quite good.
3.When viewed from the testing of hypotheses, it can be concluded that the Z
count is greater than Z tables, so the criteria used by Ho is rejected, which means
the positive correlation of brand loyalty with impulse buying.

48
5.2 Recommendation Based on the analysis and interpretation of data that has been done before, and the
conclusions which have been formulated, then the suggestions can be put forward
are as follows:
1. Results showed that consumers are less likely to do impulse buying if
consumers are already loyal to a brand, although many new products in the
market, consumers still choose brands they trust. PT Unilever Limited as the main
producer for Sariwangi should continue to make new innovations, given the
competition in this industry are very tight with the emergence of new arrivals.
2. Regarding consumer impulse buying behavior, was considered quite good. PT
Unilever should pay more attention to the attitudes of consumers and create better
strategies so that when consumers in any condition they are still buying or
choosing Sariwangi as a tea beverage products. Particularly on the factors of
motivation and action are affected by circumstances, influenced by the stimulation
of consumer psychology to be more noticed.
3. To avoid impulse buying, the consumer should plan or list what things they
really need. So customer will not buy something emotionally that sometimes they
feel regret to buy the thing that not necessary.

49
LIST OF REFFERENCES Cooper, Donald R, dan C. William Emory. 1997. Metode Penelitian Bisnis, Edisi
kelima, Erlangga. Jakarta.
Engel, James E., Roger D.Blackwell, and Paul W. Miniard. 2006. Consumer
Behavior, Tenth Edition. USA, Thomson South Western.
Hasan, Ali. 2008. Marketing. Media Pressindo, Jakarta
Hasan, M. Iqbal. 2002. Metodologi Penelitian dan Aplikasinya. Ghalia Indonesia,
Jakarta
Kotler, Philip. 2000. Marketing Management, the Millenium Edition. Prentice
Hall International Inc, New Jarsey.
Kuncoro, Mudrajat. 2003. Metode Riset untuk bisnis dan Ekonomi. Erlangga,
Jakarta.
Lamb, Charles W., Joseph F.Hair, dan Carl McDaniel. 2001. Pemasaran, Jilid 1.
Salemba Empat, Jakarta.
Mowen, John C, dan Michael Minor. 2002. Perilaku Konsumen, Jilid 2, Edisi
kelima. Erlangga, Jakarta.
Peter, J. Paul, dan Jerry C. Olson. 1999. Consumer Behavior and Marketing
Strategy, Jilid 2, Edisi keempat. Erlangga, Jakarta.
Santoso, Singgih. 2000. Buku Latihan SPSS Statistik Parametrik. Jakarta. PT.
Gramedia.
Santoso, Singgih. 2001. Buku Latihan SPSS Statistik non Parametrik. Jakarta. PT.
Gramedia.
Sugiyono. 2003, Metode Penelitian Bisnis, Alfabeta, Bandung
Sumarwan, Ujang. 2002. Perilaku Konsumen, Cetakan Kedua. Ghalia Indonesia,
Bogor Selatan.

50
Triana, Lilik, dan Ghina Noeraini.2006. “Hubungan Kesetiaan Merek dengan
Impulse Buying (Studi Kasus Pada Mahasiswi STEI Pengguna Shampoo
Sunsilk)”. Dalam Jurnal Ekonomi STEI, Hlm.204-214. STEI Jakarta.
http://www.unilever.co.id/id/brands/foodbrands/Sariwangi/

51
APPENDIX
Questionnaire Covering Letter
Kepada Yth,
Konsumen The Sariwangi
Di tempat
Dengan Hormat,
Saya Yoshua Wira Atmaja, ID 011200800065, mahasiswa President University
major International Business, ingin melakukan observasi tentang Hubungan
Kesetiaan Merk Dengan Impulse Buying pada pengguna teh Sariwangi. Oleh
karena itu saya mohon kesediaan Bapak/Ibu/Saudara/I berkenan mendukung
observasi tersebut dengan mengisi kuesioner yang telah saya buat dibawah ini.
Atas partisipasi dan kerjasama dari Bapak/Ibu/Saudara/I saya ucapkan banyak
terima kasih.
Hormat saya
Yoshua Wira Atmaja

52
DATA PRIBADI Beritanda “X” untuk pilihan jawaban pada kolom yang tersedia
1. Nama Responden :
2. Alamat :
3. Jenis Kelamin :
( ) Pria ( ) Wanita
4. Usia anda :
( ) <20 ( ) 20-30 ( ) >30
BAGIAN II : KUSIONER Beri tanda “X” pada kolom yang tersedia
Keterangan :
SS : Sangat Setuju
S : Setuju
R : Ragu
TS : Tidak Setuju
STS : Sangat Tidak Setuju

53
Questionnaire
Brand Loyalty
Questions SS S R TS STS
1 You think Sariwangi have good quality
2 Sariwangi have competitive price with other Brands
3 Do you think Sariwangi have good benefits
4 Do you think Sariwangi have more benefits from other brand
5 Do you think Sariwangi gives satisfaction
6 Do you want to try another product besides Sariwangi
7 Do you like Sariwangi Tea
8 Do you will purchase Sariwangi again
9 Is Sariwangi fit your expectation
10 Are you will buy Sariwangi more than one times
11 Do You Always Buy Sariwangi
12 You buy Sariwangi about the healthy
13 When you have the necessity of a tea beverage product, you will only buy Sariwangi
14 You will buy Sariwangi regularly in certain period
15 If the price of Sariwangi unstable, you will buy another brand

54
Questionnaire
Impulse Buying
Statement SS S R TS STS
1 In the case of unexpected situation, do You will buy Sariwangi
2 If your tea out of stock, you will buy Sariwangi
3 Visual forms of Sariwangi make you interested to buy
4 If the Store Only Sells Sariwangi, you will buy that product
5 You buy Sariwangi because of the promotion
6 When you need a tea product In a sudden, then you'll choose Sariwangi
7 You choose Sariwangi because of interest with prize offered
8 When you want to buy tea product, you will buy Sariwangi
9 Buying Sariwangi suddenly, making something very interesting for you
10 See Sariwangi products in the store, you will buy without previously thought

55
Variable X 50
Brand Loyalty Questionnaire list No. X1 X2 X3 X4 X5 X6 X7 X8 X9 X10 X11 X12 X13 TOTAL
1 4 4 4 3 4 4 4 4 5 4 3 4 4 51
2 4 4 4 3 4 4 4 3 3 4 3 4 3 47
3 4 3 3 2 3 1 1 3 4 2 2 2 3 33
4 3 4 3 3 2 3 4 3 3 3 3 2 4 40
5 4 3 3 4 3 3 3 4 3 3 1 1 3 38
6 4 3 4 4 4 4 4 4 3 3 3 3 2 45
7 5 3 4 4 3 3 3 4 3 3 4 4 4 47
8 4 3 4 4 4 4 4 4 3 3 3 3 2 45
9 3 5 3 3 2 3 3 4 4 3 4 3 4 44
10 5 4 4 3 4 4 4 4 5 5 5 4 4 55
11 4 4 4 3 4 4 4 3 3 4 3 4 3 47
12 4 3 3 4 3 3 3 4 3 3 1 1 3 38
13 4 4 4 3 4 4 4 3 3 4 2 3 3 45
14 4 4 4 3 4 4 4 3 3 4 3 4 3 47
15 3 4 3 3 2 3 4 3 3 3 3 2 4 40
16 2 3 4 3 4 4 4 4 5 5 5 4 4 51
17 4 3 3 4 3 3 3 4 3 3 1 1 3 38
18 5 5 4 5 4 5 4 5 5 4 3 4 2 55
19 3 3 3 3 3 4 3 3 4 4 4 4 3 44
20 4 4 3 4 4 5 4 5 5 4 3 4 2 51
21 4 3 4 4 4 4 4 4 3 3 3 3 2 45
22 3 4 3 3 2 3 4 3 3 3 3 2 4 40
23 1 1 3 2 2 2 1 2 2 2 3 3 3 27
24 3 3 3 3 3 4 3 3 4 4 4 4 3 44
25 4 4 4 3 4 4 4 3 3 4 3 4 3 47
26 3 4 3 3 2 3 4 3 3 3 3 2 4 40
27 4 3 4 4 4 4 4 4 3 3 3 3 2 45
28 4 4 4 3 4 4 4 3 3 4 3 4 3 47
29 5 5 4 5 4 5 4 5 5 4 3 4 2 55

56
30 5 5 4 3 3 4 4 3 3 3 4 3 3 47
31 4 4 3 3 4 4 4 4 5 4 3 4 4 50
32 3 3 4 4 4 3 3 3 3 4 3 4 4 45
33 4 4 4 3 4 4 4 3 3 4 3 4 3 47
34 3 3 4 3 4 4 4 4 5 5 5 3 3 50
35 4 4 4 3 4 4 4 3 3 4 3 4 3 47
36 5 3 3 4 3 3 3 4 3 3 1 1 3 39
37 2 3 4 3 4 4 4 4 5 5 5 4 4 51
38 3 4 3 3 2 3 4 3 3 3 3 2 4 40
39 1 3 3 3 3 2 1 1 1 2 3 3 1 27
40 4 4 4 3 4 4 4 3 3 4 3 4 3 47
41 4 3 3 1 3 3 3 3 4 3 3 3 4 40
42 4 4 4 3 4 4 4 3 3 4 3 4 3 47
43 3 4 3 3 2 3 4 3 3 3 3 2 4 40
44 4 3 3 4 3 3 3 4 3 3 1 1 3 38
45 4 4 4 3 4 4 4 3 3 4 3 4 3 47
46 3 3 3 3 3 4 3 3 4 4 4 4 3 44
47 4 3 3 3 4 4 3 4 4 4 3 4 2 45
48 4 3 4 4 4 4 4 4 3 3 3 3 2 45
49 3 3 4 3 4 4 4 4 5 5 5 3 3 50
50 4 3 4 4 4 4 4 4 3 3 3 3 2 45
Total 183 177 178 164 171 181 178 174 174 178 154 157 153 2222
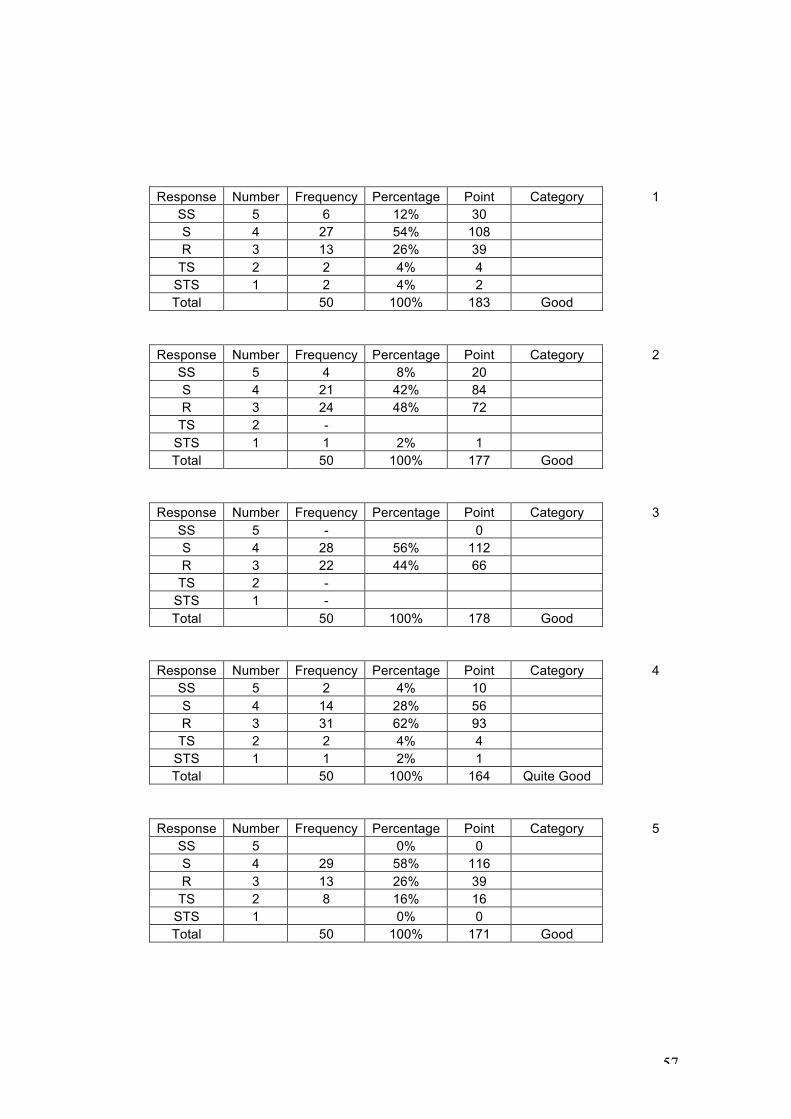
57
Response Number Frequency Percentage Point Category 1
SS 5 6 12% 30 S 4 27 54% 108 R 3 13 26% 39
TS 2 2 4% 4 STS 1 2 4% 2 Total 50 100% 183 Good
Response Number Frequency Percentage Point Category 2
SS 5 4 8% 20 S 4 21 42% 84 R 3 24 48% 72
TS 2 - STS 1 1 2% 1 Total 50 100% 177 Good
Response Number Frequency Percentage Point Category 3
SS 5 - 0 S 4 28 56% 112 R 3 22 44% 66
TS 2 - STS 1 - Total 50 100% 178 Good
Response Number Frequency Percentage Point Category 4
SS 5 2 4% 10 S 4 14 28% 56 R 3 31 62% 93
TS 2 2 4% 4 STS 1 1 2% 1 Total 50 100% 164 Quite Good
Response Number Frequency Percentage Point Category 5
SS 5 0% 0 S 4 29 58% 116 R 3 13 26% 39
TS 2 8 16% 16 STS 1 0% 0 Total 50 100% 171 Good

58
Response Number Frequency Percentage Point Category 6 SS 5 3 6% 15 S 4 29 58% 116 R 3 15 30% 45
TS 2 2 4% 4 STS 1 1 2% 1 Total 50 100% 181 Good
Response Number Frequency Percentage Point Category 7
SS 5 0% 0 S 4 34 68% 136 R 3 13 26% 39
TS 2 0% 0 STS 1 3 6% 3 Total 50 100% 178 Good
Response Number Frequency Percentage Point Category 8
SS 5 3 6% 15 S 4 21 42% 84 R 3 24 48% 72
TS 2 1 2% 2 STS 1 1 2% 1 Total 50 100% 174 Good
Response Number Frequency Percentage Point Category 9
SS 5 10 20% 50 S 4 7 14% 28 R 3 31 62% 93
TS 2 1 2% 2 STS 1 1 2% 1 Total 50 100% 174 Good
Response Number Frequency Percentage Point Category 10
SS 5 5 10% 25 S 4 21 42% 84 R 3 21 42% 63
TS 2 3 6% 6 STS 1 0% 0 Total 50 100% 178 Good

59
Response Number Frequency Percentage Point Category 11 SS 5 5 10% 25 S 4 6 12% 24 R 3 32 64% 96
TS 2 2 4% 4 STS 1 5 10% 5 Total 50 100% 154 Quite Good
Response Number Frequency Percentage Point Category
SS 5 0% 0 12 S 4 24 48% 96 R 3 14 28% 42
TS 2 7 14% 14 STS 1 5 10% 5 Total 50 100% 157 Quite Good
Response Number Frequency Percentage Point Category
SS 5 0% 0 13 S 4 15 30% 60 R 3 24 48% 72
TS 2 10 20% 20 STS 1 1 2% 1 Total 50 100% 153 Quite Good
183 Good 177 Good 178 Good 164 Quite Good 171 Good 181 Good 178 Good 174 Good 174 Good 178 Good 154 Quite Good 157 Quite Good 153 Quite Good
2222 Good 170.9231

60
Variable Y 50
Impulse buying Questionnaire List No. X1 X2 X3 X4 X5 X6 X7 X8 X9 X10
1 5 5 5 1 1 4 1 4 1 3 30
2 3 4 3 4 5 4 5 4 4 4 40
3 5 4 2 5 3 4 3 4 4 5 39
4 2 2 3 3 3 3 3 3 1 2 25
5 1 2 2 3 4 3 4 3 1 3 26
6 3 3 4 4 4 3 4 3 2 2 32
7 4 4 5 5 4 4 3 4 2 4 39
8 4 3 2 3 4 3 4 2 3 3 31
9 3 4 3 4 5 4 5 4 3 3 38
10 4 4 5 5 4 4 3 4 2 4 39
11 2 3 3 4 4 2 4 3 2 3 30
12 1 2 2 3 2 3 2 3 2 2 22
13 2 3 3 4 4 2 4 3 2 3 30
14 3 4 2 4 5 4 5 4 4 4 39
15 2 3 3 4 4 2 4 3 2 3 30 16 3 3 4 4 4 3 4 3 2 2 32
17 2 2 3 3 3 3 3 3 1 2 25
18 5 4 2 5 3 4 3 4 4 5 39
19 3 3 3 3 3 4 3 3 2 2 29
20 1 2 2 3 4 3 4 3 1 3 26
21 3 3 3 4 4 4 5 4 3 4 37
22 2 3 3 4 4 2 4 3 2 3 30
23 1 2 2 3 4 3 4 3 1 3 26
24 4 4 4 5 4 4 3 4 2 4 38
25 4 4 5 5 4 4 3 4 2 4 39
26 2 2 3 3 2 3 2 3 2 3 25
27 5 4 2 5 3 4 3 4 4 5 39
28 3 4 3 4 5 4 5 4 4 4 40
29 4 4 4 5 4 4 3 4 2 4 38
30 4 4 5 5 4 4 3 4 2 4 39

61
31 3 4 2 4 5 4 5 4 4 4 39
32 3 3 3 4 4 4 4 3 3 4 35
33 3 5 5 3 3 4 4 4 3 3 37
34 4 4 5 5 4 4 3 4 2 4 39
35 3 4 3 4 5 4 5 4 4 4 40
36 1 2 2 3 3 3 4 3 1 3 25
37 4 4 4 5 4 4 3 4 2 4 38
38 3 4 2 4 5 4 5 4 4 4 39
39 2 3 3 4 4 2 4 3 2 3 30
40 4 4 5 5 4 2 3 3 2 3 35
41 4 4 5 5 4 4 3 4 2 4 39
42 2 3 3 4 4 2 4 3 2 3 30
43 1 2 4 3 1 3 3 3 3 2 25
44 2 3 3 4 4 2 4 3 2 3 30
45 3 4 2 4 5 4 5 4 4 4 39
46 2 3 3 4 4 2 4 3 2 3 30
47 3 3 4 4 4 3 4 3 2 2 32
48 2 2 3 3 3 3 3 3 3 2 27
49 5 4 2 5 3 4 3 4 4 5 39
50 3 4 4 4 3 4 5 3 3 4 37
Total 147 167 162 198 187 168 184 173 123 168 1677

62
Response Number Frequency Percentage Point Category 1 SS 5 5 10% 25 S 4 11 22% 44 R 3 16 32% 48
TS 2 12 24% 24 STS 1 6 12% 6 Total 50 100% 147 Quite Good
Response Number Frequency Percentage Point Category 2
SS 5 2 4% 10 S 4 23 46% 92 R 3 15 30% 45
TS 2 10 20% 20 STS 1 Total 50 100% 167 Quite Good
Response Number Frequency Percentage Point Category 3
SS 5 9 18% 45 S 4 8 16% 32 R 3 19 38% 57
TS 2 14 28% 28 STS 1 Total 50 100% 162 Quite Good
Response Number Frequency Percentage Point Category
SS 5 14 28% 70 4 S 4 22 44% 88 R 3 13 26% 39
TS 2 STS 1 1 2% 1 Total 50 100% 198 Good
Response Number Frequency Percentage Point Category 5
SS 5 8 16% 40 S 4 27 54% 108 R 3 11 22% 33
TS 2 2 4% 4 STS 1 2 4% 2 Total 50 100% 187 Good

63
Response Number Frequency Percentage Point Category
SS 5 6 S 4 27 54% 108 R 3 14 28% 42
TS 2 9 18% 18 STS 1 Total 50 100% 168 Quite Good
Response Number Frequency Percentage Point Category 7
SS 5 10 20% 50 S 4 18 36% 72 R 3 19 38% 57
TS 2 2 4% 4 STS 1 1 2% 1 Total 50 100% 184 Good
Response Number Frequency Percentage Point Category 8
SS 5 S 4 24 48% 96 R 3 25 50% 75
TS 2 1 2% 2 STS 1 Total 50 100% 173 Good
Response Number Frequency Percentage Point Category 9
SS 5 S 4 11 22% 44 R 3 8 16% 24
TS 2 24 48% 48 STS 1 7 14% 7 Total 50 100% 123 Not Good
Response Number Frequency Percentage Point Category 10
SS 5 4 8% 20 S 4 19 38% 76 R 3 18 36% 54
TS 2 9 18% 18 STS 1 Total 50 100% 168 Quite Good

64
147 Quite Good 167 Quite Good 162 Quite Good 198 Good 187 Good 168 Quite Good 184 Good 173 Good 123 Not Good 168 Quite Good
1677 Quite Good 167.7
Correlations
Brand Loyalty
Impulse Buying
Spearman's rho Brand Loyalty
Correlation Coefficient 1.000 .520(**)
Sig. (2-tailed) . .000 N 50 50
Impulse Buying Correlation Coefficient .520(**) 1.000
Sig. (2-tailed) .000 . N 50 50
** Correlation is significant at the 0.01 level (2-tailed).

65
Hypothesis rejected Hypothesis rejected
Hypothesis accepted
Z -1,96 0 1,96
Z count = r . √n-1
= 0,520 x √50-1
= 0,520 x 7 = 3.64
Z count> Z table = Ho is rejected and Ha accepted.