Embed Size (px)
Citation preview
GRC Transactions, Vol. 36, 2012
731
KeywordsResistivity, temperature, alteration minerals, correlation, res-ervoirs, Menengai caldera
ABSTRACT
Resistivity measurements are one of the methods of finding deep sub-surface structures indirectly from the surface at relatively low cost, in comparison to direct method of drilling forgeothermal prospect. The geophysical techniques employed aim at mapping electrical resistivity of theearth matrix beneath the surface to de-termine geothermal potential areas from the resulting resistivity anomaly. Magnetotelluric (MT) and Transient electromagnetic (TEM) imagesubsurface geology in search for anomalous geothermal reservoirs and electri-cally conductiveheat source and cap rock zones. Resistivity cross-section from Menengai indicates four distinct anomalies of very resistive top layer 200m from the surface, followed by low resistivity layer (cap) overlying moderately resistive core (reservoir) underlain by deep sited low resistivity dense bodies interpreted to be a heat source. Com-paring the resistivity a structure with well data, mainly alteration minerals and temperature, at depth is the principal objective of this paper. The conductive minerals such as zeolite dominatein the temperature range of 80-200°C representing low resistivity clay cap rock between the depths of 400-800m. Between depths of 900-2200m, at temperatures of 200-240°C, zeolites diminishes replaced by more resistive epidotes. Above 250°C epidote dominates the relatively resistive reser-voir core, where conductivity is controlled by pore fluids rather than clay minerals. Thus from this correlation it’s clear that resistivity data can be interpreted and used in the prediction of pre-drilled well temperature and alteration mineralogy distribution with caution.
1.0 Introduction
The Menengai geothermal field has been surveyed extensively for decades until present using resistivity methods among others to identify and delineate high temperature geothermal systems.The resistivity methods used been Magnetotulleric (MT), most pre-ferred due to its ability to penetrate and probe resistivity structures much deeper beneath the surface, while transient electromagnetic (TEM) is used as complementary to MT for static shift correc-tion. The ongoing geophysical exploration of resistivity data has revealed low resistivity anomalies overlying a moderately resistive sub-stratum at several points which have been a target for drilling exploration wells in menengai caldera (MW-01) and sitting more wells in the periphery of greater menengai geothermal
Correlating Resistivity With Temperature and Alteration Mineralogy in Menengai Geothermal Field:
Case Study of Menengai Exploration Well (MW-01)
Yussuf Noor, Janet Suwai, and Deflorah Kangogo
[email protected] • [email protected] • [email protected]
Figure 1. Location of Menengai Geothermal Field and Menengai Caldera.

732
Noor, et al.
field for future consideration (Figure 1). Since exploration well data for MW-01 is available, there is need to correlate, altera-tion mineralogy and temperature data with resistivity structures obtained during surface exploration. Geothermal environment is prone to changes in resistivity resulting from geothermal fluids and hydrothermal alteration, forming clay minerals at different temperatures relative to depth. Despite the findings from this re-search that comes in handy in determining pre-drilled temperatures at different depths by correlating it with resistivity, caution should be taken not to misinterpret the findings since each field is unique and every low resistivity may not necessarily be a drilling target.
2.0 Variation in Resistivity
Despite the insulator property of rocks in natural condition, several physical parameters such as porosity, salinity of saturat-ing fluid, temperature, thermal alteration and alteration mineral determine it’s conductivity in water-saturated rocks (Arnason et al., 2008).This property is summed up by Archie’sformula (Archie 1942) as below for a water saturated rocks,
ρ = ρω · α · Φ-n
ρ is the bulk resistivity, ρω is the fluid saturated resistivity, Φ porosity, n and α are the empirical coefficient
A study by Zulfadhli et al, (2010) correlating subsurface and laboratory resistivity of granite rock, indicates, field measurements with lower resistivity than laboratory analysis indicating pres-ences of water in the pores and cracks of subsurface rocks. Thus the true resistivity of rocks is higher than the apparent resistivity attributed to the moisture content from water and minerals in the subsurface rock. A resistive sub-stratum overlain by a conduc-tive zone consisting of altered minerals makes a drilling target for geothermal prospect (Mulyadi et., al., 1998). Mulyadi (1998) further attributed decrease in resistivity to increase in clay content, geothermal fluids, altered minerals, change in acidity and decrease in silica content.
3.0 Variation in Alteration Mineralogy
Metamorphism of minerals occurs under high pressure and temperature which tend to increase with depth as indicated by the expression;
p = ρhg
Where p is pressure, ρ is the density, h is depth and g is the gravity
Other factors that alter minerals include hydrothermal interac-tion with the rock matrix that changes the chemical composition and mineralogy of the host rock. The alteration may further be accelerated and magnified by the pH nature of geo-fluid composi-tion, while the result of the alteration is manifested in the clays and alteration minerals formed. PriUtami (2000) revealed the existence of hydrothermal mineral assemblages of acidic nature that occupies the shallower level of the system characterized by the presence of Kaolin with or without smectite, alunite, quartz and pyrite. In the deeper level of the system, geo-fluid composition is neutral in pH resulting in the formation of epidote, wairakite, calcite, chlorite and interlayer clays.
4.0 Temperature Variation
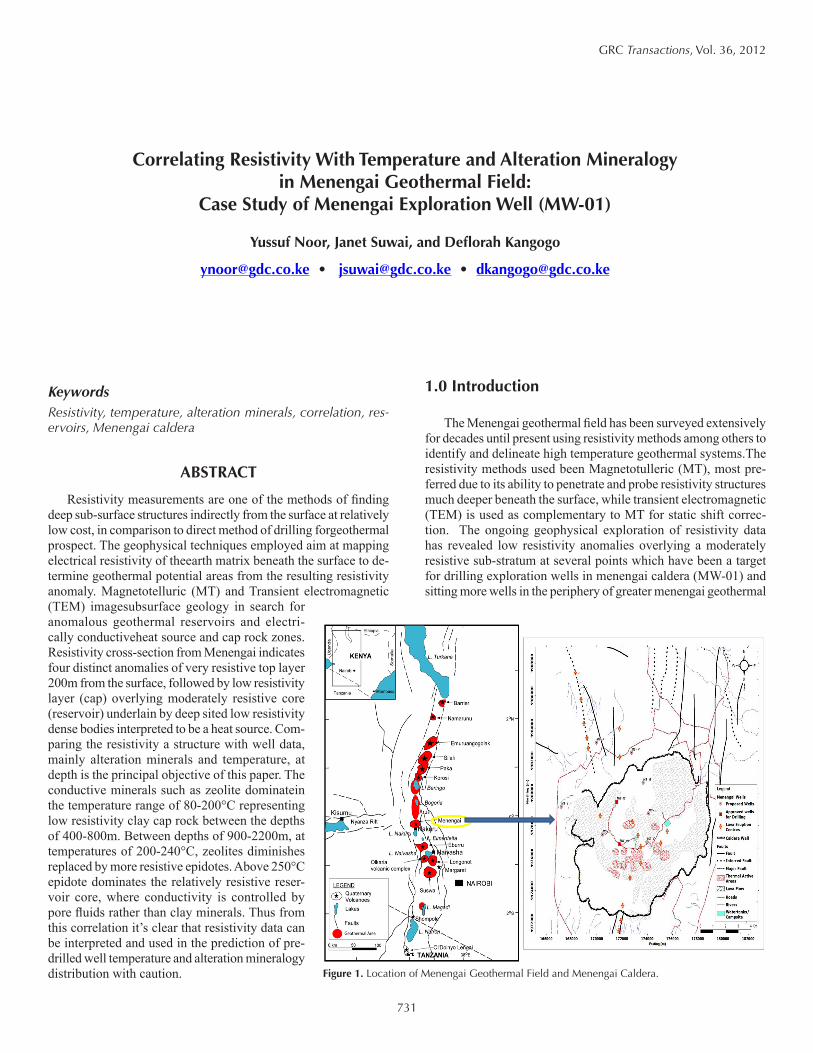
Temperature is the key element in a geothermal system that determines the use of its output effectively, in that high enthalpy system is used for electricity generation while low enthalpy is best suited for direct utilization. Temperature varies with depth in geo-thermal system where at shallow depthclayminerals such as kaolin and smectite dominate and stabilizes at ambient temperatures of about 80°C, while epidote, wairakite and laumonite are used as high temperature indicators (PriUtami, 2000). However, at any stage in the system, temperature may change due to an encounter with cold recharge or thermal instability during measurement. Temperature also tends to increase with depth, demonstrated by MW-01 temperature profile in this paper (Figure 4).
5.0 Results5.1 Resistivity Profile
To determine the resistivity of Menengai (MW-01) exploration well, cross section of MT 68 and TEM sample Mntem-66 profile conducted at the well pad (figures 2a, 2b and 3) was individually interpreted to correlate with well data. From the surface to about 200m (1800masl) the resistivity is high (>1000Ω.m), indicative of unaltered rocksextending from the surface. Low resistivity (<20Ω.m) dominates from 1400masl-800masl and is attributed to low temperature clay minerals such as zeolites detected. The low resistivity could have been influenced by other factors such as permeable fracture zones loaded with saline hydrothermal fluids, before the gradual rise in resistivity to a moderately high resis-tivity (>40 Ω.m) between 800masl -200mbsl. This is correlated with high temperature alteration minerals such as epidote. Highly conductive convex structures exist below 4000mbsl (Figure 2a)
Figure 2a. Resistivity cross-section of MW-01.

733
Noor, et al.
which is the heat source for the Menengai geothermal system not covered in this paper.
5.2 Temperature LogsSeveral heat up temperature test were
done to appraise the recovery trend of wells caused by cooling effects during drilling process. These recovery tempera-ture logs are used to locate feed zones and evaluate formation temperature. Major feed zones are encountered at around 800m and below 1800m depth in MW-01.
The temperature in the upper forma-tion (200m) is low (<50°C) coinciding with the resistive cold rock structure. However, between 200 and 400m a sudden drop in temperature correlate with a cold permeable zone indicated by total circulation loss. Above the depth of 500m, the alteration is non-existence to minimal indicative of less fractured system with low geo-fluid permeability. Temperature increases to a mid-level high between 500m-900m to over 180°C. This middle depth zone is characterized by moderate alteration and intense drill-ing fluids loss of circulation, signifying a highly permeable zone due to feed zone around this horizon (Figure 4). Alteration minerals associated with this zone are zeolite and probably smectite, though undetected in the analysis of MW-01. This correlate well with conductive zone (<20 Ω.m) encountered in the apparent resistivity profile between 400 and 800m from the surface that makes cap rock in this system. Flowing profile indicate temperatures of over 270°C from the well bottom. This correlate well with tempera-ture estimated from gas geothermometers for reservoir beneath Menengai and at Ol Rongai >270°C (Lagat et al., 2010). The high temperature zone is also char-acterized by secondary minerals such as epidote, albite, illite and quartz associ-ated with moderate to high temperature formations (Anderson et al., 1999, Ussher et al., 2000). Resistivity profile in this region is in the range 45 Ω.m supporting the high temperature mineral formation that correlate very well with well temperature above 250°C (figure 4). This agrees with resistive unaltered rock formation at the top, conductive cap rock and moderately resistive reservoir zone respectively.
Figure 2b. Resistivity cross-section of MW-01 and MT68 I-D Occam profile.
Figure 3. TEM resistivity cross-section through MW-01 and MT-68 I-D Occam profile.
734
Noor, et al.
5.3 Hydrothermal Alteration Minerals
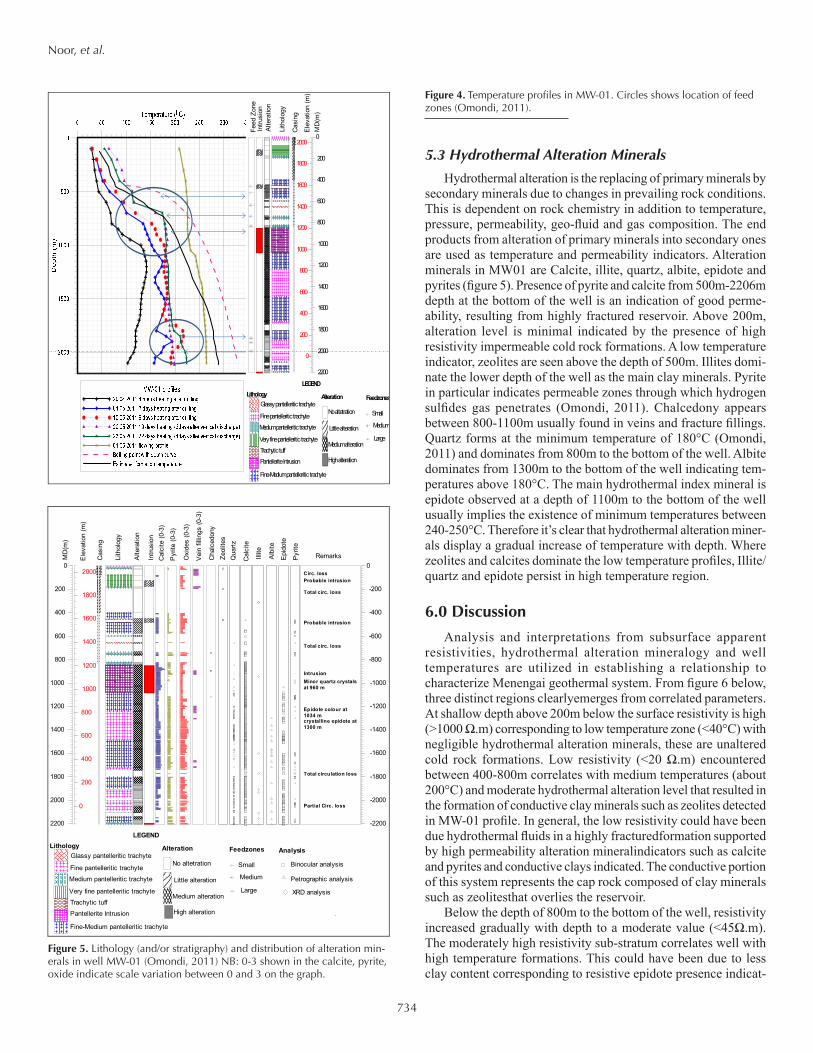
Hydrothermal alteration is the replacing of primary minerals by secondary minerals due to changes in prevailing rock conditions. This is dependent on rock chemistry in addition to temperature, pressure, permeability, geo-fluid and gas composition. The end products from alteration of primary minerals into secondary ones are used as temperature and permeability indicators. Alteration minerals in MW01 are Calcite, illite, quartz, albite, epidote and pyrites (figure 5). Presence of pyrite and calcite from 500m-2206m depth at the bottom of the well is an indication of good perme-ability, resulting from highly fractured reservoir. Above 200m, alteration level is minimal indicated by the presence of high resistivity impermeable cold rock formations. A low temperature indicator, zeolites are seen above the depth of 500m. Illites domi-nate the lower depth of the well as the main clay minerals. Pyrite in particular indicates permeable zones through which hydrogen sulfides gas penetrates (Omondi, 2011). Chalcedony appears between 800-1100m usually found in veins and fracture fillings. Quartz forms at the minimum temperature of 180°C (Omondi, 2011) and dominates from 800m to the bottom of the well. Albite dominates from 1300m to the bottom of the well indicating tem-peratures above 180°C. The main hydrothermal index mineral is epidote observed at a depth of 1100m to the bottom of the well usually implies the existence of minimum temperatures between 240-250°C. Therefore it’s clear that hydrothermal alteration miner-als display a gradual increase of temperature with depth. Where zeolites and calcites dominate the low temperature profiles, Illite/quartz and epidote persist in high temperature region.
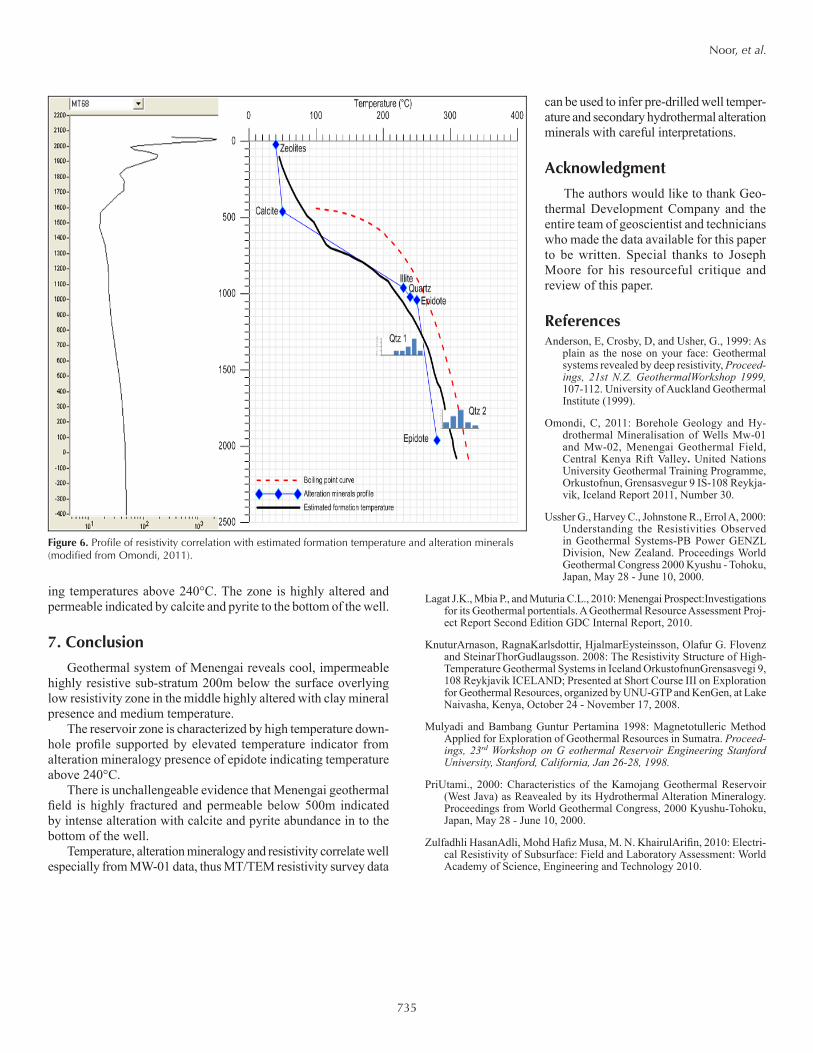
6.0 Discussion
Analysis and interpretations from subsurface apparent resistivities, hydrothermal alteration mineralogy and well temperatures are utilized in establishing a relationship to characterize Menengai geothermal system. From figure 6 below, three distinct regions clearlyemerges from correlated parameters. At shallow depth above 200m below the surface resistivity is high (>1000 Ω.m) corresponding to low temperature zone (<40°C) with negligible hydrothermal alteration minerals, these are unaltered cold rock formations. Low resistivity (<20 Ω.m) encountered between 400-800m correlates with medium temperatures (about 200°C) and moderate hydrothermal alteration level that resulted in the formation of conductive clay minerals such as zeolites detected in MW-01 profile. In general, the low resistivity could have been due hydrothermal fluids in a highly fracturedformation supported by high permeability alteration mineralindicators such as calcite and pyrites and conductive clays indicated. The conductive portion of this system represents the cap rock composed of clay minerals such as zeolitesthat overlies the reservoir.
Below the depth of 800m to the bottom of the well, resistivity increased gradually with depth to a moderate value (<45Ω.m). The moderately high resistivity sub-stratum correlates well with high temperature formations. This could have been due to less clay content corresponding to resistive epidote presence indicat-
Intru
sion
Alte
ratio
n
MD
(m)
Lith
olog
y
Cas
ing
Feed
Zon
e
Ele
vatio
n (m
)
Trachytic tuff
Very fine pantelleritic trachyte
Pantellerite Intrusion
No altetration
Little alteration
Medium alteration
Small
Large
Medium
LEGEND
FeedzonesAlterationLithology
Fine pantelleritic trachyte
Glassy pantelleritic trachyte
Medium pantelleritic trachyte
Fine-Medium pantelleritic trachyte
High alteration
2000
1800
1600
1400
1200
1000
800
600
400
200
0
0
200
400
600
800
1000
1200
1400
1600
1800
2000
2200
Lith
olog
y
Ele
vatio
n (m
)
Cas
ing
MD
(m)
Alte
ratio
n
Intru
sion
Cal
cite
(0-3
)
Vei
n fil
lings
(0-3
)
Oxi
des
(0-3
)
Pyr
ite (0
-3)
Cha
lced
ony
Zeol
ites
Qua
rtz
Cal
cite
RemarksPyr
ite
Epi
dote
Alb
ite
Illite
Trachytic tuff
Very fine pantelleritic trachyte
Pantellerite Intrusion
No altetration
Little alteration
Medium alteration
High alteration
Small
Large
Medium
LEGEND
Feedzones Analysis
Binocular analysis
Petrographic analysis
XRD analysis
AlterationLithology
Fine pantelleritic trachyte
Glassy pantelleritic trachyte
Medium pantelleritic trachyte
Fine-Medium pantelleritic trachyte
2000
1800
1600
1400
1200
1000
800
600
400
200
0
0
200
400
600
800
1000
1200
1400
1600
1800
2000
2200
0
-200
-400
-600
-800
-1000
-1200
-1400
-1600
-1800
-2000
-2200
Circ. lossProbable intrusion
Total circ. loss
Probable intrusion
Total circ. loss
IntrusionMinor quartz crystalsat 960 m
Epidote colour at1034 mcrystalline epidote at1300 m
Total circulation loss
Partial Circ. loss
Figure 4. Temperature profiles in MW-01. Circles shows location of feed zones (Omondi, 2011).
Figure 5. Lithology (and/or stratigraphy) and distribution of alteration min-erals in well MW-01 (Omondi, 2011) NB: 0-3 shown in the calcite, pyrite, oxide indicate scale variation between 0 and 3 on the graph.
735
Noor, et al.
ing temperatures above 240°C. The zone is highly altered and permeable indicated by calcite and pyrite to the bottom of the well.
7. Conclusion
Geothermal system of Menengai reveals cool, impermeable highly resistive sub-stratum 200m below the surface overlying low resistivity zone in the middle highly altered with clay mineral presence and medium temperature.
The reservoir zone is characterized by high temperature down-hole profile supported by elevated temperature indicator from alteration mineralogy presence of epidote indicating temperature above 240°C.
There is unchallengeable evidence that Menengai geothermal field is highly fractured and permeable below 500m indicated by intense alteration with calcite and pyrite abundance in to the bottom of the well.
Temperature, alteration mineralogy and resistivity correlate well especially from MW-01 data, thus MT/TEM resistivity survey data
can be used to infer pre-drilled well temper-ature and secondary hydrothermal alteration minerals with careful interpretations.
Acknowledgment
The authors would like to thank Geo-thermal Development Company and the entire team of geoscientist and technicians who made the data available for this paper to be written. Special thanks to Joseph Moore for his resourceful critique and review of this paper.
ReferencesAnderson, E, Crosby, D, and Usher, G., 1999: As
plain as the nose on your face: Geothermal systems revealed by deep resistivity, Proceed-ings, 21st N.Z. GeothermalWorkshop 1999, 107-112. University of Auckland Geothermal Institute (1999).
Omondi, C, 2011: Borehole Geology and Hy-drothermal Mineralisation of Wells Mw-01 and Mw-02, Menengai Geothermal Field, Central Kenya Rift Valley. United Nations University Geothermal Training Programme, Orkustofnun, Grensasvegur 9 IS-108 Reykja-vik, Iceland Report 2011, Number 30.
Ussher G., Harvey C., Johnstone R., Errol A, 2000: Understanding the Resistivities Observed in Geothermal Systems-PB Power GENZL Division, New Zealand. Proceedings World Geothermal Congress 2000 Kyushu - Tohoku, Japan, May 28 - June 10, 2000.
Lagat J.K., Mbia P., and Muturia C.L., 2010: Menengai Prospect:Investigations for its Geothermal portentials. A Geothermal Resource Assessment Proj-ect Report Second Edition GDC Internal Report, 2010.
KnuturArnason, RagnaKarlsdottir, HjalmarEysteinsson, Olafur G. Flovenz and SteinarThorGudlaugsson. 2008: The Resistivity Structure of High-Temperature Geothermal Systems in Iceland OrkustofnunGrensasvegi 9, 108 Reykjavik ICELAND; Presented at Short Course III on Exploration for Geothermal Resources, organized by UNU-GTP and KenGen, at Lake Naivasha, Kenya, October 24 - November 17, 2008.
Mulyadi and Bambang Guntur Pertamina 1998: Magnetotulleric Method Applied for Exploration of Geothermal Resources in Sumatra. Proceed-ings, 23rd Workshop on G eothermal Reservoir Engineering Stanford University, Stanford, California, Jan 26-28, 1998.
PriUtami., 2000: Characteristics of the Kamojang Geothermal Reservoir (West Java) as Reavealed by its Hydrothermal Alteration Mineralogy. Proceedings from World Geothermal Congress, 2000 Kyushu-Tohoku, Japan, May 28 - June 10, 2000.
Zulfadhli HasanAdli, Mohd Hafiz Musa, M. N. KhairulArifin, 2010: Electri-cal Resistivity of Subsurface: Field and Laboratory Assessment: World Academy of Science, Engineering and Technology 2010.
Figure 6. Profile of resistivity correlation with estimated formation temperature and alteration minerals (modified from Omondi, 2011).

736