Embed Size (px)
Citation preview

Corporate Taxes and the
Location of U.S. Trademarks
Jost Heckemeyer
University of Hannover
Pia Olligs
University of Cologne
Michael Overesch
University of Cologne
June, 2016
Abstract:
This study analyzes whether tax incentives play a role in the legal assignment of trademarks
registered for the U.S. market by large multinational enterprises. Our analysis for US S&P 500
firms suggests that tax considerations have a limited influence on the geographical allocation of
trademarks. However, if trademarks are assigned to affiliates located offshore, we find a
significant influence of corporate tax rates and U.S. withholding taxes. Comparing these results
to the assignment of U.S. trademarks registered by European firms (STOXX 600 Europe), we are
able to identify that U.S. firms are more sensitive to a tax rate decrease in certain tax havens than
European firms.
Keywords: Trademark, Corporate Tax, Location Choice, Multinational Firm

1
1. Introduction
We analyze where large multinational companies assign the ownership of their U.S.
trademarks and whether these location choices are driven by tax considerations. Matching the
U.S. Patent and Trademark Office’s (USPTO) register with group structures of large MNEs from
the U.S. (S&P 500), we describe and explain the geographic origin of U.S. trademark
registrations submitted by these global companies. Furthermore, we compare U.S. firms’
strategies to those of large MNEs from Europe (STOXX Europe 600).
Trademarks are important intangible assets in modern business and often represent
fundamental drivers of firm value. They enable companies to distinguish their products from the
competition and serve to convey corporate identity. Today, the world’s top 100 brands, embodied
within trademark rights, feature estimated market values ranging from US$ 12 billion (J.P.
Morgan) up to US$ 128 billion (Apple).1 Investors acknowledge the value of trademarks (Sander
and Block, 2011) and expect positive cash flow effects from new registered trademarks
(Krasnikov, Mishra and Orozco, 2009).
Against this background, multinational companies may seek tax advantages in holding
trademark assets offshore. There is indeed anecdotal evidence on MNEs strategically designating
subsidiaries in low-tax countries to hold their trademark rights. For example, the world’s biggest
producer of sporting goods, Nike Inc., has assigned numerous trademark rights to subsidiaries in
Bermuda (McIntyre, Phillips, and Baxandall, 2015).2 The trademarks may be used in foreign
retail markets by entities which pay a royalty to the trademark-owners in Bermuda. These
royalties reduce Nike’s taxable profits in retail markets while increasing profits in Bermuda. As
1 Brand Finance, Global 500 – The annual report on the world’s most valuable global brands, February 2015.
Available for download: http://brandfinance.com/images/upload/brand_finance_global_500_2015.pdf. 2 There are further examples of international tax planning strategies involving trademarks and a number of
consultancies explicitly advocate such strategies. Also see Dischinger and Riedel (2011) for a discussion.

2
there is no corporate income tax in Bermuda, this is an attractive tax saving strategy which could,
among other factors, explain Nike’s very low foreign effective tax rate (ETR) of only 2.2 percent
in 2014.3
Previous empirical literature shows more generally that MNEs engage in tax-motivated
income-shifting to low-tax jurisdictions (Hines and Rice, 1994; Huizinga and Laeven, 2008;
Heckemeyer and Overesch, 2014). Moreover, there is compelling empirical evidence that this
may involve the tax-efficient geographical allocation of intangible assets within the group
(Grubert and Slemrod, 1998; Dischinger and Riedel, 2011; Markle and Shackelford, 2012a,
2012b). With respect to the types of intangibles at the heart of international tax saving strategies,
previous work concentrates on the role of patents. Using patent data registered at the European
patent office (EPO), the earlier studies suggest that patent ownership within MNEs indeed
responds to international tax incentives (Karkinsky and Riedel, 2012; Griffith, Miller and
O’Connell, 2014; Boehm et al., 2015). Dudar and Voget (2016) analyze the tax response of
patent and trademark assignments for a pooled sample of European and U.S. firms. Still, very
little is known, specifically, about the relevance of U.S. trademarks for international tax planning
of large MNEs, considering the particularities of the U.S. context.
We fill this research gap and analyze the extent to which international tax incentives drive
the geographical ownership allocation of trademarks filed at the USPTO within large U.S. MNEs
and European MNEs. As the Nike Inc. example shows, trademarks, just as other intangibles,
exhibit characteristics of a public good (Markusen, 1995) and thus can be used as a non-rival
input separate from other affiliates in the group. Moreover, appropriate royalty rates should be
arm’s length but valuation of intangibles is difficult and, as a consequence, the MNE may be able
3 See Nike Inc.’s 2014 10-k: https://www.sec.gov/Archives/edgar/data/320187/000032018714000097/nke-
5312014x10k.htm#s1BA25FBD5706D09A386C71629FCDD9A6.

3
to distort intra-group royalty prices in order to shift additional income to the trademark-owner.
Furthermore, whereas R&D investment must take place at an early stage to finance creative
invention, most investment in a trademark is undertaken after its assignment and registration,
because continuous extensive marketing is necessary to establish a new trademark (Sander and
Block, 2011). As a consequence, the allocation of trademarks might be relatively flexible because
value creation will take place only in the long term. On the other hand, if the user of a trademark
undertakes these advertising activities at his own risk, the associated expenditures have to be
reflected in the royalty paid to the trademark’s owner (OECD, 2015). The potential to shift profits
to low-tax countries decreases accordingly.
Importantly, as this study deals with trademarks registered at the U.S. Patent and
Trademark Office, the particularities of U.S. trademark law must be carefully considered as well.
Licensing of U.S. trademarks is indeed riskier than licensing other intellectual property (Cheztek,
2001). In particular, there exist stringent legal requirements with respect to any licensor’s control
over the nature and quality of the goods or services to which the mark is applied by license.
These stringent requirements under U.S. law provide an important reason to designate as owner
and applicant of a U.S. trademark either the parent company or the entity that actually uses the
trademark (Heavner and Luepke, 2008).
Whether tax considerations are dominated by non-tax considerations, e.g. linked to
trademark law, or still play a significant role in the trademark assignment within multinational
companies is, ultimately, an empirical issue. To investigate the tax sensitivity of trademark
allocation within MNEs, we exploit a new dataset provided by the U.S. Patent and Trademark
Office (USPTO) containing all trademarks registered for the U.S. market between 2003 and 2012
(for a detailed description of the dataset see Graham et al., 2013). We match the trademark
registration data with international group structures of large U.S. MNEs and European MNEs
4
listed respectively in the S&P 500 or the STOXX Europe 600 Index.4 Eventually, our matched
data sample combines rich trademark data, 96,762 USPTO registrations in total, with detailed
information about the trademark-owning entities and their affiliated group. This data provides
deep insight into the patterns of U.S. trademark ownership in global MNEs.
The results from the data analysis are twofold. First, we find that there is indeed a strong
home bias in trademark ownership. U.S. MNEs listed in the S&P 500 hold and register 95.7
percent of their U.S. trademarks in the United States. Similarly, European MNEs listed in the
STOXX Europe 600 locate 89.9 percent of their U.S. trademark portfolio either directly at a U.S.
subsidiary, i.e. in the country of protection and use, or alternative in their parent country. Only
16.6 percent of U.S. trademarks owned by S&P 500 firms in our sample are held in classical tax
haven countries. Still, some tax havens turn out as important trademark holding locations. Ireland
and Switzerland, for example, are popular for both U.S. and European MNEs whereas Bermuda
is highly frequented by U.S. firms. Based on these explorative results, we consider the underlying
location choice to be a two-step choice where the first choice is whether to locate trademark
ownership in a third country or at the headquarter location (offshore decision) and, conditional on
locating it in a third country, the second step is to select the respective third country (foreign
location decision).
We start our empirical analysis with the offshore decision whether to locate trademark
ownership in the U.S. or abroad. Interestingly, we do not identify tax considerations as an
important factor in this choice. However, we find a strong concentration of trademarks ownership
location in Delaware which is acknowledged to be a domestic U.S. tax haven (Dyreng, Lindsey
and Thornock, 2013; Lindsey and Wilson, 2015). In total numbers, U.S. firms locate 43,770
trademarks, i.e. 53.5 percent of all successful registrations, in Delaware. Accordingly, we assume
4 The matching procedure is described in the data section 3.

5
that tax considerations indeed play a role when a firm chooses the U.S. affiliate to assign
trademark ownership.
Getting to the foreign location decision, the tax elasticity of trademark location choice is
indeed significant and negative, conditional on designating a subsidiary in a third country, i.e.
neither in the parent country nor in the United States, to hold the trademark. Moreover, we find
that withholding taxes imposed on royalty payments between the U.S. and a potential trademark
location significantly lower the respective country’s probability to actually host a U.S. trademark.
Simulating a one percentage point decrease in the statutory tax rate of some selected countries,
we identify that especially tax haven countries benefit from this cut in statutory tax rate. We find
that Ireland reacts with a cross semi-elasticity of 21.8, i.e. compared to the base probability
before the cut in tax rate, Ireland gains 21.8 percent in base probability. Similarly other tax haven
countries (Bermuda; Switzerland) react rather sensitive (18.2; 17.9) while high tax countries like
Canada and Germany have lower cross semi-elasticities of 2.5 and 0.7. Comparing these results
to the location choice of European firms, we find that U.S. firms react more sensitive to a one
percentage point cut in statutory tax rate of tax haven countries. For European firms, we find
cross semi-elasticities of 14.8 for Ireland and 11.1 for Switzerland.
Tax authorities have raised increasing concerns about the relocation of intangible assets to
low-tax countries. Furthermore, the OECD has put forward an action plan to encounter base
erosion and profit shifting (BEPS) resulting from international tax planning. One action point on
the agenda deals specifically with issues related to the tax treatment of intangibles (OECD,
2015). IP-intensive firms are primary targets of this agenda because the income deriving from
intangible assets is considered to be especially mobile (De Simone, Mills and Stomberg, 2014)
and the mobility of income has been shown to increase with a company’s R&D expenditure and
with its advertising expenditure (Harris, 1993; Grubert, 2003). Against this background and in

6
view of the substantial values and important tax implications associated with trademarks, it is
indeed surprising that, up to now, there has been very little empirical evidence on the ownership
patterns of this important class of intangible asset. Our study informs and advances the debate on
the magnitude and elasticities of international tax avoidance by IP-intensive multinational firms.
The remainder of the paper is organized as follows. In Section 2, we discuss the influence
of tax considerations within the process of trademark location decision. Section 3 describes our
dataset and methodology. Empirical results are presented in Section 4. Section 5 concludes.
2. Tax Avoidance Through Trademark Use
2.1 Trademark Registration and Ownership
In modern business, trademarks are a primary tool of corporate marketing, communication
and brand building. More specifically, a trademark can be any word, name, symbol, device or any
combination of these that enables one party to distinguish its goods and services from those of
other parties.5 In other words, trademarks act as a certificate of origin and quality and, more
generally, it can help to communicate the company’s values and identity. The value of a
trademark therefore lies in the goodwill and consumer recognition it represents. Against this
background, the U.S. law offers several ways to protect a trademark used in the United States.
Protection thereby means the ability of trademark owners to exclude unauthorized parties from
using similar marks on identical or confusingly similar products (Calboli, 2007).
The ownership in a trademark derives from use. Under U.S. common law, the first user of a
distinctive trademark in commerce is generally provided with protection of this trademark in the
geographic region it is used in. It is thus not necessary to register a trademark in order to own it.
5 See 15 U.S.C. § 1127.

7
However, common law trademark rights are limited not only in geographical scope but the owner
also lacks a clear title to his mark.6 As a consequence, absent registration, trademark rights can
diminish quickly over time and place and be lost as a result of interrupted use and disuse. In view
of these limitations, a registration of trademarks at the USPTO is attractive. In particular, the
certificate of registration creates a presumption (‘prima facie evidence’) of ownership and
establishes a right of priority covering the entire United States regardless of where the mark is
actually used.7 Besides filing an application directly at the USPTO, the owner of a trademark
might file an international application under the Madrid Protocol or the Paris Convention.
International applications name the countries in which the registrant seeks protection for the
respective trademark and are filed through the World Intellectual Property Organization (WIPO).
These applications do not constitute a unique international registration, but rather one separate
registration in each of the designated countries following the law of these countries (World
Intellectual Property Organization, 2012). In other words, WIPO hands the applications to the
respective office the applicant claims protection for, but each office examines the international
application in the same way as applications filed directly at this office.8 For our analysis, this
difference in administrative process is not of interest.
6 Bohan Mathers, LLC: Who Owns a Trademark? URL: http://www.bohanmathers.com/who-owns-a-
trademark.html. 7 See 15 U.S.C. § 1057. Successful registration of a trademark requires that it is in use or is intended to be in use, see
15 U.S.C. § 1051. However, the filing date of an application for registration at the USPTO constitutes “constructive
use” of the mark, conferring a nationwide right of priority over a later date of actual first common law use, see 15
U.S.C. § 1057(c). Also note that a trademark registration remains active for ten years. It can be renewed in a ten-year
term if the trademark is continuously used (see 15 U.S.C. §§ 1058(a), 1059(a)). 8 In contrast to direct U.S. applications, international applications are usually not based on immediate use in the U.S.
market, but on an existing foreign registration or an earlier application filed at a foreign office. We conducted our
analysis in section 3.2 for international and direct U.S. applications separately. As we could not identify any
noteworthy difference, we do not differentiate between international and direct applications in the following.

8
2.2 International Tax Planning Strategies Built Around Trademark Rights
A multinational company generally owns a collection of trademark related rights which, in
their diverse forms of protection, together with the embodied values or goodwill represent the
brand (Cohen, 2008). For an MNE, the question arises whether and where to consolidate these
rights. Some international companies with U.S. affiliates simply choose to have one of their U.S.
subsidiaries file the U.S. application in its own name. In some cases, local subsidiaries may even
register a trademark at the USPTO without the knowledge of the parent company. Enforcement
of marks owned by many different local subsidiaries can be difficult and lead to ineffective
protection strategies on an international scale (Heavner and Luepke, 2008). Consolidating all
trademark rights into one single entity which then owns all trademark registrations world-wide
avoids inconsistent ownership in trademark registrations and, in addition, helps to police the
marks and exploit their value to the maximum (Heavner and Luepke, 2008; Cohen, 2008). From
this perspective, the entity that is designated to hold the trademark rights can be the parent
company or, alternatively, a holding company. This choice will be driven by tax considerations
on the one hand and by the particularities of trademark law on the other hand.
From a tax perspective, the appeal of holding U.S. trademarks away from the parent arises
from the international profit shifting potential. Trademarks held in an entity set up in a low-tax
jurisdiction can, in principle, be licensed out to the parent company or other affiliates within the
multinational group which use the mark in U.S. commerce. The royalties paid in compensation
for the trademark license are treated as tax-deductible expense to the licensees which may operate
in the U.S., whereas the royalty income received by the licensor is taxed at low rates or remains
even tax-free. This income may be later repatriated to the parent company, the sole stockholder of

9
the trademark owning entity, in the form of dividends.9 The result is a reduction in the overall tax
burden of the multinational company. This reduction is definite if the home country of the
MNE’s parent company exempts foreign dividends from home country taxes. The exemption
system is applied in most European countries. The U.S., however, do not tax-exempt foreign
dividends but avoid international double taxation of profits by granting credits for foreign taxes
paid, which reduce the U.S. home country tax liability. Accordingly, any profits shifted from
high-tax countries to trademark owners in tax-favorable jurisdictions generate no ultimate tax
savings for U.S. MNEs because residual U.S. tax is levied when the foreign profits are repatriated
as dividends to the U.S. parent. Whether the mere deferral of home country tax liabilities creates
sufficiently strong incentives for U.S. MNEs to engage in strategic allocation of trademark
ownership is ultimately an empirical question.10
Recent empirical evidence, however, shows that
multinationals domiciled in exemption countries, on average, shift more income than do those
domiciled in credit countries (Markle, 2015).
Some further important nuances of international tax regimes may affect the tax benefits
arising from income shifting via trademarks allocation. In particular, withholding taxes and
controlled foreign company (CFC) legislation might militate against the license model (Cohen,
2008; Markle and Robinson, 2012). For example, according to national law, the U.S. levy a 30%
withholding tax on gross royalty payments, which indeed seems particularly relevant for
trademarks used in U.S. commerce. From a tax perspective, we thus expect U.S. trademarks to be
allocated to foreign countries that avoid high U.S. withholding taxes on royalties through a good
9 For a general description of international tax planning strategies, including the role of intangibles and holding
structures, see Russo (2007) and, more specifically, Fuest et al (2013). 10
U.S. MNEs are indeed known to hold much cash overseas to avoid the U.S. repatriation taxes:
http://www.bloomberg.com/news/articles/2014-03-12/cash-abroad-rises-206-billion-as-apple-to-ibm-avoid-tax. Also
see Lindsey and Wilson (2015) for a discussion. The financial reporting standards in the U.S. reflect the income tax
treatment if the earnings are deemed to be indefinitely reinvested in the foreign country. In other words, under APB
23 in U.S. GAAP (and IAS 12 in IFRS), the tax expense related to the U.S. tax liability on foreign earnings is not
recorded until the dividend is paid and the cash tax payment is due. Also see Markle (2015) for a discussion.

10
network of double tax treaties with the United States and/or other relevant countries involved.
Moreover, to limit benefits from international tax planning that are considered as inappropriate,
many capital exporting countries have introduced some form of CFC legislation. These special
tax regimes target non-trading income derived by foreign entities of resident MNEs which are
subject to critically low tax rates. Once a CFC rule turns binding, the advantage from the deferral
of home country tax liabilities (credit countries) or from the exemption of foreign dividends
(exemption countries) is effectively nullified by consolidating the foreign entity’s non-trading
income with that of its parent company and taxing it as it is earned. Although MNEs may find
ways to overcome CFC legislation, these rules pose certain obstacles to the license model.11
Furthermore, the license model raises international transfer-pricing issues. Basically, the
trademark owner is entitled to the income deriving from the exploitation of a trademark right.
Appropriate royalty rates should be arm’s length but valuation of intangibles is difficult and, as a
consequence, the MNE may be able to distort intra-group royalty prices in order to shift
additional income to the trademark owner. In return, if the user of a trademark undertakes
advertising activities to enhance trademark value at his own risk, the associated expenditures
have to be reflected in the royalty paid to the trademark’s owner (OECD, 2015). The potential to
shift profits to low-tax countries decreases accordingly.
After all, tax considerations might not only lead multinational companies to locate their
U.S. trademarks in tax attractive locations outside the U.S. Some U.S. states, Delaware in
particular, offer attractive tax rules for intangible assets as well. Specifically, Delaware exempts
from state-level corporate income tax those corporations whose activities are confined to the
11
U.S. CFC rules under Subpart F of the U.S. IRC can be circumvented by so-called check-the box elections, with
the consequence that intra-company royalty flows are disregarded and only revenues from transactions with
customers, which due to exceptions included in the Subpart F provisions typically do not constitute Subpart F
income, are considered from a US perspective. In the European Union, CFC legislation has been limited by the
European Court of Justice (Cadburry Schweppes, ECJ, 2006): As long as certain structures are not merely artificially
motivated by tax purposes but also by economic activity, CFC rules do not apply.

11
maintenance and management of their intangible investment.12
Accordingly, a tax avoidance
strategy that exploits this rule involves implementation of a Passive Investment Company (PIC)
or Delaware Intangible Holding Company (DIHC) which are designated to hold ownership in
intangible assets. Subsequently, income is shifted into these entities from other U.S. states
principally through the same mechanism as outlined previously, i.e. intra-firm license agreements
and associated royalty payments.13
The role of Delaware as a domestic tax haven inside the U.S.
is quantitatively explored in Dyreng, Lindsey and Thornock (2013). They show that, using a
Delaware-based tax strategy, U.S. firms can decrease their U.S. state income tax burden by 15-24
percent. Still, immediate cash tax savings from domestic strategies are quantitatively smaller than
those resulting from international strategies which involve non-U.S. IP locations. However,
domestic strategies generate permanent benefits whereas tax savings from multinational
avoidance are only temporary until the foreign profits are eventually repatriated to the United
States. From this perspective, a domestic PIC strategy may be more potent than similar
multinational strategies (Blouin and Krull, 2009; Markle, 2011; Dyreng, Lindsey and Thornock,
2013, Lindsey and Wilson, 2015). Consistently, Dyreng, Lindsey and Thornock (2013) find that
the frequency of subsidiaries located in Delaware outpaces by far the state’s economic output in
terms of GDP, and, in addition, the frequency of patent assignment to Delaware-based owners per
dollar of state GDP is the highest in the U.S. However, initiatives taken by other U.S. states to
fight the Delaware tax strategy turn out to be effective, as well. 14
12
See 30 Del. C. § 1902(b)(8). Nevada, South Dakota, Washington, and Wyoming may provide similar tax benefits
as they impose not state-level corporate income tax at all. 13
This strategy is described by an abundant legal literature. It is “probably the most well known aggressive tax
planning technique” (Bankman, 2007: p. 778) in U.S. state taxation. 14
Two countermeasures are considered. The first measure is combined reporting which requires a company to
include the net profits of all its domestic entities in a consolidated or combined tax return, effectively eliminating
intra-company transfers that make the Delaware PIC strategy possible. The second measure considered is an
economic nexus doctrine that requires firms to file and pay taxes based on economic presence, thus allowing states to
tax the royalty income that escapes taxation in the state of Delaware (Dyreng, Lindsey and Thornock, 2013).
12
The decision by U.S. firms to implement subsidiaries in Delaware or rather abroad in some
foreign tax haven is empirically analyzed by Lindsey and Wilson (2015). Interestingly, neither
Dyreng, Lindsey and Thornock (2013) nor Lindsey and Wilson (2015) explicitly consider the
distinct role of trademarks in their analysis.
2.3 U.S. Trademark Law and Tax Avoidance Strategies
This role of trademarks might be special, however. In particular, legal literature highlights
differences in the riskiness of tax avoidance strategies built around trademarks as opposed to
other types of intangibles. More specifically, particularities of U.S. trademark law result in the
licensing of trademarks being riskier than licensing other intellectual property. Licensing
trademarks, under certain conditions, implies the risk of losing the right to use the trademark
whereas no corresponding risk is incurred in the case of other intangibles (Chestek, 2001).
First, in the United States, both under common law and the Lanham Act (15 U.S.C.
§§1051-1127), an assignment of a trademark without the associated goodwill (“in gross”) is
deemed invalid and the assignee acquires no rights in the mark. In other words, a trademark
cannot exist independently of the business it represents. If the subsidiary designated to hold the
trademark rights does no business other than licensing, it may be difficult to claim that any
goodwill at all is associated with the mark.15
Second and perhaps more importantly, the
requirements for a trademark license to be valid are higher in the United States than they are in
many other countries. The main difference is that the trademark licensor in the United States
must, by statute, exercise sufficient control and supervision over the nature and quality of the
goods or services to which the mark is applied by its license (Heavner and Luepke, 2008). If the
15
See Lawrence Stanley: “Trademark Holding Companies: Speculative Benefits, Certain Pitfalls”, blog post, dated
January 9, 2012. URL: https://webtm.com/trademark-holding-companies-speculative-benefits-certain-pitfalls/.
Lawrence Stanley is Associate at Morgan, Lewis & Bockius LLP.

13
licensor fails to exercise such control, the license may be considered a “naked” license and that
may lead to an abandonment of rights in the mark and its registration. The U.S. judiciary answers
the question of adequate control on a case-by-case basis (Chestek, 2001; Calboli, 2007).
Although courts have repeatedly proven reluctant in requiring a strict application of quality
control and rather adopted a pragmatic approach, there remains considerable uncertainty as to
what constitutes a valid license (Calboli, 2007). To avoid the risk of losing the right to use the
trademarks, the owner of the mark needs to set quality standards in any license agreement, list the
ways in which control over these standards is exercised and, finally, be up to review and enforce
these standards. In particular, an offshore subsidiary may have difficulties in arguing that it
controls its parent’s or sisters’ use of the mark and associated goods and services (Cheztek, 2001;
Calboli, 2007). The stringent licensing requirements provide an important reason to designate as
owner and applicant of a trademark either the parent company or the entity that actually uses the
trademark (Heavner and Luepke, 2008). In other words, U.S. trademark law militates against
holding U.S. trademarks away from the parent or from the using U.S. entity.16
Whether tax considerations are dominated by non-tax considerations, e.g. linked to
trademark law, or still play a significant role in the trademark assignment within multinational
companies is, ultimately, an empirical issue.
16
Of course, the parent company can itself be located in a tax attractive jurisdiction. For example, Delaware is by far
the most common state of parent company incorporation among publicly traded U.S. enterprises. The role of
Delaware as primary location for incorporation of parent companies is due to legal benefits that evolved from
regulatory competition among U.S. states (Dyreng, Lindsey, Thornock, 2013; Roe, 2003, Bebchuk, Cohen and
Ferrell, 2002).

14
3. Data and Methodology
3.1 Data
In order to conduct our empirical analysis we require information on the legal ownership of
U.S. trademarks within MNE group structures. The trademark data is taken from the USPTO
register.17
A trademark application at the USPTO needs to be filed by the mark’s legal owner
(Graham et al., 2013). Thus, we can infer from the USPTO data the legal owners of the registered
trademarks and where those entities reside. Besides information on trademark ownership
including name, address and further applicant information, the USPTO database contains, for
each trademark respectively, the date of filing, registration and the classes of goods and services
covered. We use the update 2012 dataset which includes registrations until January 2013 and
consider trademarks successfully registered between 1st January 2003 and 31
st December 2012.
18
We match this information to the ownership structures of U.S. companies listed in the S&P
500 Index19
and, in addition, to European companies listed in the STOXX Europe 600 Index.
With respect to the ownership structures of the S&P 500 firms, we exploit the information
disclosed in Exhibit 21 of Form 10-k. As already established by prior literature (see for example
Dyreng and Lindsey, 2009; Lindsey and Wilson, 2015), Exhibit 21 reveals information about a
firm’s significant subsidiaries and their countries of incorporation.20
Exhibit 21 is available at the
17
The full dataset is available for download at http://www.uspto.gov/learning-and-resources/electronic-data-
products/trademark-case-files-dataset-0. For a more detailed description of the dataset see Graham et al. (2013). 18
We do not include renewal registrations. Trademark renewal will certainly follow the primary filing, potentially
leading to strong dependence of the respective data points and problems of double counting. 19
Note: We do not include MNEs listed on the S&P 500 Index but that do neither have their headquarters nor their
incorporation in the U.S. 20
According to SEC Regulation (17 CFR 210.1-02(w)), a subsidiary can be deemed not to be a significant subsidiary
if all of the following three conditions are met: (1) the parent company’s and its other subsidiaries’ investments in the
subsidiary do not exceed ten percent of the parent company’s total assets; (2) the parent company’s and its other
subsidiaries’ proportionate share of the assets of the subsidiary do not exceed ten percent of the consolidated firm’s
total assets; and (3) the parent company’s and its other subsidiaries’ proportionate share of the subsidiary’s pre-tax
income from continuing operations does not exceed ten percent of the consolidated income from continuing
operations.

15
SEC’s database EDGAR.21
We have collected this information for the fiscal year 2007.22
In our
matching procedure, we use legal names and countries of incorporation. We require the country
of incorporation to perfectly match and the company name to match at least to 99.4 percent.23
Moreover, we add financial data obtained from COMPUSTAT. Statutory corporate tax
rates, information on controlled foreign company (CFC) legislation in the U.S. and European
countries as well as special tax treatment of trademark income (trademark boxes) are collected
from the International Bureau of Fiscal Documentation (IBFD) and tax surveys provided by EY,
KPMG and PwC. Macroeconomic data is obtained from the World Bank and CEPII GEODIST.24
Marginal Tax Rates derive from Graham’s database.25
We require non-missing values for all
country characteristics. After all, our final dataset includes 478 S&P firms that registered 81,766
new trademarks for use in U.S. commerce between 2003 and 2012.26
For additional analysis, we match the USPTO information to the ownership structures of
European companies listed in the STOXX Europe 600 Index during 2007. The information on
ownership structures is obtained from the AMADEUS database provided by Bureau van Dijk and
financial information from COMPUSTAT GLOBAL. All other control variables reveal from the
same sources as used for the U.S. firms. The data covers 235 STOXX Europe 600 firms being
21
https://www.sec.gov/edgar/searchedgar/companysearch.html. 22
As the transfer of intangible assets usually results in heavy tax consequences, we assume that the trademark is
registered by a company remaining in the group and changes in ownership structure within the group of companies
should not be of any interest for our analysis. Also note that the country Georgia cannot be distinguished from the
U.S. state Georgia in our dataset, and we therefore deleted Georgia from our sample. 23
The challenge is to match the legal name as little misspellings or the usage of abbreviations for the legal form of a
company might hinder the matching. Therefore, we searched the company names for commonly used legal forms
and replaced all written out legal forms with its abbreviations. Moreover, we deleted space characters from the
spelling and changed it to the use of small letters only. 24
For variable description see Appendix 1. 25
Simulated marginal tax rates (MTR), based on the methodology of Graham (1996), are available for download at:
https://faculty.fuqua.duke.edu/~jgraham/taxform.html. 26
A detailed overview regarding data collection for the sample is reported in Appendix 2.

16
based in sixteen countries.27
These firms registered 14,984 new U.S. trademarks during the same
time period.
3.2 Methodology
In our empirical framework, we model the MNE's trademark allocation decision as a two-
step process in which we first analyze the determinants of the corporate decision to locate legal
ownership of U.S. trademarks offshore and then, in a second step, investigate the tax and non-tax
country characteristics that attract legal ownership of U.S. trademarks, conditional on offshoring
ownership. This two-step framework for analysis is consistent with other studies modeling the
geographical allocation of intangible asset ownership within MNEs, e.g. with Boehm et al. (2015)
who investigate the geographical split between R&D activity and patent ownership, or more
generally, with the framework for analysis of MNEs' choice on transnational capital investment
as proposed by Horstmann and Markusen (1992) and extended by Devereux (2006).
Accordingly, in the first part of our empirical analysis, we assess potential determinants of
the decision whether to locate trademark ownership in the U.S. or offshore ("offshore decision").
Specifically, we define a binary variable OFFSHOREi,n,t which takes on the value 1 if firm i
locates the ownership of trademark n at time t in a foreign country and 0 otherwise. Following
the latent variable approach to binary choice models, we specify an unobserved underlying latent
variable OFFSHORE* as
𝑂𝐹𝐹𝑆𝐻𝑂𝑅𝐸∗𝑖,𝑛,𝑡 = 𝛽0 + 𝛽1𝑀𝑇𝑅𝑖,𝑛,𝑡 + 𝛽2𝑉𝑖,𝑛,𝑡 + 𝛽4𝑋𝑖,𝑛,𝑡 + ε𝑖,𝑛,𝑡 (1)
27
A list of the home countries is reported in Appendix 3.

17
Our model accounts for a set of explanatory variables. On the one hand, these encompass
factors that reflect the incentive to shift income and allocate assets offshore. More specifically,
MTR is a firm’s simulated marginal federal corporate income tax rate according to the
methodology put forward by Shevlin (1990) and Graham (1996, 1999). Simulated marginal tax
rates are sophisticated estimates of corporate marginal tax rates, taking into account the most
important dynamic features of the U.S. tax code, i.e. net operating loss carry-forwards and carry-
backs, investment tax credits etc.28
Along the lines of Lindsey and Wilson (2015) who model
firm-level characteristics associated with the location of subsidiaries in domestic versus foreign
tax haven jurisdictions, we expect a significant positive coefficient for MTR. The higher the tax
costs for an additional dollar of U.S. income, the higher should be the incentives to allocate
trademark ownership abroad.
Moreover, valuable trademarks should carry more income shifting potential than less
valuable ones and, thus, we expect valuable trademarks to be located offshore with higher
probability.29
We follow Sandner and Block (2011) and approximate trademark value by the
number of goods and service classes for which it is registered. When filing an application, it is
possible to seek protection for several goods and service classes. Trademarks with few classes
tend to protect single products or narrow product lines whereas trademarks awarded to many
classes rather protect wider product lines or so-called umbrella-brands (Sandner and Block, 2011;
Cabral, 2000; Erdem, 1998). The breadth and market scope of a trademark, as reflected in the
number of goods and services for which it is registered, should correlate positively with its ability
28
According to Graham (1996), simulated marginal tax rates are calculated for each firm and year separately by
assuming that taxable income follows a random walk with drift over 18 years into the future. Then, the present value
of the tax bill is calculated. Subsequently, it is recalculated after adding one dollar to taxable income in the current
period. Results from 50 simulations (based on 50 separate forecasts of taxable income) are averaged to finally
represent the firm-specific marginal tax rate. We obtained simulated marginal tax rates from John Graham's
homepage: https://faculty.fuqua.duke.edu/~jgraham/taxform.html. 29
The role of patent value in international tax planning strategies built around patents is highlighted by Boehm et al.
(2015).
18
to influence consumer behavior and purchasing decisions, and, thus, with its value (Sandner and
Block, 2011; Economides, 1988).
Furthermore, we follow Lindsey and Wilson (2015) and try to capture firm-specific
characteristics that reflect a firm's 'operational wherewithal' to use foreign low-tax jurisdictions
and shift profits abroad. To this aim, we include in vector X of equation (1) the variables
ADVEXP, defined as advertising expense scaled by total assets, and PROFITABILITY, defined as
the ratio of gross profit to total sales, as well as INDUSTRY, i.e. a dummy variable that marks
parent company industries, classified by three-digit SIC codes, that turn out to be particularly
functional for profit shifting according to research by Simone, Mills and Stomberg (2014).30
Moreover, we add a dummy variable DELAWARE which marks companies with corporate
domicile in Delaware. The state of Delaware has historically offered a corporate statute that
tends to be more flexible and favorable to corporate management as compared with other U.S.
states (Clinton and Thomson, 2013). Multinational companies that seek that type of flexibility
might be more apt or willing to engage in a flexible and efficient allocation of valuable
intangibles. In addition, similar to Lindsey and Wilson (2015), SIZE and MTBRATIO are
included to control for general firm characteristics that may influence the decision to locate U.S.
trademark ownership abroad. SIZE is defined as the natural logarithm of total assets and
MTBRATIO is the ratio of a firm’s market value to its book value of equity. Eventually, the
vector X includes the variable INTERNATIONAL, defined as the number of foreign subsidiaries
of a multinational firm divided by the total number of subsidiaries. Companies with a strong
footprint outside of the U.S. may be more likely to hold intangibles offshore. For example, after
the acquisition of a non-U.S. subsidiary, control and management of the associated IP might
30
We classify the following three-digit SIC codes as income mobile industries: 283 (Pharmaceutical), 357, 367, 737
(Computers) and 738 (Services).

19
remain with the subsidiary just for some non-tax reasons. Summary statistics for all independent
variables used in Equation (1) are reported in table 1.
[Table 1]
The unobserved latent variable 𝑂𝐹𝐹𝑆𝐻𝑂𝑅𝐸∗𝑖,𝑛,𝑡 modeled in (1) reflects the net benefit from
offshoring trademark ownership and our observation is
𝑂𝐹𝐹𝑆𝐻𝑂𝑅𝐸𝑖,𝑛,𝑡 = 1 𝑖𝑓 𝑂𝐹𝐹𝑆𝐻𝑂𝑅𝐸∗𝑖,𝑛,𝑡 > 0 (2)
𝑂𝐹𝐹𝑆𝐻𝑂𝑅𝐸𝑖,𝑛,𝑡 = 0 𝑖𝑓 𝑂𝐹𝐹𝑆𝐻𝑂𝑅𝐸∗𝑖,𝑛,𝑡 ≤ 0 (3)
Assuming that the error term ε𝑖,𝑛,𝑡 in equation (1) is logistically distributed, the probability to
observe a U.S. trademark being registered by an offshore entity can be written as
𝑃(𝑂𝐹𝐹𝑆𝐻𝑂𝑅𝐸𝑖,𝑛,𝑡 = 1) = Λ(𝛽0 + 𝛽1𝑀𝑇𝑅𝑖,𝑛,𝑡 + 𝛽2𝑉𝑖,𝑛,𝑡 + 𝛽4𝑋𝑖,𝑛,𝑡) , where Λ(. ) indicates the
logistic cumulative distribution function. We obtain parameter estimates by estimating this model
with maximum likelihood techniques.
In the second part of our empirical analysis, we employ a mixed logit model to analyze
which host country characteristics determine the location of legal trademark ownership
conditional on offshore location. The mixed logit model has been employed in other empirical
analyses investigating determinants of ownership allocation of intangibles (Griffith et al, 2014;
Dudar and Voget, 2016). It represents a variant of the conditional logit model but with a random
coefficient formulation (Greene, 2012; Train, 2003).
To model the determinants of the geographical allocation of trademark ownership, we
specify a mixed logit model that accommodates unobserved heterogeneity in preference

20
parameters with firm i's payoff from locating legal ownership of trademark n in country j given as
𝜋𝑖𝑛𝑗 = Tax′𝑖𝑗𝛽𝑖 + 𝑋′𝑖𝑛𝑗𝛿 + 휀𝑖𝑛𝑗. The vector 𝑇𝑎𝑥𝑖𝑗 includes tax factors STR, USWHT, CFC and
TMBOX. Along the lines of Griffith et al. (2014), we model the coefficients of the variables in
𝑇𝑎𝑥𝑖𝑗 with a random component, i.e. 𝛽𝑖 = 𝛽 + 𝑣𝑖 , with 𝑣𝑖~𝑁(0, Σ𝛽) .31
Firm i assigns
trademark ownership to host country 𝑗∗ if 𝜋𝑖𝑛𝑗∗ > 𝜋𝑖𝑛𝑗 ∀ 𝑗∗ ≠ 𝑗. Considering the probability of
choosing country 𝑗∗ over alternatives j , conditional on realizations of the random part of the
coefficient 𝑣𝑖 , gives a conditional logit model. The unconditional probability is obtained by
integrating out the random term. The model is estimated by using simulated maximum likelihood
(Train, 2003).32
The random coefficients are best interpreted as reflecting unobserved heterogeneity in
preferences. More intuitively, an equivalent formulation of the mixed logit model can be used
without a random-coefficients interpretation, as simply representing error components that create
correlations among the benefits for different locations (Train, 2009). These correlations over
alternatives allow for more realistic substitution patterns than a conditional logit model. In other
words, mixed logit does not exhibit independence from irrelevant alternatives. Referring to these
two, ultimately equivalent, interpretations, the random coefficients reflect heterogeneity in
preferences with respect to tax or, put differently, allow for flexible substitution patterns between
choice alternatives with respect to host country tax factors.
STR is the statutory corporate tax rate of a host country j. In addition, we consider the U.S.
withholding tax (USWHT) levied on royalty payments from the U.S. to the respective host
country. We expect both tax factors to have a negative effect on the probability of trademark
31
This formulation is along the lines of Cameron and Trivedi (2009: 508). 32
We assume that each firm’s choice set consists of all foreign countries where at least one trademark has been
assigned to. This is not particularly restrictive as all firms in our sample are large MNEs represented in nearly all
host countries included in the sample.

21
allocation to the potential host country. Moreover, we define a dummy variable CFC as 1 if the
home country CFC regime, according to the respective minimum effective tax rate criteria,
potentially applies for subsidiaries located in host country j; it is 0 otherwise. Furthermore, the
dummy variable TMBOX indicates if a host country offers special tax treatment of income
generated by trademark usage.
Vector X captures gravity variables such as GDP, GDP per capita (GDPcap), the
geographical distance (DIST) between country-alternative j and the U.S., and COMLANG, a
dummy that marks English speaking countries. Moreover, we include the World Bank's control
of corruption index (CCI) as an indicator for the quality of institutions in country j. We
hypothesize that U.S. trademarks are more likely to be located in large and developed economies
geographically and culturally close to the United States. In other words, we expect the
coefficients of the gravity variables to be positive. CCI captures perceptions of the extent to
which public power is exercised for private gain on a scale from -2.5 (weak governance) and 2.5
(strong governance). In accordance with Dharmapala and Hines (2008), we expect that trademark
ownership is rather located in countries with stronger governance. Summary statistics for all
independent variables are reported in table 2.
[Table 2]

22
4. Empirical Analysis
4.1 Choice between U.S. and Foreign Trademark Assignment
The 478 S&P firms included in this study designate ownership of their U.S. trademarks to
1.9 countries. As this average includes the U.S., this can be interpreted as the average use of 0.9
foreign countries. However, as figure 1 illustrates the proportion of foreign ownership in U.S.
trademark portfolios is highly skewed: 293 of the 478 S&P firms did not locate any of their
trademarks outside the U.S. whereas five companies have assigned their full U.S. trademark
portfolio to non-U.S. affiliates.
[Figure 1]
Accordingly, a first view at the data reveals a strong home bias for trademark registrations at the
USPTO. Home bias in intangible asset investment is already identified in previous research. For
example, Karkinsky and Riedel (2012) find that, on average, European MNEs file 57.1 percent of
their patent applications at the European Patent Office in the name of the parent company. The
home bias in trademark registrations submitted by U.S. MNEs at the USPTO, however, is much
more pronounced. Specifically, 95.7 percent of the 81,766 U.S. trademarks registered by S&P
firms between 2003 and 2012 were owned by a U.S. entity. Thus, the proportion (number) of
trademarks these firms hold outside the U.S. amounts to only 4.3 percent (3,543 trademarks).
Still, these foreign held trademarks spread over a remarkable number of countries. In total, 40
countries turn out to be holding locations for registered U.S. trademarks in S&P 500 firms.33
On
33
U.S. firms located their U.S. trademark ownership in the following countries: Argentina, Australia, Austria,
Barbados, Belgium, Bermuda, Brazil, Canada, Chile, China, Czech Republic, Denmark, Equatorial Guinea, Finland,
France, Germany, Great Britain, Hong Kong, India, Indonesia, Ireland, Israel, Italy, Japan, Luxembourg, Malaysia,
Marshall Islands, Mexico, Netherlands, New Zealand, Norway, Poland, republic of Korea, Singapore, Spain,
Sweden, Switzerland, Turkey, Uruguay and Venezuela.

23
average, a U.S. firm locates 5 percent of its U.S. trademarks offshore. Figure 2 illustrates these
relations.
[Figure 2]
Notably, the tax treatment of intangible assets is not homogenous even within the U.S. but
rather varies considerably across the federal states. In particular, Delaware is acknowledged to be
a domestic U.S. tax haven. Delaware exempts income derived from intangible assets from state-
level taxes. By transferring their intangibles to Delaware, firms can thus achieve permanent tax
savings and lower their effective state tax rates on average by 0.7-1.1 percentage points and thus
their U.S. state income tax burden by 15-24 percent compared to firms that do not base their tax
planning strategy on Delaware’s tax system (Dyreng, Lindsey and Thornock, 2013; Lindsey and
Wilson, 2015). Using our matched data sample, we can consider and compare the level of U.S.
trademark ownership, in terms of trademark registrations at the USPTO, concentrated in the
domestic U.S. tax haven Delaware relative to foreign non-U.S. tax havens (Figure 2). In total
numbers, U.S. firms locate 43,770 trademarks, i.e. 53.5 percent of all successful registrations, in
Delaware while they locate only 587 trademarks in foreign tax haven countries.34
Taking into account the pattern of trademark allocation, we assume a two-step location
choice as the underlying decision process. The first choice is whether to locate trademark
ownership in a third country, while the location choice is only the second step. Therefore, we
start with an analysis of the determinants of assigning a trademark offshore. We use the logistic
regression approach described in Section 3 which considers OFFSHORE as dependent variable.
Table 3 presents the respective results.
34
Note: Our tax haven definition follows Dyreng and Lindsey (2009).

24
[Table 3]
In column (1) we only consider some firm level control variables and the US marginal tax
rate. In column (2) we add our measure for the trademark value and in column (3) we consider
additional variables that capture incentives for international tax planning. The results show that
most of the firm characteristics do not contribute much to explain the offshore decision. Only the
size of foreign activities is associated with a higher probability to hold a trademark offshore.
Interestingly, our results suggest that the US marginal tax rate of the firm does play a
decisive role in the decision whether to locate U.S. trademark ownership abroad. However, the
probability to hold a trademark abroad is significantly higher if the firm has chosen the state of
Delaware as its headquarter location. This finding suggests that a firm that has already considered
an attractive regulatory and tax environment into account might also be aware of international tax
planning opportunities associated with trademark offshoring.
Finally, our results show that a higher trademark value increases the probability of holding
a trademark abroad. This finding might also hint at tax planning considerations because more
valuable trademarks are associated with more profit shifting opportunities. We therefore expect
tax considerations to play a more decisive role if the decision to assign trademark ownership to a
foreign affiliate is taken.
4.2 Foreign Trademark Assignments of U.S. Firms
The S&P firms do not solely locate the ownership for their U.S. trademarks inside the U.S.,
they also assign 3,543 trademarks to non-U.S. affiliates. 587 of these are located in nine tax
haven countries (Barbados, Bermuda, Hong Kong, Ireland, Luxembourg, Marshall Islands,

25
Singapore, Switzerland and Uruguay), i.e. 16.57 percent of the offshore trademarks are located in
foreign tax haven countries.
[Table 4]
Table 4 shows the top ten countries in terms of the total number of U.S. trademarks owned
by subsidiaries located in these countries (left) and the average number of U.S. trademarks owned
by subsidiaries located in a country per firm (right). Interestingly, considering the total number of
trademarks U.S. companies locate most trademarks in countries with rather high tax rates like
Japan, Great Britain and Germany.
If no double tax treaty is in place, the U.S. withholds a 30 percent tax on royalty payments
paid to a foreign entity. Interestingly, the U.S. signed double tax treaties with most of the
countries in Table 4 that reduce the withholding tax on royalty payments to zero percent. For this
reason, especially Ireland and Switzerland are interesting options for the location of trademark
ownership as they have agreed with the U.S. on a withholding tax of zero percent on royalty
payments.
Considering the average number of U.S. trademarks owned by subsidiaries located in a
country per firm, Table 4 shows that tax havens become more important. Two tax havens rank
among the top five trademark locations of U.S. MNEs, whereas no tax haven figured among the
top five for the total number of registrations. One of these tax haven countries (Ireland) combines
tax haven status with a withholding tax of zero percent on royalties received from the U.S. In
sum, the explorative analysis indicates that tax havens are not excessively sought in the
geographical allocation of trademark ownership. However, those firms which actually allocate
their U.S. trademarks to tax havens tend to do so in a more extensive way.

26
Previous literature on tax aggressiveness has investigated the determinants of tax avoidance
using financial accounting data (for an overview Hanlon and Heitzman, 2010). In particular, tax
haven operations and high intangible assets ownership is associated with additional tax avoidance
(Markle and Shackelford, 2012a and 2012b; Harris, 1993; Grubert, 2003). Therefore, we expect a
different pattern of trademark ownership, more extensive tax haven use in particular, for firms
high intangible asset ownership or intense tax haven activities.35
[Figure 3]
Figure 3 however depicts only a meaningful difference for firms with extensive use of tax
haven subsidiaries. They locate 34.58 percent of their third-country trademarks in tax havens
while all S&P 500 firms do only locate 16.57 percent there. Firms with a high share of intangible
assets locate only slightly more trademarks in tax havens (20.37 percent). We find similar results
for the relation of the average number of registrations per third country to the average number of
registrations per tax haven used. Only firms with intense tax haven operations locate on average a
considerably higher amount of trademarks (11.75) in each tax haven country.
Effective tax rates (ETRs) are well-accepted proxies for the overall tax avoidance of a firm,
as a lower ETR suggests that a firm is more effectively avoiding income taxes compared to firms
with higher ETRs (Dyreng and Lindsey, 2009). Interestingly, firms with low ETRs do not locate
more trademarks in a tax haven country, they even locate slightly less trademarks at tax havens
(15.12 percent).
In sum, the descriptive results of table 4 and figure 3 show that trademark ownership is not
primarily located in tax haven countries but rather in other countries.
35
Variables are defined in Appendix 1.

27
[Table 5]
In order to analyze whether host country tax incentives determine foreign trademark
assignment of US firms, we use the mixed logit approach described in Section 3. Table 5 presents
the basic results for the mixed logit regression. The results suggest that a higher corporate tax rate
(STR) leads to a lower probability that a trademark is located in the respective host country. The
same effect can be observed for USWHT in specification (2). A higher withholding tax levied by
the U.S. on royalty payments to a host country leads to a lower probability that a trademark is
located there. For both, STR and USWHT, our results are highly statistically significant across all
specifications. Moreover, results in table 5 confirm that firms respond heterogeneously to taxes.
The highly significant standard deviations for our random coefficients indicate that parameters do
indeed vary among the firms. Interestingly, the US CFC rule as well as preferential tax regimes
for income generated by trademarks (so called trademark boxes) to do not significantly affect the
location choice of trademarks.
Concerning our fixed variables, we find coefficients that are in line with our expectations.
We find a statistically significant positive relationship for GDP per Capita and CPI as well as a
negative for geographical distance.
[Table 6]
As the results presented in table 5 cannot be interpreted quantitatively, we predict base
probabilities for our results of column (1). The base probabilities of the most preferred countries
are presented in table 6. The predicted base probabilities for one country to be chosen as location
for U.S. trademarks vary from above ten percent to below one percent. In table 4, we identified
Japan as the most popular foreign trademark location concerning the total as well as the average
28
number of registrations per firm. Our predicted probabilities confirm this observation as Japan is
among the most popular countries with a base probability of 0.1122. Only Canada (0.1225) has a
higher base probability. In line with our observations in the descriptive part, we find that tax
havens are amongst the most popular countries but do not dominate extensively. Other high-tax
third countries like Canada, Japan and Germany are chosen with much higher probabilities.
Moreover, our approach allows us to identify which tax havens are preferred by U.S. firms. We
find that they rather use Ireland (0.0898), Bermuda (0.0676) and Switzerland (0.0481) than
Barbados (0.00005), Marshall Islands (0.00009) and Luxembourg (0.0007) for the location of
their U.S. trademarks.
The benefit of our mixed logit model is that it does not only allow us to simulate the
probability firms locate their trademark in a certain country, but also enables us to find out how a
change in a host country STR affects this probability as well as the probabilities of other host
countries. In the following, we simulate how a one percentage point decrease in STR of certain
countries would affect the probability a trademark is located in the countries we identified as the
most popular countries in table 6. Table 7 presents the result as relative change compared to the
base probability in the original scenario.
[Table 7]
Interestingly, we find that trademark assignment to Hong Kong, Ireland, Bermuda and
Switzerland which are all defined as tax havens react most pronounced to a tax rate cut. Ireland
as the most popular tax haven considering base probabilities is chosen with 21.8 percent higher
probability compares to the probability of 0.09 before a tax rate cut. In other words, Ireland is
chosen with a base probability of 0.1096 after a tax rate cut. Translated into trademarks this

29
means an increase of 67.68 trademarks.
Trademarks can either refer to single goods or wider product lines (Cabral, 2000).
Interestingly, the USPTO dataset provides information for how many of potentially 52 classes of
goods and services a trademark is registered. Following Sander and Block (2011), we assume that
the value of a trademark positively correlates with the number of classes it covers. This
assumption seems plausible because a successful registration requires the owner of the
application to prove the actual use of the trademark for each individual class of goods or services
it is supposed to cover.
Firms in our dataset protect their trademarks for between one and eight classes. We classify
trademarks covering one or two classes as having low value whereas trademarks covering seven
or eight classes are considered to be of high value. We find that the S&P 500 firms included in
this study designate ownership of 4.35 percent of their less valuable U.S. trademarks covering
one or two classes of goods or services to entities outside the U.S. while they locate 6.72 percent
of their more valuable trademarks there. This indicates that firms locate their trademarks covering
more classes rather in foreign countries.
Therefore, we re-run our regression for two sub-groups: The first group contains
trademarks covering one or two classes of goods and services (low value). The second sub-group
pitches on trademarks covering seven or eight classes (high value).
[Table 8]
Table 8 presents the results for these sub-group regressions. We can confirm our main
results, which show that tax rates have a negative impact on the probability that a third country is
chosen as trademark location. However, we cannot confirm that tax havens play a more important

30
role for trademarks of high value than for those being of low value. Concerning base probabilities
predicted after specifications (1) and (2) of table 8, Canada, Japan and Germany stay among the
four most popular countries for both, low value and high value, trademarks.
4.3 Comparison to Foreign Trademark Assignments of European Firms
In additional analysis, we compare the location of U.S. trademark ownership of U.S. firms
to European firms. Our data covers 235 STOXX Europe 600 firms. These firms registered 14,984
new U.S. trademarks during the same time period. Similar to U.S. firms, we find a strong home
as well as an U.S. bias for European firms. 51.22 percent of the 14,984 U.S. trademarks newly
registered by European firms between 2003 and 2012 are held in the sixteen respective home
countries36
while 38.68 percent are located in the United States. The proportion of U.S.
trademarks these firms hold neither in their respective parent countries nor in the U.S. is 10.1
percent.37
Nonetheless, U.S. trademark ownership within these STOXX 600 firms spreads over
37 different third countries of which 24 are home country for neither of these firms. On average,
each firm designates U.S. trademark ownership to 2.6 different countries. However, the
proportion of third country ownership in U.S. trademark portfolios is again skewed: 109 of the
235 STOXX 600 companies locate their full U.S. trademark portfolio either in the U.S. or their
home country but never in a third country. Only six firms locate all of their U.S. trademarks
neither in the U.S. nor their home country but in some third country.38
Considering tax haven usage by the STOXX 600 MNEs, the data show that 3,264 (i.e. 56.3
percent) of those U.S. trademarks which were filed from within the U.S. are held in Delaware, the
36
Home country means the country where the global ultimate owner is domiciled according to Amadeus. 37
Appendix 5 illustrates this for European firms (similar to Figure 2 for U.S. firms). 38
Third country is every country that is neither the U.S. nor the home country of a firm. In the following, we do only
consider third countries that are used at least once as location of trademark ownership during 2003 and 2012 by the
respective sub-group.

31
U.S. tax haven. This contrasts with 404 U.S. trademarks designated to third country tax havens.
Still, those 404 trademarks represent 26.70 percent of all third-country trademarks filed in foreign
non-U.S. tax havens which is a disproportionally high share given that only seven of the 37 third
countries recorded used the European MNEs are tax havens (Bermuda, Hong Kong, Ireland,
Luxembourg, Singapore, Switzerland and Uruguay).
In the following, we include only trademarks located in third countries in our analysis.
Considering ETR as measure of the overall tax avoidance of European MNEs, low ETR firms
locate 44.55 percent of their third country trademark ownership in tax havens while all firms
locate only 26.70 percent there. This indicates that low ETR firms tend to geographically allocate
their trademarks more tax efficiently than other sub-groups.
[Table 9]
Table 9 shows the top ten third countries in terms of the total number of U.S. trademarks
located in these countries (left) and the average number of U.S. trademarks located in a third
country per European firm (right). In contrast to U.S. firms, for European firms not only high-tax
countries rank among the top three countries, but also the tax haven Switzerland. Once again tax
haven countries gain of importance if we consider the average number of U.S. trademarks owned
by subsidiaries located in a third country per firm. European firms locate most trademarks in
Ireland and Switzerland, which combine tax haven status with a withholding tax of zero percent
on royalties received from the U.S. Interestingly, Ireland seems to be an interesting tax efficient
location for both, U.S. and European firms. Similar to the analysis for U.S. firms, our explorative
analysis for European firms indicates that overall tax havens are not excessively sought in the

32
geographical allocation of U.S. trademark ownership. However, those firms which actually
allocate their U.S. trademarks to tax havens tend to do so in an extensive way.
[Table 10]
Table 10 presents mixed logit regression results for the European firms. Similar to the
results for U.S. firms in Table 5, we can confirm that European firms respond heterogeneously on
taxes. Once again, we find coefficients that are in line with our expectations. For both, STR and
USWHT, our results are highly statistically significant. Our result for CFC is also in line with our
expectations. If a CFC rule is potentially applicable on the royalties deriving from the respective
trademark, this country is chosen with a lower probability.39
Thus, our results suggest a
somewhat different effect of CFC rules of European countries and the US. While European CFC
rules affect trademark location choices, the US Subpart F rule does not. This finding might be
explained by well-known strategies to circumvent application of Subpart F like “check-the-box”.
With regard to trademark boxes we find a negative effect. The sign of the effects might be also
attributed to the effectiveness of European CFC rules because the low tax rates applicable under a
trademark box regime are subject to the CFC rules of the home countries.
Concerning our fixed variables, we find a statistically significant positive relationship for
GDP per Capita and CPI as well as a negative for geographical distance.
[Table 11]
We again predict base probabilities for some countries. Table 11 presents the predicted base
probabilities for those countries being the most popular countries concerning base probabilities.
39
Our CFC Dummy does not consider the Cadbury-Schweppes decision of the European Court of Justice. To make
sure that our results are not influenced by this, we repeated the regression considering that CFC rules are not
applicable within the European Union after the decision. The results are similar to those reported in this paper.

33
Interestingly, European firms choose tax havens with a lower base probability than U.S. firms.
The top four countries chosen with the highest probability by European firms are the same
countries as for U.S. firms. In particular, these countries are Canada, Germany, Great Britain and
Japan which are all rather high-tax countries. Though, sorted by base probability the order differs.
Once again, we do not identify tax haven countries among the most popular countries. If
European firms decide to locate their trademark in a tax haven, they choose Ireland (0.0519) and
Switzerland (0.0510) with the highest probability. Rather unpopular tax haven countries are
Uruguay (0.0004) and Luxembourg (0.0023).
Once again, we test whether trademarks covering 7 or more classes are rather located in
low tax jurisdictions by repeating our regression for this sub-group and predicting base
probabilities afterwards.40
Similar to the results for U.S. firms, we cannot confirm that low tax
countries are more preferred than high tax countries for the location of valuable trademarks.
However, in contrast to the results for U.S. firms, European firms chose Ireland and Switzerland
with a slightly higher base probability (0.0600 and 0.0565) for trademarks covering more classes.
As these differences are below 0.01, they cannot be considered of economic relevance.
For European firms, we do also simulate the reaction to a one percentage point decrease in
STR for those countries identified as most popular in table 11. Table 12 presents the cross semi-
elasticities.
[Table 12]
Interestingly, once again the tax haven countries identified as popular in table 11 are those
benefiting the most from their own tax rate decrease. Ireland’s base probability increases about
40
Results are reported in Appendix 4.

34
14.78 percent and Switzerland’s about 11.12 percent. Transferred into a number of trademarks
this indicates an increase of trademark assignments of 11.6 trademarks for Ireland and 8.73
trademarks for Switzerland. Compared to the reaction of U.S. firms to a one percentage point
decrease in Ireland’s STR, European firms react less sensitive.
Overall, our results indicate that U.S. and European firms choose to locate the ownership of
their trademarks used in the U.S. market rather in the U.S. or their home country. If they decide
to locate the ownership in a third country, the most popular countries are most likely not
particular tax attractive. However, we are able to identify that tax considerations play a
significant role in the selection of trademark host countries for trademarks used in the U.S.
market. For both, U.S. and European firms, the tax havens Ireland and Switzerland are amongst
the most popular trademark ownership locations whereas Bermuda and Hong Kong are more
preferred by U.S. firms. However, U.S. firms react slightly more sensitive to a tax rate decrease
than European firms. Nevertheless, this sensitivity results in about 50 trademark assignments less
for certain tax havens. Considering that Krasnikov, Mishra and Orozco (2009) estimate on
average $ 7.8 million of future cash flows for each additional registration of a brand-association
trademark, this difference can be seen as a notable profit shifting potential for the respective
firms.
5. Conclusion
It is well-known that firms profit from tax planning strategies enabling them to shift profits
to low-tax countries. Even though prior literature confirms the importance of intellectual property
for these strategies, little is known about the actual location of intellectual property. We therefore
analyze the role that tax considerations play in the allocation of trademark ownership to foreign
subsidiaries. This paper uses a new and unique dataset that links the location of trademarks

35
registered by MNEs for the U.S. market with group structures of large MNEs from the U.S. (S&P
500) and Europe (STOXX Europe 600). We analyze whether tax incentives play a decisive role
in the legal assignment of U.S. trademarks to entities outside the U.S.
Interestingly, we identify for both, U.S. and European MNEs, a strong home-bias.
However, our findings indicate also the importance of tax considerations if a firm decides to
assign trademark ownership to an affiliate located in a foreign country. We find a statistically
significant negative relationship between host country tax rates as well as U.S. withholding taxes
and trademark location choice.
Admittedly, interpreting our results from an economical perspective indicates that profit
shifting with the use of trademarks is limited. Our results suggest that U.S. firms react to a
corporate tax rate decrease of one percentage point in Ireland with an increase in trademark
assignment of about 70 trademarks. The numbers suggest a limited effect of tax considerations
within the process of trademark location considering that U.S. firms registered 81,766 new
trademarks in our research period. The same is true for European firms though European firms
react even less sensitive to tax rate decreases.
One explanation for our results might be the nature of trademarks. In contrast to patents,
most investments in trademarks are undertaken after the geographical assignment. Tax sensitive
firms usually try to locate their income to low tax countries while they prefer to generate their
expenses at high tax countries. As transfer pricing rules require that investments undertaken for
the establishment of a trademark by a trademark’s user have to be considered in the analysis of
functions, the potential to locate expenses at high tax countries and income at low tax countries
for trademarks is limited.

36
Our results contribute to the ongoing debate on BEPS and the current discussion about the
use of intellectual property for aggressive tax planning strategies resulting in low ETRs. Besides
showing where U.S. and European firms actually locate the ownership some kind of intellectual
property (trademarks), we are able to identify that firms integrate tax considerations to a limited
degree in their decision process. However, most firms locate their trademarks rather in other
countries.

37
APPENDIX
Appendix 1: Variable Definitions
ADVERT EXPENSE advertising expense (xad) scaled by total assets (at)
CFC
Dummy variable with the value one if CFC if the home country
of firm n has a CFC rule in place that is applicable for
subsidiaries located in choice country j in year t and zero
otherwise.
COMLANG Dummy variable with the value of one if English is an official
language in the host country (Source: World Bank)
CPI Control of Corruption Index (Source: World Bank, Worldwide
Governance Indicators)
DIST Distance between U.S. and country i (Source: CEPII
GEODIST)
FOREIGN ACTIVITIES Share of foreign subsidiaries in total number of subsidiaries
GDP Natural logarithm of gross domestic product (Source: World
Bank)
GDPPERCAP Natural logarithm of gross domestic product per capita (Source:
World Bank)
HQ DELAWARE Dummy variable with the value of one if the headquarter of the
firm is located in Delaware
INCOME MOBILE
Dummy variable with the value of one if the parent company
belongs to the following three-digit SIC codes: 283
(Pharmaceutical), 357, 367, 737 (Computers) and 738
(Services).
MARKE TO BOOK ratio of a firm’s market value (prcc_f) to its book value (bkvlps)
US MTR firm’s simulated marginal US federal corporate income tax rate
based on Graham (1996)
OFFSHORE Dummy variable with the value of one if trademark ownership
is assigned to an affiliate located offshore.
PROFITABILITY ratio of gross profit (gp) to total sales (sale)

38
SIZE natural logarithm of total assets (at)
TMBOX Dummy variable indicating host countries that offer a special
tax rate for income from trademark usage (trademark box)
TRADEMARK VALUE Number of classes a trademark is registered for (Source:
USPTO)
STR Statutory corporate tax rate of the host country
USWHT Withholding tax rate levied on royalty payments of U.S. entities
to foreign countries
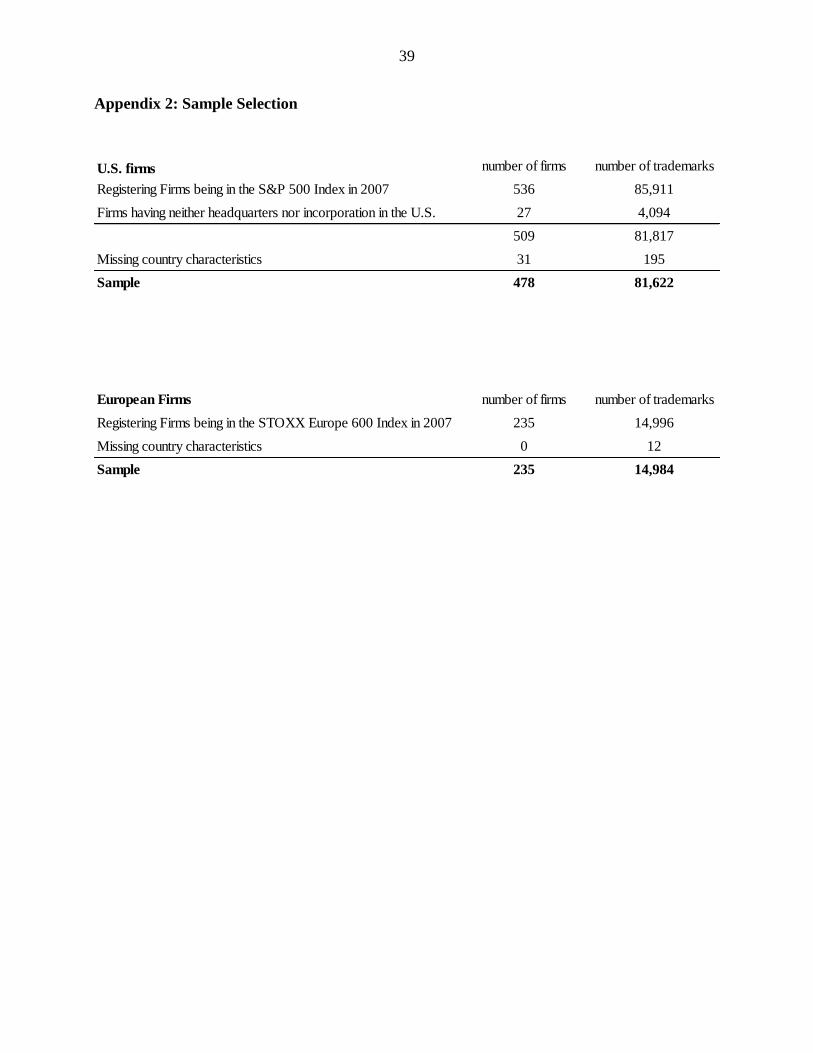
39
Appendix 2: Sample Selection
U.S. firms number of firms number of trademarks
Registering Firms being in the S&P 500 Index in 2007 536 85,911
Firms having neither headquarters nor incorporation in the U.S. 27 4,094
509 81,817
Missing country characteristics 31 195
Sample 478 81,622
European Firms number of firms number of trademarks
Registering Firms being in the STOXX Europe 600 Index in 2007 235 14,996
Missing country characteristics 0 12
Sample 235 14,984

40
Appendix 3: Home Countries of European Firms
Home Country Number of Firms
Austria 2
Belgium 2
Denmark 6
Finland 13
France 38
Germany 29
Great Britain 88
Ireland 5
Italy 3
Luxembourg 2
Netherlands 13
Norway 4
Portugal 1
Spain 12
Sweden 16
Switzerland 1
Total 235
Notes: Appendix 3 presents the Home Country for
the STOXX 600 Europe firms.

41
Appendix 4: European Firms – Low and High Value Trademarks
1 2
low value high value
Random Variables
STR -12.420*** 16.600*** -8.743* 11.850***
(3.471) (2.173) (4.899) (2.334)
CFC -9.311*** 4.461*** -2.826* -2.249***
(0.698) (0.407) (1.462) (0.704)
Fixed Variables
GDP 1.507*** 1.309***
(0.203) (0.382)
GDPPERCAP -0.094 0.055
(0.425) (0.313)
CPI 1.698*** 1.368***
(0.442) (0.336)
DIST -0.174 -0.339**
(0.183) (0.168)
N 14,430
9,842
Notes: Appendix 4 presents the mixed logit estimates for sub-groups of the European firm sample. Both, specification (1)
and specification (2) consider only trademarks allocated to third country subsidiaries. Specification (1) considers only
covering 1 or 2 classes of goods and services (low value). Specification (2) considers only trademarks covering 7 or 8
classes of goods and services (high value). Numbers in parentheses are robust standard errors. Variables are defined in
Appendix 1. *, ** and *** show significance at the level of 10%, 5% and 1%, respectively.

42
Appendix 5: European Firms – Distribution of Trademark Ownership
Notes: Appendix 5 shows the distribution of trademark ownership to entities located in the U.S., the home country or a third
country where third country is every country that is not the U.S. nor the home country for all trademarks registered by STOXX
600 Europe firms. For trademark ownership allocated to U.S. entities, the column “trademarks owned by U.S. companies” shows
the distribution of trademark ownership to entities located in Delaware or other U.S. states. For trademark ownership allocated to
third countries, the column “trademarks owned by third country subsidiaries” shows the distribution of trademark ownership to
tax haven and non-tax haven countries. The definition for tax havens follows Dyreng and Lindsey (2009).
0%
10%
20%
30%
40%
50%
60%
70%
80%
90%
100%
all trademarks trademarks owned by U.S.
companies
trademarks owned by third
country subsidiaries
owned by entity located in third country
owned by entitiy located home country
owned by entitiy located in the U.S.
owned by entity located in other U.S. state
owned by entitiy located in Delaware
owned by entity located in tax haven country
owned by entity located in non-tax haven third country

43
REFERENCES
Abramovsky, L., Griffith, R., Macartney, G., Miller, H. (2008). The location of Innovative
Activity in Europe, IFS working papers, No. 08,10.
Bankman, J. (2007). State Tax Shelters and the State Taxation of Capital, Virginia Tax Review,
16, 769-788.
Bebchuk, L., Cohen, A., Ferrell, A. (2002). Does the Evidence Favor State Competition in
Corporate Law?, California Law Review, 90, 1775-1821.
Blouin, J., Robinson, L., Seidman, J. (2015). Conflicting Transfer Pricing Incentives and the Role
of Coordination, Tuck School of Business Working Paper No. 2010-74.
Boehm, T., Karkinsky, R., Knoll, B., Riedel, N. (2015). Corporate Taxes and Strategic Patent
Location within Multinational Firms, Working Paper.
Cabral, L.M.B. (2000). Stretching Firm and Brand Reputation, RAND Journal of Economics, 31,
658 - 673.
Calboli, I. (2005). Trademark Assignment “With Goodwill”: A Concept Whose Time Has Gone,
Florida Law Review, 57, 771-842.
Calboli, I. (2007). The Sunset of “Quality Control” in Modern Trademark Licensing, American
University Law Review, 57, 341-407.
Chamberlain, G. (1980). Analysis of Covariance with Qualitative Data, Review of Economic
Studies, 47, 225-238.
Chernozhukov, V., Fernández-Val, I., Hahn, J., and W. Newey (2008). Identification and
Estimation of Marginal Effects in Nonlinear Panel Models, Working Paper.
Chestek, P.S. (2001). Control of Trademarks by the Intellectual Property Holding Company,
IDEA – Journal of Law and Technology, 41, 1-48.
Clinton, S.W., Thomson, R.P. (2013). How Did Delaware Get So Popular?, California Business
Law Practitioner - Winter 2013, copyright 2013 by the Regents of the University of California.
Cohen, L. (2008). Trademarks - Banking a Bankable Instrument, Trademark World Review #204,
February 2008.
De Simone, L., Mills, L., Stomberg, B. (2014). What does Income Mobility Reveal about the Tax
Risk-Reward Tradeoff?, Rock Center for Corporate Governance at Stanford University
Working Paper No. 192.
Devereux, M. P. (2007). The Impact of Taxation on the Location of Capital, Firms and Profit: A
Survey of Empirical Evidence. OUCBT Working Paper No. 0702, Oxford.
Dharmapala, D., Hines, J. R. (2009). Which Countries Become Tax Havens?, Journal of Public
Economics, 93, 1058 - 1068.
Dischinger, M., Riedel, N. (2011). Corporate taxes and the location of intangible assets within
multinational firms, Journal of Public Economics, 95, 691 - 707.
Dudar, O., Voget, J. (2016). Corporate Taxation and Location of Intangible Assets: Patents vs.
Trademarks, ZEW Discussion Paper No. 16-015.

44
Dyreng, S. D., Lindsey, B. P. (2009). Using Financial Accounting Data to Examine the Effect of
Foreign Operations Located in Tax Havens and Other Countries on U.S. Multinational Firms’
Tax Rate, Journal of Accounting Research, 47, 1283 - 1316.
Dyreng, S.D., Hanlon, M., Maydew, E. L. (2008). Long-Run Corporate Tax Avoidance, The
Accounting Review, 83, 61 - 82.
Dyreng, S.D., Lindsey, B.P., Thornock, J.R. (2013). Exploring the role Delaware plays as a
domestic tax haven, Journal of Financial Economics, 108, 751-772.
Economides, N. (1988). The Economics of Trademarks. Trademark Reporter, 78, 523-539.
Erdem, T. (1998). An Empirical Analysis of Umbrella Branding. Journal of Marketing Research,
35(3), 339-351.
Fuest, C., Spengel, C., Finke, K., Heckemeyer, J.H., Nusser, H. (2013). Profit Shifting and
“Aggressive” Tax Planning by Multinational Firms: Issues and Options for Reform, World
Tax Journal, 5, 307-324
Graham, J.R. (1996). Proxies for the Corporate Marginal Tax Rate, Journal of Financial
Economics, 42, 187-221.
Graham, J.R. (1999). Do Personal Taxes Affect Corporate Financing Decisions?, Journal of
Public Economics, 73, 147-185.
Graham, J.R., Hancock, G., Marco, A.C., Myers, A.F. (2013). The USPTO Trademark Case File
Dataset: Descriptions, Lessons, and Insights. Available at:
http://papers.ssrn.com/sol3/papers.cfm?abstract_id=2188621.
Greene, W. H. (2003). Econometric Analysis, 7th
ed., Pearson.
Griffith, R., Miller, H., O’Connell, M. (2014). Ownership of Intellectual Property and Corporate
Taxation, Journal of Public Economics, 112, 12 - 23.
Grubert, H. (2003). Intangible Income, Intercompany Transactions, Income Shifting, and the
Choice of Location, National Tax Journal, 56, 221 - 242.
Grubert, H., Mutti, J. (1991). Taxes, Tariffs and Transfer Pricing in Multinational Corporate
Decision Making, The Review of Economics and Statistics, 73, 285 - 293.
Grubert, H., Slemrod, J. (1998). The Effect of Taxes on Investment and Income Shifting to
Puerto Rico, Review of Economics and Statistics, 80, 365 - 373.
Hanlon, M., Heitzman, S. (2010). A Review of Tax Research, Journal of Accounting and
Economics, 50, 127 - 178.
Harris, D. G. (1993). The Impact of U.S. Tax Law Revision on Multinational Corporations'
Capital Location and Income Shifting Decisions, Journal of Accounting Research
(Supplement), 31, 111 - 140.
Heavner, B.B., Luepke, M.H.H. (2008). Avoiding Trademark Pitfalls in the “Land of the
Unlimited Possibilities”: The Top 15 Mistakes of Foreign Applicants in the U.S. Trademark
Office, The Trademark Reporter, 98, 974-997.
Heckemeyer, J.H., Overesch, M. (2014). Multinationals’ Profit Response to Tax Differentials:
Effect Size and Shifting Channels, Working Paper.

45
Hines, J. R., Rice, E. R. (1994). Fiscal Paradise: Foreign Tax Havens and American Business,
The Quarterly Journal of Economics, 109, 149 - 182.
Horstmann, I. J., Markusen, J.R. (1992). Endogenous Market Structures in International Trade
(natura facit saltum). Journal of International Economics, 32, 109-129.
Huizinga, H., Laeven, L. (2008). International Profit-Shifting within Multinationals: A Multi-
Country Perspective, Journal of Public Economics, 92, 1164 - 1182.
Karkinsky, T., Riedel, N. (2012). Corporate Taxation and the choice of patent location within
multinational firms, Journal of International Economics, 88, 176 - 185.
Klassen, K. J., LaPlante, S. K. (2012a). Are U.S. Multinational Corporations Becoming More
Aggressive Income Shifters?, Journal of Accounting Research, 50, 1245 - 1285.
Klassen, K. J., LaPlante, S. K. (2012b). The Effect of Foreign Reinvestment and Financial
Reporting Incentives on Cross-Jurisdictional Income Shifting, Contemporary Accounting
Research, 29, 928 - 955.
Krasnikov, A., Mishra, S., Orozco, D. (2009). Evaluating the Financial Impact of Branding Using
Trademarks: A Framework and Empirical Evidence, Journal of Marketing, 73, 154 - 166.
Lindsey, B. P., Wilson, W. M. (2015). Foreign or Domestic Tax Havens: The Location Decision
for Intangible Property by U.S. Firms, Working Paper.
Markle, K. (2015). A Comparison if the Tax-Motivated Income Shifting of Multinationals in
Territorial and Worldwide Countries, Contemporary Accounting Research, 33, 7-43.
Markle, K. S., Shackelford, D. A. (2012a). Cross-Country Comparisons of Corporate Income
Taxes, National Tax Journal, 65, 493 - 528.
Markle, K. S., Shackelford, D. A. (2012b). Cross-Country Comparisons of the Effects of
Leverage, Intangible Assets, and Tax Havens on Corporate Income Taxes, Tax Law Review,
65, 415 - 432.
Markle, K., Robinson, L. (2012). Tax Haven Use Across International Tax Regimes, Working
Paper.
Markusen, J.R. (1995). The Boundaries of Multinational Enterprises and the Theory of
International Trade, Journal of Economic Perspectives, 9, 169-189.
McIntyre, R.S., Phillips, R., Baxandall, P. (2015). Offshore Shell games 2015 – The Use of
Offshore Tax Havens by Fortune 500 Companies. Available at:
http://ctj.org/pdf/offshoreshell2015.pdf.
OECD (2015). OECD/G20 Base Erosion and Profit Shifting Project – Aligning Transfer Pricing
Outcomes with Value Creation, Actions 8-10 – 2015 Final Reports. Available at:
http://www.oecd-
library.org/docserver/download/2315351e.pdf?expires=1447085483&id=id&accname=guest&
checksum=6747250CB36AF9337E02F4CA7665D636.
Roe, M. (2003). Delaware’s Competition, Harvard Law Review, 117, 588-646.
Sander, P.G., Block, J. (2011). The Market Value of R&D, Patents, and Trademarks, Research
Policy, 40, 969 - 985.

46
Shevlin, T. (1990). Estimating Corporate Marginal Tax Rates with Asymmetric Tax Treatment of
Gains and Losses. Journal of the American Taxation Association, 12, 51-67.
Train, K. (2003). Discrete Choice Methods with Simulation, Cambridge University Press.
Train, K. (2009). Discrete Choice Methods with Simulation, 2nd ed., Cambridge University
Press.
World Intellectual Property Organization (2012). The Madrid Agreement Concerning the
International Registration of Marks and the Protocol Relating to that Agreement: Objectives,
Main Features, Advantages. WIPO Publication No. 418(E).

47
Figure 1. Trademark Holding by U.S. Firms
Notes: Figure 1 shows the distribution of firms assigning their U.S. trademark portfolio either only to U.S. entities, only to non-
U.S. affiliates or to both.
Firms assigning full U.S. trademark portfolio to U.S. entities
Firms assigning full U.S. trademark portfolio to to non-U.S. affiliates
Firms assigning U.S. trademark portfolio to to U.S. and non-U.S. entities

48
Figure 2. U.S. Firms – Distribution of Trademark Ownership
Notes: Figure 2 shows the distribution of trademark ownership to entities located in the U.S. or a foreign country all trademarks.
For trademark ownership allocated to U.S. entities, the column “trademarks owned by U.S. entities” shows the distribution of
trademark ownership to entities located in Delaware or other U.S. states. For trademark ownership allocated to foreign countries,
the column “trademarks owned by foreign subsidiaries” shows the distribution of trademark ownership to tax haven and non-tax
haven countries. The definition for tax havens follows Dyreng and Lindsey (2009).
0%
10%
20%
30%
40%
50%
60%
70%
80%
90%
100%
all trademarks trademarks owned by U.S.
entities
trademarks owned by
foreign subsidiaries
owned by entity located in foreign country
owned by entitiy located in the U.S.
owned by entity located in other U.S. state
owned by entitiy located in Delaware
owned by entity located in tax haven foreign country
owned by entity located in non-tax haven country

49
Figure 3. U.S. Firms – Trademarks owned by entities located offshore
Notes: Figure 3 shows the distribution of trademark ownership located in foreign countries distinguished between tax haven
countries and other foreign countries for the S&P 500 firms. The definition for tax havens follows Dyreng and Lindsey (2009).
The first bar includes all S&P500 firms of our sample, the second bar includes only firms in the upper quartile of the share of
intangible assets to total assets; the third bar includes only firms in the quartile with the lowest ETR; and the fourth bar includes
only firms in the upper quartile of number of affiliates located in a tax haven scaled by total number of affiliates.
0%
10%
20%
30%
40%
50%
60%
70%
80%
90%
100%
all High Intangible Intense Haven Low ETR
registrations by entity located in tax haven
registrations by entity located in other foreign country

50
Table 1. Summary Statistics – Offshore Decision
Variable Obs Mean Median Std. Dev. 25% 75%
MTR 54,970 0.2142 0.3499 0.1570 0.0238 0.3500
TRADEMARK VALUE 54,970 4.1577 4.0000 1.8166 3.0000 5.0000
PROFITABILITY 54,970 0.4367 0.4334 0.2136 0.2637 0.5873
ADVERT EXPENSE 54,970 0.0286 0.0050 0.0517 0.0000 0.0388
INCOME MOBILE 54,970 0.1812 0.0000 0.3852 0.0000 0.0000
HQ DELAWARE 54,970 0.6183 1.0000 0.4858 0.0000 1.0000
SIZE 54,970 9.8872 9.6725 1.5140 8.6478 10.8961
FOREIGN ACTIVITIES 54,970 0.4799 0.5667 0.2726 0.2800 0.7202
MARKET TO BOOK 54,970 3.7911 2.8569 18.8289 1.7645 4.1466
Notes: Table 1 shows descriptive statistics for all variables included in Equation (1). Variables are defined in Appendix 1.
Table 2. Summary Statistics – Foreign Location Decision
Variable Obs Mean Median Std. Dev. 25% 75%
U.S. Firms
STR 3,543 0.2972 0.3000 0.1008 0.2600 0.3660
USWHT 3,543 0.0405 0.0000 0.0846 0.0000 0.0500
CFC 3,543 0.5848 1.0000 0.4928 0.0000 1.0000
TMBOX 3,543 0.0162 0.0000 0.1262 0.0000 0.0000
GDP 3,543 27.7101 28.2069 1.6020 27.0884 28.7291
GDPPERCAP 3,543 10.6045 10.6262 0.6171 10.4684 10.8266
CPI 3,543 1.6154 1.7369 0.6023 1.3437 2.0232
DIST 3,543 8.5404 8.7054 0.8709 8.6252 8.9960
COMLANG 3,543 0.3878 0.0000 0.4873 0.0000 1.0000
European Firms
STR 1,513 0.2733 0.2800 0.0738 0.2225 0.3300
USWHT 1,513 0.0230 0.0000 0.0704 0.0000 0.0000
CFC 1,513 0.0476 0.0000 0.2130 0.0000 0.0000
TMBOX 1,513 0.0628 0.0000 0.0243 0.0000 0.0000
CFC 1,513 0.0476 0.0000 0.2130 0.0000 0.0000
GDP 1,513 27.5864 27.5599 1.0901 27.0139 28.5482
GDPPERCAP 1,513 10.7143 10.7408 0.6416 10.6027 10.9443
CPI 1,513 1.7513 1.8595 0.5316 1.6390 2.0833
DIST 1,513 8.3996 8.6769 0.8463 8.6252 8.7439
COMLANG 1,513 0.4005 0.0000 0.4902 0.0000 1.0000
Notes: Table 2 shows descriptive statistics for all variables included in Equation (2) if LocTM is equal to one. Variables are
defined in Appendix 1.

51
Table 3. Choice between U.S. and Foreign Trademark Assignment
1 2 3
US MTR -0.217 -0.246 0.160
(0.679) (0.684) (0.647)
TRADEMARK VALUE 0.179*** 0.176***
(0.053) (0.054)
PROFITABILITY -0.343
(0.776)
ADVERT EXPENSE -2.043
(5.485)
INCOME MOBILE 0.829
(0.800)
HQ DELAWARE 0.917**
(0.395)
SIZE 0.011 0.008 0.027
(0.192) (0.193) (0.169)
FOREIGN ACTIVITIES 3.148*** 2.882*** 2.665***
(0.813) (0.774) (0.822)
MARKET TO BOOK -0.002 -0.002 -0.002
(0.002) (0.002) (0.002)
N 54,970 54,970 54,970
Notes: Table 3 presents results from logit regressions with OFFSHORE as dependent variable. Numbers in parentheses are robust
standard errors clustered by firms. Variables are defined in Appendix 1. *, ** and *** show significance at the level of 10%, 5%
and 1%, respectively.

52
Table 4. Top 10 Countries by Total and Average Number of Registrations
Notes: Table 4 shows the top 10 countries of U.S. trademark ownership location regarding the total number of registrations (left)
and the average number of registrations per firm that registered U.S. trademarks by affiliates located in the respective country
(right). Trademarks owned by entities located in the U.S. are not considered. Countries marked with a * are tax havens following
Dyreng and Lindsey’s (2009) definition.
country total number of registrations countryaverage number of
registrations per firm
Japan 598 Japan 85.43
Great Britain 502 Bermuda * 37.00
Germany 444 Ireland * 16.63
Canada 326 Turkey 12.33
Netherlands 273 Sweden 11.00
Switzerland * 202 Netherlands 10.50
Bermuda * 185 Germany 10.09
Sweden 165 Finland 8.80
Ireland * 133 Switzerland * 8.08
France 123 Great Britain 7.49
United States 78,223 United States 165.73

53
Table 5. U.S. Firms – Mixed Logit Results
1 2 3
Mean SD Mean SD Mean SD
Random Variables
STR -9.494*** 18.39*** -13.31*** 17.74*** -5.775*** 18.39***
(1.973) (1.369) (2.631) 1,769 (1.943) (1.369)
USWHT
-14.29*** 13.29*** -7.821*** 19.60***
(1,557) 1,197 (1.718) (2.169)
CFC
-0.198 -3.028***
(0.263) (0.416)
TMBOX
0.806** 1.256***
(0.405) (0.414)
Fixed Variables
GDP -0.200* -0.181 -0.192** (0.115) (0.160) (0.0928)
GDPPERCAP 1.206*** 0.954*** 0.933*** (0.118) (0.144) (0.119) DIST -0.392*** -0.253** -0.290**
(0.108) (0.0989) (0.116) CPI 1.170*** 0.660** 0.657** (0.268) (0.289) (0.261)
COMLANG 0.0121 0.186 0,152 (0.370) (0.324) (0.302) N 141,720 141,720 141,720
Notes: Table 5 presents the mixed logit estimates for U.S. firms. 3,543 positive trademark registrations from third countries are
included. Numbers in parentheses are robust standard errors. Variables are defined in Appendix 1. *, ** and *** show
significance at the level of 10%, 5% and 1%, respectively.

54
Table 6. U.S. Firms – Base Probabilities
Country Base Probability
Canada 0.1225
Japan 0.1122
Germany 0.1117
Great Britain 0.1048
Ireland * 0.0900
Bermuda * 0.0676
Switzerland * 0.0478
France 0.0388
Netherlands 0.0381
Hong Kong * 0.0288
Notes: Table 6 presents the predicted base
probabilities after regression 1 of table 5 for the top
10 countries regarding base probability. Countries
marked with a * are tax havens following Dyreng
and Lindsey’s (2009) definition.
Table 7. U.S. Firms – Cross Semi-Elasticities
Canada Japan Germany Great Britain Ireland Bermuda Switzerland France Netherlands Hong Kong
Canada 2.473 1.183 0.382 -0.662 -0.650 -0.216 -0.484 0.042 -0.261 -0.268
Japan 1.229 -4.585 1.966 0.115 -0.123 -0.022 -0.088 0.562 0.047 -0.054
Germany 0.206 1.720 0.745 -0.386 -0.523 -0.157 -0.364 0.142 -0.210 -0.203
Great Britain -0.858 0.188 -0.461 8.637 -1.534 -0.584 -0.904 -0.180 -0.511 -0.568
Ireland -1.161 -0.146 -0.710 -1.927 21.786 -6.517 -2.139 -0.230 -0.837 -1.882
Bermuda -0.534 -0.035 -0.282 -0.977 -9.413 18.174 -1.674 -0.078 -0.477 -1.894
Switzerland -1.293 -0.182 -0.833 -1.967 -3.692 -2.033 17.887 -0.295 -0.782 -1.154
France 0.145 1.864 0.440 -0.543 -0.548 -0.136 -0.366 0.779 -0.184 -0.221
Netherlands -0.858 0.205 -0.402 -1.257 -1.652 -0.640 -0.911 -0.174 9.762 -0.553
Hong Kong -1.293 -0.190 -0.821 -2.056 -5.388 -3.839 -1.943 -0.279 -0.854 23.716
Notes: Table 7 presents the cross semi-elasticities for a one percentage point cut in STR.

55
Table 8. U.S. Firms – Low and High Value Trademarks
1 2
low value high value
Mean SD Mean SD
Random Variables
STR -6.378*** 15.290*** -4.870** 14.500***
(2.330) (1.669) (2.452) (2.512)
Fixed Variables
GDP 0.821*** 1.313***
(0.094) (0.123)
GDPPERCAP 0.045 0.066
(0.248) (0.161)
CPI 0.262 0.805***
(0.340) (0.226)
DIST -0.695*** -0.536***
(0.165) (0.206)
N 22,440 23,840
Notes: Table 8 presents the mixed logit estimates for sub-groups of the sample. Both, specification (1) and specification (2)
consider only trademarks allocated to non-U.S. subsidiaries. Specification (1) considers only covering 1 or 2 classes of
goods and services (low value). Specification (2) considers only trademarks covering 7 or 8 classes of goods and services
(high value). Numbers in parentheses are robust standard errors. Variables are defined in Appendix 1. *, ** and *** show
significance at the level of 10%, 5% and 1%, respectively.

56
Table 9. European Firms – Top 10 Countries by Total and Average Number of Registrations
Notes: Table 9 shows the top 10 countries of U.S. trademark ownership location regarding the total number of registrations (left)
and the average number of registrations per firm that registered U.S. trademarks by affiliates located in the respective country
(right) for STOXX 600 Europe firms. Trademarks owned by entities located in the U.S. or the home country are not considered.
Countries marked with a * are tax havens following Dyreng and Lindsey’s (2009) definition.
country total number of registrations countryaverage number of
registrations per firm
Home Country 7,675 United States 39.43
United States 5,796 Home Country 35.53
Switzerland * 226 Ireland * 16.63
Netherlands 217 Switzerland * 14.13
Great Britain 215 Netherlands 9.43
Canada 198 Great Britain 8.60
Germany 183 Colombia 8.00
Ireland * 133 Bermuda * 7.00
France 79 El Salvador 7.00
Luxembourg * 23 Canada 6.39
Japan 23 Germany 6.31
Australia 22 France 4.94

57
Table 10. European Firms – Mixed Logit Results
1 2 3
Mean SD Mean SD Mean SD
Random Variables
STR -7.659** 10.510*** -5.076* 11.54*** -7.089** 13.83***
(3.379) (2.956) (2.948) (1.230) (3.031) (1.586)
USWHT
-8.277*** 22.66*** -17.13*** 26.170***
(-1.528) (2.342) (3.006) (5.035)
CFC
-1.198*** 4.555***
(0.383) (0.549)
TMBOX
-5.969** 7.622***
(2.780) (2.209)
Fixed Variables
GDP 0.087 0.102 0.0042
(0.162) (0.243) (0.221)
GDPPERCAP 1.205*** 0.937*** 1.000***
(0.259) (0.165) (0.225)
CPI -0.551*** -0.499*** -0.526**
(0.143) (0.238) (0.242)
DIST 1.233*** 0.772*** 0.774***
(0.291) (0.171) (0.284)
COMLANG -0.450 -0.364 -0.328
(0.504) (0.669) (0.644)
N 55,981 55,981 55,981
Notes: Table 10 presents the mixed logit estimates for European firms. 1,513 positive trademark registrations from third
countries are included. Numbers in parentheses are robust standard errors. Variables are defined in Appendix 1. *, ** and
*** show significance at the level of 10%, 5% and 1%, respectively.

58
Table 11. European Firms – Base Probabilities
Country Base Probability
Canada 0.1783
Germany 0.1145
Great Britain 0.1135
Japan 0.0881
France 0.0692
Netherlands 0.0565
Ireland * 0.0519
Switzerland * 0.0510
Sweden 0.0343
Australia 0.0324
Notes: Table 11 presents the predicted base
probabilities after regression 1 of table 10 for the top
10 countries regarding base probability. Countries
marked with a * are tax havens following Dyreng
and Lindsey’s (2009) definition.
Table 12. European Firms – Cross Semi-Elasticities
Canada Germany Great Britain Japan France Netherlands Ireland Switzerland Sweden Australia
Canada 3.5390 -0.2180 -0.6609 0.2456 -0.1047 -0.3537 -0.4491 -0.4258 -0.2188 -0.1532
Germany -0.4087 3.0618 -0.5020 0.3552 -0.0436 -0.3165 -0.4246 -0.3668 -0.1817 -0.1239
Great Britain -1.0946 -0.5641 6.7521 -0.0398 -0.3087 -0.5644 -0.8105 -0.6461 -0.3553 -0.2550
Japan 0.5053 0.4883 -0.0918 -0.9501 0.3543 -0.0534 -0.1270 -0.1137 -0.0349 0.0309
France -0.2536 -0.0675 -0.5363 0.5453 2.4529 -0.2687 -0.3436 -0.2908 -0.1698 -0.0953
Netherlands -1.1546 -0.6043 -1.0879 -0.0650 -0.3309 7.9311 -0.9732 -0.6933 -0.3661 -0.2657
Ireland -1.8301 -0.9600 -1.8289 -0.2208 -0.4666 -1.1104 14.7784 -1.8378 -0.6312 -0.4108
Switzerland -1.4405 -0.7749 -1.3540 -0.1877 -0.4035 -0.7538 -1.7318 11.1183 -0.4484 -0.3178
Sweden -1.1302 -0.6098 -1.1925 -0.0653 -0.3433 -0.6077 -0.9101 -0.6789 8.2637 -0.2745
Australia -0.8167 -0.4317 -0.9589 0.1024 -0.2384 -0.4739 -0.6481 -0.5132 -0.3065 6.1615
Notes: Table 12 presents the cross semi-elasticities for a one percentage point cut in STR.