Embed Size (px)
Citation preview

Forward Looking-Advisory
Forward-Looking Statements - This presentation offers our assessment of Zargon's future plans and operations as at February 18, 2015, and contains forward-looking statements. Such statements are generally identified by the use of words such as "anticipate", "continue", "estimate", "expect", "forecast", "may", "will", "project", "should", "plan", "intend", "believe" and similar expressions (including the negatives thereof). In particular, this presentation contains forward-looking information as to Zargon’s corporate strategy and business plans, Zargon’s oil exploration project inventory and development plans, Zargon’s dividend policy and the amount of future dividends, future commodity prices, Zargon’s expectation for uses of funds from financing, Zargon’s capital expenditure program and the allocation and the sources of funding thereof, Zargon’s cash flow and dividend model and the assumptions contained therein and the results there from, anticipated payout rates, 2015 and beyond production and other guidance and the assumptions contained therein, estimated tax pools, Zargon’s reserve estimates, Zargon’shedging policies, Zargon’s drilling, development and exploitation plans and projects and the results there from and Zargon’s ASP project plans 2015 and beyond, plans to sell un-strategic assets, the source of funding for our 2015 and beyond capital program including ASP, capital expenditures, costs and the results therefrom. By their nature, forward-looking statements are subject to numerous risks and uncertainties, some of which are beyond our control, including such as those relating to results of operations and financial condition, general economic conditions, industry conditions, changes in regulatory and taxation regimes, volatility of commodity prices, escalation of operating and capital costs, currency fluctuations, the availability of services, imprecision of reserve estimates, geological, technical, drilling and processing problems, environmental risks, weather, the lack of availability of qualified personnel or management, stock market volatility, the ability to access sufficient capital from internal and external sources and competition from other industry participants for, among other things, capital, services, acquisitions of reserves, undeveloped lands and skilled personnel. Risks are described in more detail in our Annual Information Form, which is available on our website. Forward-looking statements are provided to allow investors to have a greater understanding of our business.You are cautioned that the assumptions, including, among other things, future oil and natural gas prices; future capital expenditure levels; future production levels; future exchange rates; the cost of developing and expanding our assets; our ability to obtain equipment in a timely manner to carry out development activities; our ability to market our oil and natural gas successfully to current and new customers; the impact of increasing competition; our ability to obtain financing on acceptable terms; and our ability to add production and reserves through our development and acquisition activities used in the preparation of such information, although considered reasonable at the time of preparation, may prove to be imprecise and, as such, undue reliance should not be placed on forward-looking statements. Our actual results, performance, or achievement could differ materially from those expressed in, or implied by, these forward-looking statements. We can give no assurance that any of the events anticipated will transpire or occur, or if any of them do, what benefits we will derive from them. The forward-looking information contained in this presentation is expressly qualified by this cautionary statement. Our policy for updating forward-looking statements is that Zargondisclaims, except as required by law, any intention or obligation to update or revise any forward-looking statements, whether as a result of new information, future events or otherwise.Barrels of Oil Equivalent - Natural gas is converted to a barrel of oil equivalent (“Boe”) using six thousand cubic feet of gas to one barrel of oil. In certain circumstances, natural gas liquid volumes have been converted to a thousand cubic feet equivalent (“Mcfe”) on the basis of one barrel of natural gas liquids to six thousand cubic feet of gas. Boes and Mcfes may be misleading, particularly if used in isolation. A conversion ratio of one barrel to six thousand cubic feet of natural gas is based on an energy equivalency conversion method primarily applicable at the burner tip and does not represent a value equivalency at the wellhead. Given that the value ratio based on the current price of crude oil as compared to natural gas is significantly different from the energy equivalency of 6:1, utilizing a conversion ratio on a 6:1 basis may be misleading as an indication of value. The estimates of reserves and future net revenue for individual properties may not reflect the same confidence level as estimates of reserves and future net revenue for all properties, due to the effects of aggregation. Estimated reserve values disclosed in this presentation do not represent fair market value. Discovered Petroleum Initially-In-Place (“DPIIP”) is that quantity of petroleum that is estimated, as of a given date, to be contained in known accumulations prior to production. The recoverable portion of discovered petroleum initially in place includes production, reserves, and contingent resources; the remainder is unrecoverable.The aggregate of the exploration and development costs incurred in the most recent financial year and the change during that year in estimated future development costs generally will not reflect total finding and development costs related to reserves additions for that year.
2
Core Attributes
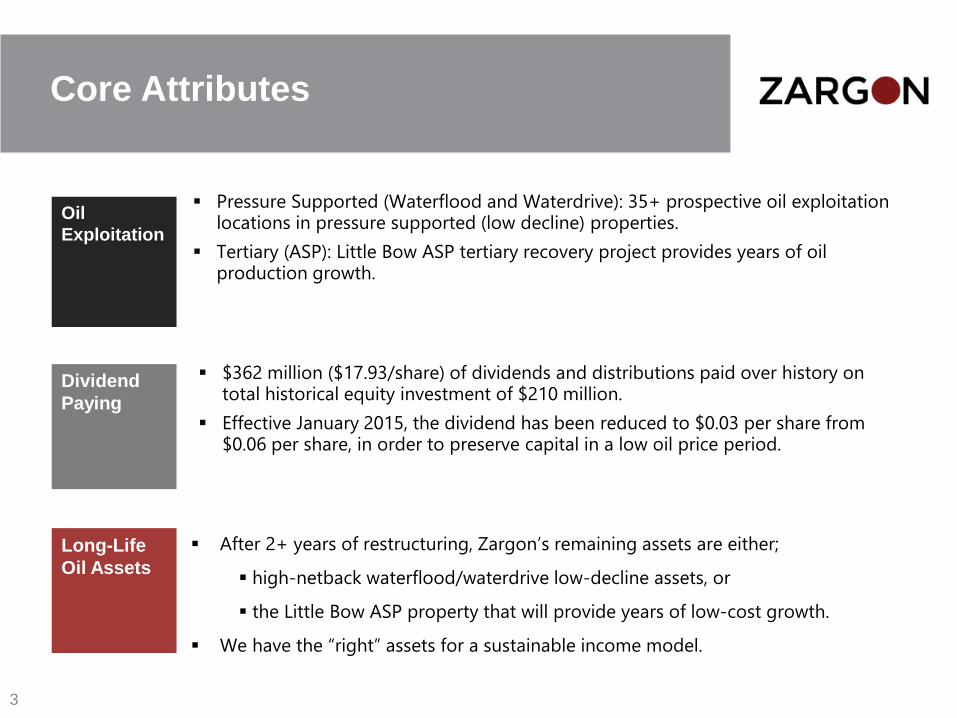
$362 million ($17.93/share) of dividends and distributions paid over history on total historical equity investment of $210 million.
Effective January 2015, the dividend has been reduced to $0.03 per share from $0.06 per share, in order to preserve capital in a low oil price period.
Pressure Supported (Waterflood and Waterdrive): 35+ prospective oil exploitation locations in pressure supported (low decline) properties.
Tertiary (ASP): Little Bow ASP tertiary recovery project provides years of oil production growth.
Oil Exploitation
Long-Life Oil Assets
Dividend Paying
After 2+ years of restructuring, Zargon’s remaining assets are either;
high-netback waterflood/waterdrive low-decline assets, or
the Little Bow ASP property that will provide years of low-cost growth.
We have the “right” assets for a sustainable income model.
3

Asset Description
WaterfloodandWaterdriveOilProperties
Other Non-Strategic
Little Bow ASP Teritiatry Recovery
Properties account for approximately 94% of oil production (3,750 bbl/d); very predictable with low declines of 15 percent (or less) per year.
Inventory of low risk oil exploitation wells, can be deferred until prices improve.
High proved and probable producing oil reserve life index of 8.8 years (McDaniel corporate estimate) identifies long-term production without any additional wells.
Little Bow ASP phase 1 is displaying encouraging oil-banking production trends.
Combined, Little Bow ASP Phases 1-4 are forecast to provide 2,400 bbl/d of incremental oil production by 2021.
Scalable technology that can be used for other fields.
Remaining properties were higher cost, higher decline and did not support our sustainable oil income model.
In 2014, we disposed 350+ net wells producing 220 bbl/d and 9.5 mmcf/d (1,800 boe/d).
Remaining non-strategic assets of 250 bbl/d and 3.0 mmcf/d (750 boe/d) represents only 6% of oil production. These assets will be “warehoused” until prices improve.
4

Zargon Overview (Feb. 18, 2015)
Capitalization– Toronto Stock Exchange: Symbols: ZAR; ZAR.DB– Common Shares Outstanding: 30.25 million (basic)– Market Capitalization: $120 million ($3.96 per share) (1)
– Net Debt at Dec. 31, 2014 (unaudited): $114 million (after Hamilton Lake sale), comprised of
Convertible Debentures (6%) $57.5 million (face value – June 2017 maturity) Bank Debt and Net Working Capital Deficit $56 million Authorized Bank Debt $130 million (43 percent drawn)
– Insider Ownership: 3.35 million shares (11 percent)
Dividend & Yield– Monthly Dividend (Commencing January 2015): $0.03 per share (reduced from $0.06 per share)– Yield at current share price: 9.1% (1)
Q4 2014 Production – Equivalent: 5,222 boe/d – Oil: 4,150 bbl/d (79% of production)– Gas: 6.43 mmcf/d
Q3 2014 Financial Results– Funds Flow from Operations $0.36 per basic share ($10.9 million)– Dividends Paid $0.18 per basic share ($5.4 million)
(1) Based on a monthly dividend rate of $0.03/share and using the February 18, 2015 closing share price of $3.96.
5

Recent Developments
December 22, 2014 Balance Sheet Preservation Press Release:
Dividend decreased to $0.03/month -Saves $11 million in 2015
Hamilton Lake property sale closed -Provided $22.5 million cash
2015 Conventional cap. budget reduced -Saves $13 million in 2015
January 19, 2015 Production Update Press Release:
Definitive ASP production of 80 bbl/d (total) observed,
ASP production trends continue to point to the targeted 12% reservoir recovery,
Q4 2014 production met guidance (4,150 bbl/d and 6.43 mmcf/d).
Balance sheet protected
Production Update
2014Year End Reserves
February 19, 2015 Annual Reserves Review Press Release:
Proved and Probable Oil Reserves – 19.67 million barrels (13.0 year rli),
Proved Developed Producing Oil Reserves – 10.05 million barrels (6.6 year rli),
Proved and Probable NAV of $10.11 per share; Proved Developed Producing NAV of $3.84 per share (no ASP).
6

2015 Corporate Objectives
Little BowASP
PreserveBalance Sheet
Waterflood and Waterdrive
Operate efficiently and cost-effectively while delivering 2015 ASP production targets.
Deliver phase 1 exploitation modifications and phase 2 pre-construction objectives for less than $6 million, while preserving a fall 2016 phase 2 start-up schedule.
Conclude phase 3 & 4 laboratory and preliminary reservoir simulation studies.
Operate efficiently and cost-effectively to maximize cash flow.
Proceed with long-dated waterflood optimizations, but defer drilling programs until oil prices improve.
The preservation of our balance sheet during this challenging low oil price period is imperative.
Maximize corporate cash flows by targeting all costs, including operating, G&A and discretionary capital costs.
As a last resort, consider a further temporary dividend reduction until oil prices improve.
7

Waterflood/drive Well Inventory
Property Project Net Wells Comments
Bellshill Lake Increase fluid withdrawal 5 Facility optimization; infills and step-outs
Bellshill Lake – Killam Develop Glauconite pool 5 Infill and step-out locations
Taber Develop Sunburst pool 5 Expand and enhance waterfloods
Williston Basin Elswick, Midale, Weyburn, Ralph, Steelman, Mackobee
20+ Horizontal drainage wells in relatively tight reservoirs; additional pressure support required in some cases
Drilling Inventory of 35+ net wells.
The Q4 2014 conventional oil exploitation drilling program included 3 Williston Basin and 2 Taber wells.
Future drilling will be deferred until oil prices improve.
8

Long-Life, Low-Decline Oil Volumes
Using vintaged Zargon operated production plots, we calculate base oil production declines of less than 15%. Independent research by Peters and the proved and probable developed producing McDaniel analyses (1st year decline of 14.5%) support our view of industry-low base declines.
0
1,000
2,000
3,000
4,000
5,000
6,000
2005 2006 2007 2008 2009 2010 2011 2012 2013
Gro
ss W
.I. O
il Pr
oduc
tion
Rate
( bb
l/da
y )
2013 Additions2012 Additions2011 Additions2010 Additions2009 Additions2008 AdditionsBase Production
Zargon Corporate Decline Analysis - Total Oil Production Rate
Data to Dec 31, 2013
Comparative Declines Source: Peters & Co. Limited, Intermediates & Juniors (January 12, 2015) Oil sands and SAGD producers are not included.
0 10 20 30 40 50
Average Annual Decline Rate (%)
Average 31%
Zargon
9

Canadian ASP Projects
10 Canadian ASP Projects in operation.
2 additional projects have regulatory approval.
Major operators: Husky, CNRL, Cenovus, Crescent Point.
Significant implementation in Saskatchewan: historically (no longer) favorable EOR royalty treatment.
Technology utilized in Asia since 1980’s.
Edmonton
Lethbridge
Calgary
Medicine Hat
Grande Prairie Mooney(Black Pearl)
2011
Coleville (Penn West)
2011Suffield
(Cenovus)2007
Taber South (Husky)2006
Taber (Husky)2008
Grand Forks(CNRL)
Battrum(Hyak Energy)
Fosterton (Husky)
2012 Gull Lake (Husky)
2009
Instow(Crescent Point)
2007/11
Little Bow (Zargon)
Alberta Sask.
Bone Creek (Husky)
In Progress
Scheme Approved
In Progress
Scheme Approved
10

Little Bow ASP: Proven Technology
EOR in a mature, southern Alberta waterflood Phased Development Phase 1 ASP injection commenced March 2014
Capital (Non Chemical): Phase 1: $50 Million (Completed) Phase 2 Development: $12 million evenly split
between 2015-16
Chemical Costs 2015 – Phase 1: $12 Million 2016 – Phase 1 & 2: $15 Million
Incremental ASP production (Zargon forecast): 2015 Q1-Q4: 100, 250, 500 and 750 bbl/d
2015 Avg: 400 bbl/d2016 Avg: 1,200 bbl/d
Incremental Phases 1 & 2 ASP Reserves: Zargon forecast incremental oil recovery:
5.2 million barrels (12% doiip)
McDaniel forecast incremental oil recovery: 4.5 million barrels (proved and probable) 1.5 million barrels (proved)
Little Bow ASP: Phase 1&2 Development
15-18W4
Zargon LandZargon WellsZargon LandZargon Wells
Phase 1 AreaPhase 2 AreaPhase 1 AreaPhase 2 Area
Little Bow Mannville “P” Pool
Little Bow Mannville “I” Pool
11

Little Bow ASP Project Milestones
Recent Highlights
ASP facility, oil battery and field construction complete and online in March 2014 ($50 million: construction & startup).
July 2014 - Revisions to Conventional Enhanced Oil Recovery (“EOR”) Crown royalty program significantly improved Zargon’s Little Bow ASP economics.
February 2015: 3.3 million barrels of ASP Injection or 15 percent of the total chemical bank (ASP and polymer only) scheduled to be injected in the phase 1 operations.
Reservoir pressure and injection data provides strong evidence of oil banks being formed in the reservoir. Currently more than 80 bbl/d of new ASP production from producers in close proximity to ASP injectors. Oil cut improvements observed in 11 of the project’s 16 producers.
12

ASP Enhanced Oil Recovery Process
Dilute concentrations of chemicals (Alkali, Surfactant and Polymer) in water are injected into an existing oil pool to “scrub” out oil that waterflooding alone will not recover.
RockRock
a) Water Injection:More than half of oil is “trapped”
b) Alkali / SurfactantMobilizes trapped oil
Water Injection
TrappedOil Droplet Water
RockRock
Mobilized Oil DropletAlkali & SurfactantSolution
Injector Producer
WaterWater
Injector Producer
PolymerSolution
IncreasedContactVolume
PolymerSolution
IncreasedContactVolume
a) Water Injection b) Polymer Injection
Surfactants: Detergent; mobilizes trapped oil.
Alkali: Increases surfactant effectiveness.
Polymer (Thickener):Thickened water helps sweep oil from the reservoir.
13

ASP Injection Sequence
1) ASP InjectionA blend of Alkali, Surfactant & Polymer mobilizes trapped oil
2) Polymer “Push”Polymer displaces mobilized
oil to producing wells
3) Terminal WaterfloodReturn to waterflood to
complete oil displacement
OIL BANK ASP POLYMER WATER
Little Bow Phase 1 & 2 Injection Schedule
Phase 1 ASP Polymer Waterflood
Phase 2 ASP Polymer
20212017 2018 2019 20202013 2014 2015 2016
14

Little Bow ASP Project Analog
Taber Mannville “B” ASP Analog
Most mature Canadian ASP Project; Husky Operated Same geological setting, oil quality, reservoir size and pre-
ASP depletion state as Zargon’s Little Bow Pool First ASP Injection: 2006 Incremental recovery greater than 12% is projected
Taber Production History
Sep-12
Sep-11
Sep-10
Sep-09
Sep-08
Sep-07
Sep-06Sep-05
16 % R.F.
16 % R.F.
14.5 % R.F. (Husky Application)
14 % R.F.
14 % R.F.
12 % R.F.(Zargon Base
Case)
12 % R.F.
10 % R.F.
10 % R.F.
8 % R.F.(Zargon PV10 Breakeven)
8 % R.F.
10
100
1,000
10,000
15,000 16,000 17,000 18,000 19,000 20,000 21,000 22,000 23,000 24,000 25,000
Cumulative Oil Production (mbbl)
Oil P
rodu
ction
(bbl
/d)
1%
10%
100%
1000%
Oil Cut (%)
Data to July-2013
Oil Cut (%)
Oil Rate, bbl/d
First ASP InjectionMay, 2006
?
?
ERCB DPIIP = 43.1 mmbblASP Recovery Ult. Recovery *
% mmbbl mmbbl8 3.4 20.5
10 4.3 21.312 5.2 22.214 6.0 23.016 6.9 23.9
* Ultimate Recovery where ASP flood returns to pre-ASP levels
Little Bow Mannville “I” and “P” Pools (Zargon)
Taber Mannville “B” Pool (Husky)15

Oil Producer
Waterflood InjectorASP InjectorOil Producer
Waterflood InjectorASP InjectorOil Producer
Waterflood InjectorASP InjectorOil Producer
Waterflood InjectorASP InjectorOil Producer
Waterflood InjectorASP InjectorOil Producer
Waterflood InjectorASP Injector
Increased Oil Cut
-200
-150
-100
-50
0
50
100
150
200
Jul Aug Sep Oct Nov Dec Jan Feb
bpd
0
1
2
3
4
5
6
7
8
Oil C
ut (%)
ASP Early Oil Response Varies by Area
Southeast:Chemical Injection: 17% completeOil Cut increase: 1 to 2.5 %Oil Rate increase: 80 bbl/d6 of 7 producers with oil cut gains
-200
-150
-100
-50
0
50
100
150
200
Jul Aug Sep Oct Nov Dec Jan Feb
bpd
0
1
2
3
4
5
6
7
8
Oil C
ut (%)
Central:Chemical Injection 11% completeCurrently, under-injected, will remedy3 of 5 producers with (subtle)
oil cut gains
Northwest:Chemical Injection: 9 -18 % completeSome challenges (now resolved) with
injection conformanceModified ASP flow patterns interrupted
waterflood production trends2 of 4 producers with (subtle) oil cut
gains
-200
-150
-100
-50
0
50
100
150
200
Jul Aug Sep Oct Nov Dec Jan Feb
bpd
0
1
2
3
4
5
6
7
8
Oil C
ut (%)

Little Bow ASP Oil Production
Nov Dec Jan 2015 Feb Mar April May June July Aug Sept Oct Nov Dec0
200
400
600
800
1000
1200
1400
Oct-2014
bbl/d
ASP Oil Response – Actual vs. Forecast
2014 Base Waterflood Forecast (from McDaniel 2013 YE report)
Daily Actuals
Zargon Forecast2015 Avg. ∆ = 400 bbl/d
Ultimate: 5.2 million barrels
McDaniel P+P (Undev.)2015 Avg. ∆ = 132 bbl/d
Ultimate: 4.5 million barrels
ASP Plant Maintenanceand Well Workovers
17

Phases 1-4 Development Plan
Zargon W.I.(%)
W.I. DOIIP*
(mmbbl)
Phases 1 & 2
LB “I” Pool 100 31
LB “P” Pool 100 8
Phases 3 & 4
U&W Unit 97 26
G Unit 95 10
MM Unit 100 5
Other
C8C / X8X 100 9
Total 89
* AER DOIIP Data (Jan. 2014)
15-19W4 15-18W4
14-19W4 14-18W4
Zargon LandZargon Wells
Phases 1&2 Area
“C8C/X8X” Pool “MM” Unit
“G”, “U&W” Units
Phases 3&4 Area
18

Phases 1 & 2 Project Economics
Zargon Internal Production Forecasts Oil Price: 80 C$/bbl Real (Edmonton Par)Effective Date: January 1, 2015 Compares to McDaniel July 1, 2014 : 2P reserves – 4.5 mmbl, 2P PV10 – $98.6 million
Little Bow ASP: Phases 1&2 Production
0
500
1000
1500
2000
2500
2012 2013 2014 2015 2016 2017 2018 2019 2020 2021 2022 2023 2024 2025 2026 2027 2028 2029 2030
bbl/d
Phases 1&2: 12% Recovery (5.2 mmbbl)
Phase 1 Phase 2
(1) ASP Chemical injectant booked as capital(2) Phase 2 capital; incurred in 2015 and 2016
Base Waterflood
Go Forward
IRR (%) 90
PV10 ($million) 106
F&D ($/bbl) (1) 16
Netback ($/bbl) (1) 55
Recycle Ratio (1) 3.4
Oil Reserves (mbbl) 5,200
Capital ($million) 12 (2)
Chemical ($million) 71
19

Phases 3 & 4 Project Economics
Zargon Internal Production Forecasts Oil Price: 80 C$/bbl Real (Edmonton Par)Effective Date: January 1, 2015 Reflects Current Zargon Working Interests varying from 97 – 100 %
(1) ASP Chemical injectant booked as capital(2) Phase 3 & 4 capital; incurred in 2019-2021(3) Phase 3 & 4 chemical costs; incurred in 2019-2027
ASP Development Forecast - Phases 1-4
0
500
1000
1500
2000
2500
3000
2012 2013 2014 2015 2016 2017 2018 2019 2020 2021 2022 2023 2024 2025 2026 2027 2028 2029 2030
BOPD
Zargon W.I. Production
Phases 1&212% Recovery
100% W.I.
Phases 3&411% Recovery
97% W.I.
Base Waterflood
Phases 1 - 4 Go Forward Economics
Phases 3 & 4 Phases 1 - 4
IRR (%) 37 82
PV10 ($million) 51 157
F&D ($/bbl) (1) 23 19
Netback ($/bbl) (1) 61 58
Recycle Ratio (1) 2.7 3.0
Oil Reserves (mbbl) 4,650 9,850
Capital ($million) (2) 20 32
Chemical ($million) (3) 85 156
20

Project Netbacks and Recycle Ratios
Notes:
EOR royalties reflect recent Alberta EOR royalty modifications, which are calculated to be in effect for the first 8 years of each phase.
Existing operations are carrying the battery, gas plant, and field costs; therefore incremental costs are low. Chemical costs are treated as capital.
The Little Bow ASP project provides attractive half cycle returns (even at the current low oil prices), that will provide profitable reinvestment programs throughout the rest of the decade.
Future Development Costs Phase 1-2 Phase 1-4
Future Capital Costs $ 12 million $ 32 million Future Chemical Costs $ 71 million $ 156 millionTotal Future Capital $ 83 million $ 188 million Oil Reserves (Zargon estimate) 5,200 mbbl 9,850 mbblFuture Development Cost $ 16/bbl $ 19/bbl
Incremental ASP Netbacks & Recycle Ratios for Phase 1-2$ 50 US/bbl $ 70 US/bbl
Estimated Field Price (Cdn.) $ 37.5/bbl $ 62.5/bblEffective EOR Royalty, % 5 % 5 %Incremental Op. Costs $ 7/bbl $ 7/bblIncremental Field Netback $ 29/bbl $ 52/bblFuture Development Costs (Phase 1-2) $ 16/bbl $ 16/bbl Go Forward Recycle Ratio 1.8 times 3.2 times
21

2014 Property Disposition Program
Objective: Conclude property dispositions that high-grade and concentrate the Company’s properties on our core oil exploitation business:
More than 350 net active wells were sold in these sales. Over 500 net wells were sold in the last 18 months.
Only a few minor non-core properties remain for potential sale. These assets will be “warehoused” until commodity prices improve.
Completed 2014 property sales:
$1.5 million of Q1 proceeds for one Saskatchewan property (9 bbl/d)
$3.2 million (net) of Q2 proceeds relating to five Alberta transactions (23 bbl/d and 1,050 mcf/d)
$6.6 million of Q3 proceeds relating to seven Alberta transactions (17 bbl/d and 7,080 mcf/d)
$25.0 million ($22.5 million cash) of Q4 proceeds for Hamilton Lake property (170 bbl/d and 1,400 mcf/d)
Total cash proceeds of $33.7 million (net) for approximately 220 bb/d and 9,500 mcf/d (or 1,800 boe/d)
In aggregate, these properties (net of acquisitions) had been assigned 21.2 bcf and 824 mbbl in the McDaniel 2013 year end report.
22

2015 Capital Budgets
Zargon is committed to not materially increase debt levels in 2015. Based on the current 2015 budget, Zargon’s $32 million of 2015 capital programs and $11 million of dividends ($0.03 per share per month) must be balanced by $43 million of 2015 corporate cash flows, which (based on our corporate modeling – inputs provided on the next slide) require a WTI oil price of $60 US per barrel in H1 and $70 US per barrel in H2.
In order to balance the 2015 budget in a lower price environment, Zargon’s adjustment hierarchy will be: g&a and operating cost reductions, conventional capital deferral/elimination, non-critical path ASP phase 2 capital deferrals and finally (if absolutely necessary) temporary dividend rate adjustments. ASP chemical injections will be maintained.
Note: excluding hedges a $10 US/bbl WTI change in 2015 oil prices changes cash flows by $15 million.
Capital Program 2014 2015 (revised)ASP Phase 1 Construction Capital $ 8 million $ nilASP Phase 1 Exploitation Capital $ 2 million $ 2 millionASP Phase 2 Development Capital $ nil $ 6 millionASP Phase 1 Chemical Costs $11 million $12 million
Total ASP Capital $21 million $20 million Conventional (non ASP) Capital $36 million $12 million
Total Capital Program $57 million $32 million
23

Production Guidance and Cost Targets
Operating Conventional Oil - $22.00 per bbl; Gas - $2.60/mcf; ASP Oil - $7/bbl
G&A $4.50 per boe (excluding one-time charges); costs expected to improve during the year due to effects of corporate downsizing and growing ASP volumes.
Royalties Conventional Oil 18%; ASP Oil 5%; Natural Gas 9%.
Q1 2015 Oil 4,100 barrels per day (4,000 bbl/d conventional and 100 bbl/d ASP) Cal. 2015 Oil 3,800 barrels per day (excl. ASP)
400 barrels per day (ASP)
Q1 2015 Gas 5.0 million cubic feet per day Cal. 2015 Gas 4.8 million cubic feet per day
FX $0.80 US/$Cdn. Oil Prices $60 US/bbl; H2 $70 US/bbl
WTI to Zargon Base Differential; $18 Cdn./bblWTI to ASP Differential; $25 Cdn./bbl
Gas Prices $2.65/mcf Hedges Refer to next slide
Production Guidance
2015 Cost Targets(Year Avg.)
Other 2015 Parameters
24

Current Commodity Hedges
Q4 2014: 3,000 gj/d at $4.03/gj (AECO)
Q1 2015: 3,000 gj/d at $4.18/gj (AECO)
Zargon uses hedges to help fund dividends and capital programs during periods of lower commodity prices
Q4 2014: 2,600 bbl/d at $90.92 US/bbl (WTI) and 400 bbl/d at $99.60 Cdn/bbl (WTI)
Q1 2015: 1,600 bbl/d at $93.44 US/bbl (WTI)
Q2 2015: 1,200 bbl/d at $94.01 US/bbl (WTI)
Hedging Strategy
Current Forward Natural Gas Sales
Current Forward Oil Sales
25

McDaniel 2014 Yr. End Net Asset Value
Waterflood and waterdrive property value of $286 million less estimated December 31/14 net debt of $114 million leaves $172 million or $5.70 per Zargon share (30.18 million shares outstanding).
Little Bow ASP, undeveloped land and other assets (after sales) add $133 million, or $4.41 per share, taking the net asset value to $10.11 per share.
Waterflood WaterdriveProperties
Q1/15 Oil Guidance (bbl/d)
Q1/15 Gas Guidance (mmcf/d)
McD. Oil Res.(mmbbl)
McD. Gas Res. (bcf)
PV10 Asset Value (million)
Williston Basin 1,850 0.40 7.95 1.23 $150Taber South 730 0.10 2.25 0.20 $ 55
Bellshill (incl. Killam) 670 0.20 2.19 2.20 $ 45Little Bow Conventional 500 1.30 2.14 2.22 $ 36
Subtotal – Core 3,750 2.00 14.53 5.85 $ 286
Non-Core AssetsQ1/15 Oil
Guidance (bbl/d)Q1/15 Gas
Guidance (mmcf/d)McD. Oil Res.
(mmbbl)McD. Gas Res.(bcf)
PV10 Asset Value ($million)
Non Core Remaining 250 3.00 0.66 8.10 $ 20Undeveloped Land - - - - $ 12
Subtotal – Non-Core 250 3.00 0.66 8.10 $ 32
Little Bow ASP AssetsQ1/15 Oil
Guidance (bbl/d)Q1/15 Gas
Guidance (mmcf/d)McD. Oil Res.
(mmbbl)McD. Gas Res.(bcf)
PV 10 Asset Value ($million)
Subtotal – ASP 100 - 4.48 1.74 $ 101
Grand Total 4,100 5.00 19.67 15.69 $ 419
26

McDaniel 2014 Yr. End Net Asset Value
(30.18 million shares at Dec 31, 2014)
(30.09 million shares at Dec 31, 2013)
27

Key Takeaways
Zargon’s unique low-decline asset provides stability in this challenging low price period.
Balance sheet will be protected by cost containment initiatives, 2015 capital budget reductions and finally (if absolutely necessary) a temporary further dividend reduction.
Unaudited bank debt (& net working capital deficiency) of $56 million at year end 2014 represents only 43% of authorized bank line.
Go forward ASP project economics provide solid recycle ratios (1.8 times), even at WTI oil prices of $50 US/bbl. Little Bow ASP project provides years of profitable production growth through 2021.
ASP project success will lead to follow-on projects at Little Bow and potentially other Southern Alberta properties.
Balance Sheet Protected
Deep Discount to NAV
Oil Growth at Low Cost
Investors buy Zargon at a large discount to the proved and probable net asset value for Zargon’s waterflood and waterdrive oil assets. No value is attributed to the Little Bow ASP project.
Zargon’s long-dated oil reserves provide investor’s exceptional torque to future increases in oil prices.
28

Williston Basin Property Summary
The Williston Basin assets are characterized by waterflood and waterdriveproperties. Significant oil exploitation work remains.
Since 2008, these properties have provided $281 million of property cash flow and $147 million of free cash flow after capital, in addition to providing a net $87 million of proceeds from property dispositions.
1000
1100
1200
1300
1400
1500
1600
1700
1800
1900
2000
2100
2200
2300
2400
2500
2600
2700
2800
2900
2008 2009 2010 2011 2012 2013 2014
Historical - Current Assets 2008 2009 2010 2011 2012 2013 2014
30

Williston Basin Activity Summary
Ongoing Activities Exploit long life low decline pools
with horizontal wells and waterfloodenhancements.
2014 Activities Drilled 8 exploitation horizontal
wells at Steelman, Weyburn, Ralph and Mackobee Coulee.
Upgraded 2 central batteries (Weyburn, and Steelman).
Modified and enhanced existing waterflood projects (Steelman and Ralph).
2015 Activities The size and scope of the Williston
Basin conventional oil exploitation capital programs will be dependent on the corporate cash flows available.
Drill exploitation horizontal wells at Frys, Weyburn, Huntoon, Ralph and Mackobee Coulee.
Upgrade 2 central batteries (Huntoon and Elswick).
Modify and enhance existing waterflood projects (Weyburn, Frysand Elswick).
Estevan
North Dakota
Saskatchewan Manitoba
Haas
Truro
Mackobee Coulee
Frys
Steelman
Ralph
Elswick
Weyburn
Workman
31

Taber South Property Summary
The Taber South waterflood property has been developed with horizontal producers and injectors. Now, mostly developed (except for waterflood expansion) the property provides significant free cash flow.
Since 2008, the property has provided $80 million of property cash flow and $43 million of free cash flow after capital.
Taber S - Production Contribution by Drilling Program Date (29 hz wells)
0
100
200
300
400
500
600
700
800
900
1,000
2007 2008 2009 2010 2011 2012 2013 2014
Oil R
ate (b
bl/d)
Pre 2008 2008 2009 2010 Q1 2011 Q3 2011 Q4 2012 Q4 2013 Q2 2014
2 wells converted to Water Injection
1 well converted to Water Injection1 well converted to Water Injection
32

Little Bow (pre-ASP) Property Summary
The Little Bow waterflood property is now being re-developed for tertiary ASP potential.
Since 2009, these waterflood assets have provided $38 million of property cash flow and $20 million of free cash flow after capital.
Little Bow Core Area Production
200
300
400
500
600
700
800
Jan-10 Jul-10 Jan-11 Jul-11 Jan-12 Jul-12 Jan-13 Jul-13 Jan-14
Oil
Rat
e (b
bl/d
)
Zargon Operated OilwellsNo Drilling Activity - Well Reactivation/Optimization Projects
33

Bellshill Lake Property Summary
Bellshill Lake property includes a Bellshill Lake waterdrive and Killam Glauconite waterflood property.
The Bellshill Lake waterdrive property has been developed with vertical producers and high volume lift.
The Killam Glauconite property is a less mature property that is being developed with horizontal producers.
Since 2008, these two Bellshill Lake properties have provided $76 million of property cash flow and $36 million of free cash flow after capital.
100
1,000
Jan-07 Jan-08 Jan-09 Jan-10 Jan-11 Jan-12 Jan-13 Jan-14
Oil
Rate
(bbl
/day
)
base 2009 2010 2011 2012 2013 2014
Rate OPEX Netback Netback CAPEX Net Proceeds(bbl/d) ($/boe) ($/boe) ($M) ($M) ($M)
2008 488 12.70 50.56 11,987 6,302 5,6862009 738 11.12 31.94 9,693 3,684 6,0092010 607 13.91 38.42 9,306 4,863 4,4432011 688 15.33 45.24 12,596 7,570 5,0262012 703 13.92 39.78 12,034 9,185 2,8492013 713 14.43 41.04 12,414 4,067 8,348
H1-2014 718 13.87 52.29 7,680 4,368 3,312Total 75,710 40,037 35,673
Netback Elements
34

Little Bow Phase 1 & 2 Optimizations
Reservoir simulation model developed to optimize ASP flood design
Multiple scenarios:- ASP fluid design- Drilling & workover locations- Pattern layout
Optimized case predicts 6.5 million barrels incremental oil recovery
Economics assume 5.2 million barrels: 12% incremental recovery factor
1,276 cases run
Base Waterflood Recovery
ASP Oil Recovery (mbbl)
McDaniel 2013 Year End: 4,500
Zargon 2013 Optimized: 6,500
Zargon 2013 Economics: 5,200
ASP
Oil
Reco
very
Oil
Reco
very
1,276 cases run
Base Waterflood Recovery
ASP Oil Recovery (mbbl)
McDaniel 2013 Year End: 4,500
Zargon 2013 Optimized: 6,500
Zargon 2013 Economics: 5,200
ASP
Oil
Reco
very
Oil
Reco
very
1,276 cases run
Base Waterflood Recovery
ASP Oil Recovery (mbbl)
McDaniel 2013 Year End: 4,500
Zargon 2013 Optimized: 6,500
Zargon 2013 Economics: 5,200
ASP
Oil
Reco
very
Oil
Reco
very
35

Alberta Modified EOR Crown Royalty
Program Highlights and its Impact on Zargon
Announced July 2014.
Now, Alberta conventional oil EOR royalties in line with Alberta oil sands and Saskatchewan conventional oil EOR programs.
5 percent oil royalty rate for up to 10 years.
Little Bow Phase 1: Eight years expected.
McDaniel has updated the Little Bow ASP evaluation with the new royalty program.
McDaniel (Phases 1 & 2)Oil & Liquids
Reserves(mmbbl)
Project NPVPrev. EOR Roy.
As of Jan. 1, 2014($million)
Project NPVModified EOR Roy. As of July 1, 2014
($million)
Proved Undeveloped 1.53 25.1 39.6
Proved and Probable Undeveloped 4.48 66.3 98.6
Estimated Tax Pools
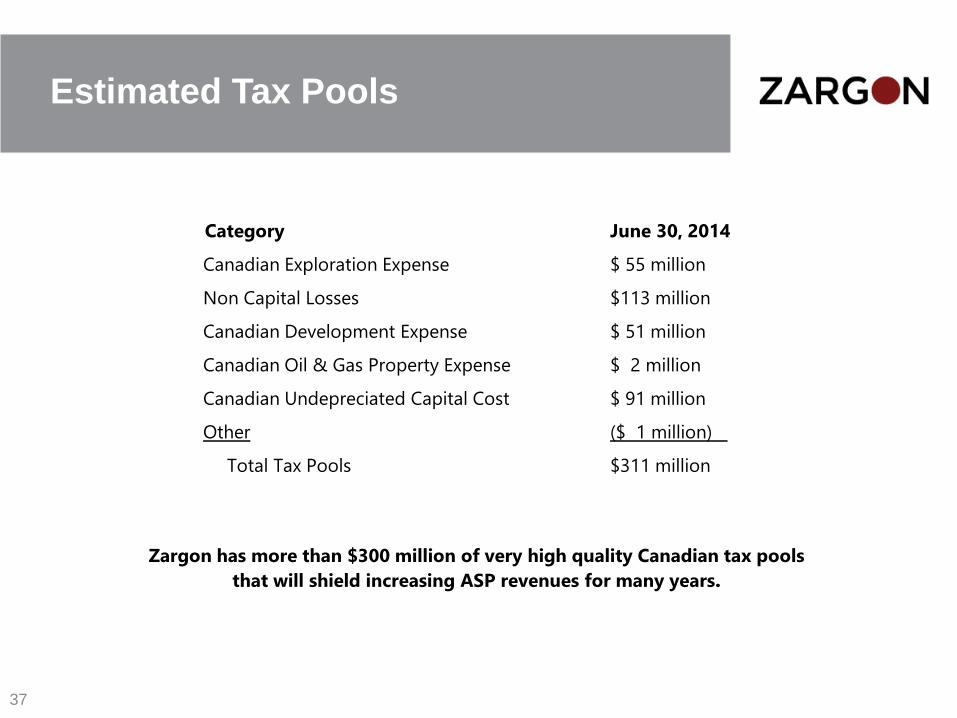
Category June 30, 2014
Canadian Exploration Expense $ 55 million
Non Capital Losses $113 million
Canadian Development Expense $ 51 million
Canadian Oil & Gas Property Expense $ 2 million
Canadian Undepreciated Capital Cost $ 91 million
Other ($ 1 million)
Total Tax Pools $311 million
Zargon has more than $300 million of very high quality Canadian tax pools that will shield increasing ASP revenues for many years.
37