Embed Size (px)
Citation preview

Corporate Presentation
9 June 2016
1

The presentation herein may contain forward looking statements by the management
of Best World International Ltd (BWI) that pertain to expectations for financial
performance of future periods vs past periods. Such forward looking statements
involve certain risks and uncertainties as they relate to future events. Actual results
may vary materially from those targeted, expected or projected due to various factors.
Such factors are, among others, general economic conditions, foreign exchange
fluctuations, competitive product and pricing pressures as well as changes in tax
regimes and regulatory developments. Such statements are not and should not be
construed as management’s representation on the future performance of BWI.
Therefore, the actual performance of BWI may differ significantly from expressions
provided herein. The reader is cautioned to not unduly rely on these forward-looking
statements.
Neither the Group nor its advisers and representatives shall have any liability
whatsoever for any loss arising, whether directly or indirectly, from any use or
distribution of this presentation or its contents.
This presentation is for information only and does not constitute an invitation or offer
to acquire, purchase or subscribe for shares in BWI.
2
• About Best World
• Business Model & Financial Highlights
• Strategy & Outlook
• Q&A
Content
3

Our Vision
4
To be a global leading
health and wellness
company dedicated to
creating products that
enhance the lives of our
customers.

About Best World
• Founded in 1990, Best World
International specializes in
– Premium skincare,
– Health Supplements
– Nutritional and wellness
products.
• Today, Best World is a key
regional player with a network
of over 412,000 independent
distributors and members in
the 12 markets we operate in.
5

About Best World
• In July 2004, Best World became
the first direct-selling company to
be public listed on the Singapore
Stock Exchange.
• Through our wholly owned
subsidiary in the PRC, we also
manufacture and distribute the
Aurigen line of supplements in
China through drugstores in
28 provinces of PRC.
6

• Founded in 1990
• Opening of first business centre in Malaysia in 1998
• Listed on SGX in 2004
• Entered into Thailand Market in 2004
• Expanded into Vietnam with new lifestyle center in
2005
• Expanded outside South East Asia with Hong Kong
Regional Center in 2006
• Expanded into Taiwan Market in 2006
• Grand launch of Indonesia Market in 2007
• Entered into Korea Market in 2009
• Ventured into Philippines in 2010
• Completed acquisition of Zhejiang SolidGold
Pharmaceutical Co., Ltd. in 2014
• Established a Joint Venture in Dubai, the United
Arab Emirates in 2016
Corporate Milestones
7
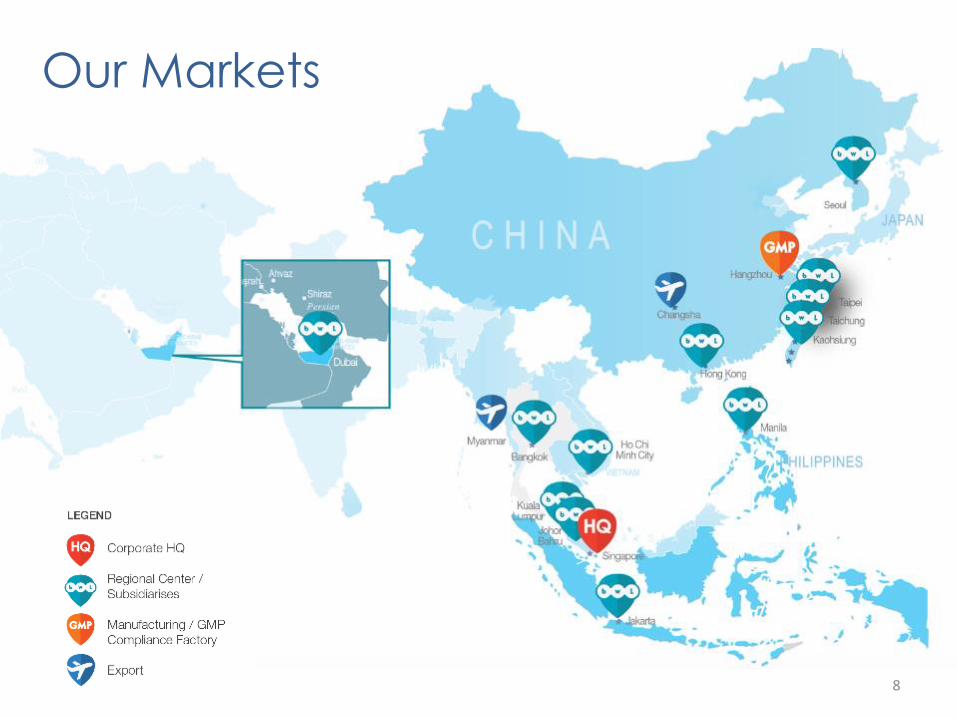
Our Markets
8
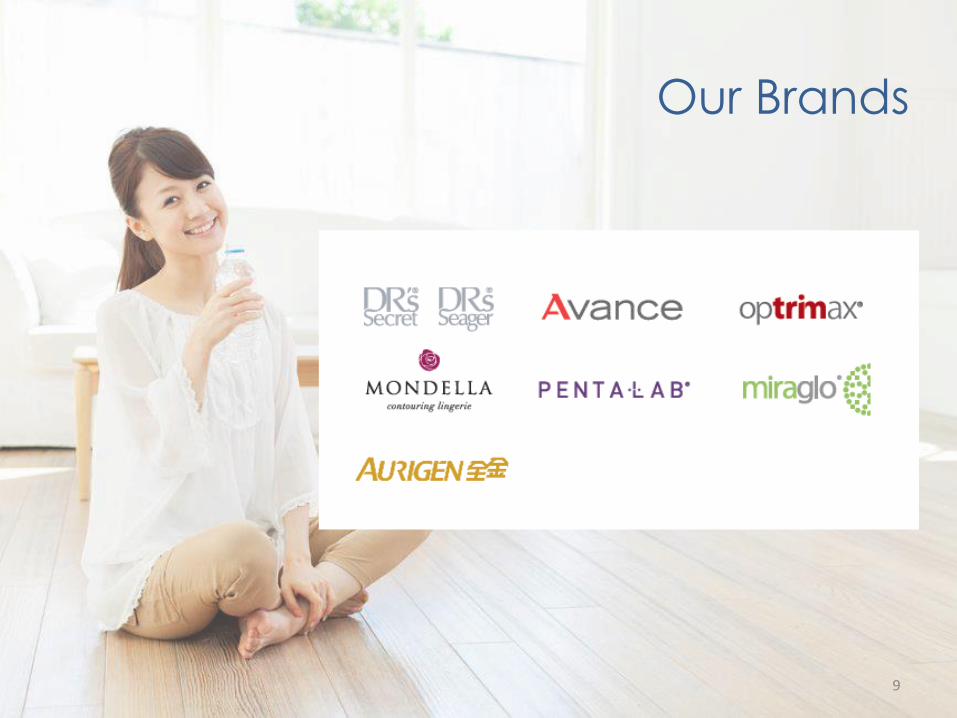
Our Brands
9

Our Brands
10
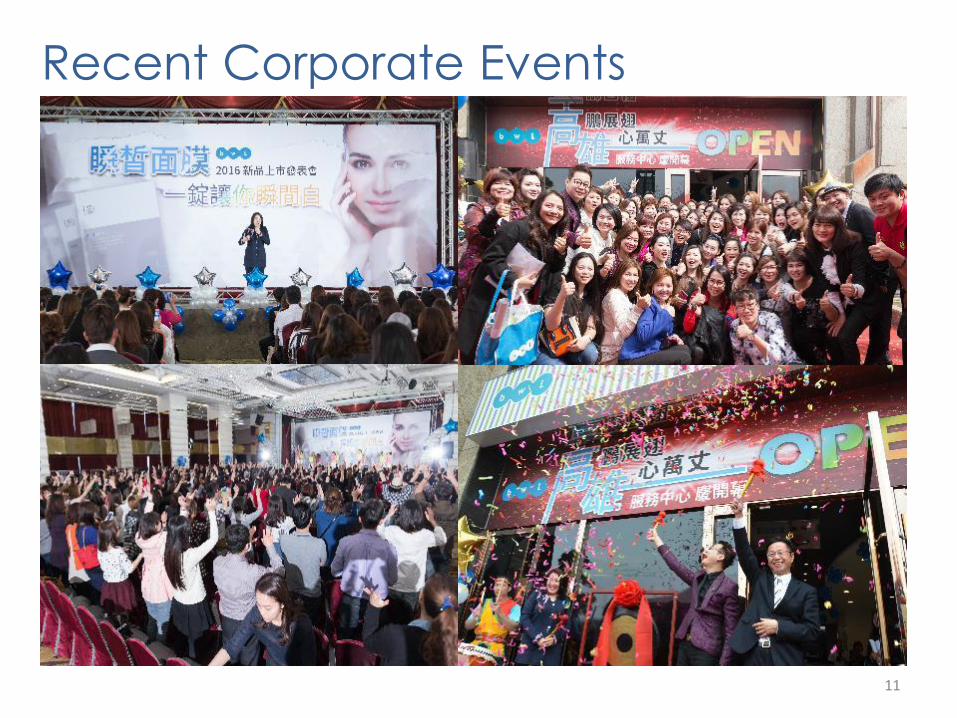
Recent Corporate Events
11

2009, 2008, 2015
Our Awards
12

Business
Model &
Financial
Highlights
13

• Marketing through extensive regional
network
• Sizeable member base with strong
growth ensures push of new and
existing products to drive top and
bottom line growth
• Unique system of training classes and
compensation scheme to effectively
engage members
• Member’s commission derived based on
sales
3rd Party
Manufacturing
Marketing
Tools
Product
Registration
Product Concept
Direct Selling
Business Model
14
Direct Selling Business

D
Transfer Price Transfer Price
(a fraction of
members’ price)
Members’ Price
Best World HQ
Subsidiary
D D D
D
D D D
vs Best World HQ
Agent
Direct Selling Export
15
Business Model Segments

0
50,000
100,000
150,000
200,000
250,000
300,000
350,000
400,000
450,000
2010 2011 2012 2013 2014 2015 1Q2016
Membership (2010-1Q2016)
Business Model
16
Membership Growth

Financial Highlights
Steady Revenue growth
• Gaining momentum in key markets
17
S$’(M)
9.0 12.8 13.5
35.2 8.8
18.3 21.0 9.2
19.2
26.2
14.0
25.0
40.9
0.0
20.0
40.0
60.0
80.0
100.0
120.0
2013 2014 2015 2016
Revenue

Financial Highlights
Stable financial margins
• Stable distribution and administrative expenses
• Highly scalable with little capex required as key costs are mainly related to commissions 18
41.0
75.3
101.6
14.3
28.2
36.4
17.7 22.6
27.2
0.0
20.0
40.0
60.0
80.0
100.0
120.0
2013 2014 2015
S$’(M)
Margins

Financial Highlights
19
Net cash position with negligible borrowings
As at 31 March 2016, Best World has S$46.7 million in cash and cash equivalents
Cash
31.5
39.2 42.9
0
10
20
30
40
50
S$’(M)

Financial Highlights
20
Dividend Policy
• At least 30% of profit after tax
Dividends
0.3
0.8
2
43% 43% 44%
30%
32%
34%
36%
38%
40%
42%
44%
46%
0
0.5
1
1.5
2
2.5
S$ Cents
2013 2015 2014

Strategy
& Outlook
21

Growth Opportunities in Key Markets
Taiwan China Indonesia
• Ranked among the Top 15
Direct Selling brands in
Taiwan in 2015 by the Fair
Trade Commission of the
Republic of China (中華民國公平交易委員會)
• The number one in Taiwan,
Amway, has a market
share of NT$11.7B
• Application for direct selling
license in China is in
progress – potential market
demand may increase in
multiple folds
• Laid the groundwork in
preparation for its direct
selling market through:
- Registering all of its
products
- An established network via
export agents
- Top leaders trained in
Taiwan will be forerunners in
China’s direct selling market
• Positive results underscore
new motivated leader
distributors that have been
acquired
• Continues to be an exciting
market for the Group’s
weight management
products
22

Continue to build on growth momentum in key markets through new product launches, services and opening of new regional centres
Explore inorganic growth opportunities to gain access to new markets, new distribution channels or gain exclusivity to new products/services
Tap into upstream value chain of business which are synergistic to ours
1
2
3
Growth Strategy

Thank You!
Q&A
24

Appendix
25

Revenue by Business Segmentation
Direct Selling 74.1%
Export 13.3%
Manufacturing/ Wholesale
12.6%
1Q2015
Direct Selling 69.4%
Export 27.9%
Manufacturing/Wholesale
2.7%
1Q2016
Direct Selling Export Manufacturing/Wholesale
26

Revenue by Region
Singapore 4.0%
China 30.0%
Taiwan, 57.4%
Indonesia 4.0%
Others 4.6%
1Q2016
Singapore China Taiwan Indonesia Others
Singapore 14.5%
China 22.9%
Taiwan 33.1%
Indonesia 3.5%
Others 26.0%
1Q2015
27

Revenue by Products
Skin Care 70%
Health Supplements
11%
Weight Management
16%
Others 3%
Skin Care Health Supplements
Weight Management Others
FY2015
Skin Care 74% Health
supplements 8%
Weight Management
11%
Others 7%
Skin Care Health Supplements
Weight Management Others
1Q2016
28
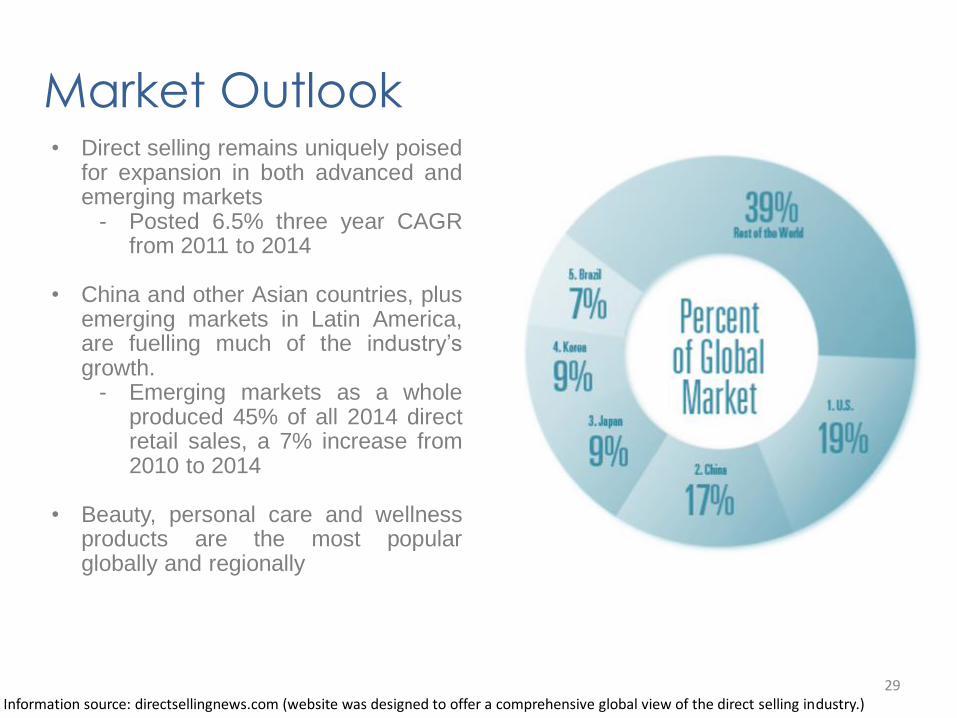
Market Outlook
Information source: directsellingnews.com (website was designed to offer a comprehensive global view of the direct selling industry.)
• Direct selling remains uniquely poised for expansion in both advanced and emerging markets
- Posted 6.5% three year CAGR from 2011 to 2014
• China and other Asian countries, plus
emerging markets in Latin America, are fuelling much of the industry’s growth.
- Emerging markets as a whole produced 45% of all 2014 direct retail sales, a 7% increase from 2010 to 2014
• Beauty, personal care and wellness
products are the most popular globally and regionally
29

Investment Merits
Value Proposition
Established network of distributors
Wide range of products backed by
good reviews
Growth Prospects
Growing revenue driven by momentum
in key markets; awaiting license from
China
Stable margins due to economies of
scale and operational efficiencies
Strong Balance Sheet
Healthy cash position with low
gearing
Dividend policy of at least 30% of net profit after tax
30

Taiwan Direct-Selling Market (2015) Rank Company Sales Figure
1 Amway NT$11.7B
2 Pro-Partner NT$7.1B
3 Melaleuca *NT$4.8B
4 Herbalife *NT$4.6B
5 Nu Skin *NT$4.5B
6 Market America *NT$4.3B
7 Total Swiss International Group NT$4.2B
8 Jeunesse Global NT$2.7B
9 E. Excel NT$2.3B
10 Avon Products *NT$2.1B
*= Estimated Information extracted from: Power Networking Monthly magazine 31

Best World Products Before VS. After
32

![BW 1Q Corporate Presentation [Read-Only] - listed companybestworld.listedcompany.com/.../BW_May052016_1Q_Corporate_Presentation.p… · Corporate Presentation . ... Arab Emirates](https://img.dokumen.tips/doc/110x75/5ec613b17de35c0582412e26/bw-1q-corporate-presentation-read-only-listed-corporate-presentation-arab.jpg)