Embed Size (px)
Citation preview

2
Corporate governance bodies of Nova KBM as of 30 June 2015
Management Board of Nova KBM
Robert Senica President
Sabina Župec Kranjc Member
Executive Directors of Nova KBM
Aleksander Batič
Jernej Močnik
Vlasta Brečko
Primož Britovšek
Darja Hota Mesarič
Supervisory Board of Nova KBM
Peter Kukovica Chair
Niko Samec Deputy Chair
Andrej Fatur Member
Peter Kavčič Member
Miha Glavič Member
Name of the parent bank: Nova Kreditna banka Maribor d.d. Short name of the parent bank: Nova KBM d.d. Registered office: Ulica Vita Kraigherja 4, 2505 Maribor BIC (SWIFT): KBMASI2X Reuters: KBMS IBAN: SI56 0100 0000 0400 014 Account No.: 01000-0000400014 Registration No.: 5860580 Entry No. in the register of companies kept by the Maribor District Court: 062/10924200 VAT ID No.: SI94314527 Share capital: €150,000,000

3
Moja naložba d.d.**45% ownership Total assets: €120.5 million Net profit: €158,000 ROAE: 4.5%; ROAA: 0.27%
KBM Infond d.o.o.72.73%1 ownership Total assets: €13.7 million Net profit: €862,000 ROAE: 16.37%; ROAA: 15.26%
MANAGEMENT OF FUNDS
AND PENSION SAVINGS Number of employees: 48 Share of Group assets: 3.0%
* ROAE and ROAA are presented on a pre-tax basis.
** Associated company. 1 The Group´s stake in the share capital of KBM Infond accounts for 72.00%. Due to KBM Infond holding a certain amount of its own shares, the Group´s stake in the capital of and voting rights
in KBM Infond equals 72.73%.
P
2P In accordance with IFRS 10, MB Finance is regarded as a special purpose vehicle controlled by Nova KBM. Nova KBM has neither voting rights nor an equity stake in this entity.
NOVA KBM GROUP Total assets: €4,230.9 million
Net profit: €12.3 million Number of employees: 1,707
ROAE*: 5.31% ROAA*: 0.77%
KBM Leasing d.o.o.(in liquidation) 100% ownership Total assets: €18.6 million Net profit: €951,000 ROAE: 13.14%; ROAA: 10.64%
Gorica Leasing d.o.o.(in liquidation) 100% ownership Total assets: €21.3 million Net loss: €1.1 million ROAE: (9.83%); ROAA: (9.56%)
KBM Leasing Hrvatska d.o.o. (in liquidation) 100% ownership Total assets: €12.8 million Net loss: €8.9 million ROAE: negative average capital ROAA: (71.57%)
KBM Invest d.o.o.100% ownership Total assets: €10.7 million Net profit: €4,000 ROAE: 0.19% ROAA: 0.07%
M-PAY d.o.o.50% ownership Total assets: €229,000 Net profit: €5,000 ROAE: 5.44%; ROAA: 5.43%
LEASING, REAL ESTATE AND OTHER SERVICES Number of employees: 29 Share of Group assets: 1.4%
MB Finance B.V.0.00%2 ownership
Nova KBM d.d. Total assets: €3,540.0 million Net profit: €22.5 million ROAE: 8.99%; ROAA: 1.47%
PBS d.d.99.12% ownership Total assets: €687.8 million Net profit: €746,000 ROAE: 2.96%; ROAA: 0.21%
Adria Abwicklungs GmbH in Liqu. 100% ownership
Total assets: €15.5 million Net loss: €2.4 million
BANKING Number of employees: 1,630 Share of Group assets: 95.6%
KBM BANKA a.d. 89.53% ownership Total assets: €71.8 million Net loss: €958,000 ROAE: (13.36%); ROAA: (2.53%)

4
Contents INTERIM REPORT OF THE NOVA KBM GROUP: JANUARY – JUNE 2015
KEY PERFORMANCE INDICATORS OF THE NOVA KBM GROUP AND NOVA KBM ...................................... 5 SIGNIFICANT EVENTS DURING THE FIRST HALF OF 2015 ............................................................................. 6 EVENTS AFTER THE END OF THE REPORTING PERIOD................................................................................. 8 CHANGES IN THE SUPERVISORY BOARD OF NOVA KBM.............................................................................. 9 STATEMENT OF MANAGEMENT´S RESPONSIBILITIES................................................................................... 9 PROFILE OF THE NOVA KBM GROUP AND NOVA KBM ................................................................................ 10 SHAREHOLDER STRUCTURE OF NOVA KBM AND INFORMATION ABOUT ITS SHARES............................... 11 OPERATING RESULTS OF THE NOVA KBM GROUP...................................................................................... 12 FINANCIAL POSITION OF THE NOVA KBM GROUP ....................................................................................... 14 INTERIM FINANCIAL REPORT OF THE NOVA KBM GROUP AND NOVA KBM............................................. 15
Interim Income Statement.................................................................................................................................. 17
Interim Statement of Other Comprehensive Income ....................................................................................... 20
Interim Statement of Financial Position ........................................................................................................... 23
Interim Statement of Cash Flows...................................................................................................................... 24
Interim Statement of Changes in Equity........................................................................................................... 26
Notes to the financial statements ..................................................................................................................... 28
FINANCIAL CALENDAR OF NOVA KBM FOR THE REST OF 2015................................................................. 66

5
Key performance indicators of the Nova KBM Group and Nova KBM
Nova KBM Group Nova KBM
2015 2014 Ind. 2015 2014 Ind.
Statement of financial position (€000) 30.6. 31.12. 30.6. 31.12.
Total assets 4,230,898 4,369,010 97 3,540,025 3,608,215 98
Total deposits from the non-banking sector 3,043,663 3,076,875 99 2,471,692 2,466,097 100
Total loans and advances to the non-banking sector
1,830,255 1,920,875 95 1,533,336 1,593,294 96
Total equity 615,465 616,357 100 591,737 580,347 102
Income statement (€000) 1.1. – 30.6. 1.1. – 30.6. 1.1. – 30.6. 1.1. – 30.6.
Net interest income 49,967 53,018 94 40,407 44,087 92
Net fee and commission income 27,600 28,393 97 20,213 21,066 96
Net gains from trading in securities and foreign exchange
7,014 13,190 53 6,748 10,351 65
Other income/(expenses) 180 (1,784) 290 (2,147)
Operating costs (47,011) (50,008) 94 (34,290) (35,470) 97
Impairment losses and provisions (21,416) (18,718) 114 (7,445) (20,080) 37
Profit before tax from continuing and discontinued operations
16,334 24,091 68 25,923 17,807 146
Net profit for the reporting period 12,276 20,876 59 22,465 14,822 152
Ratios (%) 30.6. 31.12. 30.6. 31.12.
Interest margin 2.35 2.38 2.29 2.48
Total capital adequacy 24.08 23.30 26.97 25.75
Tier 1 capital adequacy 24.08 23.30 26.97 25.75
Common Equity Tier 1 capital adequacy 24.08 23.30 26.97 25.75
ROAA before tax 0.77 0.40 1.47 0.82
ROAE before tax 5.31 3.07 8.99 5.57
Operating costs/Average total assets 2.21 2.23 1.94 1.96
Operating costs/Income (CIR) 55.46 62.14 50.68 50.05
Net customer loans/Customer deposits (LTD) 60.13 62.43 62.04 64.61
Ratings (long-term) 30.6. 31.12.
B3
(Moody´s) Caa1
(Moody´s)
B+ (Fitch) BB- (Fitch)

6
Significant events during the first half of 2015
January
On 27 January, the PBS Supervisory Board appointed Marko Novak as the new President of the PBS Management Board, subject to approval of the Bank of Slovenia. Aleksander Jerenko was appointed as a substitute member of the Management Board.
On 28 January, Vesna Užnik Đorić, a member of the KBM Banka Executive Board, ended her employment with KBM Banka.
February
On 3 February, the National Bank of Serbia consented to the appointment of Nikola Fržović as a member of the KBM Banka Executive Board.
On 27 February, the Nova KBM Supervisory Board took a decision to recall Aleš Hauc from the position of the President of the Nova KBM Management Board, and appointed Robert Senica as the new President. Sabina Župec Kranjc remained on the Management Board as a member.
Nova KBM extended its offering of payment cards by introducing contactless payment cards, thereby enabling its customers to make payments in a simpler and faster manner, and to benefit from other advantages of using these payment cards.
In an assessment conducted by the Moje Finance magazine, two of the mutual funds managed by KBM Infond were declared as the best mutual funds in a total of three different categories, while as many as five KBM Infond fund managers were ranked among the best in their profession.
March
The competent authorities approved a document outlining the organisational activities to be carried out to accomplish the envisaged integration of PBS´s operations into those of Nova KBM.
On 17 March, Aleš Hauc stepped down as the Chair of the PBS Supervisory Board.
On 23 March, Adria Bank returned to the Austrian Financial Market Authority (FMA) its licence for providing banking services.
Also on 23 March, Damijan Podlesek was appointed as a new member of the KBM Invest Supervisory Board.

7
As part of a socially responsible campaign called 'Donate a Book, Donate a Future', Nova KBM handed over to the Friends of Youth Association of Slovenia more than 2,200 books it had collected from its employees and customers.
At the Slovene Advertising Festival, Nova KBM´s trademark 'Sveta Vladar' (Ruler of the World) was awarded the main prize for the best digital marketing campaign, and the silver EFFIE prize for marketing and communication effectiveness.
PBS added a car insurance service to the range of insurance brokerage services it provides. In addition, it offered its corporate customers the Activa Visa Business Electron debit card, and participated in the installation of the first bill payment machine of Pošta Slovenija (Post of Slovenia) which makes it possible for money order payments to be settled in cash.
KBM Infond took over the management of the Perspektiva Umbrella Fund with six sub-funds.
April
Nova KBM offered its customers new MasterCard and Visa charge cards that allow payments in instalments and NFC contactless payments, and the design of which may be customized by customers themselves.
On 1 April, Marija Brenk became a member of the PBS Management Board. Mojca Mak remained on the PBS Management Board as a substitute member.
On 7 April, Sabina Župec Kranjc, who had until then been acting as a member of the PBS Supervisory Board, was appointed as its Chair, while Boris Novak was appointed her deputy.
On 30 April, the Shareholders´ Meeting of KBM Leasing Hrvatska made the decision to initiate the liquidation of the company.
May
On 19 May, Fitch Ratings downgraded Nova KBM´s Long-Term Issuer Default Rating (IDR) to 'B+' from 'BB-', with the rating being assigned a stable outlook, and raised its Viability Rating by one notch, to 'b+' from 'b'. Nova KBM´s Support Rating was downgraded to '5' from '3', while the Support Rating Floor was changed to 'No Floor' from 'BB-'.
PBS added ECO consumer and ECO housing loans to its offering of retail loans.
Adria Bank changed its legal form from a joint stock company to a limited liability company (GmbH) named Adria Abwicklungs.
June
On 30 June, the Slovene Sovereign Holding, Apollo Global Management LLC and the European Bank for Reconstruction and Development signed the agreement concerning the sale of a 100% shareholding of the Republic of Slovenia in Nova KBM.

8
Moody´s Investors Service upgraded Nova KBM´s long-term local and foreign-currency deposit ratings to 'B3' from 'Caa1', and at the same time raised the outlook on the ratings to 'positive' from 'stable'. Moody´s also upgraded Nova KBM´s baseline credit assessment (BCA) and adjusted BCA to 'caa1' from 'caa2'. Short-term local and foreign-currency deposit ratings were affirmed at 'Not Prime'.
For its professional execution of commercial payments sent through Deutsche Bank, Nova KBM received the 'Deutsche Bank´s 2014 Gold Straight-through Processing Excellence Award/EUR STP Excellence Award', thus being ranked among the most effective banks in the payment service business.
At DIGGIT, a Slovene conference on digital communication, Nova KBM received recognition for its innovative advertising campaign called 'Zlatko – Živim lajf' (Zlatko – Living Life).
PBS extended its offering by introducing new types of personal accounts, in addition to creating packages of products customized to the needs of individual customer segments.
On 18 June, Natalija Muršič Tomažič started her term of office as a substitute member of the PBS Management Board, replacing in that position Mojca Mak, whose term of office expired on the same day.
Also on 18 June, the Shareholders´ Meeting of Adria Abwicklungs made the decision to initiate the liquidation of the company.
Events after the end of the reporting period The liquidation proceedings against KBM Leasing and Gorica Leasing had not been completed by 31 July 2015, as originally planned, because some of the activities that the liquidators intended to carry out as part of the business closing process were still in progress.

9
Changes in the Supervisory Board of Nova KBM There were no changes in the composition of the Nova KBM Supervisory Board in the first six months of 2015.
Statement of management´s responsibilities
(pursuant to Article 113 of the Financial Instruments Market Act) By signing this statement, the Nova KBM Management Board confirms to the best of its knowledge that:
– the financial report summary has been drawn up in accordance with the appropriate
accounting framework of reporting and that it provides a true and fair view of the assets, liabilities, the financial position and the profit and loss of Nova KBM and other companies included in the consolidation as a whole, and
– the interim business report, which has been drawn up in accordance with the relevant
accounting standard, provides a fair view of significant transactions with related persons.
Maribor, 21 August 2015 Management Board of Nova KBM d.d.
Sabina Župec Kranjc Robert Senica Member President

10
Profile of the Nova KBM Group and Nova KBM Nova KBM d.d. (herein also referred to as 'Nova KBM' or the 'Bank') is the parent company of the Nova KBM Group (herein also referred to as the 'Group') which, as of 30 June 2015, comprised the parent company and 10 subsidiary companies. Nova KBM is a commercial bank with a tradition of understanding and supporting its retail and corporate customers to whom it provides standard banking products. Its registered office is at Ulica Vita Kraigherja 4, 2505 Maribor, Republic of Slovenia.
Nova KBM is obliged to prepare consolidated financial statements.
The Group comprises the parent bank and its subsidiary companies.
Company Position in the Group Group´s voting rights in
the company (%)
Registered office (country of
incorporation)
Nova Kreditna banka Maribor d.d. parent bank Maribor, Slovenia
Poštna banka Slovenije d.d. subsidiary bank 99.12 Maribor, Slovenia
Adria Abwicklungs GmbH in Liqu. subsidiary company 100.00 Vienna, Austria
KBM Banka a.d. subsidiary bank 89.53 Kragujevac, Serbia
KBM Infond d.o.o. subsidiary company 72.731 Maribor, Slovenia
KBM Leasing d.o.o. (in liquidation) subsidiary company 100.00 Maribor, Slovenia
KBM Invest d.o.o. subsidiary company 100.00 Maribor, Slovenia
Gorica Leasing d.o.o. (in liquidation) subsidiary company 100.00 Maribor, Slovenia
M-PAY d.o.o. subsidiary company 50.00 Maribor, Slovenia
KBM Leasing Hrvatska d.o.o. (in liquidation)
subsidiary company 100.00 Zagreb, Croatia
MB Finance B.V. subsidiary company 00.002 Netherlands
1 The Group´s stake in the share capital of KBM Infond accounts for 72.00%. Due to KBM Infond holding a certain amount of its own shares, the
Group´s stake in the capital of and voting rights in KBM Infond equals 72.73%.
2 In accordance with IFRS 10, MB Finance is regarded as a special purpose vehicle controlled by Nova KBM. Nova KBM has neither voting rights
nor an equity stake in this entity, and the operations of this entity are considered to be immaterial to the Group.

11
Key performance indicators of individual Group companies for the six-month period ended 30 June 2015
COMPANY Number of employees 30.6.2015
Net profit/(loss)
(€000)
Total assets (€000)
ROAE before tax
(%)
ROAA before tax
(%) Nova KBM d.d. 1,120 22,465 3,540,025 8.99 1.47Poštna banka Slovenije d.d. 230 746 687,846 2.96 0.21
Adria Abwicklungs GmbH in Liqu. 14 (2,403) 15,471 * *KBM Banka a.d. 266 (958) 71,835 (13.36) (2.53)
KBM Infond d.o.o. 34 862 13,726 16.37 15.26
KBM Leasing d.o.o. (in liquidation) 5 951 18,553 13.14 10.64KBM Invest d.o.o. 8 4 10,698 0.19 0.07Gorica Leasing d.o.o. (in liquidation) 9 (1,082) 21,307 (9.83) (9.56)
M-Pay d.o.o. 0 5 229 5.44 5.43KBM Leasing Hrvatska d.o.o. (in liquidation) 7 (8,925) 12,845 ** (71.57)
Moja naložba d.d. 14 158 120,540 4.50 0.27
* The performance ratios of Adria Abwicklungs GmbH (in liquidation), a company into which Adria Bank was legally transformed after it had returned its licence for providing banking services and transferred its assets to Nova KBM, are not presented because they are irrelevant. ** Not calculated due to the company having negative average capital.
Shareholder structure of Nova KBM and information about its shares As of 30 June 2015, the share capital of Nova KBM totalled €150,000,000 and was split into 10,000,000 ordinary no-par-value shares, all of which were held by the Republic of Slovenia. Nova KBM shares, with the ticker symbol KBMS, are not quoted on a regulated stock market.
Nova KBM has issued only one class of shares which are all freely transferable and bear the same rights. Each ordinary share entitles its holder to one vote at the Bank Shareholders´ Meeting. The rights of the holders of ordinary shares are set out in the relevant legislation of the Republic of Slovenia.
Information about shares
Nova KBM Group Nova KBM
30.6.15 31.3.15 31.12.14 31.12.13 30.6.15 31.3.15 31.12.14 31.12.13
Book value per share3 (€) 61.25 63.31 61.34 56.67 59.17 59.75 58.03 51.77
Net earnings/(loss) per share4 (€) 2.40 4.84 2.19 (63.05) 4.49 4.76 3.59 (65.65)
3 Book value per share on the last day of the reporting period is calculated as the ratio between the Bank´s total equity (for the Group: equity attributable to owners of the parent) and the total number of Bank shares outstanding at the end of the reporting period.
4 Net earnings or loss per share is calculated as the ratio between the Bank´s annualised net profit or loss (for the Group: net profit or loss attributable to owners of the parent) and the weighted average number of Bank shares in the period. The total number of KBMS shares outstanding at the end of the reporting period was taken into account in the calculation of the 2013 net loss and the 2014 net earnings per share.
12
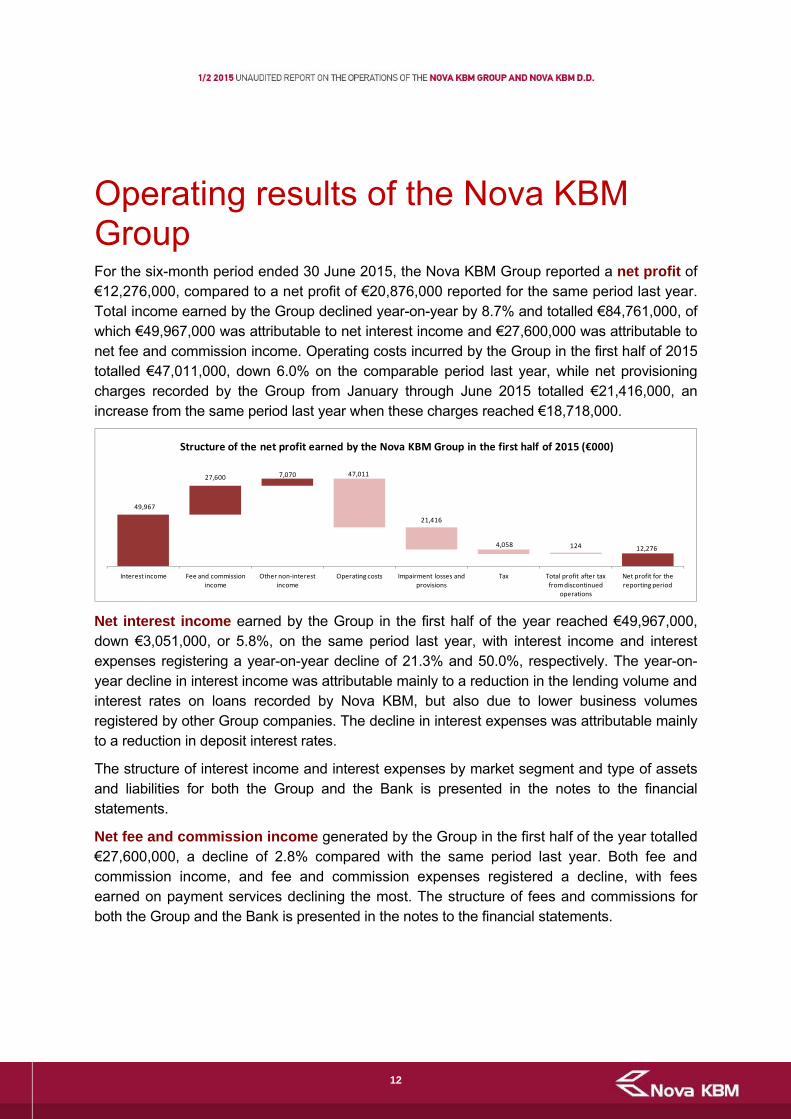
Operating results of the Nova KBM Group For the six-month period ended 30 June 2015, the Nova KBM Group reported a net profit of €12,276,000, compared to a net profit of €20,876,000 reported for the same period last year. Total income earned by the Group declined year-on-year by 8.7% and totalled €84,761,000, of which €49,967,000 was attributable to net interest income and €27,600,000 was attributable to net fee and commission income. Operating costs incurred by the Group in the first half of 2015 totalled €47,011,000, down 6.0% on the comparable period last year, while net provisioning charges recorded by the Group from January through June 2015 totalled €21,416,000, an increase from the same period last year when these charges reached €18,718,000.
49,967
27,600 7,070 47,011
21,416
4,058 124 12,276
Interest income Fee and commission income
Other non‐interest income
Operating costs Impairment losses and provisions
Tax Total profit after tax from discontinued
operations
Net profit for the reporting period
Structure of the net profit earned by the Nova KBM Group in the first half of 2015 (€000)
Net interest income earned by the Group in the first half of the year reached €49,967,000, down €3,051,000, or 5.8%, on the same period last year, with interest income and interest expenses registering a year-on-year decline of 21.3% and 50.0%, respectively. The year-on-year decline in interest income was attributable mainly to a reduction in the lending volume and interest rates on loans recorded by Nova KBM, but also due to lower business volumes registered by other Group companies. The decline in interest expenses was attributable mainly to a reduction in deposit interest rates.
The structure of interest income and interest expenses by market segment and type of assets and liabilities for both the Group and the Bank is presented in the notes to the financial statements.
Net fee and commission income generated by the Group in the first half of the year totalled €27,600,000, a decline of 2.8% compared with the same period last year. Both fee and commission income, and fee and commission expenses registered a decline, with fees earned on payment services declining the most. The structure of fees and commissions for both the Group and the Bank is presented in the notes to the financial statements.

13
Other non-interest income5 was €7,194,000, down from €11,406,000 reported for the same period last year.
Operating costs (administration costs, including depreciation and amortisation) incurred by the Group in the first half of the year totalled €47,011,000, a decline of 6.0% compared with the same period last year, with Group banks registering the largest drop. As regards the composition of operating costs, staff costs accounted for 48.6% of the total operating costs, followed by general and administrative costs (37.5%), and depreciation and amortisation (13.9%). The Group´s cost-to-income ratio reached 55.46% in the first half of the year.
The Group´s net provisioning charges totalled €21,416,000 in the first half of the year, compared to €18,718,000 reported for the same period last year. The structure of provisions and impairment losses by type of assets for both the Group and the Bank is displayed in the notes to the financial statements.
The Nova KBM Group expects to end the financial year of 2015 with a profit.
5 Other non-interest income includes: dividend income; realised gains or losses on financial assets and liabilities not measured at fair value
through profit or loss; net gains or losses on financial assets and liabilities held for trading; gains or losses on financial assets and liabilities
designated at fair value through profit or loss; net exchange rate differences; net gains or losses on derecognition of assets other than non-current
assets held for sale; other net operating income or loss; share of profits or losses of associates and joint ventures accounted for using the equity
method; net gains or losses from non-current assets held for sale and liabilities associated therewith; and total profit or loss after tax from
discontinued operations.

14
Financial position of the Nova KBM Group At the end of June 2015, the Group´s total assets amounted to €4,230,898,000, down 3.2%, or €138,112,000, on the end of 2014. The decline in total assets was in line with the requirements of the European Commission.
The decline in the balance of cash funds was largely attributable to a reduction in the volume of deposits held by Nova KBM with the central bank and commercial banks.
The decline in the volume of loans in the first half of the year was mostly the result of a reduction in loans outstanding to the non-banking sector. This decline was partially offset by a marginal increase in loans outstanding to banks.
The increase in the balance of the Group´s financial assets registered in the first half of the year was largely attributable to an increase in the portfolio of available-for-sale financial assets held by Nova KBM.
The decline in deposits and loans from customers was chiefly attributable to a reduction in current and non-current deposits placed with Group banks.
As of 30 June 2015, the Group´s total equity amounted to €615,465,000, a decline of 0.1% from the end of last year, with its total capital adequacy ratio standing at 24.08%. The composition of the Group´s equity is presented in the notes to the financial statements.
As a result of a decline in both net loans outstanding to the non-banking sector and deposits from the non-banking sector, the Group´s loan-to-deposit ratio (net LTD ratio) contracted in the first half of the year by 2.3 percentage points, to 60.13% at the end of June 2015.
The Group is consistently implementing its restructuring programme and is scaling down its business volumes and risk-weighted assets in accordance with the commitments it has given to the European Commission.
4,369,010 (106,272)
(54,723)43,647 (20,764) 4,230,898
Total assets 31.12.2014
Cash in hand Loans and advances Financial assets Other assets Total assets 30.6.2015
Movements in the Nova KBM Group´s assets in the first half of 2015(€000)
4,369,010 (33,212)
(75,167)
(28,841)
(892) 4,230,898
Total liabilities and equity
31.12.2014
Deposits and loans from customers
Deposits and loans from banks, including
central banks
Other liabilities Equity Total liabilities and equity
30.6.2015
Movements in the Nova KBM Group´s liabilities and equity in the first half of 2015
(€000)

INTERIM FINANCIAL REPORT OF THE
NOVA KBM GROUP AND
NOVA KBM d.d.
JANUARY – JUNE 2015
��
15

FINANCIAL STATEMENTS
NOVA KBM GROUP
AND NOVA KBM d.d.
��
16

��
17
1 Interim Income Statement €000
Nova KBM Group Nova KBM d.d.
ITEM DESCRIPTION Notes 1.1.–
30.6.20151.1.–
30.6.2014 1.1.–
30.6.2015 1.1.–
30.6.2014
Interest income 8 64,298 81,688 53,224 68,417
Interest expenses 8 (14,331) (28,670) (12,817) (24,330)
Net interest income 8 49,967 53,018 40,407 44,087
Dividend income 9 772 64 1,248 488
Fee and commission income 10 40,808 42,963 21,983 22,909
Fee and commission expenses 10 (13,208) (14,570) (1,770) (1,843)
Net fee and commission income 10 27,600 28,393 20,213 21,066
Realised gains on financial assets and liabilities not measured at fair value through profit or loss
11 7,095 8,440 6,938 6,024
Net (losses) on financial assets and liabilities held for trading 12 (7,136) (645) (7,204) (971)
Net gains/(losses) on financial assets and liabilities designated at fair value through profit or loss
13 (2,059) 4,749 (2,059) 4,748
Net exchange rate differences 14 9,114 646 9,073 550
Net gains/(losses) on derecognition of assets other than non-current assets held for sale
- 53 (91) 5 44
Other net operating (loss) - (900) (1,521) (1,023) (2,743)
Administration costs 15 (40,483) (42,602) (29,420) (29,802)
Depreciation and amortisation - (6,528) (7,406) (4,870) (5,668)
Provisions 16 4,779 3,571 4,080 3,029
Impairment losses 17 (26,195) (22,289) (11,525) (23,109)
Share of profits of associates and joint ventures accounted for using the equity method
- 71 101 0 0
Total profit from non-current assets and disposal groups classified as held for sale
- 60 64 60 64
PROFIT FROM CONTINUING OPERATIONS - 16,210 24,492 25,923 17,807
Tax (expense) related to profit or loss from continuing operations
18 (4,058) (3,215) (3,458) (2,985)
NET PROFIT FROM CONTINUING OPERATIONS - 12,152 21,277 22,465 14,822
Total profit/(loss) after tax from discontinued operations - 124 (401) 0 0
NET PROFIT FOR THE REPORTING PERIOD - 12,276 20,876 22,465 14,822
a) Attributable to owners of the parent - 12,014 18,170 22,465 14,822
– continuing operations - 11,908 18,514 22,465 14,822
– discontinued operations - 106 (344) 0 0
b) Attributable to non-controlling interests - 262 2,706 0 0
– continuing operations - 244 2,763 0 0
– discontinued operations - 18 (57) 0 0
Basic earnings per share (€) - 1.20 1.82 2.25 1.48
Diluted earnings per share (€) - 1.20 1.82 2.25 1.48
The accompanying notes form an integral part of these financial statements.

1.1 Interim Income Statement – presented by quarter
€000 Nova KBM Group - 2015 - - - 2014 ITEM DESCRIPTION Q2 Q1 Q4 Q3 Q2 Q1
Interest income 31,230 33,068 39,159 40,408 39,862 41,826
Interest expenses (6,491) (7,840) (10,143) (11,716) (13,570) (15,100)
Net interest income 24,739 25,228 29,016 28,692 26,292 26,726
Dividend income 772 0 29 953 64 0
Fee and commission income 20,796 20,012 21,366 21,114 22,128 20,835
Fee and commission expenses (6,592) (6,616) (7,708) (7,206) (7,396) (7,174)
Net fee and commission income 14,204 13,396 13,658 13,908 14,732 13,661
Realised gains on financial assets and liabilities not measured at fair value through profit or loss 5,146 1,949 6,188 472 5,790 2,650 Net gains/(losses) on financial assets and liabilities held for trading 347 (7,483) 350 (601) 231 (876) Net gains/(losses) on financial assets and liabilities designated at fair value through profit or loss (2,155) 96 (1,829) 2,798 1,053 3,696
Net exchange rate differences 319 8,795 118 448 273 373
Net gains/(losses) on derecognition of assets other than non-current assets held for sale 31 22 (160) 412 (81) (10)
Other net operating (loss) (460) (440) (504) (984) (799) (722)
Administration costs (20,470) (20,013) (24,945) (21,599) (21,862) (20,740)
Depreciation and amortisation (3,213) (3,315) (3,547) (3,509) (3,656) (3,750)
Provisions 4,783 (4) 10,430 1,496 2,568 1,003
Impairment losses (21,132) (5,063) (22,273) (15,449) (16,819) (5,470)
Share of profits/(losses) of associates and joint ventures accounted for using the equity method (9) 80 (13) 66 66 35 Total profit/(loss) from non-current assets and disposal groups classified as held for sale (1) 61 (323) 174 0 64 PROFIT FROM CONTINUING OPERATIONS 2,901 13,309 6,195 7,277 7,852 16,640 Tax (expense)/income related to profit or loss from continuing operations (3,023) (1,035) 9,243 (1,604) (3,009) (206) NET PROFIT/(LOSS) FROM CONTINUING OPERATIONS (122) 12,274 15,438 5,673 4,843 16,434 Total profit/(loss) after tax from discontinued operations 135 (11) (18,581) (125) (331) (70) NET PROFIT/(LOSS) FOR THE REPORTING PERIOD 13 12,263 (3,143) 5,548 4,512 16,364 a) Attributable to owners of the parent (96) 12,110 (1,729) 5,457 4,367 13,803 – continuing operations (225) 12,133 15,381 5,563 4,656 13,858 – discontinued operations 129 (23) (17,110) (106) (289) (55) b) Attributable to non-controlling interests 109 153 (1,414) 91 145 2,561 – continuing operations 103 141 57 110 187 2,576 – discontinued operations 6 12 (1,471) (19) (42) (15)
Basic earnings/(loss) per share (€) (0.01) 1.21 (0.17) 0.55 0.44 1.38
Diluted earnings/(loss) per share (€) (0.01) 1.21 (0.17) 0.55 0.44 1.38
18
19
€000
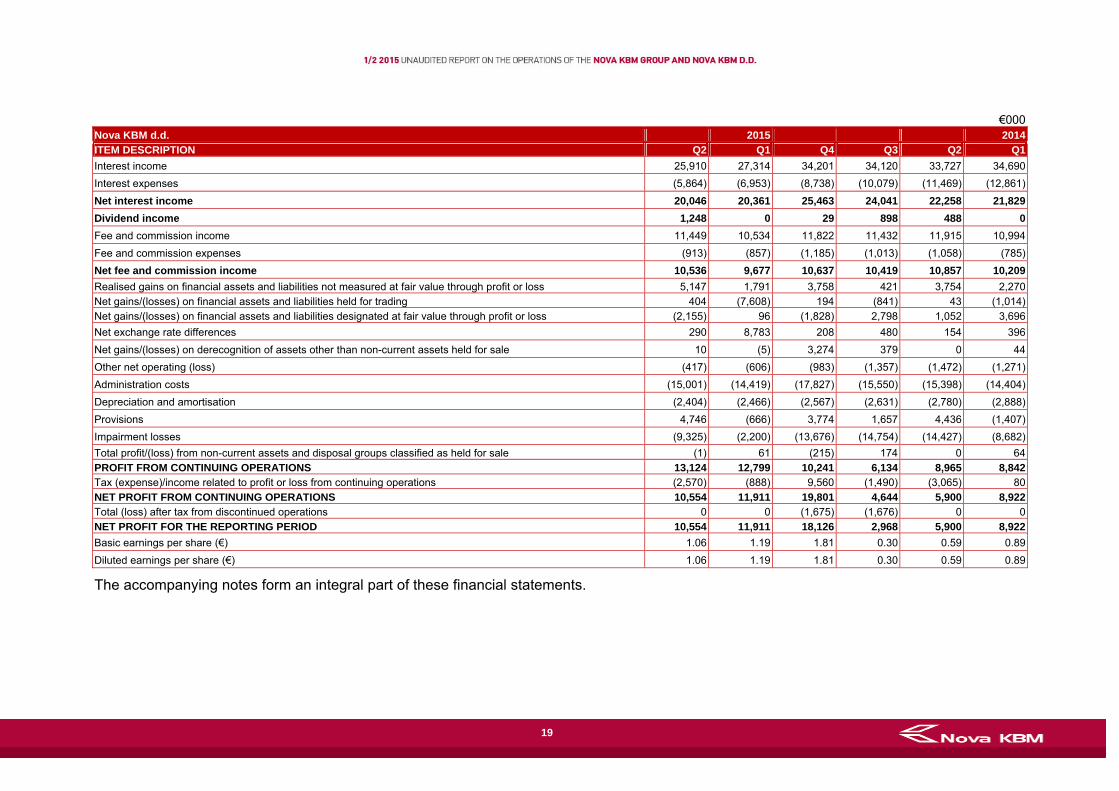
Nova KBM d.d. - 2015 - - - 2014 ITEM DESCRIPTION Q2 Q1 Q4 Q3 Q2 Q1
Interest income 25,910 27,314 34,201 34,120 33,727 34,690
Interest expenses (5,864) (6,953) (8,738) (10,079) (11,469) (12,861)
Net interest income 20,046 20,361 25,463 24,041 22,258 21,829
Dividend income 1,248 0 29 898 488 0
Fee and commission income 11,449 10,534 11,822 11,432 11,915 10,994
Fee and commission expenses (913) (857) (1,185) (1,013) (1,058) (785)
Net fee and commission income 10,536 9,677 10,637 10,419 10,857 10,209
Realised gains on financial assets and liabilities not measured at fair value through profit or loss 5,147 1,791 3,758 421 3,754 2,270 Net gains/(losses) on financial assets and liabilities held for trading 404 (7,608) 194 (841) 43 (1,014) Net gains/(losses) on financial assets and liabilities designated at fair value through profit or loss (2,155) 96 (1,828) 2,798 1,052 3,696
Net exchange rate differences 290 8,783 208 480 154 396
Net gains/(losses) on derecognition of assets other than non-current assets held for sale 10 (5) 3,274 379 0 44
Other net operating (loss) (417) (606) (983) (1,357) (1,472) (1,271)
Administration costs (15,001) (14,419) (17,827) (15,550) (15,398) (14,404)
Depreciation and amortisation (2,404) (2,466) (2,567) (2,631) (2,780) (2,888)
Provisions 4,746 (666) 3,774 1,657 4,436 (1,407)
Impairment losses (9,325) (2,200) (13,676) (14,754) (14,427) (8,682)
Total profit/(loss) from non-current assets and disposal groups classified as held for sale (1) 61 (215) 174 0 64 PROFIT FROM CONTINUING OPERATIONS 13,124 12,799 10,241 6,134 8,965 8,842 Tax (expense)/income related to profit or loss from continuing operations (2,570) (888) 9,560 (1,490) (3,065) 80 NET PROFIT FROM CONTINUING OPERATIONS 10,554 11,911 19,801 4,644 5,900 8,922 Total (loss) after tax from discontinued operations 0 0 (1,675) (1,676) 0 0 NET PROFIT FOR THE REPORTING PERIOD 10,554 11,911 18,126 2,968 5,900 8,922
Basic earnings per share (€) 1.06 1.19 1.81 0.30 0.59 0.89
Diluted earnings per share (€) 1.06 1.19 1.81 0.30 0.59 0.89
The accompanying notes form an integral part of these financial statements.

20
20
20
2 Interim Statement of Other Comprehensive Income €000
Nova KBM Group Nova KBM d.d.
ITEM DESCRIPTION 1.1.–
30.6.20151.1.–
30.6.20141.1.–
30.6.2015 1.1.–
30.6.2014
NET PROFIT FOR THE REPORTING PERIOD AFTER TAX 12,276 20,876 22,465 14,822
OTHER COMPREHENSIVE INCOME/(LOSS) AFTER TAX (12,989) 30,656 (11,078) 23,256
ITEMS THAT MAY BE RECLASSIFIED TO PROFIT OR LOSS (12,989) 30,656 (11,078) 23,256
Foreign currency translation (58) (53) 0 0
– translation (losses) taken to equity (58) (53) 0 0
Available-for-sale financial assets (15,575) 37,244 (13,347) 28,020
– valuation gains/(losses) taken to equity (15,575) 37,254 (13,347) 28,020
– transferred to profit or loss 0 (10) 0 0
Share of (losses) of associates and joint ventures accounted for using the equity method
(16) (46) 0 0
Net profit/(loss) related to discontinued operations 12 (143) 0 0
Income tax relating to items that may be reclassified to profit or loss
2,648 (6,346) 2,269 (4,764)
TOTAL COMPREHENSIVE INCOME/(LOSS) FOR THE REPORTING PERIOD AFTER TAX (713) 51,532 11,387 38,078
a) Attributable to owners of the parent (986) 48,712 11,387 38,078
– continuing operations (1,103) 49,184 11,387 38,078
– discontinued operations 117 (472) 0 0
b) Attributable to non-controlling interests 273 2,820 0 0
– continuing operations 254 2,892 0 0
– discontinued operations 19 (72) 0 0
The accompanying notes form an integral part of these financial statements.

2.1 Interim Statement of Other Comprehensive Income – presented by quarter
€000 Nova KBM Group 2015 - - - 2014
ITEM DESCRIPTION Q2 Q1 Q4 Q3 Q2 Q1
NET PROFIT/(LOSS) FOR THE REPORTING PERIOD AFTER TAX 13 12,263 (3,143) 5,548 4,512 16,364
OTHER COMPREHENSIVE INCOME/(LOSS) AFTER TAX (20,654) 7,665 (4,546) 7,098 7,480 23,176
ITEMS THAT WILL NOT BE RECLASSIFIED TO PROFIT OR LOSS 0 0 (819) 0 0 0
Actuarial net (losses) on defined benefit pension plans 0 0 (858) 0 0 0
Net (losses) related to non-current assets and disposal groups classified as held for sale 0 0 (6) 0 0 0
Income tax relating to items that will not be reclassified to profit or loss 0 0 45 0 0 0
ITEMS THAT MAY BE RECLASSIFIED TO PROFIT OR LOSS (20,654) 7,665 (3,727) 7,098 7,480 23,176
Foreign currency translation (58) 0 (4) 9 (67) 14
– valuation gains/(losses) taken to equity (58) 0 (4) 9 (67) 14
Available-for-sale financial assets (24,694) 9,119 (4,406) 8,974 9,194 28,050
– valuation gains/(losses) taken to equity (24,694) 9,119 (4,421) 8,974 9,192 28,062
– transferred to profit or loss 0 0 15 0 2 (12)
Share of profits/(losses) of associates and joint ventures accounted for using the equity method (48) 32 92 6 9 (55)
Net profit/(loss) related to discontinued operations (52) 64 (177) (377) (82) (61)
Income tax relating to items that may be reclassified to profit or loss 4,198 (1,550) 768 (1,514) (1,574) (4,772)
TOTAL COMPREHENSIVE INCOME/(LOSS) FOR THE REPORTING PERIOD AFTER TAX (20,641) 19,928 (7,689) 12,646 11,992 39,540
a) Attributable to owners of the parent (20,680) 19,694 (6,229) 12,553 11,805 36,907
– continuing operations (20,763) 19,660 11,044 12,997 12,167 37,017
– discontinued operations 83 34 (17,273) (444) (362) (110)
b) Attributable to non-controlling interests 39 234 (1,460) 93 187 2,633
– continuing operations 39 215 31 151 238 2,654
– discontinued operations 0 19 (1,491) (58) (51) (21)
21
22
€000
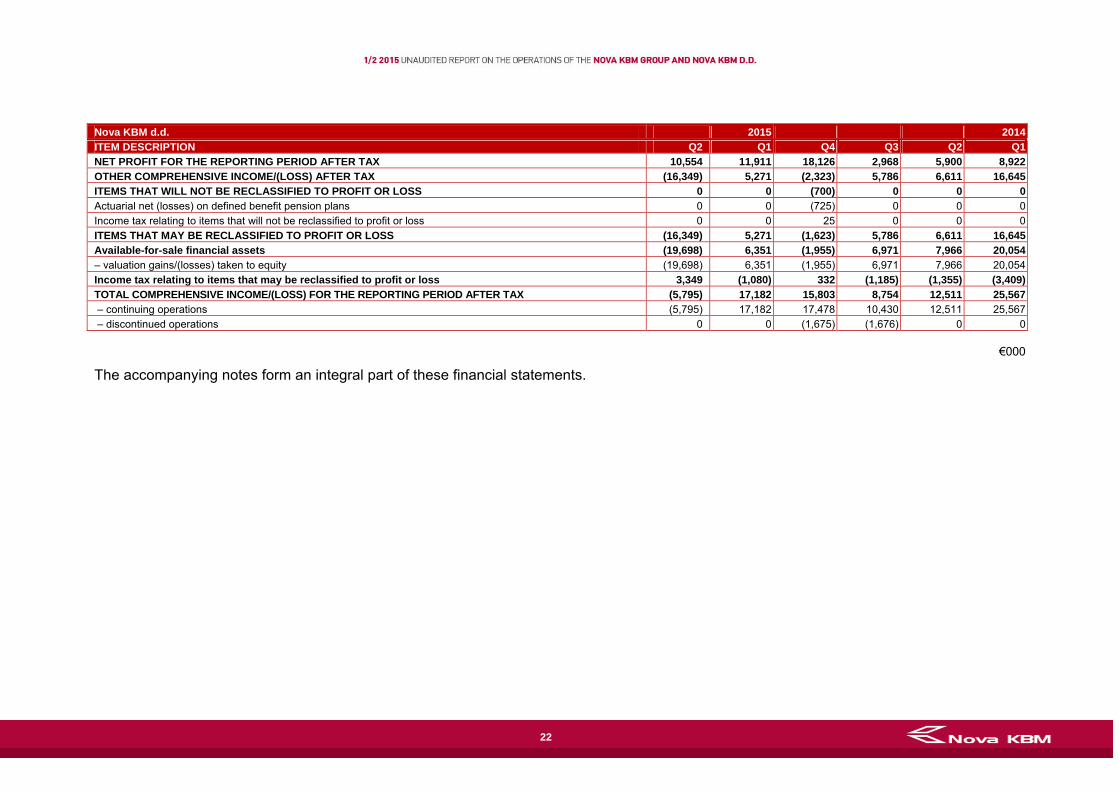
Nova KBM d.d. 2015 - - - 2014 ITEM DESCRIPTION Q2 Q1 Q4 Q3 Q2 Q1 NET PROFIT FOR THE REPORTING PERIOD AFTER TAX 10,554 11,911 18,126 2,968 5,900 8,922 OTHER COMPREHENSIVE INCOME/(LOSS) AFTER TAX (16,349) 5,271 (2,323) 5,786 6,611 16,645 ITEMS THAT WILL NOT BE RECLASSIFIED TO PROFIT OR LOSS 0 0 (700) 0 0 0 Actuarial net (losses) on defined benefit pension plans 0 0 (725) 0 0 0 Income tax relating to items that will not be reclassified to profit or loss 0 0 25 0 0 0 ITEMS THAT MAY BE RECLASSIFIED TO PROFIT OR LOSS (16,349) 5,271 (1,623) 5,786 6,611 16,645 Available-for-sale financial assets (19,698) 6,351 (1,955) 6,971 7,966 20,054 – valuation gains/(losses) taken to equity (19,698) 6,351 (1,955) 6,971 7,966 20,054 Income tax relating to items that may be reclassified to profit or loss 3,349 (1,080) 332 (1,185) (1,355) (3,409) TOTAL COMPREHENSIVE INCOME/(LOSS) FOR THE REPORTING PERIOD AFTER TAX (5,795) 17,182 15,803 8,754 12,511 25,567 – continuing operations (5,795) 17,182 17,478 10,430 12,511 25,567 – discontinued operations 0 0 (1,675) (1,676) 0 0
The accompanying notes form an integral part of these financial statements.
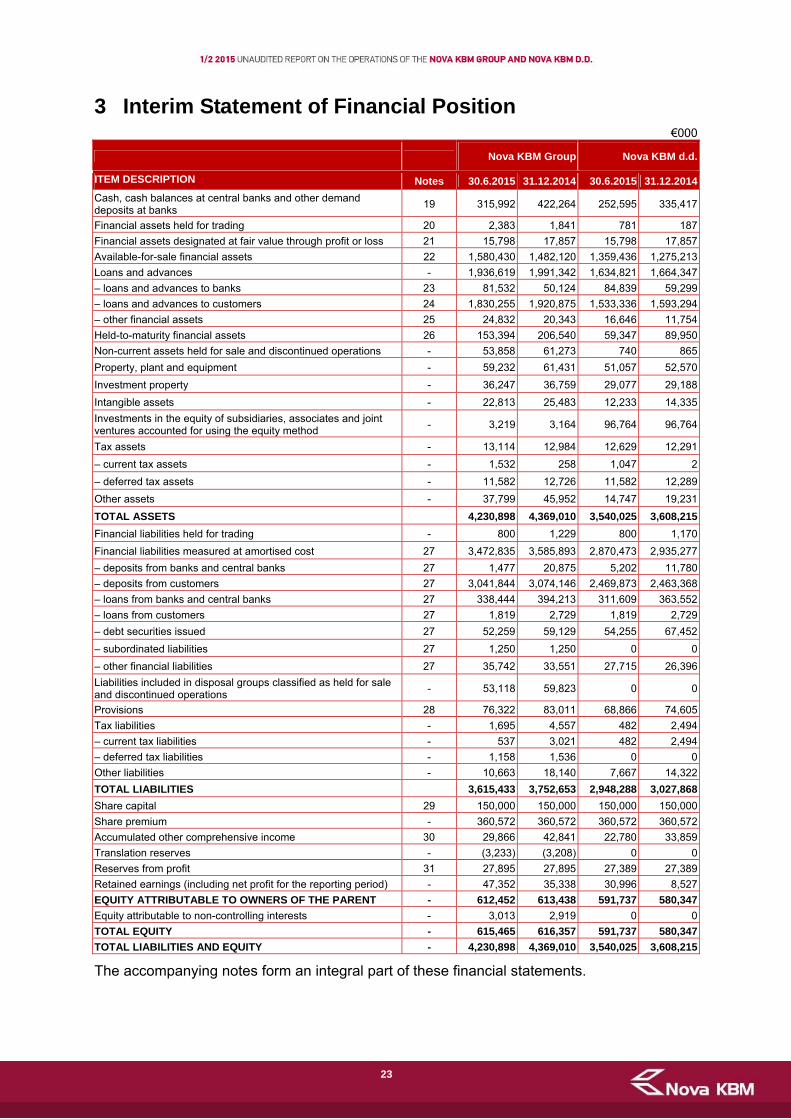
3 Interim Statement of Financial Position €000
Nova KBM Group Nova KBM d.d.
ITEM DESCRIPTION Notes 30.6.2015 31.12.2014 30.6.2015 31.12.2014
Cash, cash balances at central banks and other demand deposits at banks
19 315,992 422,264 252,595 335,417
Financial assets held for trading 20 2,383 1,841 781 187
Financial assets designated at fair value through profit or loss 21 15,798 17,857 15,798 17,857
Available-for-sale financial assets 22 1,580,430 1,482,120 1,359,436 1,275,213
Loans and advances - 1,936,619 1,991,342 1,634,821 1,664,347
– loans and advances to banks 23 81,532 50,124 84,839 59,299
– loans and advances to customers 24 1,830,255 1,920,875 1,533,336 1,593,294
– other financial assets 25 24,832 20,343 16,646 11,754
Held-to-maturity financial assets 26 153,394 206,540 59,347 89,950
Non-current assets held for sale and discontinued operations - 53,858 61,273 740 865
Property, plant and equipment - 59,232 61,431 51,057 52,570
Investment property - 36,247 36,759 29,077 29,188
Intangible assets - 22,813 25,483 12,233 14,335
Investments in the equity of subsidiaries, associates and joint ventures accounted for using the equity method
- 3,219 3,164 96,764 96,764
Tax assets - 13,114 12,984 12,629 12,291
– current tax assets - 1,532 258 1,047 2
– deferred tax assets - 11,582 12,726 11,582 12,289
Other assets - 37,799 45,952 14,747 19,231
TOTAL ASSETS 4,230,898 4,369,010 3,540,025 3,608,215
Financial liabilities held for trading - 800 1,229 800 1,170
Financial liabilities measured at amortised cost 27 3,472,835 3,585,893 2,870,473 2,935,277
– deposits from banks and central banks 27 1,477 20,875 5,202 11,780
– deposits from customers 27 3,041,844 3,074,146 2,469,873 2,463,368
– loans from banks and central banks 27 338,444 394,213 311,609 363,552
– loans from customers 27 1,819 2,729 1,819 2,729
– debt securities issued 27 52,259 59,129 54,255 67,452
– subordinated liabilities 27 1,250 1,250 0 0
– other financial liabilities 27 35,742 33,551 27,715 26,396
Liabilities included in disposal groups classified as held for sale and discontinued operations
- 53,118 59,823 0 0
Provisions 28 76,322 83,011 68,866 74,605
Tax liabilities - 1,695 4,557 482 2,494
– current tax liabilities - 537 3,021 482 2,494
– deferred tax liabilities - 1,158 1,536 0 0
Other liabilities - 10,663 18,140 7,667 14,322
TOTAL LIABILITIES 3,615,433 3,752,653 2,948,288 3,027,868
Share capital 29 150,000 150,000 150,000 150,000
Share premium - 360,572 360,572 360,572 360,572
Accumulated other comprehensive income 30 29,866 42,841 22,780 33,859
Translation reserves - (3,233) (3,208) 0 0
Reserves from profit 31 27,895 27,895 27,389 27,389
Retained earnings (including net profit for the reporting period) - 47,352 35,338 30,996 8,527
EQUITY ATTRIBUTABLE TO OWNERS OF THE PARENT - 612,452 613,438 591,737 580,347
Equity attributable to non-controlling interests - 3,013 2,919 0 0
TOTAL EQUITY - 615,465 616,357 591,737 580,347
TOTAL LIABILITIES AND EQUITY - 4,230,898 4,369,010 3,540,025 3,608,215
The accompanying notes form an integral part of these financial statements.
23

4 Interim Statement of Cash Flows €000
Nova KBM Group Nova KBM d.d.
Designation ITEM DESCRIPTION 1.1.–
30.6.20151.1.–
30.6.2014 1.1.–
30.6.2015 1.1.–
30.6.2014
A. CASH FLOWS FROM OPERATING ACTIVITIES
a) Total profit before tax 16,334 24,091 25,923 17,807
Depreciation and amortisation 6,865 7,796 4,870 5,668
Impairment of available-for-sale financial assets 0 2,685 0 2,671
Impairment of loans and advances 25,652 20,686 11,415 20,418
(Reversal of impairment) of held-to-maturity financial assets (415) (3) 0 0
Impairment/(reversal of impairment) of tangible assets, investment property, intangible assets and other assets
656 (526) 110 20
Share of (profits) of associates and joint ventures accounting for using the equity method
(71) (101) 0 0
Net (gains) from exchange rate differences (9,002) (697) (9,073) (550)
Net (gains)/losses from the sale of tangible assets and investment properties
(48) 67 (5) (44)
Other (gains) from investing activities (1,948) (4,015) (1,523) (2,738)
Net unrealised (gains) from non-current assets held for sale and discontinued operations and liabilities associated therewith
(60) (64) (60) (64)
Other adjustments to total profit or loss before tax (4,896) (3,870) (4,080) (3,029)
Cash flow from operating activities before changes in operating assets and liabilities
33,067 46,049 27,577 40,159
b) (Increase)/decrease in operating assets (excluding cash equivalents)
(41,039) 75,656 (44,929) (6,058)
Net (increase)/decrease in financial assets held for trading 553 (1,314) (597) 226
Net decrease in financial assets designated at fair value through profit or loss
2,059 7,699 2,059 7,699
Net (increase) in available-for-sale financial assets (113,080) (52,917) (97,570) (59,603)
Net decrease in loans and advances 60,634 105,892 46,240 47,674
Net (increase)/decrease in non-current assets held for sale 128 887 125 (196)
Net (increase)/decrease in other assets 8,667 15,409 4,814 (1,858)
c) (Decrease) in operating liabilities (136,355) (312,154) (78,868) (271,144)
Net increase/(decrease) in financial liabilities held for trading (429) (97) (370) 144
Net (decrease) in deposits, loans and advances measured at amortised cost
(119,655) (313,381) (56,870) (271,492)
Net (decrease) in debt securities in issue measured at amortised cost
(6,870) (500) (13,197) (679)
Net increase/(decrease) in other liabilities (9,401) 1,824 (8,431) 883
d) Cash flow from operating activities (a + b + c) (144,327) (190,449) (96,220) (237,043)
e) Income taxes (paid)/refunded (4,308) 487 (3,544) 0
f) Net cash flow from operating activities (d + e) (148,635) (189,962) (99,764) (237,043)
24
25
€000
Nova KBM Group Nova KBM d.d.
Designation ITEM DESCRIPTION 1.1.–
30.6.20151.1.–
30.6.2014 1.1.–
30.6.2015 1.1.–
30.6.2014
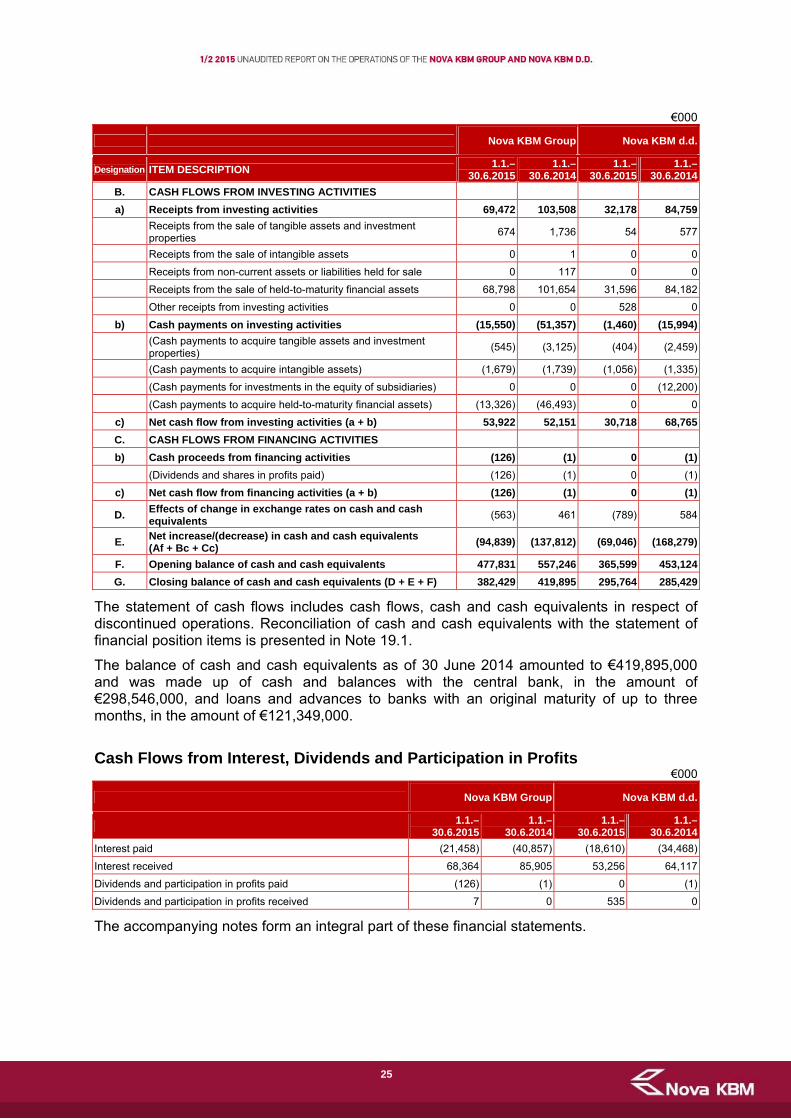
B. CASH FLOWS FROM INVESTING ACTIVITIES
a) Receipts from investing activities 69,472 103,508 32,178 84,759
Receipts from the sale of tangible assets and investment properties
674 1,736 54 577
Receipts from the sale of intangible assets 0 1 0 0
Receipts from non-current assets or liabilities held for sale 0 117 0 0
Receipts from the sale of held-to-maturity financial assets 68,798 101,654 31,596 84,182
Other receipts from investing activities 0 0 528 0
b) Cash payments on investing activities (15,550) (51,357) (1,460) (15,994)
(Cash payments to acquire tangible assets and investment properties)
(545) (3,125) (404) (2,459)
(Cash payments to acquire intangible assets) (1,679) (1,739) (1,056) (1,335)
(Cash payments for investments in the equity of subsidiaries) 0 0 0 (12,200)
(Cash payments to acquire held-to-maturity financial assets) (13,326) (46,493) 0 0
c) Net cash flow from investing activities (a + b) 53,922 52,151 30,718 68,765
C. CASH FLOWS FROM FINANCING ACTIVITIES
b) Cash proceeds from financing activities (126) (1) 0 (1)
(Dividends and shares in profits paid) (126) (1) 0 (1)
c) Net cash flow from financing activities (a + b) (126) (1) 0 (1)
D. Effects of change in exchange rates on cash and cash equivalents
(563) 461 (789) 584
E. Net increase/(decrease) in cash and cash equivalents (Af + Bc + Cc)
(94,839) (137,812) (69,046) (168,279)
F. Opening balance of cash and cash equivalents 477,831 557,246 365,599 453,124
G. Closing balance of cash and cash equivalents (D + E + F) 382,429 419,895 295,764 285,429
The statement of cash flows includes cash flows, cash and cash equivalents in respect of discontinued operations. Reconciliation of cash and cash equivalents with the statement of financial position items is presented in Note 19.1.
The balance of cash and cash equivalents as of 30 June 2014 amounted to €419,895,000 and was made up of cash and balances with the central bank, in the amount of €298,546,000, and loans and advances to banks with an original maturity of up to three months, in the amount of €121,349,000.
Cash Flows from Interest, Dividends and Participation in Profits
€000
Nova KBM Group Nova KBM d.d.
- 1.1.–
30.6.20151.1.–
30.6.20141.1.–
30.6.2015 1.1.–
30.6.2014
Interest paid (21,458) (40,857) (18,610) (34,468)
Interest received 68,364 85,905 53,256 64,117
Dividends and participation in profits paid (126) (1) 0 (1)
Dividends and participation in profits received 7 0 535 0
The accompanying notes form an integral part of these financial statements.

26
5 Interim Statement of Changes in Equity Interim statement of changes in equity of the Nova KBM Group for the six months ended 30 June 2015
€000
ITEM DESCRIPTION Share
capitalShare
premium
Accumulated other
comprehensive income
Translation reserves
Reserves from profit
Retained earnings
(including net profit for the
reporting period)
Equity attributable
to owners of the
parent
Equity attributable
to non-controlling
interests
Total equity
OPENING BALANCE FOR THE REPORTING PERIOD 150,000 360,572 42,841 (3,208) 27,895 35,338 613,438 2,919 616,357
Total comprehensive income for the reporting period after tax 0 0 (12,975) (25) 0 12,014 (986) 273 (713)
Appropriation of (accounting for) dividends 0 0 0 0 0 0 0 (126) (126)
Other 0 0 0 0 0 0 0 (53) (53)
CLOSING BALANCE FOR THE REPORTING PERIOD 150,000 360,572 29,866 (3,233) 27,895 47,352 612,452 3,013 615,465
The accompanying notes form an integral part of these financial statements.
Interim statement of changes in equity of Nova KBM d.d. for the six months ended 30 June 2015
€000
ITEM DESCRIPTION Share capital Share premiumAccumulated other
comprehensive income
Reserves from profit
Retained earnings (including net profit
for the reporting period)
Total equity
OPENING BALANCE FOR THE REPORTING PERIOD 150,000 360,572 33,859 27,389 8,527 580,347
Total comprehensive income for the reporting period after tax 0 0 (11,078) 0 22,465 11,387
Other 0 0 (1) 0 4 3
CLOSING BALANCE FOR THE REPORTING PERIOD 150,000 360,572 22,780 27,389 30,996 591,737
The accompanying notes form an integral part of these financial statements.

27
Interim statement of changes in equity of the Nova KBM Group for the six months ended 30 June 2014
€000
ITEM DESCRIPTION Share
capitalShare
premium
Accumulated other
comprehensive income
Translation reserves
Reserves from profit
Retained earnings
(including net profit for the
reporting period)
Equity attributable
to owners of the
parent
Equity attributable
to non-controlling
interests
Total equity
OPENING BALANCE FOR THE REPORTING PERIOD 150,000 360,572 8,981 (2,486) 663 48,937 566,667 (6,639) 560,028
Total comprehensive income for the reporting period after tax 0 0 30,733 (191) 0 18,170 48,712 2,820 51,532
Recapitalisation of subsidiaries 0 0 0 0 0 (8,264) (8,264) 8,264 0
Appropriation of (accounting for) dividends 0 0 0 0 0 0 0 (95) (95)
Transfer of net profit to reserves from profit 0 0 0 0 (164) 164 0 0 0
Other 0 0 0 0 0 0 0 (64) (64)
CLOSING BALANCE FOR THE REPORTING PERIOD 150,000 360,572 39,714 (2,677) 499 59,007 607,115 4,286 611,401
€000
The accompanying notes form an integral part of these financial statements.
Interim statement of changes in equity of Nova KBM d.d. for the six months ended 30 June 2014
The accompanying notes form an integral part of these financial statements.
ITEM DESCRIPTION Share capital Share premiumAccumulated other
comprehensive income
Retained earnings (including net profit
for the reporting period)
Total equity
OPENING BALANCE FOR THE REPORTING PERIOD 150,000 360,572 7,140 0 517,712
Total comprehensive income for the reporting period after tax 0 0 23,256 14,822 38,078
CLOSING BALANCE FOR THE REPORTING PERIOD 150,000 360,572 30,396 14,822 555,790

NOTES TO THE FINANCIAL STATEMENTS
NOVA KBM GROUP
AND NOVA KBM d.d.
28

1 General information Nova KBM d.d. (herein also referred to as 'Nova KBM' or the 'Bank') is the parent company of the Nova KBM Group (herein also referred to as the 'Group') which, as of 30 June 2015, comprised the parent company and 10 subsidiary companies.
Nova KBM is a commercial bank with a tradition of understanding and supporting its retail and corporate customers to whom it provides standard banking products. Its registered office is at Ulica Vita Kraigherja 4, 2505 Maribor, Republic of Slovenia. As of 30 June 2015, the share capital of Nova KBM totalled €150,000,000 and was split into 10,000,000 ordinary no-par-value shares, all of which were held by the Republic of Slovenia.
On 30 June 2015, the Slovene Sovereign Holding, Apollo Global Management LLC (Apollo) and the European Bank for Reconstruction and Development (EBRD) signed the agreement concerning the sale of a 100% shareholding of the Republic of Slovenia in Nova KBM. The buyers, Apollo and EBRD, will endeavour to ensure the further growth of Nova KBM, while developing its services and broadening its offerings. Moreover, they will make every effort to strengthen the relationships with Nova KBM´s corporate and retail customers, as well as its other stakeholders. The following sale-related actions will be taken over the next few months: the acquisition of approvals from the relevant supervisory bodies, the payment of the purchase consideration, and the transfer and registration of the shareholding – i.e. the closing of the sale process.
Nova KBM is obliged to prepare consolidated financial statements.
2 Definition of the Group The Group comprises the parent bank and its subsidiary companies.
Company Position in the Group Group´s voting rights in the company (%)
Registered office (country of
incorporation)
Nova Kreditna banka Maribor d.d. parent bank Maribor, Slovenia
Poštna banka Slovenije d.d. subsidiary bank 99.12 Maribor, Slovenia
Adria Abwicklungs GmbH in Liqu. subsidiary company 100.00 Vienna, Austria
KBM Banka a.d. subsidiary bank 89.53 Kragujevac, Serbia
KBM Infond d.o.o. subsidiary company 72.731 Maribor, Slovenia
KBM Leasing d.o.o. (in liquidation) subsidiary company 100.00 Maribor, Slovenia
KBM Invest d.o.o. subsidiary company 100.00 Maribor, Slovenia
Gorica Leasing d.o.o. (in liquidation) subsidiary company 100.00 Maribor, Slovenia
M-PAY d.o.o. subsidiary company 50.00 Maribor, Slovenia
KBM Leasing Hrvatska d.o.o. (in liquidation) subsidiary company 100.00 Zagreb, Croatia
MB Finance B.V. subsidiary company 00.002 Netherlands
1 The Group´s stake in the share capital of KBM Infond accounts for 72.00%. Due to KBM Infond holding a certain amount of its own shares, the Group´s stake in the capital of and voting rights in KBM Infond equals 72.73%.
2 In accordance with IFRS 10, MB Finance is regarded as a special purpose vehicle controlled by Nova KBM. Nova KBM has neither voting rights nor an equity stake in this entity, and the operations of this entity are considered to be immaterial to the Group.
On 29 August 2014, the Adria Bank Supervisory Board reached a decision to start the procedures to terminate the operations of Adria Bank. Adria Bank returned its licence for providing banking services to the Austrian Financial Market Authority (FMA) on 23 March 2015, the same day on which it ceased its banking operations and met the conditions to wind down its business. On 11 June 2014, Adria Bank was legally transformed from a joint stock company into a limited liability company named Adria Abwicklungs (GmbH), which filed for controlled liquidation on 26 June 2015, in accordance with a ruling made by the relevant court.
29

In accordance with the adopted restructuring programme and commitments given to the European Commission by the Republic of Slovenia and Nova KBM regarding the restructuring of the Nova KBM Group, the controlled liquidation of KBM Leasing and Gorica Leasing started on 31 December 2014, while that of KBM Leasing Hrvatska started on 15 June 2015, based on rulings made by the relevant courts. While these three companies are still controlled by Nova KBM and are therefore fully consolidated in the Group´s accounts, their financial statements have been prepared on a non-going concern basis. A non-going concern assumption has been taken into consideration in the valuation of the investments in, and credit exposures to, these companies.
The liquidation proceedings against KBM Leasing and Gorica Leasing had not been completed by 31 July 2015, as originally planned, because some of the activities that the liquidators intended to carry out as part of the business closing process were still in progress.
In December 2014, the Nova KBM Management Board passed a decision to sell KBM Banka, based on which the investment of Nova KBM in KBM Banka was book-transferred to 'Non-current assets held for sale'. KBM Banka is fully consolidated in the consolidated financial statements, with its assets, liabilities and profit and loss components being presented as separate items. KBM Banka is in the process of being sold. While work is in progress with respect to a due diligence review of KBM Banka, a request has been made to the relevant Serbian regulator to give a preliminary opinion regarding the sale of KBM Banka to a new owner.
Istra Plan, a company 100% owned by KBM Invest, is not regarded as a business entity. Consequently, only the assets of this company, totalling €672,000, have been included in the consolidated financial statements.
3 Basis for the presentation of consolidated financial statements
The financial statements of the Nova KBM Group and Nova KBM for the six months ended 30 June 2015 were authorised for issue on 27 July 2015 by the Nova KBM Management Board.
The interim financial statements have been prepared in accordance with the regulatory requirements and on the assumption that both Nova KBM and the Nova KBM Group will continue as going concerns in the foreseeable future and that they will be able to meet their liabilities when due.
3.1 Statement of compliance and purpose of financial statements
The separate and consolidated financial statements have been prepared in accordance with International Financial Reporting Standards (hereafter 'IFRSs') as endorsed by the European Union.
The interim financial report is prepared in a condensed form and includes selected explanatory notes as requested in accordance with IAS 34 – Interim Financial Reporting.
Interim financial statements are unaudited and are regarded as general-purpose financial statements. They are not intended for use by any party for purposes of decision-making concerning ownership, financing or any other specific transactions relating to the Group. Accordingly, users of these interim financial statements should not rely exclusively on the financial statements and should undertake other procedures before making decisions.
30

3.2 Presentation and functional currency
Items included in the financial statements are presented in euro, which is the functional and presentation currency of both the Bank and the Group.
All amounts in the financial statements and in the notes to the financial statements are expressed in thousands of euros, unless stated otherwise. Slight discrepancies in the totals may occur due to rounding adjustments.
4 Significant accounting policies The accounting policies used by the Group are presented in detail in its 2014 Annual Report.
The adopted accounting policies have been consistently applied in both reporting periods presented in these financial statements.
During the interim reporting period and in 2014, the Group did not reclassify any of its financial assets into another category.
Newly adopted standards, revisions and interpretations that have been adopted by the EU and that have or will come into effect in 2015 are presented below:
Amendments to various standards – Improvements to IFRSs (cycle 2010 – 2012) resulting from the annual improvement project of IFRSs (IFRS 2, IFRS 3, IFRS 8, IFRS 13, IAS 16, IAS 24 and IAS 38) primarily with a view to removing inconsistencies and clarifying wording; adopted by the EU on 17 December 2014 (effective for annual periods beginning on or after 1 February 2015).
Amendments to various standards – Improvements to IFRSs (cycle 2011 – 2013) resulting from the annual improvement project of IFRSs (IFRS 1, IFRS 3, IFRS 13 and IAS 40) primarily with a view to removing inconsistencies and clarifying wording; adopted by the EU on 18 December 2014 (effective for annual periods beginning on or after 1 January 2015).
Amendments to IAS 19 – Employee Benefits – Defined Benefit Plans: Employee Contributions; adopted by the EU on 17 December 2014 (effective for annual periods beginning on or after 1 February 2015).
IFRIC 21 – Levies; adopted by the EU on 13 June 2014 (effective for annual periods beginning on or after 17 June 2014).
The amendments to the existing standards have not led to any material changes in the Group´s accounting policies.
Standards and interpretations issued by the International Accounting Standards Board (IASB) but, as of the date of this interim report, not yet adopted for use by the EU are set out below:
IFRS 9 – Financial Instruments (effective for annual periods beginning on or after 1 January 2018).
IFRS 14 – Regulatory Deferral Accounts (effective for annual periods beginning on or after 1 January 2016).
IFRS 15 – Revenue from Contracts with Customers (effective for annual periods beginning on or after 1 January 2017).
Amendments to IFRS 10 – Consolidated Financial Statements, and IAS 28 – Investments in Associates and Joint Ventures – Sale or Contribution of Assets between an Investor and its Associate or Joint Venture (the date of initial application has been postponed; the draft for discussion is expected to be released by the IASB on 1 January 2016).
Amendments to IFRS 10 – Consolidated Financial Statements, IFRS 12 – Disclosure of Interests in Other Entities, and IAS 28 – Investments in Associates
31

Amendments to IFRS 11 – Joint Arrangements – Accounting for Acquisition of Interests in Joint Operations (effective for annual periods beginning on or after 1 January 2016).
Amendments to IAS 1 – Presentation of Financial Statements – Disclosure Initiative (effective for annual periods beginning on or after 1 January 2016).
Amendments to IAS 16 – Property, Plant and Equipment, and IAS 38 – Intangible Assets – Clarification of Acceptable Methods of Depreciation and Amortisation (effective for annual periods beginning on or after 1 January 2016).
Amendments to IAS 16 – Property, Plant and Equipment, and IAS 41 – Agriculture – Agriculture: Bearer Plants (effective for annual periods beginning on or after 1 January 2016).
Amendments to IAS 27 – Separate Financial Statements – Equity Method in Separate Financial Statements (effective for annual periods beginning on or after 1 January 2016).
Amendments to various standards – Improvements to IFRSs (cycle 2012 – 2014) resulting from the annual improvement project of IFRSs (IFRS 5, IFRS 7, IFRS 19 and IAS 34) primarily with a view to removing inconsistencies and clarifying wording (effective for annual periods beginning on or after 1 January 2016).
The Group has not early adopted any standard or interpretation that has been issued but is not yet effective. It anticipates that the adoption of these standards, revisions and interpretations will have no material impact on its financial statements in the period of initial application, with the exception of IFRS 9, the impact of which on the financial statements of the Bank and the Group has not been assessed yet.
32

33
5 Risk review The Bank Management Board delegates risk oversight and management to the senior management (policy holders). The policy holders, together with officers responsible for particular policies, determine the method of measuring individual risks. The responsible officers are specialised in defining, measuring and controlling individual risks.
The organisational unit responsible for defining the acceptable level of a specific type of risk and the method of measuring and monitoring the risk is organisationally separate from the unit it monitors. In accordance with the rules of procedure, each risk management policy has to be approved by the Policy Approval Committee and, in addition, agreed by the President of the Management Board or his deputy. The Group companies may use their own approach in managing individual risks, taking into consideration the importance of risk and the regulatory framework.
Further details with respect to risk management are provided in the Group´s 2014 Annual Report.
5.1 Credit risk
Analysis of exposure to credit risk
Nova KBM Group Loans to customers Loans to banks
30.6.2015 31.12.2014 30.6.2015 31.12.2014
Net outstanding loans 1,830,255 1,920,875 81,532 50,124
Individual impairment
Gross amount 947,906 966,592 6,145 730
Impairment (550,292) (531,869) (4) (3)
Net amount 397,614 434,723 6,141 727
Collective impairment
Credit rating A 941,287 941,848 0 0
Credit rating B 275,457 298,683 0 0
Credit rating C 166,256 174,665 0 0
Credit rating D 25,599 29,477 0 0
Credit rating E 71,669 71,194 0 0
Gross amount 1,480,268 1,515,867 0 0
Impairment (82,584) (86,958) 0 0
Net amount 1,397,684 1,428,909 0 0
Net non-impaired loans 34,957 57,243 75,391 49,397
Total net loans 1,830,255 1,920,875 81,532 50,124

Nova KBM d.d. Loans to customers Loans to banks
30.6.2015 31.12.2014 30.6.2015 31.12.2014
Net outstanding loans 1,533,336 1,593,294 84,839 59,299
Individual impairment
Gross amount 662,543 672,926 5,132 5,015
Impairment (350,249) (344,441) (5,130) (5,013)
Net amount 312,294 328,485 2 2
Collective impairment
Credit rating A 844,379 804,293 0 0
Credit rating B 190,712 232,345 0 0
Credit rating C 137,173 154,612 0 0
Credit rating D 22,999 26,815 0 0
Credit rating E 58,766 58,294 0 0
Gross amount 1,254,029 1,276,359 0 0
Impairment (66,954) (67,558) 0 0
Net amount 1,187,075 1,208,801 0 0
Net non-impaired loans 33,967 56,008 84,837 59,297
Total net loans 1,533,336 1,593,294 84,839 59,299
Past-due and unpaid claims
Nova KBM Group 30.6.2015
Up to 30 days 31 to 60 days 61 to 90 days Over 90 days Total
Banks 130 0 0 2 132
State 36 5 4 3 48
Legal entities 59,906 2,215 8,465 533,324 603,910
Households 1,751 473 478 67,997 70,699
Total 61,823 2,693 8,947 601,326 674,789
Nova KBM Group 31.12.2014
Up to 30 days 31 to 60 days 61 to 90 days Over 90 days Total
Banks 14 0 0 2 16
State 112 5 5 3 125
Legal entities 44,698 34,190 24,941 486,058 589,887
Households 1,984 525 3,044 60,256 65,809
Total 46,808 34,720 27,990 546,319 655,837
Nova KBM d.d. 30.6.2015
Up to 30 days 31 to 60 days 61 to 90 days Over 90 days Total
Banks 130 0 0 2 132
State 31 0 0 0 31
Legal entities 56,984 746 5,012 311,799 374,541
Households 1,292 343 385 46,503 48,523
Total 58,437 1,089 5,397 358,304 423,227
34

Nova KBM d.d. 31.12.2014
Up to 30 days 31 to 60 days 61 to 90 days Over 90 days Total
Banks 14 0 0 2 16
State 107 0 1 0 108
Legal entities 28,321 32,892 19,981 271,318 352,512
Households 1,465 339 2,930 38,068 42,802
Total 29,907 33,231 22,912 309,388 395,438
NPLs in the total loan portfolio
Nova KBM Group Nova KBM d.d.
30.6.2015 31.12.2014 30.6.2015 31.12.2014
Total gross loan portfolio 2,544,667 2,589,829 2,040,508 2,069,605
Total net loan portfolio 1,911,787 1,970,999 1,618,175 1,652,593
Net NPLs 437,670 462,519 354,085 370,457
Net NPLs/total net loan portfolio (%) 22.89 23.47 21.88 22.42
35

Analysis of NPLs by industry sectors
The following tables set forth, for the periods indicated, the total net loans and net NPLs outstanding to individual industry sectors, and the proportion of net NPLs in net loans:
Nova KBM Group 30.6.2015 31.12.2014
Industry sector Total net
loansNet NPLs Share of NPLs
(%)Total net
loansNet NPLs Share of NPLs
(%)
Households 853,199 36,269 4.25 857,683 33,849 3.95
Agriculture and hunting, forestry, fishing
26,048 8,833 33.91 23,240 8,532 36.71
Mining 2,151 229 10.65 2,786 676 24.26
Manufacturing industry 297,494 127,216 42.76 342,155 142,670 41.70
Electricity, gas and steam supply 41,131 3,655 8.89 46,771 3,946 8.44
Water supply, waste and sewage management, rehabilitation of the environment
25,078 3,105 12.38 24,052 979 4.07
Construction 69,478 39,483 56.83 71,471 31,088 43.50
Trade, maintenance and repair of motor vehicles
199,382 73,658 36.94 188,896 76,590 40.55
Transportation and storage 50,975 5,752 11.28 52,511 6,025 11.47
Accommodation and food service activities
37,722 18,945 50.22 39,621 19,292 48.69
Information and communication activities
20,320 11,376 55.98 22,526 13,507 59.96
Financial intermediation 122,222 10,891 8.91 92,590 20,442 22.08
Real estate activities 34,594 26,449 76.46 39,025 29,712 76.14
Professional, scientific and technical activities
43,821 24,166 55.15 47,680 25,601 53.69
Other various business activities 10,569 3,005 28.43 15,764 2,758 17.50
Public administration and defence services, compulsory social security activities
11,993 322 2.68 32,415 185 0.57
Education 2,831 263 9.29 3,181 392 12.32
Health and welfare security 21,175 8,508 40.18 23,128 8,704 37.63
Arts, entertainment and recreation 37,303 34,921 93.61 38,824 35,957 92.62
Other activities 4,301 624 14.51 6,680 1,614 24.16
Total net loans 1,911,787 437,670 22.89 1,970,999 462,519 23.47
36

Nova KBM d.d. 30.6.2015 31.12.2014
Industry sector Total net
loansNet NPLs Share of NPLs
(%)Total net
loansNet NPLs Share of NPLs
(%)
Households 756,997 34,035 4.50 762,689 31,509 4.13
Agriculture and hunting, forestry, fishing
19,090 4,515 23.65 17,216 4,626 26.87
Mining 1,836 229 12.47 1,989 229 11.51
Manufacturing industry 234,537 97,803 41.70 272,295 111,133 40.81
Electricity, gas and steam supply 38,536 2,049 5.32 43,954 3,838 8.73
Water supply, waste and sewage management, rehabilitation of the environment
19,121 2,118 11.08 14,602 241 1.65
Construction 46,842 25,721 54.91 42,208 14,273 33.82
Trade, maintenance and repair of motor vehicles
147,115 55,804 37.93 130,157 57,208 43.95
Transportation and storage 47,813 5,106 10.68 48,826 5,151 10.55
Accommodation and food service activities
28,767 14,131 49.12 29,728 13,940 46.89
Information and communication activities
14,705 8,311 56.52 14,362 8,022 55.86
Financial intermediation 133,049 20,755 15.60 111,939 32,035 28.62
Real estate activities 27,906 20,608 73.85 32,292 23,907 74.03
Professional, scientific and technical activities
29,253 17,543 59.97 31,597 18,478 58.48
Other various business activities 7,103 1,860 26.19 8,021 1,196 14.91
Public administration and defence services, compulsory social security activities
4,522 0 0.00 26,229 0 0.00
Education 2,713 263 9.69 3,020 369 12.22
Health and welfare security 18,731 8,475 45.25 20,497 8,673 42.31
Arts, entertainment and recreation 36,218 34,261 94.60 37,555 35,184 93.69
Other activities 3,321 498 15.00 3,417 445 13.02
Total net loans 1,618,175 354,085 21.88 1,652,593 370,457 22.42
37
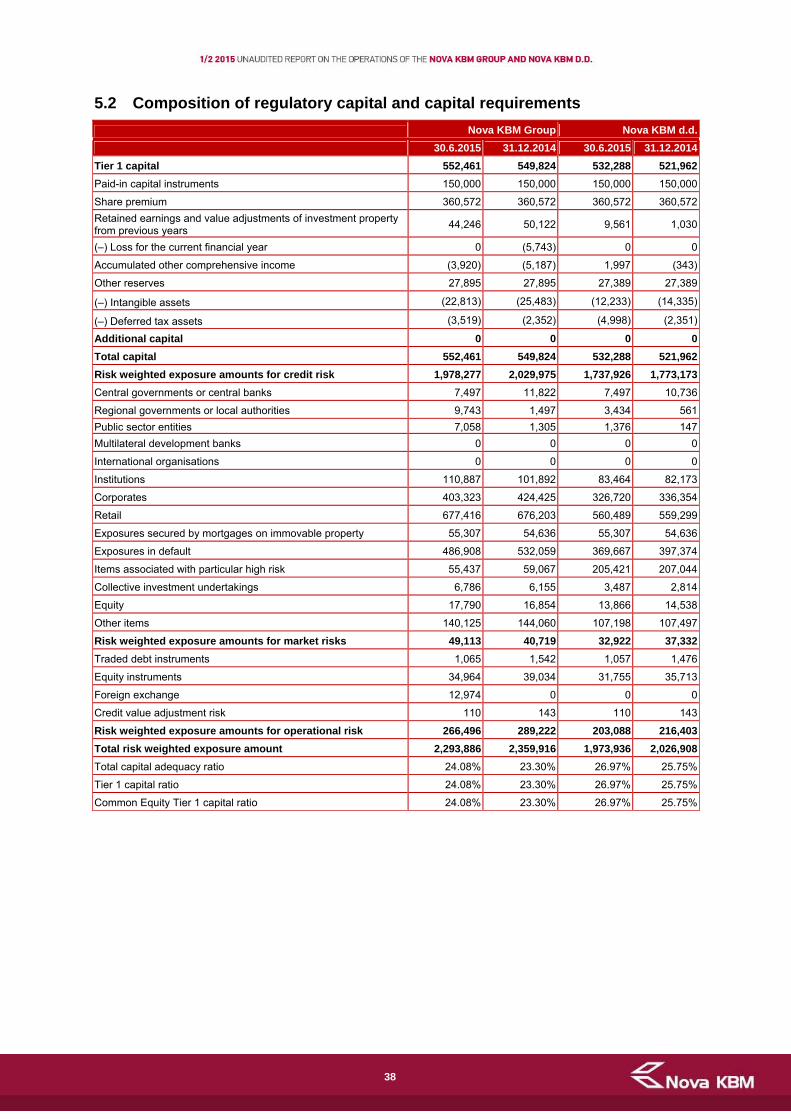
5.2 Composition of regulatory capital and capital requirements
Nova KBM Group Nova KBM d.d.
30.6.2015 31.12.2014 30.6.2015 31.12.2014
Tier 1 capital 552,461 549,824 532,288 521,962
Paid-in capital instruments 150,000 150,000 150,000 150,000
Share premium 360,572 360,572 360,572 360,572
Retained earnings and value adjustments of investment property from previous years
44,246 50,122 9,561 1,030
(‒) Loss for the current financial year 0 (5,743) 0 0
Accumulated other comprehensive income (3,920) (5,187) 1,997 (343)
Other reserves 27,895 27,895 27,389 27,389
(‒) Intangible assets (22,813) (25,483) (12,233) (14,335)
(‒) Deferred tax assets (3,519) (2,352) (4,998) (2,351)
Additional capital 0 0 0 0
Total capital 552,461 549,824 532,288 521,962
Risk weighted exposure amounts for credit risk 1,978,277 2,029,975 1,737,926 1,773,173
Central governments or central banks 7,497 11,822 7,497 10,736
Regional governments or local authorities 9,743 1,497 3,434 561
Public sector entities 7,058 1,305 1,376 147
Multilateral development banks 0 0 0 0
International organisations 0 0 0 0
Institutions 110,887 101,892 83,464 82,173
Corporates 403,323 424,425 326,720 336,354
Retail 677,416 676,203 560,489 559,299
Exposures secured by mortgages on immovable property 55,307 54,636 55,307 54,636
Exposures in default 486,908 532,059 369,667 397,374
Items associated with particular high risk 55,437 59,067 205,421 207,044
Collective investment undertakings 6,786 6,155 3,487 2,814
Equity 17,790 16,854 13,866 14,538
Other items 140,125 144,060 107,198 107,497
Risk weighted exposure amounts for market risks 49,113 40,719 32,922 37,332
Traded debt instruments 1,065 1,542 1,057 1,476
Equity instruments 34,964 39,034 31,755 35,713
Foreign exchange 12,974 0 0 0
Credit value adjustment risk 110 143 110 143
Risk weighted exposure amounts for operational risk 266,496 289,222 203,088 216,403
Total risk weighted exposure amount 2,293,886 2,359,916 1,973,936 2,026,908
Total capital adequacy ratio 24.08% 23.30% 26.97% 25.75%
Tier 1 capital ratio 24.08% 23.30% 26.97% 25.75%
Common Equity Tier 1 capital ratio 24.08% 23.30% 26.97% 25.75%
38

6 Fair value of financial assets and financial liabilities Where possible, the Group determines the fair value of financial instruments on the basis of their market prices. The Group starts to measure the value of financial assets according to a valuation model once it establishes that the market is not active.
Further details with respect to the policy of determining the fair value of financial assets and financial liabilities are presented in the Group´s 2014 Annual Report.
Analysis of fair value hierarchy
Nova KBM Group 30.6.2015 31.12.2014
Total Level 1 Level 2 Level 3 Total Level 1 Level 2 Level 3
Financial assets
Derivatives 188 0 188 0 187 0 187 0
Financial assets held for trading
2,195 2,195 0 0 1,654 1,654 0 0
– equity financial instruments 2,195 2,195 0 0 1,654 1,654 0 0
Available-for-sale financial assets
1,580,430 1,138,820 438,148 3,462 1,482,120 1,038,084 440,932 3,104
– debt financial instruments 1,547,252 1,124,745 422,507 0 1,463,106 1,022,174 440,932 0
– equity financial instruments 33,178 14,075 15,641 3,462 19,014 15,910 0 3,104
Financial assets designated at fair value through profit or loss
15,798 15,798 0 0 17,857 17,857 0 0
– equity financial instruments 15,798 15,798 0 0 17,857 17,857 0 0
Financial liabilities
Derivatives 800 0 800 0 1,229 0 1,229 0
Nova KBM d.d. 30.6.2015 31.12.2014
Total Level 1 Level 2 Level 3 Total Level 1 Level 2 Level 3
Financial assets
Derivatives 188 0 188 0 187 0 187 0
Financial assets held for trading
593 593 0 0 0 0 0 0
– equity financial instruments 593 593 0 0 0 0 0 0
Available-for-sale financial assets
1,359,436 931,818 424,367 3,251 1,275,213 844,020 428,304 2,889
– debt financial instruments 1,332,511 922,386 410,125 0 1,261,435 833,131 428,304 0
– equity financial instruments 26,925 9,432 14,242 3,251 13,778 10,889 0 2,889
Financial assets designated at fair value through profit or loss
15,798 15,798 0 0 17,857 17,857 0 0
– equity financial instruments 15,798 15,798 0 0 17,857 17,857 0 0
Financial liabilities
Derivatives 800 0 800 0 1,170 0 1,170 0
39
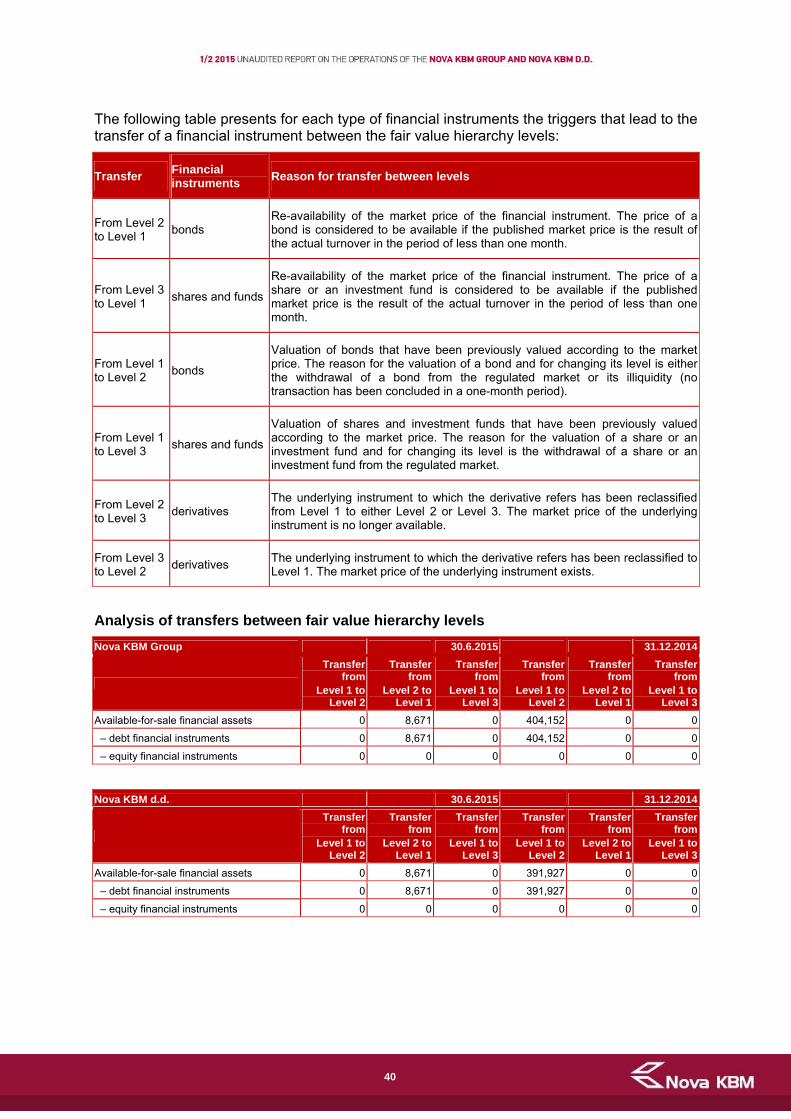
The following table presents for each type of financial instruments the triggers that lead to the transfer of a financial instrument between the fair value hierarchy levels:
Transfer Financial instruments
Reason for transfer between levels
Re-availability of the market price of the financial instrument. The price of a bond is considered to be available if the published market price is the result of the actual turnover in the period of less than one month.
From Level 2 to Level 1
bonds
Re-availability of the market price of the financial instrument. The price of a share or an investment fund is considered to be available if the published market price is the result of the actual turnover in the period of less than one month.
From Level 3 to Level 1
shares and funds
Valuation of bonds that have been previously valued according to the market price. The reason for the valuation of a bond and for changing its level is either the withdrawal of a bond from the regulated market or its illiquidity (no transaction has been concluded in a one-month period).
From Level 1 to Level 2
bonds
Valuation of shares and investment funds that have been previously valued according to the market price. The reason for the valuation of a share or an investment fund and for changing its level is the withdrawal of a share or an investment fund from the regulated market.
From Level 1 to Level 3
shares and funds
The underlying instrument to which the derivative refers has been reclassified from Level 1 to either Level 2 or Level 3. The market price of the underlying instrument is no longer available.
From Level 2 to Level 3
derivatives
From Level 3 to Level 2
derivatives The underlying instrument to which the derivative refers has been reclassified to Level 1. The market price of the underlying instrument exists.
Analysis of transfers between fair value hierarchy levels
Nova KBM Group 30.6.2015 31.12.2014
Transfer from
Level 1 to Level 2
Transfer from
Level 2 to Level 1
Transfer from
Level 1 to Level 3
Transfer from
Level 1 to Level 2
Transfer from
Level 2 to Level 1
Transfer from
Level 1 to Level 3
Available-for-sale financial assets 0 8,671 0 404,152 0 0
– debt financial instruments 0 8,671 0 404,152 0 0
– equity financial instruments 0 0 0 0 0 0
Nova KBM d.d. 30.6.2015 31.12.2014
Transfer from
Level 1 to Level 2
Transfer from
Level 2 to Level 1
Transfer from
Level 1 to Level 3
Transfer from
Level 1 to Level 2
Transfer from
Level 2 to Level 1
Transfer from
Level 1 to Level 3
Available-for-sale financial assets 0 8,671 0 391,927 0 0
– debt financial instruments 0 8,671 0 391,927 0 0
– equity financial instruments 0 0 0 0 0 0
40

Movements in financial assets included in Level 3
Nova KBM Group Nova KBM d.d.Available-for-sale financial assets Total Shares Stocks Total Shares Stocks
1 January 2014 3,167 2,553 614 3,026 2,540 486
Change due to sale (972) (972) 0 (972) (972) 0
Change due to debt-to-equity conversions 2,116 2,036 80 2,036 2,036 0
Shares returned from BAMC 834 834 0 834 834 0
Change due to revaluation (2,041) (2,041) 0 (2,035) (2,036) 1
31 December 2014 3,104 2,410 694 2,889 2,402 487
Change due to debt-to-equity conversions 362 362 0 362 362 0
Changes in the portfolio of Adria Abwicklungs GmbH
(4) 0 (4) 0 0 0
1 January 2015 3,104 2,410 694 2,889 2,402 487
In the six-month period ended 30 June 2015, no changes took place in the Group´s financial assets included in Level 3 of the fair value hierarchy.
Fair value of financial instruments measured at amortised cost
Nova KBM Group 30.6.2015
Book value Fair value Level 1 Level 2 Level 3
Financial assets
Cash, cash balances at central banks and other demand deposits at banks
315,992 315,992 315,992 0 0
Loans and advances to banks 81,532 87,335 0 87,335 0
Loans and advances to customers 1,830,255 1,837,832 0 0 1,837,832
Other financial assets 24,832 24,832 0 0 24,832
Held-to-maturity financial assets 153,394 160,001 155,447 4,554 0
Financial liabilities
Deposits from banks and central banks 1,477 1,433 0 1,433 0
Deposits from customers 3,041,844 3,046,482 0 3,046,482 0
Loans from banks and central banks 338,444 339,216 0 339,216 0
Loans from customers 1,819 1,821 0 1,821 0
Debt securities 52,259 56,160 0 56,160 0
Subordinated liabilities 1,250 1,250 0 1,250 0
Other financial liabilities 35,742 35,742 0 0 35,742
41

Nova KBM Group 31.12.2014
Book value Fair value Level 1 Level 2 Level 3
Financial assets
Cash, cash balances at central banks and other demand deposits at banks
422,264 422,264 422,264 0 0
Loans and advances to banks 50,124 56,173 0 56,173 0
Loans and advances to customers 1,920,875 1,928,869 0 0 1,928,869
Other financial assets 20,343 20,343 0 0 20,343
Held-to-maturity financial assets 206,540 213,247 208,635 4,612 0
Financial liabilities
Deposits from banks and central banks 20,875 20,768 0 20,768 0
Deposits from customers 3,074,146 3,080,697 0 3,080,697 0
Loans from banks and central banks 394,213 395,259 0 395,259 0
Loans from customers 2,729 2,732 0 2,732 0
Debt securities 59,129 63,012 0 63,012 0
Subordinated liabilities 1,250 1,250 0 1,250 0
Other financial liabilities 33,551 33,551 0 0 33,551
Nova KBM d.d. 30.6.2015
Book value Fair value Level 1 Level 2 Level 3
Financial assets
Cash, cash balances at central banks and other demand deposits at banks
252,595 252,595 252,595 0 0
Loans and advances to banks 84,839 90,642 0 90,642 0
Loans and advances to customers 1,533,336 1,540,479 0 0 1,540,479
Other financial assets 16,646 16,646 0 0 16,646
Held-to-maturity financial assets 59,347 63,901 59,347 4,554 0
Financial liabilities
Deposits from banks and central banks 5,202 5,158 0 5,158 0
Deposits from customers 2,469,873 2,474,407 0 2,474,407 0
Loans from banks and central banks 311,609 312,381 0 312,381 0
Loans from customers 1,819 1,821 0 1,821 0
Debt securities 54,255 58,156 0 58,156 0
Other financial liabilities 27,715 27,715 0 0 27,715
42
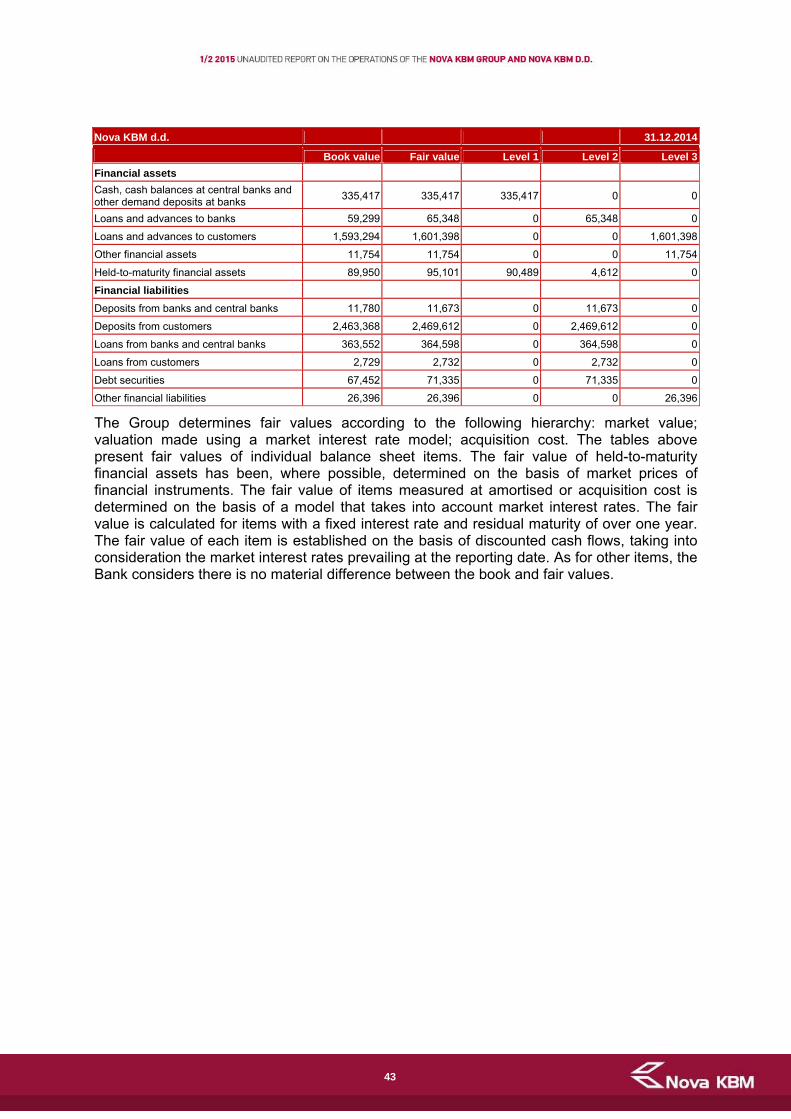
43
Nova KBM d.d. 31.12.2014
Book value Fair value Level 1 Level 2 Level 3
Financial assets
Cash, cash balances at central banks and other demand deposits at banks
335,417 335,417 335,417 0 0
Loans and advances to banks 59,299 65,348 0 65,348 0
Loans and advances to customers 1,593,294 1,601,398 0 0 1,601,398
Other financial assets 11,754 11,754 0 0 11,754
Held-to-maturity financial assets 89,950 95,101 90,489 4,612 0
Financial liabilities
Deposits from banks and central banks 11,780 11,673 0 11,673 0
Deposits from customers 2,463,368 2,469,612 0 2,469,612 0
Loans from banks and central banks 363,552 364,598 0 364,598 0
Loans from customers 2,729 2,732 0 2,732 0
Debt securities 67,452 71,335 0 71,335 0
Other financial liabilities 26,396 26,396 0 0 26,396
The Group determines fair values according to the following hierarchy: market value; valuation made using a market interest rate model; acquisition cost. The tables above present fair values of individual balance sheet items. The fair value of held-to-maturity financial assets has been, where possible, determined on the basis of market prices of financial instruments. The fair value of items measured at amortised or acquisition cost is determined on the basis of a model that takes into account market interest rates. The fair value is calculated for items with a fixed interest rate and residual maturity of over one year. The fair value of each item is established on the basis of discounted cash flows, taking into consideration the market interest rates prevailing at the reporting date. As for other items, the Bank considers there is no material difference between the book and fair values.

7 Reporting by operating segments 7.1 Analysis by operating segments as of 30 June 2015
Banking LeasingFund
managementReal estate
activityOther Total
Inter-segment relationships
Relationships with third parties
A. Net income/expenses 80,852 1,166 2,658 214 392 85,282 776 84,506
Interest income 64,261 1,106 4 0 245 65,616 1,318 64,298
Interest expenses (14,785) (433) 0 (166) (55) (15,439) (1,108) (14,331)
Net interest income 49,476 673 4 (166) 190 50,177 210 49,967
Dividend income 1,248 0 0 0 0 1,248 476 772
Fee and commission income 37,703 32 3,278 0 200 41,213 405 40,808
Fee and commission expenses (12,743) (29) (773) (3) (12) (13,560) (352) (13,208)
Net fee and commission income 24,960 3 2,505 (3) 188 27,653 53 27,600
Realised gains on financial assets and liabilities not measured at fair value through profit or loss 6,982 4 100 0 10 7,096 1 7,095
Net gains/(losses) on financial assets and liabilities held for trading (7,193) 0 55 0 3 (7,135) 1 (7,136)
Net (losses) on financial assets and liabilities designated at fair value through profit or loss (2,059) 0 0 0 0 (2,059) 0 (2,059)
Net exchange rate differences 9,076 37 (1) 0 1 9,113 (1) 9,114
Net gains on derecognition of assets other than non-current assets held for sale 11 36 0 6 0 53 0 53
Other net operating income/(loss) (1,649) 413 (5) 377 0 (864) 36 (900)
B. Other items by segments (54,183) (10,222) (1,635) (210) (2,351) (68,601) (305) (68,296)
Administration costs (36,555) (1,060) (1,114) (207) (1,664) (40,600) (117) (40,483)
Depreciation and amortisation (5,734) (173) (521) (3) (97) (6,528) 0 (6,528)
Provisions 4,969 194 0 0 (588) 4,575 (204) 4,779
Impairment losses (16,923) (9,183) 0 0 (2) (26,108) 87 (26,195)
Share of profits of associates and joint ventures accounted for using the equity method 0 0 0 0 0 0 (71) 71
Total profit from non-current assets and disposal groups classified as held for sale 60 0 0 0 0 60 0 60
C. Profit or loss
PROFIT/(LOSS) FROM CONTINUING OPERATIONS 26,669 (9,056) 1,023 4 (1,959) 16,681 471 16,210
Tax (expense) related to profit or loss from continuing operations (3,458) 0 (161) 0 (439) (4,058) 0 (4,058)
NET PROFIT/(LOSS) FROM CONTINUING OPERATIONS 23,211 (9,056) 862 4 (2,398) 12,623 471 12,152
Total profit after tax from discontinued operations 124 0 0 0 0 124 0 124
NET PROFIT/(LOSS) FOR THE REPORTING PERIOD 23,335 (9,056) 862 4 (2,398) 12,747 471 12,276
D. Segment assets and liabilities -
Total assets 4,281,344 52,705 13,726 10,698 15,700 4,374,173 143,275 4,230,898
– non-current assets held for sale and discontinued operations 53,758 0 0 0 0 53,758 (100) 53,858
– investments in the equity of associates and joint ventures accounted for using the equity method 96,764 0 0 0 0 96,764 93,545 3,219
Liabilities (excluding equity) by segments 3,645,561 24,940 830 6,361 5,706 3,683,398 67,965 3,615,433
Total equity 635,783 27,765 12,896 4,337 9,994 690,775 75,310 615,465
Increase in property, plant and equipment and intangible assets 1,274 0 245 0 0 1,519 0 1,519
The column 'Inter-segment relationships' includes the following items: intra-Group income and expenses; income from dividends from subsidiaries; additional impairments/reversal of impairments as a result of changing over to a harmonised customer classification across the Group; impairment of investments in the equity of subsidiaries and of loans given to subsidiaries; the effects of valuation of the associated company using the equity method; claims and liabilities between Group companies; investments in subsidiaries and the proportional share of equity of subsidiaries; and other consolidation entries.
44

45
Analysis by operating segments as of 30 June 2014
Banking LeasingFund
managementReal estate
activityOther Total
Inter-segment relationships
Relationships with third parties
A. Net income/expenses 90,869 (53) 2,359 459 13 93,647 594 93,053
Interest income 85,150 2,117 0 308 2 87,577 5,889 81,688
Interest expenses (29,919) (3,952) (5) (665) 0 (34,541) (5,871) (28,670)
Net interest income 55,231 (1,835) (5) (357) 2 53,036 18 53,018
Dividend income 488 0 0 0 0 488 424 64
Fee and commission income 40,609 28 2,703 0 0 43,340 377 42,963
Fee and commission expenses (14,212) (152) (475) (10) 0 (14,849) (279) (14,570)
Net fee and commission income 26,397 (124) 2,228 (10) 0 28,491 98 28,393
Realised gains/(losses) on financial assets and liabilities not measured at fair value through profit or loss 7,743 (1) 80 618 0 8,440 0 8,440
Net gains/(losses) on financial assets and liabilities held for trading (694) 0 50 0 0 (644) 1 (645)
Net gains/(losses) on financial assets and liabilities designated at fair value through profit or loss 4,748 0 0 0 0 4,748 (1) 4,749
Net exchange rate differences 578 70 0 0 0 648 2 646
Net gains/(losses) on derecognition of assets other than non-current assets held for sale 4 (103) 0 6 0 (93) (2) (91)
Other net operating income/(loss) (3,626) 1,940 6 202 11 (1,467) 54 (1,521)
B. Other items by segments (71,282) (1,147) (1,547) (571) (2) (74,549) (5,988) (68,561)
Administration costs (39,981) (1,183) (1,033) (571) (2) (42,770) (168) (42,602)
Depreciation and amortisation (6,680) (208) (514) (3) 0 (7,405) 1 (7,406)
Provisions 2,472 0 0 0 0 2,472 (1,099) 3,571
Impairment losses (27,157) 244 0 3 0 (26,910) (4,621) (22,289)
Share of profits of associates and joint ventures accounted for using the equity method 0 0 0 0 0 0 (101) 101
Total profit from non-current assets and disposal groups classified as held for sale 64 0 0 0 0 64 0 64
C. Profit or loss
PROFIT/(LOSS) FROM CONTINUING OPERATIONS 19,587 (1,200) 812 (112) 11 19,098 (5,394) 24,492
Tax (expense) related to profit or loss from continuing operations (2,925) 0 (139) (129) (2) (3,195) 20 (3,215)
NET PROFIT/(LOSS) FROM CONTINUING OPERATIONS 16,662 (1,200) 673 (241) 9 15,903 (5,374) 21,277
Total (loss) after tax from discontinued operations (401) 0 0 0 0 (401) 0 (401)
NET PROFIT/(LOSS) FOR THE REPORTING PERIOD 16,261 (1,200) 673 (241) 9 15,502 (5,374) 20,876
D. Segment assets and liabilities - - - - - - --
Total assets 4,629,538 113,640 14,118 43,866 219 4,801,381 255,828 4,545,553
– non-current assets held for sale and discontinued operations 6,116 694 0 0 0 6,810 367 6,443
– investments in the equity of associates and joint ventures accounted for using the equity method 66,339 0 0 0 0 66,339 63,327 3,012
Liabilities (excluding equity) by segments 3,992,249 177,451 1,220 53,939 1 4,224,860 290,708 3,934,152
Total equity 637,289 (63,811) 12,898 (10,073) 218 576,521 (34,880) 611,401
Increase in property, plant and equipment and intangible assets 2,101 13 38 0 0 2,152 0 2,152
The column 'Inter-segment relationships' includes the following items: intra-Group income and expenses; income from dividends from subsidiaries; additional impairments/reversal of impairments as a result of changing over to a harmonised customer classification across the Group; impairment of investments in the equity of subsidiaries and of loans given to subsidiaries; the effects of valuation of the associated company using the equity method; claims and liabilities between Group companies; investments in subsidiaries and the proportional share of equity of subsidiaries; and other consolidation entries.

46
Notes to the income statement items
8 Interest income and interest expenses 8.1 Analysis of interest by market segments
Nova KBM Group - Nova KBM d.d.
- 1.1.–
30.6.2015-
1.1.–30.6.2014
-1.1.–
30.6.2015 -
1.1.–30.6.2014
Income Expenses Income Expenses Income Expenses Income Expenses
Non-financial companies 19,782 554 27,828 2,263 15,096 506 20,135 1,987
State 19,844 557 26,775 849 16,609 327 22,073 535
Banks 1,022 3,343 1,571 6,037 1,177 3,213 2,468 5,284
Other financial organisations 863 1,705 711 1,855 987 1,680 2,913 1,714
Households 20,720 7,935 22,270 17,200 17,509 6,861 18,612 14,381
Foreign persons 2,027 189 2,462 355 1,814 189 2,159 355
Non-profit institutions serving households
40 48 71 111 32 41 57 74
Total 64,298 14,331 81,688 28,670 53,224 12,817 68,417 24,330
Net interest income 49,967 53,018 40,407 44,087
8.2 Analysis of interest by type of assets and liabilities
Nova KBM Group - Nova KBM d.d.
- 1.1.–
30.6.2015-
1.1.–30.6.2014
-1.1.–
30.6.2015 -
1.1.–30.6.2014
Current Non-current Current Non-current Current Non-current Current Non-current
Interest income Balances with the central bank (measured at amortised cost)
5 0 318 0 2 0 298 0
Financial assets held for trading
103 0 78 0 103 0 78 0
Available-for-sale financial assets
16,036 3,417 17,000 7,793 16,018 714 16,896 4,339
Loans and deposits (including finance leases)
10,789 32,003 14,459 38,028 8,281 27,100 11,131 33,413
Held-to-maturity financial assets
63 1,833 240 3,711 0 995 184 2,066
Other financial assets 49 0 61 0 11 0 12 0Total by maturity 27,045 37,253 32,156 49,532 24,415 28,809 28,599 39,818Total 64,298 81,688 53,224 68,417 Interest expenses Financial liabilities to the central bank (measured at amortised cost)
0 74 0 469 0 66 0 446
Financial liabilities held for trading
0 100 0 75 0 100 0 75
Financial liabilities measured at amortised cost
1,571 12,586 6,417 21,709 1,235 11,416 4,886 18,923
Total by maturity 1,571 12,760 6,417 22,253 1,235 11,582 4,886 19,444Total 14,331 28,670 12,817 24,330 Net interest income 49,967 53,018 40,407 44,087

47
9 Dividend income Nova KBM Group -Nova KBM d.d.
1.1.–
30.6.20151.1.–
30.6.20141.1.–
30.6.2015 1.1.–
30.6.2014
Financial assets held for trading 10 0 10 0
Financial assets designated at fair value through profit or loss 503 0 503 0
Available-for-sale financial assets 259 64 207 0
Investments in the equity of Group companies accounted for using the cost method
0 0 528 488
Total 772 64 1,248 488
10 Fee and commission income and fee and commission expenses
Nova KBM Group -Nova KBM d.d.
1.1.–
30.6.20151.1.–
30.6.20141.1.–
30.6.2015 1.1.–
30.6.2014
Fee and commission income 40,808 42,963 21,983 22,909
Guarantees 1,661 1,875 1,416 1,600
Payment transactions 21,879 23,243 9,688 9,741
Brokerage and agency services 327 810 301 789
Transactions in securities for customers 244 172 244 172
Lending operations 2,528 3,162 1,830 1,962
Other services 14,169 13,701 8,504 8,645
Fee and commission expenses 13,208 14,570 1,770 1,843
Banking services 3,404 3,497 1,533 1,517
Brokerage and agency services 501 384 28 19
Stock exchange transactions and other transactions in securities 104 238 100 141
Payment transactions 8,676 9,943 96 153
Other services 523 508 13 13
Net fee and commission income 27,600 28,393 20,213 21,066
11 Realised gains on financial assets and liabilities not measured at fair value through profit or loss
Nova KBM Group - -1.1.–
30.6.2015- -
1.1.–30.6.2014
Realised
gainsRealised
lossesNet realised
gainsRealised
gainsRealised
losses Net realised
gains
Available-for-sale financial assets 4,161 0 4,161 7,615 3 7,612
Loans and advances (including finance leases and other financial assets)
3,121 189 2,932 1,175 348 827
Financial liabilities measured at amortised cost
2 0 2 1 0 1
Total 7,284 189 7,095 8,791 351 8,440

48
Nova KBM d.d. - -1.1.–
30.6.2015- -
1.1.–30.6.2014
Realised
gainsRealised
lossesNet realised
gainsRealised
gainsRealised
losses Net realised
gains
Available-for-sale financial assets 4,051 0 4,051 5,517 3 5,514
Loans and advances (including finance leases and other financial assets)
2,970 83 2,887 568 58 510
Total 7,021 83 6,938 6,085 61 6,024
12 Net losses on financial assets and liabilities held for trading
Nova KBM Group - -1.1.–
30.6.2015- -
1.1.–30.6.2014
Gains LossesNet gains/
(losses)Gains Losses
Net gains/(losses)
Trading in equity instruments 238 278 (40) 308 186 122
Trading in debt securities 31 0 31 0 0 0
Trading in foreign exchange (purchase/sale)
1,283 644 639 539 194 345
Trading in derivatives 1,449 9,167 (7,718) 979 2,091 (1,112)
– futures/forwards 933 9,065 (8,132) 537 1,073 (536)
– swaps 104 102 2 170 62 108
– other derivatives 412 0 412 272 956 (684)
Trading in financial liabilities 0 48 (48) 0 0 0
Total 3,001 10,137 (7,136) 1,826 2,471 (645)
Nova KBM d.d. - -1.1.–
30.6.2015- -
1.1.–30.6.2014
Gains LossesNet gains/
(losses)Gains Losses
Net gains/(losses)
Trading in equity instruments 44 30 14 58 38 20
Trading in debt securities 31 0 31 0 0 0
Trading in foreign exchange (purchase/sale)
1,146 625 521 419 182 237
Trading in derivatives 1,445 9,167 (7,722) 863 2,091 (1,228)
– futures/forwards 933 9,065 (8,132) 537 1,073 (536)
– swaps 100 102 (2) 54 62 (8)
– other derivatives 412 0 412 272 956 (684)
Trading in financial liabilities 0 48 (48) 0 0 0
Total 2,666 9,870 (7,204) 1,340 2,311 (971)
The Group uses derivatives (futures/forwards) to economically hedge its exposure to foreign exchange risk. The effects of derivatives are linked to the effects arising from exchange rate differences (Note 14).
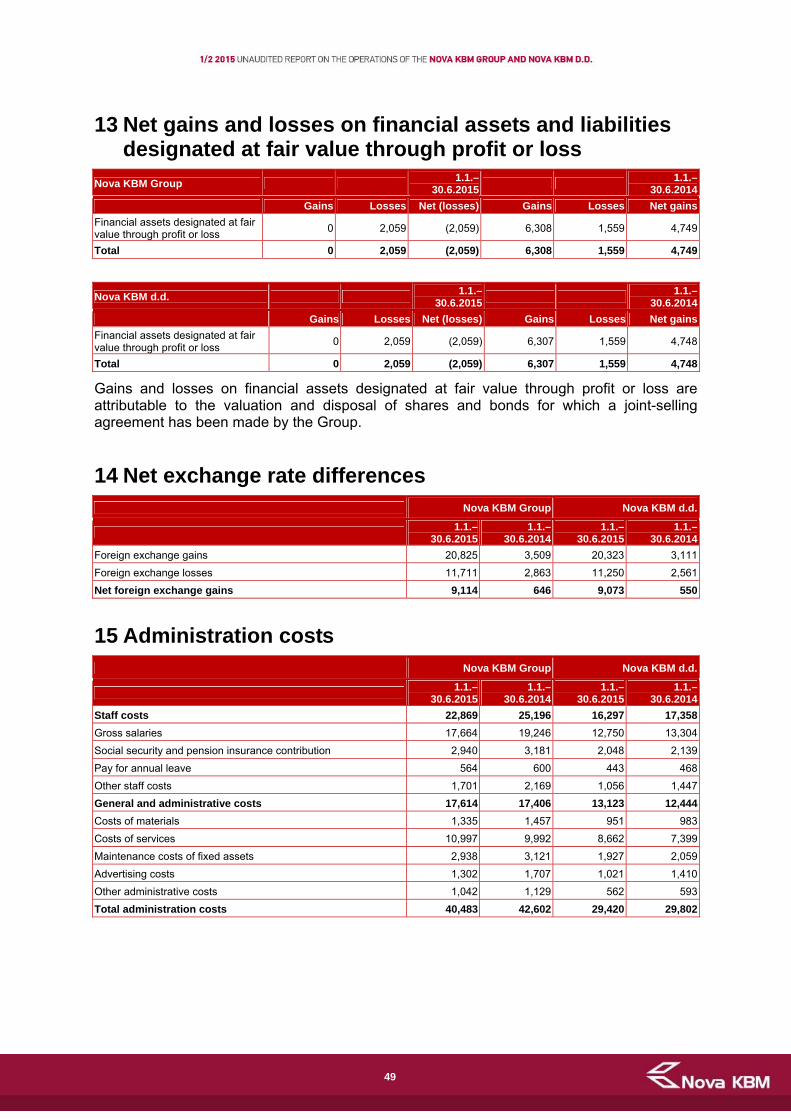
49
13 Net gains and losses on financial assets and liabilities designated at fair value through profit or loss
Nova KBM Group - -1.1.–
30.6.2015- -
1.1.–30.6.2014
Gains Losses Net (losses) Gains Losses Net gains
Financial assets designated at fair value through profit or loss
0 2,059 (2,059) 6,308 1,559 4,749
Total 0 2,059 (2,059) 6,308 1,559 4,749
Nova KBM d.d. - -1.1.–
30.6.2015- -
1.1.–30.6.2014
Gains Losses Net (losses) Gains Losses Net gains
Financial assets designated at fair value through profit or loss
0 2,059 (2,059) 6,307 1,559 4,748
Total 0 2,059 (2,059) 6,307 1,559 4,748
Gains and losses on financial assets designated at fair value through profit or loss are attributable to the valuation and disposal of shares and bonds for which a joint-selling agreement has been made by the Group.
14 Net exchange rate differences Nova KBM Group -Nova KBM d.d.
1.1.–
30.6.20151.1.–
30.6.20141.1.–
30.6.2015 1.1.–
30.6.2014
Foreign exchange gains 20,825 3,509 20,323 3,111
Foreign exchange losses 11,711 2,863 11,250 2,561
Net foreign exchange gains 9,114 646 9,073 550
15 Administration costs Nova KBM Group -Nova KBM d.d.
1.1.–
30.6.20151.1.–
30.6.20141.1.–
30.6.2015 1.1.–
30.6.2014
Staff costs 22,869 25,196 16,297 17,358
Gross salaries 17,664 19,246 12,750 13,304
Social security and pension insurance contribution 2,940 3,181 2,048 2,139
Pay for annual leave 564 600 443 468
Other staff costs 1,701 2,169 1,056 1,447
General and administrative costs 17,614 17,406 13,123 12,444
Costs of materials 1,335 1,457 951 983
Costs of services 10,997 9,992 8,662 7,399
Maintenance costs of fixed assets 2,938 3,121 1,927 2,059
Advertising costs 1,302 1,707 1,021 1,410
Other administrative costs 1,042 1,129 562 593
Total administration costs 40,483 42,602 29,420 29,802

50
16 Provisions Nova KBM Group -Nova KBM d.d.
1.1.–
30.6.20151.1.–
30.6.20141.1.–
30.6.2015 1.1.–
30.6.2014
Provisions for off-balance sheet liabilities (6,858) (6,985) (5,813) (5,778)
Provisions for tax claims and other pending legal issues 1,641 3,137 1,848 3,137
Other provisions 438 277 (115) (388)
Total (4,779) (3,571) (4,080) (3,029)
17 Impairment losses
17.1 Impairment of financial assets not measured at fair value through profit or
loss
Nova KBM Group -Nova KBM d.d.
1.1.–
30.6.20151.1.–
30.6.20141.1.–
30.6.2015 1.1.–
30.6.2014
Available-for-sale financial assets designated at fair value 0 2,671 0 2,671
Financial assets measured at amortised cost 25,566 20,143 11,415 20,418
– demand deposits at banks 0 0 (40) 0
– loans and advances to banks 1 233 1 220
– loans and advances to customers 24,755 19,556 11,221 20,156
– other financial assets 810 354 233 42
Total impairment of financial assets not measured at fair value through profit or loss
25,566 22,814 11,415 23,089
18 Tax expense related to profit or loss from continuing operations
Nova KBM Group -Nova KBM d.d.
1.1.–
30.6.20151.1.–
30.6.20141.1.–
30.6.2015 1.1.–
30.6.2014
Income tax related to profit from continuing operations (645) (296) (482) 0
Deferred tax from continuing operations (3,413) (2,919) (2,976) (2,985)
Total (4,058) (3,215) (3,458) (2,985)
Nova KBM Group -Nova KBM d.d.
1.1.–
30.6.20151.1.–
30.6.20141.1.–
30.6.2015 1.1.–
30.6.2014
Financial assets not measured at fair value through profit or loss 25,566 22,814 11,415 23,089
Other assets 629 (525) 110 20
Total impairment losses 26,195 22,289 11,525 23,109

51
Notes to the statement of financial position items
19 Cash, cash balances at central banks and other demand deposits at banks
- Nova KBM Group -Nova KBM d.d.
30.6.2015 31.12.2014 30.6.2015 31.12.2014
Cash in hand 65,241 64,359 44,486 40,847
Obligatory deposits at central banks 197,212 269,221 163,286 221,167
Other deposits at central banks 14,719 14,771 11,197 11,177
Demand deposits at banks 38,820 73,913 33,626 62,226
Total 315,992 422,264 252,595 335,417
Obligatory deposit funds are available to finance day-to-day operations and are therefore considered as cash equivalent.
19.1 Cash and cash equivalents
- Nova KBM Group -Nova KBM d.d.
30.6.2015 31.12.2014 30.6.2015 31.12.2014
Cash, cash balances at central banks and other demand deposits at banks
315,992 422,264 252,595 335,417
Loans and advances to banks 44,314 32,923 43,169 30,182
Cash and cash equivalents of discontinued operations 22,123 22,644 0 0
Total 382,429 477,831 295,764 365,599
20 Financial assets held for trading Nova KBM Group -Nova KBM d.d.
30.6.2015 31.12.2014 30.6.2015 31.12.2014
Derivatives 188 187 188 187
Equity instruments 2,195 1,654 593 0
Total 2,383 1,841 781 187
Quoted 768 281 593 0
Unquoted 1,615 1,560 188 187
Total 2,383 1,841 781 187
No assets held in the Group´s portfolio of financial assets held for trading have been pledged as collateral.
None of the instruments included in the portfolio of financial assets held for trading have the characteristics to qualify as subordinated debt.

52
20.1 Movements in financial assets held for trading
Nova KBM Group -Nova KBM d.d.
2015 2014 2015 2014
1 January 1,841 1,786 187 612
Increase during the year 33,429 6,385 33,298 4,670
– acquisition 33,293 6,031 33,223 4,526
– exchange rate differences 0 11 0 11
– change in fair value (recovery and reversal of impairment) 62 210 1 0
– other (deferred interest, realised gains) 74 133 74 133
Decrease during the year 32,887 6,330 32,704 5,095
– disposal (sale and redemption) 32,742 4,600 32,672 4,591
– change in fair value (impairment and reversal of recovery) 127 463 14 426
– exchange rate differences 2 6 2 0
– other (deferred interest, realised losses) 16 1,261 16 78
30 June 2015/31 December 2014 2,383 1,841 781 187
21 Financial assets designated at fair value through profit or loss
Nova KBM Group -Nova KBM d.d.
30.6.2015 31.12.2014 30.6.2015 31.12.2014
Quoted equity instruments 15,798 17,857 15,798 17,857
Total 15,798 17,857 15,798 17,857
As of 30 June 2015, the Group had no assets of this portfolio pledged as collateral, and during the six-month period ended 30 June 2015, it did not receive any financial assets of this portfolio from the realisation of collateral provided as security for loans.
The portfolio of financial assets designated at fair value through profit or loss includes equity instruments for which a joint-selling agreement has been made by the Group.
None of the instruments included in the portfolio of financial assets designated at fair value through profit or loss have the characteristics to qualify as subordinated debt.
21.1 Movements in financial assets designated at fair value through profit or loss
Nova KBM Group -Nova KBM d.d.
2015 2014 2015 2014
1 January 17,857 24,586 17,857 24,586
Increase during the year 0 7,277 0 7,277
– change in fair value (recovery and reversal of impairment) 0 5,614 0 5,614
– other 0 1,663 0 1,663
Decrease during the year 2,059 14,006 2,059 14,006
– disposal (sale and redemption) 0 12,447 0 12,447
– change in fair value (impairment and reversal of recovery) 2,059 1,552 2,059 1,552
– other 0 7 0 7
30 June 2015/31 December 2014 15,798 17,857 15,798 17,857

53
22 Available-for-sale financial assets 22.1 Analysis by type
Nova KBM Group -Nova KBM d.d.
30.6.2015 31.12.2014 30.6.2015 31.12.2014
Equity instruments 33,178 19,014 26,923 13,778
Debt securities issued by the state and the central bank 1,475,032 1,377,062 1,268,420 1,185,493
Debt securities issued by banks 32,712 47,692 31,616 44,598
Other debt securities 39,508 38,352 32,477 31,344
Total 1,580,430 1,482,120 1,359,436 1,275,213
As of 30 June 2015, the Group had assets of this portfolio worth €656,936,000 pledged with the Bank of Slovenia for the pool of collateral, the guarantee scheme and the guaranteed claims of depositors. During the six-month period ended 30 June 2015, the Group did not receive any financial assets of this portfolio from the realisation of collateral provided as security for loans. At the end of March 2015, the Group paid a total of €15,651,000 into the Bank Resolution Fund that had been set up by the Bank of Slovenia (€14,252,000 was paid by Nova KBM, while €1,399,000 was paid by PBS).
None of the instruments included in the portfolio of available-for-sale financial assets have the characteristics to qualify as subordinated debt.
22.2 Movements in available-for-sale financial assets
Nova KBM Group Equity
instrumentsDebt securities Total
1 January 2015 19,014 1,463,106 1,482,120
Recognition of additional financial assets 16,014 241,574 257,588
Interest 0 (13,245) (13,245)
Net revaluation through equity (747) (14,829) (15,576)
Derecognition of financial assets upon disposal (1,409) (8,075) (9,484)
Derecognition of financial assets upon maturity 0 (125,134) (125,134)
Net gains on sale 306 3,855 4,161
30 June 2015 33,178 1,547,252 1,580,430
Nova KBM Group Equity
instrumentsDebt securities Total
1 January 2014 34,761 1,432,103 1,466,864
Recognition of additional financial assets 2,949 514,209 517,158
Interest 0 934 934
Net exchange rate differences (3) (1,167) (1,170)
Net revaluation through equity 4,049 37,818 41,867
Net impairment through profit or loss (3,050) (450) (3,500)
Derecognition of financial assets upon disposal (24,804) (106,901) (131,705)
Derecognition of financial assets upon maturity 0 (412,894) (412,894)
Net gains on sale 5,156 8,180 13,336
Other (44) (8,726) (8,770)
31 December 2014 19,014 1,463,106 1,482,120

54
Nova KBM d.d. Equity
instrumentsDebt securities Total
1 January 2015 13,778 1,261,435 1,275,213
Recognition of additional financial assets 14,615 216,991 231,606
Interest 0 (11,999) (11,999)
Net revaluation through equity (664) (12,683) (13,347)
Derecognition of financial assets upon disposal (1,012) (8,076) (9,088)
Derecognition of financial assets upon maturity 0 (117,000) (117,000)
Net gains on sale 206 3,845 4,051
30 June 2015 26,923 1,332,513 1,359,436
Nova KBM d.d. Equity
instrumentsDebt securities Total
1 January 2014 29,820 1,180,979 1,210,799
Recognition of additional financial assets 2,869 445,606 448,475
Interest 0 2,029 2,029
Net revaluation through equity 2,987 30,049 33,036
Net impairment through profit or loss (3,022) (450) (3,472)
Derecognition of financial assets upon disposal (23,908) (38,479) (62,387)
Derecognition of financial assets upon maturity 0 (361,931) (361,931)
Net gains on sale 5,032 3,632 8,664
31 December 2014 13,778 1,261,435 1,275,213
23 Loans and advances to banks
Nova KBM Group -Nova KBM d.d.
30.6.2015 31.12.2014 30.6.2015 31.12.2014
Current loans 79,334 47,915 73,190 47,199
Impairment of current loans (4) (3) 0 0
Non-current loans 2,202 2,212 16,779 17,113
Impairment of non-current loans 0 0 (5,130) (5,013)
Total – net amount 81,532 50,124 84,839 59,299
Impairment 4 3 5,130 5,013
Total – gross amount 81,536 50,127 89,969 64,312

55
24 Loans and advances to customers
Nova KBM Group -Nova KBM d.d.
30.6.2015 31.12.2014 30.6.2015 31.12.2014
Current loans 439,711 500,375 273,552 333,318
Impairment of current loans (143,442) (139,005) (54,195) (61,026)
Non-current loans 2,009,668 2,024,575 1,665,354 1,662,228
Impairment of non-current loans (478,947) (471,195) (353,975) (344,483)
Claims under guarantees 13,752 14,752 11,633 9,747
Impairment of claims under guarantees (10,487) (8,627) (9,033) (6,490)
Total – net amount 1,830,255 1,920,875 1,533,336 1,593,294
Impairment 632,876 618,827 417,203 411,999
Total – gross amount 2,463,131 2,539,702 1,950,539 2,005,293
24.1 Movements in impairment of loans and advances to customers
Nova KBM Group -Nova KBM d.d.
2015 2014 2015 2014
1 January 618,827 589,957 411,999 446,871
Net impairment of principal 24,755 51,823 11,221 50,530
Additional impairment of interest 8,249 16,931 6,363 12,275
Additional impairment/reversal of impairment of fees (22) (592) (22) 179
Write-off of loans and advances to customers (15,576) (52,533) (10,006) (48,297)
Exchange rate differences 82 (375) 0 0
Assets received from subsidiaries 0 0 193 33,849
Conversion of loans into equity of subsidiaries 0 0 0 (83,408)
Other (3,439) 13,616 (2,545) 0
30 June 2015/31 December 2014 632,876 618,827 417,203 411,999
Recognition of additional impairment/reversal of impairment of interest and fees on loans given to customers is reflected in Note 8 (Interest income and interest expenses) and Note 10 (Fee and commission income and fee and commission expenses) to the income statement.
25 Other financial assets Nova KBM Group -Nova KBM d.d.
30.6.2015 31.12.2014 30.6.2015 31.12.2014
Cheques 11 46 10 39
Claims for fees and commissions 1,567 1,909 831 1,396
Accounts receivables 2,455 2,324 166 38
Other 20,799 16,064 15,639 10,281
Total – net amount 24,832 20,343 16,646 11,754
Impairment 5,546 4,552 1,677 1,537
Total – gross amount 30,378 24,895 18,323 13,291
The largest proportion of the figure shown under the item 'Other' is attributable to claims arising from business relationships.

56
25.1 Movements in other financial assets
Nova KBM Group -Nova KBM d.d.
2015 2014 2015 2014
1 January 4,552 4,853 1,537 1,667
Assets acquired through business combinations 0 8 0 8
Additional impairment of principal 810 218 233 222
Additional impairment of interest 12 30 13 29
Additional impairment of fees 39 390 39 240
Write-off of other financial assets (751) (759) (145) (628)
Exchange rate differences 7 (2) 0 (1)
Other 877 (186) 0 0
30 June 2015/31 December 2014 5,546 4,552 1,677 1,537
Recognition of additional impairment/reversal of impairment of interest and fees on other financial assets is reflected in Note 8 (Interest income and interest expenses) and Note 10 (Fee and commission income and fee and commission expenses) to the income statement.
26 Held-to-maturity financial assets
Nova KBM Group -Nova KBM d.d.
30.6.2015 31.12.2014 30.6.2015 31.12.2014
Debt securities 153,394 206,540 59,347 89,950
– current securities issued by the state and the central bank 22,487 30,930 0 0
– non-current securities issued by the state and the central bank 117,104 142,078 55,383 79,943
– non-current securities issued by banks and savings banks 4,991 24,920 0 6,136
– non-current securities issued by other issuers 8,812 8,612 3,964 3,871
Total 153,394 206,540 59,347 89,950
Quoted 153,394 206,540 59,347 89,949
Unquoted 0 0 0 1
Total 153,394 206,540 59,347 89,950
As of 30 June 2015, the Group had assets of this portfolio worth €103,021,000 pledged with the Bank of Slovenia for the pool of collateral and the guarantee scheme.
26.1 Movements in held-to-maturity financial assets
Nova KBM Group -Nova KBM d.d.
2015 2014 2015 2014
1 January 206,540 280,153 89,950 192,437
Increase during the year 15,222 91,313 993 3,553
– acquisition 13,326 84,527 0 0
– reversal of impairment 0 7 0 0
– other (deferred interest) 1,896 6,779 993 3,553
Decrease during the year 68,368 164,926 31,596 106,040
– disposal (sale and redemption) 64,428 154,865 30,180 100,000
– impairment 0 178 0 0
– exchange rate differences 0 8 0 0
– other (interest received) 3,940 9,875 1,416 6,040
30 June 2015/31 December 2014 153,394 206,540 59,347 89,950
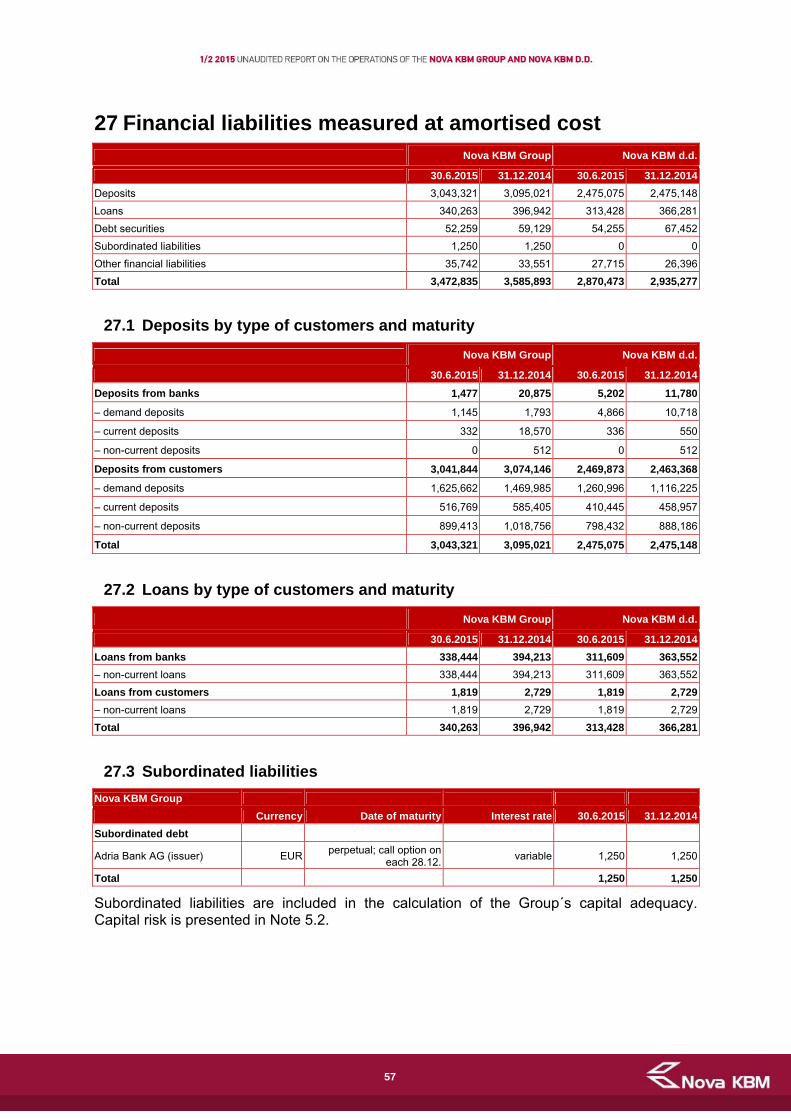
57
27 Financial liabilities measured at amortised cost
Nova KBM Group -Nova KBM d.d.
30.6.2015 31.12.2014 30.6.2015 31.12.2014
Deposits 3,043,321 3,095,021 2,475,075 2,475,148
Loans 340,263 396,942 313,428 366,281
Debt securities 52,259 59,129 54,255 67,452
Subordinated liabilities 1,250 1,250 0 0
Other financial liabilities 35,742 33,551 27,715 26,396
Total 3,472,835 3,585,893 2,870,473 2,935,277
27.1 Deposits by type of customers and maturity
Nova KBM Group -Nova KBM d.d.
30.6.2015 31.12.2014 30.6.2015 31.12.2014
Deposits from banks 1,477 20,875 5,202 11,780
– demand deposits 1,145 1,793 4,866 10,718
– current deposits 332 18,570 336 550
– non-current deposits 0 512 0 512
Deposits from customers 3,041,844 3,074,146 2,469,873 2,463,368
– demand deposits 1,625,662 1,469,985 1,260,996 1,116,225
– current deposits 516,769 585,405 410,445 458,957
– non-current deposits 899,413 1,018,756 798,432 888,186
Total 3,043,321 3,095,021 2,475,075 2,475,148
27.2 Loans by type of customers and maturity
Nova KBM Group -Nova KBM d.d.
30.6.2015 31.12.2014 30.6.2015 31.12.2014
Loans from banks 338,444 394,213 311,609 363,552
– non-current loans 338,444 394,213 311,609 363,552
Loans from customers 1,819 2,729 1,819 2,729
– non-current loans 1,819 2,729 1,819 2,729
Total 340,263 396,942 313,428 366,281
27.3 Subordinated liabilities
Nova KBM Group
Currency Date of maturity Interest rate 30.6.2015 31.12.2014
Subordinated debt - - - -
Adria Bank AG (issuer) EUR perpetual; call option on
each 28.12.variable 11,250 1,250
Total - - - 1,250 1,250
Subordinated liabilities are included in the calculation of the Group´s capital adequacy. Capital risk is presented in Note 5.2.

58
27.4 Other financial liabilities
Nova KBM Group -Nova KBM d.d.
30.6.2015 31.12.2014 30.6.2015 31.12.2014
Liabilities for fees and commissions 0 71 1 35
Liabilities for gross salaries of employees 2,975 3,141 2,229 2,305
Liabilities to suppliers 1,409 4,446 1,059 3,528
Liabilities related to payment card transactions 9,899 7,965 9,875 7,939
Liabilities related to ATM transactions 2,261 1,747 2,069 1,614
Liabilities related to funds provided by customers for making payments abroad
1,892 659 1,846 647
Liabilities related to cash transactions 5,870 2,596 1,955 1,279
Liabilities arising from participation in profits – dividends, shares of profits
46 22 22 22
Accruals and deferred income 6,443 5,797 3,180 2,596
Surplus arising from authorised transactions for customers 123 179 123 179
Other financial liabilities 4,824 6,928 5,356 6,252
Total 35,742 33,551 27,715 26,396
The largest proportion of the amount shown under the item 'Other financial liabilities' arises from the balances held in transitional accounts.
28 Provisions
Nova KBM Group Provisions for restructuring
Provisions for pending legal issues
Provisions for pensions and
similar benefits
Provisions for off-balance
sheet liabilities
Other provisions
Total
1 January 2015 2,028 18,753 7,334 52,272 2,624 83,011
Net creation of provisions through profit or loss
0 1,641 481 (6,858) (43) (4,779)
– provisions made during the year 0 6,133 676 10,318 0 17,127
– provisions reversed during the year 0 (4,492) (195) (17,176) (43) (21,906)
Provisions used during the year (370) (1,229) (312) 0 0 (1,911)
Other 0 0 1 0 0 1
30 June 2015 1,658 19,165 7,504 45,414 2,581 76,322
Nova KBM Group Provisions for restructuring
Provisions for pending legal issues
Provisions for pensions and
similar benefits
Provisions for off-balance
sheet liabilities
Other provisions
Total
1 January 2014 11,280 17,785 6,549 64,060 489 100,163
Net creation of provisions through profit or loss
(8,151) 1,151 490 (11,622) 2,377 (15,755)
– provisions made during the year 1,449 4,418 1,343 31,261 2,394 40,865
– provisions reversed during the year
(9,600) (3,267) (853) (42,883) (17) (56,620)
Net creation/reversal of provisions through equity
0 0 864 0 0 864
Provisions used during the year (1,101) (167) (428) 0 (238) (1,934)
Exchange rate differences 0 (5) (10) (78) (1) (94)
Other 0 (11) (131) (88) (3) (233)
31 December 2014 2,028 18,753 7,334 52,272 2,624 83,011

59
Nova KBM d.d. Provisions for restructuring
Provisions for pending legal issues
Provisions for pensions and
similar benefits
Provisions for off-balance
sheet liabilities
Other provisions
Total
1 January 2015 2,028 17,508 4,651 50,225 193 74,605
Net creation of provisions through profit or loss
0 1,848 (115) (5,813) 0 (4,080)
– provisions made during the year 0 6,134 0 9,184 0 15,318
– provisions reversed during the year 0 (4,286) (115) (14,997) 0 (19,398)
Provisions used during the year (370) (1,229) (60) 0 0 (1,659)
30 June 2015 1,658 18,127 4,476 44,412 193 68,866
Nova KBM d.d. Provisions for restructuring
Provisions for pending legal issues
Provisions for pensions and
similar benefits
Provisions for off-balance
sheet liabilities
Other provisions
Total
1 January 2014 1,680 15,867 3,940 61,943 421 83,851
Net creation of provisions through profit or loss
1,449 1,721 91 (11,718) (3) (8,460)
– provisions made during the year 1,449 3,872 442 27,689 0 33,452
– provisions reversed during the year 0 (2,151) (351) (39,407) (3) (41,912)
Net reversal of provisions through equity
0 0 725 0 0 725
Provisions used during the year (1,101) (80) (105) 0 (225) (1,511)
31 December 2014 2,028 17,508 4,651 50,225 193 74,605
29 Share capital
Nova KBM Group and Nova KBM d.d. 30.6.2015 31.12.2014
Ordinary shares 150,000 150,000
– subscribed by the state 150,000 150,000
In the six-month period ended 30 June 2015 and during 2014, the Group did not purchase or sell treasury shares, and no treasury shares were held by Nova KBM at the end of June 2015, nor were shares of Nova KBM held by any of the Group companies.
30 Accumulated other comprehensive income
Nova KBM Group -Nova KBM d.d.
30.6.2015 31.12.2014 30.6.2015 31.12.2014
Other accumulated comprehensive income in respect of available-for-sale financial assets
30,401 43,375 23,213 34,292
– revaluation 36,600 52,224 27,968 41,315
– deferred taxes (6,199) (8,849) (4,755) (7,023)
Other accumulated comprehensive income (535) (534) (433) (433)
– revaluation (552) (551) (433) (433)
– deferred taxes 17 17 0 0
Total 29,866 42,841 22,780 33,859

60
30.1 Movements in accumulated other comprehensive income
Nova KBM Group -Nova KBM d.d.
2015 2014 2015 2014
1 January 42,841 8,981 33,859 7,140
Net change arising from the valuation of available-for-sale financial assets
(15,624) 41,722 (13,347) 33,036
– valuation gains/(losses) taken to equity (15,624) 41,718 (13,347) 33,036
– transferred to profit or loss 0 4 0 0
Other net change in valuation (1) (850) 0 (725)
Net change in deferred taxes 2,650 (7,012) 2,268 (5,592)
30 June 2015/31 December 2014 29,866 42,841 22,780 33,859
31 Reserves from profit
Nova KBM Group -Nova KBM d.d.
30.6.2015 31.12.2014 30.6.2015 31.12.2014
Regulatory reserves 2,302 2,302 1,796 1,796
Statutory reserves 17,062 17,062 17,062 17,062
Other reserves from profit 8,531 8,531 8,531 8,531
Total 27,895 27,895 27,389 27,389
31.1 Movements in reserves from profit
Nova KBM Group -Nova KBM d.d.
2015 2014 2015 2014
1 January 27,895 663 27,389 0
Increase in regulatory reserves 0 1,639 0 1,796
Increase in statutory reserves 0 17,062 0 17,062
Increase in other reserves 0 8,531 0 8,531
30 June 2015/31 December 2014 27,895 27,895 27,389 27,389
In accordance with the provisions of the Companies Act and Nova KBM´s Articles of Association, the Nova KBM Management Board has, with the consent of the Supervisory Board, appropriated the 2014 net profit for reserves as follows:
for regulatory reserves: €1,796,000 for statutory reserves: €17,062,000 for other reserves from profit: €8,531,000.

61
Other notes
32 Commitments and contingent liabilities by type
Nova KBM Group - Nova KBM d.d.
30.6.2015 30.6.2015
Current Non-current Total Current Non-current Total
Financial guarantees 62,207 16,448 78,655 58,772 13,673 72,445
Service guarantees 115,282 68,534 183,816 94,138 59,114 153,252
Total guarantees 177,489 84,982 262,471 152,910 72,787 225,697
Unsecured letters of credit 33 0 33 127 0 127
Approved and undrawn loans 126,380 12,211 138,591 124,573 11,762 136,335
Approved and undrawn overdrafts 190,063 1,062 191,125 163,578 0 163,578
Approved credit lines 6,170 0 6,170 0 0 0
Other 42 0 42 42 0 42
Total commitments and contingent liabilities
322,655 13,273 335,928 288,193 11,762 299,955
Derivatives 66,401 0 66,401 66,401 0 66,401
Total 566,578 98,255 664,833 507,631 84,549 592,180
Nova KBM Group - Nova KBM d.d.
31.12.2014 31.12.2014
Current Non-current Total Current Non-current Total
Financial guarantees 48,703 30,379 79,082 42,934 26,854 69,788
Service guarantees 107,269 73,784 181,053 87,509 65,142 152,651
Total guarantees 155,972 104,163 260,135 130,443 91,996 222,439
Unsecured letters of credit 58 0 58 172 0 172
Approved and undrawn loans 138,665 4,290 142,955 135,475 4,034 139,509
Approved and undrawn overdrafts 180,752 1,232 181,984 155,570 0 155,570
Approved credit lines 8,078 0 8,078 0 0 0
Total commitments and contingent liabilities
327,495 5,522 333,017 291,045 4,034 295,079
Derivatives 124,910 0 124,910 122,910 0 122,910
Total 608,435 109,685 718,120 544,570 96,030 640,600

62
33 Related party transactions 33.1 Statement of financial position and off-balance sheet items
- - Associates - Associates - Subsidiaries
Nova KBM Group Nova KBM d.d. Nova KBM d.d.
- 30.6.2015 31.12.2014 30.6.2015 31.12.2014 30.6.2015 31.12.2014
Assets
Deposits and loans given (gross amount)
64 2 65 2 44,676 48,732
– deposits and loans to banks 0 0 0 0 14,577 14,901
– deposits and loans to customers
1 2 1 2 30,080 33,512
– other financial assets 63 0 64 0 19 319
Investments in securities 2,237 2,237 2,237 2,237 177,935 177,935
– equity instruments 2,237 2,237 2,237 2,237 177,935 177,935
Other claims 0 0 0 0 90 0
Liabilities
Deposits and loans received 1,708 1,755 1,703 1,755 21,205 15,914
– deposits and loans from banks
0 0 0 0 3,724 10,080
– deposits and loans from customers
1,703 1,755 1,703 1,755 16,622 5,675
– other financial liabilities 5 0 0 0 859 159
Securities issued 0 0 0 0 1,997 8,323
– debt securities 0 0 0 0 1,997 8,323
Off-balance sheet items 4 4 4 4 2,528 1,983
- - Key management
personnel- Other related persons
Nova KBM Group Nova KBM d.d. Nova KBM Group Nova KBM d.d.
- 30.6.2015 31.12.2014 30.6.2015 31.12.2014 30.6.2015 31.12.2014 30.6.2015 31.12.2014
Assets
Deposits and loans given (gross amount)
236 332 236 332 43,307 44,406 297 306
– deposits and loans to customers
236 332 236 332 43,296 44,406 297 306
– other financial assets
0 0 0 0 11 0 0 0
Investments in securities
0 0 0 0 417 417 383 383
– equity instruments 0 0 0 0 417 417 383 383
Liabilities
Deposits and loans received
469 495 419 495 1,589 1,678 620 654
– deposits and loans from customers
469 495 419 495 1,355 1,479 506 535
– other financial liabilities
0 0 0 234 199 114 119
Off-balance sheet items
49 44 49 44 4,062 3,487 118 122
Key management personnel of the Group include members of the Management Board, executive directors and members of the Supervisory Board of Nova KBM.
Other related persons of the Group include:
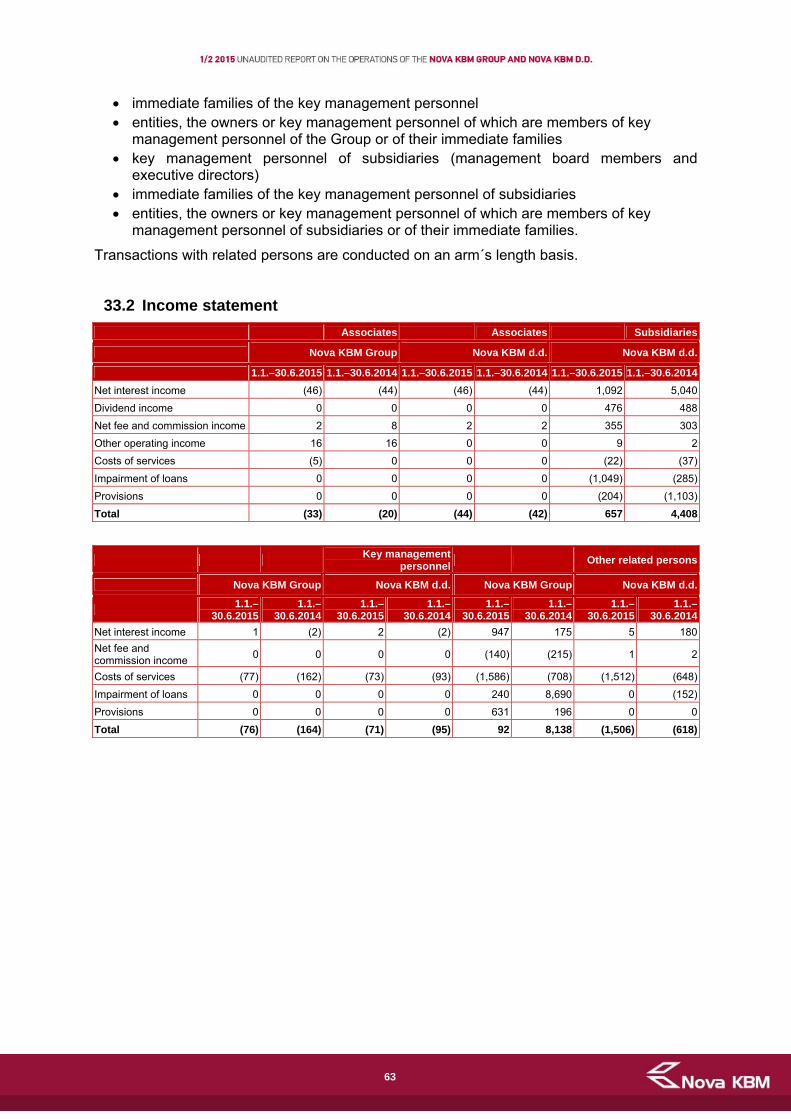
63
immediate families of the key management personnel entities, the owners or key management personnel of which are members of key
management personnel of the Group or of their immediate families key management personnel of subsidiaries (management board members and
executive directors) immediate families of the key management personnel of subsidiaries entities, the owners or key management personnel of which are members of key
management personnel of subsidiaries or of their immediate families.
Transactions with related persons are conducted on an arm´s length basis.
33.2 Income statement
- - Associates - Associates - Subsidiaries
Nova KBM Group Nova KBM d.d. Nova KBM d.d.
- 1.1.–30.6.2015 1.1.–30.6.2014 1.1.–30.6.2015 1.1.–30.6.2014 1.1.–30.6.2015 1.1.–30.6.2014
Net interest income (46) (44) (46) (44) 1,092 5,040
Dividend income 0 0 0 0 476 488
Net fee and commission income 2 8 2 2 355 303
Other operating income 16 16 0 0 9 2
Costs of services (5) 0 0 0 (22) (37)
Impairment of loans 0 0 0 0 (1,049) (285)
Provisions 0 0 0 0 (204) (1,103)
Total (33) (20) (44) (42) 657 4,408
- - Key management
personnel- Other related persons
Nova KBM Group Nova KBM d.d. Nova KBM Group Nova KBM d.d.
- 1.1.–
30.6.2015 1.1.–
30.6.2014 1.1.–
30.6.20151.1.–
30.6.20141.1.–
30.6.20151.1.–
30.6.2014 1.1.–
30.6.2015 1.1.–
30.6.2014
Net interest income 1 (2) 2 (2) 947 175 5 180
Net fee and commission income
0 0 0 0 (140) (215) 1 2
Costs of services (77) (162) (73) (93) (1,586) (708) (1,512) (648)
Impairment of loans 0 0 0 0 240 8,690 0 (152)
Provisions 0 0 0 0 631 196 0 0
Total (76) (164) (71) (95) 92 8,138 (1,506) (618)

64
33.3 Loans and guarantees given
Nova KBM Group - Management
Board members
-Supervisory
Board members
-
Other Group employees on
individual contracts
- 30.6.2015 31.12.2014 30.6.2015 31.12.2014 30.6.2015 31.12.2014
Loans 1 92 25 29 2,091 2,111
Average interest rate on loans (%)
3.23 4.14 3.49 3.61 3.19 3.36
Repayments 3 7 3 7 186 496
Nova KBM d.d. - Management
Board members
-Supervisory
Board members
-
Other Bank employees on
individual contracts
- 30.6.2015 31.12.2014 30.6.2015 31.12.2014 30.6.2015 31.12.2014
Loans 1 92 25 29 1,306 1,336
Average interest rate on loans (%)
3.23 4.14 3.49 3.61 3 3.22
Repayments 3 7 3 7 94 262
34 Exposure to the Bank of Slovenia, Republic of Slovenia and state-owned institutions
Nova KBM Group -Nova KBM d.d.
Exposure to: 30.6.2015 31.12.2014 30.6.2015 31.12.2014
Bank of Slovenia 227,571 281,328 188,725 232,344
Republic of Slovenia 1,278,420 1,260,066 1,051,638 1,036,914
State-owned institutions 438,153 452,348 494,989 496,096
Total exposure to the Bank of Slovenia, Republic of Slovenia and state-owned institutions
1,944,144 1,993,742 1,735,352 1,765,354
Share of total assets (%) 45.95 45.63 49.02 48.93
Off-balance sheet items covered by collateral provided by the Bank of Slovenia or the Republic of Slovenia
901 901 901 901
Total assets 4,230,898 4,369,010 3,540,025 3,608,215

65
35 Remuneration Nova KBM Group -Nova KBM d.d.
1.1.–30.6.2015 1.1.–30.6.2014 1.1.–30.6.2015 1.1.–30.6.2014
Management Board 147 136 147 136
Robert Senica 65 0 65 0
Sabina Župec Kranjc 61 0 61 0
Aleš Hauc 21 68 21 68
Igor Žibrik 0 68 0 68
Supervisory Board members 50 69 50 69
Members of Supervisory Board committees 30 36 30 36
Other Group employees on individual contracts 3,424 3,639 1,412 1,513
Total 3,651 3,880 1,639 1,754
Remuneration paid to Management Board members comprises: salary, pay for annual leave, bonuses, the payment of supplementary pension insurance premiums, and other remuneration under employment contracts.
Remuneration paid to members of the Supervisory Board, the Audit Committee, and the Remuneration and Nomination Committee comprises: a payment for holding the office, and to cover attendance fees, reimbursement of costs, seminar participation fees, and the payment of liability insurance premiums.
Remuneration paid to other Group employees working on individual contracts comprises: salary, pay for annual leave, bonuses, the payment of supplementary pension insurance premiums, and other remuneration under employment contracts (severance benefits paid to employees who are made redundant for business reasons, retirement benefits, compensation for a non-competition clause, and some other remuneration under employment contracts).
Igor Žibrik ended his term of office as a member of the Bank Management Board on 31 October 2014. Robert Senica and Sabina Župec Kranjc were appointed as new members of the Bank Management Board on 1 August 2014 and 17 November 2014, respectively. In February 2015, the Supervisory Board recalled Aleš Hauc from the position of the President of the Bank Management Board, and appointed Robert Senica, who was then a member of the Management Board, as the new President.
The total amount paid in the first six months of 2015 to Robert Senica, President of the Management Board, and Aleš Hauc, ex-President of the Management Board, for meeting attendances, reimbursement of costs, and bonuses in respect of their work on the supervisory board of the Group´s associated company was €1,260.01 and €3,470.04, respectively.
36 Events after the statement of financial position date No significant events have been recorded by the Bank or the Group since the statement of financial position date.

1
Financial calendar of Nova KBM for the rest of 2015 Financial calendar of Nova KBM for the rest of 2015 All announcements will be available through the electronic dissemination system of the
Ljubljana Stock Exchange (www.ljse.si
All announcements will be available through the electronic dissemination system of the
Ljubljana Stock Exchange (www.ljse.si), and on Nova KBM´s website (www.nkbm.si).
Type of publication or event Anticipated date of
publication or eventPreliminary information on the results of Nova KBM d.d. for the
period January – September 2015 Friday, 30 October 2015
Unaudited report on the operations of the Nova KBM Group
and Nova KBM d.d. for the period January – September 2015 Monday, 30 November 2015
The 2016 Business Plan of the Nova KBM Group and Nova
KBM d.d. Tuesday, 22 December 2015
The dates specified above are indicative only and are subject to change. Any changes in dates will be posted on Nova KBM´s website.
Nova KBM d.d., August 2015