Embed Size (px)
Citation preview

177
by Rob Singmaster and Andrea Heilbronner
Corporate Foreign Tax Credit, 1998
Rob Singmaster and Andrea Heilbronner are economistswith the Special Studies Returns Analysis Section. Thisarticle was written under the direction of Chris Carson,Chief.
F or 1998, U.S. corporations claimed foreign taxcredits totaling $37.3 billion (after limitations).The 5,927 companies claiming these credits
earned $147.1 billion in foreign-source “taxableincome” and paid $47.6 billion in income taxes toforeign governments. Under the foreign tax creditprovisions of the Internal Revenue Code, thesecorporations were able to lower their U.S. incometax liability from $132.7 billion (U.S. income taxbefore credits) to 95.4 billion, a 28.1-percent reduc-tion. Other credits, including the U.S. possessionstax credit and the general business tax credit, furtherreduced their US tax liability to $88.7 billion. The$37.3-billion foreign tax credit for 1998 represents a$4.9-billion decrease from 1997.
U.S. corporations claiming a foreign tax creditreported worldwide taxable income (comprised ofboth U.S. and foreign-source income) totaling $377.1billion, 39 percent of which was from foreignsources. The United Kingdom, Canada, Germany,Japan, and the Netherlands were the top five leadingsources of foreign income for U.S. corporations thatclaimed a foreign tax credit. These countries, with$64.6 billion, accounted for 43.9 percent of the year’sforeign-source income. The United Kingdom, with$22.2 billion, was the largest source, followed byCanada, with $13.4 billion.
BackgroundStarting with 1913, the first year of the modern U.S.income tax, U.S. taxpayers have been subject totaxation of their worldwide incomes. U.S. corpora-tions with international operations or investments mayalso be taxed on their foreign-source incomes in thecountry in which the income is earned. This resultsin double taxation, whereby income earned overseasis taxed first by a foreign government and then againby the United States. To help alleviate this doubletaxation, the United States adopted foreign tax creditprovisions starting with the Revenue Act of 1918.The foreign tax credit allows U.S. corporations tooffset the U.S tax on their foreign-source “taxableincome” with a credit for the foreign taxes that werealready paid.
Since their inception, the foreign tax credit’sprovisions have been modified numerous times. Theoriginal foreign tax credit introduced for 1918 allowedtaxpayers an unlimited credit against U.S incometaxes for any taxes paid to or accrued in a foreigncountry or U.S. possession. Therefore, in caseswhere the foreign tax rate was higher than the taxrate in the United States, part of the U.S tax ondomestic earned income was offset by the credit fortaxes paid to a foreign jurisdiction. This resulted inan unintended loss of tax revenue on domestic in-come and led to the development of a foreign taxcredit limitation.
The Revenue Act of 1921 helped to alleviate thisproblem by introducing an “overall limitation” whichrestricted the foreign tax credit to the lesser of: 1)the U.S. income tax multiplied by the ratio of foreign-source taxable income to worldwide taxable income,or 2) the actual foreign taxes paid. The limitationeffectively placed a ceiling, equivalent to the U.S. taxon foreign-source income, on the amount of taxesthat a corporation could credit.
The overall limitation restricted the aggregate taxcredit, but corporations were still free to arrange theiroverseas business activities so as to maximize theircredits. Specifically, corporations with operations orinvestments in foreign jurisdictions whose tax ratewas higher than the U.S. tax rate could offset whatwould otherwise be excess credits by investing in lowtax jurisdictions. In this way, corporations wereblending credits from high- and low-taxed countriesto maximize their overall credit amounts. To preventthis, Congress enacted a “per-country” limitation,which required taxpayers to calculate a foreign taxcredit limitation on a country-by-country basis. Theper-country limitation was used in various forms from1932 through 1976.
Prior to 1962, corporations were allowed tocombine all types of foreign-source income whencomputing their foreign tax credit limitations. How-ever, with the passage of the Revenue Act of 1962,corporations were required to compute a separatelimitation for non-business related interest income.The intent was to prevent corporations with foreign-source income from business operations that weretaxed at rates higher than the U.S. rate, from makinginterest-bearing investments abroad to generateadditional foreign income that was subject to little orno foreign tax. This additional lower-taxed, foreign

178
Corporate Foreign Tax Credit, 1998
178
interest income, combined with the higher-taxed,other foreign income, enabled corporations to in-crease the foreign tax credit limitation. By separatinglow-taxed non-business income from higher-taxedbusiness income, U.S. corporations were limited intheir ability to arrange foreign investments at theexpense of U.S. taxation.
Since 1962, the number of separate incomecategories has increased, especially as a result of theTax Reform Act of 1986. The current structure ofstatutory categories for foreign source income re-quires separate treatment for different types ofincome and for income from different industrialactivities.
For 1998, taxpayers were required to compute aseparate foreign tax credit limitation for each of thefollowing income categories or “baskets” (thesestatutory categories are defined in the Explanation ofSelected Terms section):
* Passive income,* High withholding tax interest,* Financial services income,* Shipping income,* Income re-sourced by treaty,* Dividends from each “noncontrolled” foreign
corporation as defined in Internal RevenueCode section 902,
* Dividends from an Interest-Charge DomesticInternational Sales Corporation (IC-DISC) orformer DISC,
* Certain distributions from a Foreign SalesCorporation (FSC) or Former FSC [1],
* Taxable income attributable to foreign tradeincome,
* Income from sanctioned countries, per Inter-nal Revenue Code section 901(j) [2], and
* All other income from outside the UnitedStates (commonly referred to as generallimitation or overall “basket” income).
Rules regarding excess or unused credits havevaried over time. While different regulations wereused prior to 1958, the Technical Amendments Actof 1958 introduced the carryover and carryback of“unused” foreign taxes. The act specified that anytaxes that exceeded the current-year limitation (andthat could, therefore, not be used) could be carriedback 2 years to be retroactively applied (necessitatingan amended return or possibly a claim for a refund)or carried forward 5 years, subject to the current-
year foreign tax credit limitation for each year. As aresult of this act, the total foreign taxes for eachseparate limitation category for any given year in-clude current-year foreign taxes plus taxes carriedforward from previous years. (The foreign taxesavailable for the credit shown in this article includeonly current-year taxes and those carried forward to1998 from previous years; no taxes carried back to1998 are included in the statistics. Amended returnsare not included in the data as they were (or will be)filed after the data were collected.)
Foreign Tax CreditTo claim a foreign tax credit, a U.S. corporation musthave foreign-source income, pay foreign income taxon that income, and have a U.S. income tax liability.The foreign tax credit is elective; if the taxpayerelects to take the credit, then no deduction for thoseforeign taxes is available. Most taxpayers elect totake the credit, since it offsets the U.S. income taxdollar for dollar, rather than a deduction, which mayonly offset every dollar of U.S. tax by the percentageof the tax rate.
Between 1993 and 1998, the number of U.S.corporations electing to credit foreign taxes variedfrom year to year, with 1998 showing the lowestnumber (Figure A). For 1998, there were 5,927corporations that chose to credit their taxes, downfrom 6,569 the previous year [3]. However, since1991, the foreign tax credit rose, despite the reductionin the number of corporations that claimed it. TaxYear 1998 was the first year since 1991 when theforeign tax credit, along with worldwide taxableincome, U.S. income tax before credits, and foreign-source taxable income all fell. While the number ofreturns with a foreign tax credit dropped 9.8 percentbetween 1997 and 1998, worldwide taxable incomefell by 8 percent. Additionally, the U.S. income taxbefore credits fell 8.3 percent, from $144.8 billion for1997 to $132.7 billion for 1998, and foreign-sourcetaxable income fell 6.9 percent, from $158 billion for1997 to $147.1 billion for 1998. During this sametime period, current-year foreign taxes actually rose,by 5.5 percent, from $45.1 billion to $47.6 billion, butthe amount of foreign tax credit claimed fell 11.6percent. However, the decreases for 1998 arecompared to 1997 numbers, which representedrecord highs. Overall, the 1998 decreases weremore in line with 1996. Worldwide income, while 8

179
Corporate Foreign Tax Credit, 1998
percent less than for 1997, was still 2 percent morethan for 1996, and U.S. income tax before creditswas 1.5 percent more than for 1996. Foreign-sourcetaxable income for 1998 was 2.5 percent less than1996, while the 1998 foreign tax credit was 7.2 per-cent less than for 1996.
Separate Limitation Categories, Tax Year 1998As a result of the Revenue Act of 1962 and the TaxReform Act of 1986, U.S. corporations are requiredto compute a separate foreign tax credit limitation foreach apportioned statutory income category or“basket.” Of the $147.1 billion of foreign–sourcetaxable income reported, income classified in thegeneral limitation basket accounted for the largestamount, with $108.7 billion, or about 74 percent of thetotal (Figure B). Not surprisingly, $38.8 billion, oraround 82 percent, of the total current-year foreigntaxes were paid on this income.
Financial services income was the second largestincome basket and accounted for 19.1 percent offoreign-sourced taxable income. Around $6 billion, or13 percent, of the current-year foreign taxes werepaid on this income.
Current-year foreign taxes as a percentage offoreign-source taxable income vary according to theincome category [4]. At 35.7 percent, general limita-
tion income generated the largest percentage ofcurrent-year foreign taxes. Overall, current-yeartaxes as a percentage of foreign-source taxableincome was 32.3 percent. However, shipping incomeand passive income, two of the statutory groupsdesigned to isolate lower-tax income, were signifi-cantly less, 16.2 and 12.1 percent, respectively.
Geographic FocusContinuing a multiyear trend, U.S. corporations withbusiness holdings in European countries wereresponsible for a significant amount of foreign-sourcegross and taxable income (Figure C, D, and Table 3)for 1998. Europe reported a total of $66.2 billion(45.0 percent) in taxable income, of which theEuropean Union (EU) accounted for $60.6 billion.The next two largest regions combined, Asia andLatin America, accounted for $38.7 billion, equal to63.9 percent of the European Union’s foreign-sourcetaxable income total.
As with previous years, the data indicate that asmall number of countries accounted for a largeportion of the foreign-source taxable income reportedby U.S. corporations (Figure C). The United King-dom, Germany, the Netherlands, Japan, and Canadaaccounted for $64.7 billion, or 43.9 percent. TheUnited Kingdom, alone, accounted for almost as
Figure A
Income Subject to U.S. Tax, Foreign-Source Taxable Income, Current-Year Foreign Taxes, and Foreign Tax Credit, Tax Years 1993-1998[Money amounts are in millions of dollars]
Amount
As a percentage of
income subject to U.S.
tax
Amount
As a percentage of
income subject to U.S.
tax
Amount
As a percentage of foreign-source
taxable income
3
Amount
As a percentage of U.S. income
tax before credits
(1) (2) (3) (4) (5) (6) (7) (8) (9) (10)
1993…….............................................................................6,322 228,688 81,913 35.8 94,687 41.4 23,716 25.0 22,895 28.01994…….............................................................................7,199 255,439 90,786 35.5 101,521 39.7 26,470 26.1 25,419 28.01995…….............................................................................6,710 303,308 107,996 35.6 120,518 39.7 30,930 25.7 30,416 28.21996…….............................................................................6,100 370,049 130,748 35.3 150,826 40.8 41,177 27.3 40,255 30.81997…….............................................................................6,569 410,126 144,779 35.3 157,989 38.5 45,080 28.5 42,223 29.21998…….............................................................................5,927 377,129 132,740 35.2 147,129 35.9 47,576 32.3 37,338 28.1
¹ "Worldwide taxable income" is also used to describe "income subject to U.S. tax" ² Before adjustments. ³ The percentages shown in this column are not effective tax rates. An effective tax rate would contain a measure of economic income in the denominator and taxes on that income in the numerator. The percentages shown here are simply a tool used to determine what factors contributed to the relatively constant proportion of foreign tax credits to U.S.tax liability over the 1993-1998 period.
Foreign-source taxable income (less loss) ²
Current-year foreign taxes Foreign tax credit claimed
Tax year
Number of U.S.
corporation returns
Income subject to U.S.
tax 1
U.S. income tax before credits

180
Corporate Foreign Tax Credit, 1998
180
much foreign-source taxable income ($22.2 billion, or15.1 percent) as the entire Asian continent ($23.4billion, or 15.9 percent).
Foreign tax paid or accrued and taxes “deemedpaid” (see Explanation of Selected Terms, underGross-up) figures, the two parts of total foreigntaxes, are presented by region in Figure E. Countriesin the European Union were the largest recipients of
foreign taxes paid, accrued, or deemed paid by U.S.corporations, reporting a combined $18.5 billion, or45.5 percent. The vast majority of these taxes werethose deemed paid (79.5 percent). Asia, the nextlargest recipient of foreign taxes, accounted for anamount equal to about two-fifths of the EuropeanUnion total, with $7.7 billion, though their taxes paidor accrued were roughly equivalent to those of theEuropean Union. As with foreign-source taxableincome, the United Kingdom, Germany, the Nether-lands, Japan, and Canada led all other countries interms of foreign tax paid, accrued, or deemed paid.These countries accounted for a combined $20.8billion, or 51.1 percent, of the total foreign tax figure.As with foreign-source taxable income, the UnitedKingdom accounted for more of the combined taxesthan any other country, with $6.1 billion, or 15.0percent, of the total.
Oil and Gas Extraction IncomeOil and gas extraction income, deductions, and taxesare reported separately from other types of foreign-source income by U.S. corporations claiming aforeign tax credit related to that income [5]. InternalRevenue Code section 907 outlines the separate rulespertaining to oil and gas extraction income and howthey affect the foreign taxes a corporation can credit.These rules prohibit certain foreign taxes from beingcredited and call for another limitation calculationspecific to foreign oil and gas extraction income(FOGEI). Foreign taxes are excluded from the
Figure B
Figure C
Germany7.5%
Japan6.2%
Canada9.1%
United Kingdom15.1%
Rest of the World56.0%
Netherlands6.1%
$147.1 Billion
Percentage of Foreign-Source Taxable Income (less Loss), by Selected Country or Geographic Area, Tax Year 1998
Foreign-Source Taxable Income, Current-Year Foreign Taxes, and Carryover, by Selected Separate Limitation Category, Tax Year 1998
Selected limitation categoryForeign-source taxable
income (less loss) ¹Current-year foreign
taxes
Current-year foreign taxes as a percentage of foreign-source taxable
income ²
Carryover from prior years
(1) (2) (3) (4)
All separate limitation categories ³.................................................................................................147,116,869 47,575,987 32.3 9,368,659 Passive income…………………………..................................................................................................5,567,513 674,146 12.1 43,399 High witholding tax interest……………..................................................................................................1,465,100 423,071 28.9 85,551 Financial services income……………...................................................................................................28,048,630 6,015,291 21.4 225,381 Shipping income………………………….................................................................................................835,349 134,982 16.2 9,389 General limitation income……………….................................................................................................108,672,198 38,804,728 35.7 8,495,176 ¹ Before adjustments. ² The percentages shown in this column are not effective tax rates. An effective tax rate would contain a measure of economic income in the denominator
and tax on that income in the numerator. ³ Sum of detail does not equal total for these columns because only selected categories are shown.
[Money amounts are in thousands of dollars]

181
Corporate Foreign Tax Credit, 1998
calculation if they were paid, accrued, or deemedpaid at a rate in excess of the applicable U.S. taxrate. The law allows that only foreign income taxes,as viewed through U.S. tax principles, are creditable.Credits can be denied for foreign levies that arefound to, in effect, constitute royalty payments to aforeign government. Also excluded are voluntarypayments in lieu of taxes, and payments for specificrights (such as the right to extract a natural resource)or services.
Figure F shows foreign oil and gas extractionincome (FOGEI) by both selected industry groupsand selected countries for 1998. A significant portion(86.9 percent) of FOGEI was reported by U.S.
corporations classified as refiners of petroleum (in-cluding integrated) and coal products manufacturing.For 1998, the oil and gas extraction industry groupaccounted for only 2.4 percent of the total oil and gasextraction-related gross income reported. Figure Flists the countries generating the greatest amounts ofgross income associated with foreign oil and gasextraction. For the fifth straight year, U.S. corpora-tions reported the United Kingdom as the largestsource of FOGEI. Norway and Indonesia wereresponsible for the next highest gross income figures,each representing approximately 6 percent and 4percent of total FOGEI, respectively. Eight coun-tries, the United Kingdom, Norway, Indonesia, Aus-
Figure D
0
20
40
60
80
100
120
140
Canada Japan Germany UnitedKingdom
Netherlands EuropeanUnion
Asia Latin America
Selected Country or Geographic Area
Billions of dollars
Dividends Dividend Gross-up Interest
Rents, Royalties, and License Fees Services Other (Non-Branch Income)
Foreign-Source Gross Income (Excluding Branch Income), by Type and by Selected Country or Geographic Area, Tax Year 1998

182
Corporate Foreign Tax Credit, 1998
182
tralia, the Netherlands, Canada, Trinidad and Tobago,and Egypt accounted for a combined 58.9 percentof all gross income from foreign oil and gas extrac-tion activities.
Industrial Groupings Under the North AmericanIndustry Classification SystemThe North American Industry Classification System(NAICS) was created under the auspices of thegovernments of the United States, Mexico, andCanada in response to the North American FreeTrade Agreement (NAFTA). It was created inorder to standardize business categories, as well as tobetter describe the types of businesses in each
nation’s economy [6]. NAICS organizes economicunits by similar production processes (a production-oriented system), while the formerly used StandardIndustrial Classification (SIC) organized economicunits by their end products (a product-orientedsystem). One of the most notable differencesbetween the NAICS and SIC systems is that NAICSputs a greater emphasis on separately identifyingservice industries. This new feature was added inresponse to the growing importance to the U.S.economy of technology-based services versusmanufacturing.
Tax Year 1998 was the first year that U.S.corporations used NAICS on tax returns to classify
Figure E
0
2
4
6
8
10
12
14
16
18
20
Canada Japan Germany UnitedKingdom
Netherlands EuropeanUnion
Asia Latin America
Selected Country or Geographic Area
Current-year foreign taxes paid or accrued Current-year foreign taxes deemed paid
Billions of dollars
Foreign Taxes Paid or Accrued and Foreign Taxes Deemed Paid, by Selected Country or Geographic Area, Tax Year 1998

183
Corporate Foreign Tax Credit, 1998
their primary business activities. Consequently, thiswas the first year that Statistics of Income (SOI)began classifying data according to NAICS. Datacompiled using the NAICS system are shown inFigure G and in Tables 1a, 2, and 3. The data basedon the previously used SIC system are also presentedin Figure G and in Table 1b. Data at the SIC divisionand major group levels were based on the conversionof Tax Year 1998 data from NAICS-based industrycodes to SIC-based codes and, therefore, will notcoincide with the industry totals in Table 1a.
The NAICS system as adapted for Statistics ofIncome consists of nine so called “divisions,” com-prising aggregates of NAICS sector data: raw mate-rials and energy production; goods production; distri-bution and transportation of goods; information;finance, insurance, real estate, and rental and leasing;professional and business services; education, health,and social assistance; leisure, accommodation, and
food services; and other services. These divisionswere created as an aggregated structure for use bystatistical agencies in the United States in order toallow comparability of statistics across agencies andare employed for the purposes of this article. Theaggregation of NAICS sectors into divisions can beseen in Figure G and Table 1a. Figure G shows thenumber of corporation income tax returns claiming aforeign tax credit and total foreign tax credit claimedfor both the NAICS-based industry groupings and theSIC-based industry groupings, according to theNAICS-based equivalents.
Industry CompositionEven with changes in industrial classification, manu-facturing corporations in 1998 continued to accountfor the majority of foreign-source taxable income,current-year taxes, and foreign tax credits. U.S.manufacturers were responsible for $91.6 billion, or62.3 percent, of the foreign-source taxable incomeand $38.1 billion, or 80 percent, of the current-yearforeign taxes. As a result, U.S. manufacturers wereable to claim $26.7 billion, or 71.6 percent, of the totalforeign tax credits. Within manufacturing, the mostsignificant of the specific industry sectors in terms offoreign-source taxable income, current-year foreigntaxes, and foreign tax credit claimed was computerand electronic products, a new sector created underthe NAICS system. This is a change from previousyears when petroleum and coal products manufactur-ing accounted for the majority of these amounts, andtechnology-related services and manufacturing weredistributed among several industry groups. While themanufacture of petroleum and coal products contin-ued to make up 11.4 percent of the total foreign taxcredit claimed for 1998, computer and electronicproducts manufacturing contributed 14.8 percent.
The other significant change in industry composi-tion also resulted from the new NAICS classifica-tions. For 1997, using the SIC classification system,finance, insurance, and real estate corporationsaccounted for the second largest source of totalforeign-source taxable income and foreign taxes,while services were a smaller proportion. However,under the NAICS classification system, income andtaxes related to bank holding companies were classi-fied for Statistics of Income under the services divi-sion as the subsector “management of companies
Figure F
U.S. Corporation Returns with a Foreign TaxCredit: Foreign Oil and Gas Extraction GrossIncome by Selected Industrial Group andSelected Country, Tax Year 1998[Money amounts are in millions of dollars]
Gross income Percentage
(less loss) of total
Selected industrial group: All industries…………………......................................................................................................................15,127 100.0 Petroleum (including integrated) and coal products manufacturing…….....................................................................................................................13,144 86.9 Chemical manufacturing……………….....................................................................................................................1,469 9.7 Oil and gas extraction………………......................................................................................................................358 2.4 All other industries…………………......................................................................................................................156 1.0
Selected country: All countries.....................................................................................................................15,127 100.0 United Kingdom……………………….....................................................................................................................4,705 31.1 Norway……………………………….......................................................................................................................768 5.1 Indonesia…………………………….......................................................................................................................757 5.0 Austrailia…………………………….......................................................................................................................717 4.7 Netherlands…………………………......................................................................................................................637 4.2 Canada………………………………......................................................................................................................*517 *3.4 Trinidad and Tobago………………….....................................................................................................................*405 *2.7 Egypt…………………………………......................................................................................................................*401 *2.7 Malaysia…………………………….......................................................................................................................*338 *2.2 Saudi Arabia………………………….....................................................................................................................*330 *2.2 Nigeria………………………………......................................................................................................................*201 *1.3 Columbia……………………………......................................................................................................................*189 *1.2 Denmark……………………………......................................................................................................................*178 *1.2 All other countries…………………......................................................................................................................4,984 33.0
* Data should be used with caution because of the small number of returns on which they are based.
Selected industrial group, country

184
Corporate Foreign Tax Credit, 1998
184
(holding companies).” As a result, the service divi-sion now represented a much larger proportion oftotal foreign-source taxable income and current-yearforeign taxes for 1998 than for 1997. For 1998, theservice division accounted for around 10 percent oftotal foreign-source taxable income, foreign taxes,and foreign tax credits. For 1997, it accounted foronly around 5 percent. Finance, insurance, and realestate, which accounted for 14.5 percent of foreign-source taxable income and 15.8 percent of the totalforeign tax credit in 1997 under SIC, accounted foronly 7 percent and 8.2 percent in 1998 underNAICS, respectively. This decrease occurred de-
spite the addition of rental and leasing to this divisionunder NAICS.
SummaryU.S. corporations claimed a total foreign tax credit of$37.3 billion for 1998, an 11.6-percent decrease fromthe previous year. This was caused by a decrease inforeign-source income and related foreign taxes paid,accrued, or deemed paid across most industrialgroupings and countries. As in previous years,Europe, especially members of the European Union,was responsible for the most foreign-source taxableincome and foreign taxes paid, accrued, or deemed
Figure G
Comparison of the Number of Returns with a Foreign Tax Credit and Total Foreign Tax Credit, by Standard Industrial Classification (SIC) System and North American Industry Classification System (NAICS) Industry Groupings, by NAICS Division, Tax Year 1998[Money amounts are in thousands of dollars]
SIC NAICS SIC NAICS
(1) (2) (3) (4) (5) (6)
All industires………………………………………….............................................................................................................................5,927 5,927 -- 37,338,380 37,338,380 --
Raw material and energy production……………............................................................................................................................310 204 -34.2 1,194,675 1,085,685 -9.1 Agriculture, forestry, fishing, and hunting……………………............................................................................................................................107 81 -24.3 52,931 54,317 2.6 Mining…………………………………………………………….............................................................................................................................164 101 -38.4 504,285 501,907 -1.0 Utilities……………………………………………………………............................................................................................................................39 23 -41.0 637,459 529,461 -16.9 Goods production……………………………………............................................................................................................................1,854 1,731 -6.6 27,242,346 26,787,750 -1.7 Construction……………………………………………………............................................................................................................................220 221 0.5 70,498 49,696 -29.5 Manufacturing………………………………………………….............................................................................................................................1,634 1,510 -7.6 27,171,848 26,738,054 -1.6 Distribution and transportation of goods……….............................................................................................................................868 896 3.2 1,425,156 1,183,441 -17.0 Wholesale and retail trade……………………………………............................................................................................................................782 809 3.5 1,276,965 1,033,628 -19.1 Wholesale trade…………………………………………….............................................................................................................................513 621 21.1 537,639 574,516 6.9 Retail trade………………………………………………….............................................................................................................................270 187 -30.7 739,326 459,112 -37.9 Transportation and warehousing……………………………...........................................................................................................................86 87 1.2 148,191 149,813 1.1 Information ¹...........................................................................................................................32 161 403.1 411,647 1,608,877 290.8 Finance, insurance, real estate, and rental and leasing……...........................................................................................................................1,724 1,490 -13.6 5,581,569 3,065,854 -45.1 Finance and insurance…………………………………………...........................................................................................................................1,358 1,204 -11.3 5,562,559 3,053,584 -45.1 Real estate and rental and leasing…...........................................................................................................................362 286 -21.0 17,341 12,270 -29.2 Service…...........................................................................................................................1,133 1,435 26.7 1,470,371 3,571,425 142.9 Professional and business services...........................................................................................................................274 1,184 332.1 1,112,055 2,921,224 162.7 Professional, scientific, and technical services……………...........................................................................................................................274 459 67.5 1,112,055 397,237 -64.3 Management of companies (holding companies) ²...........................................................................................................................-- 725 100.0 -- 2,523,987 100.0 Education, health, and social assistance………………………...........................................................................................................................11 38 245.5 21,441 24,367 13.6 Health care and social assistance……………………………...........................................................................................................................11 38 245.5 21,441 24,367 13.6 Leisure, accommodation, and food services…………………............................................................................................................................153 83 -45.8 211,818 464,525 119.3 Arts, entertainment, and recreation…………………………...........................................................................................................................140 15 -89.3 171,511 55,543 -67.6 Accommodation and food services…………………………...........................................................................................................................13 68 423.1 40,307 408,982 914.7 Other services……………………………………………………...........................................................................................................................686 130 -81.0 123,331 161,309 30.7 Not allocable………………………………………….............................................................................................................................6 10 66.7 12,616 35,348 180.2 ¹ The Communications group under the former Standard Industrial Classification System (SIC) is classified in the Information Sector under the North American Industrial Classification System (NAICS). ² Management of companies, specifically bank holding companies, is included in the finance and insurance sector under the former Standard Industrial Classification System (SIC). NOTE: Detail may not add to totals because of rounding.
Number of returnsNAICS Division, selected industrial sector, or group
Percentage difference between
NAICS/SIC
Percentage difference between
NAICS/SIC
Total foreign tax credit

185
Corporate Foreign Tax Credit, 1998
paid. Corporations classified under finance, insur-ance, real estate, and rental and leasing continue toaccount for a larger share of the foreign income andforeign tax credit totals, a trend that became evidentduring the 1990’s.
Tax Year 1998 was the first year U.S. corpora-tions used the North American Industry ClassificationSystem (NAICS) to define their principal businessactivities. This new system will allow a more thor-ough analysis of the service and technical industriesin the coming years. Comparison of 1998 to 1997data based on the former Standard Industrial Classifi-cation (SIC) system allows for analysis of industry-level changes between these 2 tax years.
Data Sources and LimitationsThe statistics in this article were derived fromcorporation income tax returns with a foreign taxcredit that were included in the 1998 Statistics ofIncome sample of returns with accounting periodsending between July 1998 and June 1999. Thesereturns were selected after administrative processingbut prior to any amendments or audit examination.The 1998 corporation income tax return sampleincluded approximately 94,000 returns sampled fromover 4.8 million returns filed for this period.
The foreign tax credit is claimed under section901 of the Internal Revenue Code. Corporationsreport the foreign income and taxes related to thecredit on Form 1118, Computation of Foreign TaxCredit--Corporations, filed with their income taxreturns. The statistics in this article are based oninformation reported on Forms 1118 and relatedcorporate returns. Corporations with an “alternativeminimum tax” (AMT) liability are required to com-pute a separate “alternative minimum tax foreign taxcredit.” The AMT foreign tax credit data are notreflected in the statistics in this article, even if thecorporation reported both the “regular” foreign taxcredit and the AMT foreign tax credit. Corporationsreporting only the AMT computation had no regulartax and, therefore, were not included in the foreigntax credit statistics.
There are small discrepancies between the morecomplete foreign tax credit data presented in thisarticle and those published in Statistics of Income--1998, Corporation Income Tax Returns [7]. Onereason for this difference is that a few of the returnsdesignated for the Statistics of Income sample were
received too late to be included in the regular corpo-ration statistics, but were included in the foreign taxcredit statistics presented in this article. Additionally,certain corporations submitted preliminary data ontheir original returns, since they lacked completeinformation on their foreign operations at the time offiling. On a case-by-case basis, additional informa-tion was requested directly from the taxpayer.Amended returns filed at a later date, including thosewith carrybacks of foreign taxes to be credited for1998, were not available for these statistics.
Foreign income and taxes are understated in thisarticle to the extent that they either were not or didnot have to be reported on Form 1118. Taking intoaccount carryback provisions, the 1998 foreign taxcredit statistics in this article do not represent thefinal amounts credited that year. A complete foreigntax credit amount would reflect the results of anyaudits, as well as the carryback of some foreigntaxes from 1999 and 2000. Foreign taxes availablefor credit in this article include only those carriedforward to 1998 from previous years. Some corpora-tions also did not file Form 1118 because they did nothave a U.S. income tax liability, and were thus unableto credit any foreign taxes paid, accrued, or deemedpaid for 1998. Finally, other corporations could havededucted their foreign taxes from their gross incomesversus claiming a foreign tax credit.
Since the estimates are based on a sample, theyare subject to sampling error. Coefficients of varia-tion (CV’s) are used to measure the magnitude ofthis sampling error. The CV is defined in the sectionon sampling variability in the “SOI Sampling Method-ology and Data Limitations” appendix of this publica-tion. Figure H presents CV’s for foreign tax creditsby selected NAICS divisions, industrial sectors, andgroups. The smaller the CV, the more reliable theestimate is judged to be.
Description of Tables 1-3Tables 1a and 1b present various industry data usingthe North American Industry Classification System(NAICS) and the previously used Standard IndustrialClassification System (SIC), respectively. Columns 2through 15 display statistics on assets, receipts,income, and taxes reported on Form 1120, Corpora-tion Income Tax Return, for those corporationsclaiming a foreign tax credit. Columns 16 through 52present statistics from Form 1118, Foreign Tax

186
Corporate Foreign Tax Credit, 1998
186
Credit--Corporations. References to tax returnschedules indicate the parts of Form 1118 fromwhich the data were obtained. Columns 16 through36 present statistics on foreign income and deduc-tions, reported primarily on Form 1118, Schedule A,Income or Loss Before Adjustments.
Although the amounts of “oil and gas income”and deductions (columns 23 and 36, respectively) areincluded in the summary columns (columns 16through 22 and 26 through 35), these amounts arealso shown separately (based on Form 1118, Sched-ule I, Reduction of Oil and Gas Extraction Taxes)because oil and gas extraction income is subject tospecial rules under Internal Revenue Code section907, which effectively requires a separate limitationcalculation for taxes related to oil and gas extractionincome. This may result in a reduction of foreigntaxes available for credit. Reductions in creditable oiland gas extraction income taxes are included withseveral other types of reductions in column 41 ofTables 1a and 1b and column 27 of Table 2.
Internal Revenue Code section 863(b) income(income partly within and partly without the UnitedStates) and foreign branch income are also includedin the summary totals reported in columns 16 through22 of Tables 1a and 1b, and are shown separately(based on Form 1118, Schedule F, Gross Incomeand Definitely Allocable Deductions FromSources Outside the U.S. Under Section 863(b)and for Foreign Branches) in columns 24 and 25 ofTables 1a and 1b.
Total deductions “not definitely allocable” tospecific types of income (column 32) are equal to thesum of Tables 1a, 1b, columns 33 through 35, relatingto research and development, interest, and any othernot definitely allocable expenses (any differences aredue to taxpayer reporting variations). Total foreign-source gross income (Tables 1a and 1b, column 16)less total foreign deductions (Tables 1a and 1b, col-umn 26) equals foreign-source taxable income beforeadjustments (Tables 1a and 1b, column 37).
Adjustments to foreign-source taxable income(column 38 of Tables 1a and 1b) include the alloca-tion of: (1) current-year foreign-source losses, (2)overall foreign losses, and (3) current-year U.S.source losses, as well as the recapture of prior-yearoverall foreign losses and recharacterization of prior-year foreign-source losses. These adjustments(reported on Schedule J, Separate Limitation LossAllocations and Other Adjustments Necessary ToDetermine Numerators of Limitation Fractions,Year-End Recharacterization Balances, and OverallForeign Loss Account Balances) affect the numera-tor of the limitation fraction used to compute theforeign tax credit. The income after adjustments (thenumerator of the limitation fraction) is reported incolumn 39 of Tables 1a and 1b. The limitation frac-tion, foreign-source taxable income divided by totaltaxable income from all sources, is applied to the totalU.S. tax against which the credit is allowed to deter-mine any limitation on the foreign tax credit. Taxpay-ers are required to calculate this limitation for eachstatutory income category or “basket.”
Statistics on foreign taxes are presented in col-umns 40 through 52 of Tables 1a and 1b. Data onforeign taxes paid, accrued, or deemed paid (throughrelated foreign corporations or their subsidiaries)from Form 1118, Schedule B, Foreign Tax Credit –Corporation, are shown in columns 43 through 52 ofTables 1a and 1b. Total foreign taxes paid or ac-
Figure H
Coefficients of Variation for Foreign Tax Credit,by Selected Industrial Group, Tax Year 1998
Selected industrial group
Coefficients of variation for foreign
tax credit (percentages)
All industries………………….………………...…….........................................................................0.02 Agriculture, forestry, fishing, and hunting………........................................................................0.02 Mining…………………………………..……………….........................................................................0.32 Utilities.…………………………………..……………….........................................................................0.02 Construction……………………………………………........................................................................2.40 Manufacturing………………………………………….........................................................................0.01
Food manufacturing………………..........................................................................0.04 Plastics and rubber products manufacturing....….........................................................................0.07 Chemical manufacturing ……………………………........................................................................0.03 Petroleum and coal products manufacuring ………..........................................................................0.01 Computer and electronic product manufacturing........................................................................0.01 Transportation equipment manufacturing….………….........................................................................( ¹ )
Wholesale trade………………………………………..........................................................................0.35 Retail trade…………………………………...……….........................................................................0.48 Transportation and warehousing .........................................................................0.10 Information ……………………………………………..........................................................................0.05 Finance and insurance ……………………………….........................................................................0.13 Real estate and rental and leasing ………………..........................................................................2.50 Professional, scientific, and technical services ..........................................................................0.54 Management of companies (holding companies)........................................................................0.11 Administrative and support and waste management and remediation services ........................................................................0.17 Educational services........................................................................9.34 Health care and social assistance ........................................................................0.02 Arts, entertainment, and recreation ........................................................................0.15 Accommodation and food services ……………..........................................................................0.01 Other services………………………………………….........................................................................0.31
¹ Less than .005 percent

187
Corporate Foreign Tax Credit, 1998
crued (Tables 1a and 1b, column 44) are the sum ofcolumns 45 through 51 (any differences are due totaxpayer reporting variations). Column 42 in Tables1a and 1b shows carryovers of excess or “unused”taxes from prior years, which can be added to the1998 pool of current-year creditable foreign taxes.Total foreign taxes paid, accrued, or deemed paid,plus carryover, are then adjusted for certain items(e.g., reductions of foreign taxes related to oil andgas extraction income under Internal Revenue Codesection 907, reductions of foreign taxes related toincome earned in sanctioned countries under InternalRevenue Code section 901(j), and other reductions ofcreditable taxes) in column 41. Thus, total foreigntaxes available for credit (Tables 1a and 1b, column40) are equal to total foreign taxes paid, accrued, ordeemed paid (column 43), plus any carryover ofprior-year excess or “unused” foreign taxes (column42), less any reduction in foreign taxes (Column 41).
Tables 2 and 3 present data using NAICS andare similar in column format to Tables 1a and 1b,except that they do not provide data from the corpo-ration income tax returns, themselves. Table 2presents data by industrial grouping and separatestatutory limitation income category or basket, whileTable 3 presents data by selected geographic regionand country.
Explanation of Selected TermsAdjustments to taxable income .--This includes
several types of adjustments reported on Schedule Jof Form 1118, Computation of Foreign Tax Credit--Corporations. These include the allocation ofcurrent-year foreign losses, overall foreign losses,and current-year U.S.-source losses. Adjustmentsdue to prior-year loss allocations are also made,including the recapture of foreign-source losses andthe recharacterization of foreign-source income. Theoverall result of these adjustments is shown in column38 of Tables 1a and 1b and column 24 of Table 2.
Carryover of foreign taxes.--Under InternalRevenue Code section 904, “U.S. persons” areallowed a 2-year carryback and 5-year carryforwardof “excess” or “unused” foreign taxes for purposesof computing the “final” foreign tax credit for thoseyears. Such taxes were included in the computationof the current-year foreign tax credit to the extentthat they did not exceed the credit limitation for thecurrent year. The 1998 statistics used for this article
include only those foreign taxes that have been car-ried forward from previous years (1993-1997). Seecolumn 42 of Tables 1a and 1b and column 28 ofTable 2.
Controlled Foreign Corporation.--UnderInternal Revenue Code section 957, a foreign corpo-ration is a ‘Controlled Foreign Corporation” if morethan 50 percent of its outstanding voting stock, ormore than 50 percent of the value of all its outstand-ing stock, is owned (directly, indirectly, or construc-tively) by “U.S. shareholders” on any day during theforeign corporation’s tax year. Internal RevenueCode section 951(b) defines a “U.S. shareholder” asa U.S. “person” with 10 percent or more of the totalcombined voting stock of the foreign corporation.Ownership attribution rules are provided in InternalRevenue Code section 958.
Current-year foreign taxes.--Current-yearforeign taxes include foreign taxes paid, accrued, ordeemed paid and are shown in column 43 of Tables1a and 1b, column 29 of Table 2, and column 15 ofTable 3. Current-year foreign taxes do not includeany carryback or carryforward of foreign taxes fromother tax years.
European Union (E.U.).--The European Union(E.U.) is a union of fifteen independent states basedon the former European Community and founded toenhance political, economic, and social cooperation.Formerly known as the European Community (EC)or the European Economic Community (EEC), themember states include Austria, Belgium, Denmark,Finland, France, Germany, Greece, Ireland, Italy,Luxembourg, the Netherlands, Portugal, Spain, Swe-den, and the United Kingdom.
Financial Services Income .--This separatelimitation category or basket applies to income fromthe specific industry of financial services. Financialservices income includes all income (including “pas-sive income”) (see below) that is generated frombanking, insurance, financing, or similar activities, andfrom certain types of insurance investments. Finan-cial services income excludes high withholding taxinterest, dividends from non-controlled foreign corpo-rations as defined in Internal Revenue Code section902, or certain types of export financing interest.
Foreign Oil and Gas Extraction Income(FOGEI).--FOGEI is the gross income producedfrom the extraction of oil and gas, as well as from thesale of assets used in the extraction of oil and gas, or

188
Corporate Foreign Tax Credit, 1998
188
from related services, working capital, dividend andpartnership distributions, and any other oil and gasextraction income. In general, a foreign tax credit, aforeign tax, or deduction is not permitted for foreigntaxes paid, accrued, or deemed paid in connectionwith the purchase or sale of oil or gas extracted in aforeign country if the taxpayer has no economicinterest in the oil or gas and if the purchase or saleprice differs from the fair market value.
Foreign Sales Corporations (FSC).--A ForeignSales Corporation was a company incorporatedabroad and usually controlled by a U.S. “person.” Aportion of the FSC’s “foreign trade income” wasexempt from U.S. taxation. Although these statisticsdo not include FSC returns, FSC dividends receivedby corporations claiming a foreign tax credit areincluded. Dividends and interest generated by a FSCcomprise a separate limitation category. In July1999, the World Trade Organization declared FSCprovisions to be an illegal export subsidy. Congressrepealed the FSC provisions and created the Extra-territorial Income Exclusion Act in November 2000,which allowed U.S. corporations to continue operat-ing FSC’s until December 2001.
Foreign-source taxable income .--Foreign-sourcetaxable income is equal to gross income (less loss)less deductions from sources outside the United States.
Foreign trade income .--Gross receipts fromforeign trade earned by a Foreign Sales Corporation(FSC) from: 1) the sale of “export property,” 2) theleasing of export property for use outside the UnitedStates, or 3) services in connection with the sale orleasing of export property. The related separatelimitation category, taxable income attributable toforeign trade income, is unusual in the 1998 statisticsbecause of the defined scope of the SOI sample (seedefinition for FSC above).
General limitation income.--This separatelimitation category or basket comprises foreign incomenot included in any other separate limitation category.
Gross-up.--Since a dividend represents a distri-bution from after-tax earnings, the amount of incomethat a domestic corporation recognizes on receiving adividend from a foreign corporation is net of all theforeign income taxes paid by that foreign corporation.U.S. corporations that satisfy ownership and otherrequirements are permitted to take an “indirect”foreign tax credit for taxes paid with respect to thedistribution. Under Internal Revenue Code section
78, these taxes are “deemed paid” by the U.S. corpo-rations under Internal Revenue Code sections 902and 960(a). Consequently, the dividend income is“grossed-up” by the amount of the taxes deemedpaid on the income from which the dividend waspaid. This prevents U.S. corporations from creditingthe foreign taxes deemed paid and deducting the sametaxes in computing foreign-source taxable income.
High withholding tax interest.--This separatelimitation category or basket includes interest incomesubject to a withholding tax greater than or equal to 5percent. This basket does not include interest re-ceived in the financing of certain export activities.
Income re-sourced by treaty .--Selected U.S.income tax treaties contain provisions reclassifyingcertain income items from being U.S.-source incometo foreign-source income. This usually occurs whena tax treaty allows the other country to tax whatwould otherwise be U.S.-source income. Certaindividends and income from a U.S.-owned foreigncorporation can be included in this category. Aseparate foreign tax credit limitation has to be computedfor each amount re-sourced from a treaty country.
Interest-Charge Domestic International SalesCorporation (IC-DISC).--IC-DISC’s were smalldomestic corporations formed to export U.S. prod-ucts. An IC-DISC could defer the tax liability on aportion of its income but had to ultimately pay thedeferred tax plus interest. Under the DISC provi-sions, a U.S. manufacturer could set up a DISC(located in the United States) whose income was nottaxed at the DISC level. Instead, the corporateshareholder was taxed directly on a portion of theDISC’s income that is deemed distributed. Theportion of the income not deemed distributed was notsubject to U.S. taxation until it was actually distrib-uted. The foreign trading partners of the UnitedStates that are party to the General Agreement onTariffs and Trade (GATT) maintained the DISCprovisions constituted an illegal export trade subsidybecause they allowed indefinite deferral of directtaxes on income from exports earned in the UnitedStates. Essentially, this pre-1985 system of taxdeferral for export income was replaced by theexemption system of foreign sales corporations(FSC’s), now also repealed. To elect IC-DISCstatus, at least 95 percent of the corporation’s grossreceipts had to be “qualified export receipts,” and atleast 95 percent of its assets “qualified export as-

189
Corporate Foreign Tax Credit, 1998
sets.” Distributions from an IC-DISC are a separatelimitation category.
Non-controlled section 902 corporation.--Anon-controlled foreign corporation is defined byInternal Revenue Code section 902 as a foreigncorporation in which a U.S. corporation possesses atleast 10 percent of the voting stock and the U.S.shareholders own no more than 50 percent of thestock measured by voting power or value. Theseforeign corporations are also referred to as “10/50companies.” Each non-controlled section 902 corpo-ration is treated individually. The dividends fromeach corporation are placed in separate categories orbaskets to avoid the averaging of high-taxed and low-taxed dividends from different non-controlled section902 corporations.
OPEC Countries.--The members of the Organi-zation of Petroleum Exporting Countries (OPEC) for1998 were Algeria, Indonesia, Iran, Iraq, Kuwait,Libya, Nigeria, Qatar, Saudi Arabia, the United ArabEmirates, and Venezuela.
Passive Income.--This separate limitation cat-egory or basket includes dividends, interest (with theexception noted below), rents, royalties, annuities, netcapital gains, and commodity transactions not con-nected with the active conduct of a trade or business.High-taxed passive income is excluded from thisbasket and is included, instead, under financial ser-vices income. Interest subject to a high withholdingtax is categorized in a separate basket. (see highwithholding tax interest, above) Furthermore,income that by definition is passive, yet is subject to aforeign tax rate exceeding the highest applicable U.S.rate, is placed in the general limitation basket versusthe passive income basket.
Section 901(j) income .--Internal Revenue Codesection 901(j) denies credit for taxes paid or accruedto select foreign governments that the United Statesdeems ineligible for the credit. These countriesinclude the following: (1) countries not recognized bythe United States, (2) countries with which theUnited States has severed or does not conduct diplo-matic relations, or (3) countries identified by theUnited States as providing support for terrorism. For1998, countries subject to these restrictions wereCuba, Iran, Iraq, Libya, North Korea, Sudan, and Syria.Income and deductions from section 901(j) countriesare reported on Form 1118, even though these taxesare not creditable. A separate limitation credit is
computed for informational purposes and is not in-cluded in the foreign tax credit of the corporation.
Shipping income .--This separate limitationcategory or basket applies to the specific industry,shipping. Shipping income includes the following: (1)all income from the use (or leasing for use) of avessel or aircraft in foreign commerce, (2) incomefrom services directly related to the use of a vesselor aircraft, (3) gains on the sale or exchange of avessel or aircraft used in the performance of suchservices, and (4) income generated from other spaceand oceanic activities. Income that would be “for-eign base company shipping income” for purposes ofdetermining the income received from ControlledForeign Corporations, under Internal Revenue Codesection 954(f), is also classified as shipping income.
Specifically allocable income .--Internal Rev-enue Code section 863(b) provides special rules fordetermining taxable income from sources outside theUnited States with respect to gross income derivedpartly from within and partly from outside the UnitedStates. The income apportioned to sources outsidethe United States under these special rules is com-monly referred to as “Section 863(b) income” and isshown in Tables 1a and 1b, column 25, and Tables 2and 3, column 11.
Tax deemed paid .--See Gross-up.U.S. Person.--A U.S. person is any citizen or
resident of the United States, domestic partnership,corporation, association, company, or any estate ortrust that is not considered “foreign.” See InternalRevenue Code section 7701 for more information onthe definition of a U.S. person.
Notes and References[1] Since income tax returns for FSC’s were not a
part of the sample used for the statistics, thisincome category is not included. Distributionsfrom FSC’s or former FSC’s are reported onthe parent corporation’s return and are includedin these statistics when provided by the taxpay-ers. In this study, this particular statutorycategory is used when corporations report anirregular separate category of income thatcannot be redefined for one of the existingcategories of income.
[2] A foreign tax credit is not allowed for foreigntaxes paid to countries sanctioned by the U.S.

190
Corporate Foreign Tax Credit, 1998
190
Government. Nevertheless, a foreign tax creditlimitation is computed for each sanctioned country.These countries for 1998 are Cuba, Iran, Iraq,Libya, North Korea, Sudan, and Syria.
[3] See Green, Kathryn A. and Luttrell, Scott,“Corporate Foreign Tax Credit, 1997,” Statis-tics of Income Bulletin , Winter 2001-2002,Volume 21, Number 3.
[4] Current-year foreign taxes divided by foreign-source taxable income should not be used as ameasure of the effective tax rate. This ratewould contain a measure of economic income inthe denominator and taxes on that income in the
numerator. These percentages are a tool usedto compare the proportion of taxes to foreign-source taxable income in each statutory group.
[5] The income, deductions, and taxes related toforeign oil and gas extraction income (FOGEI)are reported on Schedule I, Reduction of Oiland Gas Extraction Taxes, of Form 1118,Foreign Tax Credit--Corporations.
[6] North American Industry Classification SystemUnited States, 1997, Executive Office of thePresident, Office of Management and Budget, 1998.
[7] Internal Revenue Service, Statistics of Income--1998, Corporation Income Tax Returns.
SOURCE: IRS, Statistics of Income Bulletin, Fall2002. Publication 1136 (Rev. 12-2002).

191
Corporate Foreign Tax Credit, 1998
Table 1a.--U.S. Corporation Returns with a Foreign Tax Credit: Total Assets, Income, Tax, and Credits, and Foreign Income and Tax Reported on Form 1118, by Selected Industrial Group (by NAICS Classification)[All figures are estimates based on samples--money amounts are in thousands of dollars]
Foreign
Includable dividend
Dividends Dividends income of income
Major and selected minor industrial group Number of Total Total received from received from Controlled resulting from
returns assets receipts foreign IC-DISC's or Foreign foreign taxes
corporations former DISC's ¹ Corporations deemed paid
(gross-up)
(1) (2) (3) (4) (5) (6) (7)
All industries.....................................................................................................................5,927 15,174,244,548 5,367,522,238 35,296,572 19,520 22,187,348 27,092,409
Agriculture, forestry, fishing, and hunting.....................................................................................................................81 2,777,716 2,915,409 *27,219 -- *16,116 *43,927
Mining.....................................................................................................................101 78,195,566 36,927,692 188,303 -- 187,449 117,991
Metal mining..............................................................................................................44 3,951,272 1,347,109 *26,524 -- *50 *16,915 Coal mining..............................................................................................................5 *7,377,219 *4,747,531 *8 -- *411 *109 Oil and gas extraction..............................................................................................................9 *25,498,493 *7,920,350 *47,695 -- *12,511 *13,180 Nonmetallic minerals, except fuels..............................................................................................................44 41,368,583 22,912,701 114,075 -- 174,476 87,786
Utilities.....................................................................................................................23 243,364,734 92,337,173 1,035,449 -- 372,729 588,933
Construction.....................................................................................................................221 12,113,091 14,412,001 21,018 -- *26,538 *31,498 General building contractors..............................................................................................................95 4,668,120 6,767,900 8,945 -- *26,443 *24,831 Heavy construction contractors..............................................................................................................32 5,439,365 4,342,807 *3,884 -- *62 *2,121
Special trade contractors..............................................................................................................65 1,081,349 1,873,648 *8,179 -- -- *4,546
Manufacturing.....................................................................................................................1,510 3,923,042,786 2,419,087,684 26,982,434 17,957 14,360,120 21,150,959 Food manufacturing..............................................................................................................53 157,198,108 142,972,954 1,758,776 *66 501,876 1,046,028 Beverage and tobacco product manufacturing..............................................................................................................17 281,654,235 84,368,589 *2,224,659 -- *1,338,856 *1,629,176 Beverage manufactures..............................................................................................................14 194,296,090 33,541,971 *1,025,218 -- *249,254 *538,723 Tobacco manufactures..............................................................................................................3 *87,358,145 *50,826,618 *1,199,441 -- *1,089,603 *1,090,453 Textile mill and textile products mills..............................................................................................................46 15,042,216 13,405,862 21,922 -- *23,113 14,351 Apparel manufacturing..............................................................................................................49 15,121,040 18,997,041 *204,018 -- *75,016 *158,478 Wood product manufacturing..............................................................................................................14 29,901,364 19,667,132 *5,004 -- *5,780 *2,325
Paper manufacturing..............................................................................................................29 61,474,804 46,769,679 545,913 -- *156,632 485,695 Printing and related support activities..............................................................................................................41 5,590,116 6,293,780 *2,219 *21 *5,261 *1,423 Petroleum and coal products manufacturing..............................................................................................................26 524,142,876 301,026,491 5,028,786 -- 1,029,593 2,894,834 Chemical manufacturing..............................................................................................................259 630,348,854 399,543,353 6,066,241 *10,208 3,614,643 5,081,376 Pharmaceutical and medicine manufacturing..............................................................................................................61 229,463,078 151,577,017 2,388,147 -- 2,093,464 2,539,621 Other chemical manufacturing..............................................................................................................198 400,885,777 247,966,336 3,678,093 *10,208 1,521,179 2,541,756 Plastics and rubber products manufacturing..............................................................................................................60 27,127,329 28,795,315 457,580 *602 43,574 343,973 Nonmeticallic mineral product manufacturing..............................................................................................................27 31,893,603 19,506,621 211,121 -- *142,647 203,170 Primary metal manufacturing..............................................................................................................39 76,148,350 48,360,597 382,639 -- *265,955 258,125
Fabricated metal product manufacturing..............................................................................................................159 64,360,073 51,360,896 679,402 *322 276,527 517,814 Machinery manufacturing..............................................................................................................188 170,779,548 158,978,148 2,838,602 *3,541 816,947 1,574,683 Computer and electronic products..............................................................................................................174 323,583,061 336,141,763 2,849,344 *965 2,438,050 2,696,812 Electrical equipment, applicance, and component..............................................................................................................85 542,986,154 148,468,280 496,898 *391 845,856 1,389,488 Transportation equipment manufacturing..............................................................................................................87 885,748,515 530,489,956 2,729,757 -- 2,486,735 2,527,878 Motor vehicles and equipment..............................................................................................................49 738,754,764 386,700,434 2,420,106 -- 2,263,557 2,308,444 Other transportation equipment manufacturing..............................................................................................................38 146,993,751 143,789,523 309,652 -- 223,178 219,434 Furniture and related products..............................................................................................................17 7,659,663 11,036,907 *61,881 -- *61,291 *50,050 Miscellaneous manufacturing and
manufacturing not allocable..............................................................................................................139 72,282,875 52,904,320 417,673 *1,842 231,766 275,280
Wholesale and retail trade.....................................................................................................................809 392,019,740 672,462,878 1,730,688 *1,563 864,484 747,557
Wholesale trade..............................................................................................................621 208,908,799 287,672,730 1,131,366 *1,563 628,090 504,838
Durable goods.....................................................................................................451 105,733,657 161,373,829 111,935 *537 70,489 84,426
Nondurable goods.....................................................................................................170 103,175,142 126,298,901 1,019,431 *1,026 557,602 420,413
Drugs, chemicals, and allied products...................................................................................................8 *14,428,008 *25,518,836 *94,222 *1,026 *35,064 *38,524
Petroleum and petroleum products...................................................................................................39 1,526,742 3,139,267 *1,379 -- -- *22
Other miscellaneous wholesale trade...................................................................................................13 17,467,249 10,744,232 *85,482 -- *49,648 *53,602 Other nondurable goods.....................................................................................................110 69,753,143 86,896,565 838,348 -- 472,890 328,265
Footnotes at end of table.

192
Corporate Foreign Tax Credit, 1998
192
Table 1a.--U.S. Corporation Returns with a Foreign Tax Credit: Total Assets, Income, Tax, and Credits, and Foreign Income and Tax Reported on Form 1118, by Selected Industrial Group (by NAICS Classification)--Continued [All figures are estimates based on samples--money amounts are in thousands of dollars]
Foreign
Includable dividend
Dividends Dividends income of income
Major and selected minor industrial group Number of Total Total received from received from Controlled resulting from
returns assets receipts foreign IC-DISC's or Foreign foreign taxes
corporations former DISC's ¹ Corporations deemed paid
(gross-up)
(1) (2) (3) (4) (5) (6) (7)
Retail trade..............................................................................................................187 183,110,941 384,790,148 599,321 -- 236,393 242,719 Motor vehicle and parts dealers...................................................................................................17 *384,111 *926,771 *9 -- *7 -- Food and beverage stores...................................................................................................9 *3,942,888 *8,630,118 *4 -- -- --
Clothing and clothing accessories stores...................................................................................................15 29,116,349 44,306,910 *531,012 -- *135,566 *191,858 General merchandise stores...................................................................................................8 *99,650,020 *240,026,464 *7,232 -- *65,769 *10,620 All other retail stores...................................................................................................139 50,017,574 90,899,884 61,063 -- *35,052 40,241
Transportation and warehousing.....................................................................................................................87 101,614,361 97,087,295 72,381 -- 91,383 64,475
Transportation..............................................................................................................82 101,466,187 97,021,446 71,866 -- 90,400 64,024 Water transportation.........................................................................................................11 4,996,797 2,976,879 *11,220 -- *61,319 *17,061 All other transportation.........................................................................................................71 96,469,390 94,044,567 60,646 -- 29,081 46,964 Warehousing and storage..............................................................................................................5 *148,173 *65,849 *515 -- *984 *450
Information.....................................................................................................................161 563,088,879 311,630,660 1,244,442 -- 1,691,930 1,276,973 Publishing industries..............................................................................................................90 184,407,841 101,128,796 605,211 -- 367,884 491,675 Motion picture and sound recording industries..............................................................................................................25 38,432,088 19,874,118 *167,586 -- *46,619 *119,264 Broadcasting and telecommunications..............................................................................................................29 301,653,350 165,867,566 *318,520 -- *1,110,806 *447,921 Broadcasting..............................................................................................................10 103,396,411 44,497,711 *103,838 -- *560,249 *167,479 Telecommunications..............................................................................................................19 198,256,939 121,369,855 *214,682 -- *550,557 *280,442 Information and data processing services..............................................................................................................17 38,595,600 24,760,180 *153,125 -- *166,621 *218,114
Finance, insurance, and real estate.....................................................................................................................1,490 6,414,749,088 1,193,537,627 1,691,838 *( ² ) 2,936,462 1,371,051
Finance and insurance..............................................................................................................1,204 6,401,838,977 1,187,373,869 1,690,220 *( ² ) 2,921,145 1,363,714 Depository credit intermediation..............................................................................................................32 26,674,598 3,659,570 930 -- *4,859 *17 Nondepository credit intermediation..............................................................................................................19 562,601,243 82,289,024 *112,956 -- *314,068 *41,706
Securities, commodity contracts, etc...............................................................................................................841 2,333,457,537 182,475,636 610,998 *( ² ) 794,541 796,549 Insurance carriers and related activities..............................................................................................................306 3,478,622,548 918,641,650 965,314 -- 1,807,676 525,441 Other finance and insurance..............................................................................................................6 *483,050 *307,989 *23 -- -- -- Real estate and rental and leasing..............................................................................................................286 12,910,111 6,163,758 1,618 -- *15,317 *7,337
Services.....................................................................................................................1,435 3,415,028,954 510,655,284 2,226,327 -- 1,627,913 1,651,554
Professional, scientific, and technical services..............................................................................................................459 77,516,792 79,254,997 234,737 -- 187,921 179,001 Management of companies (holding companies)..............................................................................................................725 3,132,674,033 290,244,426 1,461,434 -- 1,199,039 1,071,340 Educational, health care, and social assistance..............................................................................................................38 52,441,528 28,739,764 *34,051 -- *9,973 *22,488
Arts, entertainment, and recreation..............................................................................................................15 2,529,931 2,288,627 *78,500 -- *16,895 *19,798 Accommodation and food services..............................................................................................................68 71,578,490 60,338,704 189,296 -- *69,319 *207,254 Other services..............................................................................................................130 78,288,181 49,788,765 228,309 -- 144,766 151,673 Footnotes at end of table.

193
Corporate Foreign Tax Credit, 1998
Table 1a.--U.S. Corporation Returns with a Foreign Tax Credit: Total Assets, Income, Tax, and Credits, and Foreign Income and Tax Reported on Form 1118, by Selected Industrial Group (by NAICS Classification)--Continued [All figures are estimates based on samples--money amounts are in thousands of dollars]
U.S. income tax
before credits
Income
Major and selected minor industrial group Net income subject to Regular and Foreign tax U.S. General U.S. income
(less deficit) U.S. tax Total alternative credit possessions business tax after
minimum claimed tax credit credit credits ³
tax
(8) (9) (10) (11) (12) (13) (14) (15)
All industries.....................................................................................................................398,898,244 377,129,783 132,740,630 132,832,709 37,338,380 339,990 3,855,629 88,652,512
Agriculture, forestry, fishing, and hunting.....................................................................................................................483,149 460,741 160,561 160,558 54,317 -- *5,431 98,620
Mining.....................................................................................................................3,961,566 3,688,470 1,336,802 1,335,765 501,907 -- *55,317 766,093 Metal mining..............................................................................................................288,995 286,114 103,746 103,556 74,417 -- *3 24,943 Coal mining..............................................................................................................*194,282 *189,300 *74,314 *74,314 *13,124 -- *1 *61,175 Oil and gas extraction..............................................................................................................*825,164 *753,081 *281,127 *281,127 *142,640 -- -- *138,179
Nonmetallic minerals, except fuels..............................................................................................................2,653,125 2,459,975 877,614 876,768 271,727 -- *55,313 541,796
Utilities.....................................................................................................................10,587,727 10,530,100 3,689,081 3,688,583 529,461 -- 117,513 2,863,952
Construction.....................................................................................................................878,480 853,177 298,436 295,555 49,696 -- *10,507 231,872 General building contractors..............................................................................................................400,320 383,031 132,750 132,601 29,431 -- *10,234 88,316 Heavy construction contractors..............................................................................................................375,250 373,214 131,826 130,020 11,338 -- *227 118,861 Special trade contractors..............................................................................................................78,131 72,692 25,117 24,905 7,910 -- *2 17,013
Manufacturing.....................................................................................................................188,367,924 176,643,120 62,266,015 62,365,963 26,738,054 333,719 2,232,476 31,917,015 Food manufacturing..............................................................................................................8,811,241 8,516,790 3,008,482 3,008,475 1,174,614 *155 62,698 1,720,133 Beverage and tobacco product manufacturing..............................................................................................................11,562,301 10,966,805 3,847,052 3,847,052 1,975,815 *45,056 *19,871 1,796,279 Beverage manufactures..............................................................................................................3,993,071 3,656,875 1,288,576 1,288,576 761,321 *45,056 *2,539 478,715 Tobacco manufactures..............................................................................................................*7,569,230 *7,309,930 *2,558,475 *2,558,475 *1,214,494 -- *17,332 *1,317,564 Textile mill and textile products mills..............................................................................................................518,576 455,189 160,574 160,574 14,720 -- *3,068 138,676 Apparel manufacturing..............................................................................................................1,746,592 1,741,726 616,189 616,007 158,515 *229 *4,136 453,306
Wood product manufacturing..............................................................................................................767,894 736,160 257,554 257,554 6,949 -- *713 234,840 Paper manufacturing..............................................................................................................4,152,127 4,008,568 1,418,543 1,418,797 553,314 *114 51,509 797,546 Printing and related support activities..............................................................................................................412,594 409,821 143,100 143,100 3,030 *348 *792 138,502 Petroleum and coal products manufacturing..............................................................................................................21,053,878 20,561,418 7,207,305 7,214,608 4,268,386 -- 152,729 2,381,235 Chemical manufacturing..............................................................................................................41,571,896 38,046,451 13,407,403 13,407,504 5,522,571 *264,297 611,826 6,795,989 Pharmaceutical and medicine manufacturing..............................................................................................................20,724,381 19,080,976 6,684,909 6,684,909 2,660,359 *260,579 469,941 3,247,792 Other chemical manufacturing..............................................................................................................20,847,515 18,965,475 6,722,494 6,722,595 2,862,211 *3,718 141,885 3,548,197
Plastics and rubber products manufacturing..............................................................................................................2,194,162 2,100,658 735,110 736,932 334,187 -- 10,136 340,754 Nonmeticallic mineral product manufacturing..............................................................................................................1,859,250 1,706,378 600,350 600,350 142,795 -- 6,151 434,974 Primary metal manufacturing..............................................................................................................2,743,242 2,517,785 881,953 893,599 350,613 -- 17,138 465,273 Fabricated metal product manufacturing..............................................................................................................5,687,430 5,423,217 1,896,616 1,896,534 597,459 *784 11,287 1,277,209 Machinery manufacturing..............................................................................................................15,713,590 14,220,598 4,986,844 4,987,219 2,049,854 *14,545 126,609 2,753,231 Computer and electronic products..............................................................................................................32,775,807 30,722,615 10,890,520 10,890,507 4,839,162 -- 559,034 5,393,982 Electrical equipment, applicance, and component..............................................................................................................8,907,948 8,367,441 2,883,494 2,974,022 1,481,993 -- 40,146 1,351,433
Transportation equipment manufacturing..............................................................................................................21,445,597 20,141,949 7,220,634 7,208,831 2,909,198 -- 481,735 3,779,696 Motor vehicles and equipment..............................................................................................................15,840,430 15,198,675 5,491,076 5,479,053 2,598,447 -- 416,673 2,442,052 Other transportation equipment manufacturing..............................................................................................................5,605,167 4,943,273 1,729,558 1,729,779 310,751 -- 65,063 1,337,644 Furniture and related products..............................................................................................................976,370 961,317 335,769 335,781 53,436 -- *3,743 278,057 Miscellaneous manufacturing and manufacturing not allocable..............................................................................................................5,467,428 5,038,232 1,768,524 1,768,516 301,444 *8,190 69,154 1,385,899
Wholesale and retail trade.....................................................................................................................30,125,190 29,447,253 10,325,525 10,327,617 1,033,628 -- 168,647 8,837,072
Wholesale trade..............................................................................................................10,791,346 10,199,230 3,578,338 3,578,612 574,516 -- 74,672 2,716,677
Durable goods.....................................................................................................5,528,927 5,293,601 1,848,786 1,849,074 100,685 -- 28,049 1,619,886
Nondurable goods.....................................................................................................5,262,419 4,905,629 1,729,552 1,729,538 473,832 -- 46,623 1,096,791
Drugs, chemicals, and allied products...................................................................................................*674,197 *578,675 *202,458 *202,458 *49,906 -- *3,889 *126,790
Petroleum and petroleum products...................................................................................................73,176 71,174 24,045 24,045 2,880 -- -- 18,276
Other miscellaneous wholesale trade...................................................................................................392,141 316,442 110,451 110,451 30,043 -- *5,701 61,190 Other nondurable goods.....................................................................................................4,122,905 3,939,339 1,392,598 1,392,584 391,002 -- 37,033 890,536
Footnotes at end of table.

194
Corporate Foreign Tax Credit, 1998
194
Table 1a.--U.S. Corporation Returns with a Foreign Tax Credit: Total Assets, Income, Tax, and Credits, and Foreign Income and Tax Reported on Form 1118, by Selected Industrial Group (by NAICS Classification)--Continued [All figures are estimates based on samples--money amounts are in thousands of dollars]
U.S. income tax
before credits
Income
Major and selected minor industrial group Net income subject to Regular and Foreign tax U.S. General U.S. income
(less deficit) U.S. tax Total alternative credit possessions business tax after
minimum claimed tax credit credit credits ³
tax
(8) (9) (10) (11) (12) (13) (14) (15)
Retail trade..............................................................................................................19,333,844 19,248,023 6,747,187 6,749,005 459,112 -- 93,975 6,120,395 Motor vehicle and parts dealers...................................................................................................*37,710 *37,526 *12,967 *12,967 *116 -- *33 *12,777 Food and beverage stores...................................................................................................*181,369 *179,736 *61,527 *62,913 *10,016 -- *1,201 *50,310
Clothing and clothing accessories stores...................................................................................................3,876,947 3,869,289 1,364,978 1,364,978 247,749 -- *6,187 1,107,324 General merchandise stores...................................................................................................*9,786,220 *9,742,339 *3,410,043 *3,410,039 *66,037 -- *57,640 *3,221,392 All other retail stores...................................................................................................5,451,600 5,419,133 1,897,672 1,898,108 135,194 -- 28,914 1,728,591
Transportation and warehousing.....................................................................................................................6,766,200 6,167,224 2,201,616 2,201,616 149,813 -- 36,451 1,571,390
Transportation..............................................................................................................6,757,541 6,158,971 2,198,810 2,198,810 149,234 -- 36,451 1,569,162 Water transportation.........................................................................................................465,050 407,239 146,760 146,760 56,152 -- *1,438 77,840 All other transportation.........................................................................................................6,292,491 5,751,731 2,052,050 2,052,050 93,082 -- 35,013 1,491,322 Warehousing and storage..............................................................................................................*8,659 *8,253 *2,806 *2,806 *579 -- -- *2,227
Information.....................................................................................................................36,395,986 34,674,070 12,144,430 12,147,233 1,608,877 -- 265,171 10,238,779 Publishing industries..............................................................................................................10,596,026 9,378,929 3,313,690 3,311,596 697,470 -- 58,516 2,551,891 Motion picture and sound recording industries..............................................................................................................2,375,541 2,232,989 784,763 783,973 122,179 -- *1,340 661,154 Broadcasting and telecommunications..............................................................................................................20,318,811 20,030,173 6,984,901 6,990,587 536,669 -- *116,282 6,309,669 Broadcasting..............................................................................................................2,650,164 2,422,045 848,869 848,868 235,176 -- *11,862 *600,909 Telecommunications..............................................................................................................17,668,647 17,608,128 6,136,032 6,141,719 301,493 -- *104,420 5,708,760 Information and data processing services..............................................................................................................3,105,608 3,031,979 1,061,077 1,061,077 252,559 -- *89,032 716,064
Finance, insurance, and real estate.....................................................................................................................76,170,975 70,649,020 24,863,054 24,858,995 3,065,854 -- 364,373 21,073,736
Finance and insurance..............................................................................................................75,599,871 70,199,824 24,704,831 24,702,565 3,053,584 -- 364,279 20,928,406 Depository credit intermediation..............................................................................................................398,305 382,846 132,920 132,920 6,606 -- *670 125,515 Nondepository credit intermediation..............................................................................................................5,428,608 5,229,377 1,830,110 1,830,106 197,499 -- *56,134 1,575,206
Securities, commodity contracts, etc...............................................................................................................13,105,902 12,470,039 4,372,533 4,371,164 1,403,892 -- 34,830 2,841,052 Insurance carriers and related activities..............................................................................................................56,565,860 52,016,745 18,333,963 18,333,070 1,444,097 -- 272,645 16,352,818 Other finance and insurance..............................................................................................................101,195 *100,817 *35,306 *35,306 *1,490 -- -- *33,816 Real estate and rental and leasing..............................................................................................................571,104 449,196 158,223 156,430 12,270 -- *94 145,330
Services.....................................................................................................................43,546,409 42,409,299 14,888,593 14,884,313 3,571,425 *6,271 589,557 10,542,141
Professional, scientific, and technical services..............................................................................................................7,741,146 7,317,795 2,563,971 2,562,392 397,237 -- 145,258 2,010,747 Management of companies (holding companies)..............................................................................................................26,034,004 25,470,688 8,949,661 8,948,539 2,523,987 -- 343,971 5,962,897 Educational, health care, and social assistance..............................................................................................................2,388,312 2,363,945 826,885 826,885 24,367 -- *4,037 797,701
Arts, entertainment, and recreation..............................................................................................................239,313 225,954 78,435 78,435 55,543 -- *1,590 21,259 Accommodation and food services..............................................................................................................3,905,179 3,849,620 1,354,676 1,353,669 408,982 *6,271 75,424 861,866 Other services..............................................................................................................3,238,455 3,181,298 1,114,964 1,114,394 161,310 -- 19,278 887,670 Footnotes at end of table.

195
Corporate Foreign Tax Credit, 1998
Table 1a.--U.S. Corporation Returns with a Foreign Tax Credit: Total Assets, Income, Tax, and Credits, and Foreign Income and Tax Reported on Form 1118, by Selected Industrial Group (by NAICS Classification)--Continued [All figures are estimates based on samples--money amounts are in thousands of dollars]
Foreign income and taxes reported on Form 1118
Gross income (less loss)
Foreign
dividend
Major and selected minor industrial group income Rents,
Total Dividends resulting from Interest royalties, Service Other
foreign taxes and income income
deemed paid license fees
(gross-up)
(16) (17) (18) (19) (20) (21) (22)
All industries.....................................................................................................................349,386,789 60,541,096 27,074,099 68,413,782 55,875,295 23,414,004 114,068,512
Agriculture, forestry, fishing, and hunting.....................................................................................................................290,450 62,274 *43,927 *26,361 *18,293 *1 *139,594
Mining.....................................................................................................................5,357,393 363,579 117,974 228,918 409,764 2,043,709 2,193,449 Metal mining..............................................................................................................488,846 *26,566 *16,915 *40,286 *127 *6,144 398,808 Coal mining..............................................................................................................*111,146 *420 *109 *21,052 -- -- *89,564 Oil and gas extraction..............................................................................................................*1,602,459 *61,604 *13,164 *93,075 *50,610 *219,828 *1,164,178
Nonmetallic minerals, except fuels..............................................................................................................3,154,942 274,989 87,786 74,505 359,027 1,817,736 540,898
Utilities.....................................................................................................................3,303,485 1,407,780 588,656 566,225 *40,447 127,571 572,805
Construction.....................................................................................................................558,544 47,556 *31,498 5,390 19,911 331,390 122,799 General building contractors..............................................................................................................251,516 35,491 *24,831 *2,900 *8,316 *172,058 *7,920 Heavy construction contractors..............................................................................................................166,883 *3,949 *2,121 *98 *7,816 *110,234 *42,665 Special trade contractors..............................................................................................................119,501 8,073 *4,546 *2,345 *3,780 *28,704 *72,052
Manufacturing.....................................................................................................................167,963,972 44,303,840 21,134,234 9,412,797 35,137,332 3,360,666 54,615,104 Food manufacturing..............................................................................................................5,977,147 2,328,590 1,046,341 122,402 706,982 *46,465 1,726,367 Beverage and tobacco product manufacturing..............................................................................................................11,089,926 *3,573,477 *1,618,222 274,635 *2,589,306 *110,319 2,923,967 Beverage manufactures..............................................................................................................4,814,672 *1,274,468 *538,518 *223,093 *1,423,065 *110,319 *1,245,209 Tobacco manufactures..............................................................................................................*6,275,254 *2,299,009 *1,079,703 *51,542 *1,166,241 -- *1,678,758 Textile mill and textile products mills..............................................................................................................218,292 44,819 14,348 *33,055 *45,415 *1,951 *78,706 Apparel manufacturing..............................................................................................................833,084 278,957 158,483 6,121 293,924 *11,624 *83,974
Wood product manufacturing..............................................................................................................86,802 *6,531 *2,325 *33,760 *10,499 -- *33,688 Paper manufacturing..............................................................................................................2,408,960 792,947 485,695 45,279 513,358 *51,090 520,591 Printing and related support activities..............................................................................................................55,999 *7,480 *1,423 *756 *15,191 *12,428 *18,721 Petroleum and coal products manufacturing..............................................................................................................27,941,656 6,072,307 2,893,166 3,798,365 503,055 *97,998 14,576,765 Chemical manufacturing..............................................................................................................32,412,739 9,958,280 5,078,100 847,523 6,454,181 470,718 9,603,936 Pharmaceutical and medicine manufacturing..............................................................................................................14,704,055 4,394,083 2,536,194 258,788 2,840,547 *222,553 4,451,890 Other chemical manufacturing..............................................................................................................17,708,684 5,564,197 2,541,906 588,735 3,613,634 248,165 5,152,046
Plastics and rubber products manufacturing..............................................................................................................1,701,562 505,843 343,973 62,863 362,009 *35,622 391,253 Nonmeticallic mineral product manufacturing..............................................................................................................822,084 426,917 203,170 14,797 104,984 *9,714 62,502 Primary metal manufacturing..............................................................................................................2,021,069 682,164 258,075 115,563 102,429 *12,613 850,225 Fabricated metal product manufacturing..............................................................................................................3,088,191 980,240 518,019 96,405 244,060 109,198 1,140,269 Machinery manufacturing..............................................................................................................12,658,071 4,571,173 1,574,369 638,806 1,491,328 213,693 4,168,702 Computer and electronic products..............................................................................................................36,075,703 6,483,683 2,696,496 672,790 17,682,296 544,708 7,995,730 Electrical equipment, applicance, and component..............................................................................................................11,519,570 1,385,368 1,389,440 1,749,019 838,993 976,492 5,180,258
Transportation equipment manufacturing..............................................................................................................15,895,256 5,216,959 2,527,923 822,001 2,501,494 628,267 4,198,612 Motor vehicles and equipment..............................................................................................................11,494,280 4,642,366 2,308,489 402,737 1,771,231 *3,838 2,365,619 Other transportation equipment manufacturing..............................................................................................................4,400,976 574,593 219,434 419,264 730,263 *624,429 1,832,994 Furniture and related products..............................................................................................................222,264 *123,173 *50,050 *7,405 10,029 -- 31,607 Miscellaneous manufacturing and manufacturing not allocable..............................................................................................................2,935,598 864,935 274,615 71,251 667,798 27,766 1,029,233
Wholesale and retail trade.....................................................................................................................9,007,432 2,595,939 747,611 416,232 1,058,946 500,106 3,688,599
Wholesale trade..............................................................................................................5,705,569 1,760,574 504,884 348,788 336,797 139,047 2,615,479
Durable goods.....................................................................................................1,276,168 182,581 84,425 99,613 74,992 42,315 792,242
Nondurable goods.....................................................................................................4,429,402 1,577,993 420,459 249,175 261,806 96,732 1,823,237
Drugs, chemicals, and allied products...................................................................................................*407,979 *129,246 *38,524 *8,595 *109,956 *2,697 *118,960
Petroleum and petroleum products...................................................................................................69,278 *1,379 *22 *10,463 *4,844 *3,929 *48,640
Other miscellaneous wholesale trade...................................................................................................333,308 *135,132 *53,604 *4,347 *309 *3,444 *136,473 Other nondurable goods.....................................................................................................3,618,837 1,312,236 328,309 225,769 146,697 86,661 1,519,164
Footnotes at end of table.

196
Corporate Foreign Tax Credit, 1998
196
Table 1a.--U.S. Corporation Returns with a Foreign Tax Credit: Total Assets, Income, Tax, and Credits, and Foreign Income and Tax Reported on Form 1118, by Selected Industrial Group (by NAICS Classification)--Continued [All figures are estimates based on samples--money amounts are in thousands of dollars]
Foreign income and taxes reported on Form 1118
Gross income (less loss)
Foreign
dividend
Major and selected minor industrial group income Rents,
Total Dividends resulting from Interest royalties, Service Other
foreign taxes and income income
deemed paid license fees
(gross-up)
(16) (17) (18) (19) (20) (21) (22)
Retail trade..............................................................................................................3,301,863 835,365 242,727 67,444 722,149 *361,059 1,073,120 Motor vehicle and parts dealers...................................................................................................*1,164 *16 -- *257 *699 -- *192 Food and beverage stores...................................................................................................*73,973 *10 -- *3,479 *69,056 -- *1,428
Clothing and clothing accessories stores...................................................................................................1,325,951 666,547 *191,863 *7,714 88,647 -- 371,180 General merchandise stores...................................................................................................*714,141 *73,041 *10,620 *21,179 *137,559 *191,669 *280,073 All other retail stores...................................................................................................1,186,635 95,751 40,244 34,815 426,188 *169,390 420,247
Transportation and warehousing.....................................................................................................................9,086,753 162,535 64,475 54,343 72,419 8,695,634 37,348
Transportation..............................................................................................................9,083,166 161,036 64,024 52,716 72,419 8,695,634 37,337 Water transportation.........................................................................................................309,614 *72,101 *17,060 *6,814 *110 *187,447 *26,081 All other transportation.........................................................................................................8,773,553 88,935 46,964 45,902 72,309 8,508,187 11,256 Warehousing and storage..............................................................................................................*3,587 *1,499 *450 *1,627 -- -- *11
Information.....................................................................................................................31,202,763 3,115,765 1,274,993 453,340 13,941,701 1,597,173 10,819,790 Publishing industries..............................................................................................................16,703,997 1,012,435 491,674 104,523 10,342,629 207,483 4,545,253 Motion picture and sound recording industries..............................................................................................................2,060,009 214,209 *119,264 *306 404,723 *14,305 *1,307,203 Broadcasting and telecommunications..............................................................................................................10,185,150 1,569,335 *445,981 *297,735 2,858,142 *260,557 4,753,400 Broadcasting..............................................................................................................3,977,269 *804,809 *165,595 *150,186 *2,700,489 *682 *155,508 Telecommunications..............................................................................................................6,207,881 *764,526 *280,387 *147,549 *157,653 *259,876 *4,597,892 Information and data processing services..............................................................................................................2,253,606 *319,787 *218,073 *50,776 *336,207 1,114,828 *213,935
Finance, insurance, and real estate.....................................................................................................................55,137,632 4,464,750 1,370,649 22,304,212 1,170,297 2,818,974 23,008,749
Finance and insurance..............................................................................................................54,984,526 4,448,156 1,363,312 22,281,377 1,112,009 2,782,489 22,997,183 Depository credit intermediation..............................................................................................................211,210 5,799 *24 *196,163 *284 *8,644 *296 Nondepository credit intermediation..............................................................................................................8,555,687 372,548 *41,706 2,002,612 *199,180 *664,182 5,275,458
Securities, commodity contracts, etc...............................................................................................................21,356,984 1,313,005 796,571 12,415,304 95,022 463,381 6,273,700 Insurance carriers and related activities..............................................................................................................24,793,095 2,756,780 525,011 7,666,755 813,100 1,632,749 11,398,701 Other finance and insurance..............................................................................................................*67,550 *24 -- *542 *4,422 *13,534 *49,027 Real estate and rental and leasing..............................................................................................................153,106 16,594 *7,337 22,836 58,288 *36,485 11,567
Services.....................................................................................................................67,282,303 3,928,370 1,652,590 34,944,806 4,006,186 3,938,780 18,811,570
Professional, scientific, and technical services..............................................................................................................7,461,182 449,347 180,575 104,638 1,563,225 2,675,154 2,488,243 Management of companies (holding companies)..............................................................................................................54,946,522 2,695,659 1,070,770 34,484,151 1,385,281 541,363 14,769,299 Educational, health care, and social assistance..............................................................................................................241,073 44,026 *22,488 *396 41,491 *94,736 *37,936
Arts, entertainment, and recreation..............................................................................................................559,701 *108,719 *19,798 *2,187 110,053 *308,281 *10,663 Accommodation and food services..............................................................................................................2,904,182 256,541 *207,254 268,550 744,483 *110,711 1,316,643 Other services..............................................................................................................1,169,643 374,077 151,706 84,884 161,654 208,536 188,787 Footnotes at end of table.

197
Corporate Foreign Tax Credit, 1998
Table 1a.--U.S. Corporation Returns with a Foreign Tax Credit: Total Assets, Income, Tax, and Credits, and Foreign Income and Tax Reported on Form 1118, by Selected Industrial Group (by NAICS Classification)--Continued [All figures are estimates based on samples--money amounts are in thousands of dollars]
Foreign income and taxes reported on Form 1118--Continued
Deductions
Deductions allocable to specific types of income
Oil and gas Specifically Rental, royalty, and
Major and selected minor industrial group extraction Foreign allocable licensing expenses
income branch income Total Depreciation, Service
(less loss) 4
income 4
[section depletion, expenses
863(b)] 4
and
amortization
(23) (24) (25) (26) (27) (28) (29) (30)
All industries.....................................................................................................................15,127,351 87,251,267 9,176,112 202,269,920 108,022,787 1,290,753 6,110,720 13,036,724
Agriculture, forestry, fishing, and hunting.....................................................................................................................-- -- *127,202 *119,484 *71,634 -- *686 *(²)
Mining.....................................................................................................................*369,280 1,975,904 -- 3,290,604 2,451,032 102,247 25,709 649,775 Metal mining..............................................................................................................*358,226 *159,600 -- 229,896 154,820 *9,961 *247 *1,023
Coal mining..............................................................................................................-- *61,285 -- *63,206 *48,698 -- -- -- Oil and gas extraction..............................................................................................................-- *234,332 -- *1,148,101 *915,505 -- *592 *9,529 Nonmetallic minerals, except fuels..............................................................................................................*11,054 1,520,687 -- 1,849,402 1,332,008 *92,286 *24,870 639,223
Utilities.....................................................................................................................*2,372 *621,175 -- 1,225,796 581,522 *5,784 *1,060 *11,606
Construction.....................................................................................................................-- *107,451 -- 381,474 336,455 *1,183 *1,675 256,540
General building contractors..............................................................................................................-- *51,692 -- *157,046 *155,020 *10 *455 *139,379 Heavy construction contractors..............................................................................................................-- *27,581 -- *117,482 *91,695 *1,148 *992 *84,747 Special trade contractors..............................................................................................................-- *19,856 -- 89,464 72,257 *25 *228 *21,520
Manufacturing.....................................................................................................................14,612,814 21,097,281 8,215,612 76,260,938 42,276,285 224,324 1,741,975 1,240,576 Food manufacturing..............................................................................................................-- 792,900 *71,879 2,354,105 1,510,336 *1,504 *1,363 *16,539 Beverage and tobacco product manufacturing..............................................................................................................-- *1,791,352 -- 4,155,100 *2,522,761 -- *776,423 *550
Beverage manufactures..............................................................................................................-- *836,534 -- *1,823,496 *891,449 -- *739,658 *550 Tobacco manufactures..............................................................................................................-- *954,818 -- *2,331,604 *1,631,312 -- *36,764 -- Textile mill and textile products mills..............................................................................................................-- *601 *4,676 129,128 54,883 -- -- *749 Apparel manufacturing..............................................................................................................-- *78,688 *1,788 204,782 *96,498 *53 *9,614 *4,185 Wood product manufacturing..............................................................................................................-- *1,129 -- *44,725 *12,541 -- -- -- Paper manufacturing..............................................................................................................-- 15,700 *43,218 782,845 255,978 *5 *10,500 *6,389 Printing and related support activities..............................................................................................................-- *18,342 -- *20,196 *18,052 *139 *1,186 *11,631
Petroleum and coal products manufacturing..............................................................................................................13,143,975 9,138,087 *472,640 15,173,345 13,077,655 *11,673 *267,487 *108,026 Chemical manufacturing..............................................................................................................*1,468,839 3,679,394 863,944 13,978,033 6,824,075 *5,675 *118,692 225,808 Pharmaceutical and medicine manufacturing..............................................................................................................-- 1,307,237 *444,041 5,631,939 2,728,037 -- *105,265 *73,258 Other chemical manufacturing..............................................................................................................*1,468,839 2,372,157 419,903 8,346,094 4,096,038 *5,675 13,426 152,550 Plastics and rubber products manufacturing..............................................................................................................-- 103,107 *10,840 656,252 374,152 *4,132 *13,424 *1,409 Nonmeticallic mineral product manufacturing..............................................................................................................-- *4,560 *10,622 242,564 96,769 *31 *887 *3,157 Primary metal manufacturing..............................................................................................................-- *264,854 *58,910 973,901 494,850 *121,368 *7,550 *2,065
Fabricated metal product manufacturing..............................................................................................................-- 397,529 *18,956 1,273,011 813,211 *1,592 *5,872 *96,646 Machinery manufacturing..............................................................................................................-- 742,583 251,551 5,770,124 2,672,733 *1,109 85,721 80,081 Computer and electronic products..............................................................................................................-- 1,709,617 3,578,401 15,481,479 5,189,318 *1,465 73,520 122,762 Electrical equipment, applicance, and component..............................................................................................................-- 498,120 *2,232,646 6,832,694 4,028,830 *1,956 *35,171 *24,959 Transportation equipment manufacturing..............................................................................................................-- 1,654,108 *448,384 6,444,599 3,207,770 *55,623 *190,840 *530,726 Motor vehicles and equipment..............................................................................................................-- 1,240,572 *374,463 3,767,925 1,106,826 *14,252 *8,867 *1,902
Other transportation equipment manufacturing..............................................................................................................-- *413,536 *73,920 2,676,674 2,100,944 *41,371 *181,973 *528,824 Furniture and related products..............................................................................................................-- *19,346 *4,683 57,699 *29,314 -- *865 -- Miscellaneous manufacturing and manufacturing not allocable..............................................................................................................-- 187,264 *142,474 1,686,354 996,557 *17,998 142,860 *4,894
Wholesale and retail trade.....................................................................................................................*111,489 1,682,666 *65,874 4,151,614 2,682,751 4,979 348,695 286,624
Wholesale trade..............................................................................................................*111,489 789,497 *63,685 2,892,810 1,880,720 3,499 246,151 105,017
Durable goods.....................................................................................................-- 131,553 *616 796,074 430,400 *1,589 193,405 52,668
Nondurable goods.....................................................................................................*111,489 657,944 *63,069 2,096,736 1,450,320 *1,910 52,746 52,348
Drugs, chemicals, and allied products...................................................................................................-- *55,212 *14,994 *213,268 *181,022 -- -- *8,835
Petroleum and petroleum products...................................................................................................-- *13,972 -- *46,680 *43,152 *1,290 *27,516 *3,481
Other miscellaneous wholesale trade...................................................................................................*111,489 *3,608 -- *229,037 *126,842 -- *209 *767 Other nondurable goods.....................................................................................................-- 585,153 *48,075 1,607,751 1,099,304 *620 *25,021 *39,266
Footnotes at end of table.
Gross income (less loss)--Continued
Other
Total

198
Corporate Foreign Tax Credit, 1998
198
Table 1a.--U.S. Corporation Returns with a Foreign Tax Credit: Total Assets, Income, Tax, and Credits, and Foreign Income and Tax Reported on Form 1118, by Selected Industrial Group (by NAICS Classification)--Continued [All figures are estimates based on samples--money amounts are in thousands of dollars]
Foreign income and taxes reported on Form 1118--Continued
Deductions
Deductions allocable to specific types of income
Oil and gas Specifically Rental, royalty, and
Major and selected minor industrial group extraction Foreign allocable licensing expenses
income branch income Total Depreciation, Service (less loss) 4 income 4 [section depletion, expenses
863(b)] 4
and
amortization
(23) (24) (25) (26) (27) (28) (29) (30)
Retail trade..............................................................................................................-- 893,169 *2,189 1,258,804 802,031 *1,480 102,544 *181,608 Motor vehicle and parts dealers...................................................................................................-- -- -- -- -- -- -- -- Food and beverage stores...................................................................................................-- -- -- *3,751 *3,503 -- *2,595 --
Clothing and clothing accessories stores...................................................................................................-- *227,122 -- 311,800 248,324 *1,057 *86,339 -- General merchandise stores...................................................................................................-- *284,521 -- *436,750 *333,455 *369 -- *88,917 All other retail stores...................................................................................................-- *381,526 *2,189 506,503 216,749 *54 *13,610 *92,691
Transportation and warehousing.....................................................................................................................-- 4,724,738 *3,128 8,035,750 7,795,999 *1,503 *4,649 5,510,783
Transportation..............................................................................................................-- 4,724,738 *3,128 8,034,679 7,795,597 *1,503 *4,649 5,510,783 Water transportation.........................................................................................................-- *25,300 -- *108,465 *84,749 *333 *1,758 *82,001 All other transportation.........................................................................................................-- 4,699,438 *3,128 7,926,213 7,710,848 *1,169 *2,891 5,428,782 Warehousing and storage..............................................................................................................-- -- -- *1,071 *402 -- *( ² ) --
Information.....................................................................................................................-- 3,054,897 *243,296 19,911,938 12,634,227 232,406 2,283,489 1,282,885 Publishing industries..............................................................................................................-- 1,904,993 *100,718 10,784,713 4,871,963 *366 205,085 *86,524 Motion picture and sound recording industries..............................................................................................................-- *9,740 -- 884,778 734,423 *13,707 *149.554 *10,344 Broadcasting and telecommunications..............................................................................................................-- *617,803 *142,579 6,876,400 5,913,584 *212,896 *1,928,850 *220,553 Broadcasting..............................................................................................................-- *10,119 *142,579 *3,006,315 *2,484,485 *212,230 *1,925,621 *100 Telecommunications..............................................................................................................-- *607,683 -- 3,870,085 3,429,098 *665 *3,229 *220,452 Information and data processing services..............................................................................................................-- *522,362 -- 1,366,047 1,114,258 *5,438 -- *965,464
Finance, insurance, and real estate.....................................................................................................................-- 15,943,921 *144 36,408,313 17,775,632 266,215 700,719 1,368,707
Finance and insurance..............................................................................................................-- 15,915,658 *144 36,320,336 17,710,461 260,871 679,460 1,339,714 Depository credit intermediation..............................................................................................................-- -- -- 173,558 *9,639 -- *3 *3,232 Nondepository credit intermediation..............................................................................................................-- *2,304,032 -- 7,377,832 5,423,519 *64,021 *2,736 *404,496
Securities, commodity contracts, etc...............................................................................................................-- 4,343,440 *144 14,361,469 4,511,756 *150,588 448,697 *196,687 Insurance carriers and related activities..............................................................................................................-- 9,218,616 -- 14,352,225 7,710,406 *45,630 228,023 723,088 Other finance and insurance..............................................................................................................-- *49,570 -- *55,253 *55,141 *632 -- *12,210 Real estate and rental and leasing..............................................................................................................-- *28,264 -- 87,976 65,172 *5,344 21,259 *28,993
Services.....................................................................................................................*20,542 37,879,859 *520,856 52,402,896 21,383,528 452,113 1,001,519 *2,429,227
Professional, scientific, and technical services..............................................................................................................-- 2,291,696 *512,590 5,226,906 4,488,326 13,765 514,651 *1,757,229 Management of companies (holding companies)..............................................................................................................*20,542 33,985,663 -- 44,446,560 14,927,773 428,581 349,480 *187,439 Educational, health care, and social assistance..............................................................................................................-- *6,801 *4,707 102,557 81,226 *672 *3,105 *48,129
Arts, entertainment, and recreation..............................................................................................................-- *155,495 -- *367,160 *294,946 *18 *70,495 *222,708 Accommodation and food services..............................................................................................................-- *1,301,150 *350 1,676,414 1,226,056 *1301 8,843 *8,206 Other services..............................................................................................................-- 139,053 *3,210 583,298 365,201 *7,775 54,946 205,515 Footnotes at end of table.
Total
Other
Gross income (less loss)--Continued

199
Corporate Foreign Tax Credit, 1998
Table 1a.--U.S. Corporation Returns with a Foreign Tax Credit: Total Assets, Income, Tax, and Credits, and Foreign Income and Tax Reported on Form 1118, by Selected Industrial Group (by NAICS Classification)--Continued [All figures are estimates based on samples--money amounts are in thousands of dollars]
Foreign income and taxes reported on Form 1118--Continued
Deductions not allocable to
Other specific types of income Deductions Taxable
Major and selected minor industrial group deductions from oil income Adjustments
allocable Research and gas (less loss) to taxable
to specific Total and Interest Other extraction before income
types of development income 5 adjustments
income
(31) (32) (33) (34) (35) (36) (37) (38)
All industries.....................................................................................................................87,584,590 94,247,133 9,876,318 49,478,293 32,808,117 9,369,404 147,116,869 10,480,879
Agriculture, forestry, fishing, and hunting.....................................................................................................................*70,947 *47,851 *24,454 *10,035 *10,090 -- 170,965 *4,916
Mining.....................................................................................................................1,673,301 839,572 *54,061 295,441 463,133 *178,756 2,066,788 173,296 Metal mining..............................................................................................................*143,590 *75,076 -- *35,278 *39,798 *178,756 258,950 *42,211 Coal mining..............................................................................................................*48,698 *14,507 -- *12,044 -- -- *47,940 -- Oil and gas extraction..............................................................................................................*905,383 *232,596 *1,292 *130,821 *100,482 -- *454,359 *12,433
Nonmetallic minerals, except fuels..............................................................................................................575,630 517,394 *52,769 117,299 322,853 -- 1,305,540 *118,652
Utilities.....................................................................................................................563,072 644,273 *398 597,950 *45,543 *52 2,077,689 *169,861
Construction.....................................................................................................................77,058 45,019 *415 *8,334 *23,061 -- 177,070 20,882 General building contractors..............................................................................................................*15,176 *2,026 -- *1,342 *644 -- 94,470 *531 Heavy construction contractors..............................................................................................................*4,808 *25,786 *144 *3,348 *21,304 -- 49,401 *15,170 Special trade contractors..............................................................................................................*50,485 *17,207 *271 *3,644 *1,113 -- 30,037 *5,181
Manufacturing.....................................................................................................................39,069,409 33,984,654 7,230,395 12,813,048 13,585,976 9,069,121 91,703,034 3,963,115 Food manufacturing..............................................................................................................1,490,929 843,769 53,048 538,037 235,427 -- 3,623,042 203,275 Beverage and tobacco product manufacturing..............................................................................................................1,745,788 *1,632,339 *53,142 *404,087 *1,117,361 -- 6,934,825 *248,755 Beverage manufactures..............................................................................................................*151,240 *932,047 -- *156,458 *717,840 -- 2,991,175 *248,755 Tobacco manufactures..............................................................................................................*1,594,548 *700,292 *53,142 *247,629 *399,521 -- *3,943,650 -- Textile mill and textile products mills..............................................................................................................*54,134 74,245 *12,147 *53,556 *7,378 -- 89,164 *19,713 Apparel manufacturing..............................................................................................................*82,646 108,283 *306 *84,865 *17,779 -- 628,302 *130,620
Wood product manufacturing..............................................................................................................*12,541 *32,184 *130 *17,174 *14,880 -- 42,078 -- Paper manufacturing..............................................................................................................239,083 526,868 107,834 118,510 291,444 -- 1,626,115 *5,123 Printing and related support activities..............................................................................................................*5,096 *2,143 *1,039 *276 *747 -- 35,803 *1,099 Petroleum and coal products manufacturing..............................................................................................................12,690,469 2,095,690 130,764 1,502,739 458,624 8,648,926 12,768,311 70,859 Chemical manufacturing..............................................................................................................6,473,900 7,153,959 1,597,673 2,724,054 2,763,512 *420,195 18,434,706 476,368 Pharmaceutical and medicine manufacturing..............................................................................................................2,549,513 2,903,902 652,590 729,552 1,472,465 -- 9,072,116 *4,108 Other chemical manufacturing..............................................................................................................3,924,387 4,250,056 945,083 1,994,502 1,291,047 *420,195 9,362,590 472,260
Plastics and rubber products manufacturing..............................................................................................................355,188 282,101 81,314 110,785 78,159 -- 1,045,309 26,004 Nonmeticallic mineral product manufacturing..............................................................................................................92,694 145,795 *35,209 81,140 *24,355 -- 579,520 *148,350 Primary metal manufacturing..............................................................................................................363,867 479,051 *43,018 269,352 163,192 -- 1,047,167 *14,722 Fabricated metal product manufacturing..............................................................................................................709,101 459,800 55,526 160,635 239,560 -- 1,815,179 24,692 Machinery manufacturing..............................................................................................................2,505,822 3,097,391 476,151 968,950 1,574,716 -- 6,887,947 185,513 Computer and electronic products..............................................................................................................4,991,571 10,292,161 3,621,416 1,168,228 5,476,204 -- 20,594,225 2,033,301 Electrical equipment, applicance, and component..............................................................................................................3,966,744 2,803,864 111,181 2,317,307 367,557 -- 4,686,876 16,019
Transportation equipment manufacturing..............................................................................................................2,430,581 3,236,829 703,182 2,066,854 437,672 -- 9,450,656 196,345 Motor vehicles and equipment..............................................................................................................1,081,806 2,661,100 552,662 1,846,307 240,583 -- 7,726,354 32,922 Other transportation equipment manufacturing..............................................................................................................1,348,776 575,730 *150,520 220,547 *197,090 -- 1,724,302 *163,423 Furniture and related products..............................................................................................................*28,449 *28,385 *742 *23,221 *4,422 -- 164,564 *3,387 Miscellaneous manufacturing and manufacturing not allocable..............................................................................................................830,806 689,797 146,573 203,278 312,984 -- 1,249,244 158,969
Wholesale and retail trade.....................................................................................................................2,042,453 1,468,863 32,916 595,729 786,058 *110,976 4,855,818 565,245
Wholesale trade..............................................................................................................1,526,054 1,012,089 25,935 467,718 479,698 *110,976 2,812,759 315,094
Durable goods.....................................................................................................182,738 365,674 15,168 156,436 171,400 -- 480,093 43,005
Nondurable goods.....................................................................................................1,343,316 646,415 10,767 311,282 308,298 *110,976 2,332,666 272,089
Drugs, chemicals, and allied products...................................................................................................*172,187 *32,246 *3,030 *17,110 *10,484 -- *194,711 *52
Petroleum and petroleum products...................................................................................................*10,865 *3,527 -- *211 -- -- 22,598 --
Other miscellaneous wholesale trade...................................................................................................*125,866 *102,195 -- *2,140 *100,055 *110,976 104,272 *616 Other nondurable goods.....................................................................................................1,034,397 508,447 7,736 291,820 197,759 -- 2,011,086 271,421
Footnotes at end of table.
Deductions--Continued

200
Corporate Foreign Tax Credit, 1998
200
Table 1a.--U.S. Corporation Returns with a Foreign Tax Credit: Total Assets, Income, Tax, and Credits, and Foreign Income and Tax Reported on Form 1118, by Selected Industrial Group (by NAICS Classification)--Continued [All figures are estimates based on samples--money amounts are in thousands of dollars]
Foreign income and taxes reported on Form 1118--Continued
Deductions not allocable to
Other specific types of income Deductions Taxable
Major and selected minor industrial group deductions from oil income Adjustmentsallocable Research and gas (less loss) to taxable
to specific Total and Interest Other extraction before income
types of development income 5
adjustments
income
(31) (32) (33) (34) (35) (36) (37) (38)
Retail trade..............................................................................................................516,399 456,774 *6,981 128,010 306,360 -- 2,043,059 250,151 Motor vehicle and parts dealers...................................................................................................-- -- -- -- -- -- *1,164 -- Food and beverage stores...................................................................................................*907 *249 -- *230 -- -- *70,221 *34,959
Clothing and clothing accessories stores...................................................................................................*160,928 63,477 *416 *54,726 *7,880 -- 1,014,150 *146,159 General merchandise stores...................................................................................................*244,170 *103,295 *10 *53,386 *49,899 -- *277,391 *25,047 All other retail stores...................................................................................................110,394 289,753 *6,555 19,669 248,581 -- 680,132 *43,986
Transportation and warehousing.....................................................................................................................2,279,064 239,751 *17,961 89,798 129,211 -- 1,051,003 14,909
Transportation..............................................................................................................2,278,662 239,081 *17,961 89,128 129,211 -- 1,048,488 14,909 Water transportation.........................................................................................................*657 *23,716 -- *15,540 *6,749 -- 201,149 *13,293 All other transportation.........................................................................................................2,278,005 215,365 *17,961 73,588 122,462 -- 847,339 *1,616 Warehousing and storage..............................................................................................................*401 *670 -- *670 -- -- *2,515 --
Information.....................................................................................................................8,835,447 7,277,711 2,140,229 997,890 4,055,860 -- 11,290,825 3,462,969 Publishing industries..............................................................................................................4,579,988 5,912,750 1,972,015 202,053 3,665,721 -- 5,919,284 3,086,388 Motion picture and sound recording industries..............................................................................................................*560,818 150,355 -- *126,901 *16,278 -- 1,175,231 *115,449 Broadcasting and telecommunications..............................................................................................................*3,551,285 *962,816 *76,352 *612,784 *270,767 -- 3,308,751 *234,458 Broadcasting..............................................................................................................*346,534 *521,829 *15,162 *291,450 *215,217 -- 970,955 *233,724 Telecommunications..............................................................................................................*3,204,752 *440,987 *61,190 *321,334 *55,550 -- 2,337,796 *734 Information and data processing services..............................................................................................................*143,355 251,790 *91,862 56,151 *103,094 -- 887,559 *26,674
Finance, insurance, and real estate.....................................................................................................................15,439,991 18,632,680 *55,721 11,746,321 6,139,091 -- 18,729,319 1,775,390
Finance and insurance..............................................................................................................15,430,416 18,609,876 *55,721 11,729,928 6,132,679 -- 18,664,189 1,761,149 Depository credit intermediation..............................................................................................................*6,403 *163,919 -- *117,449 *42,735 -- 37,652 *894 Nondepository credit intermediation..............................................................................................................*4,952,265 1,954,313 *46,561 *1,047,569 *552,690 -- 1,177,855 *17,158
Securities, commodity contracts, etc...............................................................................................................3,715,784 9,849,713 *4,865 9,245,909 525,685 -- 6,995,515 1,082,667 Insurance carriers and related activities..............................................................................................................6,713,664 6,641,819 *4,296 1,318,890 5,011,569 -- 10,440,870 656,635 Other finance and insurance..............................................................................................................*42,299 *111 -- *111 *( ² ) -- *12,297 *3,794 Real estate and rental and leasing..............................................................................................................9,575 *22,805 -- *16,393 *6,412 -- 65,130 *14,241
Services.....................................................................................................................17,500,670 31,019,368 319,766 22,277,952 7,568,575 -- 14,879,407 325,967
Professional, scientific, and technical services..............................................................................................................2,202,681 738,580 126,778 106,662 466,476 -- 2,234,275 235,946 Management of companies (holding companies)..............................................................................................................13,962,273 29,518,787 *184,617 21,730,863 6,827,693 -- 10,499,962 3,879 Educational, health care, and social assistance..............................................................................................................*29,321 *21,331 -- *9,024 *11,568 -- 138,515 *17,802
Arts, entertainment, and recreation..............................................................................................................*1,724 *72,215 *4,653 *20,315 *36,199 -- 192,540 *18,737 Accommodation and food services..............................................................................................................1,207,706 450,357 -- *259,545 *176,321 -- 1,227,769 *15,947 Other services..............................................................................................................96,965 218,097 *3,718 151,542 50,318 -- 586,345 33,658 Footnotes at end of table.
Deductions--Continued

201
Corporate Foreign Tax Credit, 1998
Table 1a.--U.S. Corporation Returns with a Foreign Tax Credit: Total Assets, Income, Tax, and Credits, and Foreign Income and Tax Reported on Form 1118, by Selected Industrial Group (by NAICS Classification)--Continued [All figures are estimates based on samples--money amounts are in thousands of dollars]
Foreign income and taxes reported on Form 1118--Continued
Foreign taxes available for credit
Paid or accrued
Taxable
Major and selected minor industrial group income Reduction Total paid, Taxes
(less loss) Total for certain Carryover accrued, Total withheld at
after foreign and deemed source on
adjustments taxes paid dividends
(39) (40) (41) (42) (43) (44) (45)
All industries.....................................................................................................................136,635,990 47,575,987 2,476,970 9,368,659 40,684,298 13,608,822 2,193,964
Agriculture, forestry, fishing, and hunting.....................................................................................................................166,049 63,034 -- *2,694 60,340 16,414 1,798
Mining.....................................................................................................................1,893,492 1,022,018 *320,756 578,481 764,294 646,320 12,727
Metal mining..............................................................................................................216,739 196,018 *301,304 *353,777 143,545 126,630 *6 Coal mining..............................................................................................................*47,940 *13,148 -- *224 *12,924 *12,815 *( ² ) Oil and gas extraction..............................................................................................................*441,925 *486,855 *12,254 *191,385 *307,724 *294,560 *7019 Nonmetallic minerals, except fuels..............................................................................................................1,186,888 325,996 *7,199 33,095 300,100 212,314 *5,702
Utilities.....................................................................................................................1,907,828 797,846 *1,523 46,727 752,642 163,985 50,815
Construction.....................................................................................................................156,188 67,637 -- 10,919 56,718 25,220 651 General building contractors..............................................................................................................93,939 41,009 -- *7,709 33,300 8,470 463 Heavy construction contractors..............................................................................................................34,231 12,976 -- *1,095 11,881 9,760 *54 Special trade contractors..............................................................................................................24,856 12,314 -- *2,116 10,199 5,652 *128
Manufacturing.....................................................................................................................87,739,919 33,251,300 2,151,029 7,255,155 28,147,174 7,011,736 1,651,031
Food manufacturing..............................................................................................................3,419,767 1,367,528 -- 137,210 1,230,317 183,742 82,398 Beverage and tobacco product manufacturing..............................................................................................................6,686,070 2,029,453 -- *7,558 2,021,894 403,673 *108,751 Beverage manufactures..............................................................................................................2,742,420 806,135 -- *708 805,427 266,909 *48,076 Tobacco manufactures..............................................................................................................*3,943,650 *1,223,318 -- *6,850 *1,216,467 *136,764 *60,676 Textile mill and textile products mills..............................................................................................................69,452 22,655 -- 4,912 17,743 3,395 *923
Apparel manufacturing..............................................................................................................497,682 191,413 -- *855 190,558 32,074 *11,939 Wood product manufacturing..............................................................................................................42,078 7,750 -- *396 7,354 5,029 *190 Paper manufacturing..............................................................................................................1,620,992 607,118 -- 31,900 575,218 89,523 33,985 Printing and related support activities..............................................................................................................34,704 4,227 -- *1,313 2,914 1,491 *29 Petroleum and coal products manufacturing..............................................................................................................12,697,452 6,752,874 2,125,749 3,980,754 4,897,869 2,004,548 220,546 Chemical manufacturing..............................................................................................................17,958,337 6,808,021 *21,494 627,490 6,202,026 1,123,788 331,279
Pharmaceutical and medicine manufacturing..............................................................................................................9,068,008 3,254,996 *17 336,259 2,918,754 382,560 171,901 Other chemical manufacturing..............................................................................................................8,890,329 3,553,026 *21,477 291,230 3,283,272 741,228 159,378 Plastics and rubber products manufacturing..............................................................................................................1,019,305 428,606 -- 27,874 400,731 56,759 27,550 Nonmeticallic mineral product manufacturing..............................................................................................................431,170 272,175 -- 51,357 220,818 17,648 *6,037 Primary metal manufacturing..............................................................................................................1,032,445 457,831 *2,608 126,281 334,158 76,083 *15,877 Fabricated metal product manufacturing..............................................................................................................1,790,488 787,011 -- 178,283 608,728 90,709 43,390 Machinery manufacturing..............................................................................................................6,702,434 2,223,502 *1,155 78,776 2,145,880 571,511 226,512
Computer and electronic products..............................................................................................................18,560,923 5,690,032 *23 1,802,487 3,887,568 1,191,072 246,074 Electrical equipment, applicance, and component..............................................................................................................4,670,856 1,963,485 -- 9,957 1,953,527 564,088 15,924 Transportation equipment manufacturing..............................................................................................................9,254,311 3,196,787 -- 143,374 3,053,413 525,490 255,621 Motor vehicles and equipment..............................................................................................................7,693,432 2,866,108 -- 131,152 2,734,957 426,467 236,378 Other transportation equipment manufacturing..............................................................................................................1,560,879 330,678 -- *12,222 318,456 99,023 19,243
Furniture and related products..............................................................................................................161,177 70,349 -- *15,360 54,989 4,939 *3,635 Miscellaneous manufacturing and manufacturing not allocable..............................................................................................................1,090,275 370,485 -- 29,016 341,469 66,175 20,369
Wholesale and retail trade.....................................................................................................................4,290,573 1,554,476 *137 361,988 1,192,625 445,015 102,024
Wholesale trade..............................................................................................................2,497,666 959,780 *137 208,193 751,724 246,840 92,815
Durable goods.....................................................................................................437,089 132,170 -- 15,779 116,391 31,966 7,739
Nondurable goods.....................................................................................................2,060,577 827,610 *137 192,414 635,333 214,874 85,076
Drugs, chemicals, and allied products...................................................................................................*194,658 *50,271 -- *105 *50,166 *11,642 *4,196
Petroleum and petroleum products...................................................................................................22,598 3,505 -- *488 3,017 2,995 *189
Other miscellaneous wholesale trade...................................................................................................103,655 104,945 *137 *46,332 58,750 5,146 *2,971 Other nondurable goods.....................................................................................................1,739,665 668,889 -- 145,489 523,400 195,091 77,720
Footnotes at end of table.

202
Corporate Foreign Tax Credit, 1998
202
Table 1a.--U.S. Corporation Returns with a Foreign Tax Credit: Total Assets, Income, Tax, and Credits, and Foreign Income and Tax Reported on Form 1118, by Selected Industrial Group (by NAICS Classification)--Continued [All figures are estimates based on samples--money amounts are in thousands of dollars]
Foreign income and taxes reported on Form 1118--Continued
Foreign taxes available for credit
Paid or accrued
Taxable
Major and selected minor industrial group income Reduction Total paid, Taxes
(less loss) Total for certain Carryover accrued, Total withheld at
after foreign and deemed source on
adjustments taxes paid dividends
(39) (40) (41) (42) (43) (44) (45)
Retail trade..............................................................................................................1,792,908 594,696 -- 153,795 440,901 198,175 9,209 Motor vehicle and parts dealers...................................................................................................*1,164 *118 -- *2 *116 *116 *2 Food and beverage stores...................................................................................................*35,262 *10,268 -- *2,758 *7,510 *7,510 *2
Clothing and clothing accessories stores...................................................................................................867,991 311,970 -- *80,511 231,459 39,596 *2,249 General merchandise stores...................................................................................................*252,344 *98,807 -- *56,079 *42,728 *32,108 *6,686 All other retail stores...................................................................................................636,146 173,533 -- 14,444 159,089 118,845 271
Transportation and warehousing.....................................................................................................................1,036,094 188,793 -- 13,159 175,634 111,160 3,926
Transportation..............................................................................................................1,033,579 187,780 -- 12,767 175,013 110,989 3,919 Water transportation.........................................................................................................187,856 86,009 -- *1,876 84,133 *67,072 *1,060 All other transportation.........................................................................................................845,723 101,771 -- 10,891 90,880 43,916 2,859 Warehousing and storage..............................................................................................................*2,515 *1,014 -- *392 *621 *171 *7
Information.....................................................................................................................7,827,856 2,768,786 *508 307,774 2,461,519 1,186,527 99,077 Publishing industries..............................................................................................................2,832,896 1,429,423 *508 38,997 1,390,934 899,259 47,741 Motion picture and sound recording industries..............................................................................................................1,059,782 217,946 -- *58,393 159,553 40,290 *3,715 Broadcasting and telecommunications..............................................................................................................3,074,293 850,278 -- *201,136 649,142 203,160 *32,283 Broadcasting..............................................................................................................737,231 410,520 -- *122,857 287,663 122,069 *4,312 Telecommunications..............................................................................................................2,337,062 439,758 -- *78,279 361,478 81,092 *27,972 Information and data processing services..............................................................................................................860,885 271,139 -- *9,249 261,891 43,817 *15,338
Finance, insurance, and real estate.....................................................................................................................16,953,929 3,343,076 -- 241,484 3,101,592 1,730,942 131,904
Finance and insurance..............................................................................................................16,903,040 3,307,725 -- 228,303 3,079,421 1,716,109 131,652 Depository credit intermediation..............................................................................................................36,758 8,157 -- *623 7,534 7,510 204 Nondepository credit intermediation..............................................................................................................1,160,697 229,606 -- *18,718 210,889 169,182 *17,627
Securities, commodity contracts, etc...............................................................................................................5,912,848 1,536,384 -- 66,080 1,470,304 673,732 30,095 Insurance carriers and related activities..............................................................................................................9,784,235 1,531,736 -- 142,882 1,388,854 863,843 83,723 Other finance and insurance..............................................................................................................*8,503 *1,841 -- *( ² ) *1,841 *1,841 *3 Real estate and rental and leasing..............................................................................................................50,889 35,351 -- 13,180 22,170 14,833 251
Services.....................................................................................................................14,553,440 4,470,585 *2,326 550,156 3,922,755 2,269,990 139,713
Professional, scientific, and technical services..............................................................................................................1,998,330 532,482 -- 111,356 421,126 240,551 10,758 Management of companies (holding companies)..............................................................................................................10,496,083 3,076,607 *2,326 245,552 2,833,380 1,762,437 94,263 Educational, health care, and social assistance..............................................................................................................120,714 43,012 -- *14,954 28,059 5,571 *664
Arts, entertainment, and recreation..............................................................................................................173,804 62,406 -- *7,839 54,567 34,770 *6,858 Accommodation and food services..............................................................................................................1,211,822 526,203 -- 135,282 390,920 183,666 *11,937 Other services..............................................................................................................552,687 229,875 -- 35,173 194,702 42,996 15,233 Footnotes at end of table.

203
Corporate Foreign Tax Credit, 1998
Table 1a.--U.S. Corporation Returns with a Foreign Tax Credit: Total Assets, Income, Tax, and Credits, and Foreign Income and Tax Reported on Form 1118, by Selected Industrial Group (by NAICS Classification)--Continued [All figures are estimates based on samples--money amounts are in thousands of dollars]
Foreign income and taxes reported on Form 1118--Continued
Foreign taxes available for credit--Continued
Paid or accrued--Continued
Other taxes paid or accrued on--
Major and selected minor industrial group Specifically Taxes
Rents, allocable deemed
Interest royalties, Branch income Service Other paid
and license income [section income income
fees 863(b)]
(46) (47) (48) (49) (50) (51) (52)
All industries.....................................................................................................................784,126 2,213,430 4,861,563 8,524 387,240 3,159,976 27,075,476
Agriculture, forestry, fishing, and hunting.....................................................................................................................*965 *3,047 *8,276 -- *21 *2,307 *43,927
Mining.....................................................................................................................10,429 15,307 256,348 -- 25,385 326,124 117,974
Metal mining..............................................................................................................*588 *25 *459 -- *995 124,557 *16,915 Coal mining..............................................................................................................*1,591 -- *11,224 -- -- -- *109 Oil and gas extraction..............................................................................................................*5,178 *2,183 *108,420 -- *1424 *170,336 *13,164 Nonmetallic minerals, except fuels..............................................................................................................3,072 13,099 *136,245 -- *22,966 31,230 87,786
Utilities.....................................................................................................................*13,334 -- *2,275 -- *2,521 *95,040 588,656
Construction.....................................................................................................................*553 1,240 *3,023 -- 8,328 11,426 *31,498 General building contractors..............................................................................................................*286 *462 *2,316 -- *4,037 *906 *24,831 Heavy construction contractors..............................................................................................................*9 *595 *38 -- *1,729 *7,334 *2,121 Special trade contractors..............................................................................................................*258 *183 *668 -- *1,286 *3,129 *4,546
Manufacturing.....................................................................................................................153,943 1,408,089 1,877,298 2,726 118,969 1,799,680 21,135,438
Food manufacturing..............................................................................................................5,004 44,341 21,504 -- *5,322 25,172 1,046,576 Beverage and tobacco product manufacturing..............................................................................................................*6,686 *110,645 *161,990 *642 *872 *14,085 *1,618,222 Beverage manufactures..............................................................................................................*6,680 *47,158 *150,530 *642 *872 *12,952 *538,518 Tobacco manufactures..............................................................................................................*7 *63,488 *11,460 -- -- *11,33 *1,079,703 Textile mill and textile products mills..............................................................................................................*510 *1,431 *306 *74 *64 *87 14,348
Apparel manufacturing..............................................................................................................*75 15,229 *4,559 -- *155 *117 158,483 Wood product manufacturing..............................................................................................................*772 *382 *3,110 -- -- *575 *2,325 Paper manufacturing..............................................................................................................2,551 27,166 *25,274 -- *243 *303 485,695 Printing and related support activities..............................................................................................................*68 *1,272 -- -- *88 *33 *1,423 Petroleum and coal products manufacturing..............................................................................................................34,839 8,285 *935,966 -- *481 804,431 2,893,321 Chemical manufacturing..............................................................................................................25,951 235,135 254,805 *762 19,662 256,194 5,078,238
Pharmaceutical and medicine manufacturing..............................................................................................................9,915 75,079 88,558 *558 *5446 31,103 2,536,194 Other chemical manufacturing..............................................................................................................16,036 160,057 166,247 *203 14,216 225,090 2,542,044 Plastics and rubber products manufacturing..............................................................................................................1,743 19,355 *7,115 -- *703 *293 343,973 Nonmeticallic mineral product manufacturing..............................................................................................................240 4,808 *661 -- *3,102 *2,801 203,170 Primary metal manufacturing..............................................................................................................4,500 *3,990 *19,477 -- *217 32,023 258,075 Fabricated metal product manufacturing..............................................................................................................2,825 9,512 11,070 *5 *1,134 22,773 518,019 Machinery manufacturing..............................................................................................................12,209 68,781 200,559 *54 24,311 39,085 1,574,369
Computer and electronic products..............................................................................................................13,418 716,001 128,288 *286 15,055 71,951 2,696,496 Electrical equipment, applicance, and component..............................................................................................................27,218 13,320 6,075 *883 *476 500,191 1,389,440 Transportation equipment manufacturing..............................................................................................................12,559 105,340 81,090 *16 *46,414 24,450 2,527,923 Motor vehicles and equipment..............................................................................................................10,572 80,109 *48,407 *9 *29,737 *21,255 2,308,489 Other transportation equipment manufacturing..............................................................................................................*1,987 25,231 *32,683 *8 *16,676 *3,195 219,434
Furniture and related products..............................................................................................................*538 457 *186 -- -- *123 *50,050 Miscellaneous manufacturing and manufacturing not allocable..............................................................................................................2,235 22,639 15,265 *4 *670 4,994 275,293
Wholesale and retail trade.....................................................................................................................15,176 80,222 199,476 *259 8,526 39,332 747,611
Wholesale trade..............................................................................................................14,239 23,242 91,143 *259 7,613 17,528 504,884
Durable goods.....................................................................................................5,208 3,746 7,433 *259 1,073 6,508 84,425
Nondurable goods.....................................................................................................9,031 19,496 83,710 -- 6,540 11,020 420,459
Drugs, chemicals, and allied products...................................................................................................*161 *3,415 *3,018 -- *500 *352 *38,524
Petroleum and petroleum products...................................................................................................*1,061 *484 *555 -- *361 *345 *22
Other miscellaneous wholesale trade...................................................................................................*257 *229 *993 -- *315 *382 *53,604 Other nondurable goods.....................................................................................................7,552 15,369 79,144 -- *5,363 9,942 328,308
Footnotes at end of table.
Taxes withheld at source on--

204
Corporate Foreign Tax Credit, 1998
204
Table 1a.--U.S. Corporation Returns with a Foreign Tax Credit: Total Assets, Income, Tax, and Credits, and Foreign Income and Tax Reported on Form 1118, by Selected Industrial Group (by NAICS Classification)--Continued [All figures are estimates based on samples--money amounts are in thousands of dollars]
Foreign income and taxes reported on Form 1118--Continued
Foreign taxes available for credit--Continued
Paid or accrued--Continued
Other taxes paid or accrued on--
Major and selected minor industrial group Specifically Taxes
Rents, allocable deemed
Interest royalties, Branch income Service Other paid
and license income [section income income
fees 863(b)]
(46) (47) (48) (49) (50) (51) (52)
Retail trade..............................................................................................................937 56,980 108,333 -- *912 21,804 242,727 Motor vehicle and parts dealers...................................................................................................*27 *80 -- -- -- *6 -- Food and beverage stores...................................................................................................*270 *7,238 -- -- -- *( ² ) --
Clothing and clothing accessories stores...................................................................................................*144 3,462 *15,393 -- -- *18,348 *191,863 General merchandise stores...................................................................................................*163 *7,873 *15,103 -- *59 *2,224 *10,620 All other retail stores...................................................................................................*332 38,327 *77,837 -- *853 *1,225 40,244
Transportation and warehousing.....................................................................................................................3,827 *3,173 27,677 *590 70,671 *1294 64,475
Transportation..............................................................................................................3,664 *3,173 27,677 *590 70,671 *1294 64,024 Water transportation.........................................................................................................*102 -- *8 -- *65,744 *157 *17,060 All other transportation.........................................................................................................3,562 *3,173 *27,669 *590 4,927 *1,137 46,964 Warehousing and storage..............................................................................................................*164 -- -- -- -- -- *450
Information.....................................................................................................................8,481 566,532 333,290 *2,161 22,774 154,212 1,274,993 Publishing industries..............................................................................................................1,020 431,250 296,357 *2,161 *6,091 114,639 491,674 Motion picture and sound recording industries..............................................................................................................-- 7,580 *2,571 -- *13 *26,410 *119,264 Broadcasting and telecommunications..............................................................................................................*6,002 117,077 *32,929 -- *2,745 12,125 *445,981 Broadcasting..............................................................................................................*771 *110,847 -- -- *76 *6,063 *165,595 Telecommunications..............................................................................................................*5,230 *6,230 *32,929 -- *2,669 *6,061 *280,387 Information and data processing services..............................................................................................................*1,459 *10,625 *1,433 -- 13,924 *1,039 *218,073
Finance, insurance, and real estate.....................................................................................................................362,150 21,930 661,282 *64 43,908 509,705 1,370,650
Finance and insurance..............................................................................................................361,750 17,217 654,171 *64 41,974 509,281 1,363,312 Depository credit intermediation..............................................................................................................*7,037 *47 *129 -- *94 *( ² ) *24 Nondepository credit intermediation..............................................................................................................*5,921 *11,720 *128,526 -- *4,377 *1,011 *41,706
Securities, commodity contracts, etc...............................................................................................................151,174 2,717 202,500 -- *6,258 280,989 796,571 Insurance carriers and related activities..............................................................................................................197,619 2,608 321,825 *64 31,245 226,759 525,011 Other finance and insurance..............................................................................................................-- *125 *1,191 -- -- *521 -- Real estate and rental and leasing..............................................................................................................400 4,713 *7,111 -- *1,934 424 *7,337
Services.....................................................................................................................215,244 113,889 1,491,927 *2,724 86,138 220,357 1,652,764
Professional, scientific, and technical services..............................................................................................................363 38,978 122,882 *2,724 51,410 13,436 180,575 Management of companies (holding companies)..............................................................................................................206,343 3,823 1,260,657 -- *8,591 188,759 1,070,944 Educational, health care, and social assistance..............................................................................................................*7 *3,327 *106 -- *1,390 *76 *22,488
Arts, entertainment, and recreation..............................................................................................................*27 *3,567 *543 -- *11,515 *12,259 *19,798 Accommodation and food services..............................................................................................................6,491 57,494 *96,502 -- *7,420 *3,821 *207,254 Other services..............................................................................................................2,013 6,698 *11,235 -- 5,811 2,005 151,705 Footnotes on next page.
Taxes withheld at source on--

205
Corporate Foreign Tax Credit, 1998
Footnotes and Notes to Table 1: * Data should be used with caution because of the small number of returns on which they were based. ¹ Interest-Charge Domestic International Sales Corporation (IC-DISC) and Domestic International Sales Corporation (DISC). ² Less than $500. ³ In addition to the credits shown in columns 12-14, this is after reduction by other credits, such as the jobs credit and the investment credit, which are not shown separately in this table.
Included in gross income (less loss), columns 16-22. See notes below. Included in deductions, columns 26-35. See notes below. NOTES: Detail may not add to totals because of rounding. Columns 2 through 15 present statistics on assets, receipts, income, and taxes reported on Form 1120 (Corporation Income Tax Return) series for corporations claiming a foreign tax credit. Columns 16 through 52 present statistics from Form 1118, Foreign
Tax Credit--Corporations. Schedule references indicate the schedule of Form 1118 from which the data were obtained. Columns 16 through 36 present statistics on foreign income (i.e., income from sources outside the United States) and deductions reported primarily on Schedule A, Form 1118. Although the amounts of oil and gas income and deductions (columns 23 and 36, respectively) are contained in the summary columns (i.e., columns 16 through 22 and 26 through 35), these amounts are also reported separately (on Schedule I) because oil and gas income is subject to special rules under Internal Revenue Code section 907,
which may result in a reduction of foreign taxes available for credit. Code section 863(b) income (income partly within and partly without the United States) and foreign branch income are also included in the summary amounts reported in columns 16 through 22 and are also reported separately (on Schedule F) in columns 24 and 25. Total deductions not allocable to specific types of income (column 32) are equal to the sum of columns 33 through 35 (any differences are due to taxpayer reporting practices). Total foreign-source gross income (column 16) less total foreign deductions (column 26) is equal to foreign-source taxable income before adjustments (column 37).
Adjustments to foreign-source taxable income (reported in column 38) include allocations of current-year U.S.-source losses and recapture of foreign losses,as well as other adjustments. These adjustments (reported on Schedule J) affect the numerator of the limitation fraction used to compute the foreign tax credit. The foreign-source taxable income after adjustments (the numerator of the limitation fraction) is reported in column 39. The limitation fraction, which represents
the ratio of foreign-source taxable income after adjustments to total (U.S. and foreign) taxable income after adjustments, is applied to the total U.S. tax againstwhich the credit is allowed to determine any limitation on the foreign tax credit.
Statistics on foreign taxes are reported in columns 40 through 52. Data on foreign taxes paid, accrued, and deemed paid (through related foreign corporations or their subsidiaries) from Schedule B, Form 1118, are reported in columns 43 through 52. Total foreign taxes paid or accrued (column 44) are the sum of columns45 through 51 (any differences are due to taxpayer reporting practices). Total foreign taxes paid, accrued, and deemed paid (column 43) are equal to the sum of
total taxes paid or accrued (column 44) and taxes deemed paid (column 52). Total foreign taxes paid, accrued, and deemed paid are then adjusted for certain items (e.g., reductions of foreign taxes under Code section 907 related to oil and gas income), which are reported in column 41, as well as carryovers of foreign taxes not credited in prior years, which are reported in column 42. Thus, total foreign taxes available for credit (column 40) are equal to total foreign taxes paid, accrued, and deemed paid (column 43) less certain foreign taxes (column 41), plus any carryover of prior-year foreign taxes (column 42).
5
4

206
Corporate Foreign Tax Credit, 1998
206
Table 1b.--U.S. Corporation Returns with a Foreign Tax Credit: Total Assets, Income, Tax, and Credits, and Foreign Income and Tax Reported on Form 1118, by Selected Industrial Group (by SIC Classification) [All figures are estimates based on samples--money amounts are in thousands of dollars]
Foreign
Includable dividend
Dividends Dividends income of income
Major and selected minor industrial group Number of Total Total received from received from Controlled resulting from
returns assets receipts foreign IC-DISC's or Foreign foreign taxes
corporations former DISC's ¹ Corporations deemed paid
(gross-up)
(1) (2) (3) (4) (5) (6) (7)
All industries.....................................................................................................................5,927 15,174,244,548 5,367,522,238 35,296,572 19,520 22,187,348 27,092,409
Agriculture, forestry, and fishing.....................................................................................................................107 3,584,855 4,283,187 *21,820 -- *16,116 *42,782
Mining.....................................................................................................................164 95,033,214 38,818,332 151,192 -- 208,842 112,335 Metal mining..............................................................................................................10 9,300,850 4,801,377 *9,271 -- *364 *3,097 Coal mining..............................................................................................................6 *20,175,491 *5,866,352 *23 -- *3,777 *997 Oil and gas extraction..............................................................................................................85 60,386,800 23,660,962 114,481 -- 204,701 91,239 Nonmetallic minerals, except fuels..............................................................................................................12 5,154,412 4,343,023 *27,324 -- -- *17,001
Construction.....................................................................................................................220 16,101,731 24,358,101 28,843 -- *36,305 32,630 General building contractors..............................................................................................................126 9,218,346 17,733,227 16,821 -- *36,243 *25,963 Heavy construction contractors..............................................................................................................27 5,550,593 4,646,661 *3,843 -- *62 *2,121 Special trade contractors..............................................................................................................56 1,253,496 1,943,057 *8,179 -- -- *4,546
Manufacturing.....................................................................................................................1,634 4,074,287,782 2,513,671,091 27,469,828 19,520 15,129,035 21,506,856 Food and kindred products..............................................................................................................71 353,657,639 175,764,299 2,847,837 *66 830,700 1,649,484 Tobacco manufactures..............................................................................................................5 *88,665,073 *51,913,650 *1,236,016 -- *1,124,323 *1,114,659 Textile mill products..............................................................................................................22 11,870,499 12,293,698 4,626 -- *23,742 7,789 Apparel and other textile products..............................................................................................................53 18,424,587 21,376,534 217,837 *31 *89,734 164,313 Lumber and wood products..............................................................................................................17 29,986,598 19,803,825 *5,588 -- *53,881 *2,626 Furniture and fixtures..............................................................................................................14 11,610,561 13,037,164 *69,458 -- *61,170 *56,395 Paper and allied products..............................................................................................................30 61,031,956 46,285,844 538,600 -- 156,636 481,273 Printing and publishing..............................................................................................................93 134,492,655 67,963,111 235,049 *21 *71,460 110,460 Industrial plastics and synthetic material..............................................................................................................97 305,936,905 133,137,526 1,987,913 *9,441 876,131 1,323,133 Drugs..............................................................................................................56 216,278,719 143,789,492 2,358,108 *1,026 2,059,262 2,505,855 Other chemicals..............................................................................................................104 97,365,661 103,823,860 1,693,801 *767 550,540 1,215,054 Petroleum (including integrated) and coal products..............................................................................................................22 506,570,319 298,995,959 5,041,934 -- 1,081,502 2,921,797 Rubber and miscellaneous plastics products..............................................................................................................88 25,829,173 29,214,531 429,188 *602 39,963 327,859 Leather and leather products..............................................................................................................9 *2,194,565 *32,203,85 *4,980 -- *3,314 *3,713 Stone, clay, and glass products..............................................................................................................30 29,803,155 22,894,144 226,221 -- *29,811 150,926 Primary metal industries..............................................................................................................41 91,274,273 70,649,912 459,780 -- 269,497 318,929 Fabricated metal products..............................................................................................................140 70,917,190 55,993,377 679,729 *1,063 312,468 498,800 Office, computing, and accounting equipment..............................................................................................................24 93,773,312 97,550,552 1,923,365 -- 460,842 1,369,173 Other machinery, except electrical..............................................................................................................219 122,170,287 122,804,163 2,741,364 *3,094 707,255 1,466,680 Electrical and electronic equipment..............................................................................................................185 754,441,654 355,341,773 1,486,283 *656 2,623,823 2,358,487 Motor vehicles and equipment..............................................................................................................41 733,451,305 373,844,864 2,416,266 -- 2,286,353 2,305,503 Transportation equipment, except motor vehicles..............................................................................................................46 151,779,874 152,092,506 328,819 *537 234,973 237,186 Instruments and related products..............................................................................................................109 128,059,480 109,163,444 281,467 *1,347 1,084,584 767,287 Miscellaneous manufacturing and manufacturing not allocable..............................................................................................................69 30,498,856 27,238,220 249,579 *850 85,277 145,874
Transportation and public utilities.....................................................................................................................160 672,935,385 366,206,189 1,639,361 -- 1,180,148 1,145,926 Transportation..............................................................................................................86 106,154,096 97,966,029 71,291 -- 89,493 63,516 Water transportation.........................................................................................................36 5,214,507 3,254,417 *11,131 -- *61,319 *16,979 All other transportation.........................................................................................................48 100,898,780 94,630,485 59,272 -- 28,174 46,121 Communication..............................................................................................................32 246,682,526 143,533,627 *36,873 -- *592,581 *357,348 Electric, gas, and sanitary services..............................................................................................................39 319,982,046 124,539,421 1,231,196 -- 498,074 725,062 Footnotes at end of table.

207
Corporate Foreign Tax Credit, 1998
Table 1b.--U.S. Corporation Returns with a Foreign Tax Credit: Total Assets, Income, Tax, and Credits, and Foreign Income and Tax Reported on Form 1118, by Selected Industrial Group (by SIC Classification) --Continued [All figures are estimates based on samples--money amounts are in thousands of dollars]
Foreign
Includable dividend
Dividends Dividends income of income
Major and selected minor industrial group Number of Total Total received from received from Controlled resulting from
returns assets receipts foreign IC-DISC's or Foreign foreign taxes
corporations former DISC's ¹ Corporations deemed paid
(gross-up)
(1) (2) (3) (4) (5) (6) (7)
Wholesale and retail trade.....................................................................................................................782 424,052,069 679,808,010 1,710,436 -- 820,799 832,089
Wholesale trade..............................................................................................................513 201,266,182 273,664,027 961,978 -- 508,393 405,101
Groceries and related products.....................................................................................................10 2,258,588 3,804,623 *6,653 -- *265 *1,301 Machinery, equipment, and supplies.....................................................................................................57 8,128,163 7,904,869 *13,758 -- *5,346 *7,778 Miscellaneous wholesale trade.....................................................................................................445 190,879,431 261,954,535 941,567 -- 502,782 396,022
Drugs, chemicals, and allied products...................................................................................................19 24,914,265 33,814,377 *75,904 -- *42,548 *69,486 Petroleum and petroleum products...................................................................................................8 *17,311,893 *10,339,775 *90,077 -- *49,648 *55,975 Other miscellaneous wholesale trade...................................................................................................288 147,570,289 216,628,689 774,418 -- 390,205 257,029
Retail trade..............................................................................................................270 222,785,887 406,143,984 748,459 -- 312,406 426,988
Building materials, garden supplies, and mobile home dealers...................................................................................................14 *20,148,216 *42,521,495 *43,676 -- -- *31,906 General merchandise stores...................................................................................................8 *99,635,030 *240,025,855 *8,003 -- *65,769 *10,960
Food stores...................................................................................................10 5,316,006 10,394,638 *4 -- -- -- Automotive dealers and service stations...................................................................................................18 *451,576 *1,390,642 *167 -- *7 -- Apparel and accessory stores...................................................................................................13 27,948,693 42,908,181 *530,607 -- *135,566 *191,858 Furniture and home furnishing stores...................................................................................................11 3,366,439 2,506,762 *2,445 -- *9,985 *1,634
Eating and drinking places...................................................................................................29 44,737,280 27,402,608 *159,269 -- *63,469 *186,309 All other retail stores...................................................................................................166 21,170,067 38,962,191 *4,287 -- *37,610 *4,322
Finance, insurance, and real estate.....................................................................................................................1,724 9,526,885,253 1,485,647,335 3,155,182 *( ² ) 4,123,434 2,439,859
Banking..............................................................................................................300 3,311,684,955 306,383,259 845,381 -- 921,235 606,456 Credit agencies other than banks..............................................................................................................26 1,463,301,969 119,186,187 *420,809 -- *407,083 *138,427 Security, commodity brokers, and services..............................................................................................................83 1,304,938,129 147,961,669 281,885 *( ² ) 649,041 692,054 Insurance..............................................................................................................234 3,197,539,541 846,688,164 796,912 -- 1,750,215 453,884 Insurance agents, brokers, and service..............................................................................................................56 54,024,165 13,285,310 72,972 -- *41,095 *71,436
Real estate..............................................................................................................362 132,306,625 32,894,694 94,728 -- *3,110 *2,720 Holding and other investment companies, except bank holding companies..............................................................................................................659 62,685,204 18,491,181 641,884 -- 350,889 474,167
Services.....................................................................................................................1,133 361,259,647 254,606,500 1,096,456 -- 659,205 970,732
Hotels and other lodging places..............................................................................................................13 29,691,649 31,863,249 *25,045 -- *13,424 *20,467 Personal services..............................................................................................................11 6,442,025 6,593,329 *32,281 -- *822 *20,204 Business services..............................................................................................................260 154,944,036 122,040,305 758,000 -- 544,188 767,061
Auto repair; miscellaneous repair services..............................................................................................................14 7,092,225 5,641,239 *2,253 -- *5,918 *3,996 Amusement and recreation services..............................................................................................................140 76,792,014 35,641,540 *176,280 -- *29,935 *96,612 All other services..............................................................................................................686 85,952,282 51,727,814 100,781 -- 62,121 61,739 Footnotes at end of table.

208
Corporate Foreign Tax Credit, 1998
208
Table 1b.--U.S. Corporation Returns with a Foreign Tax Credit: Total Assets, Income, Tax, and Credits, and Foreign Income and Tax Reported on Form 1118, by Selected Industrial Group (by SIC Classification) --Continued [All figures are estimates based on samples--money amounts are in thousands of dollars]
U.S. income tax
before credits
Income
Major and selected minor industrial group Net income subject to Regular and Foreign tax U.S. General U.S. income
(less deficit) U.S. tax Total alternative credit possessions business tax after
minimum claimed tax credit credit credits ³
tax
(8) (9) (10) (11) (12) (13) (14) (15)
All industries.....................................................................................................................398,898,244 377,129,783 132,740,630 132,832,709 37,338,380 339,990 3,855,629 88,652,512
Agriculture, forestry, and fishing.....................................................................................................................524,523 500,095 175,522 175,520 52,931 -- *5,461 114,937
Mining.....................................................................................................................4,147,891 3,866,280 1,398,196 1,397,159 504,285 -- *56,252 810,693 Metal mining..............................................................................................................606,201 555,978 212,134 212,134 90,904 -- -- 118,074 Coal mining..............................................................................................................*365,294 *343,811 *128,393 *128,393 *62,483 -- *1 *65,895 Oil and gas extraction..............................................................................................................2,769,431 2,563,513 914,555 913,523 335,656 -- *55,666 504,440 Nonmetallic minerals, except fuels..............................................................................................................402,111 398,163 142,078 142,073 15,229 -- *585 121,262
Construction.....................................................................................................................973,898 922,097 323,166 319,907 70,498 -- *10,507 235,333 General building contractors..............................................................................................................517,288 473,621 165,402 164,162 50,517 -- *10,278 98,240 Heavy construction contractors..............................................................................................................375,170 372,490 131,582 129,775 11,828 -- *227 119,422 Special trade contractors..............................................................................................................79,363 73,924 25,560 25,348 7,791 -- *2 17,575
Manufacturing.....................................................................................................................198,568,318 185,943,283 65,542,089 65,641,464 27,171,848 333,719 2,345,425 34,658,931 Food and kindred products..............................................................................................................13,107,334 12,160,424 4,297,812 4,297,805 1,939,616 *45,211 66,104 2,195,003 Tobacco manufactures..............................................................................................................*7,624,782 *7,356,266 *2,575,377 *2,575,377 *1,228,545 -- *17,332 *1,320,415 Textile mill products..............................................................................................................469,662 431,727 150,471 150,471 9,369 -- *3,068 133,917 Apparel and other textile products..............................................................................................................2,051,342 2,032,983 720,175 719,993 165,124 *229 *4,112 550,713 Lumber and wood products..............................................................................................................778,764 746,643 261,081 261,081 8,886 -- *618 226,523 Furniture and fixtures..............................................................................................................1,143,789 1,122,214 393,423 393,435 57,306 -- *5,825 330,089 Paper and allied products..............................................................................................................4,039,028 3,895,780 1,379,059 1,379,314 549,375 *114 50,819 762,691 Printing and publishing..............................................................................................................6,683,275 6,133,778 2,158,242 2,157,936 158,780 *348 5,414 1,991,424 Industrial plastics and synthetic material..............................................................................................................10,757,189 9,428,678 3,355,717 3,355,818 1,521,323 *1,878 81,014 1,604,750 Drugs..............................................................................................................20,286,959 18,665,518 6,539,410 6,539,410 2,644,473 *237,337 462,366 3,147,847 Other chemicals..............................................................................................................9,493,491 9,248,899 3,265,697 3,265,697 1,356,731 *1,840 80,336 1,826,506 Petroleum (including integrated) and coal products..............................................................................................................21,182,883 20,693,021 7,253,421 7,260,725 4,295,129 -- *151,794 2,402,413 Rubber and miscellaneous plastics products..............................................................................................................2,297,462 2,199,926 771,096 771,592 321,530 *784 11,733 388,096 Leather and leather products..............................................................................................................*209,676 *206,687 *72,063 *72,063 *12,309 -- *506 *59,249 Stone, clay, and glass products..............................................................................................................2,699,818 2,501,265 876,245 876,102 143,440 -- 10,215 704,686 Primary metal industries..............................................................................................................3,443,473 3,216,331 1,126,287 1,137,950 395,210 -- 20,075 665,004 Fabricated metal products..............................................................................................................6,031,625 5,769,483 2,017,253 2,018,145 599,144 -- 29,691 1,372,805 Office, computing, and accounting equipment..............................................................................................................11,024,116 10,863,315 3,913,571 3,913,516 3,062,138 -- 67,841 770,156 Other machinery, except electrical..............................................................................................................12,768,712 11,645,087 4,085,825 4,086,438 1,850,891 *43 57,211 2,152,970 Electrical and electronic equipment..............................................................................................................28,257,254 25,950,300 9,069,071 9,159,453 2,666,334 -- 550,938 5,832,481 Motor vehicles and equipment..............................................................................................................14,565,432 13,938,180 5,049,549 5,037,701 2,582,991 -- 420,301 2,014,728 Transportation equipment, except motor vehicles..............................................................................................................6,218,031 5,524,409 1,933,136 1,932,987 328,002 -- 65,429 1,522,958 Instruments and related products..............................................................................................................11,068,207 10,005,152 3,506,188 3,505,153 1,086,682 *45,934 160,774 2,124,567 Miscellaneous manufacturing and manufacturing not allocable..............................................................................................................2,090,700 1,982,993 692,739 694,057 173,186 -- 17,717 500,634
Transportation and public utilities.....................................................................................................................40,064,661 39,178,320 13,735,369 13,740,278 1,198,523 -- 281,424 11,556,307 Transportation..............................................................................................................7,002,879 6,378,475 2,275,545 2,275,545 148,191 -- 36,416 1,646,362 Water transportation.........................................................................................................486,260 427,277 153,573 153,573 55,058 -- *1,460 85,724 All other transportation.........................................................................................................6,507,851 5,942,432 2,118,991 2,118,991 91,593 -- 34,955 1,559,198 Communication..............................................................................................................20,001,054 19,836,675 6,915,389 6,920,929 411,647 -- 115,513 6,365,598 Electric, gas, and sanitary services..............................................................................................................13,037,964 12,948,838 4,539,558 4,538,930 637,459 -- 129,495 3,540,750 Footnotes at end of table.

209
Corporate Foreign Tax Credit, 1998
Table 1b.--U.S. Corporation Returns with a Foreign Tax Credit: Total Assets, Income, Tax, and Credits, and Foreign Income and Tax Reported on Form 1118, by Selected Industrial Group (by SIC Classification) --Continued [All figures are estimates based on samples--money amounts are in thousands of dollars]
U.S. income tax
before credits
Income
Major and selected minor industrial group Net income subject to Regular and Foreign tax U.S. General U.S. income
(less deficit) U.S. tax Total alternative credit possessions business tax after
minimum claimed tax credit credit credits ³
tax
(8) (9) (10) (11) (12) (13) (14) (15)
Wholesale and retail trade.....................................................................................................................30,454,071 29,888,664 10,476,109 10,477,054 1,276,965 -- 173,663 8,739,864
Wholesale trade..............................................................................................................9,378,747 8,899,756 3,121,614 3,121,472 537,639 -- 52,166 2,318,751
Groceries and related products.....................................................................................................128,248 126,639 43,989 43,989 3,350 -- -- 37,809 Machinery, equipment, and supplies.....................................................................................................435,635 388,663 134,711 134,715 15,030 -- *1,872 114,746 Miscellaneous wholesale trade.....................................................................................................8,814,865 8,384,454 2,942,914 2,942,769 519,259 -- 50,294 2,166,196
Drugs, chemicals, and allied products...................................................................................................713,251 594,644 211,677 211,663 89,888 -- *2,486 94,469 Petroleum and petroleum products...................................................................................................*350,182 *306,584 *107,173 *107,173 *32,522 -- *5,701 *55,850 Other miscellaneous wholesale trade...................................................................................................7,589,152 7,330,665 2,572,163 2,572,031 387,244 -- 42,107 1,973,971
Retail trade..............................................................................................................21,075,324 20,988,909 7,354,495 7,355,582 739,326 -- 121,497 6,421,113
Building materials, garden supplies, and mobile home dealers...................................................................................................*2,949,054 *2,947,119 *1,031,378 *1,031,378 *29,783 -- *7,281 *994,314 General merchandise stores...................................................................................................*9,785,892 *9,741,478 *3,409,765 *3,409,765 *66,168 -- *57,640 *3,220,983
Food stores...................................................................................................332,702 331,070 114,357 115,743 10,938 -- *1,645 101,774 Automotive dealers and service stations...................................................................................................*42,549 *42,064 *14,425 *14,425 *557 -- 38 *13,765 Apparel and accessory stores...................................................................................................3,720,526 3,718,355 1,312,151 1,312,151 234,535 -- *6,187 1,069,646 Furniture and home furnishing stores...................................................................................................163,028 161,363 55,811 56,180 2,567 -- *193 52,749
Eating and drinking places...................................................................................................2,529,229 2,510,700 879,932 879,265 367,663 -- 38,247 471,921 All other retail stores...................................................................................................1,551,969 1,536,446 536,569 536,569 27,113 -- 10,256 495,866
Finance, insurance, and real estate.....................................................................................................................101,941,949 95,892,380 33,737,730 33,732,319 5,581,569 -- 701,540 26,985,727
Banking..............................................................................................................26,260,749 25,723,785 9,036,799 9,036,705 2,076,142 -- 344,496 6,510,705 Credit agencies other than banks..............................................................................................................5,927,835 5,693,391 1,992,568 1,992,568 524,201 -- *63,772 1,403,324 Security, commodity brokers, and services..............................................................................................................9,861,688 9,313,231 3,270,743 3,269,452 1,054,742 -- 26,940 2,097,491 Insurance..............................................................................................................52,889,296 48,181,415 16,997,445 16,996,572 1,356,070 -- 246,363 15,135,975 Insurance agents, brokers, and service..............................................................................................................1,933,942 2,201,602 764,277 764,277 70,467 -- *7,598 681,608
Real estate..............................................................................................................1,332,972 1,207,311 425,434 423,644 17,341 -- *3,814 402,384 Holding and other investment companies, except bank holding companies..............................................................................................................3,701,134 3,537,337 1,238,659 1,237,296 480,937 -- 8,520 744,137
Services.....................................................................................................................22,185,305 20,902,122 7,339,653 7,336,212 1,470,371 *6,271 281,357 5,549,313
Hotels and other lodging places..............................................................................................................1,401,357 1,364,685 479,013 478,673 40,307 *6,271 *38,617 393,784 Personal services..............................................................................................................1,346,588 1,344,174 470,311 470,311 21,441 -- *1,842 447,029 Business services..............................................................................................................12,483,461 11,664,641 4,104,880 4,102,185 1,107,272 -- 194,774 2,775,665
Auto repair; miscellaneous repair services..............................................................................................................276,896 171,004 61,643 61,562 4,783 -- *1,142 55,684 Amusement and recreation services..............................................................................................................2,822,438 2,640,500 921,990 921,990 171,511 -- *13,409 736,860 All other services..............................................................................................................3,808,918 3,672,387 1,286,419 1,286,093 123,331 -- 30,952 1,127,474 Footnotes at end of table.

210
Corporate Foreign Tax Credit, 1998
210
Table 1b.--U.S. Corporation Returns with a Foreign Tax Credit: Total Assets, Income, Tax, and Credits, and Foreign Income and Tax Reported on Form 1118, by Selected Industrial Group (by SIC Classification) --Continued [All figures are estimates based on samples--money amounts are in thousands of dollars]
Foreign income and taxes reported on Form 1118
Gross income (less loss)
Foreign
dividend
Major and selected minor industrial group income Rents,
Total Dividends resulting from Interest royalties, Service Other
foreign taxes and income income
deemed paid license fees
(gross-up)
(16) (17) (18) (19) (20) (21) (22)
All industries.....................................................................................................................349,386,789 60,541,096 27,074,099 68,413,782 55,875,295 23,414,004 114,068,512
Agriculture, forestry, and fishing.....................................................................................................................285,435 56,952 *42,782 *26,048 *19,842 *945 *138,866
Mining.....................................................................................................................5,537,629 347,907 112,335 217,728 397,328 2,154,382 2,307,949 Metal mining..............................................................................................................1,149,376 *9,635 *3,097 *32,979 *267 *265,367 *838,030 Coal mining..............................................................................................................*488,956 5,237 *997 *65,083 *28,475 *-14,039 *403,203 Oil and gas extraction..............................................................................................................3,830,365 305,631 91,239 111,975 363,688 1,902,891 1,054,941 Nonmetallic minerals, except fuels..............................................................................................................68,839 *27,310 *17,001 *7,691 *4,898 *163 *11,776
Construction.....................................................................................................................699,779 95,216 32,627 10,327 62,688 372,694 126,227 General building contractors..............................................................................................................392,846 83,235 *25,960 *5,707 *48,976 217,458 *11,510 Heavy construction contractors..............................................................................................................208,339 *3,908 *2,121 *2,274 *7,816 *126,403 *65,818 Special trade contractors..............................................................................................................96,477 8,073 *4,546 *2,345 *3,780 28,832 *48,899
Manufacturing.....................................................................................................................175,788,740 45,611,630 21,488,230 9,484,570 38,330,878 3,553,378 57,320,053 Food and kindred products..............................................................................................................11,051,056 3,760,822 1,649,593 345,371 2,134,463 158,641 3,002,166 Tobacco manufactures..............................................................................................................*6,412,358 *2,370,305 *1,103,909 *57,025 *1,166,241 -- *1,714,878 Textile mill products..............................................................................................................76,735 28,157 7,789 *4,194 *18,636 *851 *17,109 Apparel and other textile products..............................................................................................................989,431 307,488 164,315 29,807 348,188 *12,782 *126,851 Lumber and wood products..............................................................................................................142,965 *55,215 *2,626 *33,450 *10,499 *113 *41,063 Furniture and fixtures..............................................................................................................246,481 130,628 *56,395 *9,203 11,273 *7,631 *31,351 Paper and allied products..............................................................................................................2,395,056 785,638 481,273 44,233 512,362 *50,881 520,669 Printing and publishing..............................................................................................................5,209,003 340,223 110,460 20,858 2,541,890 136,745 2,058,826 Industrial plastics and synthetic material..............................................................................................................10,037,665 3,207,742 1,322,956 420,956 1,811,764 185,339 3,088,909 Drugs..............................................................................................................14,461,763 4,329,884 2,502,427 251,517 2,794,200 *195,728 4,388,007 Other chemicals..............................................................................................................7,678,029 2,258,089 1,215,606 146,190 1,845,157 44,385 2,168,601 Petroleum (including integrated) and coal products..............................................................................................................27,901,527 6,137,025 2,920,129 3,801,909 498,907 *96,823 14,446,735 Rubber and miscellaneous plastics products..............................................................................................................1,700,258 473,946 327,859 63,006 383,945 *35,444 416,058 Leather and leather products..............................................................................................................*146,620 *8,293 *3,713 *1,710 *61,302 *13,693 *57,908 Stone, clay, and glass products..............................................................................................................942,347 329,201 150,926 32,165 135,049 *61,879 233,128 Primary metal industries..............................................................................................................2,451,399 765,368 318,862 146,422 137,310 28,615 1,054,822 Fabricated metal products..............................................................................................................3,205,723 1,011,003 499,003 139,315 255,955 110,425 1,190,022 Office, computing, and accounting equipment..............................................................................................................16,454,054 2,396,863 1,369,173 256,597 10,297,921 *328,278 1,805,221 Other machinery, except electrical..............................................................................................................10,318,942 4,068,873 1,466,367 442,670 693,220 221,865 3,425,947 Electrical and electronic equipment..............................................................................................................24,956,701 5,136,356 2,356,017 2,074,137 3,796,075 1,171,215 10,422,900 Motor vehicles and equipment..............................................................................................................11,268,229 4,648,874 2,305,548 403,197 1,707,216 *3,865 2,199,530 Transportation equipment, except motor vehicles..............................................................................................................4,408,784 598,047 237,186 418,810 733,669 624,461 1,796,611 Instruments and related products..............................................................................................................11,731,509 2,105,014 766,622 303,085 5,878,926 51,133 2,626,729 Miscellaneous manufacturing and manufacturing not allocable..............................................................................................................1,446,673 340,801 145,874 20,348 496,308 *11,879 431,463
Transportation and public utilities.....................................................................................................................20,865,576 2,818,518 1,145,429 810,465 391,954 9,092,416 6,606,793 Transportation..............................................................................................................9,084,396 159,553 63,516 53,008 72,391 8,698,324 37,604 Water transportation.........................................................................................................306,120 *72,012 *16,979 *6,741 *110 *182,869 *27,410 All other transportation.........................................................................................................8,768,119 86,653 46,121 46,194 72,281 8,506,682 *10,187 Communication..............................................................................................................7,883,226 928,771 *357,293 149,305 268,236 259,594 5,920,028 Electric, gas, and sanitary services..............................................................................................................3,888,203 1,730,195 724,620 608,152 *51,327 129,308 644,602 Footnotes at end of table.

211
Corporate Foreign Tax Credit, 1998
Table 1b.--U.S. Corporation Returns with a Foreign Tax Credit: Total Assets, Income, Tax, and Credits, and Foreign Income and Tax Reported on Form 1118, by Selected Industrial Group (by SIC Classification) --Continued [All figures are estimates based on samples--money amounts are in thousands of dollars]
Foreign income and taxes reported on Form 1118
Gross income (less loss)
Foreign
dividend
Major and selected minor industrial group income Rents,
Total Dividends resulting from Interest royalties, Service Other
foreign taxes and income income
deemed paid license fees
(gross-up)
(16) (17) (18) (19) (20) (21) (22)
Wholesale and retail trade.....................................................................................................................10,000,750 2,522,847 832,143 583,221 1,501,570 309,391 4,251,578
Wholesale trade..............................................................................................................5,152,708 1,464,378 405,146 319,207 363,315 104,981 2,495,681
Groceries and related products.....................................................................................................59,532 *6,914 *1,301 *2,325 *5,899 *1,634 *41,459 Machinery, equipment, and supplies.....................................................................................................234,636 19,105 *7,778 11,988 *12,998 *3,752 179,015 Miscellaneous wholesale trade.....................................................................................................4,858,540 1,438,359 396,067 304,894 344,418 99,594 2,275,207
Drugs, chemicals, and allied products...................................................................................................687,121 *116,435 *69,530 *15,275 *33,512 *14,049 438,320 Petroleum and petroleum products...................................................................................................*339,621 *139,722 *55,978 *4,110 *309 *3,444 *136,059 Other miscellaneous wholesale trade...................................................................................................3,774,287 1,160,642 257,029 285,044 310,526 81,662 1,679,384
Retail trade..............................................................................................................4,848,042 1,058,469 426,997 264,015 1,138,254 204,410 1,755,897
Building materials, garden supplies, and mobile home dealers...................................................................................................*89,418 *43,698 *31,906 -- *13,156 -- *658 General merchandise stores...................................................................................................*715,165 *73,812 *10,960 *21,179 *137,559 *191,669 *279,987
Food stores...................................................................................................84,804 *10 -- *12,166 *71,218 -- *1,410 Automotive dealers and service stations...................................................................................................*12,293 *175 -- *247 *11,679 -- *192 Apparel and accessory stores...................................................................................................1,105,845 *666,141 *191,863 *7,584 *83,259 -- 156,997 Furniture and home furnishing stores...................................................................................................34,803 *12,430 *1,637 *187 *12,896 -- *7,653
Eating and drinking places...................................................................................................2,308,071 *220,665 *186,309 *200,080 667,270 *7,539 *1,026,207 All other retail stores...................................................................................................497,625 41,538 *4,322 *22,570 141,216 *5,203 282,776
Finance, insurance, and real estate.....................................................................................................................109,353,735 7,149,158 2,438,877 56,781,286 2,543,806 2,644,466 37,796,142
Banking..............................................................................................................53,753,319 1,804,201 605,892 34,704,362 1,379,414 520,891 14,738,560 Credit agencies other than banks..............................................................................................................16,357,242 774,571 *138,427 7,482,252 *252,139 *2,340 7,707,511 Security, commodity brokers, and services..............................................................................................................12,576,796 838,724 692,054 6,933,236 *17,310 379,365 3,716,107 Insurance..............................................................................................................23,684,583 2,532,278 453,456 7,161,860 812,240 1,467,088 11,257,661 Insurance agents, brokers, and service..............................................................................................................403,097 112,771 *71,434 *14,789 *15 *140,696 *63,393
Real estate..............................................................................................................603,580 97,885 *2,720 396,280 *21,560 *74,026 11,109 Holding and other investment companies, except bank holding companies..............................................................................................................1,958,326 987,352 474,180 88,492 61,127 60,060 287,115
Services.....................................................................................................................26,807,506 1,901,950 972,476 500,136 12,626,868 5,286,331 5,519,746
Hotels and other lodging places..............................................................................................................655,156 *38,469 *20,467 59,209 *88,170 *106,473 *342,368 Personal services..............................................................................................................99,882 *33,103 *20,204 *4,714 *20,137 *16,472 *5,253 Business services..............................................................................................................19,605,488 1,306,195 767,370 272,646 9,336,728 3,089,796 4,832,753
Auto repair; miscellaneous repair services..............................................................................................................50,422 *8,019 *3,996 *1,357 *23,753 *5,865 *7,431 Amusement and recreation services..............................................................................................................3,946,056 346,883 *96,611 *151,228 2,925,024 *326,979 *99,330 All other services..............................................................................................................2,411,948 164,667 63,174 10,788 227,942 1,740,163 205,214 Footnotes at end of table.

212
Corporate Foreign Tax Credit, 1998
212
Table 1b.--U.S. Corporation Returns with a Foreign Tax Credit: Total Assets, Income, Tax, and Credits, and Foreign Income and Tax Reported on Form 1118, by Selected Industrial Group (by SIC Classification) --Continued [All figures are estimates based on samples--money amounts are in thousands of dollars]
Foreign income and taxes reported on Form 1118--Continued
Deductions
Deductions allocable to specific types of income
Oil and gas Specifically Rental, royalty, and
Major and selected minor industrial group extraction Foreign allocable licensing expenses
income branch income Total Depreciation, Service (less loss) income [section Total depletion, expenses
863(b)] and Other
amortization
(23) (24) (25) (26) (27) (28) (29) (30)
All industries.....................................................................................................................15,127,351 87,251,267 9,176,112 202,269,920 108,022,787 1,290,753 6,110,720 13,036,724
Agriculture, forestry, and fishing.....................................................................................................................-- -- *127,202 *115,564 *70,985 -- *307 --
Mining.....................................................................................................................472,333 2,007,499 -- 3,462,161 2,619,659 102,587 33,994 665,804 Metal mining..............................................................................................................-- *220,753 -- *876,391 *692,728 *830 *95 *18,190 Coal mining..............................................................................................................-- *61,285 -- *284,929 *244,603 -- -- -- Oil and gas extraction..............................................................................................................*461,279 1,701,647 -- 2,283,875 1,675,451 101,757 33,885 647,507 Nonmetallic minerals, except fuels..............................................................................................................*11,054 *23,814 -- *16,965 *6,876 -- *14 *107
Construction.....................................................................................................................-- *107,451 *23,307 458,270 383,923 *2,089 *1,686 273,016 General building contractors..............................................................................................................-- *60,014 *23,307 235,121 204,282 *10 *455 *151,980 Heavy construction contractors..............................................................................................................-- *27,581 -- 155,226 *117,511 *1,148 *992 *99,516 Special trade contractors..............................................................................................................-- *19,856 -- *67,004 *61,211 *25 *228 *21,520
Manufacturing.....................................................................................................................14,509,761 21,589,235 8,538,198 80,943,008 45,083,686 231,239 1,954,701 1,307,834 Food and kindred products..............................................................................................................-- 1,686,674 *71,879 4,297,904 2,450,022 *1,504 *741,022 *18,645 Tobacco manufactures..............................................................................................................-- *954,818 -- *2,390,864 *1,650,364 -- *36,764 -- Textile mill products..............................................................................................................-- *1,639 *4,676 32,541 *7,205 -- -- *725 Apparel and other textile products..............................................................................................................-- *122,504 *1,788 296,541 151,153 *53 *14,539 *4,209 Lumber and wood products..............................................................................................................-- *952 -- *56,401 *14,522 -- -- -- Furniture and fixtures..............................................................................................................-- *23,406 *960 *69,353 *30,863 *1,034 -- *2,055 Paper and allied products..............................................................................................................-- 15,641 *43,218 781,672 255,588 *5 *10,465 *6,198 Printing and publishing..............................................................................................................-- 269,734 *3,671 3,760,614 2,143,176 *432 121,619 *70,228 Industrial plastics and synthetic material..............................................................................................................*1,335,459 1,115,467 *119,928 5,083,615 2,550,648 *4,526 *12,411 *111,889 Drugs..............................................................................................................-- 1,287,087 *444,041 5,458,801 2,697,371 -- *105,265 *44,199 Other chemicals..............................................................................................................-- 1,357,243 *225,167 3,297,801 1,685,067 *1,148 *1,168 *14,167 Petroleum (including integrated) and coal products..............................................................................................................13,174,302 9,090,042 *472,640 15,055,260 12,984,024 *11,673 *267,321 *108,026 Rubber and miscellaneous plastics products..............................................................................................................-- 142,337 *16,195 690,218 416,670 *3,688 *12,909 *1,190 Leather and leather products..............................................................................................................-- *9,840 -- *71,593 *28,320 *39 *15,578 -- Stone, clay, and glass products..............................................................................................................-- *63,539 *80,075 417,517 182,477 *31 *887 *51,728 Primary metal industries..............................................................................................................-- 391,176 *58,910 1,237,755 753,662 *121,368 *7,213 *3,110 Fabricated metal products..............................................................................................................-- 315,735 *12,483 1,333,091 706,451 *3,955 *16,746 *88,328 Office, computing, and accounting equipment..............................................................................................................-- 1,154,855 *41,602 6,613,897 1,892,105 *4 *15,866 *8,292 Other machinery, except electrical..............................................................................................................-- 574,462 252,776 4,381,134 2,100,492 *1,723 69,174 91,892 Electrical and electronic equipment..............................................................................................................-- 1,042,464 5,281,063 13,096,633 6,764,787 *6,820 168,017 116,875 Motor vehicles and equipment..............................................................................................................-- *1,110,706 *327,587 3,657,824 1,070,808 *15,482 *1,304 *1,902 Transportation equipment, except motor vehicles..............................................................................................................-- 427,944 *78,952 2,642,022 2,131,142 *41,371 *179,544 *528,824 Instruments and related products..............................................................................................................-- 284,282 1,000,587 5,401,336 1,987,459 *1,907 49,393 29,421 Miscellaneous manufacturing and manufacturing not allocable..............................................................................................................-- 144,802 -- 772,380 419,208 *14,270 *98,970 *5,335
Transportation and public utilities.....................................................................................................................*13,226 6,119,843 *1,132 14,020,153 12,389,580 7,347 14,316 5,747,958 Transportation..............................................................................................................-- 4,724,738 *1,132 8,039,025 7,800,446 *1,503 *4,649 5,513,662 Water transportation.........................................................................................................-- *26,636 -- *108,142 *84,426 *333 *1,758 *80,422 All other transportation.........................................................................................................-- *4,698,101 *1,132 7,925,273 7,710,411 *1,169 *2,891 5,427,630 Communication..............................................................................................................-- *607,694 -- 4,514,299 3,949,526 *60 *8,064 *220,141 Electric, gas, and sanitary services..............................................................................................................*13,226 787,411 -- 1,461,136 638,078 *5,784 *1,603 *12,626 Footnotes at end of table.
Gross income (less loss)--Continued
4 4
4

213
Corporate Foreign Tax Credit, 1998
Table 1b.--U.S. Corporation Returns with a Foreign Tax Credit: Total Assets, Income, Tax, and Credits, and Foreign Income and Tax Reported on Form 1118, by Selected Industrial Group (by SIC Classification) --Continued [All figures are estimates based on samples--money amounts are in thousands of dollars]
Foreign income and taxes reported on Form 1118--Continued
Deductions
Deductions allocable to specific types of income
Oil and gas Specifically Rental, royalty, and
Major and selected minor industrial group extraction Foreign allocable licensing expenses
income branch income Total Depreciation, Service
(less loss) income [section Total depletion, expenses
863(b)] and Other
amortization
(23) (24) (25) (26) (27) (28) (29) (30)
Wholesale and retail trade.....................................................................................................................*111,489 2,329,487 *86,253 4,737,737 3,008,232 4,915 361,400 158,257
Wholesale trade..............................................................................................................*111,489 794,889 *86,253 2,607,891 1,445,111 3,490 255,873 67,322
Groceries and related products.....................................................................................................-- *13,972 -- *47,190 *41,978 *1,290 *27,939 *1,592 Machinery, equipment, and supplies.....................................................................................................-- *24,412 *11,485 139,194 *66,489 *855 *2,894 *3,476 Miscellaneous wholesale trade.....................................................................................................*111,489 756,506 *72,454 2,421,507 1,336,644 *1,344 225,040 62,254
Drugs, chemicals, and allied products...................................................................................................-- *330,704 *48,075 355,849 *40,169 -- -- *13,254 Petroleum and petroleum products...................................................................................................*111,489 *3,608 -- *228,842 *126,647 -- *14 *767 Other miscellaneous wholesale trade...................................................................................................-- 422,194 *24,379 1,809,221 1,149,624 *1,344 206,101 47,898
Retail trade..............................................................................................................-- 1,534,597 *2,314 2,129,846 1,563,122 *1,426 105,527 *90,935
Building materials, garden supplies, and mobile home dealers...................................................................................................-- -- -- *3,909 -- -- -- -- General merchandise stores...................................................................................................-- *284,521 -- *437,436 *333,843 *369 -- *88,917
Food stores...................................................................................................-- -- -- *4,282 *3,489 -- *2,595 -- Automotive dealers and service stations...................................................................................................-- -- -- *6,200 *6,200 -- *4,679 -- Apparel and accessory stores...................................................................................................-- *13,702 -- 166,639 *113,155 -- *6,497 -- Furniture and home furnishing stores...................................................................................................-- -- -- *12,773 *6,704 -- *3,147 --
Eating and drinking places...................................................................................................-- *959,583 *125 1,236,659 885,508 -- *8,436 *1,148 All other retail stores...................................................................................................-- *276,792 *2,189 261,948 *214,222 *1,057 *80,172 *871
Finance, insurance, and real estate.....................................................................................................................*20,542 49,311,082 *2,140 80,205,399 32,351,951 691,380 1,019,041 1,119,170
Banking..............................................................................................................-- 34,193,438 -- 44,588,772 14,925,464 *427,782 333,456 *164,693 Credit agencies other than banks..............................................................................................................-- *5,465,375 -- 12,363,752 7,590,320 *64,763 *2,844 *19,972 Security, commodity brokers, and services..............................................................................................................-- *343,090 -- 8,513,284 1,846,172 *151,091 *438,545 *207,083 Insurance..............................................................................................................-- 9,165,065 -- 14,065,403 7,504,116 *45,290 227,945 585,945 Insurance agents, brokers, and service..............................................................................................................-- *54,976 -- 200,094 *167,619 *209 *70 *112,161
Real estate..............................................................................................................-- *34,814 -- 65,722 53,240 *2,003 *9,191 *23,006 Holding and other investment companies, except bank holding companies..............................................................................................................*20,542 54,323 *144 398,213 255,389 *241 3,772 *3,109
Services.....................................................................................................................-- 5,785,513 397,880 18,326,211 12,114,300 251,195 2,725,275 3,764,685
Hotels and other lodging places..............................................................................................................-- *339,753 -- *489,482 *396,530 *4,593 *6,767 *8,206 Personal services..............................................................................................................-- *01,670 *3,167 *26,379 *17,005 -- *22 *12,702 Business services..............................................................................................................-- 4,878,678 245,969 12,716,652 7,357,647 19,785 579,010 2,334,597
Auto repair; miscellaneous repair services..............................................................................................................-- *935 -- 22,115 *13,389 *144 *468 *3,440 Amusement and recreation services..............................................................................................................-- *175,354 *142,579 3,329,168 2,836,096 *225,955 2,047,944 *235,307 All other services..............................................................................................................-- 365,427 *6,164 1,710,331 1,463,994 *718 91,064 1,145,009 Footnotes at end of table.
Gross income (less loss)--Continued
4 4
4

214
Corporate Foreign Tax Credit, 1998
214
Table 1b.--U.S. Corporation Returns with a Foreign Tax Credit: Total Assets, Income, Tax, and Credits, and Foreign Income and Tax Reported on Form 1118, by Selected Industrial Group (by SIC Classification) --Continued [All figures are estimates based on samples--money amounts are in thousands of dollars]
Foreign income and taxes reported on Form 1118--Continued
Deductions not allocable to
Other specific types of income Deductions Taxable
Major and selected minor industrial group deductions from oil income Adjustmentsallocable Research and gas (less loss) to taxable
to specific Total and Interest Other extraction before income
types of development income 5
adjustments
income
(31) (32) (33) (34) (35) (36) (37) (38)
All industries.....................................................................................................................87,584,590 94,247,133 9,876,318 49,478,293 32,808,117 9,369,404 147,116,869 10,480,879
Agriculture, forestry, and fishing.....................................................................................................................*70,678 *44,579 *24,454 *10,035 *10,090 -- 169,870 *4,916
Mining.....................................................................................................................1,817,274 842,502 *52,884 304,042 453,900 *260,679 2,075,468 173,668 Metal mining..............................................................................................................*673,614 *183,663 -- *94,285 *89,378 -- 272,985 *10,858 Coal mining..............................................................................................................*244,603 *40,326 -- *37,862 -- -- *204,027 *1,575 Oil and gas extraction..............................................................................................................892,302 608,424 *51,360 164,792 363,205 *260,679 1,546,490 161,234 Nonmetallic minerals, except fuels..............................................................................................................*6,755 *10,089 *1,524 *7,102 *1,316 -- 51,873 --
Construction.....................................................................................................................107,131 74,348 *415 10,803 49,421 -- 241,509 22,723 General building contractors..............................................................................................................*51,837 *30,839 -- *3,812 *27,003 -- 157,725 *350 Heavy construction contractors..............................................................................................................*15,855 *37,715 *144 *3,348 *21,304 -- 53,112 *17,192 Special trade contractors..............................................................................................................*39,438 *5,794 *271 *3,644 *1,113 -- 29,472 *5,181
Manufacturing.....................................................................................................................41,589,912 35,859,322 7,256,462 13,046,001 15,171,429 8,987,198 94,845,732 5,245,162 Food and kindred products..............................................................................................................1,688,851 1,847,883 55,026 753,973 964,300 -- 6,753,152 577,935 Tobacco manufactures..............................................................................................................*1,613,599 *740,500 *53,142 *2,74837 *412,521 -- *4,021,495 *34,829 Textile mill products..............................................................................................................*6,480 25,336 *1,469 *17,822 *4,702 -- 44,194 *709 Apparel and other textile products..............................................................................................................*132,352 145,388 *2,696 *119,580 *17,779 -- 692,890 *133,852 Lumber and wood products..............................................................................................................*14,522 *41,878 *180 *26,768 *14,931 -- 86,565 *7,604 Furniture and fixtures..............................................................................................................*27,773 *38,490 *938 *29,466 *8,086 -- 177,128 *3,355 Paper and allied products..............................................................................................................238,920 526,084 *107,444 118,502 291,249 -- 1,613,384 *5,123 Printing and publishing..............................................................................................................1,950,897 1,617,438 *6,081 178,922 1,414,574 -- 1,448,389 792,238 Industrial plastics and synthetic material..............................................................................................................2,421,822 2,532,967 513,615 1,436,180 577,425 *414,343 4,954,051 212,169 Drugs..............................................................................................................2,547,908 2,761,430 632,284 651,349 1,428,501 -- 9,002,962 *4,078 Other chemicals..............................................................................................................1,668,584 1,612,734 424,770 511,194 663,512 -- 4,380,227 272,378 Petroleum (including integrated) and coal products..............................................................................................................12,597,004 2,071,236 *128,195 1,486,882 *452,595 8,572,855 12,846,267 77,748 Rubber and miscellaneous plastics products..............................................................................................................398,884 273,549 85,528 97,672 78,359 -- 1,010,039 26,352 Leather and leather products..............................................................................................................*12,703 *43,273 -- *5,273 *37,080 -- *75,027 *6,490 Stone, clay, and glass products..............................................................................................................129,830 235,040 *46,995 94,829 *83,794 -- 524,829 *2,062 Primary metal industries..............................................................................................................621,970 484,094 24,051 256,142 200,413 -- 1,213,644 22,216 Fabricated metal products..............................................................................................................597,421 626,640 84,078 268,742 269,977 -- 1,872,632 53,416 Office, computing, and accounting equipment..............................................................................................................1,867,944 4,721,791 1,442,827 733,924 2,543,691 -- 9,840,157 *734,883 Other machinery, except electrical..............................................................................................................1,937,703 2,280,642 325,597 638,178 1,247,297 -- 5,937,808 101,644 Electrical and electronic equipment..............................................................................................................6,473,075 6,331,846 1,419,483 2,645,023 2,229,490 -- 11,860,067 1,454,220 Motor vehicles and equipment..............................................................................................................1,052,121 2,587,016 538,778 1,848,172 178,756 -- 7,610,405 5,476 Transportation equipment, except motor vehicles..............................................................................................................1,381,403 510,880 153,226 217,719 *138,302 -- 1,766,762 *161,513 Instruments and related products..............................................................................................................1,906,737 3,413,877 1,100,378 536,149 1,761,443 -- 6,330,173 467,982 Miscellaneous manufacturing and manufacturing not allocable..............................................................................................................300,634 353,172 102,447 90,557 144,920 -- 674,293 76,679
Transportation and public utilities.....................................................................................................................6,619,959 1,630,573 79,669 1,288,718 253,533 *10,551 6,845,423 198,704 Transportation..............................................................................................................2,280,633 238,578 *17,961 88,628 129,208 -- 1,045,371 14,909 Water transportation.........................................................................................................*1,913 *23,716 -- *15,540 *6,749 -- 197,978 *13,293 All other transportation.........................................................................................................2,278,720 214,863 *17,961 73,088 122,459 -- 842,846 *1,616 Communication..............................................................................................................3,721,261 564,773 *61,310 *435,009 *67,205 -- 3,368,927 *845 Electric, gas, and sanitary services..............................................................................................................618,065 823,058 *398 765,080 57,120 *10,551 2,427,068 182,950 Footnotes at end of table.
Deductions--Continued

215
Corporate Foreign Tax Credit, 1998
Table 1b.--U.S. Corporation Returns with a Foreign Tax Credit: Total Assets, Income, Tax, and Credits, and Foreign Income and Tax Reported on Form 1118, by Selected Industrial Group (by SIC Classification) --Continued [All figures are estimates based on samples--money amounts are in thousands of dollars]
Foreign income and taxes reported on Form 1118--Continued
Deductions not allocable to
Other specific types of income Deductions Taxable
Major and selected minor industrial group deductions from oil income Adjustmentsallocable Research and gas (less loss) to taxable
to specific Total and Interest Other extraction before income
types of development income 5adjustments
income
(31) (32) (33) (34) (35) (36) (37) (38)
Wholesale and retail trade.....................................................................................................................2,483,660 1,729,505 23,956 784,762 878,464 *110,976 5,263,013 407,703
Wholesale trade..............................................................................................................1,118,426 1,162,780 23,248 457,756 647,175 *110,976 2,544,817 164,119
Groceries and related products.....................................................................................................*11,157 *5,212 -- *224 -- -- 12,343 -- Machinery, equipment, and supplies.....................................................................................................*59,264 *72,705 *282 *17,414 *54,450 -- 95,442 *28,028 Miscellaneous wholesale trade.....................................................................................................1,048,005 1,084,864 22,967 440,118 592,725 *110,976 2,437,033 136,091
Drugs, chemicals, and allied products...................................................................................................*26,915 315,680 *5,563 *81,953 *216,719 -- 331,272 *50,187 Petroleum and petroleum products...................................................................................................*125,866 *102,195 -- *2,140 *100,055 *110,976 *110,780 *616 Other miscellaneous wholesale trade...................................................................................................894,280 659,598 17,367 348,671 275,951 -- 1,965,066 85,288
Retail trade..............................................................................................................1,365,234 566,724 *707 327,006 231,289 -- 2,718,196 243,584
Building materials, garden supplies, and mobile home dealers...................................................................................................-- *3,909 -- -- -- -- *85,509 -- General merchandise stores...................................................................................................*244,557 *103,593 *10 *53,386 *49,899 -- *277,730 *25,047
Food stores...................................................................................................*894 *793 -- *572 *202 -- 80,521 *34,959 Automotive dealers and service stations...................................................................................................*1,521 -- -- -- -- -- *6,093 *2,092 Apparel and accessory stores...................................................................................................*106,658 53,484 *416 *45,118 *7,495 -- 939,205 *146,159 Furniture and home furnishing stores...................................................................................................*3,557 *6,068 -- *768 *3,556 -- 22,031 --
Eating and drinking places...................................................................................................*875,924 *351,151 -- *196,718 *153,136 -- 1,071,412 *1,208 All other retail stores...................................................................................................*132,123 47,725 *281 *30,445 *16,999 -- 235,678 *34,118
Finance, insurance, and real estate.....................................................................................................................29,522,361 47,853,448 194,212 33,466,865 12,729,162 -- 29,148,336 1,766,094
Banking..............................................................................................................13,999,534 29,663,308 *184,617 21,833,466 6,843,179 -- 9,164,547 5,166 Credit agencies other than banks..............................................................................................................7,502,741 4,773,433 -- *4,080,349 *415,166 -- 3,993,490 *775,978 Security, commodity brokers, and services..............................................................................................................1,049,453 6,667,112 *4,819 6,197,948 463,851 -- 4,063,512 *287,786 Insurance..............................................................................................................6,644,935 6,561,288 *897 1,290,971 4,962,359 -- 9,619,180 656,505 Insurance agents, brokers, and service..............................................................................................................*55,179 *32,475 *3,399 *26,487 *2,586 -- 203,004 *131
Real estate..............................................................................................................19,040 12,482 -- *8,950 *3,154 -- 537,858 38,698 Holding and other investment companies, except bank holding companies..............................................................................................................248,267 142,823 *480 28,182 38,851 -- 1,560,114 1,832
Services.....................................................................................................................5,373,145 6,211,911 2,244,225 566,944 3,261,503 -- 8,481,295 2,650,258
Hotels and other lodging places..............................................................................................................*376,963 *92,953 -- *57,278 *22,481 -- 165,674 *15,317 Personal services..............................................................................................................*4,282 *9,373 *269 *4,499 *2,298 -- 73,504 *3,456 Business services..............................................................................................................4,424,255 5,359,005 2,154,394 180,519 2,926,944 -- 6,888,836 2,403,392
Auto repair; miscellaneous repair services..............................................................................................................*9,338 *8,726 *( ² ) *3,093 *3,304 -- 28,306 *9,738 Amusement and recreation services..............................................................................................................*326,889 493,072 *17,947 *273,839 *184,357 -- 616,888 *22,640 All other services..............................................................................................................227,203 246,337 *70,888 47,691 120,615 -- 701,616 195,715 Footnotes at end of table.
Deductions--Continued

216
Corporate Foreign Tax Credit, 1998
216
Table 1b.--U.S. Corporation Returns with a Foreign Tax Credit: Total Assets, Income, Tax, and Credits, and Foreign Income and Tax Reported on Form 1118, by Selected Industrial Group (by SIC Classification) --Continued [All figures are estimates based on samples--money amounts are in thousands of dollars]
Foreign income and taxes reported on Form 1118--Continued
Foreign taxes available for credit
Paid or accrued
Taxable
Major and selected minor industrial group income Reduction Total paid, Taxes
(less loss) Total for certain Carryover accrued, Total withheld at
after foreign and deemed source on
adjustments taxes paid dividends
(39) (40) (41) (42) (43) (44) (45)
All industries.....................................................................................................................136,635,990 47,575,987 2,476,970 9,368,659 40,684,298 13,608,822 2,193,964
Agriculture, forestry, and fishing.....................................................................................................................164,954 60,983 -- *1,676 59,306 16,525 1,539
Mining.....................................................................................................................1,901,801 1,015,562 *320,756 573,326 762,992 650,658 10,812 Metal mining..............................................................................................................262,127 365,335 -- *139,153 226,182 *223,085 *4,892 Coal mining..............................................................................................................*202,452 *124,047 *12,254 *40,994 *95,307 *94,310 *( ² ) Oil and gas extraction..............................................................................................................1,385,255 507,024 *301,304 389,221 419,107 327,868 4,868 Nonmetallic minerals, except fuels..............................................................................................................51,873 19,141 *7,199 *3,958 22,382 5,380 *1,038
Construction.....................................................................................................................218,785 94,874 -- 15,488 79,387 46,759 630 General building contractors..............................................................................................................157,375 68,319 -- *11,793 56,526 30,566 452 Heavy construction contractors..............................................................................................................35,920 13,997 -- *1,579 12,418 10,297 *49 Special trade contractors..............................................................................................................24,291 12,196 -- *2,116 10,080 5,534 *128
Manufacturing.....................................................................................................................89,600,571 34,120,725 2,151,006 7,490,718 28,781,013 7,291,579 1,675,680 Food and kindred products..............................................................................................................6,175,217 2,239,102 -- 137,919 2,101,183 451,356 130,478 Tobacco manufactures..............................................................................................................*3,986,666 *1,257,071 -- *11,306 *1,245,765 *141,856 *62,661 Textile mill products..............................................................................................................43,485 11,149 -- *1,945 9,204 1,415 *107 Apparel and other textile products..............................................................................................................559,038 203,074 -- *2,755 200,319 36,005 *11,995 Lumber and wood products..............................................................................................................78,961 14,122 -- *4,524 9,599 6,973 *2,143 Furniture and fixtures..............................................................................................................173,772 73,690 -- *12,406 61,283 4,889 *3,593 Paper and allied products..............................................................................................................1,608,262 600,713 -- *30,407 570,306 89,033 33,542 Printing and publishing..............................................................................................................656,151 307,869 -- 26,475 281,394 170,934 10,535 Industrial plastics and synthetic material..............................................................................................................4,741,882 1,861,076 *10,967 199,176 1,672,867 349,774 115,804 Drugs..............................................................................................................8,998,884 3,157,143 *17 275,478 2,881,682 379,255 169,925 Other chemicals..............................................................................................................4,107,850 1,806,913 -- 165,115 1,641,798 426,191 43,371 Petroleum (including integrated) and coal products..............................................................................................................12,768,519 6,777,573 2,136,259 3,987,506 4,926,325 2,006,042 220,158 Rubber and miscellaneous plastics products..............................................................................................................983,688 407,286 -- 23,052 384,234 56,374 21,950 Leather and leather products..............................................................................................................*68,537 *12,411 -- *4 *12,406 *8,693 *429 Stone, clay, and glass products..............................................................................................................522,767 216,266 -- 37,735 178,531 27,605 *9,933 Primary metal industries..............................................................................................................1,191,427 607,420 *2,608 209,334 400,694 81,832 21,592 Fabricated metal products..............................................................................................................1,819,217 715,263 -- 121,574 593,688 94,686 46,138 Office, computing, and accounting equipment..............................................................................................................9,105,274 3,623,014 -- *1,630,286 1,992,728 623,555 139,165 Other machinery, except electrical..............................................................................................................5,836,164 2,009,071 *1,155 68,902 1,941,324 474,956 210,857 Electrical and electronic equipment..............................................................................................................10,405,847 3,648,553 -- 348,113 3,300,440 944,423 114,925 Motor vehicles and equipment..............................................................................................................7,604,929 2,844,479 -- 128,785 2,715,695 410,147 232,471 Transportation equipment, except motor vehicles..............................................................................................................1,605,249 349,964 -- 12,751 337,213 100,027 19,448 Instruments and related products..............................................................................................................5,862,191 1,140,482 -- 25,723 1,114,759 347,459 36,106 Miscellaneous manufacturing and manufacturing not allocable..............................................................................................................597,614 219,221 -- 24,010 195,211 49,338 18,124
Transportation and public utilities.....................................................................................................................6,646,719 1,700,827 *2,214 156,649 1,546,392 400,964 92,338 Transportation..............................................................................................................1,030,462 186,734 -- 13,150 173,584 110,068 3,790 Water transportation.........................................................................................................184,685 83,333 -- *521 82,812 65,833 *975 All other transportation.........................................................................................................841,229 99,948 -- 11,253 88,695 42,574 2,726 Communication..............................................................................................................3,368,082 552,280 -- *81,429 470,851 113,558 29,159 Electric, gas, and sanitary services..............................................................................................................2,244,118 960,397 *2,214 61,946 900,665 176,045 59,389 Footnotes at end of table.

217
Corporate Foreign Tax Credit, 1998
Table 1b.--U.S. Corporation Returns with a Foreign Tax Credit: Total Assets, Income, Tax, and Credits, and Foreign Income and Tax Reported on Form 1118, by Selected Industrial Group (by SIC Classification) --Continued [All figures are estimates based on samples--money amounts are in thousands of dollars]
Foreign income and taxes reported on Form 1118--Continued
Foreign taxes available for credit
Paid or accrued
Taxable
Major and selected minor industrial group income Reduction Total paid, Taxes
(less loss) Total for certain Carryover accrued, Total withheld at
after foreign and deemed source on
adjustments taxes paid dividends
(39) (40) (41) (42) (43) (44) (45)
Wholesale and retail trade.....................................................................................................................4,855,311 1,793,928 *137 444,425 1,349,641 517,498 103,021
Wholesale trade..............................................................................................................2,380,698 848,969 *137 177,248 671,858 266,712 83,597
Groceries and related products.....................................................................................................12,343 4,529 -- *1,468 3,061 *1,760 *457 Machinery, equipment, and supplies.....................................................................................................67,414 16,088 -- *1,320 14,769 6,990 *506 Miscellaneous wholesale trade.....................................................................................................2,300,942 828,351 *137 174,461 654,028 257,962 82,634
Drugs, chemicals, and allied products...................................................................................................281,085 223,211 -- *70,857 152,354 82,824 *4,747 Petroleum and petroleum products...................................................................................................*110,163 *108,589 *137 *46,380 *62,346 *6,369 *4,219 Other miscellaneous wholesale trade...................................................................................................1,879,778 482,491 -- 57,183 425,308 168,280 73,640
Retail trade..............................................................................................................2,474,612 944,959 -- 267,176 677,783 250,786 19,424
Building materials, garden supplies, and mobile home dealers...................................................................................................*85,509 *34,638 -- -- *34,638 *2,732 *-58 General merchandise stores...................................................................................................*252,682 *99,134 -- *56,079 *43,055 *32,096 *6,686
Food stores...................................................................................................45,562 11,190 -- *2,758 *8,432 *8,432 *2 Automotive dealers and service stations...................................................................................................*4,001 *557 -- *60 *497 *497 *26 Apparel and accessory stores...................................................................................................793,046 298,756 -- *80,511 218,245 26,382 *2,188 Furniture and home furnishing stores...................................................................................................22,031 2,751 -- *21 2,731 *1,094 *106
Eating and drinking places...................................................................................................1,070,204 460,677 -- *122,907 337,770 151,461 *10,146 All other retail stores...................................................................................................201,559 37,256 -- *4,841 32,415 28,093 *328
Finance, insurance, and real estate.....................................................................................................................27,382,242 6,390,808 *2,326 477,240 5,915,894 3,476,843 225,074
Banking..............................................................................................................9,159,381 2,462,854 -- 124,364 2,338,489 1,732,424 71,717 Credit agencies other than banks..............................................................................................................3,217,512 602,877 -- *61,464 541,413 402,985 *29,159 Security, commodity brokers, and services..............................................................................................................3,775,726 1,122,624 -- 9,756 1,112,868 420,814 17,100 Insurance..............................................................................................................8,962,675 1,435,898 -- 142,235 1,293,663 840,208 70,579 Insurance agents, brokers, and service..............................................................................................................202,873 78,283 -- *633 77,650 6,216 3,274
Real estate..............................................................................................................499,160 21,259 -- 3,126 18,132 15,412 9,780 Holding and other investment companies, except bank holding companies..............................................................................................................1,558,282 665,005 *2,326 135,648 531,683 57,503 23,355
Services.....................................................................................................................5,831,037 2,386,891 *530 207,871 2,179,550 1,207,074 84,855
Hotels and other lodging places..............................................................................................................150,357 76,339 -- *22,398 53,941 33,474 *1,791 Personal services..............................................................................................................70,048 37,173 -- *11,789 25,384 5,181 *1,844 Business services..............................................................................................................4,485,444 1,799,417 *508 84,956 1,714,969 947,599 64,651
Auto repair; miscellaneous repair services..............................................................................................................18,568 7,499 -- *8 7,491 3,495 *1,085 Amusement and recreation services..............................................................................................................594,248 264,491 -- *12,227 252,264 155,654 *11,139 All other services..............................................................................................................505,901 199,589 -- 75,633 123,956 60,782 4,050 Footnotes at end of table.

218
Corporate Foreign Tax Credit, 1998
218
Table 1b.--U.S. Corporation Returns with a Foreign Tax Credit: Total Assets, Income, Tax, and Credits, and Foreign Income and Tax Reported on Form 1118, by Selected Industrial Group (by SIC Classification) --Continued [All figures are estimates based on samples--money amounts are in thousands of dollars]
Foreign income and taxes reported on Form 1118--Continued
Foreign taxes available for credit--Continued
Paid or accrued--Continued
Other taxes paid or accrued on--
Major and selected minor industrial group Specifically Taxes
Rents, allocable deemed
royalties, Branch income Service Other paid
Interest and license income [section income income
fees 863(b)]
(46) (47) (48) (49) (50) (51) (52)
All industries.....................................................................................................................784,126 2,213,430 4,861,563 8,524 387,240 3,159,976 27,075,476
Agriculture, forestry, and fishing.....................................................................................................................*1,052 *3,209 *8,276 -- *142 2,307 *42,782
Mining.....................................................................................................................10,615 13,048 260,017 -- 30,009 326,157 112,335 Metal mining..............................................................................................................*2,525 *( ² ) *108,420 -- *15,902 *91,346 *35,490 Coal mining..............................................................................................................*4,138 -- *11,224 -- -- *78,949 *997 Oil and gas extraction..............................................................................................................3,720 12,887 140,374 -- 14,106 151,914 91,239 Nonmetallic minerals, except fuels..............................................................................................................*233 *161 -- -- -- *3,948 *17,001
Construction.....................................................................................................................*471 11,595 *3,023 -- 18,142 12,899 32,627 General building contractors..............................................................................................................*99 *10,455 *2,316 -- *14,808 *2,436 *25,960 Heavy construction contractors..............................................................................................................*114 *595 *38 -- *2,025 *7,476 *2,121 Special trade contractors..............................................................................................................*258 *183 *668 -- *1,309 *2,987 *4,546
Manufacturing.....................................................................................................................156,889 1,553,770 1,954,303 3,851 126,598 1,820,487 21,489,435 Food and kindred products..............................................................................................................11,671 91,974 172,035 *48 *6,498 38,654 1,649,827 Tobacco manufactures..............................................................................................................*84 *63,488 *11,460 -- -- *4,163 *1,103,909 Textile mill products..............................................................................................................*412 *334 *306 *74 *64 *118 7,789 Apparel and other textile products..............................................................................................................*108 18,876 *4,599 -- *132 *296 164,315 Lumber and wood products..............................................................................................................*742 *382 *3,096 -- *11 *598 *2,626 Furniture and fixtures..............................................................................................................*525 455 *169 -- *146 -- *56,395 Paper and allied products..............................................................................................................2,567 27,085 25,313 -- *222 303 481,273 Printing and publishing..............................................................................................................675 126,325 *12,501 -- *5,979 14,918 110,460 Industrial plastics and synthetic material..............................................................................................................8,053 94,360 97,841 *41 7,898 25,775 1,323,094 Drugs..............................................................................................................9,737 74,776 88,591 *558 *4,566 31,103 2,502,427 Other chemicals..............................................................................................................8,292 67,929 111,138 *422 *3,966 191,074 1,215,606 Petroleum (including integrated) and coal products..............................................................................................................34,773 *8,138 *932,296 -- *481 810,196 2,920,283 Rubber and miscellaneous plastics products..............................................................................................................1,829 20,520 11,074 -- *708 *293 327,859 Leather and leather products..............................................................................................................*68 *7,834 *339 -- *23 -- *3,713 Stone, clay, and glass products..............................................................................................................722 5,519 *805 *10 *5,541 *27,515 150,926 Primary metal industries..............................................................................................................3,944 6,688 *20,740 -- *548 28,320 318,862 Fabricated metal products..............................................................................................................3,570 10,246 8,816 -- *1,060 24,856 499,003 Office, computing, and accounting equipment..............................................................................................................*1,389 408,526 50,853 -- *2,521 21,100 1,369,173 Other machinery, except electrical..............................................................................................................12,069 28,932 184,799 *44 24,764 13,491 1,466,367 Electrical and electronic equipment..............................................................................................................34,912 151,824 98,417 *1,567 12,514 530,264 2,356,017 Motor vehicles and equipment..............................................................................................................10,647 77,446 *45,816 *883 *29,738 *13,145 2,305,548 Transportation equipment, except motor vehicles..............................................................................................................2,064 25,308 33,551 *13 *16,681 *2,962 237,186 Instruments and related products..............................................................................................................6,446 218,655 24,353 *191 *2,064 59,645 767,300 Miscellaneous manufacturing and manufacturing not allocable..............................................................................................................790 11,082 15,143 -- *81 4,117 145,874
Transportation and public utilities.....................................................................................................................23,216 13,248 66,149 *590 76,390 129,031 1,145,429 Transportation..............................................................................................................3,694 *3,168 27,677 *590 69,830 *1,319 63,516 Water transportation.........................................................................................................*102 -- *44 -- *64,555 *157 *16,979 All other transportation.........................................................................................................3,592 *3,168 *27,633 *590 *3,704 *1,162 46,121 Communication..............................................................................................................*5,256 8,978 *35,505 -- *2,619 32,041 *357,293 Electric, gas, and sanitary services..............................................................................................................14,266 *1,102 *2,967 -- *2,650 95,671 724,620 Footnotes at end of table.
Taxes withheld at source on--

219
Corporate Foreign Tax Credit, 1998
Table 1b.--U.S. Corporation Returns with a Foreign Tax Credit: Total Assets, Income, Tax, and Credits, and Foreign Income and Tax Reported on Form 1118, by Selected Industrial Group (by SIC Classification) --Continued [All figures are estimates based on samples--money amounts are in thousands of dollars]
Foreign income and taxes reported on Form 1118--Continued
Foreign taxes available for credit--Continued
Paid or accrued--Continued
Other taxes paid or accrued on--
Major and selected minor industrial group Specifically Taxes
Rents, allocable deemed
Interest royalties, Branch income Service Other paid
and license income [section income income
fees 863(b)]
(46) (47) (48) (49) (50) (51) (52)
Wholesale and retail trade.....................................................................................................................17,767 121,790 231,685 *594 7,024 35,617 832,143
Wholesale trade..............................................................................................................10,920 35,390 116,660 *594 6,763 12,787 1,185,669
Groceries and related products.....................................................................................................*134 *584 *506 -- *79 -- *1,301 Machinery, equipment, and supplies.....................................................................................................*1,271 *658 *3,555 -- *30 *972 *7,778 Miscellaneous wholesale trade.....................................................................................................9,516 34,149 112,600 *594 6,654 11,815 396,067
Drugs, chemicals, and allied products...................................................................................................*120 *520 *76,027 -- *1,152 *257 *69,530 Petroleum and petroleum products...................................................................................................*235 *229 *993 -- *315 *378 *55,978 Other miscellaneous wholesale trade...................................................................................................9,114 33,392 35,531 *594 5,187 10,821 257,028
Retail trade..............................................................................................................6,847 86,400 115,025 -- *261 22,830 426,997
Building materials, garden supplies, and mobile home dealers...................................................................................................*1 *2,699 -- -- -- 90 *31,906 General merchandise stores...................................................................................................*163 *7,873 *15,103 -- *59 *2,212 *10,960
Food stores...................................................................................................*1,150 *7,280 -- -- -- -- -- Automotive dealers and service stations...................................................................................................*26 *15 -- -- -- 430 -- Apparel and accessory stores...................................................................................................*113 *3,414 *2,319 -- -- *18,348 *191,863 Furniture and home furnishing stores...................................................................................................*18 *709 -- -- -- *261 *1,637
Eating and drinking places...................................................................................................*5,108 51,838 *82,737 -- *143 *1,489 *186,309 All other retail stores...................................................................................................*268 12,572 *14,866 -- *59 -- *4,322
Finance, insurance, and real estate.....................................................................................................................569,415 23,626 1,914,397 *64 51,246 693,022 2,439,051
Banking..............................................................................................................213,055 3,822 1,265,892 -- 7,445 170,492 24,264 Credit agencies other than banks..............................................................................................................*28,203 *12,654 *285,335 -- *4,502 *43,133 *138,427 Security, commodity brokers, and services..............................................................................................................126,629 *419 *37,624 -- *6,730 232,313 692,054 Insurance..............................................................................................................194,743 2,562 319,879 *64 29,775 222,605 453,456 Insurance agents, brokers, and service..............................................................................................................*147 *3 *1,987 -- *529 *276 *71,434
Real estate..............................................................................................................2,163 *380 *78 -- *1,440 1,571 *2,720 Holding and other investment companies, except bank holding companies..............................................................................................................4,472 *3,784 *3,603 -- *825 21,464 474,180
Services.....................................................................................................................4,701 473,131 422,818 *3,424 77,689 140,456 972,476
Hotels and other lodging places..............................................................................................................*378 *7,834 *13,706 -- *7,420 *2,344 *20,467 Personal services..............................................................................................................*229 *1,736 *905 -- *424 *44 *38,019 Business services..............................................................................................................3,085 332,307 403,684 *3,424 29,997 110,450 767,370
Auto repair; miscellaneous repair services..............................................................................................................*112 *1,984 *35 -- *37 *241 *3,996 Amusement and recreation services..............................................................................................................*779 116,664 *543 -- *11,659 *14,869 *96,611 All other services..............................................................................................................*97 12,411 3,564 -- 28,152 12,507 63,174 Footnotes on next page.
Taxes withheld at source on--

220
Corporate Foreign Tax Credit, 1998
220
Footnotes and Notes to Table 1b: * Data should be used with caution because of the small number of returns on which they were based. ¹ Interest-Charge Domestic International Sales Corporation (IC-DISC) and Domestic International Sales Corporation (DISC). ² Less than $500. ³ In addition to the credits shown in columns 12-14, this is after reduction by other credits, such as the jobs credit and the investment credit, which are not shown separately in this table.
Included in gross income (less loss), columns 16-22. See notes below. Included in deductions, columns 26-35. See notes below. NOTES: Detail may not add to totals because of rounding. Columns 2 through 15 present statistics on assets, receipts, income, and taxes reported on Form 1120 (Corporation Income Tax Return) series for corporations claiming a foreign tax credit. Columns 16 through 52 present statistics from Form 1118, Foreign
Tax Credit--Corporations. Schedule references indicate the schedule of Form 1118 from which the data were obtained. Columns 16 through 36 present statistics on foreign income (i.e., income from sources outside the United States) and deductions reported primarily on Schedule A, Form 1118. Although the amounts of oil and gas income and deductions (columns 23 and 36, respectively) are contained in the summary columns (i.e., columns 16 through 22 and 26 through 35), these amounts are also reported separately (on Schedule I) because oil and gas income is subject to special rules under Internal Revenue Code section 907,
which may result in a reduction of foreign taxes available for credit. Code section 863(b) income (income partly within and partly without the United States) and foreign branch income are also included in the summary amounts reported in columns 16 through 22 and are also reported separately (on Schedule F) in columns 24 and 25. Total deductions not allocable to specific types of income (column 32) are equal to the sum of columns 33 through 35 (any differences are due to taxpayer reporting practices). Total foreign-source gross income (column 16) less total foreign deductions (column 26) is equal to foreign-source taxable income before adjustments (column 37).
Adjustments to foreign-source taxable income (reported in column 38) include allocations of current-year U.S.-source losses and recapture of foreign losses,as well as other adjustments. These adjustments (reported on Schedule J) affect the numerator of the limitation fraction used to compute the foreign tax credit. The foreign-source taxable income after adjustments (the numerator of the limitation fraction) is reported in column 39. The limitation fraction, which represents
the ratio of foreign-source taxable income after adjustments to total (U.S. and foreign) taxable income after adjustments, is applied to the total U.S. tax againstwhich the credit is allowed to determine any limitation on the foreign tax credit.
Statistics on foreign taxes are reported in columns 40 through 52. Data on foreign taxes paid, accrued, and deemed paid (through related foreign corporations or their subsidiaries) from Schedule B, Form 1118, are reported in columns 43 through 52. Total foreign taxes paid or accrued (column 44) are the sum of columns45 through 51 (any differences are due to taxpayer reporting practices). Total foreign taxes paid, accrued, and deemed paid (column 43) are equal to the sum of
total taxes paid or accrued (column 44) and taxes deemed paid (column 52). Total foreign taxes paid, accrued, and deemed paid are then adjusted for certain items (e.g., reductions of foreign taxes under Code section 907 related to oil and gas income), which are reported in column 41, as well as carryovers of foreign taxes not credited in prior years, which are reported in column 42. Thus, total foreign taxes available for credit (column 40) are equal to total foreign taxes paid, accrued, and deemed paid (column 43) less certain foreign taxes (column 41), plus any carryover of prior-year foreign taxes (column 42).
5
4

221
Corporate Foreign Tax Credit, 1998
Table 2.--U.S. Corporation Returns with a Foreign Tax Credit: Foreign Income and Tax Reported on Form 1118, by Industrial Division (by NAICS Classification) and Income Type[All figures are estimates based on samples--money amounts are in thousands of dollars]
Foreign income and taxes reported on Form 1118
Gross income (less loss)
Foreign
Number dividend
of income Rents,
returns Total Dividends resulting from Interest royalties, Service Other
foreign taxes and income income
deemed paid license fees
(gross-up)
(1) (2) (3) (4) (5) (6) (7) (8)
ALL INDUSTRIES
All income types..............................................................................................................5,927 349,386,789 60,541,096 27,074,099 68,413,782 55,875,295 23,414,004 114,068,512
Passive income................................................................................2,289 7,444,176 3,301,216 420,416 2,238,285 357,158 *2,114 1,124,987
High withholding tax interest................................................................................368 2,493,508 81,028 47,678 2,364,803 -- -- --
Financial services income................................................................................438 109,792,724 6,612,198 2,155,388 56,210,747 3,139,828 2,528,774 39,145,789 Shipping income................................................................................47 7,795,938 220,695 41,205 73,147 474,708 *6,710,261 275,922 Dividends from noncontrolled section 902 corp………. 510 3,143,059 2,145,866 938,720 49,627 *4,540 *243 4,063 Dividends from an IC-DISC or former DISC ¹................................................................................7 *10,993 *10,993 -- -- -- -- --
Miscellaneous separately calculated limitation................................................................................9 *38,907 *4,806 *1,121 -- -- -- *32,980
Certain distributions from a FSC or former FSC ²................................................................................75 3,370,102 3,370,012 *90 -- -- -- --
General limitation income................................................................................3,791 215,247,350 44,774,167 23,462,053 7,458,970 51,899,061 14,172,611 73,480,487 Section 901(j) income................................................................................6 *783 *1,734 -- -- -- -- *-951 Income re-sourced by treaty................................................................................7 *49,249 *18,383 *7,426 *18,204 -- -- *5,236
AGRICULTURE, FORESTRY,
FISHING, AND HUNTING All income types..............................................................................................................81 290,450 62,274 *43,927 *26,361 *18,293 *1 *139,594
Passive income................................................................................76 11,938 *232 *59 *10,302 *1,388 -- *-42 High withholding tax interest................................................................................-- -- -- -- -- -- -- -- Financial services income................................................................................-- -- -- -- -- -- -- --
Shipping income................................................................................-- -- -- -- -- -- -- --
Dividends from noncontrolled section 902 corp………. 3 *1,548 *1,217 *330 -- -- -- --
Dividends from an IC-DISC or former DISC ¹................................................................................-- -- -- -- -- -- -- -- Miscellaneous separately calculated limitation................................................................................-- -- -- -- -- -- -- -- Certain distributions from a FSC or former FSC ²................................................................................** ** ** -- -- -- -- -- General limitation income................................................................................8 *258,058 *41,919 *43,538 *16,060 *16,905 *1 *139,636
Section 901(j) income................................................................................-- -- -- -- -- -- -- --
Income re-sourced by treaty................................................................................-- -- -- -- -- -- -- --
MINING
All income types..............................................................................................................101 5,357,393 363,579 *117,974 228,918 409,764 2,043,709 2,193,449 Passive income................................................................................25 68,539 27,949 *2,123 35,912 *10 -- *2,545
High withholding tax interest................................................................................8 *42,885 *3,541 *2,087 *37,257 -- -- --
Financial services income................................................................................-- -- -- -- -- -- -- --
Shipping income................................................................................** ** -- -- -- -- -- ** Dividends from noncontrolled section 902 corp………. 6 *54,095 *37,575 *16,277 -- -- -- *244 Dividends from an IC-DISC or former DISC ¹................................................................................-- -- -- -- -- -- -- -- Miscellaneous separately calculated limitation................................................................................-- -- -- -- -- -- -- --
Certain distributions from a FSC or former FSC ²................................................................................-- -- -- -- -- -- -- --
General limitation income................................................................................92 5,192,220 294,129 97,488 155,749 409,754 2,043,709 2,191,392
Section 901(j) income................................................................................** ** ** -- -- -- -- -- Income re-sourced by treaty................................................................................-- -- -- -- -- -- -- --
UTILITIES
All income types..............................................................................................................32 3,499,547 1,496,487 636,148 567,383 *40,447 127,571 631,511
Passive income................................................................................22 433,740 141,180 2,563 38,067 -- *64 *251,867
High withholding tax interest................................................................................5 *12,882 -- -- *12,882 -- -- -- Financial services income................................................................................4 *40,943 *1,893 *200 *169 *33,079 *5,562 *39 Shipping income................................................................................** ** -- -- -- ** -- ** Dividends from noncontrolled section 902 corp………. 8 *115,130 *66,071 *19,957 *29,020 -- -- *83
Dividends from an IC-DISC or former DISC ¹................................................................................-- -- -- -- -- -- -- --
Miscellaneous separately calculated limitation................................................................................-- -- -- -- -- -- -- --
Certain distributions from a FSC or former FSC ²................................................................................-- -- -- -- -- -- -- -- General limitation income................................................................................24 2,885,573 1,287,344 613,429 487,245 -- *121,946 375,610 Section 901(j) income................................................................................-- -- -- -- -- -- -- -- Income re-sourced by treaty................................................................................-- -- -- -- -- -- -- --
Footnotes at end of table.
Industrial division and income type

222
Corporate Foreign Tax Credit, 1998
222
Table 2.--U.S. Corporation Returns with a Foreign Tax Credit: Foreign Income and Tax Reported on Form 1118, by Industrial Division (by NAICS Classification) and Income Type--Continued[All figures are estimates based on samples--money amounts are in thousands of dollars]
Foreign income and taxes reported on Form 1118Gross income (less loss)
ForeignNumber dividend
of income Rents,
returns Total Dividends resulting from Interest royalties, Service Other
foreign taxes and income incomedeemed paid license fees
(gross-up)
(1) (2) (3) (4) (5) (6) (7) (8)CONSTRUCTION
All income types..............................................................................................................221 558,544 47,556 *31,498 5,390 19,911 331,390 122,799 Passive income................................................................................59 9,407 890 -- *1,195 *420 *21 *6,881 High withholding tax interest................................................................................4 *1,654 -- -- *1,654 -- -- -- Financial services income................................................................................-- -- -- -- -- -- -- -- Shipping income................................................................................-- -- -- -- -- -- -- -- Dividends from noncontrolled section 902 corp………. 50 *3,739 *2,694 *883 -- -- -- *162 Dividends from an IC-DISC or former DISC ¹................................................................................-- -- -- -- -- -- -- -- Miscellaneous separately calculated limitation................................................................................-- -- -- -- -- -- -- -- Certain distributions from a FSC or former FSC ²................................................................................-- -- -- -- -- -- -- -- General limitation income................................................................................116 543,744 43,971 *30,615 *2,541 *19,491 331,369 115,756 Section 901(j) income................................................................................-- -- -- -- -- -- -- -- Income re-sourced by treaty................................................................................-- -- -- -- -- -- -- --
MANUFACTURING All income types..............................................................................................................1,510 167,963,972 44,303,840 21,134,234 9,412,797 35,137,332 3,360,666 54,615,104 Passive income................................................................................562 5,211,826 2,628,746 307,539 1,782,488 207,203 *1,014 284,836 High withholding tax interest................................................................................117 379,289 *553 *3,120 375,617 -- -- -- Financial services income................................................................................64 5,973,455 1,027,178 339,107 1,415,064 *678,577 *8,063 2,505,467 Shipping income................................................................................20 535,381 113,650 *6,325 *40,302 *293,090 *1,707 80,308 Dividends from noncontrolled section 902 corp………. 209 1,465,239 927,084 503,586 18,480 *4,417 -- 11,673 Dividends from an IC-DISC or former DISC ¹................................................................................7 *10,993 *10,993 -- -- -- -- -- Miscellaneous separately calculated limitation................................................................................8 *9,674 *4,806 *1,121 -- -- -- *3,747 Certain distributions from a FSC or former FSC ²................................................................................50 2,955,419 2,955,329 *90 -- -- -- -- General limitation income................................................................................1,222 151,378,234 36,615,772 19,965,919 5,762,644 33,954,044 3,349,882 51,729,972 Section 901(j) income................................................................................5 *397 *1,348 -- -- -- -- *-951 Income re-sourced by treaty................................................................................6 *44,064 *18,383 *7,426 *18,204 -- -- *52
WHOLESALE AND RETAIL TRADE
All income types..............................................................................................................809 9,007,432 2,595,939 747,611 416,232 1,058,946 500,106 3,688,599 Passive income................................................................................395 319,232 124,668 10,966 68,780 43,368 -- 71,451 High withholding tax interest................................................................................57 45,468 *1,156 *3,443 40,869 -- -- -- Financial services income................................................................................8 *175,039 *46,332 *7,623 *77,926 -- -- *43,158 Shipping income................................................................................** ** ** ** -- -- -- *(³) Dividends from noncontrolled section 902 corp………. 55 35,530 *25,159 10,058 -- -- *243 *70 Dividends from an IC-DISC or former DISC ¹................................................................................-- -- -- -- -- -- -- -- Miscellaneous separately calculated limitation................................................................................-- -- -- -- -- -- -- -- Certain distributions from a FSC or former FSC ²................................................................................** ** ** -- -- -- -- -- General limitation income................................................................................413 8,415,709 2,382,554 715,138 228,656 1,015,578 499,862 3,573,921 Section 901(j) income................................................................................-- -- -- -- -- -- -- -- Income re-sourced by treaty................................................................................-- -- -- -- -- -- -- --
TRANSPORTATION AND WAREHOUSING
All income types..............................................................................................................87 9,086,753 162,535 64,475 54,343 72,419 8,695,634 37,348 Passive income................................................................................41 14,697 10,539 *688 *3,375 *94 -- *1 High withholding tax interest................................................................................10 17,729 -- -- 17,729 -- -- -- Financial services income................................................................................5 *23,437 *10,197 -- -- -- *13,199 *41 Shipping income................................................................................13 6,925,381 *82,669 *34,358 *25,762 *47,964 *6,708,554 *26,074 Dividends from noncontrolled section 902 corp………. 7 *9,484 *7,842 *1,642 -- -- -- -- Dividends from an IC-DISC or former DISC ¹................................................................................-- -- -- -- -- -- -- -- Miscellaneous separately calculated limitation................................................................................-- -- -- -- -- -- -- -- Certain distributions from a FSC or former FSC ²................................................................................-- -- -- -- -- -- -- -- General limitation income................................................................................45 2,096,025 51,288 27,786 7,478 24,360 1,973,881 11,232 Section 901(j) income................................................................................-- -- -- -- -- -- -- -- Income re-sourced by treaty................................................................................-- -- -- -- -- -- -- -- Footnotes at end of table.
Industrial division and income type
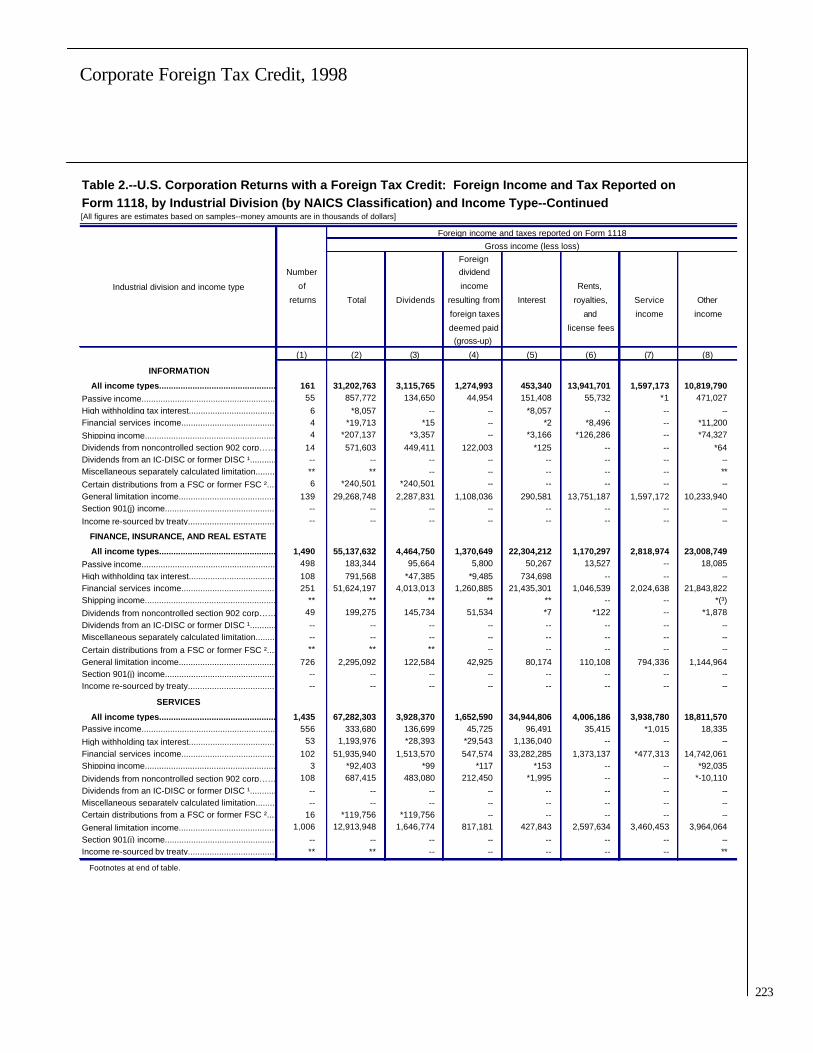
223
Corporate Foreign Tax Credit, 1998
Table 2.--U.S. Corporation Returns with a Foreign Tax Credit: Foreign Income and Tax Reported on Form 1118, by Industrial Division (by NAICS Classification) and Income Type--Continued[All figures are estimates based on samples--money amounts are in thousands of dollars]
Foreign income and taxes reported on Form 1118Gross income (less loss)
ForeignNumber dividend
of income Rents,
returns Total Dividends resulting from Interest royalties, Service Other
foreign taxes and income income
deemed paid license fees(gross-up)
(1) (2) (3) (4) (5) (6) (7) (8)
INFORMATION All income types..............................................................................................................161 31,202,763 3,115,765 1,274,993 453,340 13,941,701 1,597,173 10,819,790 Passive income................................................................................55 857,772 134,650 44,954 151,408 55,732 *1 471,027 High withholding tax interest................................................................................6 *8,057 -- -- *8,057 -- -- -- Financial services income................................................................................4 *19,713 *15 -- *2 *8,496 -- *11,200 Shipping income................................................................................4 *207,137 *3,357 -- *3,166 *126,286 -- *74,327 Dividends from noncontrolled section 902 corp………. 14 571,603 449,411 122,003 *125 -- -- *64 Dividends from an IC-DISC or former DISC ¹................................................................................-- -- -- -- -- -- -- -- Miscellaneous separately calculated limitation................................................................................** ** -- -- -- -- -- ** Certain distributions from a FSC or former FSC ²................................................................................6 *240,501 *240,501 -- -- -- -- -- General limitation income................................................................................139 29,268,748 2,287,831 1,108,036 290,581 13,751,187 1,597,172 10,233,940 Section 901(j) income................................................................................-- -- -- -- -- -- -- -- Income re-sourced by treaty................................................................................-- -- -- -- -- -- -- --
FINANCE, INSURANCE, AND REAL ESTATE
All income types..............................................................................................................1,490 55,137,632 4,464,750 1,370,649 22,304,212 1,170,297 2,818,974 23,008,749 Passive income................................................................................498 183,344 95,664 5,800 50,267 13,527 -- 18,085 High withholding tax interest................................................................................108 791,568 *47,385 *9,485 734,698 -- -- -- Financial services income................................................................................251 51,624,197 4,013,013 1,260,885 21,435,301 1,046,539 2,024,638 21,843,822 Shipping income................................................................................** ** ** ** ** -- -- *(³) Dividends from noncontrolled section 902 corp………. 49 199,275 145,734 51,534 *7 *122 -- *1,878 Dividends from an IC-DISC or former DISC ¹................................................................................-- -- -- -- -- -- -- -- Miscellaneous separately calculated limitation................................................................................-- -- -- -- -- -- -- -- Certain distributions from a FSC or former FSC ²................................................................................** ** ** -- -- -- -- -- General limitation income................................................................................726 2,295,092 122,584 42,925 80,174 110,108 794,336 1,144,964 Section 901(j) income................................................................................-- -- -- -- -- -- -- -- Income re-sourced by treaty................................................................................-- -- -- -- -- -- -- --
SERVICES
All income types..............................................................................................................1,435 67,282,303 3,928,370 1,652,590 34,944,806 4,006,186 3,938,780 18,811,570 Passive income................................................................................556 333,680 136,699 45,725 96,491 35,415 *1,015 18,335 High withholding tax interest................................................................................53 1,193,976 *28,393 *29,543 1,136,040 -- -- -- Financial services income................................................................................102 51,935,940 1,513,570 547,574 33,282,285 1,373,137 *477,313 14,742,061 Shipping income................................................................................3 *92,403 *99 *117 *153 -- -- *92,035 Dividends from noncontrolled section 902 corp………. 108 687,415 483,080 212,450 *1,995 -- -- *-10,110 Dividends from an IC-DISC or former DISC ¹................................................................................-- -- -- -- -- -- -- -- Miscellaneous separately calculated limitation................................................................................-- -- -- -- -- -- -- -- Certain distributions from a FSC or former FSC ²................................................................................16 *119,756 *119,756 -- -- -- -- -- General limitation income................................................................................1,006 12,913,948 1,646,774 817,181 427,843 2,597,634 3,460,453 3,964,064 Section 901(j) income................................................................................-- -- -- -- -- -- -- -- Income re-sourced by treaty................................................................................** ** -- -- -- -- -- ** Footnotes at end of table.
Industrial division and income type

224
Corporate Foreign Tax Credit, 1998
224
Table 2.--U.S. Corporation Returns with a Foreign Tax Credit: Foreign Income and Tax Reported on Form 1118, by Industrial Division (by NAICS Classification) and Income Type--Continued[All figures are estimates based on samples--money amounts are in thousands of dollars]
Foreign income and taxes reported on Form 1118--Continued
Deductions
Deductions allocable to specific types of income
Oil and gas Specifically Rental, royalty, and
Industrial division and income type extraction Foreign allocable licensing expenses
income branch income Total Depreciation, Service
(less loss) income [section Total depletion, expenses
863(b)] and Other
amortization
(9) (10) (11) (12) (13) (14) (15) (16)
ALL INDUSTRIES
All income types..............................................................................................................15,127,351 87,251,267 9,176,112 202,269,920 108,022,787 1,290,753 6,110,720 13,036,724
Passive income................................................................................*6,466 450,004 *2,430 1,876,663 511,814 8,431 49,050 *2,293
High withholding tax interest................................................................................-- 263,153 *136 1,028,408 140,149 -- *1,614 *1,590
Financial services income................................................................................-- 49,337,353 -- 81,744,094 33,505,524 687,531 980,954 937,327 Shipping income................................................................................-- *4,111,550 -- 6,960,589 6,658,183 *108,512 *115,130 *3,816,804 Dividends from noncontrolled section 902 corp………. -- *3,187 *( ³ ) 741,611 86,434 *( ³ ) *102 *1,832 Dividends from an IC-DISC or former DISC ¹................................................................................-- -- -- *9,387 *9,387 -- -- --
Miscellaneous separately calculated limitation................................................................................-- -- -- *11,517 *4,547 -- -- --
Certain distributions from a FSC or former FSC ²................................................................................-- -- -- 3,308,114 3,288,078 -- -- --
General limitation income................................................................................15,120,884 33,086,020 9,173,546 106,575,151 63,818,371 486,279 4,963,871 8,276,878 Section 901(j) income................................................................................-- -- -- *2,371 *268 -- -- -- Income re-sourced by treaty................................................................................-- -- -- *12,015 *32 -- -- --
AGRICULTURE, FORESTRY,
FISHING, AND HUNTING All income types..............................................................................................................-- -- *127,202 *119,484 *71,634 -- *686 *( ³ )
Passive income................................................................................-- -- -- *6,355 -- -- -- -- High withholding tax interest................................................................................-- -- -- -- -- -- -- -- Financial services income................................................................................-- -- -- -- -- -- -- --
Shipping income................................................................................-- -- -- -- -- -- -- --
Dividends from noncontrolled section 902 corp………. -- -- -- *743 -- -- -- --
Dividends from an IC-DISC or former DISC ¹................................................................................-- -- -- -- -- -- -- -- Miscellaneous separately calculated limitation................................................................................-- -- -- -- -- -- -- -- Certain distributions from a FSC or former FSC ²................................................................................-- -- -- ** ** -- -- -- General limitation income................................................................................-- -- *127,202 *93,481 *52,728 -- *686 *( ³ )
Section 901(j) income................................................................................-- -- -- -- -- -- -- --
Income re-sourced by treaty................................................................................-- -- -- -- -- -- -- --
MINING
All income types..............................................................................................................*369,280 1,975,904 -- 3,290,604 2,451,032 102,247 25,709 649,775 Passive income................................................................................-- *21,663 -- 8,909 *1,614 -- *4 --
High withholding tax interest................................................................................-- -- -- *4,912 *8 -- -- --
Financial services income................................................................................-- -- -- -- -- -- -- --
Shipping income................................................................................-- -- -- ** -- -- -- -- Dividends from noncontrolled section 902 corp………. -- -- -- *10,318 *622 -- -- -- Dividends from an IC-DISC or former DISC ¹................................................................................-- -- -- -- -- -- -- -- Miscellaneous separately calculated limitation................................................................................-- -- -- -- -- -- -- --
Certain distributions from a FSC or former FSC ²................................................................................-- -- -- -- -- -- -- --
General limitation income................................................................................*369,280 1,954,240 -- 3,266,464 2,448,789 102,247 25,705 649,775
Section 901(j) income................................................................................-- -- -- -- -- -- -- -- Income re-sourced by treaty................................................................................-- -- -- -- -- -- -- --
UTILITIES
All income types..............................................................................................................*13,226 784,550 -- 1,306,909 615,244 *5,784 *1,603 *11,606
Passive income................................................................................-- *273,136 -- 79,157 35,181 *( ³ ) *648 --
High withholding tax interest................................................................................-- *13 -- *4,339 *( ³ ) -- -- -- Financial services income................................................................................-- *5,562 -- *32,438 *26,864 -- -- *2,007 Shipping income................................................................................-- -- -- ** ** ** ** -- Dividends from noncontrolled section 902 corp………. -- -- -- *38,526 *5,100 *( ³ ) *26 --
Dividends from an IC-DISC or former DISC ¹................................................................................-- -- -- -- -- -- -- --
Miscellaneous separately calculated limitation................................................................................-- -- -- -- -- -- -- --
Certain distributions from a FSC or former FSC ²................................................................................-- -- -- -- -- -- -- -- General limitation income................................................................................*13,226 *505,840 -- 1,143,853 542,673 *374 *913 *9,599 Section 901(j) income................................................................................-- -- -- -- -- -- -- -- Income re-sourced by treaty................................................................................-- -- -- -- -- -- -- --
Footnotes at end of table.
Gross income (less loss)--Continued
4 4
4

225
Corporate Foreign Tax Credit, 1998
Table 2.--U.S. Corporation Returns with a Foreign Tax Credit: Foreign Income and Tax Reported on Form 1118, by Industrial Division (by NAICS Classification) and Income Type--Continued[All figures are estimates based on samples--money amounts are in thousands of dollars]
Foreign income and taxes reported on Form 1118--ContinuedDeductions
Deductions allocable to specific types of incomeOil and gas Specifically Rental, royalty, and
Industrial division and income type extraction Foreign allocable licensing expenses
income branch income Total Depreciation, Service
(less loss) income [section Total depletion, expenses
863(b)] and Otheramortization
(9) (10) (11) (12) (13) (14) (15) (16)
CONSTRUCTION All income types..............................................................................................................-- *107,451 -- 381,474 336,455 *1,183 *1,675 256,540 Passive income................................................................................-- -- -- *783 *742 *10 *24 -- High withholding tax interest................................................................................-- -- -- *20 -- -- -- -- Financial services income................................................................................-- -- -- -- -- -- -- -- Shipping income................................................................................-- -- -- -- -- -- -- -- Dividends from noncontrolled section 902 corp………. -- -- -- *845 *58 -- -- -- Dividends from an IC-DISC or former DISC ¹................................................................................-- -- -- -- -- -- -- -- Miscellaneous separately calculated limitation................................................................................-- -- -- -- -- -- -- -- Certain distributions from a FSC or former FSC ²................................................................................-- -- -- -- -- -- -- -- General limitation income................................................................................-- *107,451 -- 379,826 335,655 *1,173 *1,651 256,540 Section 901(j) income................................................................................-- -- -- -- -- -- -- -- Income re-sourced by treaty................................................................................-- -- -- -- -- -- -- --
MANUFACTURING
All income types..............................................................................................................14,612,814 21,097,281 8,215,612 76,260,938 42,276,285 224,324 1,741,975 1,240,576 Passive income................................................................................*6,466 148,224 *2,260 1,440,295 394,645 *4,667 *11,136 *521 High withholding tax interest................................................................................-- *1,071 *136 100,993 27,463 -- -- -- Financial services income................................................................................-- *456,077 -- 3,899,782 2,170,180 *5,755 -- *1,902 Shipping income................................................................................-- *40,401 -- 466,502 386,215 *38,979 *113,040 *2,631 Dividends from noncontrolled section 902 corp………. -- *2,126 -- 433,536 45,837 -- *76 *1,832 Dividends from an IC-DISC or former DISC ¹................................................................................-- -- -- *9,387 *9,387 -- -- -- Miscellaneous separately calculated limitation................................................................................-- -- -- *10,191 *4,547 -- -- -- Certain distributions from a FSC or former FSC ²................................................................................-- -- -- 2,935,211 2,935,036 -- -- -- General limitation income................................................................................14,606,348 20,449,382 8,213,215 66,950,656 36,302,674 174,922 1,617,724 1,233,690 Section 901(j) income................................................................................-- -- -- *2,371 *268 -- -- -- Income re-sourced by treaty................................................................................-- -- -- *12,015 *32 -- -- --
WHOLESALE AND RETAIL TRADE All income types..............................................................................................................*111,489 1,682,666 *65,874 4,151,614 2,682,751 4,979 348,695 286,624 Passive income................................................................................-- *1,781 -- 167,023 18,413 *595 *8,944 *39 High withholding tax interest................................................................................-- -- -- 13,135 *5,470 -- -- -- Financial services income................................................................................-- *11,407 -- *73,426 *45,416 *240 *4 -- Shipping income................................................................................-- -- -- ** ** -- -- -- Dividends from noncontrolled section 902 corp………. -- -- *( ³ ) 14,881 *1,680 -- -- -- Dividends from an IC-DISC or former DISC ¹................................................................................-- -- -- -- -- -- -- -- Miscellaneous separately calculated limitation................................................................................-- -- -- -- -- -- -- -- Certain distributions from a FSC or former FSC ²................................................................................-- -- -- ** ** -- -- -- General limitation income................................................................................*111,489 1,669,478 *65,874 3,868,115 2,597,284 4,144 339,747 286,586 Section 901(j) income................................................................................-- -- -- -- -- -- -- -- Income re-sourced by treaty................................................................................-- -- -- -- -- -- -- --
TRANSPORTATION AND WAREHOUSING
All income types..............................................................................................................-- 4,724,738 *3,128 8,035,750 7,795,999 *1,503 *4,649 5,510,783 Passive income................................................................................-- *7 *1 4,099 *254 -- *( ³ ) -- High withholding tax interest................................................................................-- -- -- *487 *54 -- -- -- Financial services income................................................................................-- -- -- *15,038 *12,591 -- -- *9,259 Shipping income................................................................................-- *4,071,149 -- 6,248,963 *6,057,481 *64 *36 *3,814,172 Dividends from noncontrolled section 902 corp………. -- -- -- *3,634 -- -- -- -- Dividends from an IC-DISC or former DISC ¹................................................................................-- -- -- -- -- -- -- -- Miscellaneous separately calculated limitation................................................................................-- -- -- -- -- -- -- -- Certain distributions from a FSC or former FSC ²................................................................................-- -- -- -- -- -- -- -- General limitation income................................................................................-- 653,581 *3,127 1,763,529 1,725,618 *1,438 *4,613 1,687,352 Section 901(j) income................................................................................-- -- -- -- -- -- -- -- Income re-sourced by treaty................................................................................-- -- -- -- -- -- -- -- Footnotes at end of table.
Gross income (less loss)--Continued
4 4
4
4 4

226
Corporate Foreign Tax Credit, 1998
226
Table 2.--U.S. Corporation Returns with a Foreign Tax Credit: Foreign Income and Tax Reported on Form 1118, by Industrial Division (by NAICS Classification) and Income Type--Continued[All figures are estimates based on samples--money amounts are in thousands of dollars]
Foreign income and taxes reported on Form 1118--ContinuedDeductions
Deductions allocable to specific types of incomeOil and gas Specifically Rental, royalty, and
Industrial division and income type extraction Foreign allocable licensing expenses
income branch income Total Depreciation, Service
(less loss) income [section Total depletion, expenses
863(b)] and Otheramortization
(9) (10) (11) (12) (13) (14) (15) (16)
INFORMATION All income types..............................................................................................................-- 3,054,897 *243,296 19,911,938 12,634,227 232,406 2,283,489 1,282,885 Passive income................................................................................-- *879 -- 83,371 18,628 -- *6,962 -- High withholding tax interest................................................................................-- -- -- *3,559 *42 -- -- -- Financial services income................................................................................-- -- -- *19,571 *18,478 -- -- -- Shipping income................................................................................-- -- -- *142,009 *119,319 *64,059 *1,806 -- Dividends from noncontrolled section 902 corp………. -- -- -- 72,186 *22,577 -- -- -- Dividends from an IC-DISC or former DISC ¹................................................................................-- -- -- -- -- -- -- -- Miscellaneous separately calculated limitation................................................................................-- -- -- ** -- -- -- -- Certain distributions from a FSC or former FSC ²................................................................................-- -- -- *211,806 *211,560 -- -- -- General limitation income................................................................................-- 3,054,018 *243,296 19,378,111 12,243,622 168,347 2,274,721 1,282,885 Section 901(j) income................................................................................-- -- -- -- -- -- -- -- Income re-sourced by treaty................................................................................-- -- -- -- -- -- -- --
FINANCE, INSURANCE, AND REAL ESTATE
All income types..............................................................................................................-- 15,943,921 *144 36,408,313 17,775,632 266,215 700,719 1,368,707 Passive income................................................................................-- *381 -- 36,180 26,846 *2,263 11,896 *59 High withholding tax interest................................................................................-- *2 -- 285,815 95,048 -- *1,550 *1,590 Financial services income................................................................................-- 15,143,996 -- 34,185,448 16,465,403 *253,962 652,943 776,236 Shipping income................................................................................-- -- -- ** -- -- -- -- Dividends from noncontrolled section 902 corp………. -- -- -- 46,351 *9,549 -- -- -- Dividends from an IC-DISC or former DISC ¹................................................................................-- -- -- -- -- -- -- -- Miscellaneous separately calculated limitation................................................................................-- -- -- -- -- -- -- -- Certain distributions from a FSC or former FSC ²................................................................................-- -- -- ** ** -- -- -- General limitation income................................................................................-- 799,543 *144 1,833,236 1,157,573 9,990 34,330 590,822 Section 901(j) income................................................................................-- -- -- -- -- -- -- -- Income re-sourced by treaty................................................................................-- -- -- -- -- -- -- --
SERVICES
All income types..............................................................................................................*20,542 37,879,859 520,856 52,402,896 21,383,528 452,113 1,001,519 2,429,227 Passive income................................................................................-- *3,933 *168 50,490 15,490 *895 9,436 *1,675 High withholding tax interest................................................................................-- *262,067 -- 615,149 12,064 -- *63 -- Financial services income................................................................................-- 33,720,312 -- 43,518,392 14,766,592 *427,574 *328,006 *147,924 Shipping income................................................................................-- -- -- *93,722 *89,562 -- *232 -- Dividends from noncontrolled section 902 corp………. -- *1,061 -- 120,592 1,012 -- *( ³ ) -- Dividends from an IC-DISC or former DISC ¹................................................................................-- -- -- -- -- -- -- -- Miscellaneous separately calculated limitation................................................................................-- -- -- -- -- -- -- -- Certain distributions from a FSC or former FSC ²................................................................................-- -- -- *106,671 *87,055 -- -- -- General limitation income................................................................................*20,542 3,892,487 520,688 7,897,880 6,411,754 23,644 663,781 2,279,629 Section 901(j) income................................................................................-- -- -- -- -- -- -- -- Income re-sourced by treaty................................................................................-- -- -- -- -- -- -- --
Footnotes at end of table.
Gross income (less loss)--Continued
4 4
4
4 4

227
Corporate Foreign Tax Credit, 1998
Table 2.--U.S. Corporation Returns with a Foreign Tax Credit: Foreign Income and Tax Reported on Form 1118, by Industrial Division (by NAICS Classification) and Income Type--Continued[All figures are estimates based on samples--money amounts are in thousands of dollars]
Foreign income and taxes reported on Form 1118--Continued
Deductions not allocable to
Other specific types of income Deductions Taxable
Industrial division and income type deductions from oil income Adjustments
allocable Research and gas (less loss) to taxable
to specific Total and Interest Other extraction before income
types of development income 5 adjustments
income
(17) (18) (19) (20) (21) (22) (23) (24)
ALL INDUSTRIES
All income types..............................................................................................................87,584,590 94,247,133 9,876,318 49,478,293 32,808,117 9,369,404 147,116,869 10,480,879
Passive income................................................................................452,040 1,364,849 100,470 917,624 312,363 *4 5,567,513 169,103
High withholding tax interest................................................................................136,946 888,259 2,273 746,677 135,097 -- 1,465,100 59,714 Financial services income................................................................................30,899,712 48,238,570 198,176 34,333,832 12,617,472 -- 28,048,630 1,701,605 Shipping income................................................................................2,617,737 302,406 *9,556 141,728 149,704 -- 835,349 88,096 Dividends from noncontrolled section 902 corp………. 84,500 655,177 26,147 515,748 85,234 -- 2,401,448 -237,971 Dividends from an IC-DISC or former DISC ¹................................................................................*9,387 -- -- -- -- -- *1,606 *-7
Miscellaneous separately calculated limitation................................................................................*4,547 *6,969 *456 *3,303 *3,211 -- *27,390 *-7,096
Certain distributions from a FSC or former FSC ²................................................................................3,288,078 *20,036 -- *12,294 *7,742 -- 61,988 3,002
General limitation income................................................................................50,091,343 42,756,780 9,539,078 12,793,537 19,496,919 9,369,400 108,672,198 8,707,371 Section 901(j) income................................................................................*268 *2,102 *162 *1,863 *78 -- *-1,588 *-2,927 Income re-sourced by treaty................................................................................*32 *11,984 -- *11,686 *297 -- *37,233 *-11
AGRICULTURE, FORESTRY,
FISHING, AND HUNTING All income types..............................................................................................................*70,947 *47,851 *24,454 *10,035 *10,090 -- 170,965 *4,916
Passive income................................................................................-- *6,355 *214 *5,385 *756 -- 5,584 *321
High withholding tax interest................................................................................-- -- -- -- -- -- -- --
Financial services income................................................................................-- -- -- -- -- -- -- -- Shipping income................................................................................-- -- -- -- -- -- -- -- Dividends from noncontrolled section 902 corp………. -- *743 *417 *283 *42 -- *805 *-177 Dividends from an IC-DISC or former DISC ¹................................................................................-- -- -- -- -- -- -- -- Miscellaneous separately calculated limitation................................................................................-- -- -- -- -- -- -- --
Certain distributions from a FSC or former FSC ²................................................................................** -- -- -- -- -- -- --
General limitation income................................................................................*52,041 *40,753 *23,823 *4,367 *9,292 -- *164,577 *4,772
Section 901(j) income................................................................................-- -- -- -- -- -- -- -- Income re-sourced by treaty................................................................................-- -- -- -- -- -- -- --
MINING
All income types..............................................................................................................1,673,301 839,572 *54,061 295,441 463,133 *178,756 2,066,788 173,296 Passive income................................................................................*1,610 7,295 *131 5,770 *1,085 -- 59,630 2,121
High withholding tax interest................................................................................*8 *4,904 *29 *3,920 *955 -- *37,973 *3,988
Financial services income................................................................................-- -- -- -- -- -- -- --
Shipping income................................................................................-- ** -- ** -- -- ** **
Dividends from noncontrolled section 902 corp………. *622 *9,697 *1,892 *4,654 *3,151 -- *43,777 *7,844 Dividends from an IC-DISC or former DISC ¹................................................................................-- -- -- -- -- -- -- -- Miscellaneous separately calculated limitation................................................................................-- -- -- -- -- -- -- -- Certain distributions from a FSC or former FSC ²................................................................................-- -- -- -- -- -- -- -- General limitation income................................................................................1,671,062 817,676 *52,009 281,096 457,942 *178,756 1,925,756 159,992
Section 901(j) income................................................................................-- -- -- -- -- -- ** **
Income re-sourced by treaty................................................................................-- -- -- -- -- -- -- --
UTILITIES
All income types..............................................................................................................596,250 691,665 *398 643,746 *47,061 *10,551 2,192,638 174,190 Passive income................................................................................*34,532 43,977 *13 41,322 *2,641 -- 354,583 -21,926 High withholding tax interest................................................................................*( ³ ) *4,339 -- *1,847 *2,492 -- *8,542 *-254 Financial services income................................................................................*24,857 *5,573 -- *5,388 *185 -- *8,505 *-2,409
Shipping income................................................................................-- ** -- ** -- -- ** **
Dividends from noncontrolled section 902 corp………. *5,074 *33,426 *( ³ ) *31,363 *2,062 -- *76,604 *-23,225
Dividends from an IC-DISC or former DISC ¹................................................................................-- -- -- -- -- -- -- -- Miscellaneous separately calculated limitation................................................................................-- -- -- -- -- -- -- -- Certain distributions from a FSC or former FSC ²................................................................................-- -- -- -- -- -- -- -- General limitation income................................................................................531,787 601,180 *385 560,655 *39,681 *10,551 1,741,719 219,320 Section 901(j) income................................................................................-- -- -- -- -- -- -- --
Income re-sourced by treaty................................................................................-- -- -- -- -- -- -- --
Footnotes at end of table.
Deductions--Continued

228
Corporate Foreign Tax Credit, 1998
228
Table 2.--U.S. Corporation Returns with a Foreign Tax Credit: Foreign Income and Tax Reported on Form 1118, by Industrial Division (by NAICS Classification) and Income Type--Continued[All figures are estimates based on samples--money amounts are in thousands of dollars]
Foreign income and taxes reported on Form 1118--Continued
Deductions not allocable toOther specific types of income Deductions Taxable
Industrial division and income type deductions from oil income Adjustments
allocable Research and gas (less loss) to taxable
to specific Total and Interest Other extraction before incometypes of development income
5 adjustments
income
(17) (18) (19) (20) (21) (22) (23) (24)CONSTRUCTION
All income types..............................................................................................................77,058 45,019 *415 *8,334 *23,061 -- 177,070 20,882 Passive income................................................................................*708 *41 *( ³ ) *( ³ ) *17 -- 8,623 *408 High withholding tax interest................................................................................-- *20 -- *2 *2 -- *1,634 -- Financial services income................................................................................-- -- -- -- -- -- -- -- Shipping income................................................................................-- -- -- -- -- -- -- -- Dividends from noncontrolled section 902 corp………. *58 *787 -- *756 *32 -- *2,894 *-227 Dividends from an IC-DISC or former DISC ¹................................................................................-- -- -- -- -- -- -- -- Miscellaneous separately calculated limitation................................................................................-- -- -- -- -- -- -- -- Certain distributions from a FSC or former FSC ²................................................................................-- -- -- -- -- -- -- -- General limitation income................................................................................76,292 44,171 *415 *7,576 *23,011 -- 163,918 *20,700 Section 901(j) income................................................................................-- -- -- -- -- -- -- -- Income re-sourced by treaty................................................................................-- -- -- -- -- -- -- --
MANUFACTURING All income types..............................................................................................................39,069,409 33,984,654 7,230,395 12,813,048 13,585,976 9,069,121 91,703,034 3,963,115 Passive income................................................................................378,321 1,045,650 94,891 700,771 238,937 *4 3,771,531 201,145 High withholding tax interest................................................................................27,463 73,529 *129 65,748 5,040 -- 278,297 20,692 Financial services income................................................................................2,162,523 1,729,602 6,795 1,668,795 54,011 -- 2,073,674 -11,815 Shipping income................................................................................*231,565 80,288 *932 68,692 10,663 -- 68,879 -3,047 Dividends from noncontrolled section 902 corp………. 43,929 387,699 23,451 313,586 40,358 -- 1,031,704 -154,766 Dividends from an IC-DISC or former DISC ¹................................................................................*9,387 -- -- -- -- -- *1,606 *-7 Miscellaneous separately calculated limitation................................................................................*4,547 *5,643 *142 *2,346 *3,156 -- *-516 *-7,120 Certain distributions from a FSC or former FSC ²................................................................................2,935,036 *175 -- -- *175 -- *20,208 *-116 General limitation income................................................................................33,276,338 30,647,981 7,103,893 9,979,561 13,233,261 9,069,117 84,427,578 3,921,170 Section 901(j) income................................................................................*268 *2,102 *162 *1,863 *78 -- *-1,973 *-3,011 Income re-sourced by treaty................................................................................*32 *11,984 -- *11,686 *297 -- *32,049 *-11
WHOLESALE AND RETAIL TRADE
All income types..............................................................................................................2,042,453 1,468,863 32,916 595,729 786,058 *110,976 4,855,818 565,245 Passive income................................................................................8,835 148,610 *29 81,485 56,849 -- 152,209 -25,156 High withholding tax interest................................................................................*5470 7,665 *3 *4,901 *2,705 -- 32,332 *-2,365 Financial services income................................................................................*45,173 *28,009 -- *22,626 *4,891 -- *101,614 *-7,753 Shipping income................................................................................** ** -- ** *( ³ ) -- ** ** Dividends from noncontrolled section 902 corp………. *1,680 13,201 *122 6,868 *6,136 -- 20,649 -1,904 Dividends from an IC-DISC or former DISC ¹................................................................................-- -- -- -- -- -- -- -- Miscellaneous separately calculated limitation................................................................................-- -- -- -- -- -- -- -- Certain distributions from a FSC or former FSC ²................................................................................** -- -- -- -- -- -- -- General limitation income................................................................................1,966,808 1,270,831 32,762 479,303 715,477 *110,976 4,547,594 602,446 Section 901(j) income................................................................................-- -- -- -- -- -- -- -- Income re-sourced by treaty................................................................................-- -- -- -- -- -- -- --
TRANSPORTATION AND WAREHOUSING
All income types..............................................................................................................2,279,064 239,751 *17,961 89,798 129,211 -- 1,051,003 14,909 Passive income................................................................................*254 *3,844 -- *3,443 *392 -- 10,598 *1,180 High withholding tax interest................................................................................*54 *433 -- *230 *146 -- 17,242 *-68 Financial services income................................................................................*3,332 *2,447 -- *1,307 *1,141 -- *8,399 *-102 Shipping income................................................................................*2,243,208 191,482 *7,580 *58,369 *124,116 -- 676,418 *13,726 Dividends from noncontrolled section 902 corp………. -- *3,634 *14 *3,421 *198 -- *5,850 *-2,763 Dividends from an IC-DISC or former DISC ¹................................................................................-- -- -- -- -- -- -- -- Miscellaneous separately calculated limitation................................................................................-- -- -- -- -- -- -- -- Certain distributions from a FSC or former FSC ²................................................................................-- -- -- -- -- -- -- -- General limitation income................................................................................32,215 37,911 *10,367 23,029 3,217 -- 332,495 *2,936 Section 901(j) income................................................................................-- -- -- -- -- -- -- -- Income re-sourced by treaty................................................................................-- -- -- -- -- -- -- -- Footnotes at end of table.
Deductions--Continued

229
Corporate Foreign Tax Credit, 1998
Table 2.--U.S. Corporation Returns with a Foreign Tax Credit: Foreign Income and Tax Reported on Form 1118, by Industrial Division (by NAICS Classification) and Income Type--Continued[All figures are estimates based on samples--money amounts are in thousands of dollars]
Foreign income and taxes reported on Form 1118--Continued
Deductions not allocable toOther specific types of income Deductions Taxable
Industrial division and income type deductions from oil income Adjustments
allocable Research and gas (less loss) to taxable
to specific Total and Interest Other extraction before income
types of development income 5 adjustmentsincome
(17) (18) (19) (20) (21) (22) (23) (24)
INFORMATION All income types..............................................................................................................8,835,447 7,277,711 2,140,229 997,890 4,055,860 -- 11,290,825 3,462,969 Passive income................................................................................11,666 64,743 *5,137 54,111 5,219 -- 774,401 4,441 High withholding tax interest................................................................................*42 *3,517 -- *3,464 *53 -- *4,498 -88 Financial services income................................................................................*18,478 *1,092 *91 *674 *327 -- *142 *-1,148 Shipping income................................................................................*53,454 *22,689 *1,044 *10,742 *10,903 -- *65,128 *65,126 Dividends from noncontrolled section 902 corp………. *22,577 49,610 *222 *49,105 *182 -- 499,417 *-18,175 Dividends from an IC-DISC or former DISC ¹................................................................................-- -- -- -- -- -- -- -- Miscellaneous separately calculated limitation................................................................................-- ** ** ** ** -- ** ** Certain distributions from a FSC or former FSC ²................................................................................*211,560 *245 -- -- *245 -- *28,695 *9,904 General limitation income................................................................................8,517,670 7,134,489 2,133,420 878,837 4,038,876 -- 9,890,637 3,402,884 Section 901(j) income................................................................................-- -- -- -- -- -- -- -- Income re-sourced by treaty................................................................................-- -- -- -- -- -- -- --
FINANCE, INSURANCE, AND REAL ESTATE
All income types..............................................................................................................15,439,991 18,632,680 *55,721 11,746,321 6,139,091 -- 18,729,319 1,775,390 Passive income................................................................................12,629 9,333 -- 4,935 1,510 -- 147,164 66 High withholding tax interest................................................................................91,908 190,767 *5 156,329 33,611 -- 505,753 34,533 Financial services income................................................................................14,782,261 17,720,045 *8,793 11,500,141 5,874,451 -- 17,438,749 1,677,147 Shipping income................................................................................-- ** -- ** -- -- ** ** Dividends from noncontrolled section 902 corp………. *9,549 36,802 *1 25,678 *9,043 -- 152,925 -9,375 Dividends from an IC-DISC or former DISC ¹................................................................................-- -- -- -- -- -- -- -- Miscellaneous separately calculated limitation................................................................................-- -- -- -- -- -- -- -- Certain distributions from a FSC or former FSC ²................................................................................** -- -- - -- -- -- -- General limitation income................................................................................522,431 675,663 *46,923 59,167 220,476 -- 461,856 61,124 Section 901(j) income................................................................................-- -- -- -- -- -- -- -- Income re-sourced by treaty................................................................................-- -- -- -- -- -- -- --
SERVICES
All income types..............................................................................................................17,500,670 31,019,368 319,766 22,277,952 7,568,575 -- 14,879,407 325,967 Passive income................................................................................3,484 35,000 *54 20,402 4,957 -- 283,191 6,502 High withholding tax interest................................................................................12,001 603,085 *2,107 510,236 90,093 -- 578,827 3,278 Financial services income................................................................................13,863,088 28,751,801 *182,497 21,134,901 6,682,466 -- 8,417,548 47,685 Shipping income................................................................................*89,330 *4,160 -- *137 *4,022 -- *-1,319 *-1,534 Dividends from noncontrolled section 902 corp………. *1,012 119,580 *28 80,034 24,028 -- 566,823 -35,204 Dividends from an IC-DISC or former DISC ¹................................................................................-- -- -- -- -- -- -- -- Miscellaneous separately calculated limitation................................................................................-- -- -- -- -- -- -- -- Certain distributions from a FSC or former FSC ²................................................................................*87,055 *19,616 -- *12,294 *7,322 -- *13,085 *-6,787 General limitation income................................................................................3,444,700 1,486,127 135,080 519,947 755,686 -- 5,016,068 312,027 Section 901(j) income................................................................................-- -- -- -- -- -- -- -- Income re-sourced by treaty................................................................................-- -- -- -- -- -- ** --
Footnotes at end of table.
Deductions--Continued

230
Corporate Foreign Tax Credit, 1998
230
Table 2.--U.S. Corporation Returns with a Foreign Tax Credit: Foreign Income and Tax Reported on Form 1118, by Industrial Division (by NAICS Classification) and Income Type--Continued[All figures are estimates based on samples--money amounts are in thousands of dollars]
Foreign income and taxes reported on Form 1118--Continued
Foreign taxes available for credit
Paid or accrued
Taxable
Industrial division and income type income Reduction Total paid, Taxes
(less loss) Total for certain Carryover accrued, Total withheld at
after foreign and deemed source on
adjustments taxes paid dividends
(25) (26) (27) (28) (29) (30) (31)
ALL INDUSTRIES
All income types..............................................................................................................136,635,990 47,575,987 2,476,970 9,368,659 40,684,298 13,608,822 2,193,964
Passive income................................................................................5,398,410 674,146 -- 43,399 630,747 209,959 60,020
High withholding tax interest................................................................................1,405,386 423,071 -- 85,551 337,520 289,842 8,170 Financial services income................................................................................26,347,026 6,015,291 -- 225,381 5,789,909 3,634,347 236,024 Shipping income................................................................................747,254 134,982 -- *9,389 125,593 84,388 *2,120 Dividends from noncontrolled section 902 corp………. 2,639,419 1,514,762 *17 509,415 1,005,365 66,645 65,781 Dividends from an IC-DISC or former DISC ¹................................................................................*1,613 -- -- -- -- -- --
Miscellaneous separately calculated limitation................................................................................*34,487 -- *1,121 -- *1,121 -- --
Certain distributions from a FSC or former FSC ²................................................................................*58,986 *90 -- -- *90 -- --
General limitation income................................................................................99,964,827 38,804,728 2,475,831 8,495,176 32,785,383 9,322,498 1,821,761 Section 901(j) income................................................................................*1,339 -- -- -- -- -- -- Income re-sourced by treaty................................................................................*37,244 *8,918 -- *349 *8,569 *1,143 *89
AGRICULTURE, FORESTRY,
FISHING, AND HUNTING All income types..............................................................................................................166,049 63,034 -- *2,694 60,340 16,414 1,798
Passive income................................................................................5,263 204 -- -- 204 *145 *8
High withholding tax interest................................................................................-- -- -- -- -- -- --
Financial services income................................................................................-- -- -- -- -- -- -- Shipping income................................................................................-- -- -- -- -- -- -- Dividends from noncontrolled section 902 corp………. *982 *1,826 -- *1,418 *408 *77 *77 Dividends from an IC-DISC or former DISC ¹................................................................................-- -- -- -- -- -- -- Miscellaneous separately calculated limitation................................................................................-- -- -- -- -- -- --
Certain distributions from a FSC or former FSC ²................................................................................-- -- -- -- -- -- --
General limitation income................................................................................*159,805 *61,004 -- *1,275 *59,729 *16,191 *1,712
Section 901(j) income................................................................................-- -- -- -- -- -- -- Income re-sourced by treaty................................................................................-- -- -- -- -- -- --
MINING
All income types..............................................................................................................1,893,492 1,022,018 *320,756 578,481 764,294 646,320 12,727 Passive income................................................................................57,509 3,831 -- *241 3,590 1,467 *108
High withholding tax interest................................................................................*33,985 *9,712 -- *3,517 *6,195 *4,109 --
Financial services income................................................................................-- -- -- -- -- -- --
Shipping income................................................................................-- -- -- -- -- -- --
Dividends from noncontrolled section 902 corp………. *35,933 *28,224 -- *11,688 *16,537 *260 *260 Dividends from an IC-DISC or former DISC ¹................................................................................-- -- -- -- -- -- -- Miscellaneous separately calculated limitation................................................................................-- -- -- -- -- -- -- Certain distributions from a FSC or former FSC ²................................................................................-- -- -- -- -- -- -- General limitation income................................................................................1,765,764 980,251 *320,756 563,036 737,972 640,484 12,359
Section 901(j) income................................................................................** -- -- -- -- -- --
Income re-sourced by treaty................................................................................-- -- -- -- -- -- --
UTILITIES
All income types..............................................................................................................2,018,449 846,283 *2,214 46,850 801,647 165,499 51,114 Passive income................................................................................376,509 52,243 -- *1,950 50,293 47,730 *842 High withholding tax interest................................................................................*8,797 *2,186 -- *45 *2,141 *2,141 -- Financial services income................................................................................*10,914 *1,863 -- *519 *1,344 *1,145 *132
Shipping income................................................................................-- -- -- -- -- -- --
Dividends from noncontrolled section 902 corp………. *99,829 *29,545 -- *7,930 *21,616 *1,659 *1,659
Dividends from an IC-DISC or former DISC ¹................................................................................-- -- -- -- -- -- -- Miscellaneous separately calculated limitation................................................................................-- -- -- -- -- -- -- Certain distributions from a FSC or former FSC ²................................................................................-- -- -- -- -- -- -- General limitation income................................................................................1,522,399 760,445 *2,214 *36,406 726,253 112,824 *48,481 Section 901(j) income................................................................................-- -- -- -- -- -- --
Income re-sourced by treaty................................................................................-- -- -- -- -- -- --
Footnotes at end of table.

231
Corporate Foreign Tax Credit, 1998
Table 2.--U.S. Corporation Returns with a Foreign Tax Credit: Foreign Income and Tax Reported on Form 1118, by Industrial Division (by NAICS Classification) and Income Type--Continued[All figures are estimates based on samples--money amounts are in thousands of dollars]
Foreign income and taxes reported on Form 1118--ContinuedForeign taxes available for credit
Paid or accruedTaxable
Industrial division and income type income Reduction Total paid, Taxes
(less loss) Total for certain Carryover accrued, Total withheld at
after foreign and deemed source on
adjustments taxes paid dividends
(25) (26) (27) (28) (29) (30) (31)CONSTRUCTION
All income types..............................................................................................................156,188 67,637 -- 10,919 56,718 25,220 651 Passive income................................................................................8,215 393 -- *17 376 376 51 High withholding tax interest................................................................................*1,634 *167 -- -- *167 *167 -- Financial services income................................................................................-- -- -- -- -- -- -- Shipping income................................................................................-- -- -- -- -- -- -- Dividends from noncontrolled section 902 corp………. *3,120 *1,061 -- *145 *915 *32 *(³) Dividends from an IC-DISC or former DISC ¹................................................................................-- -- -- -- -- -- -- Miscellaneous separately calculated limitation................................................................................-- -- -- -- -- -- -- Certain distributions from a FSC or former FSC ²................................................................................-- -- -- -- -- -- -- General limitation income................................................................................143,218 66,017 -- 10,757 55,260 24,644 599 Section 901(j) income................................................................................-- -- -- -- -- -- -- Income re-sourced by treaty................................................................................-- -- -- -- -- -- --
MANUFACTURING All income types..............................................................................................................87,739,919 33,251,300 2,151,029 7,255,155 28,147,174 7,011,736 1,651,031 Passive income................................................................................3,570,386 422,271 -- 22,382 399,889 91,977 37,891 High withholding tax interest................................................................................257,605 55,704 -- 12,249 43,455 40,334 *304 Financial services income................................................................................2,085,489 856,248 -- *58,579 797,669 458,562 *51,808 Shipping income................................................................................71,925 *15,911 -- *8,402 *7,509 *1,184 *592 Dividends from noncontrolled section 902 corp………. 1,186,469 845,136 *17 310,253 534,900 31,314 30,553 Dividends from an IC-DISC or former DISC ¹................................................................................*1,613 -- -- -- -- -- -- Miscellaneous separately calculated limitation................................................................................*6,604 -- *1,121 -- *1,121 -- -- Certain distributions from a FSC or former FSC ²................................................................................*20,323 *90 -- -- *90 -- -- General limitation income................................................................................80,506,408 31,048,077 2,149,890 6,842,940 26,355,026 6,388,275 1,529,795 Section 901(j) income................................................................................*1,038 -- -- -- -- -- -- Income re-sourced by treaty................................................................................*32,059 *7,864 -- *349 *7,515 *89 *89
WHOLESALE AND RETAIL TRADE
All income types..............................................................................................................4,290,573 1,554,476 *137 361,988 1,192,625 445,015 102,024 Passive income................................................................................177,365 33,104 -- 5,462 27,642 16,676 7,370 High withholding tax interest................................................................................34,698 8,675 -- *597 8,078 4,636 -- Financial services income................................................................................*109,367 *21,606 -- *170 *21,436 *13,814 *2,422 Shipping income................................................................................** ** -- -- ** ** ** Dividends from noncontrolled section 902 corp………. 22,554 20,951 -- 9,129 11,823 1,765 1,765 Dividends from an IC-DISC or former DISC ¹................................................................................-- -- -- -- -- -- -- Miscellaneous separately calculated limitation................................................................................-- -- -- -- -- -- -- Certain distributions from a FSC or former FSC ²................................................................................-- -- -- -- -- -- -- General limitation income................................................................................3,945,148 1,469,126 *137 346,630 1,122,633 407,495 89,838 Section 901(j) income................................................................................-- -- -- -- -- -- -- Income re-sourced by treaty................................................................................-- -- -- -- -- -- --
TRANSPORTATION AND WAREHOUSING
All income types..............................................................................................................1,036,094 188,793 -- 13,159 175,634 111,160 3,926 Passive income................................................................................9,418 1,247 -- *264 983 295 *59 High withholding tax interest................................................................................17,311 1,864 -- *23 1,841 1,841 -- Financial services income................................................................................*8,501 *1,273 -- *316 *957 *957 *957 Shipping income................................................................................662,692 117,920 -- *987 116,933 *82,575 *899 Dividends from noncontrolled section 902 corp………. *8,613 *4,164 -- *1,759 *2,404 *762 *762 Dividends from an IC-DISC or former DISC ¹................................................................................-- -- -- -- -- -- -- Miscellaneous separately calculated limitation................................................................................-- -- -- -- -- -- -- Certain distributions from a FSC or former FSC ²................................................................................-- -- -- -- -- -- -- General limitation income................................................................................329,559 62,326 -- 9,811 52,516 24,730 1,250 Section 901(j) income................................................................................-- -- -- -- -- -- -- Income re-sourced by treaty................................................................................-- -- -- -- -- -- -- Footnotes at end of table.

232
Corporate Foreign Tax Credit, 1998
232
Table 2.--U.S. Corporation Returns with a Foreign Tax Credit: Foreign Income and Tax Reported on Form 1118, by Industrial Division (by NAICS Classification) and Income Type--Continued[All figures are estimates based on samples--money amounts are in thousands of dollars]
Foreign income and taxes reported on Form 1118--ContinuedForeign taxes available for credit
Paid or accruedTaxable
Industrial division and income type income Reduction Total paid, Taxes
(less loss) Total for certain Carryover accrued, Total withheld at
after foreign and deemed source on
adjustments taxes paid dividends
(25) (26) (27) (28) (29) (30) (31)
INFORMATION All income types..............................................................................................................7,827,856 2,768,786 *508 307,774 2,461,519 1,186,527 99,077 Passive income................................................................................769,959 74,855 -- *806 74,050 29,096 4,388 High withholding tax interest................................................................................*4,587 *773 -- *9 *765 *765 -- Financial services income................................................................................*1,290 *2 -- -- *2 *2 *2 Shipping income................................................................................*1 -- -- -- -- -- -- Dividends from noncontrolled section 902 corp………. 517,591 178,627 -- *38,097 140,530 *18,527 *18,527 Dividends from an IC-DISC or former DISC ¹................................................................................-- -- -- -- -- -- -- Miscellaneous separately calculated limitation................................................................................** -- -- -- -- -- -- Certain distributions from a FSC or former FSC ²................................................................................*18,791 -- -- -- -- -- -- General limitation income................................................................................6,487,753 2,514,528 *508 268,863 2,246,172 1,138,137 76,159 Section 901(j) income................................................................................-- -- -- -- -- -- -- Income re-sourced by treaty................................................................................-- -- -- -- -- -- --
FINANCE, INSURANCE, AND REAL ESTATE
All income types..............................................................................................................16,953,929 3,343,076 -- 241,484 3,101,592 1,730,942 131,904 Passive income................................................................................147,098 23,276 -- 5,230 18,046 12,246 7,774 High withholding tax interest................................................................................471,221 107,988 -- 9,740 98,247 88,762 *124 Financial services income................................................................................15,761,602 2,983,244 -- 141,425 2,841,819 1,580,934 118,476 Shipping income................................................................................** ** -- -- ** -- -- Dividends from noncontrolled section 902 corp………. 162,299 112,374 -- 58,977 53,397 1,863 1,793 Dividends from an IC-DISC or former DISC ¹................................................................................-- -- -- -- -- -- -- Miscellaneous separately calculated limitation................................................................................-- -- -- -- -- -- -- Certain distributions from a FSC or former FSC ²................................................................................-- -- -- -- -- -- -- General limitation income................................................................................400,732 116,174 -- 26,111 90,062 47,137 3,737 Section 901(j) income................................................................................-- -- -- -- -- -- -- Income re-sourced by treaty................................................................................-- -- -- -- -- -- --
SERVICES
All income types..............................................................................................................14,553,440 4,470,585 *2,326 550,156 3,922,755 2,269,990 139,713 Passive income................................................................................276,688 62,723 -- 7,047 55,676 9,950 1,529 High withholding tax interest................................................................................575,549 236,002 -- 59,371 176,630 147,087 *7,741 Financial services income................................................................................8,369,863 2,151,054 -- *24,373 2,126,681 1,578,934 62,227 Shipping income................................................................................*215 *117 -- -- *117 -- -- Dividends from noncontrolled section 902 corp………. 602,028 292,854 -- 70,019 222,835 10,385 10,385 Dividends from an IC-DISC or former DISC ¹................................................................................-- -- -- -- -- -- -- Miscellaneous separately calculated limitation................................................................................-- -- -- -- -- -- -- Certain distributions from a FSC or former FSC ²................................................................................*19,871 -- -- -- -- -- -- General limitation income................................................................................4,704,042 1,726,781 *2,326 389,346 1,339,762 522,581 57,831 Section 901(j) income................................................................................-- -- -- -- -- -- -- Income re-sourced by treaty................................................................................** ** -- -- ** ** --
Footnotes at end of table.

233
Corporate Foreign Tax Credit, 1998
Table 2.--U.S. Corporation Returns with a Foreign Tax Credit: Foreign Income and Tax Reported on Form 1118, by Industrial Division (by NAICS Classification) and Income Type--Continued[All figures are estimates based on samples--money amounts are in thousands of dollars]
Foreign income and taxes reported on Form 1118--Continued
Foreign taxes available for credit--Continued
Paid or accrued--Continued
Other taxes paid or accrued on--
Industrial division and income type Specifically Taxes
Rents, allocable deemed
Interest royalties, Branch income Service Other paid
and license income [section income income
fees 863(b)]
(32) (33) (34) (35) (36) (37) (38)
ALL INDUSTRIES
All income types..............................................................................................................784,126 2,213,430 4,861,563 8,524 387,240 3,159,976 27,075,476
Passive income................................................................................31,672 25,052 5,805 *69 *463 86,878 420,788
High withholding tax interest................................................................................281,672 -- -- -- -- -- 47,678 Financial services income................................................................................338,852 17,739 1,925,241 *64 48,015 1,068,411 2,155,563 Shipping income................................................................................*1,657 *2,574 *15,701 -- *61,735 *601 41,205 Dividends from noncontrolled section 902 corp………. *7 *358 *53 *(³) -- 446 938,720 Dividends from an IC-DISC or former DISC ¹................................................................................-- -- -- -- -- -- --
Miscellaneous separately calculated limitation................................................................................-- -- -- -- -- -- *1,121
Certain distributions from a FSC or former FSC ²................................................................................-- -- -- -- -- -- *90
General limitation income................................................................................130,265 2,167,707 2,914,763 8,391 *277,026 2,002,585 23,462,885 Section 901(j) income................................................................................-- -- -- -- -- -- -- Income re-sourced by treaty................................................................................-- -- -- -- -- *1,054 *7,426
AGRICULTURE, FORESTRY,
FISHING, AND HUNTING All income types..............................................................................................................*965 *3,047 *8,276 -- *21 *2,307 *43,927
Passive income................................................................................*1 *134 -- -- -- *3 *59
High withholding tax interest................................................................................-- -- -- -- -- -- --
Financial services income................................................................................-- -- -- -- -- -- -- Shipping income................................................................................-- -- -- -- -- -- -- Dividends from noncontrolled section 902 corp………. -- -- -- -- -- -- *330 Dividends from an IC-DISC or former DISC ¹................................................................................-- -- -- -- -- -- -- Miscellaneous separately calculated limitation................................................................................-- -- -- -- -- -- --
Certain distributions from a FSC or former FSC ²................................................................................-- -- -- -- -- -- --
General limitation income................................................................................*964 *2,913 *8,276 -- *21 *2,304 *43,538
Section 901(j) income................................................................................-- -- -- -- -- -- -- Income re-sourced by treaty................................................................................-- -- -- -- -- -- --
MINING
All income types..............................................................................................................10,429 15,307 256,348 -- 25,385 326,124 117,974 Passive income................................................................................*601 -- *46 -- -- *712 *2,123
High withholding tax interest................................................................................*4,109 -- -- -- -- -- *2,087
Financial services income................................................................................-- -- -- -- -- -- --
Shipping income................................................................................-- -- -- -- -- -- --
Dividends from noncontrolled section 902 corp………. -- -- -- -- -- -- *16,277 Dividends from an IC-DISC or former DISC ¹................................................................................-- -- -- -- -- -- -- Miscellaneous separately calculated limitation................................................................................-- -- -- -- -- -- -- Certain distributions from a FSC or former FSC ²................................................................................-- -- -- -- -- -- -- General limitation income................................................................................5,719 15,307 256,301 -- 25,385 325,412 97,488
Section 901(j) income................................................................................-- -- -- -- -- -- --
Income re-sourced by treaty................................................................................-- -- -- -- -- -- --
UTILITIES
All income types..............................................................................................................13,358 -- *2,967 -- *2,521 *95,539 636,148 Passive income................................................................................*84 -- -- -- -- *46,804 2,563 High withholding tax interest................................................................................*2,141 -- -- -- -- -- -- Financial services income................................................................................-- -- *1,013 -- -- -- *200
Shipping income................................................................................-- -- -- -- -- -- --
Dividends from noncontrolled section 902 corp………. -- -- -- -- -- -- *19,957
Dividends from an IC-DISC or former DISC ¹................................................................................-- -- -- -- -- -- -- Miscellaneous separately calculated limitation................................................................................-- -- -- -- -- -- -- Certain distributions from a FSC or former FSC ²................................................................................-- -- -- -- -- -- -- General limitation income................................................................................*11,132 -- *1,955 -- *2,521 *48,735 613,429 Section 901(j) income................................................................................-- -- -- -- -- -- --
Income re-sourced by treaty................................................................................-- -- -- -- -- -- --
Footnotes at end of table.
Taxes withheld at source on--

234
Corporate Foreign Tax Credit, 1998
234
Table 2.--U.S. Corporation Returns with a Foreign Tax Credit: Foreign Income and Tax Reported on Form 1118, by Industrial Division (by NAICS Classification) and Income Type--Continued[All figures are estimates based on samples--money amounts are in thousands of dollars]
Foreign income and taxes reported on Form 1118--ContinuedForeign taxes available for credit--Continued
Paid or accrued--ContinuedOther taxes paid or accrued on--
Industrial division and income type Specifically Taxes
Rents, allocable deemed
Interest royalties, Branch income Service Other paid
and license income [section income incomefees 863(b)]
(32) (33) (34) (35) (36) (37) (38)
CONSTRUCTION All income types..............................................................................................................*553 1,240 *3,023 -- 8,328 11,426 *31,498 Passive income................................................................................*119 *39 -- -- -- *166 -- High withholding tax interest................................................................................*167 -- -- -- -- -- -- Financial services income................................................................................-- -- -- -- -- -- -- Shipping income................................................................................-- -- -- -- -- -- -- Dividends from noncontrolled section 902 corp………. -- -- -- -- -- *32 *883 Dividends from an IC-DISC or former DISC ¹................................................................................-- -- -- -- -- -- -- Miscellaneous separately calculated limitation................................................................................-- -- -- -- -- -- -- Certain distributions from a FSC or former FSC ²................................................................................-- -- -- -- -- -- -- General limitation income................................................................................*266 *1,201 *3,023 -- 8,328 11,228 *30,615 Section 901(j) income................................................................................-- -- -- -- -- -- -- Income re-sourced by treaty................................................................................-- -- -- -- -- -- --
MANUFACTURING
All income types..............................................................................................................153,943 1,408,089 1,877,298 2,726 118,969 1,799,680 21,135,438 Passive income................................................................................18,177 11,298 4,247 *69 *322 19,975 307,912 High withholding tax interest................................................................................40,030 -- -- -- -- -- *3,120 Financial services income................................................................................*1,192 *858 *24,961 -- *4,692 *375,051 339,107 Shipping income................................................................................*126 -- *32 -- -- *435 *6,325 Dividends from noncontrolled section 902 corp………. *7 *310 *53 -- -- *392 503,585 Dividends from an IC-DISC or former DISC ¹................................................................................-- -- -- -- -- -- -- Miscellaneous separately calculated limitation................................................................................-- -- -- -- -- -- *1,121 Certain distributions from a FSC or former FSC ²................................................................................-- -- -- -- -- -- *90 General limitation income................................................................................94,411 1,395,624 1,848,005 2,657 113,955 1,403,827 19,966,751 Section 901(j) income................................................................................-- -- -- -- -- -- -- Income re-sourced by treaty................................................................................-- -- -- -- -- -- *7,426
WHOLESALE AND RETAIL TRADE All income types..............................................................................................................15,176 80,222 199,476 *259 8,526 39,332 747,611 Passive income................................................................................2,922 5,645 *103 -- -- 636 10,966 High withholding tax interest................................................................................4,636 -- -- -- -- -- *3,443 Financial services income................................................................................*2,003 -- *1,553 -- -- *7,835 *7,623 Shipping income................................................................................-- -- -- -- -- -- ** Dividends from noncontrolled section 902 corp………. -- -- -- *(³) -- -- 10,057 Dividends from an IC-DISC or former DISC ¹................................................................................-- -- -- -- -- -- -- Miscellaneous separately calculated limitation................................................................................-- -- -- -- -- -- -- Certain distributions from a FSC or former FSC ²................................................................................-- -- -- -- -- -- -- General limitation income................................................................................5,616 74,577 197,820 *259 8,526 30,860 715,138 Section 901(j) income................................................................................-- -- -- -- -- -- -- Income re-sourced by treaty................................................................................-- -- -- -- -- -- --
TRANSPORTATION AND WAREHOUSING
All income types..............................................................................................................3,827 *3,173 27,677 *590 70,671 *1,294 64,475 Passive income................................................................................*220 *9 -- -- -- *7 *688 High withholding tax interest................................................................................1,841 -- -- -- -- -- -- Financial services income................................................................................-- -- -- -- -- -- -- Shipping income................................................................................*1,531 *2,574 *15,669 -- *61,735 *166 *34,358 Dividends from noncontrolled section 902 corp………. -- -- -- -- -- -- *1,642 Dividends from an IC-DISC or former DISC ¹................................................................................-- -- -- -- -- -- -- Miscellaneous separately calculated limitation................................................................................-- -- -- -- -- -- -- Certain distributions from a FSC or former FSC ²................................................................................-- -- -- -- -- -- -- General limitation income................................................................................*235 *590 *12,008 *590 8,936 *1,121 27,786 Section 901(j) income................................................................................-- -- -- -- -- -- -- Income re-sourced by treaty................................................................................-- -- -- -- -- -- -- Footnotes at end of table.
Taxes withheld at source on--

235
Corporate Foreign Tax Credit, 1998
Table 2.--U.S. Corporation Returns with a Foreign Tax Credit: Foreign Income and Tax Reported on Form 1118, by Industrial Division (by NAICS Classification) and Income Type--Continued[All figures are estimates based on samples--money amounts are in thousands of dollars]
Foreign income and taxes reported on Form 1118--ContinuedForeign taxes available for credit--Continued
Paid or accrued--ContinuedOther taxes paid or accrued on--
Industrial division and income type Specifically Taxes
Rents, allocable deemed
Interest royalties, Branch income Service Other paid
and license income [section income incomefees 863(b)]
(32) (33) (34) (35) (36) (37) (38)
INFORMATION All income types..............................................................................................................8,481 566,532 333,290 *2,161 22,774 154,212 1,274,993 Passive income................................................................................6,106 4,262 *41 -- -- 14,297 44,954 High withholding tax interest................................................................................*765 -- -- -- -- -- -- Financial services income................................................................................-- -- -- -- -- -- -- Shipping income................................................................................-- -- -- -- -- -- -- Dividends from noncontrolled section 902 corp………. -- -- -- -- -- -- 122,003 Dividends from an IC-DISC or former DISC ¹................................................................................-- -- -- -- -- -- -- Miscellaneous separately calculated limitation................................................................................-- -- -- -- -- -- -- Certain distributions from a FSC or former FSC ²................................................................................-- -- -- -- -- -- -- General limitation income................................................................................1,610 562,270 333,249 *2,161 22,774 139,915 1,108,036 Section 901(j) income................................................................................-- -- -- -- -- -- -- Income re-sourced by treaty................................................................................-- -- -- -- -- -- --
FINANCE, INSURANCE, AND REAL ESTATE
All income types..............................................................................................................362,150 21,930 661,282 *64 43,908 509,705 1,370,650 Passive income................................................................................934 845 *104 -- -- 2,590 5,800 High withholding tax interest................................................................................88,638 -- -- -- -- -- *9,485 Financial services income................................................................................272,190 13,324 638,868 *64 36,523 501,488 1,260,885 Shipping income................................................................................-- -- -- -- -- -- ** Dividends from noncontrolled section 902 corp………. -- *49 -- -- -- *21 51,534 Dividends from an IC-DISC or former DISC ¹................................................................................-- -- -- -- -- -- -- Miscellaneous separately calculated limitation................................................................................-- -- -- -- -- -- -- Certain distributions from a FSC or former FSC ²................................................................................-- -- -- -- -- -- -- General limitation income................................................................................388 7,712 22,310 -- 7,385 5,606 42,925 Section 901(j) income................................................................................-- -- -- -- -- -- -- Income re-sourced by treaty................................................................................-- -- -- -- -- -- --
SERVICES
All income types..............................................................................................................215,244 113,889 1,491,927 *2,724 86,138 220,357 1,652,764 Passive income................................................................................2,508 2,820 *1,264 -- *142 1,688 45,725 High withholding tax interest................................................................................139,346 -- -- -- -- -- *29,543 Financial services income................................................................................63,468 *3,557 1,258,846 -- *6,800 184,037 547,748 Shipping income................................................................................-- -- -- -- -- -- *117 Dividends from noncontrolled section 902 corp………. -- -- -- -- -- -- 212,450 Dividends from an IC-DISC or former DISC ¹................................................................................-- -- -- -- -- -- -- Miscellaneous separately calculated limitation................................................................................-- -- -- -- -- -- -- Certain distributions from a FSC or former FSC ²................................................................................-- -- -- -- -- -- -- General limitation income................................................................................9,922 107,513 231,817 *2,724 79,196 33,578 817,181 Section 901(j) income................................................................................-- -- -- -- -- -- -- Income re-sourced by treaty................................................................................-- -- -- -- -- ** --
* Data should be used with caution because of the small number of returns on which they were based. ** Not shown to avoid disclosure of information about specific taxpayers. However, the data are included in the appropriate totals. ¹ Interest-Charge Domestic International Sales Corporation (IC-DISC) and Domestic International Sales Corporation (DISC). ² Foreign Sales Corporation (FSC). ³ Less than $500. Included in gross income (less loss), columns 2-8. Included in deductions, columns 12-21. NOTE: Detail may not add to totals because of rounding.
Taxes withheld at source on--
4
5

236
Corporate Foreign Tax Credit, 1998
236
Table 3.--U.S. Corporation Returns with a Foreign Tax Credit: Foreign Income and Tax Reportedon Form 1118, by Selected Country to Which Foreign Tax Was Paid[All figures are estimates based on samples--money amounts are in thousands of dollars]
Foreign income and taxes reported on Form 1118
Gross income (less loss)
Foreign
Selected country Number of dividend income Rents,returns Total Dividends resulting from Interest royalties,
foreign taxes anddeemed paid license fees
(gross-up)
(1) (2) (3) (4) (5) (6)
All countries.....................................................................................................................5,927 349,386,789 60,541,096 27,074,099 68,413,782 55,875,295
Canada.....................................................................................................................1,779 23,852,124 5,563,762 3,716,981 4,048,835 2,932,801
Latin America, total.....................................................................................................................1,301 40,563,434 7,249,626 1,933,814 11,644,780 3,672,998 Mexico......................................................................................................... 869 10,793,027 2,043,470 764,394 2,652,695 1,127,290 Central America, total.........................................................................................................283 1,943,735 536,679 93,634 372,342 194,956 Belize..................................................................................................... 30 27,369 *877 *14 *6,507 *37 Costa Rica.....................................................................................................137 264,983 18,586 4,925 17,137 36,745 El Salvador.....................................................................................................107 170,816 9,499 *3,065 34,105 7,876 Guatemala.....................................................................................................145 350,406 27,817 9,065 57,670 52,719 Honduras.....................................................................................................84 87,192 6,869 *3,537 15,080 4,547 Nicaragua.....................................................................................................48 43,078 *10,500 *2,945 *1,560 1,453 Panama.....................................................................................................183 968,766 462,524 70,080 240,184 66,000 Central America not allocable.....................................................................................................4 *31,124 *6 *3 *99 *25,580 Caribbean countries, total.........................................................................................................359 4,214,736 1,270,381 114,350 1,250,479 219,475 Cayman Islands (British).....................................................................................................170 2,467,956 1,003,097 76,754 1,128,471 164,728 Dominican Republic.....................................................................................................149 314,076 74,920 *21,561 63,586 20,511 Haiti..................................................................................................... 35 67,385 *5,009 *802 *7,852 *933 Jamaica.....................................................................................................104 128,487 *3,612 *4,178 27,613 11,124 Trinidad and Tobago.....................................................................................................113 677,767 32,586 *4,922 15,229 8,477 Other Caribbean countries.....................................................................................................112 559,065 151,158 6,133 7,729 13,701 South America, total.........................................................................................................870 21,161,837 3,399,096 961,436 7,064,825 1,937,088 Argentina.....................................................................................................486 6,223,558 549,970 217,638 2,599,215 380,608 Bolivia..................................................................................................... 95 154,741 *7,774 *2,646 56,590 7,473 Brazil..................................................................................................... 550 7,893,023 1,964,595 503,993 2,566,876 933,427 Chile..................................................................................................... 314 2,313,341 279,024 36,093 766,458 152,889 Colombia.....................................................................................................310 1,555,551 149,914 69,917 222,553 147,361 Ecuador.....................................................................................................177 197,293 19,105 4,846 75,746 21,386 Paraguay.....................................................................................................57 79,288 *198 *21 *52,996 6,429 Peru..................................................................................................... 243 607,446 18,010 14,586 134,352 50,643 Uruguay.....................................................................................................114 306,142 27,534 7,218 123,102 27,229 Venezuela.....................................................................................................350 1,759,462 382,943 104,477 462,148 207,291 Other South America.....................................................................................................43 71,992 *28 -- *4,789 2,352 Latin America not allocable.........................................................................................................22 2,450,100 -- -- *304,439 *194,189
Other Western Hemisphere, total.....................................................................................................................339 6,872,801 2,230,644 172,249 2,347,205 70,316 Bahamas.........................................................................................................97 1,350,512 146,571 12,187 1,146,217 6,743 Bermuda.........................................................................................................210 3,429,865 1,688,179 120,948 1,057,733 6,330 Netherlands Antilles.........................................................................................................81 377,520 132,943 18,099 49,157 39,694 Other British West Indies.........................................................................................................119 462,459 261,329 19,863 65,887 11,387 All other Western Hemisphere.........................................................................................................62 1,252,446 *1,622 *1,152 28,211 6,163
Europe, total.....................................................................................................................2,419 141,323,557 31,533,478 15,573,111 25,187,378 24,707,447 European Union, total.........................................................................................................2,355 128,330,371 28,935,936 14,698,942 22,679,937 22,269,270 Austria..................................................................................................... 241 893,866 210,834 85,553 80,435 304,788 Belgium.....................................................................................................365 5,827,425 932,290 314,391 813,332 836,596 Denmark.....................................................................................................277 1,074,194 241,430 96,710 77,058 295,950 Finland.....................................................................................................243 867,691 90,427 38,605 82,118 272,775 France.....................................................................................................597 9,476,174 1,530,680 821,145 788,762 2,640,491 Germany.....................................................................................................709 19,583,288 5,446,733 2,878,564 987,875 3,741,322 Greece.....................................................................................................179 893,030 40,038 24,860 363,852 238,180 Ireland.....................................................................................................303 5,414,442 1,186,665 175,897 247,889 3,378,872 Italy..................................................................................................... 542 6,673,809 1,439,785 1,552,213 754,918 1,355,190 Luxembourg.....................................................................................................96 1,579,950 569,079 874,653 50,207 72,170 Footnotes at end of table.

237
Corporate Foreign Tax Credit, 1998
Table 3.--U.S. Corporation Returns with a Foreign Tax Credit: Foreign Income and Tax Reportedon Form 1118, by Selected Country to Which Foreign Tax Was Paid--Continued[All figures are estimates based on samples--money amounts are in thousands of dollars]
Foreign income and taxes reported on Form 1118
Gross income (less loss)
Foreign
Selected country Number of dividend income Rents,returns Total Dividends resulting from Interest royalties,
foreign taxes anddeemed paid license fees
(gross-up)
(1) (2) (3) (4) (5) (6)
Europe--continued European Union--continued Netherlands.....................................................................................................893 12,822,873 5,014,783 2,331,361 537,585 2,641,845 Portugal.....................................................................................................201 555,898 143,838 55,281 43,034 152,001 Spain..................................................................................................... 535 3,493,856 1,032,472 431,233 247,933 1,144,001 Sweden.....................................................................................................353 2,349,243 787,195 409,481 227,791 431,364 United Kingdom.....................................................................................................1,363 56,793,961 10,269,687 4,608,994 17,377,147 4,763,310 European Union, not allocable.....................................................................................................4 *30,671 -- -- -- *414
Other West European countries, total.........................................................................................................576 9,052,279 2,333,071 774,312 2,006,093 1,333,160 Liechtenstein.....................................................................................................11 *17,592 *13,305 *301 *742 *88 Monaco.....................................................................................................18 29,601 *14,333 *10 *979 *187 Norway.....................................................................................................227 1,913,815 170,334 107,435 209,868 191,755 Switzerland.....................................................................................................476 5,201,099 2,051,281 628,593 354,587 963,768 Turkey..................................................................................................... 177 1,828,052 83,184 37,500 1,430,805 166,267 Other West European countries.....................................................................................................67 61,412 *635 *473 8,452 11,048 West European countries not allocable.....................................................................................................** ** -- -- ** ** East European countries, total.........................................................................................................381 3,065,052 263,739 99,833 494,932 985,211 Romania.....................................................................................................65 88,349 *1,659 *364 19,749 22,994 Former Soviet Union.....................................................................................................244 893,109 94,229 22,183 330,589 125,921 Other East European countries.....................................................................................................280 2,083,593 167,852 77,286 144,593 836,296 Europe not allocable.........................................................................................................31 875,856 *732 *23 *6,417 119,807
Africa, total.....................................................................................................................499 4,589,999 484,965 185,125 436,941 517,459
North Africa, total.........................................................................................................174 1,166,415 62,589 20,813 133,714 86,535 Algeria..................................................................................................... 30 89,077 *10,632 *10,553 *3,081 *1,501 Egypt..................................................................................................... 138 965,657 45,438 7,226 91,619 78,442 Libya..................................................................................................... 5 *473 -- -- -- -- Morocco.....................................................................................................65 47,401 *728 *356 11,159 6,125 Other North Africa.....................................................................................................43 63,808 *5,792 *2,677 27,855 *467
East Africa, total.........................................................................................................111 227,485 24,914 8,672 35,847 30,802
Ethiopia..................................................................................................... 18 41,645 -- -- *1,437 *2,662 Kenya..................................................................................................... 60 91,689 *5,000 *2,496 29,042 7,941 Tanzania.....................................................................................................17 1,066 -- -- -- *334 Uganda..................................................................................................... 15 3,152 *1,317 *657 *6 *213 Other East Africa.....................................................................................................76 89,933 18,596 *5,519 5,363 19,652
West and Central Africa, total.........................................................................................................157 2,155,415 299,923 78,588 68,597 87,119
Gabon..................................................................................................... 44 27,624 *15,240 *1,454 *3,495 *-122 Ghana..................................................................................................... 27 90,706 *28,028 *13,618 *384 *112 Liberia..................................................................................................... 33 130,031 86,140 *2,024 27,428 -- Nigeria..................................................................................................... 66 1,075,925 163,215 58,794 9,679 62,502 Zaire..................................................................................................... 10 *-67,869 *502 *126 *508 *759 Other West and Central Africa.....................................................................................................81 898,999 *6,799 *2,573 27,103 23,869
Southern Africa, total.........................................................................................................352 1,038,945 97,539 77,053 197,396 312,932 Malawi..................................................................................................... 10 *4,233 *1,917 *1,269 -- *99 Zimbabwe.....................................................................................................48 25,528 9,855 9,952 *226 2,807 South Africa (including Namibia).....................................................................................................342 956,674 83,212 64,083 195,962 271,589 Zambia..................................................................................................... 22 10,764 *840 *1,123 *102 *1,129 Other Southern Africa.....................................................................................................17 41,747 *1,715 *626 *1,105 *37,307 Africa not allocable.........................................................................................................8 *1,739 -- -- *1,386 *70
Footnotes at end of table.

238
Corporate Foreign Tax Credit, 1998
238
Table 3.--U.S. Corporation Returns with a Foreign Tax Credit: Foreign Income and Tax Reportedon Form 1118, by Selected Country to Which Foreign Tax Was Paid--Continued[All figures are estimates based on samples--money amounts are in thousands of dollars]
Foreign income and taxes reported on Form 1118
Gross income (less loss)
Foreign
Number of dividend income Rents,Selected country returns Total Dividends resulting from Interest royalties,
foreign taxes anddeemed paid license fees
(gross-up)
(1) (2) (3) (4) (5) (6)
Asia, total.....................................................................................................................1,649 67,986,812 5,895,283 3,778,228 12,534,280 15,768,639 Middle East, total.........................................................................................................426 4,746,724 271,829 87,976 646,134 539,311 Bahrain..................................................................................................... 63 388,924 *12,653 *384 298,724 1,006 Iran..................................................................................................... 17 12,012 *1,340 -- -- *1,066 Iraq..................................................................................................... 7 *10,745 -- -- *129 -- Israel..................................................................................................... 265 1,100,279 118,346 35,664 114,153 139,710 Kuwait..................................................................................................... 107 134,074 *1,714 *285 *416 15,963 Lebanon.....................................................................................................64 55,077 *457 *29 *17,741 16,321 Qatar..................................................................................................... 59 101,177 -- -- 18,128 5,919 Saudi Arabia.....................................................................................................158 1,592,022 76,055 32,254 52,421 221,528 United Arab Emirates.....................................................................................................124 672,316 38,441 *9,436 121,448 29,844 Other areas of the Arabian Peninsula.....................................................................................................67 404,993 *11,485 *9,532 *11,518 23,348 Other Middle East .....................................................................................................98 275,105 11,338 *392 11,457 84,604
Southern and Southeast Asia, total.........................................................................................................797 18,421,135 1,493,658 542,730 3,830,110 4,914,497 Bangladesh.....................................................................................................28 42,293 -- -- *18,297 *181 India..................................................................................................... 323 1,245,921 45,256 36,247 397,428 83,062 Indonesia.....................................................................................................286 3,759,952 269,020 187,342 683,100 119,414 Malaysia.....................................................................................................314 1,513,932 77,183 25,568 291,249 244,810 Pakistan.....................................................................................................89 367,704 4,471 *2,330 204,166 4,326 Philippines.....................................................................................................263 1,743,162 405,185 123,311 469,837 126,604 Singapore.....................................................................................................444 7,279,021 478,428 102,864 1,170,370 3,767,037 Sri Lanka.....................................................................................................48 68,427 *5,468 *1,467 *10,180 30,335 Thailand.....................................................................................................327 2,189,209 205,974 62,637 494,110 516,152 Vietnam.....................................................................................................57 46,425 *148 *32 *17,764 1,401 Other Southern and Southeast Asia.....................................................................................................50 165,089 *2,526 *931 73,608 21,175
Eastern Asia, total.........................................................................................................1,379 40,884,803 4,129,774 3,147,518 5,455,910 9,939,594 China..................................................................................................... 377 1,895,819 83,298 13,167 136,837 538,606 Hong Kong.....................................................................................................457 6,717,780 1,108,617 299,496 2,085,930 422,757 Japan.....................................................................................................1,109 18,803,324 2,336,763 2,553,508 1,250,555 7,067,258 South Korea.....................................................................................................387 3,033,256 281,698 194,702 950,475 888,259 Taiwan..................................................................................................... 360 4,633,471 319,355 86,645 1,010,187 1,021,434 Other Eastern Asia.....................................................................................................32 5,801,153 *42 -- *21,925 *1,280 Asia not allocable.........................................................................................................39 3,934,151 *22 *3 *2,602,126 *375,238 Oceania, total.....................................................................................................................878 10,955,550 2,472,660 1,286,448 1,551,212 1,325,536 Australia.........................................................................................................830 9,391,370 2,101,674 1,093,783 1,353,537 1,179,089 New Zealand.........................................................................................................330 1,074,640 338,324 191,171 157,360 137,011 Other Oceania.........................................................................................................63 489,539 *32,662 *1,494 40,316 9,435 Puerto Rico and U.S. Possessions, total.....................................................................................................................449 6,068,415 359,358 75,446 1,344,369 1,681,336 Puerto Rico.........................................................................................................398 5,170,569 285,146 39,772 1,006,771 1,670,845 U.S. Possessions, total.........................................................................................................156 897,845 74,212 *35,674 337,598 10,492 American Samoa.....................................................................................................17 10,709 -- -- *6,918 *250 Guam..................................................................................................... 104 390,843 *36,954 *18,355 139,098 4,484 Virgin Islands.....................................................................................................84 363,068 *23,507 *11,523 126,862 3,612 Other U.S. Possessions.....................................................................................................28 133,226 *13,751 *5,796 64,721 *2,145 Country not stated.....................................................................................................................2,890 43,793,002 1,370,315 352,607 9,318,782 5,198,234 Foreign Sales Corporation dividends ¹.....................................................................................................................72 3,370,102 3,370,012 *90 -- -- Interest-Charge Domestic International Sales Corporation dividends ¹..............................................................................................................5 *10,993 *10,993 -- -- -- Footnotes at end of table.

239
Corporate Foreign Tax Credit, 1998
Table 3.--U.S. Corporation Returns with a Foreign Tax Credit: Foreign Income and Tax Reportedon Form 1118, by Selected Country to Which Foreign Tax Was Paid--Continued[All figures are estimates based on samples--money amounts are in thousands of dollars]
Foreign income and taxes reported on Form 1118--Continued
Gross income (less loss)--Continued
Oil and gas Specifically
Selected country extraction Foreign allocable TotalService Other income branch income deductionsincome income (less loss) ² income ² [section
863(b)] ²
(7) (8) (9) (10) (11) (12)
All countries.....................................................................................................................23,414,004 114,068,512 15,127,351 87,251,267 9,176,112 202,269,920
Canada.....................................................................................................................996,488 6,593,257 517,144 2,875,140 750,542 10,450,401
Latin America, total.....................................................................................................................4,247,751 11,814,466 761,005 12,796,437 289,954 25,234,836 Mexico.........................................................................................................720,557 3,484,620 *-4 2,956,277 190,403 6,040,618 Central America, total.........................................................................................................115,254 630,870 *17 569,013 4,424 1,057,421 Belize.....................................................................................................*146 19,788 -- *13,798 *106 27,512 Costa Rica.....................................................................................................6,155 181,436 -- 63,918 1,033 107,835 El Salvador.....................................................................................................13,388 102,884 -- 59,592 *247 99,377 Guatemala.....................................................................................................65,287 137,847 *17 136,752 456 245,929 Honduras.....................................................................................................10,857 46,301 -- 35,707 *144 52,476 Nicaragua.....................................................................................................*1,287 25,333 -- 16,256 *63 14,400 Panama.....................................................................................................18,133 111,845 -- 232,556 *569 481,346 Central America not allocable.....................................................................................................-- *5,436 -- *10,432 *1,806 *28,547
Caribbean countries, total.........................................................................................................383,340 976,712 *401,947 1,171,626 8,337 2,394,367 Cayman Islands (British).....................................................................................................13,328 81,578 *-2,945 609,644 *10 1,177,752 Dominican Republic.....................................................................................................14,880 118,618 -- 103,342 *426 153,783 Haiti.....................................................................................................*12,840 39,949 -- *27,208 *6 45,479 Jamaica.....................................................................................................27,479 54,481 -- 60,477 *156 96,031 Trinidad and Tobago.....................................................................................................108,121 508,434 *404,892 167,862 *666 523,823 Other Caribbean countries.....................................................................................................206,692 173,651 -- 203,092 *7,073 397,499
South America, total.........................................................................................................1,141,611 6,657,781 359,045 6,292,348 86,790 13,537,061 Argentina.....................................................................................................293,237 2,182,890 *137,233 2,068,253 5,317 4,524,757 Bolivia.....................................................................................................46,131 34,128 *6 40,119 *405 93,761 Brazil.....................................................................................................242,702 1,681,430 *849 1,897,649 59,327 4,293,947 Chile.....................................................................................................114,254 964,623 *184 761,540 1,919 1,572,029 Colombia.....................................................................................................148,912 816,894 *189,038 709,632 -562 1,031,580 Ecuador.....................................................................................................9,379 66,830 *400 56,567 *673 113,146 Paraguay.....................................................................................................4,111 15,533 -- 68,362 *3 59,686 Peru.....................................................................................................53,862 335,993 *945 166,210 *4,777 605,357 Uruguay.....................................................................................................33,345 87,713 -- 140,178 9,521 207,660 Venezuela.....................................................................................................182,304 420,298 *30,391 355,512 5,000 994,969 Other South America.....................................................................................................*13,375 51,449 -- 28,326 *410 40,170 Latin America not allocable.........................................................................................................*1,886,988 64,484 -- *1,807,173 -- 2,205,369
Other Western Hemisphere, total.....................................................................................................................1,309,192 743,196 *39,442 2,842,852 *3,395 4,263,442 Bahamas.........................................................................................................16,189 22,605 *2,054 1,121,859 *4 989,133 Bermuda.........................................................................................................67,847 488,828 *37,388 387,907 *3,386 1,642,062 Netherlands Antilles.........................................................................................................9,012 128,616 -- *51,040 *3 225,676 Other British West Indies.........................................................................................................7,500 96,493 -- 56,165 *( ³ ) 264,324 All other Western Hemisphere.........................................................................................................1,208,643 6,654 -- *1,225,881 *1 1,142,247
Europe, total.....................................................................................................................5,580,812 38,741,332 6,487,019 32,915,251 1,986,873 75,167,381 European Union, total.........................................................................................................4,809,010 34,937,276 5,550,097 29,479,165 1,720,250 67,743,514
Austria.....................................................................................................17,585 194,671 *67 114,670 *10,464 561,447 Belgium.....................................................................................................219,558 2,711,257 *172 2,088,174 18,973 3,785,029 Denmark.....................................................................................................25,672 337,375 *177,905 234,789 *2,049 545,856 Finland.....................................................................................................19,766 364,000 -- 32,244 *32,667 497,735 France.....................................................................................................334,998 3,360,097 *11,647 1,310,722 124,758 5,668,531 Germany.....................................................................................................555,713 5,973,080 *17,302 2,887,062 275,005 8,509,038 Greece.....................................................................................................11,870 214,231 -- 418,679 *874 670,085 Ireland.....................................................................................................188,319 236,799 -- 101,135 *39,501 2,289,194 Italy.....................................................................................................214,834 1,356,868 *38 1,186,180 83,299 3,271,532 Luxembourg.....................................................................................................2,749 11,090 -- 21,913 *8 476,501 Footnotes at end of table.

240
Corporate Foreign Tax Credit, 1998
240
Table 3.--U.S. Corporation Returns with a Foreign Tax Credit: Foreign Income and Tax Reportedon Form 1118, by Selected Country to Which Foreign Tax Was Paid--Continued[All figures are estimates based on samples--money amounts are in thousands of dollars]
Foreign income and taxes reported on Form 1118--Continued
Gross income
(less loss)--Continued
Oil and gas Specifically
extraction Foreign allocable TotalSelected country Service Other income branch income deductions
income income (less loss) ² income ² [section863(b)] ²
(7) (8) (9) (10) (11) (12)
Europe--continued European Union--continued Netherlands.....................................................................................................244,398 2,052,900 *637,268 585,814 910,479 3,931,780 Portugal.....................................................................................................22,289 139,455 *243 80,547 *13,130 288,457 Spain.....................................................................................................91,326 546,892 *-10 457,082 39,297 1,583,095 Sweden.....................................................................................................107,137 386,276 -- 258,037 *36,060 1,018,213 United Kingdom.....................................................................................................2,752,795 17,022,028 4,705,466 19,675,159 133,687 34,627,653 Other European Economic Community.....................................................................................................-- *30,258 -- *26,959 -- *19,368
Other West European countries, total.........................................................................................................256,875 2,348,768 *767,515 2,315,185 10,623 4,439,109 Liechtenstein.....................................................................................................*891 *2,266 -- -- -- 4,673 Monaco.....................................................................................................*5,973 *8,119 -- *4,997 -- 14,544 Norway.....................................................................................................88,184 1,146,239 767,768 673,288 *-372 1,011,487 Switzerland.....................................................................................................133,792 1,069,079 -- 793,760 *3,876 2,298,939 Turkey.....................................................................................................24,346 85,950 *-316 842,792 *3,328 1,067,274 Other West European countries.....................................................................................................3,689 37,115 *63 *348 *3,792 42,164 West European countries not allocable.....................................................................................................-- -- -- -- -- ** East European countries, total.........................................................................................................339,382 881,955 *169,407 753,761 221,261 2,468,950 Romania.....................................................................................................12,062 31,521 *85 *49,793 *-628 64,221 Former Soviet Union.....................................................................................................129,844 190,344 *169,322 332,098 *1,606 1,164,775 Other East European countries.....................................................................................................197,476 660,091 -- 371,870 *220,283 1,239,954 Europe not allocable.........................................................................................................*175,544 573,334 -- *367,140 *34,739 515,809
Africa, total.....................................................................................................................671,483 2,294,026 781,514 1,272,890 6,535 3,213,537
North Africa, total.........................................................................................................113,764 749,000 *414,782 455,611 *1,349 1,169,695 Algeria.....................................................................................................*33,691 29,619 *13,373 *11,530 *1 171,889 Egypt.....................................................................................................77,331 665,601 *401,389 359,944 *737 902,470 Libya..................................................................................................... -- *473 -- *11 -- *3,693 Morocco.....................................................................................................2,549 26,483 -- *35,906 *612 25,732 Other North Africa.....................................................................................................*194 26,823 *20 *48,220 -- 65,912
East Africa, total.........................................................................................................17,067 110,183 -- 67,035 *1,531 144,045
Ethiopia.....................................................................................................*93 *37,453 -- *9,476 *5 44,081 Kenya.....................................................................................................*3,312 43,899 -- 40,930 *45 58,057 Tanzania.....................................................................................................*119 *613 -- *( ³ ) -- 603 Uganda.....................................................................................................*83 *875 -- -- -- 1,689 Other East Africa.....................................................................................................13,459 27,344 -- *16,629 *1,481 39,615
West and Central Africa, total.........................................................................................................415,536 1,205,651 *366,732 415,399 *6 1,263,523
Gabon.....................................................................................................*2,351 5,205 *12,519 *9,089 -- 15,671 Ghana.....................................................................................................*2,728 45,837 -- *13,139 *1 41,347 Liberia.....................................................................................................*6,617 *7,822 -- *6,671 -- 33,516 Nigeria.....................................................................................................70,547 711,188 *200,961 *43,188 *1 418,039 Zaire.....................................................................................................*1,425 *-71,189 *5,985 *15 -- *4,744 Other West and Central Africa.....................................................................................................331,868 506,788 *147,266 343,297 *5 750,205
Southern Africa, total.........................................................................................................124,953 229,073 -- 334,845 3,649 635,132 Malawi..................................................................................................... *2 *945 -- -- -- *1,719 Zimbabwe.....................................................................................................*228 2,460 -- *324 *-814 11,678 South Africa (including Namibia).....................................................................................................124,415 217,414 -- 327,523 4,464 600,791 Zambia.....................................................................................................*297 *7,272 -- *6,992 -- 8,934 Other Southern Africa.....................................................................................................*11 *983 -- *6 -- 12,010 Africa not allocable.........................................................................................................*163 *119 -- -- -- *1,142
Footnotes at end of table.

241
Corporate Foreign Tax Credit, 1998
Table 3.--U.S. Corporation Returns with a Foreign Tax Credit: Foreign Income and Tax Reportedon Form 1118, by Selected Country to Which Foreign Tax Was Paid--Continued[All figures are estimates based on samples--money amounts are in thousands of dollars]
Foreign income and taxes reported on Form 1118--Continued
Gross income (less loss)--Continued
Oil and gas Specifically
extraction Foreign allocable TotalSelected country Service Other income branch income deductions
income income (less loss) ² income ² [section863(b)] ²
(7) (8) (9) (10) (11) (12)
Asia, total.....................................................................................................................4,168,955 25,841,428 1,968,136 26,122,956 1,386,111 44,592,033 Middle East, total.........................................................................................................709,062 2,492,412 *708,014 1,641,987 -50,331 3,480,264 Bahrain.....................................................................................................20,545 55,613 -- 311,976 *56 381,103 Iran..................................................................................................... -- *9,606 -- -- -- 1,055 Iraq..................................................................................................... -- *10,616 -- *633 -- *3,957 Israel.....................................................................................................58,187 634,219 -- 41,907 *5,849 801,664 Kuwait.....................................................................................................77,377 38,319 -- 32,731 *33 131,683 Lebanon.....................................................................................................*1,004 19,526 -- *27,468 *2 43,269 Qatar.....................................................................................................49,119 28,011 *-12,508 22,089 *4 79,573 Saudi Arabia.....................................................................................................330,550 879,214 *330,382 587,017 *-57,870 1,061,851 United Arab Emirates.....................................................................................................60,680 412,467 *234,510 361,233 *1,547 554,607 Other areas of the Arabian Peninsula.....................................................................................................103,122 245,988 *155,630 *151,848 *26 227,277 Other Middle East .....................................................................................................8,479 158,833 -- 105,086 *21 194,227
Southern and Southeast Asia, total.........................................................................................................1,025,584 6,614,556 1,151,016 5,420,740 433,062 11,364,629 Bangladesh.....................................................................................................2,119 21,695 -- *28,930 -- 30,035 India.....................................................................................................147,367 536,561 -- 376,088 360 935,751 Indonesia.....................................................................................................88,719 2,412,356 757,085 641,805 *5,881 2,410,181 Malaysia.....................................................................................................139,182 735,939 *337,544 673,698 32,408 1,001,443 Pakistan.....................................................................................................4,328 148,083 *20,480 264,606 *628 262,544 Philippines.....................................................................................................91,994 526,231 *-543 520,567 170,450 977,846 Singapore.....................................................................................................361,017 1,399,305 *1,278 2,030,849 207,873 4,076,096 Sri Lanka.....................................................................................................3,804 17,173 -- *21,010 *211 44,204 Thailand.....................................................................................................132,796 777,540 *35,172 702,483 15,379 1,471,703 Vietnam.....................................................................................................16,172 10,908 -- *33,306 *-131 40,441 Other Southern and Southeast Asia.....................................................................................................38,084 28,765 -- 127,399 *3 114,384
Eastern Asia, total.........................................................................................................2,216,376 15,995,632 *109,107 17,587,965 1,002,799 26,126,559 China.....................................................................................................522,121 601,789 *91,568 604,890 22,958 1,377,521 Hong Kong.....................................................................................................469,223 2,331,757 -- 3,483,993 527,569 4,427,853 Japan.....................................................................................................764,021 4,831,219 *17,539 4,438,426 332,510 9,691,518 South Korea.....................................................................................................164,721 553,400 -- 973,611 20,253 2,012,432 Taiwan.....................................................................................................269,789 1,926,060 -- 2,353,417 99,510 3,472,676 Other Eastern Asia.....................................................................................................*26,500 5,751,406 -- *5,733,628 -- 5,144,559 Asia not allocable.........................................................................................................*217,933 738,829 -- 1,472,265 *580 3,620,580 Oceania, total.....................................................................................................................694,156 3,625,537 *760,982 3,377,950 28,016 5,364,074 Australia.........................................................................................................419,505 3,243,782 *717,326 2,886,533 27,037 4,516,789 New Zealand.........................................................................................................43,236 207,538 *-3 229,188 978 423,692 Other Oceania.........................................................................................................231,416 174,217 *43,659 *262,229 *1 423,593 Puerto Rico and U.S. Possessions, total.....................................................................................................................749,291 1,858,614 -- 2,329,308 42,215 4,156,046 Puerto Rico.........................................................................................................642,524 1,525,511 -- 1,951,090 12,444 3,439,912 U.S. Possessions, total.........................................................................................................106,767 333,104 -- 378,219 *29,771 716,133 American Samoa.....................................................................................................*950 *2,591 -- *6,811 -- 7,282 Guam.....................................................................................................51,074 140,877 -- 242,378 *2,952 287,303 Virgin Islands.....................................................................................................50,775 146,789 -- 116,569 *( ³ ) 280,888 Other U.S. Possessions.....................................................................................................*3,967 *42,846 -- *12,461 *26,819 140,661 Country not stated.....................................................................................................................4,995,876 22,556,656 3,812,109 2,699,095 4,682,470 26,510,669 Foreign Sales Corporation dividends ¹.....................................................................................................................-- -- -- -- -- 3,308,114 Interest-Charge Domestic International Sales Corporation dividends ¹..............................................................................................................-- -- -- -- -- *9,387 Footnotes at end of table.

242
Corporate Foreign Tax Credit, 1998
242
Table 3.--U.S. Corporation Returns with a Foreign Tax Credit: Foreign Income and Tax Reportedon Form 1118, by Selected Country to Which Foreign Tax Was Paid--Continued[All figures are estimates based on samples--money amounts are in thousands of dollars]
Foreign income and taxes reported on Form 1118--Continued
Foreign taxes paid, accrued, and deemed paid
Foreign taxes paid or accruedDeductions Taxable Taxes withheld at source on--
from oil incomeSelected country and gas (less loss) Total
extraction before Total Dividends Interestincome
4adjustments
(13) (14) (15) (16) (17) (18)
All countries.....................................................................................................................9,369,404 147,116,869 40,684,298 13,608,822 2,193,964 784,126
Canada.....................................................................................................................*252,401 13,401,723 4,510,064 793,084 263,751 46,290
Latin America, total.....................................................................................................................724,008 15,328,598 3,864,134 1,930,320 273,471 258,154 Mexico.........................................................................................................*1,469 4,752,408 1,176,210 411,816 24,567 36,423 Central America, total.........................................................................................................*53 886,314 149,501 55,867 4,587 357 Belize..................................................................................................... -- -142 *337 *323 *303 -- Costa Rica.....................................................................................................-- 157,148 19,346 14,421 2,247 *112 El Salvador.....................................................................................................-- 71,439 7,233 4,167 *21 *98 Guatemala.....................................................................................................*53 104,477 24,944 15,879 *526 *89 Honduras.....................................................................................................-- 34,716 6,774 3,237 *781 *26 Nicaragua.....................................................................................................-- 28,678 4,189 1,244 -- *10 Panama..................................................................................................... -- 487,420 85,348 15,268 *679 *22 Central America not allocable.....................................................................................................-- *2,577 *1,331 *1,328 *30 -- Caribbean countries, total.........................................................................................................*354,647 1,820,369 161,198 46,848 5,710 1,281 Cayman Islands (British).....................................................................................................-- 1,290,204 76,754 -- -- -- Dominican Republic.....................................................................................................-- 160,293 39,629 18,069 *2,208 *555 Haiti..................................................................................................... -- 21,906 *6,679 *5,877 *750 -- Jamaica..................................................................................................... -- 32,456 13,515 9,337 *356 *425 Trinidad and Tobago.....................................................................................................*354,647 153,945 12,960 8,038 *1,626 *19 Other Caribbean countries.....................................................................................................-- 161,565 11,659 5,526 *770 *282 South America, total.........................................................................................................367,840 7,624,776 2,367,781 1,406,345 238,607 218,578 Argentina.....................................................................................................*148,594 1,698,800 533,417 315,779 *2,226 38,860 Bolivia..................................................................................................... *58 60,980 6,074 3,428 *111 *270 Brazil.....................................................................................................*1,004 3,599,076 1,102,822 598,829 173,855 167,437 Chile..................................................................................................... *241 741,312 231,082 194,989 51,899 3,812 Colombia.....................................................................................................*152,370 523,972 225,084 155,167 7,521 *230 Ecuador.....................................................................................................*6,011 84,147 15,495 10,649 *516 *553 Paraguay.....................................................................................................*1,855 19,602 8,646 8,625 -- *85 Peru.....................................................................................................*3,130 2,089 52,901 38,315 *301 850 Uruguay..................................................................................................... -- 98,482 16,018 8,800 -- -- Venezuela.....................................................................................................*54,578 764,493 166,522 62,045 *2,178 6,480 Other South America.....................................................................................................-- 31,822 *9,719 *9,719 -- -- Latin America not allocable.........................................................................................................-- 244,731 *9,444 *9,444 -- *1,514
Other Western Hemisphere, total.....................................................................................................................*37,235 2,609,359 178,024 5,775 *1,263 *248 Bahamas......................................................................................................... -- 361,379 12,187 -- -- -- Bermuda.........................................................................................................*37,235 1,787,802 120,948 -- -- -- Netherlands Antilles.........................................................................................................-- 151,844 20,506 *2,407 *609 *154 Other British West Indies.........................................................................................................-- 198,135 21,865 2,002 *653 *94 All other Western Hemisphere.........................................................................................................-- 110,199 *2,518 *1,366 -- --
Europe, total.....................................................................................................................3,000,863 66,156,176 19,954,687 4,380,761 1,110,521 85,032 European Union, total.........................................................................................................2,326,804 60,586,857 18,473,291 3,773,534 1,026,880 29,222 Austria..................................................................................................... *41 332,419 103,310 17,757 7,738 *50 Belgium.....................................................................................................*49 2,042,396 551,402 237,010 30,310 2,135 Denmark.....................................................................................................*134,848 528,338 147,146 50,436 4,866 *249 Finland..................................................................................................... -- 369,955 51,439 12,834 6,768 *239 France.....................................................................................................*3,275 3,807,643 1,139,056 317,246 49,742 3,071 Germany.....................................................................................................*205 11,074,250 3,493,354 614,790 264,204 1,193 Greece.....................................................................................................*1,740 222,945 62,112 37,252 *28 *5 Ireland.....................................................................................................*( ³ ) 3,125,248 181,515 5,618 671 *82 Italy..................................................................................................... *2,729 3,402,276 1,858,647 306,434 54,678 8,640 Luxembourg.....................................................................................................-- 1,103,449 903,334 28,681 *28,618 *5 Footnotes at end of table.

243
Corporate Foreign Tax Credit, 1998
Table 3.--U.S. Corporation Returns with a Foreign Tax Credit: Foreign Income and Tax Reportedon Form 1118, by Selected Country to Which Foreign Tax Was Paid--Continued[All figures are estimates based on samples--money amounts are in thousands of dollars]
Foreign income and taxes reported on Form 1118--Continued
Foreign taxes paid, accrued, and deemed paid
Foreign taxes paid or accrued
Deductions Taxable Taxes withheld at source on--
from oil incomeSelected country and gas (less loss) Total
extraction before Total Dividends Interestincome
4adjustments
(13) (14) (15) (16) (17) (18)
Europe--continued European Union--continued Netherlands.....................................................................................................*81,090 8,891,093 2,678,123 346,761 134,821 1,473 Portugal..................................................................................................... -- 267,441 84,770 29,489 14,381 425 Spain..................................................................................................... *287 1,910,761 619,750 188,516 74,776 1,314 Sweden..................................................................................................... -- 1,331,030 485,161 75,681 9,933 *413 United Kingdom.....................................................................................................2,102,540 22,166,308 6,114,173 1,505,028 345,346 9,928 Other European Economic Community.....................................................................................................-- *11,303 -- -- -- --
Other West European countries, total.........................................................................................................*517,402 4,613,170 1,184,948 410,636 71,534 49,876 Liechtenstein.....................................................................................................-- 12,919 *1,279 *977 -- -- Monaco..................................................................................................... -- 15,057 *208 *198 -- -- Norway.....................................................................................................*513,585 902,328 305,887 198,452 11,409 *21 Switzerland.....................................................................................................-- 2,902,160 708,028 79,434 60,108 1,219 Turkey.....................................................................................................*134 760,778 166,865 129,365 *14 *48,637 Other West European countries.....................................................................................................*3,683 19,248 *2,682 *2,209 *3 -- West European countries not allocable.....................................................................................................-- ** -- -- -- -- East European countries, total.........................................................................................................*156,656 596,102 295,203 195,370 12,107 5,933 Romania.....................................................................................................*2,372 24,128 5,879 5,515 *689 *11 Former Soviet Union.....................................................................................................*154,285 -271,666 168,829 146,646 895 *5,909 Other East European countries.....................................................................................................-- 843,640 120,495 43,209 10,523 *13 Europe not allocable.........................................................................................................-- 360,047 *1,244 *1,221 -- --
Africa, total.....................................................................................................................784,366 1,376,462 563,226 378,101 6,371 495
North Africa, total.........................................................................................................*543,529 -3,279 68,816 48,003 *57 *( ³ ) Algeria.....................................................................................................*84,556 -82,812 *23,388 *12,835 -- -- Egypt.....................................................................................................*445,352 63,187 36,246 29,020 *5 -- Libya..................................................................................................... -- *-3,219 -- -- -- -- Morocco..................................................................................................... -- 21,669 5,888 5,531 *52 *( ³ ) Other North Africa.....................................................................................................*13,621 -2,104 *3,294 *617 -- *( ³ )
East Africa, total.........................................................................................................*( ³ ) 83,440 20,684 12,012 *435 *416
Ethiopia..................................................................................................... -- -2,436 *1,036 *1,036 -- -- Kenya..................................................................................................... -- 33,632 12,846 10,350 *287 *308 Tanzania..................................................................................................... -- 463 *21 *21 -- -- Uganda..................................................................................................... -- 1,463 *657 -- -- -- Other East Africa.....................................................................................................*( ³ ) 50,318 6,124 605 *148 *108
West and Central Africa, total.........................................................................................................*240,837 891,892 320,969 242,381 3,948 *32
Gabon.....................................................................................................*1,663 11,952 *3,596 *2,142 *521 -- Ghana..................................................................................................... -- 49,358 *13,862 *245 *87 -- Liberia..................................................................................................... -- 96,515 *2,024 -- -- -- Nigeria.....................................................................................................*34,609 657,886 177,661 118,867 *3,012 *31 Zaire.....................................................................................................*1,223 -72,613 *857 *731 -- *1 Other West and Central Africa.....................................................................................................*203,343 148,794 122,969 120,395 *329 --
Southern Africa, total.........................................................................................................-- 403,813 152,757 75,705 1,930 *47 Malawi..................................................................................................... -- 2,514 *1,269 -- -- -- Zimbabwe.....................................................................................................-- 13,850 11,943 1,991 *1,662 -- South Africa (including Namibia).....................................................................................................-- 355,882 132,345 68,262 *160 *47 Zambia..................................................................................................... -- 1,830 *1,908 *785 *45 -- Other Southern Africa.....................................................................................................-- 29,736 *5,292 *4,666 *64 -- Africa not allocable.........................................................................................................-- *597 -- -- -- --
Footnotes at end of table.
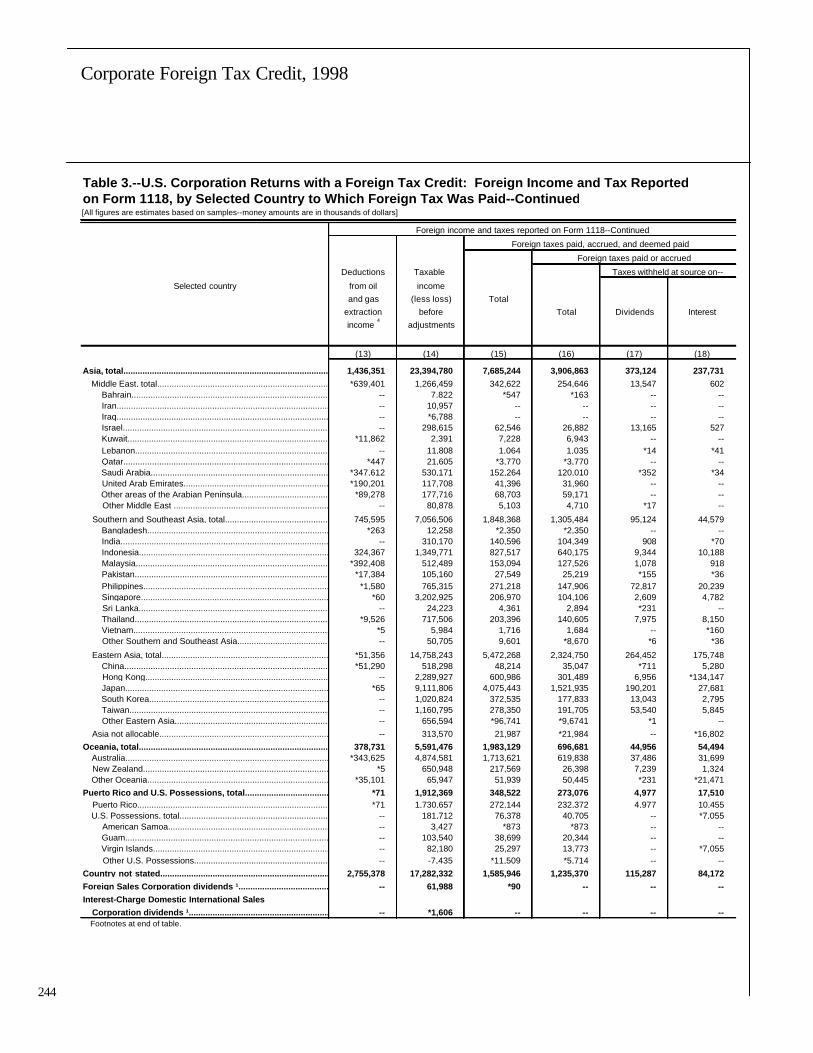
244
Corporate Foreign Tax Credit, 1998
244
Table 3.--U.S. Corporation Returns with a Foreign Tax Credit: Foreign Income and Tax Reportedon Form 1118, by Selected Country to Which Foreign Tax Was Paid--Continued[All figures are estimates based on samples--money amounts are in thousands of dollars]
Foreign income and taxes reported on Form 1118--Continued
Foreign taxes paid, accrued, and deemed paid
Foreign taxes paid or accrued
Deductions Taxable Taxes withheld at source on--
Selected country from oil incomeand gas (less loss) Total
extraction before Total Dividends Interestincome
4adjustments
(13) (14) (15) (16) (17) (18)
Asia, total.....................................................................................................................1,436,351 23,394,780 7,685,244 3,906,863 373,124 237,731 Middle East, total.........................................................................................................*639,401 1,266,459 342,622 254,646 13,547 602 Bahrain..................................................................................................... -- 7,822 *547 *163 -- -- Iran..................................................................................................... -- 10,957 -- -- -- -- Iraq..................................................................................................... -- *6,788 -- -- -- -- Israel..................................................................................................... -- 298,615 62,546 26,882 13,165 527 Kuwait.....................................................................................................*11,862 2,391 7,228 6,943 -- -- Lebanon..................................................................................................... -- 11,808 1,064 1,035 *14 *41 Qatar..................................................................................................... *447 21,605 *3,770 *3,770 -- -- Saudi Arabia.....................................................................................................*347,612 530,171 152,264 120,010 *352 *34 United Arab Emirates.....................................................................................................*190,201 117,708 41,396 31,960 -- -- Other areas of the Arabian Peninsula.....................................................................................................*89,278 177,716 68,703 59,171 -- -- Other Middle East .....................................................................................................-- 80,878 5,103 4,710 *17 --
Southern and Southeast Asia, total.........................................................................................................745,595 7,056,506 1,848,368 1,305,484 95,124 44,579 Bangladesh.....................................................................................................*263 12,258 *2,350 *2,350 -- -- India..................................................................................................... -- 310,170 140,596 104,349 908 *70 Indonesia.....................................................................................................324,367 1,349,771 827,517 640,175 9,344 10,188 Malaysia.....................................................................................................*392,408 512,489 153,094 127,526 1,078 918 Pakistan.....................................................................................................*17,384 105,160 27,549 25,219 *155 *36 Philippines.....................................................................................................*1,580 765,315 271,218 147,906 72,817 20,239 Singapore.....................................................................................................*60 3,202,925 206,970 104,106 2,609 4,782 Sri Lanka.....................................................................................................-- 24,223 4,361 2,894 *231 -- Thailand.....................................................................................................*9,526 717,506 203,396 140,605 7,975 8,150 Vietnam..................................................................................................... *5 5,984 1,716 1,684 -- *160 Other Southern and Southeast Asia.....................................................................................................-- 50,705 9,601 *8,670 *6 *36
Eastern Asia, total.........................................................................................................*51,356 14,758,243 5,472,268 2,324,750 264,452 175,748 China.....................................................................................................*51,290 518,298 48,214 35,047 *711 5,280 Hong Kong.....................................................................................................-- 2,289,927 600,986 301,489 6,956 *134,147 Japan..................................................................................................... *65 9,111,806 4,075,443 1,521,935 190,201 27,681 South Korea.....................................................................................................-- 1,020,824 372,535 177,833 13,043 2,795 Taiwan..................................................................................................... -- 1,160,795 278,350 191,705 53,540 5,845 Other Eastern Asia.....................................................................................................-- 656,594 *96,741 *9,6741 *1 -- Asia not allocable.........................................................................................................-- 313,570 21,987 *21,984 -- *16,802 Oceania, total.....................................................................................................................378,731 5,591,476 1,983,129 696,681 44,956 54,494 Australia.........................................................................................................*343,625 4,874,581 1,713,621 619,838 37,486 31,699 New Zealand.........................................................................................................*5 650,948 217,569 26,398 7,239 1,324 Other Oceania.........................................................................................................*35,101 65,947 51,939 50,445 *231 *21,471 Puerto Rico and U.S. Possessions, total.....................................................................................................................*71 1,912,369 348,522 273,076 4,977 17,510 Puerto Rico.........................................................................................................*71 1,730,657 272,144 232,372 4,977 10,455 U.S. Possessions, total.........................................................................................................-- 181,712 76,378 40,705 -- *7,055 American Samoa.....................................................................................................-- 3,427 *873 *873 -- -- Guam..................................................................................................... -- 103,540 38,699 20,344 -- -- Virgin Islands.....................................................................................................-- 82,180 25,297 13,773 -- *7,055 Other U.S. Possessions.....................................................................................................-- -7,435 *11,509 *5,714 -- -- Country not stated.....................................................................................................................2,755,378 17,282,332 1,585,946 1,235,370 115,287 84,172 Foreign Sales Corporation dividends ¹.....................................................................................................................-- 61,988 *90 -- -- -- Interest-Charge Domestic International Sales Corporation dividends ¹..............................................................................................................-- *1,606 -- -- -- -- Footnotes at end of table.

245
Corporate Foreign Tax Credit, 1998
Table 3.--U.S. Corporation Returns with a Foreign Tax Credit: Foreign Income and Tax Reportedon Form 1118, by Selected Country to Which Foreign Tax Was Paid--Continued[All figures are estimates based on samples--money amounts are in thousands of dollars]
Foreign income and taxes reported on Form 1118--Continued
Foreign taxes paid, accrued, and deemed paid--Continued
Foreign taxes paid or accrued--ContinuedTaxes withheld Other taxes paid or accrued on--
at source on Specifically TaxesSelected country --Continued allocable deemed
Rents, royalties, Branch income Service Other paidand license income [section income income
fees 863(b)]
(19) (20) (21) (22) (23) (24)
All countries.....................................................................................................................2,213,430 4,861,563 8,524 387,240 3,159,976 27,075,476
Canada.....................................................................................................................103,540 249,058 *270 24,938 105,236 3,716,980
Latin America, total.....................................................................................................................369,855 533,144 *51 81,157 414,487 1,933,814 Mexico.........................................................................................................83,959 214,161 -- 8,890 43,816 764,394 Central America, total.........................................................................................................18,082 27,343 -- 2,758 2,739 93,634 Belize..................................................................................................... *4 *16 -- -- -- *14 Costa Rica.....................................................................................................6,796 *3,888 -- *252 *1,125 4,925 El Salvador.....................................................................................................1,680 *2,276 -- *65 *28 *3,065 Guatemala.....................................................................................................5,444 *7,616 -- 1,764 *440 9,065 Honduras.....................................................................................................1,119 *632 -- *677 *1 *3,537 Nicaragua.....................................................................................................*35 *356 -- -- *844 *2,945 Panama.....................................................................................................3,004 *11,273 -- -- *289 70,080 Central America not allocable.....................................................................................................-- *1,286 -- -- *12 *3
Caribbean countries, total.........................................................................................................3,480 22,954 -- 8,103 5,319 114,350 Cayman Islands (British).....................................................................................................-- -- -- -- -- 76,754 Dominican Republic.....................................................................................................2,196 *11,910 -- *1,021 *179 *21,561 Haiti..................................................................................................... *10 *2,088 -- -- *3,030 *802 Jamaica.....................................................................................................730 6,698 -- *235 *893 *4,178 Trinidad and Tobago.....................................................................................................*403 *1,801 -- *3,465 *724 *4,922 Other Caribbean countries.....................................................................................................*142 *457 -- *3,382 *493 6,133
South America, total.........................................................................................................256,413 268,686 *51 61,405 362,605 961,436 Argentina.....................................................................................................67,034 118,950 -- 40,709 48,000 217,638 Bolivia..................................................................................................... 359 *1,296 -- *133 *1,259 *2,646 Brazil.....................................................................................................81,399 40,471 *51 6,287 129,329 503,993 Chile.....................................................................................................41,432 15,329 -- 1,297 81,219 36,093 Colombia.....................................................................................................26,440 50,805 -- 1,707 68,464 69,917 Ecuador.....................................................................................................5,504 *1,032 -- *207 *2,838 4,846 Paraguay.....................................................................................................*276 *6,357 -- -- *1,907 *21 Peru..................................................................................................... 9,663 6,058 -- 4,252 17,191 14,586 Uruguay.....................................................................................................4,997 *3,746 -- *48 *9 7,218 Venezuela.....................................................................................................19,295 15,062 -- 6,766 12,263 104,477 Other South America.....................................................................................................*15 *9,578 -- -- *126 -- Latin America not allocable.........................................................................................................*7,920 -- -- -- *9 --
Other Western Hemisphere, total.....................................................................................................................*647 3,323 *48 *174 *72 172,249 Bahamas......................................................................................................... -- -- -- -- -- 12,187 Bermuda......................................................................................................... -- -- -- -- -- 120,948 Netherlands Antilles.........................................................................................................-- *1,644 -- -- -- 18,099 Other British West Indies.........................................................................................................*48 *913 *48 *174 *72 19,863 All other Western Hemisphere.........................................................................................................*600 *766 -- -- -- *1,152
Europe, total.....................................................................................................................443,695 1,630,404 *17 96,308 1,014,784 15,573,927 European Union, total.........................................................................................................406,542 1,348,037 *17 83,148 879,686 14,699,758
Austria.....................................................................................................1,982 *7,771 -- -- 216 85,553 Belgium.....................................................................................................*5,190 111,035 -- *690 87,651 314,391 Denmark.....................................................................................................*98 41,728 -- *1,071 *2,423 96,710 Finland.....................................................................................................4,723 *608 -- *13 483 38,605 France.....................................................................................................62,778 46,799 -- 4,178 150,678 821,809 Germany.....................................................................................................3,341 291,005 -- 7,567 47,480 2,878,564 Greece.....................................................................................................1,138 *35,526 -- *477 *78 24,860 Ireland.....................................................................................................*268 *1,154 -- *2,381 *1,061 175,897 Italy..................................................................................................... 83,361 106,600 *3 *2,502 50,649 1,552,213 Luxembourg.....................................................................................................-- *58 -- -- -- 874,653 Footnotes at end of table.

246
Corporate Foreign Tax Credit, 1998
246
Table 3.--U.S. Corporation Returns with a Foreign Tax Credit: Foreign Income and Tax Reportedon Form 1118, by Selected Country to Which Foreign Tax Was Paid--Continued[Money amounts are in thousands of dollars]
Foreign income and taxes reported on Form 1118--Continued
Foreign taxes paid, accrued, and deemed paid--Continued
Foreign taxes paid or accrued--Continued
Taxes withheld Other taxes paid or accrued on--
at source on Specifically TaxesSelected country --Continued allocable deemed
Rents, royalties, Branch income Service Other paidand license income [section income income
fees 863(b)]
(19) (20) (21) (22) (23) (24)
Europe--continued European Union--continued Netherlands.....................................................................................................130,890 72,690 -- *1,486 5,401 2,331,361 Portugal.....................................................................................................8,251 *4,882 -- *99 1,451 55,281 Spain.....................................................................................................83,511 21,420 *1 *1,689 5,805 431,233 Sweden.....................................................................................................*19 18,415 -- *969 45,931 409,481 United Kingdom.....................................................................................................20,990 588,346 *13 60,027 480,378 4,609,145 Other European Economic Community.....................................................................................................-- -- -- -- -- --
Other West European countries, total.........................................................................................................15,247 263,191 -- 3,181 7,607 774,312 Liechtenstein.....................................................................................................-- *977 -- -- -- *301 Monaco..................................................................................................... -- -- -- *198 -- *10 Norway.....................................................................................................*4,609 180,943 -- *596 *875 107,435 Switzerland.....................................................................................................*586 15,322 -- *1,863 336 628,593 Turkey.....................................................................................................9,503 65,949 -- *525 *4,738 37,500 Other West European countries.....................................................................................................*549 -- -- -- *1,657 *473 West European countries not allocable.....................................................................................................-- -- -- -- -- -- East European countries, total.........................................................................................................21,763 18,098 -- 9,979 127,491 99,833 Romania.....................................................................................................1,603 *2,073 -- *1,129 *10 *364 Former Soviet Union.....................................................................................................4,213 8,973 -- 1,851 124,805 22,183 Other East European countries.....................................................................................................15,947 7,052 -- 6,999 2,676 77,286 Europe not allocable.........................................................................................................*143 *1,078 -- -- -- *23
Africa, total.....................................................................................................................39,613 282,562 -- 29,454 19,606 185,125
North Africa, total.........................................................................................................4,840 19,197 -- *13,070 *10,839 20,813 Algeria..................................................................................................... -- -- -- *12,835 -- *10,553 Egypt.....................................................................................................*4,494 *14,021 -- *182 *10,317 7,226 Libya..................................................................................................... -- -- -- -- -- -- Morocco.....................................................................................................296 *4,608 -- *53 *522 *356 Other North Africa.....................................................................................................*49 *568 -- -- -- *2,677
East Africa, total.........................................................................................................597 *4,836 -- *353 *5,375 8,672
Ethiopia..................................................................................................... -- *1,036 -- -- -- -- Kenya..................................................................................................... *304 *3,731 -- *345 *5,375 *2,496 Tanzania.....................................................................................................*21 -- -- -- -- -- Uganda..................................................................................................... -- -- -- -- -- *657 Other East Africa.....................................................................................................*272 *69 -- *8 -- *5,519
West and Central Africa, total.........................................................................................................1,359 234,120 -- *1,268 *1,654 78,588
Gabon..................................................................................................... -- *1,347 -- -- *274 *1,454 Ghana..................................................................................................... *27 *131 -- -- *( ³ ) *13,618 Liberia..................................................................................................... -- -- -- -- -- *2,024 Nigeria.....................................................................................................*765 *114,667 -- *293 *99 58,794 Zaire..................................................................................................... -- -- -- *( ³ ) *730 *126 Other West and Central Africa.....................................................................................................*567 *117,975 -- *975 *550 *2,573
Southern Africa, total.........................................................................................................32,818 24,409 -- *14,764 *1,737 77,052 Malawi..................................................................................................... -- -- -- -- -- *1,269 Zimbabwe.....................................................................................................*203 *126 -- -- -- 9,952 South Africa (including Namibia).....................................................................................................27,995 23,593 -- *14,764 *1,704 64,082 Zambia..................................................................................................... *51 *690 -- -- -- *1,123 Other Southern Africa.....................................................................................................*4,569 -- -- -- *34 *626 Africa not allocable.........................................................................................................-- -- -- -- -- --
Footnotes at end of table.

247
Corporate Foreign Tax Credit, 1998
Table 3.--U.S. Corporation Returns with a Foreign Tax Credit: Foreign Income and Tax Reportedon Form 1118, by Selected Country to Which Foreign Tax Was Paid--Continued[Money amounts are in thousands of dollars]
Foreign income and taxes reported on Form 1118--Continued
Foreign taxes paid, accrued, and deemed paid--Continued
Foreign taxes paid or accrued--Continued
Taxes withheld Other taxes paid or accrued on--
Selected country at source on Specifically Taxes--Continued allocable deemed
Rents, royalties, Branch income Service Other paidand license income [section income income
fees 863(b)]
(19) (20) (21) (22) (23) (24)
Asia, total.....................................................................................................................978,891 1,602,748 *654 41,718 671,998 3,778,382 Middle East, total.........................................................................................................16,526 115,028 *69 3,270 105,603 87,976 Bahrain.....................................................................................................*( ³ ) *163 -- -- -- *384 Iran..................................................................................................... -- -- -- -- -- -- Iraq..................................................................................................... -- -- -- -- -- -- Israel.....................................................................................................11,014 *1,338 *69 *369 400 35,664 Kuwait.....................................................................................................*1,045 *3,550 -- *19 *2,329 *285 Lebanon.....................................................................................................102 *844 -- *33 *2 *29 Qatar..................................................................................................... *7 *2,693 -- *4 *1,066 -- Saudi Arabia.....................................................................................................4,180 88,569 -- *2,707 *24,167 32,254 United Arab Emirates.....................................................................................................*3 *12,533 -- -- *19,424 *9,436 Other areas of the Arabian Peninsula.....................................................................................................*100 *2,586 -- -- *56,485 *9,532 Other Middle East .....................................................................................................*76 *2,752 -- *137 *1,729 *392
Southern and Southeast Asia, total.........................................................................................................153,316 672,796 *5 22,038 317,625 542,884 Bangladesh.....................................................................................................-- *2,160 -- *190 -- -- India..................................................................................................... 7,217 87,098 -- 4,597 4,459 36,247 Indonesia.....................................................................................................6,351 430,337 -- 6,999 176,954 187,342 Malaysia.....................................................................................................10,949 3,012 -- 1,709 109,860 25,568 Pakistan.....................................................................................................*568 *23,832 -- *72 *556 *2,330 Philippines.....................................................................................................7,860 30,173 -- 703 16,115 123,311 Singapore.....................................................................................................47,623 42,596 *5 893 5,597 102,864 Sri Lanka.....................................................................................................*566 *2,082 -- *15 *( ³ ) *1,467 Thailand.....................................................................................................72,018 43,194 -- 5,187 4,080 62,791 Vietnam.....................................................................................................*34 *633 -- *856 *2 *32 Other Southern and Southeast Asia.....................................................................................................*131 *7,679 -- *817 *1 *931
Eastern Asia, total.........................................................................................................808,337 814,568 *579 16,269 244,796 3,147,519 China.....................................................................................................17,945 5,015 *98 3,426 2,573 13,167 Hong Kong.....................................................................................................5,452 70,278 *40 *262 84,355 299,497 Japan.....................................................................................................605,416 647,824 *64 4,732 46,017 2,553,508 South Korea.....................................................................................................113,347 38,717 *378 2,052 7,502 194,702 Taiwan.....................................................................................................66,178 52,579 -- 5,798 7,765 86,645 Other Eastern Asia.....................................................................................................-- *156 -- -- *96,584 -- Asia not allocable.........................................................................................................*712 *355 -- *140 *3,975 *3 Oceania, total.....................................................................................................................77,891 192,801 -- 7,700 318,839 1,286,448 Australia.........................................................................................................67,950 186,294 -- 5,081 291,328 1,093,783 New Zealand.........................................................................................................9,623 4,470 -- *2,613 1,128 191,171 Other Oceania.........................................................................................................*318 *2,037 -- *5 *26,383 *1,494
Puerto Rico and U.S. Possessions, total.....................................................................................................................30,879 134,604 *74 13,929 71,102 75,446 Puerto Rico.........................................................................................................30,280 106,019 -- 12,451 68,190 39,772 U.S. Possessions, total.........................................................................................................*599 28,586 *74 1,479 2,912 *35,674 American Samoa.....................................................................................................*4 *861 -- *7 -- -- Guam..................................................................................................... *41 17,429 *74 *498 2,303 *18,355 Virgin Islands.....................................................................................................*554 *4,630 -- *973 *562 *11,523 Other U.S. Possessions.....................................................................................................-- *5,666 -- -- *47 *5,796 Country not stated.....................................................................................................................168,418 232,921 *669 *91,861 542,044 350,575 Foreign Sales Corporation dividends ¹.....................................................................................................................-- -- -- -- -- *90 Interest-Charge Domestic International Sales Corporation dividends ¹..............................................................................................................-- -- -- -- -- -- * Data should be used with caution because of the small number of returns on which they are based. ** Not shown to avoid disclosure of information about specific taxpayers. However, the data are included in the appropriate totals. ¹ Dividends from an Interest-Charge Domestic International Sales Corporation or a Foreign Sales Corporation were not reported for specific foreign countries. ² Included in gross income (less loss), columns 2-8. ³ Less than $500. 4 Included in total deductions, column 12. NOTE: Detail may not add to totals because of rounding.


![M.leichtova(2014)[149][178] Misunderstanding Russia - Russian Foreign Policy and the West (Google eBook)](https://img.dokumen.tips/doc/110x75/55cf8eae550346703b9484fc/mleichtova2014149178-misunderstanding-russia-russian-foreign-policy.jpg)


![Republic of the Philippines to Bid QN 2017-178-SEP... · AFFIDAVIT I, [Name of Affiant], of ... offices, corporations, or Local Government Units, foreign government/foreign or international](https://img.dokumen.tips/doc/110x75/5acadfb07f8b9aa3298de331/republic-of-the-to-bid-qn-2017-178-sepaffidavit-i-name-of-affiant-of-.jpg)


![178 Ginga Brasil 178 [Junho 09]](https://img.dokumen.tips/doc/110x75/5571fdcb497959916999f535/178-ginga-brasil-178-junho-09.jpg)


