Embed Size (px)
Citation preview
[Agrawal et. al., Vol.5 (Iss.2): February, 2017] ISSN- 2350-0530(O), ISSN- 2394-3629(P)
ICV (Index Copernicus Value) 2015: 71.21 IF: 4.321 (CosmosImpactFactor), 2.532 (I2OR)
InfoBase Index IBI Factor 3.86
Http://www.granthaalayah.com ©International Journal of Research - GRANTHAALAYAH [92]
Management
CORPORATE DEBT RESTRUCTURING IN SCHEDULED
COMMERCIAL BANKS IN INDIA: AN ANALYSIS
CA Gopal Prasad Agrawal*1
, Dr. Anil Kumar Swain2, Aswini Kumar Bhuyan
3
*1Practising Chartered Accountant, Bhubaneswar, India
2Associate Professor P.G. Department of Commerce Utkal University, Bhubaneswar, India
3Research Scholar (M. Phil), P.G. Department of Commerce, Utkal University, Bhubaneswar,
India
DOI: https://doi.org/10.5281/zenodo.345450
Abstract
After nationalisation, the Banking activities expanded multi-folds, the banking system in India
faces many problems. One of such problems is the vast number of Non-Performing Assets in the
banks’ balance sheet. To ensure proper functioning of the banking system in the economy, we
need to see that the level of NPAs is kept down. In spite of many fold developments, adverse
development of accumulation of NPAs to place over the period, several tools / methods of
managing NPAs were tried such as Lok Adalats, Debt Recovery Tribunals, SARFAESI Act,
Corporate Debt Restructuring and many more. Cleaning up of the Bank Balance Sheets is
essential and urgent to boost growth in coming years, independent loan review mechanism and
sale of unproductive assets are some of the ways to arrest the rising NPAs. Since the quality of
advances in India particularly the corporate stressed advances are quite poor and huge in
comparison to other Asian Pacific emerging countries, if the NPAs are not managed properly
there is every chance that the capital and reserves of Banks shall not to able to meet the losses
arising on account of write off of Bad Loans.
Keywords: Banking, Scheduled Commercial Banks; Npas, Balance Sheet; Corporate Debt
Restructuring; Lok Adalats; Debt Recovery Tribunals; SARFAESI Act; Emerging Economy.
Cite This Article: CA Gopal Prasad Agrawal, Dr. Anil Kumar Swain, and Aswini Kumar
Bhuyan. (2017). “CORPORATE DEBT RESTRUCTURING IN SCHEDULED
COMMERCIAL BANKS IN INDIA: AN ANALYSIS.” International Journal of Research -
Granthaalayah, 5(2), 92-112. https://doi.org/10.5281/zenodo.345450.
1. Introduction
The practice of lending and borrowing is millenniums old. The Banks’ primary activities are to
advance loans to the needy people. The concept of banking was incepted ever since humans
started engaging in economic transactions of any kind. The banking system has evolved since
[Agrawal et. al., Vol.5 (Iss.2): February, 2017] ISSN- 2350-0530(O), ISSN- 2394-3629(P)
ICV (Index Copernicus Value) 2015: 71.21 IF: 4.321 (CosmosImpactFactor), 2.532 (I2OR)
InfoBase Index IBI Factor 3.86
Http://www.granthaalayah.com ©International Journal of Research - GRANTHAALAYAH [93]
then. Modern Banking has a long history of over 300 years in India. During this period the
Banking sector has undergone several changes. Important changes are nationalisation of Banks
in the year 1969 and 1980. The main purpose of nationalisation of Bank was social welfare,
controlling private monopoly, expansion of Banking, reducing regional imbalances, priority
sector lending and developing banking habits. Hence the mandate given to the Banks was to
expand banking network, increase deposits and extend credits to priority sector. This target was
well achieved by Bank over a period of time. After nationalisation the branches has increased
from 8,322 to 57,698, Bank Deposit from Rs. 4,640 Crores to Rs. 140,150 Crores and Bank
Credit from Rs. 3,599 Crores to Rs. 84,719 Crores in the year 1989. Again during 2015 the no of
branches has increased to 130,482, Bank Deposits to 8,922,111 Crores and Bank Credit to Rs.
6,878,472 Crores.
Banking businesses is mainly that of accepting deposits from the public and lending it to the
needy persons and business at a premium. Lending of money involves a credit risk. When the
loans and advances made by banks or financial institutions turnout as non - productive, non-
rewarding and non - remunerative then they will become Non – Performing Assets (NPA). Every
growth has its own side effects. While the Banking activities expanded multi-folds, the banking
system in India faces many problems. One of such problems is the vast number of Non-
Performing Assets in the Banks’ Balance Sheet. To ensure proper functioning of the banking
system in the economy, we need to see that the level of NPAs is kept down. Non-Performing
Loans (NPLs) are an area of concern, as they adversely affect the financial health of the Banks.
The NPA demon is eating away the Indian economy slowly & steadily as it is making the credit
costly & scarce. During 1980 to 1996, there was a crisis in the banking sector world over.
According to a study 73 percent of the member countries of the International Monetary Fund
(IMF) have experienced serious banking problems. Most of these member countries are
developing nations only. One of the prominent reasons for the crisis is building up of Non -
Performing Assets in the banking and financial sector. India has also experienced the problem of
rising NPA. Apart from compromise on objective credit assessment of borrowers due to political
and economy considerations, laxities in legal system, accounting disclosure practices followed
by Banks, recession and wilful defaults have lead to the accumulation of NPA.
The Financial sector reforms in India started in 1991. A committee headed by M. Narasimham
was set up with the task of analysing India's banking sector and recommending legislation and
regulations to make it more effective, competitive and efficient. The Narasimhan Committee has
recommended prudential norms on income recognition, asset classification and provisioning. The
important aspect of the banking sector reforms is relating to liberalization of norms and
guidelines for making the whole sector vibrant and competitive. In spite of many fold
developments, adverse development of accumulation of NPAs took place over the period.
Several tools / methods of managing NPAs were tried such as Lok Adalats, Debt Recovery
Tribunals, SARFAESI Act and many more. Corporate Debt Restructuring is one of such tools of
managing NPAs in corporate sectors with least legal interventions.
[Agrawal et. al., Vol.5 (Iss.2): February, 2017] ISSN- 2350-0530(O), ISSN- 2394-3629(P)
ICV (Index Copernicus Value) 2015: 71.21 IF: 4.321 (CosmosImpactFactor), 2.532 (I2OR)
InfoBase Index IBI Factor 3.86
Http://www.granthaalayah.com ©International Journal of Research - GRANTHAALAYAH [94]
2. Objectives of the Study
1) The advances quality, management of NPAs and the role of CDR mechanism in Indian
context
2) To Compare of CDR with other existing recovery mechanisms in terms of cases referred,
cases solved, amount involved and amount recovered.
3) To compare the international trend of NPAs.
4) The growth of CDR during 2005-06 to 2015-16
3. Methodology and Review of Literature
This study is done to know the growth, measurement and management of NPAs in Scheduled
Commercial Banks with special emphasis to Corporate Debt Restructuring. The data used are
basically secondary in nature and are being collected from RBI, IMF websites and other private
agencies websites.
Many studies have been done on CDR, some of the studies are discussed here. Narsimhan-
I(1991) recommendations are series of measures such as statutory stipulations, credit
programme, improving asset quality, institution of prudential norms, greater disclosures, better
housekeeping in terms of accounting practices. The norms include not only capital adequacy,
asset classifications and provisioning but also accounting standards, exposure and disclosure
norms and guidelines for investment, risk management and asset liability management
Narsimhan-II (1998) recommendations are need for 'zero' non-performing assets for all Indian
banks with International presence. A proper system is to identify and classify NPAs, to be
brought down to 3% by 2002 and for an independent loan review mechanism for improved
management of loan portfolios. Reddy (2002) said in his study gave the importance of a sound
understanding of the macroeconomic variables and systemic issues pertaining to banks and the
economy for solving the NPA problem along with the criticality of a strong legal framework and
legislative framework. Foreign experiences must be utilized along with a clear understanding of
the local conditions to create a tailor made solution which is transparent and fair to all
stakeholders. Karunakar, Vasuki and Saravanan (2008) gave a lasting solution to the problem of
NPAs. It can be achieved only with proper credit assessment and risk management mechanism.
Banking system is to be equipped with prudential norms to minimize if not completely to avoid
the problem of NPAs. It is better to avoid NPAs at the emerging stage of credit consideration by
putting in place of rigorous and appropriate credit appraisal mechanisms. Vig (2009) concluded
that there is a threshold level of creditor rights beyond which a strengthening may have adverse
effects. An increase in the rights of secured creditors leads to a reduction in the quantity of
secured credit. This result thus suggests that improvements in creditor rights have important
demand side effects that have been ignored in previous literature. Lokare’s (2014) study’s
outcome was that in a bank dominated economy like India, the stability and sound health of the
banking system is imperative for overall economic development and financial stability. The
Indian banking sector overtime has witnessed significant transformation and has proved to be
sound and durable, even in the face of one of the worst financial crisis that hit the world
economy during 2008. Nevertheless, of late, the asset quality of Indian banks has come under
growing pressure. Sevta (2014) found that CDR is currently vital in light of the recessionary
conditions that hit India, every scheme has its own drawbacks. In an out-of-court, non-statutory

[Agrawal et. al., Vol.5 (Iss.2): February, 2017] ISSN- 2350-0530(O), ISSN- 2394-3629(P)
ICV (Index Copernicus Value) 2015: 71.21 IF: 4.321 (CosmosImpactFactor), 2.532 (I2OR)
InfoBase Index IBI Factor 3.86
Http://www.granthaalayah.com ©International Journal of Research - GRANTHAALAYAH [95]
and flexible mechanism such as CDR, if any possibility of bad faith creeps in, it can blemish the
whole process which is otherwise for the good of the corporation and looks to save an otherwise
collapsing entity. Ahamed and Mallick(2015) found that after the start of CDR, member banks
with generous regulatory forbearance on asset classification and provisioning experience an
improvement in stability which indicates that soundness of member banks increased by 43.6%
after the implementation of CDR mechanism. CDR is a channel through which timely and
efficient out-of-court restructuring mechanism with minimum regulatory forbearance can have a
positive impact on banking stability. By reducing NPLs overhang under the guise of CDR
system, RBI’s intention of having stable banking sector have largely achieved. Chavan and
Gambacorta (2016) from their studies found that the more efficiently managed a bank was, the
better was its loan quality. Banks tend to take on more risks during an upturn in credit growth
and be more cautious whenever there is a downturn. For a one percentage point increase
(decrease) in loan growth is associated with an increase (decrease) of NPLs over total advances
(NPL ratio) by 4.3 per cent in the long run. NPL ratios are sensitive to the interest rate
environment and the overall growth of the economy. NPLs of private banks are more reactive
than NPLs of public banks to changes in interest rates, because of the greater credit exposure to
retail loans (housing, consumer durables and credit card receivables) that are more reactive to
monetary policy changes. Both public and private banks show a significant pro cyclical risk
taking response to credit growth. The degree of pro cyclicality in NPLs is larger for private
banks than for public banks (4.5 per cent and 0.8 per cent, respectively).
Asset Classification: Asset classification of restructured accounts was explicitly prescribed for
the first time in April 1992 with the introduction of asset classification norms defined on
objective criteria of past due and record of recovery. These definitions were on the basis of the
recommendations of ‘The Committee on Financial System’ under the Chairmanship of Shri M.
Narasimham. It was stated that an asset, where the terms of the loan agreement regarding interest
and principal have been renegotiated or rescheduled after commencement of production, should
be classified as sub-standard and should remain in that category for at least two years of
satisfactory performance under the renegotiated or rescheduled terms. Separate guidelines on
Income Recognition, Asset Classification (IRAC) and Provisioning Norms for FIs were issued in
March 1994. These guidelines for FIs were comparatively lenient compared to those for the
banks as they allowed a time over-run of 50% of the contracted time for completion of projects
before downgrading the asset.
4. Management of NPAs
It is prudent that NPAs in bank ought to be kept at the lowest level. The two pronged approaches
would be necessary for controlling NPAs which are Preventive management and Curative
management.
Preventive Management
Mechanism of Credit Assessment and Risk Management: In a situation of liquidity overhang,
the enthusiasm of the banking system is to increase lending with compromise on asset quality
which ultimately raises concern about adverse selection and potential danger of addition to the
NPAs stock. A lasting solution to the problem of NPAs can be achieved only with proper credit
[Agrawal et. al., Vol.5 (Iss.2): February, 2017] ISSN- 2350-0530(O), ISSN- 2394-3629(P)
ICV (Index Copernicus Value) 2015: 71.21 IF: 4.321 (CosmosImpactFactor), 2.532 (I2OR)
InfoBase Index IBI Factor 3.86
Http://www.granthaalayah.com ©International Journal of Research - GRANTHAALAYAH [96]
assessment and risk management mechanism. The documentation of credit policy and credit
audit is necessary to upgrade the quality of credit appraisal in banks.
Banking Organisational Restructuring: With regard to internal factors leading to NPAs, the
onus for containing the same rest with the Bank. The need of the hour is improvement in the
managerial efficiency, skill up-gradation for proper assessment of credit worthiness and a change
in the attitude of the banks towards legal action, which is traditionally viewed as a measure of the
last resort.
Lesser Dependence on Interest: The Indian banks are heavily depending upon lending and
investments whereas the banks in the developed countries do not depend upon this income
further 86 percent of income of Indian banks is accounted from interest and the rest of the
income is fee based. The banker can earn sufficient net margin by investing in safer securities
though not at high rate of interest. It facilitates for limiting of high level of NPAs gradually.
Potential and Borderline NPAs: There is need for a mechanism of quick diagnosis and
remedial measures so that the potential and borderline accounts do not step into NPAs
categories.
Curative Management: The curative measures are to be designed in such a manner so that there
is maximum recoveries which shall help in banks funds which are locked up in NPAs are
released for recycling. In this direction, the Central government and RBI have taken various
steps for arresting incidence of fresh NPAs and creating legal and regulatory environment to
facilitate the recovery of existing NPAs of banks.
5. CDR: An Overview
The guidelines on restructuring by banks were initially focused on restructuring of an individual
bank’s exposure, including those towards corporate borrowers. Banks found it difficult to
smoothly design and implement restructuring in cases of exposures with multiple lenders i.e.
consortium finance. Hence a need was felt to devise a system where restructuring needs of large
corporate exposures from multiple banks under consortium/ multiple banking arrangements
could be carried out. This need was in view of the fact that such a restructuring package requires
taking into account different levels of exposures, securities, terms and conditions of different
banks as also the need of a centralised monitoring of implementation of the package. In view of
the difficulties faced by the banks in restructuring of large advances of corporate under
multiple/consortium banking, RBI put in place a scheme of Corporate Debt Restructuring (CDR)
in August 2001 based on the mechanism prevalent in countries like the U.K., Thailand, Korea,
Malaysia, etc. which is a voluntary process of industrial rehabilitation. The CDR framework was
to ensure speedy, cost effective, market friendly, timely and transparent mechanism for
restructuring the corporate debts of viable entities facing problems, outside the purview of BIFR,
DRT and other legal proceedings, for the benefit of all concerned.
Objectives: Preservation of viable corporate who are affected by certain internal & external
factors. CDR aims at minimising the losses to creditors & other stakeholders through an orderly
& coordinated restructuring programme to support continuing economic recovery.
Scope of CDR: The scheme is available to corporate borrowers engaged in any type of activity
subject to the following conditions:
The borrower enjoys credit facilities from more than one bank / FI.
The total outstanding is Rs.10 Crores or above.
[Agrawal et. al., Vol.5 (Iss.2): February, 2017] ISSN- 2350-0530(O), ISSN- 2394-3629(P)
ICV (Index Copernicus Value) 2015: 71.21 IF: 4.321 (CosmosImpactFactor), 2.532 (I2OR)
InfoBase Index IBI Factor 3.86
Http://www.granthaalayah.com ©International Journal of Research - GRANTHAALAYAH [97]
Conditions for Eligibility: Reserve Bank of India has sought to provide some carrots in form of
treatment of assets on the Balance Sheet of Bank. For this purpose, the RBI has also sought to
ensure that it does not become a source of window dressing by Banks or Financial Institutions.
So Corporate Debt Restructuring benefit with regard to assets classification and write offs and
provisioning will be available only if certain conditions are fulfilled. The conditions are:
The restructuring should have been done for the first time only.
The unit should become viable in seven years and repayment period for restructured
debts should not exceed ten years.
Promoter’s sacrifices in the form of writing off of loans from group companies, reduction
of capital, additional funds brought by them should at least 15 percent of the sacrifice
made by the creditors.
Promoters should give personal guarantee except where the unit is affected by external
factors like economic down turn or something which affects the concerned industry.
CDR Structure: It is three tier structures viz
1) Standing Forum: This is the top tier in CDR mechanism comprised of representatives of
all the financial institutions & Banks. It lays down the policies and guidelines to be
followed by the empowered group and CDR cell for debt restructuring.
2) Empowered Group: This group is comprised of the ED level representatives of leading
banks along with ED level representatives of concerned lenders. This group takes
decision of whether to go for the restructuring or not based upon preliminary report
prepared by CDR cell and if yes, then they provide initial guidelines. When final
restructuring plan is prepared by CDR cell the same is again approved by EG.
3) CDR Cell: It is third tier of CDR mechanism. This cell makes the initial scrutiny of the
proposals & if restructuring gets approved this cell makes a detailed plan for
restructuring.
Legitimacy of Referral: After thorough examination of facts and viability of the case a decision
is taken as to whether a case should be referred for restructuring or not.
Legal Basis: The legal basis to the CDR System is provided by the Debtor Creditor Agreement
(DCA) and the Inter-Creditor Agreement (ICA).
6. NPAs: Data Analysis and Findings
6.1.NPAs Data Analysis
A Non-Performing Asset (NPA) is defined as a credit facility in respect of which the interest
and/or instalment of principal has remained 'past due' for a specified period of time. NPA is used
by financial institutions that refer to loans that are in jeopardy of default.
[Agrawal et. al., Vol.5 (Iss.2): February, 2017] ISSN- 2350-0530(O), ISSN- 2394-3629(P)
ICV (Index Copernicus Value) 2015: 71.21 IF: 4.321 (CosmosImpactFactor), 2.532 (I2OR)
InfoBase Index IBI Factor 3.86
Http://www.granthaalayah.com ©International Journal of Research - GRANTHAALAYAH [98]
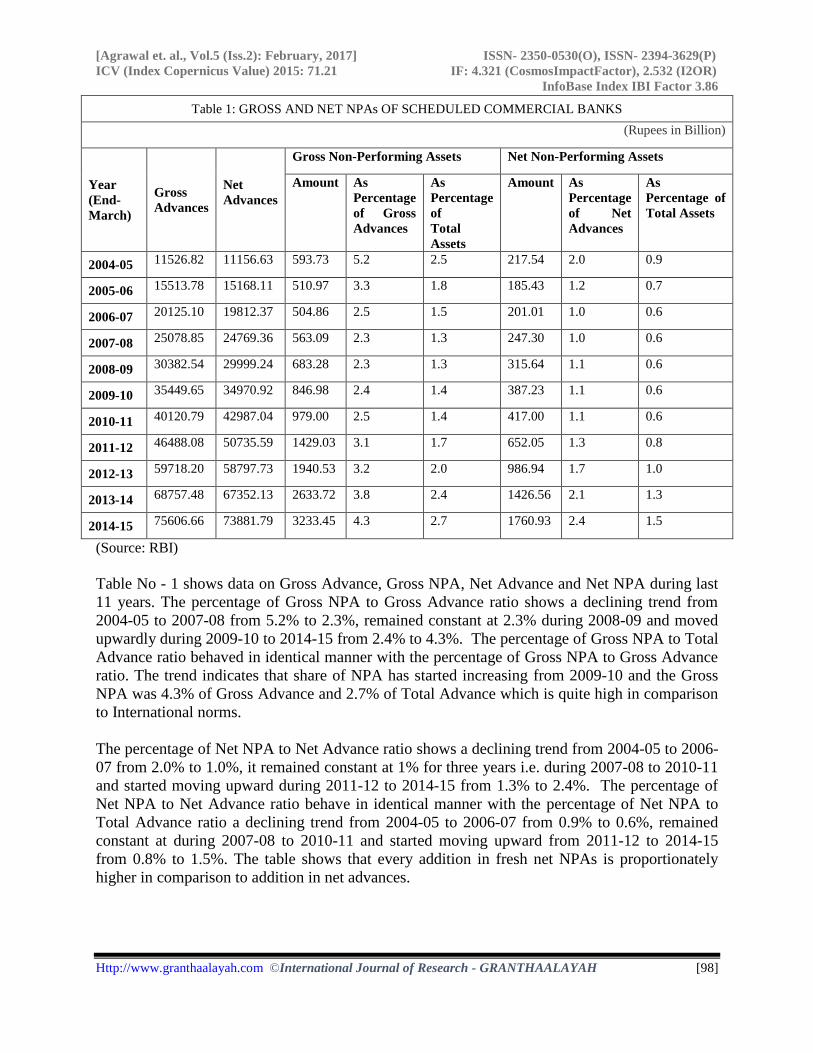
Table 1: GROSS AND NET NPAs OF SCHEDULED COMMERCIAL BANKS
(Rupees in Billion)
Year
(End-
March)
Gross
Advances
Net
Advances
Gross Non-Performing Assets Net Non-Performing Assets
Amount As
Percentage
of Gross
Advances
As
Percentage
of
Total
Assets
Amount As
Percentage
of Net
Advances
As
Percentage of
Total Assets
2004-05 11526.82 11156.63 593.73 5.2 2.5 217.54 2.0 0.9
2005-06 15513.78 15168.11 510.97 3.3 1.8 185.43 1.2 0.7
2006-07 20125.10 19812.37 504.86 2.5 1.5 201.01 1.0 0.6
2007-08 25078.85 24769.36 563.09 2.3 1.3 247.30 1.0 0.6
2008-09 30382.54 29999.24 683.28 2.3 1.3 315.64 1.1 0.6
2009-10 35449.65 34970.92 846.98 2.4 1.4 387.23 1.1 0.6
2010-11 40120.79 42987.04 979.00 2.5 1.4 417.00 1.1 0.6
2011-12 46488.08 50735.59 1429.03 3.1 1.7 652.05 1.3 0.8
2012-13 59718.20 58797.73 1940.53 3.2 2.0 986.94 1.7 1.0
2013-14 68757.48 67352.13 2633.72 3.8 2.4 1426.56 2.1 1.3
2014-15 75606.66 73881.79 3233.45 4.3 2.7 1760.93 2.4 1.5
(Source: RBI)
Table No - 1 shows data on Gross Advance, Gross NPA, Net Advance and Net NPA during last
11 years. The percentage of Gross NPA to Gross Advance ratio shows a declining trend from
2004-05 to 2007-08 from 5.2% to 2.3%, remained constant at 2.3% during 2008-09 and moved
upwardly during 2009-10 to 2014-15 from 2.4% to 4.3%. The percentage of Gross NPA to Total
Advance ratio behaved in identical manner with the percentage of Gross NPA to Gross Advance
ratio. The trend indicates that share of NPA has started increasing from 2009-10 and the Gross
NPA was 4.3% of Gross Advance and 2.7% of Total Advance which is quite high in comparison
to International norms.
The percentage of Net NPA to Net Advance ratio shows a declining trend from 2004-05 to 2006-
07 from 2.0% to 1.0%, it remained constant at 1% for three years i.e. during 2007-08 to 2010-11
and started moving upward during 2011-12 to 2014-15 from 1.3% to 2.4%. The percentage of
Net NPA to Net Advance ratio behave in identical manner with the percentage of Net NPA to
Total Advance ratio a declining trend from 2004-05 to 2006-07 from 0.9% to 0.6%, remained
constant at during 2007-08 to 2010-11 and started moving upward from 2011-12 to 2014-15
from 0.8% to 1.5%. The table shows that every addition in fresh net NPAs is proportionately
higher in comparison to addition in net advances.

[Agrawal et. al., Vol.5 (Iss.2): February, 2017] ISSN- 2350-0530(O), ISSN- 2394-3629(P)
ICV (Index Copernicus Value) 2015: 71.21 IF: 4.321 (CosmosImpactFactor), 2.532 (I2OR)
InfoBase Index IBI Factor 3.86
Http://www.granthaalayah.com ©International Journal of Research - GRANTHAALAYAH [99]
Figure 1:
The entire ratio is behaving identically in this graph. All the ratios are showing a downward
trend during 1996-97 to 2006-07, remained static till 2008-09 and started moving upward during
later part from 2009-10 onwards till 2014-15. The upward movement indicates that the quality of
assets in the Bank Balance Sheet is not up to the standard and due to window dressing the banks
have been able to conceal the true position in their Balance Sheet. But since the problem
remained for a longer period and ultimately the Banks have started to show the true picture
gradually which resulted in upward movement in the chart.
0
1
2
3
4
5
6
Pe
rce
nta
ge
PERCENTAGE OF NPAs TO ADVANCEs
As Percentage of Gross
Advances
As Percentage of
Total Assets
As Percentage of Net
Advances
As Percentage of Total
Assets
Table 2: MOVEMENT OF NON-PERFORMING ASSETS (NPAs) OF SCHEDULED
COMMERCIAL BANKS
(Amount in Millions)
Year
Gross NPAs Growth of Write-off (%)
Growth of
Gross NPA
(%)
As on
March 31
(Previous
Year)
Addition
during the
Year
Reduction
during the
Year
Write-off
during the
Year
As on March
31
(Current
year)
2005
6,43,101.14
2,04,056.04 2,28,790.62
24,631.71
5,93,734.85 0.00% 0.00%
2006
5,83,631.58
2,13,799.04 2,85,951.56
510.75
5,10,968.31 -97.93% -13.94%
2007
5,05,198.31
2,62,114.39 2,61,597.54
849.50
5,04,865.66 66.32% -1.19%
2008
5,01,914.40
3,49,812.00 2,79,467.70
9,167.20
5,63,091.50 979.13% 11.53%
2009
5,48,368.47
5,23,458.69 3,38,706.97
49,838.20
6,83,281.98 443.66% 21.34%
2010
6,82,843.20
6,95,796.97 2,84,213.22
2,47,418.72
8,47,008.23 396.44% 23.96%
2011
8,39,088.53
7,04,398.54 3,31,630.09
2,32,606.97
9,79,250.01 -5.99% 15.61%
2012 4,27,590.26 -13.75% 45.34%
[Agrawal et. al., Vol.5 (Iss.2): February, 2017] ISSN- 2350-0530(O), ISSN- 2394-3629(P)
ICV (Index Copernicus Value) 2015: 71.21 IF: 4.321 (CosmosImpactFactor), 2.532 (I2OR)
InfoBase Index IBI Factor 3.86
Http://www.granthaalayah.com ©International Journal of Research - GRANTHAALAYAH [100]
(Source: RBI)
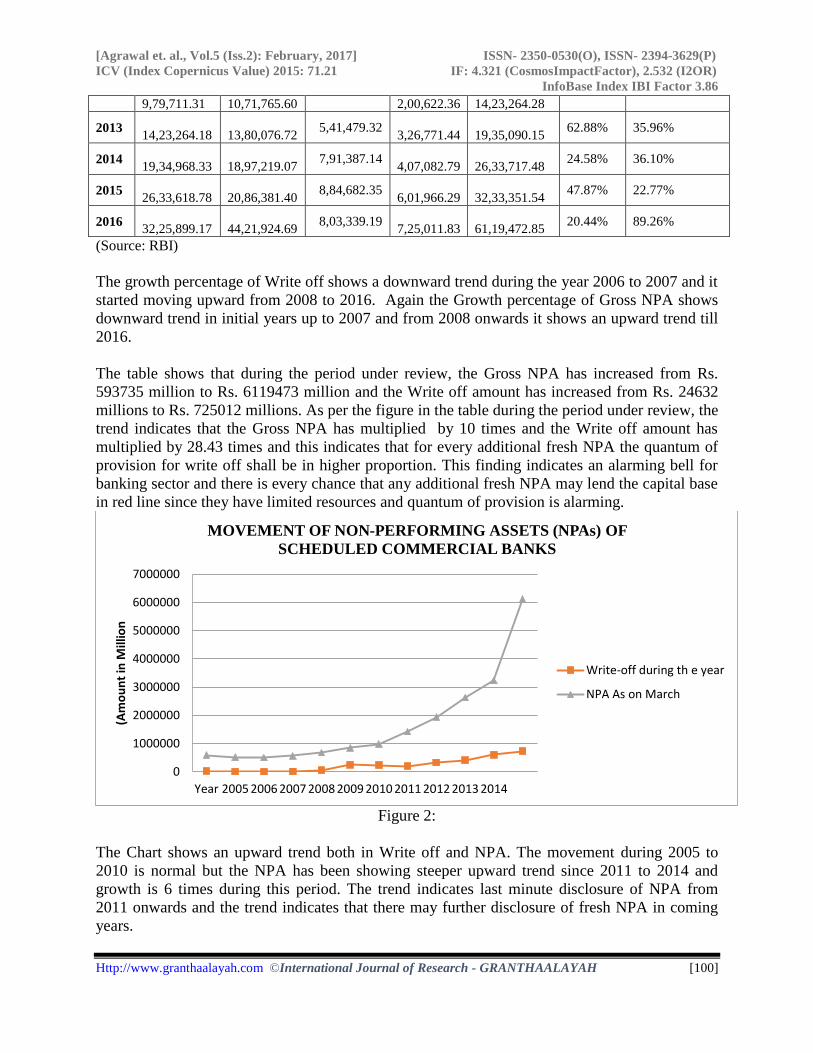
The growth percentage of Write off shows a downward trend during the year 2006 to 2007 and it
started moving upward from 2008 to 2016. Again the Growth percentage of Gross NPA shows
downward trend in initial years up to 2007 and from 2008 onwards it shows an upward trend till
2016.
The table shows that during the period under review, the Gross NPA has increased from Rs.
593735 million to Rs. 6119473 million and the Write off amount has increased from Rs. 24632
millions to Rs. 725012 millions. As per the figure in the table during the period under review, the
trend indicates that the Gross NPA has multiplied by 10 times and the Write off amount has
multiplied by 28.43 times and this indicates that for every additional fresh NPA the quantum of
provision for write off shall be in higher proportion. This finding indicates an alarming bell for
banking sector and there is every chance that any additional fresh NPA may lend the capital base
in red line since they have limited resources and quantum of provision is alarming.
Figure 2:
The Chart shows an upward trend both in Write off and NPA. The movement during 2005 to
2010 is normal but the NPA has been showing steeper upward trend since 2011 to 2014 and
growth is 6 times during this period. The trend indicates last minute disclosure of NPA from
2011 onwards and the trend indicates that there may further disclosure of fresh NPA in coming
years.
0
1000000
2000000
3000000
4000000
5000000
6000000
7000000
Year 2005 2006 2007 2008 2009 2010 2011 2012 2013 2014
(Am
ou
nt
in M
illio
n
MOVEMENT OF NON-PERFORMING ASSETS (NPAs) OF
SCHEDULED COMMERCIAL BANKS
Write-off during th e year
NPA As on March
9,79,711.31 10,71,765.60 2,00,622.36 14,23,264.28
2013
14,23,264.18
13,80,076.72 5,41,479.32
3,26,771.44
19,35,090.15 62.88% 35.96%
2014
19,34,968.33
18,97,219.07 7,91,387.14
4,07,082.79
26,33,717.48 24.58% 36.10%
2015
26,33,618.78
20,86,381.40 8,84,682.35
6,01,966.29
32,33,351.54 47.87% 22.77%
2016
32,25,899.17
44,21,924.69 8,03,339.19
7,25,011.83
61,19,472.85 20.44% 89.26%
[Agrawal et. al., Vol.5 (Iss.2): February, 2017] ISSN- 2350-0530(O), ISSN- 2394-3629(P)
ICV (Index Copernicus Value) 2015: 71.21 IF: 4.321 (CosmosImpactFactor), 2.532 (I2OR)
InfoBase Index IBI Factor 3.86
Http://www.granthaalayah.com ©International Journal of Research - GRANTHAALAYAH [101]
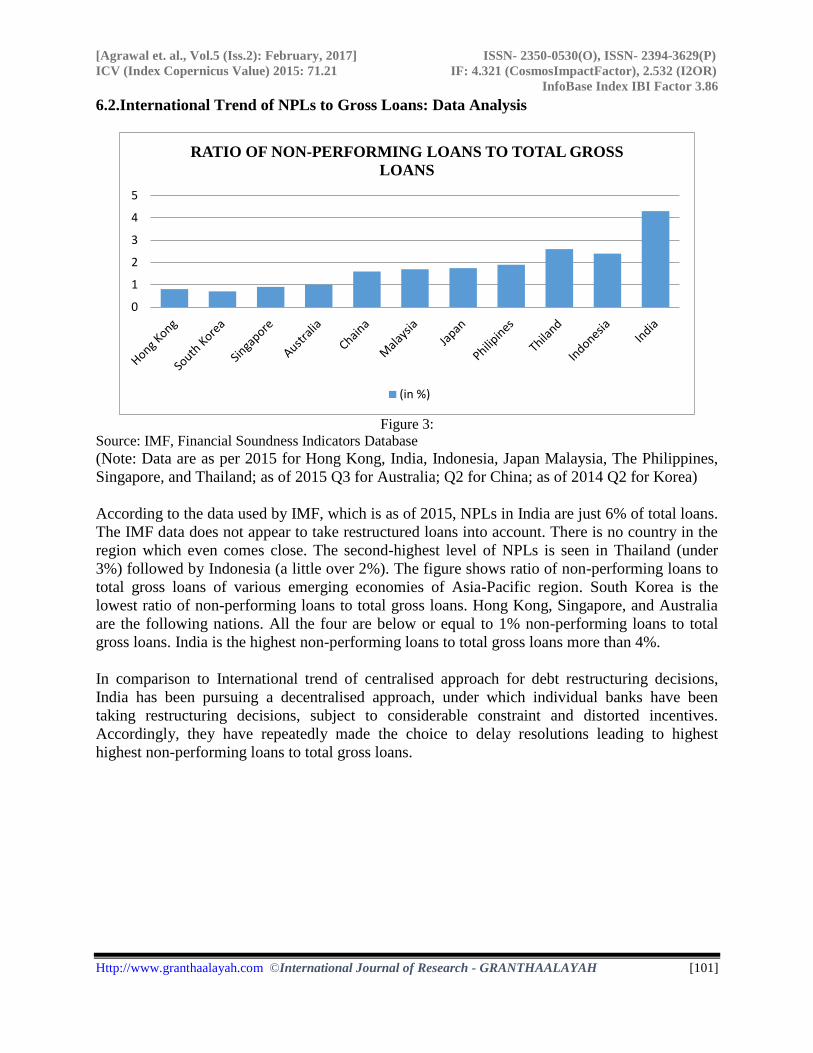
6.2.International Trend of NPLs to Gross Loans: Data Analysis
Figure 3:
Source: IMF, Financial Soundness Indicators Database
(Note: Data are as per 2015 for Hong Kong, India, Indonesia, Japan Malaysia, The Philippines,
Singapore, and Thailand; as of 2015 Q3 for Australia; Q2 for China; as of 2014 Q2 for Korea)
According to the data used by IMF, which is as of 2015, NPLs in India are just 6% of total loans.
The IMF data does not appear to take restructured loans into account. There is no country in the
region which even comes close. The second-highest level of NPLs is seen in Thailand (under
3%) followed by Indonesia (a little over 2%). The figure shows ratio of non-performing loans to
total gross loans of various emerging economies of Asia-Pacific region. South Korea is the
lowest ratio of non-performing loans to total gross loans. Hong Kong, Singapore, and Australia
are the following nations. All the four are below or equal to 1% non-performing loans to total
gross loans. India is the highest non-performing loans to total gross loans more than 4%.
In comparison to International trend of centralised approach for debt restructuring decisions,
India has been pursuing a decentralised approach, under which individual banks have been
taking restructuring decisions, subject to considerable constraint and distorted incentives.
Accordingly, they have repeatedly made the choice to delay resolutions leading to highest
highest non-performing loans to total gross loans.
0
1
2
3
4
5
RATIO OF NON-PERFORMING LOANS TO TOTAL GROSS
LOANS
(in %)

[Agrawal et. al., Vol.5 (Iss.2): February, 2017] ISSN- 2350-0530(O), ISSN- 2394-3629(P)
ICV (Index Copernicus Value) 2015: 71.21 IF: 4.321 (CosmosImpactFactor), 2.532 (I2OR)
InfoBase Index IBI Factor 3.86
Http://www.granthaalayah.com ©International Journal of Research - GRANTHAALAYAH [102]
6.3.Various Recovery Channels of NPAs: Data Analysis
Table 3: NPAs OF SCBs RECOVERED THROUGH VARIOUS CHANNELs - AMOUNT
INVOLVED
Year Lok
Adalats
DRTs SARFAESI
Act
Total Trend of
Lok
Adalats
Trend of
DRTs
Trend of
SARFAESI
Act
(Rs in Billion)
2004-05 8.01 143.17 132.24 283.42 0.00% 0.00% 0.00%
2005-06 11 61 98 170 1.76% -134.70% -34.94%
2006-07 8 92 91 191 -0.01% -83.89% -42.08%
2007-08 21 58 73 152 7.64% -139.62% -60.45%
2008-09 40 41 121 202 18.82% -167.49% -11.47%
2009-10 72 98 142 312 37.64% -74.05% 9.96%
2010-11 1 1 3 5 -4.12% -233.07% -131.88%
2011-12 17 241 353 611 5.29% 160.38% 225.27%
2012-13 66 310 681 1057 34.11% 273.49% 559.96%
2013-14 232 553 953 1738 131.76% 671.85% 837.51%
2014-15 310 604 1568 2482 177.64% 755.46% 1465.06%
2015-16 720 693 801 2214 418.82% 901.36% 682.41%
(Source: RBI)
The table shows trend of amount involved in Lok Adalats, DRTs and SARFAESI Act to Total
Amount during 2004-05 to 2015-16. The trend of Lok Adalats to Total Amount shows an
upward trend from 1.76% to 37.64% during 2005-06 to 2009-10, decreased during 2010-11 and
again moved upward from 2011-12 till 2015-16 and the trend indicates that the amount involved
in Lok Adalats has multiplied by 4 times during the period. The trend of DRTs to Total amount
shows a downward trend during initial period i.e. from 2004-05 to 2010-11 and it moved upward
from 2011-12 to 2015-16 which indicates that the amount involved in the DRT cases have
multiplied by 9 times. Further the trend of SARFAESI Act to Total amount shows a downward
trend during initial period i.e from 2004-05 to 2008-09, remained volatile during 2009-10 and
2010-11 and started moving upward from 2011-12 to 2015-16 which indicates that the amount
involved have multiplied by 7 times.

[Agrawal et. al., Vol.5 (Iss.2): February, 2017] ISSN- 2350-0530(O), ISSN- 2394-3629(P)
ICV (Index Copernicus Value) 2015: 71.21 IF: 4.321 (CosmosImpactFactor), 2.532 (I2OR)
InfoBase Index IBI Factor 3.86
Http://www.granthaalayah.com ©International Journal of Research - GRANTHAALAYAH [103]
Figure 4:
In the figure, the DRTs and SARFAESI Act percentage chart shows a downward trend during
2004-05 to 2010-11 and thereafter a steeper upward trend. The Lok Adalat chart shows a volatile
trend during 2004-05 to 2010-11 and thereafter an upward trend up to 2015-16. The trend in this
figure indicates that there is lower compliance of assets classification and NPA recovery
initiative by bank by way of filling cases in Lok Adalat, DRTs and SARFAESI Act during initial
period.
Table 4: NPAs OF SCBs RECOVERED THROUGH VARIOUS CHANNELs
Amount in Billion Rupees
Year Lok
Adalats DRTs
SARFAESI
Act Total
Lok
Adalats
% to
total
DRTs
% to
total
SARFAESI Act
% to total
2004-05 1.13 26.88 23.91 51.92 2.18% 51.77% 46.05%
2005-06 2 47 34 83 2.41% 56.63% 40.96%
2006-07 1 35 37 73 1.37% 47.95% 50.68%
2007-08 2 30 44 76 2.63% 39.47% 57.89%
2008-09 1 33 40 74 1.35% 44.59% 54.05%
2009-10 1 31 43 75 1.33% 41.33% 57.33%
2010-11 0 0 1 1 0.00% 0.00% 100.00%
2011-12 2 41 101 144 1.39% 28.47% 70.14%
2012-13 4 44 185 233 1.72% 18.88% 79.40%
-400.00%
-200.00%
0.00%
200.00%
400.00%
600.00%
800.00%
1000.00%
1200.00%
1400.00%
1600.00%
Pe
rce
nta
ge
NPAs of SCBs RECOVERED THROUGH VARIOUS CHANNELS-
AMOUNT INVOLVED
Lok Adalats % to total
DRTs % to total
SARFAESI Act % to total

[Agrawal et. al., Vol.5 (Iss.2): February, 2017] ISSN- 2350-0530(O), ISSN- 2394-3629(P)
ICV (Index Copernicus Value) 2015: 71.21 IF: 4.321 (CosmosImpactFactor), 2.532 (I2OR)
InfoBase Index IBI Factor 3.86
Http://www.granthaalayah.com ©International Journal of Research - GRANTHAALAYAH [104]
2013-14 14 53 253 320 4.38% 16.56% 79.06%
2014-15 10 42 256 308 3.25% 13.64% 83.12%
2015-16 32 64 132 228 14.04% 28.07% 57.89%
(Source: RBI)
The trend shows that the Lok Adalats to Total Recovery is static i.e within 2% during the period
from 2004-05 to 2012-13 and from 2013- 14 and has started improving from 2% and the same
was 14.04% in the year 2015-16. The trend of DTRs to Total Recovery shows an upward trend
during 2005-06, remained volatile during 2006-07 to 2010-11, improved during 2011-12,
showed a downward trend from 18.88% to 13.64% and in the year 2015-16 the same is 28.07%.
The trend of SARFAESI Act to Total Recovery shows downward trend during 2005-06, upward
trend during 2006-07 and 2007-08, downward trend during 2008-09, upward during 2009-10 &
2010-11, downward during 2011-12, upward during 2012-13 to 2014-15 and during 2015-16 the
same is 57.89%. The trend indicates that even though no of cases referred are more in case of
Lok Adalats, the share of collection is quite low in comparison to DRTs and SARFAESI Act.
Figure 5:
The graph shows the ratio of recoveries in stresses assets of Bank through various channels. The
graph shows an upward trend during this period which indicates that the recoveries has improved
from Rs. 51.92 billion in 2004-05 to Rs. 228 Billion. It indicates the contribution by recoveries in
Lok Adalats cases is quite negligible in comparison to DRTs and SARFAESI Act recoveries.
The graph further indicates that the recoveries has picked its momentum only after introduction
of SARFAESI Act and with the help of this tool bank have recovered a major share from bad
loans by way of seizure of assets and this has helped banks to show a sizable recovery from NPA
account in their Balance Sheet.
0
50
100
150
200
250
300
NPAs of SCBs RECOVERED THROUGH VARIOUS CHANNELS
Lok Adalats
DRTs
SARFAESI Act

[Agrawal et. al., Vol.5 (Iss.2): February, 2017] ISSN- 2350-0530(O), ISSN- 2394-3629(P)
ICV (Index Copernicus Value) 2015: 71.21 IF: 4.321 (CosmosImpactFactor), 2.532 (I2OR)
InfoBase Index IBI Factor 3.86
Http://www.granthaalayah.com ©International Journal of Research - GRANTHAALAYAH [105]
Table 5: RATIO OF AMOUNT RECOVERED TO AMOUNT INVOLVED THROUGH VARIOUS
CHANNELS
Rupees in Billions
Year Amount Involved Amount Recovered Amount Recovered to
Amount Involved
Lok
Ada
lats
DRTs SARF
AESI
Act
Lok
Adala
ts
DRTs SARFA
ESI Act
Lok
Adalat
s
DRTs SARFA
ESI Act
2004-05 8.01 143.17 132.24 1.13 26.88 23.91 14.11% 18.77% 18.08%
2005-06 11 61 98 2 47 34 18.18% 77.05% 34.69%
2006-07 8 92 91 1 35 37 12.50% 38.04% 40.66%
2007-08 21 58 73 2 30 44 9.52% 51.72% 60.27%
2008-09 40 41 121 1 33 40 2.50% 80.49% 33.06%
2009-10 72 98 142 1 31 43 1.39% 31.63% 30.28%
2010-11 1 1 3 0 0 1 0.00% 0.00% 33.33%
2011-12 17 241 353 2 41 101 11.76% 17.01% 28.61%
2012-13 66 310 681 4 44 185 6.06% 14.19% 27.17%
2013-14 232 553 953 14 53 253 6.03% 9.58% 26.55%
2014-15 310 604 1568 10 42 256 3.23% 6.95% 16.33%
2015-16 720 693 801 32 64 132 4.44% 9.24% 16.48%
(Source: RBI)
The ratio of amount recovered to amount involved during this period of Lok Adalat cases is
between 0% to 18.18%, which is very poor. The ratio of amount recovered to amount involved
during this period of DRTs cases is between 0% to 80.49% which is not quite satisfactory. The
ratio of amount recovered to amount involved during this period of SARFAESI Act cases is
between 16.33% to 60.27%. The trend indicates that recoveries through various channels are not
on the expected lines. It shows recoveries through various channels are not satisfactory and it
leads to conclusion that in such cases major portion off amount involved is remaining unrealised
and thus a loss to Banker and for which a bulk provision has been made in Bank’s Balance
Sheet.
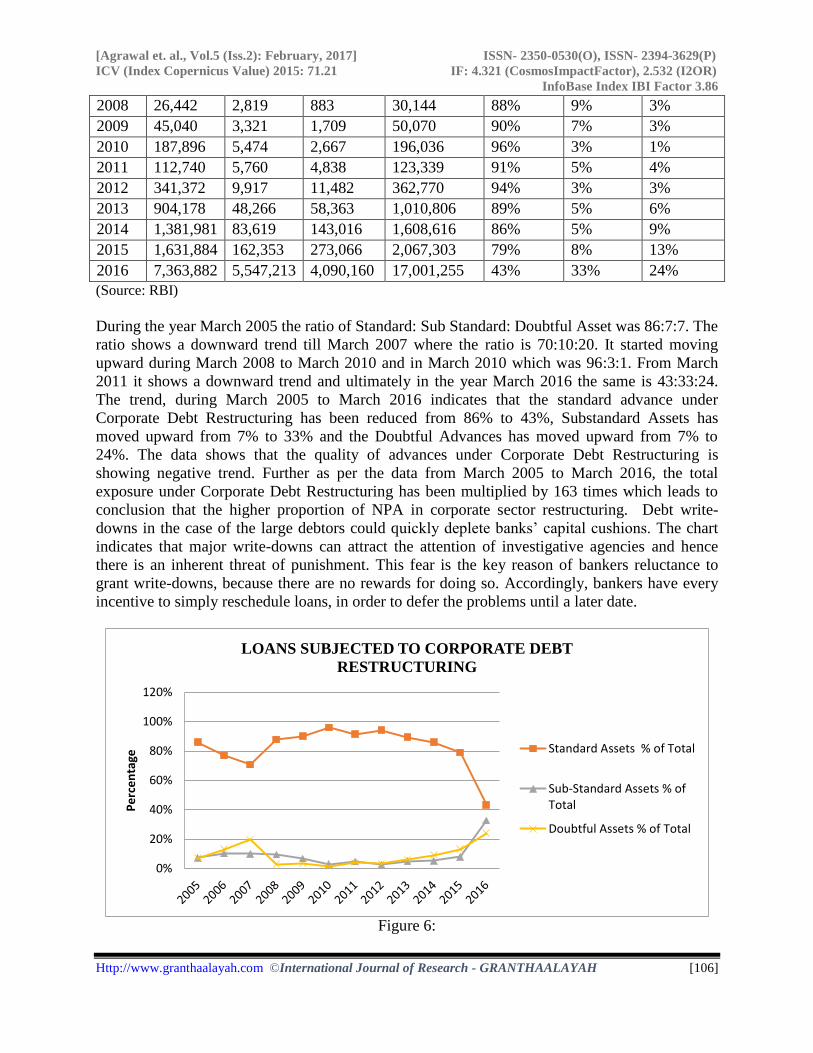
Table 6: LOANS SUBJECTED TO CORPORATE DEBT RESTRUCTURING
(Amount in ` Million)
Year
Standard
Assets
during
the Year
Sub-
Standard
Assets
during
the Year
Doubtful
Assets
during
the Year
Total
Standard
Assets
% of
Total
Sub-
Standard
Assets %
of Total
Doubtful
Assets %
of Total
2005 89,335 7,484 7,160 103,979 86% 7% 7%
2006 36,931 4,832 6,265 48,027 77% 10% 13%
2007 11,470 1,596 3,171 16,237 70% 10% 20%
[Agrawal et. al., Vol.5 (Iss.2): February, 2017] ISSN- 2350-0530(O), ISSN- 2394-3629(P)
ICV (Index Copernicus Value) 2015: 71.21 IF: 4.321 (CosmosImpactFactor), 2.532 (I2OR)
InfoBase Index IBI Factor 3.86
Http://www.granthaalayah.com ©International Journal of Research - GRANTHAALAYAH [106]
2008 26,442 2,819 883 30,144 88% 9% 3%
2009 45,040 3,321 1,709 50,070 90% 7% 3%
2010 187,896 5,474 2,667 196,036 96% 3% 1%
2011 112,740 5,760 4,838 123,339 91% 5% 4%
2012 341,372 9,917 11,482 362,770 94% 3% 3%
2013 904,178 48,266 58,363 1,010,806 89% 5% 6%
2014 1,381,981 83,619 143,016 1,608,616 86% 5% 9%
2015 1,631,884 162,353 273,066 2,067,303 79% 8% 13%
2016 7,363,882 5,547,213 4,090,160 17,001,255 43% 33% 24%
(Source: RBI)
During the year March 2005 the ratio of Standard: Sub Standard: Doubtful Asset was 86:7:7. The
ratio shows a downward trend till March 2007 where the ratio is 70:10:20. It started moving
upward during March 2008 to March 2010 and in March 2010 which was 96:3:1. From March
2011 it shows a downward trend and ultimately in the year March 2016 the same is 43:33:24.
The trend, during March 2005 to March 2016 indicates that the standard advance under
Corporate Debt Restructuring has been reduced from 86% to 43%, Substandard Assets has
moved upward from 7% to 33% and the Doubtful Advances has moved upward from 7% to
24%. The data shows that the quality of advances under Corporate Debt Restructuring is
showing negative trend. Further as per the data from March 2005 to March 2016, the total
exposure under Corporate Debt Restructuring has been multiplied by 163 times which leads to
conclusion that the higher proportion of NPA in corporate sector restructuring. Debt write-
downs in the case of the large debtors could quickly deplete banks’ capital cushions. The chart
indicates that major write-downs can attract the attention of investigative agencies and hence
there is an inherent threat of punishment. This fear is the key reason of bankers reluctance to
grant write-downs, because there are no rewards for doing so. Accordingly, bankers have every
incentive to simply reschedule loans, in order to defer the problems until a later date.
Figure 6:
0%
20%
40%
60%
80%
100%
120%
Pe
rce
nta
ge
LOANS SUBJECTED TO CORPORATE DEBT
RESTRUCTURING
Standard Assets % of Total
Sub-Standard Assets % ofTotal
Doubtful Assets % of Total
[Agrawal et. al., Vol.5 (Iss.2): February, 2017] ISSN- 2350-0530(O), ISSN- 2394-3629(P)
ICV (Index Copernicus Value) 2015: 71.21 IF: 4.321 (CosmosImpactFactor), 2.532 (I2OR)
InfoBase Index IBI Factor 3.86
Http://www.granthaalayah.com ©International Journal of Research - GRANTHAALAYAH [107]
The trend of Standard Advances shows a downward trend during March 2005 to March 2007,
upward trend during March 2008 to March 2009 and thereafter it shows steeper downward trend
which indicates the increase of share of Substandard Assets and Doubtful Assets respectively in
Total Loans subject to Corporate Debt Restructuring. The trend indicates the desired result as
expected under Corporate Debt Restructuring has not been achieved. Further the quality of
Corporate Advances needs proper review and monitoring from an outside independent agency to
keep the same under the control and timely reporting of potential NPAs.
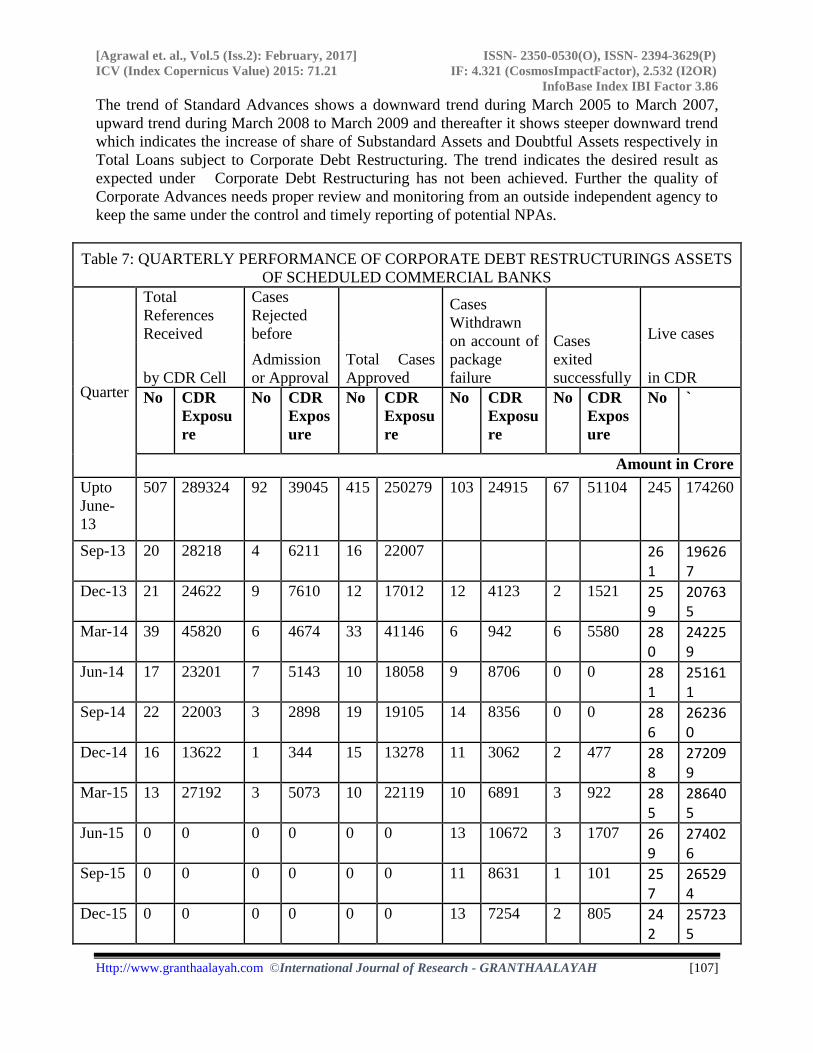
Table 7: QUARTERLY PERFORMANCE OF CORPORATE DEBT RESTRUCTURINGS ASSETS
OF SCHEDULED COMMERCIAL BANKS
Quarter
Total
References
Received
Cases
Rejected
before
Total Cases
Approved
Cases
Withdrawn
on account of
package
failure
Cases
exited
successfully
Live cases
by CDR Cell
Admission
or Approval in CDR
No CDR
Exposu
re
No CDR
Expos
ure
No CDR
Exposu
re
No CDR
Exposu
re
No CDR
Expos
ure
No `
Amount in Crore
Upto
June-
13
507 289324 92 39045 415 250279 103 24915 67 51104 245 174260
Sep-13 20 28218 4 6211 16 22007 261
196267
Dec-13 21 24622 9 7610 12 17012 12 4123 2 1521 259
207635
Mar-14 39 45820 6 4674 33 41146 6 942 6 5580 280
242259
Jun-14 17 23201 7 5143 10 18058 9 8706 0 0 281
251611
Sep-14 22 22003 3 2898 19 19105 14 8356 0 0 286
262360
Dec-14 16 13622 1 344 15 13278 11 3062 2 477 288
272099
Mar-15 13 27192 3 5073 10 22119 10 6891 3 922 285
286405
Jun-15 0 0 0 0 0 0 13 10672 3 1707 269
274026
Sep-15 0 0 0 0 0 0 11 8631 1 101 257
265294
Dec-15 0 0 0 0 0 0 13 7254 2 805 242
257235
[Agrawal et. al., Vol.5 (Iss.2): February, 2017] ISSN- 2350-0530(O), ISSN- 2394-3629(P)
ICV (Index Copernicus Value) 2015: 71.21 IF: 4.321 (CosmosImpactFactor), 2.532 (I2OR)
InfoBase Index IBI Factor 3.86
Http://www.granthaalayah.com ©International Journal of Research - GRANTHAALAYAH [108]
Mar-16 0 0 0 0 0 0 11 5000 0 0 231
252235
Jun-16 0 0 0 0 0 0 15 8690 8 6677 208
236868
Sep-16 0 0 0 0 0 0 20 13530 3 1766 185
221572
Dec-16 0 0 0 0 0 0 16 14321 1 191 168
207060
Total 655 474002
125 70998
530 403004
264 125093 98 70851
(Source: CDR Cell)
As per the data in the table, since March 2015 no fresh proposal has been referred to CDR cell
which means total failure of CDR mechanism. Further As per analysis of data on CDR, the
scenario of CDR as on December 2016 is the total references received by CDR cell 655 cases
amounting to Rs. 4,74,002 Crores out of which 125 no of cases amounting to Rs. 70,998 Crores
has been rejected before admission/ approval (which is about 15% of total amount involved),
Cases withdrawn on account of package failure is 264 number of cases amounting to Rs.
1,25,093 Crores, (which is about 26% of total amount involved), the number of cases
successfully exited from CDR is 98 amounting to Rs. 70,851 Crores (which is about 15% of total
amount involved). Finally there are 168 live cases amounting to Rs. 207060 Crores (which is
about 44% of total amount involved). The data indicates the ratio of success rate of successfully
exit from CDR is 15% of the total amount involved which is very poor in comparison to
recovery of NPAs under other channels like Lok Adalats, DRTs and SAFERASI Act.
7. Reasons of failure of CDR
Among the main reasons for restructuring not working out are the inability of promoters to
infuse the requisite equity capital within the defined period and non-compliance to CDR
agreement in pledging shares in favour of the consortium of lenders. The other reasons are:
Economic Slowdown: One of the common reason is global as well as Indian slowdown.
Slowdown in the economy certainly affects the capacity of the borrowers to repay as it adversely
affects cash flows and profitability, leverage and interest coverage ratio.
1) Adverse Business Environment: Adverse business environment such as an inordinate
delay in execution of Contracts beyond the control of the Companies due to delays by
Government in land acquisition, non-fulfilment of terms by joint venture partners etc.
has also led many debts to stressed debts.
2) The main business of the company is being run without any stake of the borrowers with
help of chain of associate and subsidiaries. The modus is that the entire money belonging
to the shareholders has been taken out and converted to investments.
3) In order to delay the declaration of loss in balance Sheet, Companies used to resort to
imprudent accounting by advancing the revenue or postponing the expenses.
4) Poor planning reflected in mid-stream change in business strategy, Changes in the
original project, Over Ambition, Lack of critical tie ups etc.
5) There is lack of Coordination among the lenders and also lack of due diligence.
[Agrawal et. al., Vol.5 (Iss.2): February, 2017] ISSN- 2350-0530(O), ISSN- 2394-3629(P)
ICV (Index Copernicus Value) 2015: 71.21 IF: 4.321 (CosmosImpactFactor), 2.532 (I2OR)
InfoBase Index IBI Factor 3.86
Http://www.granthaalayah.com ©International Journal of Research - GRANTHAALAYAH [109]
8. Development After CDR
5:25 Scheme In its effort to address one of the major issues affecting the growth of the infrastructure and core
industries, RBI has rolled out with a flexible structuring and refinancing schemes. The scheme is
popularly known as the 5:25. This scheme is basically meant to mitigate the mismatch between
cash flow from Infrastructure projects having longer gestation period. The scheme extend long-
term loans such as of 20-25 years, to match the cash flow of projects, while refinancing them
every five or seven years for long-term infrastructure projects to existing ones where the total
exposure of lenders is more than Rs.500 crore. The scheme is applicable to projects in the
infrastructure and core Industries sector.
Strategic Debt Restructuring Scheme In order to curb the rising bad loans in corporate sector, the RBI in its "Framework for
Revitalizing Distressed Assets in the Economy - Guidelines on Joint Lenders' Forum (JLF) and
Corrective Action Plan (CAP)" has suggested change of management as a part of restructuring of
stressed assets. With this principle in view and to ensure that the shareholders bear the first loss
rather than the debt holders, JLF/ Corporate Debt Restructuring Cell (CDR) may consider the
following options when a loan is restructured:
a) The possibility of transferring equity of the company by promoters to the lenders to
compensate for their sacrifices;
b) Promoters infusing more equity into their companies;
c) Transfer of the promoter holdings to a security trustee or an escrow arrangement till
turnaround of company. This will enable a change in management controlling, should
lenders favour it.
9. Implementation
No loans will be restructured without conforming to the terms specified in the Strategic
Debt Restructuring Scheme.
At the time of initial restructuring, Joint Lender Forums will incorporate, in the terms and
conditions attached to the restructured loan/s agreed with the borrower, an option to
convert the entire loan, or part thereof, into shares in the company in the event the
borrower is not able to achieve the viability milestones.
The bank during initial restructuring will require the borrower to provide the necessary
approvals/authorizations to enable the lenders to exercise the transfer of equity option
effectively, if required.
The decision to convert the whole or part of the loan into equity shares should be well
documented and approved by the majority of the JLF members.
On effecting change in ownership under the Strategic Debt Restructuring Scheme, the
lenders would collectively become the majority shareholder by conversion of their dues
from the borrower into equity.
Hence, post the conversion, all lenders under the JLF will collectively hold 51% or more
of the equity shares issued by the company.
[Agrawal et. al., Vol.5 (Iss.2): February, 2017] ISSN- 2350-0530(O), ISSN- 2394-3629(P)
ICV (Index Copernicus Value) 2015: 71.21 IF: 4.321 (CosmosImpactFactor), 2.532 (I2OR)
InfoBase Index IBI Factor 3.86
Http://www.granthaalayah.com ©International Journal of Research - GRANTHAALAYAH [110]
All banks will include the covenants to exercise the Strategic Debt Restructuring Scheme
in all loan agreements, including restructuring, supported by necessary approvals
/authorizations.
It was billed as a powerful tool in the clean-up Balance Sheets of Banks laden with bad loans,
but subsequently has proved to be a bit of a dud. The main reasons are difficulties in finding
buyers, disagreement over valuations and even the choice of merchant bankers used in the SDR
process seem to be impeding closure. SDR looked quite exciting to begin with, but soon it was
evident that there are no buyers in cases where it was being invoked. Even the buyers that
actually turned up were demanding prices that were completely not matching to finalise the deal.
10. Scheme for Sustainable Structuring of Stressed Assets (S4A Scheme)
In 2016 RBI introduced S4A Scheme. Under Scheme for Sustainable Structuring of Stressed
Assets or S4A, the banks are being allowed to convert up to half their loans of corporations into
equity or equity-like securities. Any project which has commenced commercial operations and
has an overall exposure of more than Rs.500 crore (including unpaid interest) can be brought
under this scheme, with a precondition that the bankers are convinced that the project can service
the debt in the longer run backed by an independent techno-economic viability study to establish
this. The banks will also work under the oversight of an external agency, ensuring transparency.
With the involvement of an independent agency will eliminate the fear of unwarranted scrutiny
by the Central Vigilance Commission and the Central Bureau of Investigation.
S4A does not allow the banks to offer any moratorium on debt repayment, to extend the
repayment schedule or reduce the interest rate. The conversion of debt into equity or quasi-equity
instruments will be governed by prescribed valuation norms. Finally, the banks will have to set
aside money for 20% of the total outstanding debt or 40% of the debt that is seen as
unsustainable.
The scheme is silent about unsecured creditors such as the suppliers of raw materials. Even after
the banks decide to move ahead with this scheme, the unsecured creditors has got the option to
approach a court of law and play spoilsport. Being unsecured creditors, they may not get their
dues, but they can certainly delay the process. Due to unsecured creditors, the banks may lose
time precious for the revival of a company and survival for themselves.
11. Suggestions
Cleaning up of the bank balance sheets is essential and urgent to boost growth in coming
years. High NPAs will squeeze the lending capacity of the banking sector and economic
growth would be hampered.
List of large wilful defaulters should be announced. Exemplary punishment to a few large
defaulters is necessary to drive home the point that nobody can flout the rules for self-
benefit.
There is need to institute an independent loan review mechanism especially for large
borrower accounts to identify potential NPAs.
The concept of a 'Bad Bank' that purchases stressed assets and takes them to resolution
was floated in the latest Economic Survey.

[Agrawal et. al., Vol.5 (Iss.2): February, 2017] ISSN- 2350-0530(O), ISSN- 2394-3629(P)
ICV (Index Copernicus Value) 2015: 71.21 IF: 4.321 (CosmosImpactFactor), 2.532 (I2OR)
InfoBase Index IBI Factor 3.86
Http://www.granthaalayah.com ©International Journal of Research - GRANTHAALAYAH [111]
Sale of Unproductive Assets/ Entities: The emphasis should be to save productive assets
and not the companies or promoters. The sale should not be restricted only to sale of
physical assets, it must also include sale of associates and subsidiaries when huge funds
have been invested in such associates and subsidiaries and the return on such investments
is too low.
Imprudent accounting leaves a question mark on the working of accounting professionals.
Banks may circulate a list of such companies among themselves indicating the
professionals involved, so that the other work done by these professionals is used with
appropriate caution.
Closure of All Accounts outside Consortium: It must be the pre-condition for
implementing the CDR. No concession or additional facilities should be extended unless
all accounts outside consortium have been closed.
12. Conclusion
The poor recovery in CDR indicates that this tool is less viable for bank as recovery mechanism
as compare to other tools of mechanisms. Hence RBI has made necessary changes and come out
with new measures for corporate debts mechanism like SDR and S4A to give necessary teeth to
banks to control rising NPAs in corporate sector. Finally, since the quality of advances in India
particularly the corporate stressed advances are quite poor and huge in comparison to other Asian
Pacific emerging countries, if the NPAs are not managed properly there is every chance that the
capital and reserves of Banks shall not to able to meet the losses arising on account of write off
of Bad Loans.
References
[1] Chavan Pallavi and Gambacorta Leonardo “RBI Working Paper Series No. 09: Bank Lending
And Loan Quality: The Case Of India” (Dec 14, 2016)
[2] Ahamed M. Mostak and Mallick Sushanta “CORPORATE DEBT RESTRUCTURING, BANK
COMPETITION AND STABILITY: EVIDENCE FROM CREDITORS’ PERSPECTIVE” (04
September 2015)
[3] Lokare Shashidhar M. “RBI WORKING PAPER SERIES NO. 03: RE-EMERGING STRESS IN
THE ASSET QUALITY OF INDIAN BANKS: MACRO FINANCIAL LINKAGES” (Feb 07,
2014)
[4] Reddy Prashanth K “A COMPARATIVE STUDY OF NON PERFORMING ASSETS IN INDIA
IN THE GLOBAL CONTEXT - SIMILARITIES AND DISSIMILARITIES, REMEDIAL
MEASURES” October 2002
[5] Gandhi R. “ASSET RECONSTRUCTION AND NPA MANAGEMENT IN INDIA”.
[6] Corporate Debt Structure and the Financial Crisis European Central Bank, 2015 No 1759 /
February 2015
[7] Vig Vikrant “ACCESS TO COLLATERAL AND CORPORATE DEBT STRUCTURE:
EVIDENCE FROM A NATURAL EXPERIMENT” (May 2009)
[8] Karunakar M., Vasuki K. and Saravanan S. “ARE NON - PERFORMING ASSETS GLOOMY
OR GREEDY FROM INDIAN PERSPECTIVE?” (Research Journal of Social Sciences, 3: 4-12,
2008)
[9] Mohan Rakesh, “CAPITAL ACCOUNT LIBERALISATION AND CONDUCT OF
MONETARY POLICY: THE INDIAN EXPERIENCE” (Deputy Governor, Reserve Bank of
India Paris on June 14, 2007
[Agrawal et. al., Vol.5 (Iss.2): February, 2017] ISSN- 2350-0530(O), ISSN- 2394-3629(P)
ICV (Index Copernicus Value) 2015: 71.21 IF: 4.321 (CosmosImpactFactor), 2.532 (I2OR)
InfoBase Index IBI Factor 3.86
Http://www.granthaalayah.com ©International Journal of Research - GRANTHAALAYAH [112]
[10] Lindner Peter and Jung Sung Eun “CORPORATE VULNERABILITIES IN INDIA AND
BANKS' LOAN PERFORMANCE” IMF Working Paper - WP/14/232 (2014)
[11] R. Gandhi “BANKS, DEBT RECOVERY AND REGULATIONS: A SYNERGY” RBI Bulletin
February 2015.
[12] Chung Jae and Ratnovski Lev “BENEFITS AND COSTS OF CORPORATE DEBT
RESTRUCTURING: AN ESTIMATION FOR KOREA” IMF Working Papers- WP/16/204
(October 2016)
[13] Jariwala Parag and Mehta Vikesh “SDR: A BAND-AID FOR A BULLET WOUND” (Jan 2016)
[14] BRICS- Joint Statistical Publication 2014
[15] Sevta Pankaj “CORPORATE DEBT RESTRUCTURING IN INDIA: AN OVERVIEW OF THE
SCHEME” (International Journal Of Research And Analysis Volume 2 Issue 1 2014)
[16] Yadav Dr. Sushama “NPAS: RISING TRENDS AND PREVENTIVE MEASURES IN INDIAN
BANKING SECTORS” (International Journal of Advance Research in Computer Science and
Management Studies, Volume 2, Issue 1, January 2014)
[17] Economic Survey 2016-17
[18] Mohan Rakesh, “FINANCIAL SECTOR REFORMS IN INDIA POLICIES AND
PERFORMANCE ANALYSIS” (Economic and Political Weekly March 19, 2005)
*Corresponding author.
E-mail address: [email protected]


![CHAPTER VIII ECCLESIASTICAL TRIBUNALS, FACULTIES ... · [Ch.8.] 8.1 CHAPTER VIII ECCLESIASTICAL TRIBUNALS, FACULTIES, REGISTRIES _____ 1 Preliminary The tribunals and courts defined](https://img.dokumen.tips/doc/110x75/5f28569df07cce5e7012f180/chapter-viii-ecclesiastical-tribunals-faculties-ch8-81-chapter-viii-ecclesiastical.jpg)