Embed Size (px)
Citation preview

Corporate Annual Report2017–2018
British Columbia Investment Management Corporation

With $145.6 billion of managed assets, British Columbia Investment Management Corporation (BCI) is a leading provider of investment management services to British Columbia’s public sector. We generate the investment returns that help our institutional clients build a financially secure future. With our global outlook, we seek investment opportunities that convert savings into productive capital that will meet our clients’ risk and return requirements over time. We offer investment options across a range of asset classes: fixed income; mortgages; public and private equity; real estate; infrastructure; and renewable resources.
About BCI Contents2017–2018 Investment Highlights ........................................................................ 1
BCI at a Glance ........................................................................................................ 2
Message from the Chair ......................................................................................... 4
Report from the CEO/CIO ...................................................................................... 6
Management’s Discussion and Analysis ......................................................... 9
BCI in Brief ....................................................................................................... 10
Our Clients ....................................................................................................... 12
2017–2018 Key Corporate Accomplishments ............................................. 14
2018–2019 Key Corporate Objectives .......................................................... 15
Investment Returns ........................................................................................ 16
Return Summary for the Combined Pension Plan Clients ........................ 17
Capital Markets Overview .............................................................................. 18
Public Markets ................................................................................................. 19
Fixed Income ............................................................................................ 20
Public Equities .......................................................................................... 21
Private Markets ............................................................................................... 22
Mortgages ................................................................................................. 23
Private Equity ............................................................................................ 24
Infrastructure ........................................................................................... 25
Real Estate ................................................................................................ 26
Renewable Resources .............................................................................27
Risk Management ...........................................................................................28
Responsible Investing ....................................................................................30
Board of Directors .............................................................................................. 31
Our Board of Directors .................................................................................. 32
Corporate Governance ...................................................................................... 35
Our Corporate Governance ........................................................................... 36
Compensation Discussion and Analysis ....................................................... 38
Corporate Financial Statements .................................................................... 47
Our External Managers and Partners ................................................................ 75
Our Executive Management Team ..................................................................... 76

1ANNUAL REPORT 2017–2018
Returned 9.0% against a one-year combined benchmark of 7.4%
Returned 9.9% (annualized) against a five-year combined benchmark of 8.7%
Returned 7.4% (annualized) against a ten-year combined benchmark of 6.8%
$1.9 billion in added value to British Columbia public sector pension plans
$6.6 billion in added value over the 10-year period to British Columbia public sector pension plans
Increased our managed net assets by $10.1 billion — a year-over-year increase of 7.5%
73.3% of assets managed in-house versus 63.5% for the previous year
Committed $11.5 billion to illiquid assets
2017–2018 Investment Highlights

2 ANNUAL REPORT 2017–2018
TOTAL NET ASSETS UNDER MANAGEMENT ($ BILLION)
For the year ended March 31
REGIONAL ALLOCATION OF ASSETS UNDER MANAGEMENT
As at March 31, 20181
CLIENT PROFILE
As at March 31, 20181
BCI at a Glance
1 Percentages based on net assets.
61.3
2000 2001 2002 2003 2004 2005 2006 2007 2008 2009 2010 2011 2012 2013 2014 2015 2016 2017 2018
55.9 59.9 53.262.6 67.3
76.3 83.4 85.074.4 79.7
86.9 92.199.6
110.4123.6 121.9
145.6
135.5
49.0%
5.0%
24.4%
12.7%
8.9%
Canada
U.S.
Europe
EmergingMarkets
Asia
1.5%
1.3%
85.0%
12.2%
Pension Plans
WorkSafeBC Accident Fund
Public Trusts
Government Bodies
Sinking Funds
Government Operating Funds
0.2%0.8%
0.3%

3ANNUAL REPORT 2017–2018
BCI ANNUALIZED PENSION RETURNS
For the periods ended March 31, 2018
CUMULATIVE VALUE ADDED BY BCI ($ BILLION)
Total pension portfolio return minus benchmark return for the periods ended March 31, 2018
ASSETS UNDER MANAGEMENT
For the year ended March 31, 2018 (by asset class)
$ BILLION %
PRIVATE MARKETS
Real Estate 21.1 14.5
Infrastructure 11.6 8.0
Private Equity 10.3 7.1
Mortgages 3.6 2.4
Renewable Resources 2.6 1.8
PUBLIC MARKETS
Public Equities 64.5 44.3
Fixed Income 31.7 21.8
Other Strategies — All Weather 0.2 0.1
Net Assets Under Management 145.6 100.0
8.8%8.1% 7.1%
6.5%7.4%
6.8%
9.9%8.7%9.0%
7.4%
Benchmark
10 Year 20 Year15 Year5 Year1 Year
$1.9
1 Year
$9.8$9.0
$6.6$5.8
10 Year5 Year 20 Year15 Year

4 ANNUAL REPORT 2017–2018
As a board we ensure that BCI maintains sound governance practices and that BCI has the products, services, and people in place to meet the needs of our clients. It is important that we understand the opportunities, as well as challenges, that are present and provide management with the governance and oversight that allows the corporation to adapt and transform.
As BCI continues to grow, our transformation will ensure that we can generate the returns that allow our clients to meet their pension promise and build meaningful financial futures for their beneficiaries. BCI’s executive management team is leading the transition of our investment and operational models — they are introducing more robust investment strategies, diversifying our product line, and building the internal management capabilities that support our new approach.
BCI started as a market-oriented manager that invested primarily in the public markets. In 2001, about 88 per cent of our clients’ assets were invested in fixed income and public equities. Previously, return expectations and market conditions allowed BCI to exceed our clients’ required returns primarily from bonds and stocks. Our portfolio managers successfully replicated public market indices and relied on external advisors, agents and financial intermediaries to invest and manage our clients’ funds in asset classes such as mortgages, private placements, and real estate.
In the formative years, BCI functioned as a “manager of managers.” This meant that our in-house investment team focused on assessing, selecting, and overseeing best-in-class external fund managers. They selected managers with different investment styles to allow clients to take advantage of market cycles to improve portfolio performance. And BCI relied upon a network of specialists knowledgeable about global and regional markets, as well as economic sectors, industries, products and companies, to guide and inform their investment strategies. And looking back, BCI’s approach was considered passive.
Today, about 66 per cent of our clients’ assets are invested in fixed income and public equites and we are operating in markets with different conditions. Over the last three years, expected returns for fixed income have declined by 0.4 per cent and 1.2 per cent for public equities. As we can no longer generate the returns from the public markets with the same confidence, our clients are increasing their exposure to private markets. And to support our clients’ asset mix allocations, BCI is transitioning to an active asset management model.
By comparison, an active asset management model is more dependent on skills and expertise than a passive investment model. As an active manager, our investment professionals’ focus shifts to identifying inefficiencies and value creation opportunities within the public and private markets. In-house investment research, sector knowledge and risk analysis, combined with an agile and decisive team, allows BCI to use their scale to our clients’ advantage by taking bigger equity positions in stable companies, negotiating better terms with business partners, moving swiftly in bidding and closing on transactions, and offering our clients more sophisticated investment vehicles such as derivatives.
Our new investment approach requires a different skillset and talent. And for BCI to attract and retain the required expertise, we need a framework and compensation structure that aligns with, and supports, an active asset management approach. This led the board to review BCI’s compensation framework to ensure that we are competitive and can attract the best talent within the industry.
Message from the Chair

5ANNUAL REPORT 2017–2018
Message from the Chair This year the board completed the review of compensation that began in 2015. While we typically conduct a one-year review every three years, our most recent initiative was more comprehensive and implemented in a phased approach.
The first phase, completed in 2016, focused on job classification, base salary structure, and annual incentive plan changes — shifting to a pay-for-performance compensation approach. The second phase, completed this past year and effective as of April 2017, centered around the long-term incentive plan — designed to aid in the recruitment and retention of senior staff with the skills and experience critical to BCI’s long-term success.
And, as a board, we also concentrated on formalizing our approach to compensation by defining the principles that inform BCI’s new compensation philosophy. The principles-based philosophy emphasizes long-term results and meeting clients’ expectations, and reinforces performance and desired behaviours across all employees. Effective April 1, 2018, the new compensation philosophy provides the framework to validate and align all compensation-related decisions while allowing BCI’s management to respond and adapt when strengthening our talent base.
In closing, I want to acknowledge Cheryl Yaremko, a director whose term ended January 2018, and thank her for her contributions to the board for the past five years and the leadership she provided in her capacity as the chair of the audit committee. I welcome Sheila Taylor, who joined the board in April 2018, bringing financial experience from a broad portfolio during her career in the public service, and Gayle Gorrill, who joined the board in June 2018, contributing her executive experience in finance and operations. Both new board members were appointed by the honourable Minister of Finance.
As chair, I recognize my fellow board members for their dedication and commitment to BCI’s governance. We have a strong board and a very experienced executive management team who are committed to successfully transforming BCI to continue to serve our clients interests in the years to come. Additionally, I want to thank our clients for your continued confidence and support.
Peter Milburn Chair of the BCI Board of Directors

6 ANNUAL REPORT 2017–2018
BCI’s core purpose is to help our clients and their beneficiaries build meaningful futures by ensuring long-term returns are generated from the assets within BCI’s portfolios. Our clients’ long-term perspective drives our outlook, strategies, and approach. Our clients require us to meet, or preferably exceed, their actuarial rates of return that range from 6.0 to 6.6 per cent. To increase the probability of meeting these return requirements, clients are shifting their asset mix — looking more global and to the private markets.
Our efforts are driven by our commitment to meet our clients’ long-term expectations — we continue to transform the way we invest, how we source and negotiate deals, and how we operate. As we continue to source high-quality deals abroad, we are building our reputation as a world-class investor with patient capital to deploy for the long-term. This
past year we rebranded to BCI, to reflect our changing business model and solidify our presence in the industry as a premiere investment partner working in the best interests of our clients.
PERFORMANCE
BCI’s one-year combined pension return was 9.0 per cent against a market benchmark of 7.4 per cent. All asset classes provided a positive contribution to the returns. As a result, BCI generated $1.9 billion in added value for our clients over the one-year period. Due to stronger than expected equity markets, BCI’s public equity program was the primary driver of returns. On average, our global equity program outperformed Canadian equities, reinforcing our clients’ decision to reduce their exposure to Canadian assets in favour of a more globally diversified portfolio. Our private market programs, particularly private equity, infrastructure, and real estate, also drove returns.
Over the past five years, BCI delivered an annualized return of 9.9 per cent against a market benchmark of 8.7 per cent, resulting in a cumulative added value of $5.8 billion for the period. Over 10 years, this cumulative added value grew to $6.6 billion, and the 10-year annualized return was 7.4 per cent against a market benchmark of 6.8 per cent.
BCI has a proud history of exceeding our pension plan clients’ required actuarial rates of return. For fiscal 2018 the required return was 6.3 per cent1, and BCI generated an additional 2.7 per cent — this equates to approximately $3.2 billion for the fiscal year. Returns help our clients build financially secure futures as $75 of every $100 paid to a pensioner is generated by BCI’s investment activity.
TRANSFORMATION
The asset mix determined by our clients plays a significant role in determining the returns. Our job is to work within the asset mix and within the capital markets to deliver the returns our clients seek.
Our investment strategies continue to evolve and embrace changes to the asset mix, active management, and even the introduction of new asset classes. These elements are proving to be essential to increase the probability of meeting our clients’ expected returns.
Report from the CEO/CIO
1 Based on the weighted average of BCI’s six largest pension plan clients for fiscal 2018.

7ANNUAL REPORT 2017–2018
Report from the CEO/CIO BCI is also committed to providing clients with investment management services at a reasonable cost. As costs matter, becoming more cost-effective in our approach and strategies is another way in which we can contribute to our clients’ long-term financial security.
Our new model has different cost drivers and, although our new investment strategy and clients’ shifting asset mix increases fees, BCI continues to be more cost-effective than our Canadian peers2. As we transition the management of the assets in-house and reduce our dependencies on external managers, our clients will benefit from this more cost-effective approach.
STRATEGY IN ACTION
With the foundation of our strategy now firmly established, we are beginning to see the results of the change to our investment strategy and business model. This year we increased our internal asset management to 73.3 per cent compared to 63.5 per cent from the previous year.
By using our competitive advantages as a sophisticated, agile investor with large amounts of capital we are increasing our access to high-quality opportunities. We continue to build strategic partnerships and be more innovative and entrepreneurial when negotiating transactions, setting the terms of these deals while aligning the investment interests of BCI, our investment partners, our portfolio companies, and our clients.
This year we committed $11.5 billion in the illiquid markets — expanding our direct investments and increasing our global exposure. With a more global outlook, we are putting our clients’ capital to work with stable and reliable companies that operate in sectors that we believe to be growing and evolving.
BCI’s private equity program committed more than $3.4 billion in new capital around the world this year. Our team is taking advantage of our new strategy and business model by strengthening existing partnerships and building new ones, giving us better access to high-quality deals. Key transactions for the year included: Hayfin Capital Management LLP, a leading private credit asset manager; a pharmaceuticals manufacturer; and we announced our intention to acquire a significant stake in Refresco Group N.V., a beverage and bottling company, which completed in April 2018.
Our infrastructure program committed $1.5 billion in new capital. The team continues to focus on regulated assets that provide stable cash flow and opportunity for capital appreciation. We directly invested in Nova Transportadora do Sudeste (NTS), a wholesale gas transmission business in Brazil; and Endeavour Energy, the second largest regulated electricity distributor in New South Wales, Australia. Within the infrastructure program, direct investment comprised 82 per cent of the total portfolio at year-end.
QuadReal Property Group, BCI’s real estate company 100 per cent owned by clients, continued internalizing our assets from previous third-party managers. They have assembled world-class real estate expertise with over 860 investment and property professionals solely focused on managing, expanding, and diversifying our clients’ global real estate portfolio. QuadReal committed $2.7 billion to international real estate opportunities this year. The core focus for new development is in industrial, high-density residential, office, and retail properties in major urban centres. Similar to our other direct investments, BCI maintains strategic oversight of QuadReal and is not involved in the day-to-day operations.
A large percentage of our assets under management will remain in public markets — fixed income and public equities — and we are transforming our approach and model here as well. The public markets team is shifting to appropriate strategies that target cost-effective indexing in liquid public equities, while deploying active management in less-efficient markets.
2 CEM Benchmarking: Investment Cost Effectiveness Analysis (for the 5 years ending December 31, 2016).
8 ANNUAL REPORT 2017–2018
Our public markets team transformed the High Yield Bond Fund into the Corporate Bond Fund. The expanded mandate will include U.S. investment grade bonds, provide access to new market opportunities, and add much greater capacity and liquidity.
We also established the Principal Credit Fund which aims to generate higher returns than traditional bonds and take advantage of more illiquid segments of the global credit market. This fund officially launched April 2018.
INDUSTRY EXPERTISE
While our scale gives us access to better investment opportunities, it also makes it possible to attract highly specialized talent. We continue to add the necessary skills and global expertise to our team. Over the year we strengthened our capabilities in data management, tax compliance, risk management, deal negotiation, derivatives, and sector specialization and expertise.
Our co-op and intern program has grown over the last number of years. This year we welcomed 50 new and returning students across the corporation, filling roles on both the investment and operation sides of our business. Our program allows us to capture the best graduates from tertiary institutions across Canada. BCI received two awards for our commitment to co-op education: the 2017 ACE Industry Partner of the Year, and the University of Victoria’s 2017 Employer of the Year — More than 50 employees.
ACKNOWLEDGEMENTS
Daniel Garant joined BCI to lead and take our public markets program forward under our new model. Daniel brings over 20 years of experience in the industry, holding executive-level financial and investment positions. Stefan Dunatov joined as the head of our investment strategy and risk function. Stefan brings extensive experience from within the global capital markets. Michelle Ostermann stepped into the role of leading the consulting and client services department, while Shauna Lukaitis assumed the role of chief operating officer on a permanent basis after successfully filling the role in an acting capacity for the past two years. During the year, Bryan Thomson retired from BCI. We thank him for his contributions in building the public equities program throughout BCI’s history.
At the board level, I would like to thank Cheryl Yaremko, who completed her term in January 2018, for the role she played in BCI’s governance over the past five years. On behalf of BCI, I welcome our new board members Sheila Taylor and Gayle Gorrill, both appointed by the honourable Minister of Finance, who join our board in 2018.
I would also like to take this opportunity to thank our clients and employees. We have accomplished a great deal over the past year, and I acknowledge your ongoing support and commitment to our transformation. Our strategy is ambitious — and necessary — to propel us forward in this dynamic investment environment. I am confident in our direction and progress in transforming to secure meaningful financial futures for our clients.
Gordon J. Fyfe Chief Executive Officer / Chief Investment Officer
8 ANNUAL REPORT 2017–2018
Our public markets team transformed the High Yield Bond Fund into the Corporate Bond Fund. The expanded mandate will include U.S. investment grade bonds, provide access to new market opportunities, and add much greater capacity and liquidity.
We also established the Principal Credit Fund which aims to generate higher returns than traditional bonds and take advantage of more illiquid segments of the global credit market. This fund officially launched April 2018.
INDUSTRY EXPERTISE
While our scale gives us access to better investment opportunities, it also makes it possible to attract highly specialized talent. We continue to add the necessary skills and global expertise to our team. Over the year we strengthened our capabilities in data management, tax compliance, risk management, deal negotiation, derivatives, and sector specialization and expertise.
Our co-op and intern program has grown over the last number of years. This year we welcomed 50 new and returning students across the corporation, filling roles on both the investment and operation sides of our business. Our program allows us to capture the best graduates from tertiary institutions across Canada. BCI received two awards for our commitment to co-op education: the 2017 ACE Industry Partner of the Year, and tied for the University of Victoria’s 2017 Employer of the Year — More than 50 employees.
ACKNOWLEDGEMENTS
Daniel Garant joined BCI to lead and take our public markets program forward under our new model. Daniel brings over 20 years of experience in the industry, holding executive-level financial and investment positions. Stefan Dunatov joined as the head of our investment strategy and risk function. Stefan brings extensive experience from within the global capital markets. Michelle Ostermann stepped into the role of leading the consulting and client services department, while Shauna Lukaitis assumed the role of chief operating officer on a permanent basis after successfully filling the role in an acting capacity for the past two years. During the year, Bryan Thomson retired from BCI. We thank him for his contributions in building the public equities program throughout BCI’s history.
At the board level, I would like to thank Cheryl Yaremko, who completed her term in January 2018, for the role she played in BCI’s governance over the past five years. On behalf of BCI, I welcome our new board members Sheila Taylor and Gayle Gorrill, both appointed by the honourable Minister of Finance, who join our board in 2018.
I would also like to take this opportunity to thank our clients and employees. We have accomplished a great deal over the past year, and I acknowledge your ongoing support and commitment to our transformation. Our strategy is ambitious — and necessary — to propel us forward in this dynamic investment environment. I am confident in our direction and progress in transforming to secure meaningful financial futures for our clients.
Gordon J. Fyfe Chief Executive Officer / Chief Investment Officer

9ANNUAL REPORT 2017–2018
Management’s Discussion and Analysis

10 ANNUAL REPORT 2017–2018
OUR MANDATE BCI provides investment management services to British Columbia’s public sector. We invest our clients’ funds to pay future pensions and other benefits. BCI is responsible for growing long-term client wealth while also protecting the value of their funds. We offer investment products across a wide range of asset classes.
OUR INVESTMENT DISCIPLINE We are legally and contractually required to invest our clients’ funds in their best financial interest — that is our fiduciary responsibility.
We invest for the long-term, utilizing the scale of the assets under management to our advantage. Maintaining our discipline, while focusing on due diligence and diversification, allows us to manage market risks. BCI invests in assets that provide reliable cash flows and will appreciate in value over the long term. We are transforming into an active asset manager that uses more sophisticated strategies to deliver the returns our clients seek.
INVESTMENT BELIEFS Our investment beliefs provide a clear and transparent structure for how we work to achieve our clients’ investment goals. These beliefs influence our views on capital markets, our investment processes, the creation of investment strategies, and our overall approach to managing our clients’ funds.
We believe:
• Having a strategic investment discipline is key We work with our clients to develop a strategic asset mix that is appropriate for their long-term return objectives. We vary our investment holdings and manage investment risk, utilizing financial tools, strategies, and products, seeking investment opportunities that convert savings into productive capital that will meet our clients’ risk and return requirements over time.
• Environmental, social, and governance matters makes a difference BCI brings more than capital to our investments. Our clients share our belief that responsible investing allows us to manage material environmental, social and governance risks, and improve long-term returns. We expect our portfolio companies to create long-term value and focus on stewardship.
• Skills matter Recognizing that skills are the foundation for long-term investment returns, we recruit and retain talented staff with the skills and expertise to provide leadership in investment management and business-related functions.
• Integrity counts BCI’s continued success depends on using our best judgement and making ethical decisions that are aligned with our core values of integrity, accountability, team cohesiveness, and transparency.
Our beliefs guide our team and business. Putting these beliefs into practice is key to delivering results.
OUR VISION
We will be the responsible fund manager of choice for the British Columbia public sector, at the forefront of the industry and consistently exceeding the performance and service expectations of our clients.
OUR MISSION
We are accountable to our clients to provide professional fund management for all asset classes, exercising the highest standards of prudence and fiduciary responsibility. We deliver to our clients the highest return for a given level of risk, at a reasonable cost, while recognizing our responsibility to the broader society through our governance, social and environmental related activities.
OUR VALUES
We live and embrace the values of accountability, transparency, integrity, and team cohesiveness.
BCI in Brief

11ANNUAL REPORT 2017–2018
OUR INVESTMENT FUNDS Our product line has client focused rationale in each fund, which are diversified by asset class. Each fund is expected to provide a different investment outcome for the clients.Like a mutual fund, the pooled fund combines our clients’ contributions and invests in securities and other assets. This structure provides economies of scale, allowing clients to obtain a more diversified portfolio at a lower cost than investing individually. BCI holds all assets in trust; clients do not own the individual assets within BCI’s investment portfolios.
Investing is an intrinsically dynamic activity. As capital markets evolve, we adapt our product line to ensure clients benefit from new investment opportunities. This year we suspended the Indexed European Equity Fund and the Indexed Asian Equity Fund due to underperformance. BCI’s Board approved investment policies for one new fund — the Principal Credit Fund, to capture the illiquidity premium in the fixed income market, which is benchmarked against the S&P/LSTA U.S. Leveraged Loan 100 Index. In addition, the High Yield Bond Fund was restructured to become the Corporate Bond Fund for a greater diversity of fixed income securities. The Corporate Bond Fund is 50 per cent investment grade securities benchmarked against the Bank of America Merrill Lynch US Corporate Index, and 50 percent high yield securities benchmarked against the Bank of America Merrill Lynch BB-B U.S. Cash Pay High Yield Constrained Index. Both benchmarks for the Corporate Bond Fund are hedged to the Canadian dollar.
This fiscal year also saw the restructuring of the enhanced index equity funds to quantitative active funds to identify and capture opportunities for securities that are mispriced relative to the index.
The Enhanced Indexed Canadian Equity Fund was restructured to the Canadian Quantitative Active Equity Fund, which is benchmarked against the S&P/TSX Capped Composite Index. Similarly, the Enhanced Indexed Global Equity Fund was restructured into the Global Quantitative Active Equity Fund, benchmarked against the Morgan Stanley Capital International (MSCI) World ex-Canada Net Index.
OPERATING COSTS The types of assets under management, client-driven changes to asset mix, and our investment strategy affects costs and client fees. Our pension plan and accident fund clients, accounting for almost 97.2 per cent of total assets managed, are moving into more illiquid assets to increase the probability of generating their required long-term actuarial rate of return. And by nature, these assets are more expensive to manage than publicly-traded stocks and bonds.
As returns are reported net of fees and expenses, costs matter. We are moving to a more cost-effective model by managing a greater percentage of assets in-house. BCI is gradually reducing our reliance on external managers.
Enabling a more active and in-house investment approach requires enhanced systems, processes, and specialized expertise. As a result, our operating model is transitioning and will be financially prudent, based on reasonable costs. Cost advantages arise from economies of scale provided by managing $145.6 billion, pooling assets, and managing 73.3 per cent of assets in-house.
This year our operating costs were $416.6 million or 29.6 cents per $100 of assets under management (2016–2017: $311.1 million or 24.2 cents per $100). This consists of internal and external direct costs. Internal costs are directly paid by BCI and includes salaries, rent, operational costs, and consulting fees and represent 42.5 per cent of costs in the fiscal year. External direct costs are directly paid by BCI or pools to third parties to manage assets and include fees to asset managers, auditors, custodian, etc., representing 57.5 per cent in the fiscal year.
We operate on a cost recovery model and do not receive subsidies or financial aid from any third party. We are accountable to our clients for the costs involved in managing their funds.

12 ANNUAL REPORT 2017–2018
BCI began operations under the Public Sector Pension Plans Act in 2000 in order to provide investment services to British Columbia’s public sector. BCI works in the best financial interests of our clients at all times. Our clients are not mandated to use BCI and have voluntarily chosen BCI as their investment manager. BCI has 31 clients as of March 31, 2018.
We invest on behalf of 11 public sector pension plans. As our largest client group, this accounts for approximately 85.0 per cent of the assets under management. Our investment activities help our clients secure the pensions of more than
583,000 plan members in our six largest pension plans alone. Clients establish the investment framework and set the performance targets for their pension fund. They define their personalized long-term strategic asset allocation based on their unique characteristics, circumstances, objectives and risk tolerances. Some plans take greater market and liquidity risk to enhance long-term returns. Returns are important — for every $100 a pension plan member receives in retirement benefits, on average $75 is provided by BCI’s investment activity.
Our Clients
The Municipal Pension Plan has over 320,000 active, inactive, and retired members in B.C. Members come from a variety of sectors across the province, including health, municipalities, and school districts.
The Public Service Pension Plan serves over 122,000 active, inactive, and retired members in B.C.’s public sector.
The Teachers’ Pension Plan has almost 96,000 active, inactive, and retired members from all school districts across B.C.
The College Pension Plan includes over 27,000 active, inactive, and retired members from most of the publicly funded post-secondary institutions in B.C.
The BC Hydro Pension Plan is a single-employer plan that serves eligible employees of BC Hydro. The plan has over 13,000 members.
The WorkSafeBC Pension Plan is a single-employer plan that serves eligible employees of WorkSafeBC. The plan has over 5,500 active, inactive, and retired members.
SIX LARGEST PENSION PLANS

13ANNUAL REPORT 2017–2018
Government bodies account for 13.0 per cent of our assets. We help finance the insurance and benefit funds for over 2.3 million workers in British Columbia. Publicly administered trust funds comprise 1.5 per cent of our assets. Some of these clients prioritize capital protection, while others look for liquidity and short-term performance. Sinking and government operating funds represent 0.5 per cent of our managed assets.
We invest in line with our clients’ investment frameworks and policies, as well as applicable legislation and regulations. BCI is accountable to clients for fund performance, net of all operating costs.
We focus on understanding our clients’ different investment needs — whether managing pension funds on behalf of plan trustees, growing capital reserves for insurance funds, or generating income for trust funds. This includes learning about their investment objectives, liability profile, liquidity needs, and their investment horizon. BCI assists with developing strategies that take into account our clients’ investment objective, risk appetite, and investment beliefs.
Meeting clients’ needs extends beyond putting their funds to work. Our team of investment professionals work closely with trustees to expand their knowledge and understanding of capital markets. BCI offers our major clients educational sessions that include webinars, orientation programs, multi-day training sessions, as well as an annual conference.

14 ANNUAL REPORT 2017–2018
Transition away from external active management and fund-of-funds to more cost-effective investment styles that include internal active management
2017–2018 Key Corporate Accomplishments
• Launched the Canadian Quantitative Active Fund and the Global Quantitative Active Fund
• Implemented various derivative tools to improve efficiencies and execution costs for quantitative funds
• Combined the High Yield Bond Fund with U.S. investment grade bonds to create the Corporate Bond Fund providing access to new opportunities
• Through a structured derivatives program, actively traded a variety of instruments to end the year with over $22 billion of notional derivatives value
Expanding and Diversifying Investment Strategies
Introduce new quantitative active equity funds and wind down existing enhanced indexed equity funds
Continue expansion of the High Yield Bond Fund
Expand the use of tools to improve efficiencies and execution costs such as financial futures and options
• Developed an integrated implementation plan across multiple work streams and departments, that incorporates a robust and incremental implementation approach
• Successful move to new office location at 750 Pandora in March 2018, consolidating staff into a single location
• Further enhanced risk measurement and management capabilities through refined risk measures, analytics and reporting
• Completed the first phase of implementing an improved market risk system
• Implemented straight through processing for equity and fixed income trades enabling higher volumes and reducing trade processing risk due to reduction in manual processes.
• Achieved >97 per cent automation of trade matching
• Launched a technology infrastructure that can grow as the business demands, and performs at a high level
• Established enhanced infrastructure resiliency and more robust disaster recovery capability
Strengthening the Base
Begin replacing investment management platform to reduce operational risk and increase efficiency
Move to new location to accommodate and facilitate new investment approach and expanded team
Continue building investment risk program to support new active in-house asset management model
Implement automated trade matching for public security trades
Transition IT Infrastructure to a hosted, cloud-based model
• Continued the transfer of management for real estate assets and properties from BCI’s former external property managers to QuadReal Property Group
• Operationalized BCI’s oversight of QuadReal Property Group's management of the real estate investments
• Progressed the transition of real estate support functions, such as accounting, from BCI to QuadReal Property Group
Internalizing Asset Management
Continue to move management of real estate assets and properties to QuadReal Property Group
Improve the probability of achieving our clients’ actuarial rates of return
Our team will include highly-skilled and talented investment professionals using quality data, supported by best-in-class technology and following processes aligned with industry best practices

15ANNUAL REPORT 2017–2018
2018–2019 Key Corporate Objectives
Improve the probability of achieving our clients’ actuarial rates of return
• Begin the upgrade of asset liability services to support clients’ strategic investment decisions
• Fully operationalize our derivatives program to provide additional returns via hedging and lower transaction costs
• Expand investment in the Principal Credit and Corporate Bond Funds to enhance clients’ access to diverse products
• Further integrate ESG into investment decisions to align responsible investing, client interests, and long-term investment value, including the Climate Action Plan
Expanding and Diversifying Investment Strategies
Our team will include highly-skilled and talented investment professionals using quality data, supported by best-in-class technology and following processes aligned with industry best practices
• Continue a multi-year program to replace the investment management platform to reduce operational risk and increase efficiency
• Implement a system to capture, manage and report on infrastructure & renewable resources investments
• Further augment the investment risk program to support informed investment decisions
• Improve tailored web-based client portals to deliver timely and responsive client communication
• Improve cyber security program to further protect BCI data
• Develop new approaches and capabilities in IT, Consulting & Client Services, and Public Markets
Strengthening the Base
Transition away from external active management and fund-of-funds to more cost-effective investment styles that include internal active management
• Complete the transition of real estate asset management to QuadReal Property Group
• Continue to transition the highest priority support functions to QuadReal Property Group
• Move towards the three-year plan objective of 30 per cent direct investment for Private Equity
Internalizing Asset Management
16 ANNUAL REPORT 2017–2018
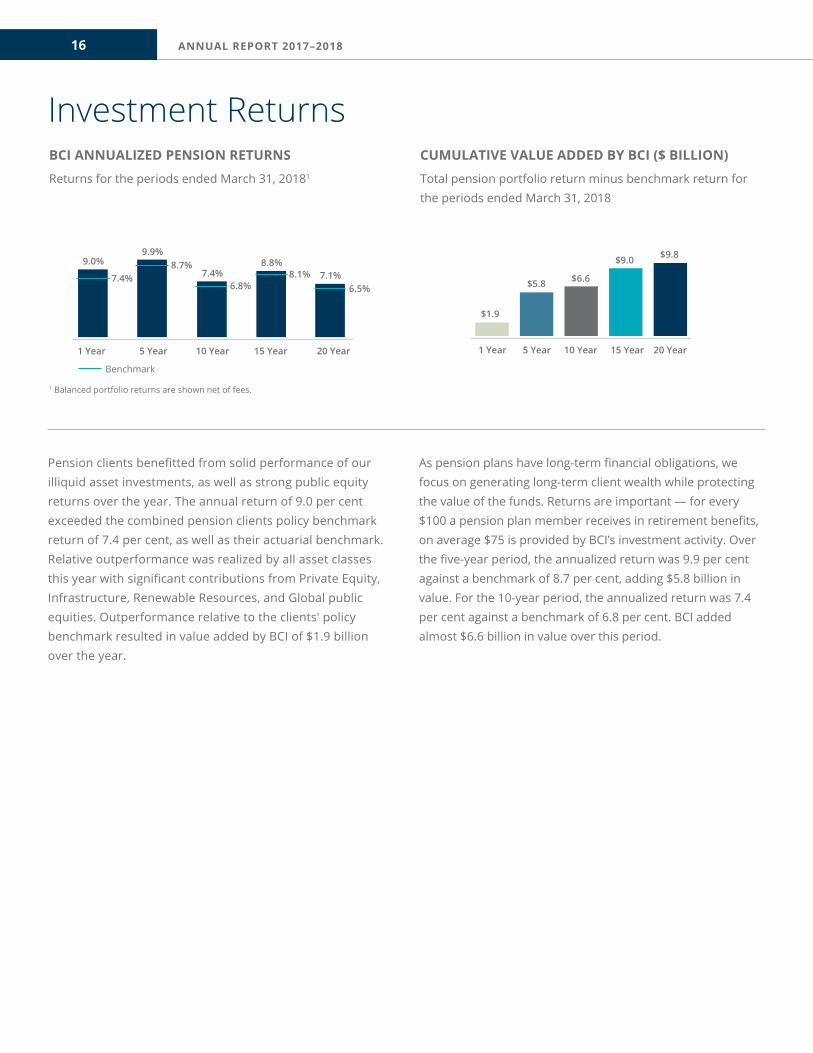
BCI ANNUALIZED PENSION RETURNS
Returns for the periods ended March 31, 20181
Investment ReturnsCUMULATIVE VALUE ADDED BY BCI ($ BILLION)
Total pension portfolio return minus benchmark return for the periods ended March 31, 2018
Pension clients benefitted from solid performance of our illiquid asset investments, as well as strong public equity returns over the year. The annual return of 9.0 per cent exceeded the combined pension clients policy benchmark return of 7.4 per cent, as well as their actuarial benchmark. Relative outperformance was realized by all asset classes this year with significant contributions from Private Equity, Infrastructure, Renewable Resources, and Global public equities. Outperformance relative to the clients' policy benchmark resulted in value added by BCI of $1.9 billion over the year.
As pension plans have long-term financial obligations, we focus on generating long-term client wealth while protecting the value of the funds. Returns are important — for every $100 a pension plan member receives in retirement benefits, on average $75 is provided by BCI’s investment activity. Over the five-year period, the annualized return was 9.9 per cent against a benchmark of 8.7 per cent, adding $5.8 billion in value. For the 10-year period, the annualized return was 7.4 per cent against a benchmark of 6.8 per cent. BCI added almost $6.6 billion in value over this period.
8.8%8.1% 7.1%
6.5%7.4%
6.8%
9.9%8.7%9.0%
7.4%
Benchmark
10 Year 20 Year15 Year5 Year1 Year
$1.9
1 Year
$9.8$9.0
$6.6$5.8
10 Year5 Year 20 Year15 Year
1 Balanced portfolio returns are shown net of fees.

17ANNUAL REPORT 2017–2018
Return Summary for the Combined Pension Plan Clients1
ANNUALIZED RETURNS %
15 YEAR 10 YEAR 5 YEAR 1 YEAR 1 YEAR VALUE-ADDED2 ($M)
PRIVATE MARKETS
Private Equity3 11.4 12.4 19.6 20.0
Benchmark 16.0 13.5 18.0 17.8
Infrastructure3 11.1 10.3 10.2
Benchmark 7.8 7.6 7.0
Renewable Resources3 11.2 15.7
Benchmark 7.0 7.0
Mortgage 5.7 5.3 4.2 3.5
Benchmark 4.3 3.6 2.4 0.8
Real Estate
Domestic Real Estate 9.4 6.2 6.3 5.7
Benchmark 5.7 5.7 5.6 6.3
Global Real Estate3 6.5 4.6 11.7 10.7
Benchmark 8.3 7.9 7.2 7.0
PUBLIC MARKETS
Public Equities
Canadian Public Equity 9.3 4.8 7.5 2.0 45.3
Benchmark 8.9 4.2 6.9 1.6
Global Public Equity 9.3 8.6 15.4 11.6 447.3
Benchmark 9.1 9.1 15.3 10.1
Emerging Markets Public Equity 7.4 10.0 17.9 (272.1)
Benchmark 5.5 10.1 20.8
Fixed Income
Short-Term 2.7 1.9 1.2 1.1 14.3
Benchmark 1.8 1.0 0.7 0.8
Nominal Bonds 5.5 4.8 3.4 1.9 77.2
Benchmark 5.2 4.3 2.9 1.4
Real Return Bonds 5.7 4.5 1.4 3.8 5.7
Benchmark 5.9 4.5 1.6 3.4
Other Strategies — All Weather 3.5 6.2
Benchmark 3.0
Except as otherwise indicated, returns are time-weighted rates of return (TWRR) as at March 31, 2018. All returns are net of fees.
Investments are reported by programs within the asset classes as set out in the clients’ Statement of Investment Policies & Procedures (SIPP). Benchmarks represent a weighted combination of multiple indices as specified in the clients’ SIPP. The indices may vary over time.
1 The Combined Pension Plan Client reflects the investments of BCI’s six largest Pension Clients, namely: BC Hydro Pension Plan; College Pension Plan; Municipal Pension Plan; Public Service Pension Plan; Teachers’ Pension Plan; and WorkSafeBC Pension Plan.2 Value-added is calculated as the monthly excess return multiplied by the monthly opening market value, as such it is reported for Public Market assets only.3 An internal rate of return methodology is used to calculate returns for Private Equity, Infrastructure, Renewable Resources, and Global Real Estate assets. The returns and benchmarks are as at December 31, 2017. Benchmarks are presented on a TWRR basis.

18 ANNUAL REPORT 2017–2018
CAPITAL MARKET INDEX RETURNS2
Capital Markets OverviewFiscal year April 1, 2017–March 31, 2018
This was another positive year for most equity markets and major indices reached new highs. Simultaneous global economic expansion, expansionary fiscal policy in the U.S., and still-elevated levels of monetary stimulus across major economies helped maintain favourable market sentiment.
The euro area1 benefitted from an increase in global trade and strong labour markets, while the U.K. economy continued to suffer amidst Brexit uncertainty. The passing of the Tax and Job Act and the Bipartisan Budget Act in the U.S. set the stage for additional stimulus in a period of accommodative monetary policy. The Chinese economy beat expectations, despite growing fears over potential consequences of rapid credit growth. Other emerging markets performed well, as India recovered from transitory shocks and Brazil exited a deep recession. Amid this backdrop, as well as firm commodity prices, emerging market equities outperformed with a 20.8 per cent return.
In Canada, the economy had a good showing early in the year with broad-based growth as the effects of the decline in investment in the energy sector diminished. Activity in the Canadian housing market remained robust; however, the impact of various provincial and federal policy measures started to weigh on the market. Elevated consumer debt levels remained a concern for the Bank of Canada as it considers further rate increases with inflation at target. With growth slowing through the remainder of the fiscal year,
and uncertainty surrounding NAFTA negotiations, Canadian equities and the Canadian dollar underperformed relative to the United States. The Canadian stock index barely beat the Canadian bond index — a composite of federal, provincial, and local government bonds — with a 1.7 per cent return (compared to 1.4 per cent).
Geopolitical tensions remained high late in the year as U.S. trade policy introduced fears of a protracted trade war that could potentially derail the global expansion. The tone in NAFTA negotiations became more productive as fiscal 2018 closed and the more punitive trade measures proposed by the U.S. government had yet to be implemented. However, trade risks remain given the recent volatility in U.S. trade policy.
Despite uncertainty, volatility was muted as the macroeconomic backdrop remained constructive; yet returned late in the fiscal year. Concerns of rising inflation in the U.S., amidst inflationary fiscal policy, sparked fears of a faster path of rate increases, while challenges in the technology sector, a significant component of major equity indices, sustained volatility at levels not seen since 2015.
High valuations in illiquid markets persist, including in private equity and infrastructure markets where record levels of capital are increasing competition for high-quality assets as institutional investors search for yield. Real estate markets, particularly in North America, remain generally healthy.
1 Euro area includes: Austria; Belgium; Cyprus; Estonia; Finland; France; Germany; Greece; Ireland; Italy; Latvia; Lithuania; Luxembourg; Malta; Netherlands; Portugal; Slovakia; Slovenia; Spain.
FTSE TMX Cda 91 Day T-Bill
FTSE TMX Cda Bond Universe
S&P/TSX Composite
MSCI World ex-Canada
MSCI Emerging Markets
MSCI AC World + 2%
Real Estate CPI+4%
1.7%
10.1%
20.8%
13.0%
6.3%
1.4%
0.8%
2 Index returns correspond to client benchmarks, are on a fiscal year basis and in Canadian dollar terms.

19ANNUAL REPORT 2017–2018
Management’s Discussion and Analysis
Public MarketsThe Public Markets program manages a portfolio of fixed income and equity investments representing $96.4 billion and totalling 66.2 per cent of BCI’s assets under management. We invest in Canada, the U.S., and internationally in developed and emerging markets utilizing index and active management strategies. Assets are managed internally and by external managers using a diverse mix of financial instruments including derivatives.
For the first time since the financial crisis, the global economy showed surprising resilience and delivered strong economic growth across many nations in the latter half of 2017. A strong labour market and surging optimism led consumers and businesses to spend confidently, resulting in a virtuous cycle. This confidence was supported by central banks providing ample liquidity to the market resulting in historically low interest rates.
With a change in economic conditions, central bankers began the process of “normalizing” interest rates. Leading the way was the U.S. Federal Reserve, which increased rates four times over the fiscal year and began unwinding their massive balance sheet. Canada also reversed the two emergency cuts, provided a few years ago, as a result of being one of the fastest growing industrial economies in 2017. Encouraged by the health of the European economy, beginning in January 2018 the European Central Bank announced plans to halve its monthly quantitative easing purchases.
An already strong U.S. equity market, benefitting from a favourable economic landscape and growing corporate earnings, soared in the latter half of the fiscal year as the U.S. passed a budget with fiscal stimulus. As a consequence, U.S. 10-year bond yields, a key rate for many loans, started rising after being range bound for some time.
As 2017 came to a close, the U.S. stock market rose further into record territory as a tax reform bill was passed. 10-year bond yields then began trending toward the psychologically significant three per cent threshold as concerns over inflation became more credible, threats of a global trade war gathered momentum, and the U.S. Federal Reserve signaled more rate hikes were imminent. After years in exile, these factors caused market volatility to return and put an abrupt end to the tranquility equity markets had become accustomed to. The S&P500 suffered its first correction, a 10 per cent drop from a peak, for the first time in two years and bond market prices suffered as interest rates rose.
The return of volatility signified an important inflection point for investor psychology. Such bouts of volatility are welcome news for active and long-term investors, such as BCI, who are often well positioned to capitalize on such turmoil.
20 ANNUAL REPORT 2017–2018
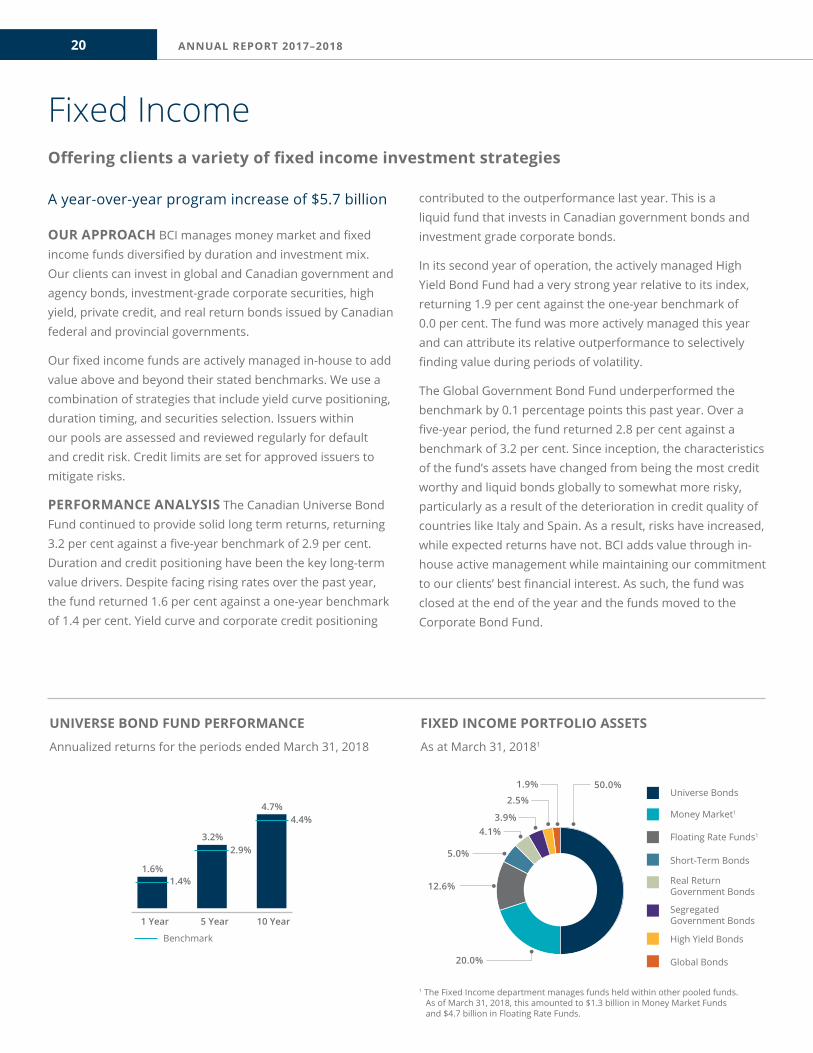
UNIVERSE BOND FUND PERFORMANCE
Annualized returns for the periods ended March 31, 2018
Fixed IncomeOffering clients a variety of fixed income investment strategies
FIXED INCOME PORTFOLIO ASSETS
As at March 31, 20181
A year-over-year program increase of $5.7 billion
OUR APPROACH BCI manages money market and fixed income funds diversified by duration and investment mix. Our clients can invest in global and Canadian government and agency bonds, investment-grade corporate securities, high yield, private credit, and real return bonds issued by Canadian federal and provincial governments.
Our fixed income funds are actively managed in-house to add value above and beyond their stated benchmarks. We use a combination of strategies that include yield curve positioning, duration timing, and securities selection. Issuers within our pools are assessed and reviewed regularly for default and credit risk. Credit limits are set for approved issuers to mitigate risks.
PERFORMANCE ANALYSIS The Canadian Universe Bond Fund continued to provide solid long term returns, returning 3.2 per cent against a five-year benchmark of 2.9 per cent. Duration and credit positioning have been the key long-term value drivers. Despite facing rising rates over the past year, the fund returned 1.6 per cent against a one-year benchmark of 1.4 per cent. Yield curve and corporate credit positioning
contributed to the outperformance last year. This is a liquid fund that invests in Canadian government bonds and investment grade corporate bonds.
In its second year of operation, the actively managed High Yield Bond Fund had a very strong year relative to its index, returning 1.9 per cent against the one-year benchmark of 0.0 per cent. The fund was more actively managed this year and can attribute its relative outperformance to selectively finding value during periods of volatility.
The Global Government Bond Fund underperformed the benchmark by 0.1 percentage points this past year. Over a five-year period, the fund returned 2.8 per cent against a benchmark of 3.2 per cent. Since inception, the characteristics of the fund’s assets have changed from being the most credit worthy and liquid bonds globally to somewhat more risky, particularly as a result of the deterioration in credit quality of countries like Italy and Spain. As a result, risks have increased, while expected returns have not. BCI adds value through in-house active management while maintaining our commitment to our clients’ best financial interest. As such, the fund was closed at the end of the year and the funds moved to the Corporate Bond Fund.
50.0%1.9%
2.5%
3.9%4.1%
20.0%
12.6%
5.0%
Universe Bonds
Money Market1
Floating Rate Funds1
SegregatedGovernment Bonds
Short-Term Bonds
Real ReturnGovernment Bonds
High Yield Bonds
Global Bonds
4.7%4.4%
3.2%2.9%
1.6%1.4%
Benchmark
10 Year5 Year1 Year
1 The Fixed Income department manages funds held within other pooled funds. As of March 31, 2018, this amounted to $1.3 billion in Money Market Funds and $4.7 billion in Floating Rate Funds.

21ANNUAL REPORT 2017–2018
ACTIVE CANADIAN SMALL CAP EQUITY FUND PERFORMANCE
Annualized returns for the periods ended March 31, 2018
REGIONAL ALLOCATION OF PUBLIC EQUITIES
As at March 31, 2018
Public EquitiesA portfolio positioned to capture global growth and income opportunities
Total program assets are $64.5 billion
OUR APPROACH BCI is a long-term investor with a portfolio positioned to capture global economic growth and income opportunities. Our pooled funds are diversified by region and investment style. We adhere to appropriate strategies and use derivative instruments to improve efficiencies and execution costs.
Indexed funds, managed internally, provide clients with direct and low-cost exposure to portfolios that closely match a benchmark index. Active funds, with a higher risk profile, offer the highest potential returns through individual stock selection. Our external managers with diverse investment styles oversee these funds.
We use appropriate strategies targeting cost-effective indexing in efficient public markets and active management in less efficient markets to increase the opportunity for value creation.
PERFORMANCE ANALYSIS For the year, the Active Canadian Small Cap Fund, which includes an internally managed portfolio, outperformed its benchmark by 11.7 percentage points. A disciplined investment process, reliant upon identifying firms that thrive, while avoiding those facing headwinds, coupled with constructing a portfolio that adequately balances risk and reward was critical in its success.
Positive performance during the year led to additional capital being added to the fund. Further capital will be deployed as opportunities arise.
Over the long term, our Active Canadian Equity Fund beat its benchmark, returning 8.7 per cent against a five-year benchmark of 6.9 per cent. Looking at the short-term, the fund missed its one-year benchmark by 0.2 percentage points and returned 1.5 per cent.
Our Active Emerging Equity Fund exceeded its 10-year benchmark and returned 5.5 per cent against a benchmark of 5.4 per cent. While over the shorter term the fund underperformed, returning 17.5 per cent relative to a one-year benchmark of 20.8 per cent. Typically, when emerging markets perform this strongly, active managers lag the benchmark. During the year, the fund improved its composition by realigning its regional allocation and is currently in the midst of streamlining the fund’s structure. The fund notably removed its exposure to Brazil from its Latin American mandate.
Good stock selection in technology and healthcare sectors led to the Active Global Equity Fund performing well this past year. The fund surpassed its benchmark both on a short-term and long-term basis returning 13.2 per cent against a one-year benchmark of 10.1 per cent and 15.5 per cent against a five-year benchmark of 15.4 per cent.
34.5%7.5%
22.8%
20.6%
14.6%U.S.
Canada
Europe
Emerging Markets
Asia
7.6%
0.5%
Benchmark
9.9%
1 Year 5 Year 10 Year
3.5%
(6.6%)
5.1%

22 ANNUAL REPORT 2017–2018
Private MarketsBCI invests the funds not currently required by our clients to pay pensions and other benefits. Clients are increasing their exposure to asset classes that are illiquid and longer term in nature.
We invest in quality assets and stable companies with the potential to appreciate in value and provide reliable cash flows in the years to come. Our outlook, strategies, and approach is driven by longer term considerations. Our investments are diversified by style, duration and region. BCI’s clients have exposure to Canada, the U.S., Europe, Asia, and emerging markets. We favour direct investments as they allow for a closer alignment of interests with our outlook and those of our clients.
BCI’s private market programs account for $49.2 billion or 33.8 per cent of total assets under management and include: infrastructure, mortgages, private equity, real estate and renewable resource.
Fundraising in private markets has reached record levels. For 2017, nearly $750 billion was raised globally by private asset managers, while the amount of uncommitted capital rose to $1.8 trillion1. With capital continuing to flow in, as institutional investors search for yield, competition has driven up prices across private asset classes. In private equity, the trend has been for greater consolidation into larger funds, while infrastructure and renewable funds have been increasingly targeted towards brownfield investments. While overall fundraising has increased in the real estate sector, funds have flowed out of closed-end funds and investors are increasingly looking at real estate as a source of income rather than a source to generate excess returns.
1 The rise and rise of private markets. McKinsey Global Private Markets Review 2018. McKinsey&Company.

23ANNUAL REPORT 2017–2018
MortgagesProviding financing for commercial real estate in Canada and the U.S.
Commitments totaled $3.6 billion for the year ended March 31, 20181
PERFORMANCE ANALYSIS The Canadian market saw increasing competition from banks, insurance companies and unregulated private debt capital over the past year. Canadian banks were active in construction lending for multi-family, retail, industrial, and office assets. Ontario and British Columbia were two of the most active markets in Canada for lenders, while Alberta lagged as a result of continuing excess supply. Major urban areas in Canada remain the most desirable for investors. The U.S. market also saw increased competition and strong capital flows contributed to compressed mortgages spreads during the year, particularly related to conservative mortgages. Debt funds were active and gained traction based on the increased regulations and capital requirements on U.S. and foreign financial institutions. Investors have taken a greater interest in debt to diversify their interests and to capitalize on strong risk-adjusted returns.
Our Fixed-Term Mortgage Fund, which primarily provides first secured financing for income-producing commercial real estate, returned 1.8 per cent over a one-year period against a benchmark of 0.6 per cent. Attractive opportunities and maintaining a short duration, in addition to strong deal selection with no loan losses for the past fiscal year,
contributed to its outperformance. Over a 15-year period, the fund returned 5.3 per cent against a benchmark of 4.6 per cent.
The Construction Mortgage Fund, which finances commercial developments, had another strong year. The fund returned 4.3 per cent against a benchmark of 1.5 per cent. Premium lending fees and rates combined with no required loan loss provisions contributed to the fund’s outperformance. Over a 15-year period, performance remained positive, returning 5.4 per cent against a benchmark of 3.2 per cent.
Our Mezzanine Mortgage Fund finances high loan-to-value loans offered to commercial developers and property owners. The fund returned 9.2 per cent against a one-year benchmark of 3.1 per cent. Premium lending fees and rates combined with no required loan loss provisions contributed to the fund’s outperformance. Over a 15-year period, the fund returned 9.1 per cent against a benchmark of 4.7 per cent.
The U.S. Mortgage Opportunity Fund, launched in the previous fiscal year, finances commercial and multi-residential properties in the United States. The fund had very strong performance, returning 5.2 per cent against a benchmark of (0.9) per cent for the partial year ended December 31, 20172. The fund committed about $840 million through both fund and direct investments for the reporting year. Changes in the U.S. mortgage market coupled with significantly higher returns from two major assets contributed to the outperformance.
FIXED TERM MORTGAGE FUND PERFORMANCE
Annualized returns for the periods ended March 31, 2018
MORTGAGE HOLDINGS BY PROPERTY TYPE
As at March 31, 2018
5.9%
5.2%5.3%
4.6%4.8%
3.9%3.1%
2.6%1.8%
0.6%
Benchmark
10 Year5 Year 20 Year15 Year1 Year
1 Reflects the domestic and U.S. commitments made in BCI's fiscal year, April 1, 2017 – March 31, 2018. Note: The U.S. Mortgage Opportunity Fund returns are reported for the calendar year ending December 31, 2017. 2 Program and benchmark periods are less than one full year. The performance and benchmark is prorated.
40.7%1.1%
3.6%
4.0%
0.4%
4.0%
27.6%
13.1%
5.5%
Residential
Office
Retail
Industrial
Land
Farm Land
Various Asset Types — Fund
Mixed
Hospitality

24 ANNUAL REPORT 2017–2018
PRIVATE EQUITY PROGRAM PERFORMANCE
Annualized returns for the periods ended December 31, 20171
Private EquityProviding long-term capital to privately financed investments across the globe
REGIONAL DISTRIBUTION OF PRIVATE EQUITY PROGRAM
As at December 31, 20171
Committed $3.4 billion for the year ended December 31, 2017
PERFORMANCE ANALYSIS The global private equity market reached historic levels in 2017, presenting a strong sellers market. The competition for high-quality assets, coupled with accommodating debt terms, added further pressures to an already tight market space. The competitive environment, with the potential for reduced returns, required increased diligence in assessing deal opportunities.
During 2017, we committed approximately $2.5 billion to 13 new fund investments with external managers that we consider to be strategic partners. We continue to focus on strategic relationships and partners, in identified sectors, that will provide us with strong returns and potential co-investment opportunities. We divested 20 fund investments that no longer aligned with our program strategy.
Focusing on our strategy, we committed approximately $950 million to new co-investments. Notable transactions included: Hayfin Capital Management LLP, a leading private credit asset manager; a pharmaceuticals manufacturer; and we announced our intention to acquire a significant stake in
Refresco Group N.V., a beverage and bottling company — the transaction closed in April 2018. As an active investment manager, our focus continues to be on increasing our co-investment opportunities and transitioning to more in-house asset management.
The program experienced solid one-year returns of 19.9 per cent (unaudited) against a benchmark of 17.5 per cent for the year ended December 31, 2017. Increased company valuations and the sale of non-core assets in a seller’s market contributed positively to returns.
The fund performed well on a multi-year basis, exceeding our five-year benchmark of 17.8 percent with unaudited returns of 19.5 per cent. Strong valuations, company distributions, and a substantial positive foreign exchange impact contributed to the outperformance. Ten year program returns are slightly below benchmark, however, the gap continues to narrow. Co-investments have consistently outperformed fund investments across all periods. This consistent outperformance is a primary driver of our strategy to expand our co-investment program and increase in-house asset management.
Benchmark
10.0%
13.5%11.5%
15.9%13.4%
12.2%
19.5%
17.8%
19.9%
10 Year5 Year 20 Year15 Year1 Year
17.5% 44.6%5.1%
3.5%
27.9%
18.9%U.S.
Europe
Emerging Markets
Asia
Canada
1 Assets in the private equity program are valued annually at December 31, and are measured on an internal rate of return basis.

25ANNUAL REPORT 2017–2018
INFRASTRUCTURE PROGRAM PERFORMANCE
Annualized returns for the periods ended December 31, 20171
InfrastructureManaging a $11.6 billion portfolio diversified by geographic region and sector
REGIONAL DISTRIBUTION OF INFRASTRUCTURE PROGRAM
As at December 31, 20171
A year-over-year increase of $0.6 billion
PERFORMANCE ANALYSIS BCI invests in privately-owned and managed infrastructure companies that operate in stable regulatory environments and provide reliable cash flows. 2017 was an active year for infrastructure investors globally. Capital availability in the market paired with limited quality assets resulted in a decrease in the number and aggregate value of transactions completed compared to the previous year. A highly competitive market drove up prices of assets making due diligence increasingly important.
Amid this competitive landscape, we committed $1.5 billion to new infrastructure assets for the year ending December 31, 2017. BCI took direct equity positions in several companies. Notable investments for the year included: Nova Transportadora do Sudeste (NTS), a wholesale gas transmission business in Brazil; and Endeavour Energy, the second largest regulated electricity distributor in New South Wales, Australia.
Additionally, we divested our interest in Compañía Logística de Hidrocarburos (CLH), a Spanish refined oil transport and storage company, and Aquarion Water Company, a U.S. water
utility. Both investments generated strong investment returns for our clients.
The program returned 10.5 per cent (unaudited) for the year against a one-year benchmark of 7.0 per cent. Positive returns were driven by increased valuations of the underlying companies and strong cash distributions. The utilities sector was a strong performer while changing market conditions had an adverse impact on select transportation assets. Over the one-year period appreciation of the Canadian dollar against the U.S. dollar had an negative impact on program returns, net of hedging activities. New investments made during the year were held at cost creating a temporary drag on performance.
Multi-year performance remained strong for the program, exceeding its (unaudited) five-year benchmark of 7.6 per cent with return of 10.5 per cent. Strong valuations and solid cash distributions drove returns. During this period the program benefitted from the relatively weak Canadian dollar against the U.S. dollar, euro, and pound. Longer term, on a ten-year basis, the program returned 11.2 per cent (unaudited) against a benchmark of 7.8 per cent.
7.8%
10.5%
7.6%
10.5%
7.0%
11.2%
Benchmark
10 Year5 Year1 Year
38.5%
12.2%
3.5%
25.0%
20.8%
U.S.
Emerging Markets
Europe
Asia
Canada
1 Assets in the infrastructure program are valued annually at December 31, and are measured on an internal rate of return basis.
26 ANNUAL REPORT 2017–2018
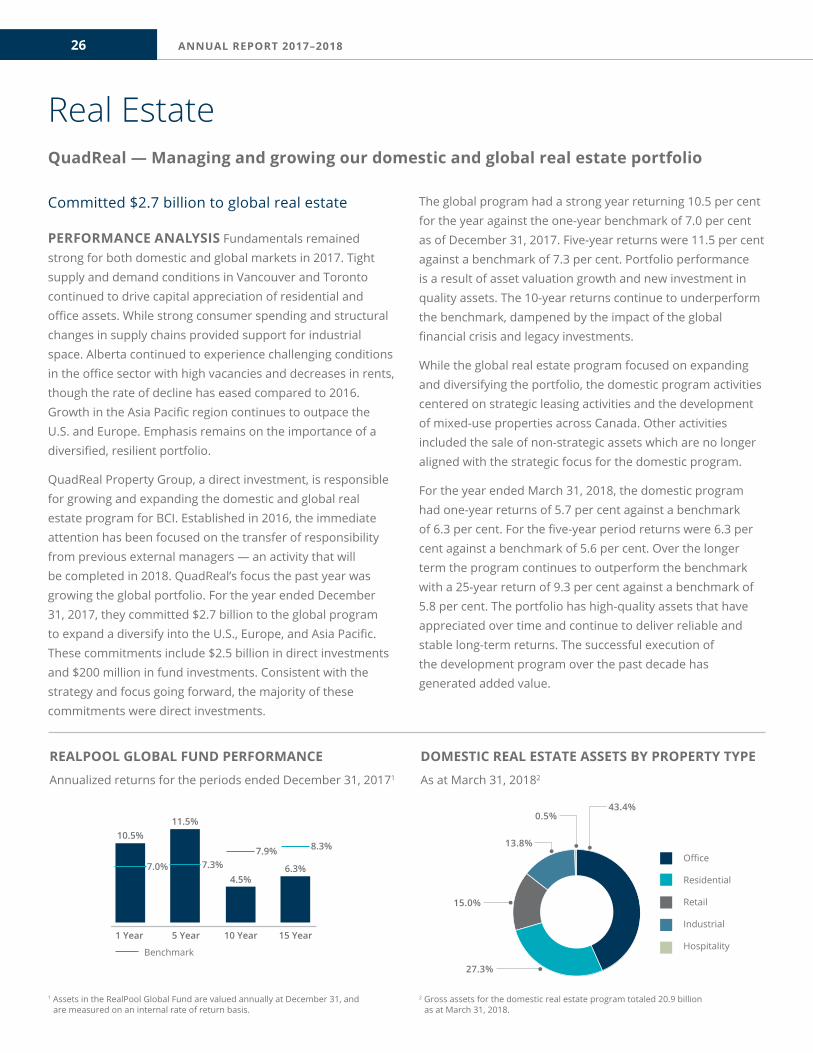
REALPOOL GLOBAL FUND PERFORMANCE
Annualized returns for the periods ended December 31, 20171
Real EstateQuadReal — Managing and growing our domestic and global real estate portfolio
DOMESTIC REAL ESTATE ASSETS BY PROPERTY TYPE
As at March 31, 20182
Committed $2.7 billion to global real estate
PERFORMANCE ANALYSIS Fundamentals remained strong for both domestic and global markets in 2017. Tight supply and demand conditions in Vancouver and Toronto continued to drive capital appreciation of residential and office assets. While strong consumer spending and structural changes in supply chains provided support for industrial space. Alberta continued to experience challenging conditions in the office sector with high vacancies and decreases in rents, though the rate of decline has eased compared to 2016. Growth in the Asia Pacific region continues to outpace the U.S. and Europe. Emphasis remains on the importance of a diversified, resilient portfolio.
QuadReal Property Group, a direct investment, is responsible for growing and expanding the domestic and global real estate program for BCI. Established in 2016, the immediate attention has been focused on the transfer of responsibility from previous external managers — an activity that will be completed in 2018. QuadReal’s focus the past year was growing the global portfolio. For the year ended December 31, 2017, they committed $2.7 billion to the global program to expand a diversify into the U.S., Europe, and Asia Pacific. These commitments include $2.5 billion in direct investments and $200 million in fund investments. Consistent with the strategy and focus going forward, the majority of these commitments were direct investments.
The global program had a strong year returning 10.5 per cent for the year against the one-year benchmark of 7.0 per cent as of December 31, 2017. Five-year returns were 11.5 per cent against a benchmark of 7.3 per cent. Portfolio performance is a result of asset valuation growth and new investment in quality assets. The 10-year returns continue to underperform the benchmark, dampened by the impact of the global financial crisis and legacy investments.
While the global real estate program focused on expanding and diversifying the portfolio, the domestic program activities centered on strategic leasing activities and the development of mixed-use properties across Canada. Other activities included the sale of non-strategic assets which are no longer aligned with the strategic focus for the domestic program.
For the year ended March 31, 2018, the domestic program had one-year returns of 5.7 per cent against a benchmark of 6.3 per cent. For the five-year period returns were 6.3 per cent against a benchmark of 5.6 per cent. Over the longer term the program continues to outperform the benchmark with a 25-year return of 9.3 per cent against a benchmark of 5.8 per cent. The portfolio has high-quality assets that have appreciated over time and continue to deliver reliable and stable long-term returns. The successful execution of the development program over the past decade has generated added value.
7.9%
11.5%
7.3%
10.5%
7.0%
Benchmark
10 Year5 Year1 Year
4.5%
8.3%
6.3%
15 Year
43.4%0.5%
13.8%
27.3%
15.0%
Office
Residential
Retail
Industrial
Hospitality
2 Gross assets for the domestic real estate program totaled 20.9 billion as at March 31, 2018.
1 Assets in the RealPool Global Fund are valued annually at December 31, and are measured on an internal rate of return basis.

27ANNUAL REPORT 2017–2018
RENEWABLE RESOURCES PROGRAM PERFORMANCE
Annualized returns for the periods ended December 31, 20171
Renewable ResourcesA global mandate with a focus on forestry and agriculture
REGIONAL DISTRIBUTION OF RENEWABLE RESOURCES PROGRAM
As at December 31, 20171
Managing a portfolio of $2.6 billion
PERFORMANCE ANALYSIS Our expanding renewable resources program allows clients to gain long-term exposure to assets that are essential to a growing global population and increasing economic mobility.
Active housing markets in China, Japan, and the U.S. drove global demand for timber with wood gaining popularity as a building material. A reduction in lumber shipments from Canada to the U.S. as a result of the Softwood Lumber Agreement dispute had limited impact on our portfolio. Our Canadian timberland performance remained solid with increased exposure to Asia over the U.S. market. Notable transactions for the year included diversification of the timberland portfolio into South America.
The agriculture sector saw low commodity prices, increased competition, and trade barriers negatively affect price margins. The ongoing trend of consolidating farm operations and integration across the supply chain aligns with the program’s strategy for investing in companies that have potential to grow and diversify and generate stable cash flows and returns.
In 2017, BCI committed capital to new investments and continued to advance the programs investment strategy. The fund performed well over the one-year period ended December 31, 2017 with unaudited returns of 15.6 per cent against a benchmark of 7.0 per cent. For timber holdings, strong one-year performance is a result of significant appreciation in the value of assets and strong distributions from the companies as an outcome of increased timber prices. Agriculture performance was driven by the capital appreciation of the underlying companies while investment performance in farmland and row crops in North America, South America, and Australia was modest. New investments made during the year were held at cost creating a temporary drag on performance.
The renewable resources program exceeded its five-year benchmark of 7.0 per cent with unaudited returns of 11.1 per cent. Industry consolidation in the agriculture sector continue to be a positive trend for our focus on platform companies. Over the period the program benefited from significant depreciation of the Canadian dollar against the U.S. dollar.
11.1%
15.6%
7.0% 7.0%
Benchmark
5 Year1 Year
51.2%
13.9%
3.7%
31.2%
Canada
U.S.
Emerging Markets
Asia
1 Assets in the renewable resources program are valued annually at December 31, and are measured on an internal rate of return basis.

28 ANNUAL REPORT 2017–2018
Risk ManagementRisk management is integral to BCI's fiduciary role in managing our clients' funds
Managing risk is the process by which BCI identifies, evaluates, measures, monitors, and communicates the risks and opportunities associated with our operations and investments.
Our clients expect to be compensated with higher returns for taking on additional investment risk. Risk management allows BCI to address uncertainty and manage associated risks and opportunities. Guiding principles inform our approach, which also requires communication and judgement. Within BCI, effective risk management calls for knowledge of capital markets and legislation, as well as an understanding of investment products, business practices, and internal controls.
Anticipating risk, taking appropriate steps to limit exposure or capitalize on the opportunities, and managing the results are essential to BCI’s risk management. BCI aims to ensure that:
• funds under management are better protected
• our operations are sound
• trust in BCI remains unchallenged.
INTEGRATED RISK GOVERNANCE In fiscal 2018, a focus was placed on building out the recent BCI board approved integrated risk governance framework that enhances the board’s ability to oversee enterprise, investment, and product-related risk management. This was in the form of investment risk related directives and procedures.
BCI’s risk governance framework formalizes the roles and responsibilities of the enterprise risk management committee and the investment risk management committee. To ensure the integration of risk between the two committees, the chief operating officer and the senior vice president, investment strategy & risk are mandatory members of each committee.
Each committee is responsible for approving risk directives and the board is responsible for approving the corporate risk policies. Senior vice presidents approve risk procedures, which must adhere to all relevant policies and directives. Collectively the policies, directives, and procedures that relate to risk form the governance framework for BCI’s risk management.
INVESTMENT RISK MANAGEMENT As our investment strategies become more dynamic and global, and we begin to actively manage more assets in-house, we require new ways to identify, assess, and either mitigate or seize opportunity in potential investment risks. Our risk management processes are evolving with our investment strategies to maximize long-term, risk-adjusted returns and preserve our clients’ capital.
Our investment risk management framework includes:
• Concentration Risk: This is the risk of loss arising from exposure, either directly or indirectly, within or across different risk types such as region, issuer, sector, investment partner, or investment type. BCI limits risk by diversifying holdings within and across these exposures.
• Credit and Counterparty Risk: Credit risk is the potential for loss from the deterioration or outright default of an issuer or guarantor’s ability to honour payment obligations. BCI uses sound credit risk measures to monitor credit quality across pooled funds, asset classes, and specific strategies.
Counterparty risk is the potential for loss from a counterparty not honouring its contractual obligations. We only engage with high quality counterparties. The quality of our counterparties is maintained through having strong legal documents in place and continuous monitoring of our exposures.
• ESG Risk: This involves the risk of financial loss as a result of environmental, social, and governance (ESG) factors. BCI will measure and monitor ESG risk at different investment levels using best-in-class industry approaches and methodologies.

29ANNUAL REPORT 2017–2018
• Liquidity Risk: BCI is exposed to market and funding liquidity risks. Market liquidity risk is the risk that an investment position cannot be unwound or offset in a timely fashion without enduring a significant loss attributable to market liquidity. Funding liquidity risk is the risk that a company will not be able to meet its payment obligations, both expected and unexpected, because of an inability to obtain funding. BCI manages liquidity risk by setting liquidity coverage ratio targets and diversifies sources and uses of liquidity by type, maturity, and counterparty.
• Market Risk: This is the potential for loss resulting from adverse movement in market prices or factors such as interest rates, exchange rates, or credit spreads. We will follow best-in-class industry practices to measure, manage and monitor market risk, and ensure that the risk is appropriate to each client and their expected return. We knowingly take on risk, assess the consequences of macro trends, and continually re-evaluate market conditions.
BCI is continuing to build a dedicated investment risk management function within the investment strategy & risk department. They support BCI’s investment activities by working with clients, the BCI board, and the asset classes to help inform key investment decisions. BCI continues to create a more robust approach to risk management and we are strengthening our expertise in the area of investment risk management.
ENTERPRISE RISK MANAGEMENT BCI operates a risk management program that allows us to tolerate risks in a controlled manner. The program is embedded in all strategic planning, operational management, and internal control decisions. By providing an objective and forward-looking assessment of the challenges and opportunities we face, we make certain we are taking the right amount of non-investment risk. This corporate-wide view ensures that we allocate resources in the areas of highest risk, opportunity, or corporate priority.
The aim of BCI’s enterprise risk management (ERM) program is to support better decision making by understanding risks and their likely impact to our non-investment activities. Our program follows the Committee of Sponsoring Organizations of the Treadway Commission (COSO) risk management framework which focuses on identifying risks that could impact the achievement of our objectives.
In fiscal 2018, the board approved a new framework for enterprise risk management.
BCI’s new framework follows these principles:
• Risk Governance and Culture: BCI’s risk governance and culture together form a basis for all other components of enterprise risk management.
• Risk, Strategy, and Objective-Setting: BCI’s integrates enterprise risk management into the process of setting strategy and business objectives.
• Risk in Execution: BCI identifies and assesses risks that may affect its ability to achieve its strategy and business objectives.
• Risk Information, Communication, and Reporting: BCI leverages information systems to capture, process, and manage risk data and information.
• Risk Review and Revision: BCI evaluates risk management capabilities and practices to determine if activities have increased value and helped us achieve our objectives.
Risks are reviewed quarterly by our board of directors who provide oversight through a risk policy. Our risk committee meets monthly to set acceptable risk tolerances, identify emerging risks and ensure mitigation activities are being completed. Business units and staff manage risks based on tolerances set by our board and management. This framework is applied through a continuous, comprehensive program that seeks to identify, evaluate, monitor and report key risks to objectives at all levels in our business and report the results to management and the board.
BCI prepares a report annually for clients to provide assurance that we are actively managing non-investment risk and our financial risks are being adequately managed.
Our internal audit team assesses the adequacy of risk management systems as part of their annual audit plan.

30 ANNUAL REPORT 2017–2018
Responsible Investing
Responsible investing is an essential part of the investment beliefs shared by BCI, the pension funds, and many of the other clients for which we invest. Assessing and managing investment risk is an integral part of how we meet our responsibility. Companies that employ robust environmental, social, and governance (ESG) practices are better positioned to generate long-tern value for investors than similar companies with less favourable practices.
Our primary mandate is to create long-term client wealth and protect the value of their funds. The majority of the funds we manage belong to pension plans. As pension funds have long-term obligations and seek a specified rate of return to fund these obligations, BCI is required to invest our clients’ funds to generate the expected returns. BCI adheres to the applicable requirements of the Pensions Benefits Standards Act and other legislation, as well as the legal contracts established by our clients.
As part of the prudent investment management of our clients’ funds, we take ESG matters into account, to better understand, manage, and mitigate risks associated with long-term investments.
We start by integrating ESG considerations into our investment analysis, decisions, and processes. And as an active owner, we monitor ESG factors and engage with companies to raise awareness that good corporate governance is the over-arching framework for effective management of risks. We also use our influence as a shareholder to encourage companies to manage and report on their ESG risks.
BCI became a founding signatory to the Principles for Responsible Investment (PRI) in 2006. Our approach is aligned with the PRI which provides a set of principles for institutional investors to consider as they integrate environmental, social, and governance factors into their investment processes and analysis, ownership activities, and interactions with other long-term investors.
BCI’S RESPONSIBLE INVESTING PRINCIPLES
The following eight principles guide our approach:
1. As our primary responsibility is to ensure enduring long-term investment returns, environmental, social and governance matters are addressed when these factors present material risk to an investment and/or the portfolio.
2. As significant ESG risks vary between asset classes, regions, sectors and companies, we adapt our approach and strategy to what is appropriate for the investment.
3. Knowledge and reason, while looking out for our clients’ investment return expectations, inform our responsible investing decisions and activities.
4. We encourage companies to identify practical and realistic solutions to ESG risks, and recognize that introducing good governance and operational practices takes time.
5. We must own a company to be able to influence its governance and operational practices. As a long-term owner, we have a responsibility to interact with companies about their governance structures, policies and operations.
6. We believe that engaging is more effective in seeking to initiate change than divesting, and that aligning with like-minded investors and organizations is sometimes more effective than working in isolation.
7. As a significant investor, we have a duty to advance responsible investing within the investment industry.
8. As responsible investing continues to evolve, integrating ESG considerations into our investment approach is constantly under development; we shall continuously learn from our own practices and experience.
For more information on our responsible investing activities, please read our Responsible Investing Annual Report and newsletters on our website (BCI.ca).
Considering environmental, social, and governance matters at all stages of an investment, creating a positive impact for the companies and our clients' long-term return objectives

31ANNUAL REPORT 2017–2018
Board of Directors
Our Board of Directors, from left to right: Peter Milburn, Ken Tannar, Karen Maynes, Dennis Blatchford, Ron McEachern

32 ANNUAL REPORT 2017–2018
Our Board of DirectorsCOMPOSITION OF THE BOARD The Public Sector Pension Plans Act (the Act) requires our board to have seven directors as follows:
• One director appointed by the College Pension Board from among its members
• One director appointed by the Municipal Pension Board from among its members
• One director appointed by the Public Service Pension Board from among its members
• One director appointed by the Teachers’ Pension Board from among its members
• Two directors, representative of other clients, appointed by B.C.’s Minister of Finance; and
• One other director appointed by B.C.’s Minister of Finance and designated to be the Chair of the Board.
These nominating bodies are aware of our criteria relating to the knowledge, experience, and skill set we look for in BCI directors.
Our largest clients, accounting for 85.0 per cent of BCI’s managed net assets, are represented on the board.
Cheryl Yaremko’s term on the board ended January 31, 2018. As of March 31, 2018, we had five board members as the two positions appointed by B.C.’s Minister of Finance remained vacant. Those vacancies have subsequently been filled.
BOARD INDEPENDENCE All directors and the Board Chair are non-executive directors and independent of management.
BCI BOARD AND COMMITTEE APPOINTMENTS 2017–2018 ATTENDANCE
Director since December 31, 2016Current term to December 31, 2019Appointed by B.C.’s Minister of FinanceIndependent
Chair, BCI Board of Directors (2016–Present) 7/7 100%
Guest, Human Resources and Governance Committee 2/2 100%
PETER MILBURN | VANCOUVER, BRITISH COLUMBIA
Peter retired in 2016 after a 33-year career with the provincial government. Most recently he fulfilled the role of deputy minister of finance and secretary to treasury board. In this role he oversaw three consecutive balanced budgets and over $15 billion in capital expenditures. Prior to this appointment Peter held several senior positions with the ministry of transportation and infrastructure including deputy minister, chief operating officer, and executive project director for the Sea to Sky Highway Improvement Project. During his career he was appointed chair of the board for two crown corporations (Transportation Investment Corporation and BC Rail) and three hospital capital boards (Women and Children’s Hospital Redevelopment, Interior Heart and Surgical Centre, and the Surrey Memorial Hospital Critical Care Tower). In addition, he was the chief executive officer for the BC Transportation Finance Authority. Peter has a degree in Civil Engineering from the University of British Columbia.
BCI DIRECTOR REMUNERATION2017–2018
ANNUAL RETAINER
BOARD MEETING FEE
COMMITTEE CHAIR FEE
COMMITTEE MEETING FEE TOTAL
$31,460 $7,071 – $1,566 $44,4041
1 Includes remuneration for representing BCI at other meetings.
OTHER BOARD DIRECTORSHIPS / TRUSTEESHIPS DURING THE LAST FIVE YEARS
TERM BOARD CHAIR & TERM COMMITTEE APPOINTMENTS
Lucas Solutions Ltd. 2017–Present Y 2017–Present –

33ANNUAL REPORT 2017–2018
1 $15,802 was paid to Dennis Blatchford as an individual.2 Includes remuneration for representing BCI at other meetings.
BCI BOARD AND COMMITTEE APPOINTMENTS 2017–2018 ATTENDANCE
Director since March 28, 2012 Current term to December 31, 2018Appointed by the Municipal Pension Board of Trustees Independent
Director, BCI Board of Directors 7/7 100%
Member, Human Resources and Governance Committee (2012–Present) 3/3 100%
DENNIS BLATCHFORD | VANCOUVER, BRITISH COLUMBIA
Dennis is a founding member of the Municipal Pension Board of Trustees and chaired its governance committee from 2008 to 2011. He is currently the pension and benefits advocate for the Health Sciences Association of British Columbia. Previously Dennis was a director for the BC Federation of Labour and worked in the areas of health policy reform, human rights legislation, disability advocacy, and community relations. From 1998 to 2004, he was a trustee of the Canadian Blood Services Pension Plan.
OTHER BOARD DIRECTORSHIPS / TRUSTEESHIPS DURING THE LAST FIVE YEARS
TERM BOARD CHAIR & TERM COMMITTEE APPOINTMENTS
Joint Health Science Benefits Trust (Trustee) 2015–Present N – Policies CommitteeHealthcare Investment Unit Trust Board
Municipal Pension Plan (Trustee) 2001–Present N – Benefits Committee
Nurses Bargaining Association: Retiree Benefits Program 2011–2017 N – Health Sciences Association Representative
Shareholder Association for Research and Education 2010–Present N – Pension Summit Planning Committee
Healthcare Investment Unit Trust (Trustee) 2017–Present Y 2018–Present –
BCI BOARD AND COMMITTEE APPOINTMENTS 2017–2018 ATTENDANCE
Director since September 18, 2014Current term to August 31, 2019Appointed by the College Pension Board of TrusteesIndependent
Director, BCI Board of Directors 7/7 100%
Chair, Audit Committee (2018–Present)1 0/0 100%
Member, Audit Committee (2014–2018) 5/5 100%
Guest, Human Resource and Governance Committee 2/2 100%
KAREN MAYNES | MAPLE RIDGE, BRITISH COLUMBIA
Now retired, Karen was the vice-president, finance and administration at Douglas College. She was nominated by the post-secondary employers’ association and appointed to the College Pension Board of Trustees in 2005 by the provincial government. Karen is the past chair of the provincial senior finance and administration officers committee, and past post-secondary sector representative of the Institute of Chartered Accountants of BC Government Organizations’ Accounting & Auditing Forum. She has also served on numerous Douglas College and provincial committees dealing with issues such as technology planning, faculty negotiations and data definitions and standards. Karen received her chartered accountant designation in 1987.
BCI DIRECTOR REMUNERATION2017–2018
ANNUAL RETAINER
BOARD MEETING FEE
COMMITTEE CHAIR FEE
COMMITTEE MEETING FEE TOTAL
40 per cent of the remuneration is paid to the Health Sciences Association of British Columbia1
$15,730 $7,071 – $3,144 $26,3372
BCI DIRECTOR REMUNERATION2017–2018
ANNUAL RETAINER
BOARD MEETING FEE
COMMITTEE CHAIR FEE
COMMITTEE MEETING FEE
AUDIT COMMITTEE PREPARATION FEE TOTAL
$15,730 $7,071 $869 $4,698 $783 $29,1512
OTHER BOARD DIRECTORSHIPS / TRUSTEESHIPS DURING THE LAST FIVE YEARS
TERM BOARD CHAIR & TERM COMMITTEE APPOINTMENTS
College Pension Board (Trustee) 2006–Present N –
Benefits CommitteeGovernance CommitteeInterplan Audit CommitteeInterplan Post-Retirement GroupBenefits Committee
1 Appointed Chair of Audit Committee February 2, 2018.2 Includes remuneration for representing BCI at other meetings.

34 ANNUAL REPORT 2017–2018
BCI BOARD AND COMMITTEE APPOINTMENTS 2017–2018 ATTENDANCE
Director since April 1, 2007Current term to March 31, 2019Appointed by the Public Service Pension Board of TrusteesIndependent
Director, BCI Board of Directors 7/7 100%
Chair, Human Resources and Governance Committee (2015–Present) 3/3 100%
Member, Human Resources and Governance Committee (2007–2014) – –
BCI DIRECTOR REMUNERATION2017–2018
ANNUAL RETAINER
BOARD MEETING FEE
COMMITTEE CHAIR FEE
COMMITTEE MEETING FEE TOTAL
$15,729 $7,071 $5,242 $3,144 $34,3311
RON McEACHERN | NORTH SAANICH, BRITISH COLUMBIA
Ron has worked in human resources and labour relations for more than 30 years. Prior to retiring, he was an associate deputy minister of employee relations in the BC Public Service Agency. Ron holds a Bachelor of Science from the University of Victoria and has completed several certificate courses with International Foundation of Employee Benefit Plans in the Advanced Trustee Management Standards Program.
BCI BOARD AND COMMITTEE APPOINTMENTS 2017–2018 ATTENDANCE
Director since January 1, 2015Current term to December 31, 2020Appointed by the Teachers’ Pension Plan Board of TrusteesIndependent
Director, BCI Board of Directors 7/7 100%
Member, Human Resources and Governance Committee (2015–Present) 3/3 100%
Guest, Audit Committee 3/3 100%
KEN TANNAR | LANGLEY, BRITISH COLUMBIA
Ken retired in 2017 after a 34-year career teaching in British Columbia, most currently as a physics and senior math teacher in Surrey. He was appointed to The Teachers’ Pension Plan Board of Trustees by the BC Teachers’ Federation in 2008. For the past ten years, Ken has served on the BCTF’s pensions committee and TPP’s advisory committee, which is independent of the TPP. He has served as the past chair for both committees. Ken holds a Bachelor of Science from the University of British Columbia.
OTHER BOARD DIRECTORSHIPS / TRUSTEESHIPS DURING THE LAST FIVE YEARS
TERM BOARD CHAIR & TERM COMMITTEE APPOINTMENTS
BC Teachers’ Federation 2005–2017 N – Pensions Committee (Past Chair)Teachers’ Pension Plan Advisory Committee (Past Chair)
Teachers’ Pension Plan (Trustee) 2008–Present Y 2018–Present Benefits and Communications Committee (Chair)
BCI DIRECTOR REMUNERATION2017–2018
ANNUAL RETAINER
BOARD MEETING FEE
COMMITTEE CHAIR FEE
COMMITTEE MEETING FEE
AUDIT COMMITTEE PREPARATION FEE TOTAL
$250 per meeting per diem of the remuneration is paid to the BC Teachers’ Federation, during his term1
$15,730 $7,071 – $3,927 $1,533 $28,2612
1 $27,011 was paid to Ken Tannar as an individual. $1,250 was paid to BC Teacher’s Federation for the term ended 2018.2 Includes remuneration for representing BCI at other meetings.
OTHER BOARD DIRECTORSHIPS / TRUSTEESHIPS DURING THE LAST FIVE YEARS
TERM BOARD CHAIR & TERM COMMITTEE APPOINTMENTS
Public Service Pension Board (Trustee) 2002–Present Y 2011–2016Benefits Committee Communications CommitteeGovernance Committee
Ron E. McEachern & Associates Ltd. 2004–Present Y 2004–Present –
1 Includes remuneration for representing BCI at other meetings.

35ANNUAL REPORT 2017–2018
Corporate Governance

36 ANNUAL REPORT 2017–2018
Our Corporate GovernanceThe board of directors is committed to high governance standards in the oversight of BCI's operations and accountability to clients
THE GOVERNANCE FRAMEWORK BCI was established by the Public Sector Pension Plans Act (the Act) in 1999. The board appoints the CEO/CIO, sets the remuneration, and reviews and monitors the CEO/CIO’s performance. The board also oversees BCI’s operations, and ensures proper reporting and accountability to our clients. The board approves pooled fund investment policies, auditors, the business plan, and annual budget. Other responsibilities include establishing an employee classification system and compensation scale.
The BCI board mandate clarifies the board’s duties and responsibilities and is available on our website.
Investment professionals under the supervision of the CEO/CIO make all investment decisions within the framework of the policies approved by the board and established by BCI’s clients.
ROLE AND ACCOUNTABILITY OF THE CHIEF INVESTMENT OFFICER The Act defines BCI’s chief investment officer as the chief executive officer with responsibility for supervising day-to-day operations and for carrying out duties relating to the management of the invested funds, including a determination of which assets to buy and sell. The CEO/CIO is accountable to the board for the efficiency and effectiveness of the corporation in carrying out its mandate. The CEO/CIO is also responsible for reporting to each client with respect to the management and investment performance of their funds.
Among other responsibilities, the CEO/CIO (or delegate) hires staff and external managers, prepares the annual business plan and budget, and establishes policies and procedures to meet operational objectives. The CEO/CIO ensures that funds are managed in a prudent and appropriate fashion.
BOARD ACTIVITY AND COMMITTEES The board meets on a quarterly basis. Meetings are scheduled in advance. Additional meetings are arranged when issues arise that require immediate board attention. The board has two standing committees:
• The audit committee, consisting of three directors, meets at least three times a year and oversees the audit programs, financial management controls, and financial reporting.
• The human resources and governance committee (HRGC), consisting of three directors, meets at least twice a year and reviews human resource strategies, compensation philosophy, succession management, performance incentive plans, employee classification systems, and board governance.
The CEO/CIO attends all board and HRGC meetings and the COO attends all audit committee meetings on behalf of the CEO/CIO (although neither the CEO/CIO or COO can be a director).
DIRECTOR ATTENDANCE The board met on seven occasions, the audit committee on five, and the HRGC on three. Directors who are not members of a committee may observe those meetings.
There was 100 per cent attendance for most of the meetings held in 2017–2018. Details for individual directors are included in their profiles on pages 32 to 34. Cheryl Yaremko, whose term ended January 31, 2018, attended four out of the five board meetings scheduled during her time on the board.
DIRECTOR ORIENTATION PROGRAM Senior management lead the orientation. New directors are briefed on the board’s role and responsibilities, our business plan, budget, investment and risk management activities and human resource policies. Details on key operational functions are also addressed.

37ANNUAL REPORT 2017–2018
BOARD EVALUATION AND ASSESSMENT Each year the directors complete a self-evaluation process that assesses the effectiveness of the board in key areas and elicits suggestions for improvement. The board discusses the results and identifies areas that require additional or new emphasis. The chair of the HRGC administers the process.
DIRECTOR REMUNERATION The Act provides that BCI may pay directors remuneration that has been set by the board and is consistent with the Province of British Columbia’s Treasury Board guidelines. The board is paid an annual retainer and per diem (meeting fee) for their service on the board and its committees.
A director is also compensated for attending meetings or conferences as a representative of BCI. If a director receives remuneration from their employer for board or committee service, such fees are paid to their employer.
Directors receive only one meeting fee per each twenty-four hour day. Members of the audit committee will be paid a preparation fee equal to a meeting rate for any audit committee meetings held on the same day as board meetings.
For fiscal 2018, remuneration levels for the annual retainer and per diem are as follows:
Total remuneration for the board was $191,723.68 in 2017–2018 (2016–2017: $221,792.50). Details for individual directors are included in their profiles. Remuneration for Cheryl Yaremko, whose term ended January 31, 2018, was $29,239.42.
DIRECTOR CODE OF CONDUCT The Code of Conduct (available on our website) outlines the minimum standard of conduct. Directors must make timely disclosure of direct or indirect interest, material or not, in any proposed or completed BCI contract, transaction, or investment. Directors must also abstain from voting on matters in which they have a personal interest.
CONTINUING DIRECTOR EDUCATION The board recognizes the importance of ongoing director education. BCI encourages directors to enrol in professional development courses and participate in industry-related seminars, such as the Public Sector Pension Conference.
BCI maintains an Institute of Corporate Director (“ICD”) membership for all directors and budgets an amount to enable directors to benefit from courses and conferences offered by third parties. In addition, directors provide feedback for key areas of the business they require further information and arrangements are made for management or external consultants to present in these areas.
In fiscal 2018, the board and its committees received a number of presentations during regular meetings, special meetings, and board dinners to enrich the board’s knowledge of the business.
JANUARY 1–DECEMBER 31, 2017 AS OF JANUARY 1, 20181
POSITION ANNUAL RETAINER PER DIEM ANNUAL RETAINER PER DIEM
Board Chair $31,339 $783 $31,825 $795
Director $15,669 $783 $15,912 $795
Audit Committee Chair $5,223 $783 $5,304 $795
HRGC Chair $5,223 $783 $5,304 $795
Committee Member – $783 – $795
1 Annual adjustment to align with the average percentage that the British Columbia pension plan grants to retired members of the College Pension Plan, Municipal Pension Plan, Teachers’ Pension Plan, and Public Service Pension Plan (the four largest clients represented on the Board).
38 ANNUAL REPORT 2017–2018
Compensation Discussion and AnalysisAligning compensation with long-term objectives and our clients' required rate of return
BCI recruits and seeks to retain talented and motivated employees with the skills and expertise to provide leadership in a complex investment environment and to continue our transformation into an in-house asset manager. As we compete with our Canadian peers for the required expertise, BCI offers rewarding work opportunities, supports continued professional development, and pays competitive base salaries and incentive pay.
We are responsible for generating long-term client wealth while also protecting the value of our clients’ funds. We are accountable to our clients for investment returns and the costs involved in managing their funds. We operate on a cost recovery model, and investment management fees are charged to the investment pools and clients.
HRGC MANDATE The human resources and governance committee (HRGC) assists the board in ensuring that BCI retains a highly effective team and that human resource practices continue to align employee performance with client expectations. The HRGC monitors and makes recommendations to the board on the following matters:
• trends and external market practices for compensation, benefits, and terms and conditions of employment
• BCI’s job classification system and compensation scale
• comparators and competitive positioning of compensation
• salary and performance assessment of the CEO/CIO
• BCI’s performance incentive plans
• oversight of risks associated with human resources activities
• employee Code of Conduct provisions
• BCI’s succession planning
• professional development and training strategies
• new human resources strategies and supporting policies
• self-evaluation plans of the board and its committees
• best practices and trends in board governance.
The HRGC consists of three directors, appointed by the board, with diverse backgrounds and experience in business
and human resources matters. Members are independent of management. Ron McEachern is the chair; Dennis Blatchford and Ken Tannar are committee members. The other directors may also attend committee meetings as guests. The CEO/CIO and senior vice president, human resources attend the meetings.
The HRGC meets at least twice a year. In 2017–2018, the committee met on three occasions, which included three in camera sessions.
COMPENSATION CONSULTANTS AND EXTERNAL SOURCES As part of the board’s governance responsibility, it conducts a comprehensive review of BCI’s philosophy and compensation structure every three years.
For investment professional roles, the board looks at similar and/or equivalent positions within BCI’s peer group which consists of the Alberta Investment Management Corporation (AIMCo), Caisse de dépôt et placement du Québec (CDPQ), the Canada Pension Plan Investment Board (CPPIB), the Ontario Municipal Employees Retirement System (OMERS), the Ontario Teachers’ Pension Plan (OTPP), and the Public Sector Pension Investment Board (PSPIB). The survey includes positions ranging in seniority and responsibilities.
BCI’s investment positions are further benchmarked against data from the Willis Towers Watson Investment Management Compensation Survey.
For non-investment roles, the board approves the compensation framework based on equivalent positions within the B.C. public sector as identified in a custom survey undertaken in fiscal 2016. This included BC Assessment Authority, BC Hydro, BC Lottery Corporation, BC Transit, Insurance Corporation of BC, and WorkSafeBC, and the positions are also benchmarked against surveys by Willis Towers Watson, which include the Investment Management Compensation survey, the Financial Services Executive Compensation survey and Middle Management, Professional & Support Compensation survey, which includes additional positions such as audit, communications, and facilities.

39ANNUAL REPORT 2017–2018
Willis Towers Watson conducts formal market surveys which BCI participates in annually. BCI also participates in ad hoc or custom surveys throughout the year which are sponsored by different market providers and/or peer organizations.
In 2015–2016, the board began a multi-year review of BCI’s compensation philosophy and structure to ensure BCI could attract and retain the specialized skills and expertise required to transform into an in-house asset manager that uses sophisticated investment strategies.
The board retained Tim Dillon & Associates (TDA) in fiscal 2016 to assist and advise them throughout the compensation review process. This decision was made independent from management.
The consultant was retained to:
• conduct custom compensation surveys
• audit job evaluation plan and process
• review salary range structure and compensation policy
• review annual and long-term incentive plans (AIP and LTIP), including: competitiveness and eligibility scope for both plans, and value driver weighting structure for annual incentive plan
• assess current benefits plan and cost-effectiveness
• advise on BCI’s revision of compensation philosophy.
The board retained Willis Towers Watson in fiscal 2017 to assist and advise them on BCI’s long-term incentive plan; and Case Dillon & Associates in fiscal 2017 to assist and advise them on our compensation philosophy. This review began in fiscal 2017 and continued in fiscal 2018.
COMPENSATION PHILOSOPHY The board’s compensation philosophy is to pay median base salary levels complemented by performance incentive plans designed to align employee interests with our clients’ return requirements (while discouraging undue risk-taking) and with BCI’s strategic objectives. This compensation philosophy remained in effect until March 31, 2018.
A comprehensive review and assessment of BCI’s compensation, philosophy, and structure began in fiscal 2016 and was completed in fiscal 2018 — see page 45 for details. Adjustments to BCI’s compensation structure and salary grade, effective April 1, 2016, were based on general guidelines that emphasize pay for performance. This enabled management to begin attracting the skill base required to move forward with BCI’s business plan.
The board retained Tim Dillon & Associates in 2016 to assist and advise them on our compensation philosophy. This review continued with Case Dillion & Associates and concluded in fiscal 2018. Changes to the compensation philosophy were made during the year and are effective April 1, 2018. See page 45 for the updated compensation philosophy.
JOB EVALUATION AND CLASSIFICATION PLAN BCI’s job evaluation and classification plan is based on external benchmarking and a “job family” system. The plan brings greater internal consistency and measures knowledge, complexity, responsibility, and working relationships that are required of all positions. The plan consists of four job categories:
• investment: actively involved in the financial management and/or support of an asset portfolio or investment activities requiring an investment professional
• management/leadership: works at a high operational and/or strategic level where decisions generally have an effect on corporate policy and performance and leadership of employees represents a significant portion of overall responsibilities
• professional/technical: provides advanced knowledge in area of expertise to give technical direction and leadership for a process, system, and/or functional area to protect the company and minimize risk
• enterprise support: provides information and/or support for various operations and processes

40 ANNUAL REPORT 2017–2018
COMPENSATION STRUCTURE The board’s philosophy, for this reporting year, is to pay median base salary levels complemented by performance incentive plans designed to align employee interests with our clients’ return requirements (while discouraging undue risk-taking) and with BCI’s strategic objectives.
Our compensation structure includes a base salary, benefits, and performance-based remuneration through an annual incentive plan (AIP) and a long-term incentive plan (LTIP) for senior roles. As a statutory corporation with one share with a par value of $10, BCI does not issue share options to our employees.
Base Salary: Salary ranges are determined from the custom and published surveys. Salaries are evaluated annually and progression through a range is based on the employee’s performance. Salary ranges are aligned with the results of industry salary surveys.
Annual Incentive Plan: To achieve the objectives set out in our business plan, we must attract, retain, and motivate skilled professionals. As BCI’s compensation structure emphasizes pay for performance, all employees are evaluated on an annual basis. Assessments are based on the individual’s accountabilities and their specific contribution to BCI’s business plan.
All permanent employees are eligible to participate in the AIP. The plan provides employees the opportunity to receive additional compensation based on the achievements of the corporate objectives, investment performance, and individual efforts.
The AIP is comprised of three value drivers for the asset class departments and two value drivers for the non-asset class departments. AIP payments are conditional on performance that, in aggregate and on a weighted basis, adds value relative to client benchmarks. The weighting assigned to each of the value drivers may differ by position depending on the role of the position and its impact on corporate performance.
Driver 1: Overall Investment Return Performance — overall investment return performance is measured 70 per cent against relative industry benchmarks and 30 per cent against client absolute return objectives. The value-added component for relative returns is assessed net of investment management fees and expenses. This driver is intended to align overall investment performance with client expectations and requirements.
To reinforce that long-term investment returns matter and to ensure alignment with BCI’s long-term investment horizon, relative returns are measured on a five-year multi-year basis and absolute return is measured over a 10-year time horizon. The excess return component is 100 basis points calculated on relative returns net of fees and expenses.
In fiscal 2018 the board removed the annual return component from the overall investment return performance calculation, extended the multi-year time horizon, and added the client absolute return benchmark, further aligning and strengthening the link between employee compensation and long-term client objectives.
Driver 2: Individual Contribution — the employee’s performance is measured against the accountabilities assigned to their role as outlined in their individual scorecards. This is intended to encourage and reward high performance.
Driver 3: Investment Department Performance — performance measured against the asset class’s respective market benchmarks with a 75 per cent weighting on multi-year asset class performance and a 25 per cent weighting on annual performance. Depending on the role, a greater weighting of total incentive pay is placed on the results of department and portfolio returns.
The maximum value-added objectives are consistent with client mandates and BCI’s investment approach. These are designed to discourage excessive risk taking consistent with BCI’s investment philosophy of focussing on long-term results.

41ANNUAL REPORT 2017–2018
30%
Total Award %
Total award payment disbursement (3 equal payments)1
Effective prior to April 1, 2017
1 Year 1 is paid in the fiscal year following the award determination; year 2 is paid in the second fiscal year following the award determination, and year 3 is paid in the third fiscal year following the award determination.
=
Total award payment disbursement (3 equal payments)
Effective April 1, 2017
Year 2
Year 3
Year 1
1/3 total award
2017–2018 Paid fiscal 2019
1/3 total award
2017–2018 Paid fiscal 2021
Year 2
Year 3
Year 1
1/3 total award
1/3 total award
1/3 total award
100%
Four-year multi-year relative
return performanceTotal
Award %=30%
Ten-year absolute client return performance
70%
Five-year relative industry return
performance+
1/3 total award
2017–2018 Paid fiscal 2020
Long-Term Incentive Plan: This plan is designed to enhance the recruitment and retention of senior employees and align commitment to BCI with our longer-term investment results by providing the opportunity to eligible employees to earn additional compensation during their BCI careers derived from investment return performance.
During fiscal 2018, the board completed a comprehensive review to ensure that BCI’s LTIP is in market alignment. The board subsequently amended the vesting and deferral provisions so that the total award would vest and be paid in equal installments over a three-year period.
Effective April 1, 2017, the long-term value add measure in AIP will be used in LTIP. This will ensure that a single measure will be used for both plans. This provides further emphasis on long-term returns. The LTIP total award is disbursed over a three-year period with a maximum weighting of 100.0 per cent for each year. New employees participating in LTIP are eligible to receive the first payment after completing one year of employment.
LONG-TERM INCENTIVE PLAN CALCULATION

42 ANNUAL REPORT 2017–2018
PERFORMANCE ASSESSMENT FOR 2017–2018 BCI’s net assets under management were $145.6 billion at the end of the fiscal year. The combined pension plan one-year annual return was 9.0 per cent compared to a combined market benchmark of 7.4 per cent. As a result, BCI’s investment activities generated $1.9 billion in added value for our pension plan clients.
Pension clients benefitted from solid performance of our illiquid asset investments, as well as strong public equity returns over the year. Pension clients benefitted from solid performance of our illiquid asset investments, as well as strong public equity returns over the year. The annual return of 9.0 per cent exceeded the combined pension clients policy benchmark return of 7.4 per cent, as well as their actuarial benchmark. Relative outperformance was realized by all asset classes this year with significant contributions from Private Equity, Infrastructure, Renewable Resources, and Global public equities. Outperformance relative to the clients policy benchmark resulted in value added by BCI of $1.9 billion over the year.
As pension plans have long-term financial obligations, we focus on generating long-term client wealth while protecting the value of the funds. Returns are important — for every $100 a pension plan member receives in retirement benefits, on average $75 is provided by BCI’s investment activity. Over the five-year period, the annualized return was 9.9 per cent against a benchmark of 8.7 per cent, adding $5.8 billion cumulative in value. For the 10-year period, the annualized return was 7.4 per cent against a benchmark of 6.8 per cent. BCI added almost $6.6 billion cumulative in value over this period.
The value-added performance is calculated as the clients’ total portfolio return net of investment management fees and minus the benchmark return.
LONG-TERM INCENTIVE PLAN CREDITS AND PAYMENTS Over the April 2013 to March 2018 period, BCI’s investment performance added value in each of the five years. The above benchmark performance in 2017–2018 generated a total award of 91.5 per cent, with 100.0 per cent being the maximum towards a current and future long-term incentive plan grant. The value-added performance (calculated as the clients’ total portfolio return net of investment management fees and minus the benchmark return) in the five-year period is shown in the table below.
1 The LTIP total award is calculated 70 per cent based on the five-year relative industry returns performance and 30 per cent based on the 10-year absolute clients returns performance.
LTIP total awards and installments are derived from the past five years and ten years of returns related to relative industry benchmarks and absolute client return objectives respectively. Total awards are deferred and disbursed in three equal installments over three fiscal years2.
As the value-added performance was delivered in each of the five years, LTIP payments for 2017–2018 reflect 91.5 per cent of the maximum opportunity. Over the five-year period, BCI generated over $5.8 billion in cumulative value-add. Over a 10-year period, we have generated $6.6 billion in cumulative added value.
YEAR BCI’S VALUE-ADDED PERFORMANCE ($)
TOTAL AWARD (MAXIMUM OF 100%)
2013–2014 $1.7 billion 96.7
2014–2015 $1.4 billion 97.8
2015–2016 $133 million 90.1
2016–2017 $688 million 84.9
2017–2018 $1.9 billion 91.51
2 Under this plan, the LTIP total award for 2017–2018 will be disbursed to eligible employees in F2019, F2020, and F2021.
43ANNUAL REPORT 2017–2018
EXECUTIVE COMPENSATION The total compensation of the five most highly remunerated officers in place at fiscal year end, with comparable amounts for 2016–2017 and 2015–2016, is disclosed in the Summary Compensation Table on page 44.
The AIP and LTIP payments for the chief executive officer / chief investment officer and the other named executive officers reflect the investment performance that exceeded our clients’ combined market benchmark and generated $1.9 billion in additional value, net of costs. These payments also recognize their department’s contribution to the returns and other business objectives, and their individual contribution. Total compensation for BCI’s named executive officers was $9.5 million in 2017–2018 ($8.2 million in 2016–2017).
TOTAL COMPENSATION Total cost of salaries and benefits for our entire employee complement was $117.8 million in 2017–2018 (8.4 cents per $100 of net assets under management) compared to $84.0 million in 2016–2017 (6.5 cents per $100 of net assets under management). This year-over-year change primarily reflects the growth in BCI‘s employee complement as well as the year-over-year increase in performance-based pay resulting from adding $1.9 billion in value.
As of March 31, 2018, BCI’s employee complement was 413 compared to 351 at the end of fiscal 2017. We added expertise in the areas of portfolio management, asset management, risk management, information technology, investment operations, and finance. BCI is transforming from a public market-oriented manager to an in-house asset manager that is strategic and risk aware. Our business plan refocuses BCI to become an in-house asset manager that uses sophisticated investment strategies and tools. In addition to deploying more capital into the illiquid markets, our industry-aligned strategies and products across asset classes are designed to allow clients to capitalize on opportunities within the global markets and meet their actuarial return requirements.

44 ANNUAL REPORT 2017–2018
1 Base salaries are guided by the Board’s compensation philosophy to pay market median among other large pension fund managers in Canada.2 The values of incentive payments are listed beside the performance year in which they were earned; actual disbursement occurs in the following fiscal year.3 The incentive plan value reflects performance over a five and ten-year timeframe; actual disbursement occurs in the following fiscal year.4 These values represent the contributions paid by BCI on behalf of the named individuals to the Public Service Pension Plan and the Canada Pension Plan.5 These values include BCI-funded group health and welfare benefits and illness wage-loss provisions, parking, professional dues, and contributions paid by BCI on behalf of
the named individuals for legislated benefits such as Employment Insurance and Workers’ Compensation. Vacation pay is calculated on incentive compensation in line with applicable employment standards.
6 Values in this table constitute the total compensation earned by or paid on behalf of the identified individuals. All values are inclusive.7 Daniel Garant joined BCI on September 5, 2017.8 Jim Pittman joined BCI on April 4, 2016.9 As a retiring employee, Bryan Thomson is entitled to a single payment of $285,760 for the vested value of LTIP. This payment will be made in 2018 – 2019 and is included in
the Long-Term Incentive Plan value.
NAME AND PRINCIPAL POSITION YEAR BASE
SALARY 1ANNUAL
INCENTIVE 2, 3LONG-TERM
INCENTIVE PLAN 2, 3PENSION
CONTRIBUTIONS 4OTHER
BENEFITS 5TOTAL
COMPENSATION 6
Gordon J. FyfeChief Executive Officer / Chief Investment Officer
2017–2018 $579,043 $1,343,013 $884,946 $65,045 $151,129 $3,023,176
2016-2017 $571,200 $1,218,619 $723,280 $64,167 $62,776 $2,640,042
2015-2016 $569,612 $704,547 $1,047,742 $63,979 $120,176 $2,506,056
Daniel GarantSenior Vice President, Public Markets
2017–2018 7 $249,231 $833,215 $610,632 $30,731 $170,347 $1,894,155
2016-2017 – – – – – –
2015-2016 – – – – – –
Lincoln Webb Senior Vice President, Infrastructure & Renewable Resources
2017–2018 $374,712 $724,500 $374,528 $42,711 $81,328 $1,597,779
2016-2017 $359,970 $661,464 $302,810 $77,768 $74,862 $1,476,874
2015-2016 $357,064 $420,433 $407,164 $40,747 $63,446 $1,288,854
Jim PittmanSenior Vice President, Private Equity
2017–2018 8 $374,712 $709,500 $374,983 $42,711 $61,290 $1,563,196
2016-2017 $353,077 $647,064 $306,252 $42,047 $59,154 $1,407,593
2015-2016 – – – – – –
Bryan ThomsonSenior Vice President, Public Equities
2017–2018 9 $320,000 $476,160 $548,118 $36,731 $69,024 $1,450,034
2016-2017 $319,934 $400,640 $268,194 $88,245 $52,499 $1,129,512
2015-2016 $315,665 $372,114 $378,395 $36,223 $55,054 $1,157,451
Summary Compensation Table

45ANNUAL REPORT 2017–2018
COMPENSATION GOVERNANCE During the year, the BCI board and management introduced a formalized governance framework that outlines the roles and responsibilities related to compensation to align with industry best practices. The framework includes the following governance authorities:
• The board of directors which makes all structural and strategic decisions including: the compensation philosophy; AIP and LTIP policies; measures of return within the AIP and LTIP policies; and the inclusion of multi-year and annual returns for asset classes. They also approve the: benchmark and performance objectives, principles, and guidelines; the total fund long-term absolute return benchmark and the individual pooled funds benchmarks; and the overall investment return performance objectives (excess return targets and maximums).
• The executive talent and compensation committee (ETCC) makes administrative and performance measurement decisions related to: AIP calculation criteria including: value driver weightings for AIP; length of time the fund needs to be open prior to inclusion in AIP calculation; multi-year timeframe for department and portfolio returns; and reviews all benchmark and excess return recommendations for further approval by the board and the CEO/CIO of BCI as appropriate. The committee is comprised of the executive management team. The committee chair has the ability to invite participants outside of the executive management team as appropriate.
• The investment risk committee (IRC), as part of its mandate, reviews all benchmark and excess return recommendations for further review by the ETCC, such as: required excess return objectives (targets and maximums) for each pooled fund, asset class, and overall investment return; and all pooled fund benchmarks and related governance and implementation requirements as well as the overall investment return absolute return benchmark. The committee is comprised of key members of the executive management team as well as investment risk professionals from within BCI.
The framework allows the board to focus on strategic decisions with alignment to the compensation philosophy. It also formalizes the decisions under board discretion and those which are delegated to BCI management.
COMPENSATION PHILOSOPHY The board completed the review of the compensation philosophy in fiscal 2018. As of April 1, 2018 the formalized compensation philosophy is principle-based and emphasizes pay-for-performance, long-term results, and meeting clients’ expectations. It provides the framework for all compensation-related decisions.
BCI is committed to providing employees with total compensation opportunities that are competitive, equitable and guided by the following principles:
• aligned to and support BCI’s short and long-term strategies and objectives to ensure value for money
• responsive to the different markets in which we compete for talent
• managed on a total compensation basis
• value cost effectiveness and ease of administration
• recognize differences in individual performance and reinforce desired behaviours
• communicated clearly and consistently
• provide a level of base salary, incentives, and benefits that is sufficiently competitive to the relevant markets
• maintain consistency, equity and establish internal job hierarchy.
The compensation philosophy will continue to be embedded into our compensation practices during fiscal 2019. The focus will be on total compensation: which includes, base salary, incentive pay (AIP and LITP), as well as benefits, pension contributions, and perquisites.
2017–2018 Activities: Compensation Framework

46 ANNUAL REPORT 2017–2018
BENCHMARKS AND COMPENSATION BCI is responsible for growing long-term client wealth while protecting the value of their funds. The board recognizes that benchmarks and excess return objectives are an integral part of the investment strategy, implementation, and risk management while also being instruments for investment performance measurement. Therefore, the board approved a policy outlining the governance of benchmarks that aligns BCI’s with industry best practices.
Effective April 1, 2018, the board approved a policy outlining the governance of benchmarks that is a principle-based approach to asset class and portfolio benchmark selection. Based on this policy, all benchmarks have been reviewed for fiscal 2019, and the value-add performance objectives (excess return targets and maximum) associated with each benchmark for incentive compensation calculations were likewise reviewed. The revised benchmark and performance objectives will be reflected in total compensation from fiscal 2019 forward.
The policy for benchmarks establishes the principles, governance, and process for benchmark selection and excess return determination. This establishes clear accountability, delegations of authorities, and responsibilities of all parties involved in determining benchmarks. Monitoring and reporting responsibilities are formalized and ensure established benchmarks and excess return objectives adequately reflect the investment mandates and constraints.
The provisions apply to all pooled funds, asset class and other investment related benchmarks. It addresses the overall investment return performance which is used as the Value Driver 1 for AIP and the LTIP programs.

47ANNUAL REPORT 2017–2018
Corporate Financial Statements
48 ANNUAL REPORT 2017–2018
Responsibility for the integrity and objectivity of the accompanying consolidated financial statements of the British Columbia Investment Management Corporation (the “Corporation”) rests with management. The consolidated financial statements, which by necessity include some amounts that are based on management’s best estimates and judgments, are prepared in accordance with International Financial Reporting Standards. In management’s opinion, the consolidated financial statements have been properly prepared within the framework of the significant accounting policies summarized in the consolidated financial statements and present fairly the Corporation’s financial position, financial performance and cash flows.
Systems of internal control and supporting procedures are maintained to provide reasonable assurance that transactions are authorized, assets are safeguarded and proper records maintained. The internal accounting control process includes management’s communication to employees of the Corporation’s policies that govern ethical business conduct.
The Board of Directors oversees management’s responsibilities for financial reporting through an Audit Committee, which is comprised entirely of independent directors. The Audit Committee reviews the consolidated financial statements of the Corporation and recommends them to the Board for approval. The consolidated financial statements have been reviewed and approved by the Corporation’s Board of Directors.
KPMG LLP, an independent auditor, has performed an audit of the consolidated financial statements, and its report follows. KPMG LLP has full and unrestricted access to the Audit Committee to discuss their audit and related findings.
Management’s Responsibility for Financial Statements
Lawrence E. Davis Senior Vice President, Finance
Gordon J. Fyfe Chief Executive Officer / Chief Investment Officer
July 5, 2018

49ANNUAL REPORT 2017–2018
Independent Auditor’s Report
To the Shareholder of British Columbia Investment Management Corporation
We have audited the accompanying consolidated financial statements of British Columbia Investment Management Corporation, which comprise the consolidated statement of financial position as at March 31, 2018, the consolidated statements of income and comprehensive income, changes in equity and cash flows for the year then ended, and notes comprising a summary of significant accounting policies and other explanatory information.
MANAGEMENT'S RESPONSIBILITY FOR THE CONSOLIDATED FINANCIAL STATEMENTS Management is responsible for the preparation and fair presentation of these consolidated financial statements in accordance with International Financial Reporting Standards, and for such internal control as management determines is necessary to enable the preparation of consolidated financial statements that are free from material misstatement, whether due to fraud or error.
AUDITORS’ RESPONSIBILITY Our responsibility is to express an opinion on these consolidated financial statements based on our audit. We conducted our audit in accordance with Canadian generally accepted auditing standards. Those standards require that we comply with ethical requirements and plan and perform an audit to obtain reasonable assurance about whether the consolidated financial statements are free from material misstatement.
An audit involves performing procedures to obtain audit evidence about the amounts and disclosures in the consolidated financial statements. The procedures selected depend on our judgment, including the assessment of the risks of material misstatement of the consolidated financial
statements, whether due to fraud or error. In making those risk assessments, we consider internal control relevant to the entity's preparation and fair presentation of the consolidated financial statements in order to design audit procedures that are appropriate in the circumstances, but not for the purpose of expressing an opinion on the effectiveness of the entity's internal control. An audit also includes evaluating the appropriateness of accounting policies used and the reasonableness of accounting estimates made by management, as well as evaluating the overall presentation of the consolidated financial statements.
We believe that the audit evidence we have obtained is sufficient and appropriate to provide a basis for our audit opinion.
OPINION In our opinion, the consolidated financial statements present fairly, in all material respects, the consolidated financial position of British Columbia Investment Management Corporation as at March 31, 2018, and its consolidated financial performance and its consolidated cash flows for the year then ended in accordance with International Financial Reporting Standards.
Chartered Professional Accountants
July 5, 2018 Vancouver, Canada

50 ANNUAL REPORT 2017–2018
BRITISH COLUMBIA INVESTMENT MANAGEMENT CORPORATION
Consolidated Statement of Financial Position(Expressed in thousands of dollars) As at March 31, 2018, with comparative information for 2017
ASSETS NOTE 2018 2017
Current assets:
Cash and cash equivalents 5 44,165 47,339
Trade and other receivables 6 198,154 56,592
Prepaid expenses 4,746 3,594
Total current assets 247,065 107,525
Premises and equipment 7 29,534 14,086
Total assets 276,599 121,611
LIABILITIES AND SHAREHOLDER’S EQUITY NOTE 2018 2017
Current liabilities:
Trade and other payables 6 180,893 58,140
Employee benefits 8 44,818 37,074
Term loan facility 9 1,819 –
Contract liabilities 4, 10 15,614 –
Total current liabilities 243,144 95,214
Trade and other payables 5,011 –
Employee benefits 8 11,597 8,132
Term loan facility 9 16,847 –
Total non-current liabilities 33,455 8,132
Total liabilities 276,599 103,346
Shareholder’s equity:
General reserve 4 – 1,711
Retained earnings 4 – 16,554
Total equity – 18,265
Total liabilities and shareholder’s equity 276,599 121,611
Operating leases (note 11) Derivatives (note 12)
See accompanying notes to consolidated financial statements.
Peter Milburn, Chair, Board of Directors
Karen Maynes, Chair, Audit Committee
Approved on behalf of the Board:
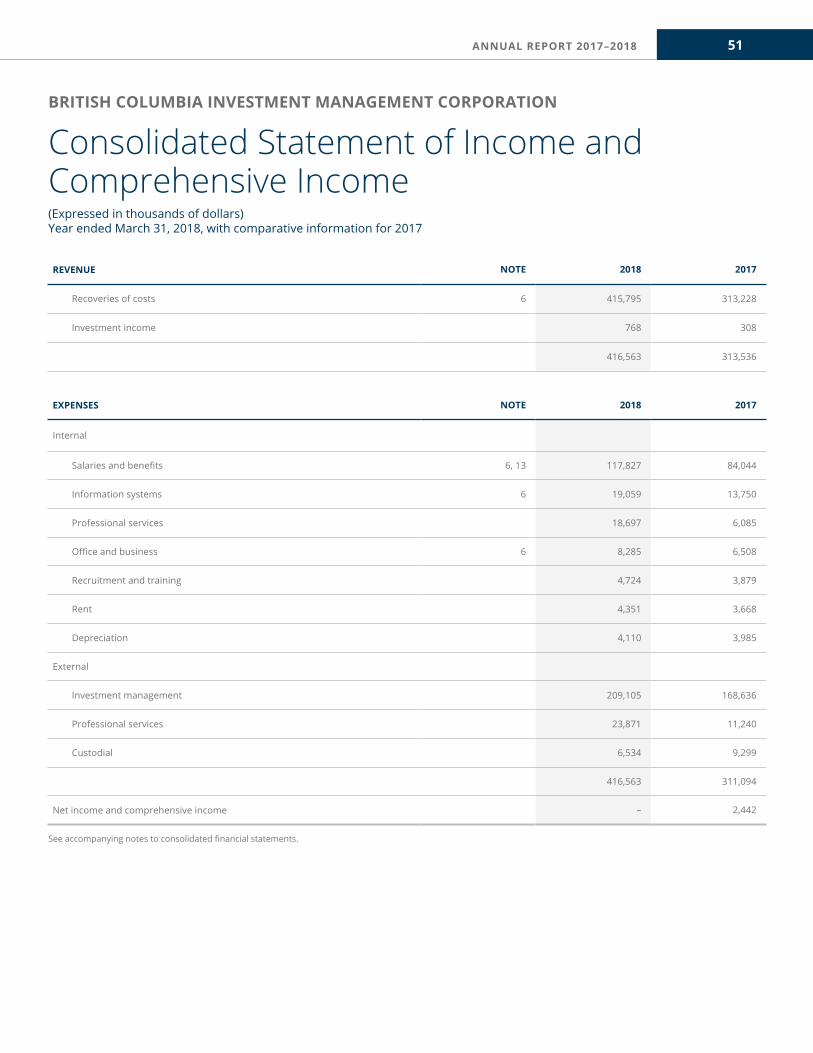
51ANNUAL REPORT 2017–2018
BRITISH COLUMBIA INVESTMENT MANAGEMENT CORPORATION
Consolidated Statement of Income and Comprehensive Income(Expressed in thousands of dollars) Year ended March 31, 2018, with comparative information for 2017
REVENUE NOTE 2018 2017
Recoveries of costs 6 415,795 313,228
Investment income 768 308
416,563 313,536
EXPENSES NOTE 2018 2017
Internal
Salaries and benefits 6, 13 117,827 84,044
Information systems 6 19,059 13,750
Professional services 18,697 6,085
Office and business 6 8,285 6,508
Recruitment and training 4,724 3,879
Rent 4,351 3,668
Depreciation 4,110 3,985
External
Investment management 209,105 168,636
Professional services 23,871 11,240
Custodial 6,534 9,299
416,563 311,094
Net income and comprehensive income – 2,442
See accompanying notes to consolidated financial statements.
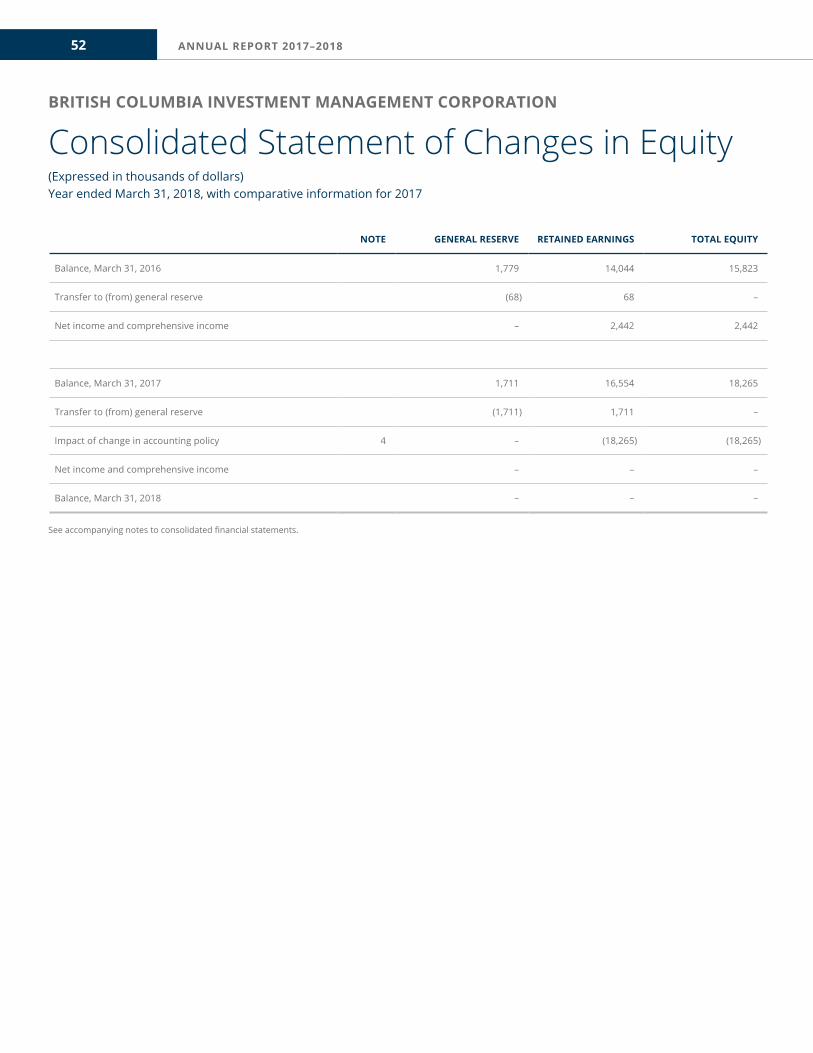
52 ANNUAL REPORT 2017–2018
BRITISH COLUMBIA INVESTMENT MANAGEMENT CORPORATION
Consolidated Statement of Changes in Equity(Expressed in thousands of dollars) Year ended March 31, 2018, with comparative information for 2017
NOTE GENERAL RESERVE RETAINED EARNINGS TOTAL EQUITY
Balance, March 31, 2016 1,779 14,044 15,823
Transfer to (from) general reserve (68) 68 –
Net income and comprehensive income – 2,442 2,442
Balance, March 31, 2017 1,711 16,554 18,265
Transfer to (from) general reserve (1,711) 1,711 –
Impact of change in accounting policy 4 – (18,265) (18,265)
Net income and comprehensive income – – –
Balance, March 31, 2018 – – –
See accompanying notes to consolidated financial statements.

53ANNUAL REPORT 2017–2018
BRITISH COLUMBIA INVESTMENT MANAGEMENT CORPORATION
Consolidated Statement of Cash Flows(Expressed in thousands of dollars) Year ended March 31, 2018, with comparative information for 2017
NOTE 2018 2017
Cash flows provided by (used in):
Operations:
Net income and comprehensive income – 2,442
Items not involving cash:
Depreciation 4,110 3,985
Loss on write-off of premises and equipment 445 26
4,555 6,453
Changes in non-cash items:
Trade receivables (141,561) (3,489)
Prepaid expenses (1,152) (739)
Trade payables and employee benefits 138,972 13,276
Contract liabilities (2,651) –
Net cash provided by (used in) operating activities (1,837) 15,501
Investments:
Premises and equipment additions (21,034) (5,791)
Proceeds from disposal of premises and equipment 1,031 –
Net cash used in investing activities (20,003) (5,791)
Financing:
Proceeds from term loan facility 20,000 –
Repayment of term loan facility (1,334) –
Net cash provided by financing activities 18,666 –
Increase (decrease) in cash and cash equivalents (3,174) 9,710
Cash and cash equivalents, beginning of year 47,339 37,629
Cash and cash equivalents, end of year 5 44,165 47,339
See accompanying notes to consolidated financial statements.

54 ANNUAL REPORT 2017–2018
BRITISH COLUMBIA INVESTMENT MANAGEMENT CORPORATION
Notes to Consolidated Financial Statements(Tabular amounts expressed in thousands of dollars, unless otherwise indicated) Year ended March 31, 2018, with comparative information for 2017
1. REPORTING ENTITY:
The British Columbia Investment Management Corporation (the “Corporation” or “BCI”) is a statutory corporation incorporated under section 16 of the Public Sector Pension Plans Act, SBC 1999 c44 (the “Act”) domiciled in Canada. The address of the Corporation’s office is 750 Pandora Avenue, Victoria, BC. The consolidated financial statements of BCI include the Corporation and its subsidiaries.
In accordance with the Act, the Corporation invests the money or securities of various public sector pension funds, the Province of British Columbia (the “Province”), provincial government bodies (Crown corporations and institutions) and publicly-administered trust funds.
The estimated market value of assets managed by the Corporation as of March 31, 2018 was $146 billion (2017 - $136 billion). Of that, approximately $124 billion (2017 - $114 billion) is invested on behalf of pension funds and $22 billion (2017 - $22 billion) on behalf of various publicly-administered trust funds and clients. These assets are held by BCI as agent for investment for its clients and may consist of units in one or more pooled investment portfolios whose assets are held in trust by BCI. BCI annually prepares separate audited financial statements for each pooled investment portfolio with more than one unitholder. Neither assets held by BCI as trustee of the pooled investment portfolios, nor assets held by BCI as agent for investment for its clients, are consolidated in these financial statements.
2. BASIS OF PREPARATION:
(A) STATEMENT OF COMPLIANCE: The consolidated financial statements have been prepared in accordance with International Financial Reporting Standards (“IFRS”) and were authorized for issue by the Board of Directors on July 5, 2018.
(B) BASIS OF MEASUREMENT: The consolidated financial statements have been prepared on the historical cost basis except long-term employee benefits which are measured at the present value of the expected future benefit.
(C) FUNCTIONAL AND PRESENTATION CURRENCY: These consolidated financial statements are presented in Canadian dollars, which is the Corporation’s functional currency. All financial information presented has been rounded to the nearest thousand dollars, unless otherwise indicated.
(D) USE OF ESTIMATES AND JUDGMENTS: The preparation of consolidated financial statements in conformity with IFRS requires management to make judgments, estimates and assumptions that affect the application of accounting policies and the reported amounts of assets, liabilities, revenue and expenses. Actual results may differ from these estimates.
Estimates and underlying assumptions are reviewed on an ongoing basis. Revisions to accounting estimates are recognized in the period in which the estimates are revised and in any future periods affected.
3. SIGNIFICANT ACCOUNTING POLICIES:
The accounting policies set out below have been applied consistently to all periods presented in these consolidated financial statements except for the new standard adopted as disclosed in (l) below.
(A) BASIS OF CONSOLIDATION: Subsidiaries are consolidated in the Corporation’s financial statements from the date that control commences until the date that control ceases.
The Corporation consolidates entities when all three of the following characteristics are present:
• Where the Corporation exerts power over the relevant activities of the entity. Power exists if the Corporation has decision making authority over those activities that significantly influence the entity’s returns.
• Where the Corporation has exposure or rights to variability of returns of the entity. Exposure exists if the Corporation’s returns vary as a result of the performance of the entity.

55ANNUAL REPORT 2017–2018
• Where there exists a linkage between power and returns as described above. A linkage exists when the Corporation can use its power over the activities of the entity to generate returns for itself.
In the normal course of operations, the Corporation utilizes subsidiary and structured entities to facilitate the management of investment assets:
(i) Subsidiary entities: The Corporation establishes subsidiary entities as part of its investment strategy. In all cases, the Corporation holds 100% of the voting shares of these subsidiary entities. The Corporation has power over the relevant activities of these entities, is exposed to variability in returns from these entities, and uses its power to generate these returns. Accordingly, these entities are consolidated into the Corporation. However, in all cases, these subsidiaries earn nominal income that is not material to the operations of the Corporation.
(ii) Structured entities: In the normal course of its operations, the Corporation establishes various structured entities, such as pooled investment portfolios and their subsidiary entities, through its role as investment manager. The Corporation’s control over these entities is established either by regulation, or ownership of voting shares, or both. The Corporation has power over the relevant activities of the structured entities; however, in all cases, the Corporation has no exposure or rights to variability of returns in these structured entities. Accordingly, these entities do not meet the criteria for control and are not consolidated.
(B) CASH AND CASH EQUIVALENTS: Cash and cash equivalents include cash and money market funds with original maturities of three months or less. Cash and cash equivalents are held at amortized cost on the consolidated statement of financial position.
(C) FINANCIAL INSTRUMENTS: The Corporation initially recognizes loans and receivables and other liabilities on the date that they are originated. All other financial assets (including any assets designated at fair value through profit or loss) are recognized initially on the trade date at which the Corporation becomes a party to the contractual provisions of the instrument.
The Corporation derecognizes a financial asset when the contractual rights to the cash flows from the asset expire, or it transfers the rights to receive the contractual cash flows on the financial asset in a transaction in which substantially all the risks and rewards of ownership of the financial asset are transferred. Any interest in transferred financial assets that is created or retained by the Corporation is recognized as a separate asset or liability. The Corporation derecognizes a financial liability when its contractual obligations are discharged, cancelled or expired.
The Corporation classifies its non-derivative financial instruments as follows:
(i) Loans and receivables: Loans and receivables are financial assets with fixed or determinable payments that are not quoted in an active market. Such assets are recognized initially at fair value plus any directly attributable transaction costs. Subsequent to initial recognition, loans and receivables are measured at amortized cost using the effective interest method, less any impairment losses. The Corporation’s financial assets designated as loans and receivables are comprised of cash and cash equivalents and trade and other receivables.
(ii) Other liabilities: Other liabilities are recognized initially at fair value, net of transaction costs. Subsequently, other liabilities are measured at amortized cost using the effective interest method. The Corporation’s financial liabilities designated as other liabilities are comprised of trade and other payables and term loan facility.
BRITISH COLUMBIA INVESTMENT MANAGEMENT CORPORATION
Notes to Consolidated Financial Statements(Tabular amounts expressed in thousands of dollars, unless otherwise indicated) Year ended March 31, 2018, with comparative information for 2017

56 ANNUAL REPORT 2017–2018
(D) PREMISES AND EQUIPMENT:
(i) Measurement: Items of premises and equipment are measured at cost less accumulated depreciation and any accumulated impairment losses.
Cost includes expenditures that are directly attributable to the acquisition of the asset.
Gains and losses on disposal of an item of premises and equipment are determined by comparing the proceeds from disposal with the carrying amount of premises and equipment, and are recognized within profit or loss.
(ii) Depreciation: Depreciation is calculated over the depreciable amount, which is the cost of an asset less its residual value.
Depreciation is recognized in profit or loss on a straight-line basis over the estimated useful lives of each part of an item of premises and equipment, since this most closely reflects the expected pattern of consumption of the future economic benefits embodied in the asset.
The estimated useful lives for the current and comparative periods are as follows:
Furniture and equipment 10 years
Computers and related software 5 years
Leasehold improvements and interests are depreciated on a straight-line basis over the anticipated life of the lease term.
Depreciation methods, useful lives and residual values are reviewed at each financial year end and adjusted if appropriate.
(E) SHARE CAPITAL: The capital of the Corporation is one share with a par value of ten dollars and is classified as equity. The share is issued to and registered in the name of the Minister of Finance and must be held by that Minister on behalf of the Government of British Columbia.
(F) RESERVE: The Corporation maintained a general reserve for certain future expenditures which could be appropriated from retained earnings at the discretion of the Board of Directors. The Board approved closure of the general reserve at April 1, 2017 and the general reserve balance was transferred to retained earnings.
(G) REVENUE: The Corporation’s revenues comprise the following:
(i) Recoveries of costs: The Corporation provides investment management services to pooled investment portfolios as defined and legislated under the Act and to its clients as contracted under funds investment management agreements (collectively, the “Management Contracts”). The Corporation’s performance obligations in connection with investment management services are satisfied over time through the rendering of services that have the same pattern of transfer to pooled investment portfolios and clients as costs are incurred. As set forth in the Management Contracts, the transaction prices allocated to performance obligations are equal to costs incurred. Contract liabilities recorded in the consolidated statement of financial position relate to the Corporation’s future period performance obligations and are recognized in income in the period when the performance obligations have been satisfied.
(ii) Investment income: Investment income is recorded on an accrual basis and includes interest income on cash and cash equivalents.
BRITISH COLUMBIA INVESTMENT MANAGEMENT CORPORATION
Notes to Consolidated Financial Statements(Tabular amounts expressed in thousands of dollars, unless otherwise indicated) Year ended March 31, 2018, with comparative information for 2017

57ANNUAL REPORT 2017–2018
(H) EMPLOYEE BENEFITS:
(i) Defined benefit plans: The Corporation and its employees contribute to the Public Service Pension Plan (the “Plan”) which is a multi-employer defined benefit pension plan in accordance with the Act. The British Columbia Pension Corporation administers the Plan, including payment of pension benefits to employees to whom the Act applies. Due to insufficient information relating to the Corporation’s share of the Plan’s assets and liabilities, the Corporation accounts for the Plan as if it were a defined contribution plan. The Corporation’s annual cost is represented by contributions required for the respective year.
The Plan operates under joint trusteeship between the employers and the Plan members, who share in the risks and rewards associated with the Plan’s unfunded liability or surplus. The most recent actuarial valuation as of March 31, 2017 indicated that the Plan was 108% funded.
(ii) Long term incentive plan: The Corporation provides a retention incentive to employees in senior staff positions through a long-term incentive plan (“LTIP”). At the end of each fiscal year, eligible employees are entitled to an LTIP Total Award. Each Total Award vests in three equal installments over a three-year period. LTIP is accrued for eligible employees at an amount equal to one third of the estimated aggregate pay-out for the current year and each of the following two years. The estimated payments relating to current and previous years, which will be paid out in years beyond the next fiscal year, are recorded as a long-term liability.
(iii) Long service retiring allowance: Employees hired prior to October 31, 2007 are entitled to a long service retiring allowance (“LSRA”) as provided for under their terms of employment. As employees render the services necessary to earn the benefit, the Corporation estimates and accrues the future obligation for retiring allowances.
(I) LEASED ASSETS:
(i) Classification: The Corporation classifies its leases according to whether the leases transfer substantially all the risks and benefits of ownership in the asset. The Corporation does not have any leases classified as finance leases where it assumes substantially all the risks and rewards of ownership. The Corporation only has operating leases and they are not recognized in the statement of financial position.
(ii) Lease payments: Payments made under operating leases are recognized in net income on a straight-line basis over the term of the lease.
BRITISH COLUMBIA INVESTMENT MANAGEMENT CORPORATION
Notes to Consolidated Financial Statements(Tabular amounts expressed in thousands of dollars, unless otherwise indicated) Year ended March 31, 2018, with comparative information for 2017

58 ANNUAL REPORT 2017–2018
( J) FOREIGN CURRENCY TRANSACTIONS: Transactions denominated in foreign currencies are translated by applying the exchange rate prevailing on the date of the transaction. At each reporting date, all monetary assets and liabilities denominated in foreign currencies are translated into Canadian dollars at the closing exchange rate. Any resulting translation adjustments are recorded in net income or loss.
(K) TAXATION: As an agent of the government of British Columbia, the Corporation is not liable to federal and provincial taxation.
(L) NEW STANDARDS AND INTERPRETATIONS ISSUED BUT NOT YET EFFECTIVE: A number of new standards, amendments to standards and interpretations are not yet effective for the year ended March 31, 2018, and have not been applied in preparing these financial statements. None of these are expected to have a significant effect on the financial statements of the Corporation, except for IFRS 9, Financial Instruments, and IFRS 16, Leases.
IFRS 9, Financial Instruments (“IFRS 9”):
IFRS 9 deals with recognition, derecognition, classification and measurement of financial instruments and its requirements represent a significant change from the existing requirements in IAS 39, Financial Instruments: Recognition and Measurement, in respect of financial assets. The standard contains two primary measurement categories for financial assets: amortized cost and fair value. A financial asset would be measured at amortized cost if it is held within a business model whose objective is to hold assets in order to collect contractual cash flows, and the asset’s contractual terms give rise on specified dates to cash flows that are solely payments of principal and interest on the principal outstanding. All other financial assets would be measured at fair value.
The standard eliminates the existing IAS 39 categories of held-to-maturity, available-for-sale, and loans and receivables. The standard is effective for annual periods beginning on or after January 1, 2018. The Corporation intends to adopt IFRS 9 in its financial statements for the annual period beginning on April 1, 2018. Management is currently evaluating the potential effect of this standard.
IFRS 16, Leases (“IFRS 16”):
On January 13, 2016 the IASB issued IFRS 16. The new standard is effective for annual periods beginning on or after January 1, 2019. Earlier application is permitted. IFRS 16 will replace IAS 17, Leases (“IAS 17”).
This standard introduces a single lessee accounting model and requires a lessee to recognize assets and liabilities for all leases with a term of more than 12 months, unless the underlying asset is of low value. A lessee is required to recognize a right-of-use asset representing its right to use the underlying asset and a lease liability representing its obligation to make lease payments.
Other areas of the lease accounting model have been impacted, including the definition of a lease. Transitional provisions have been provided.
The Corporation intends to adopt IFRS 16 in its financial statements for the annual period beginning on April 1, 2019. Management is currently evaluating the potential effect of this standard.
BRITISH COLUMBIA INVESTMENT MANAGEMENT CORPORATION
Notes to Consolidated Financial Statements(Tabular amounts expressed in thousands of dollars, unless otherwise indicated) Year ended March 31, 2018, with comparative information for 2017
59ANNUAL REPORT 2017–2018
BRITISH COLUMBIA INVESTMENT MANAGEMENT CORPORATION
Notes to Consolidated Financial Statements(Tabular amounts expressed in thousands of dollars, unless otherwise indicated) Year ended March 31, 2018, with comparative information for 2017
4. CHANGE IN ACCOUNTING POLICY:
The Corporation has early adopted IFRS 15, Revenue from Contracts with Customers with a date of initial application of April 1, 2017. As a result, the Corporation has changed its accounting policy for revenue recognition as detailed below.
The Corporation has applied IFRS 15 using the cumulative effect method and recognized the cumulative effect of initially applying IFRS 15 as an adjustment to opening balances as at April 1, 2017. Therefore, the comparative information has not been restated and continues to be reported under IAS 18.
IFRS 15 establishes a comprehensive framework for determining whether, how much and when revenue is recognized. The framework specifies that revenue should be recognized when (or as) an entity transfers goods or services to a customer measured at the amount to which the entity expects to be entitled. Depending on whether certain criteria are met, revenue is recognized over time, in a manner that depicts the entity’s performance or at a point in time, when control of the goods is transferred or performance of services is rendered to the customers.
The Corporation provides investment management services to pooled investment portfolios as defined and legislated under the Act and to its clients as contracted under funds investment management agreements. The transaction price for performance obligations are determined and legislated to be recoveries of costs incurred. The Corporation’s performance obligations to transfer service does not change when IFRS 15 is applied. The Corporation previously recovered certain operating costs and capital expenditures as funds management fees. Where certain expenditures had been collected that related to future performance obligations, such amounts were accumulated in retained earnings and general reserve.
On adoption of IFRS 15, to recognize costs previously collected in advance of satisfying performance obligations, the Corporation has reclassified retained earnings of $18,265,000 to contract liabilities in the consolidated statement of financial position as at April 1, 2017. Contract liabilities are recognized in net income when performance obligations for services rendered are satisfied.
On adoption of IFRS 15, the Corporation has presented a breakdown of functional expenses in the consolidated statement of income and comprehensive income.

60 ANNUAL REPORT 2017–2018
ASSETS AS REPORTED ADJUSTMENTS BALANCES WITHOUT ADOPTION OF IFRS 15
Current assets:
Cash and cash equivalents 44,165 – 44,165
Trade and other receivables 198,154 – 198,154
Prepaid expenses 4,746 – 4,746
Total current assets 247,065 – 247,065
Premises and equipment 29,534 – 29,534
Total assets 276,599 – 276,599
The following tables summarize the impacts of adopting IFRS 15 on the Corporation’s financial statements for the year ending March 31, 2018.
CONSOLIDATED STATEMENT OF FINANCIAL POSITION
(Expressed in thousands of dollars) As at March 31, 2018
The following table summarizes the impact on initial adoption of IFRS 15 as at April 1, 2017:
Contract liabilities as previous stated –
IFRS 15 transition 18,265
Revised contract liabilities as at April 1, 2017 18,265
Retained earnings as previous stated 16,554
General reserve as previous stated 1,711
IFRS 15 transition (18,265)
Revised shareholder’s equity as at April 1, 2017 –
BRITISH COLUMBIA INVESTMENT MANAGEMENT CORPORATION
Notes to Consolidated Financial Statements(Tabular amounts expressed in thousands of dollars, unless otherwise indicated) Year ended March 31, 2018, with comparative information for 2017
See accompanying notes to consolidated financial statements.
IMPACT OF CHANGES IN ACCOUNTING POLICIES

61ANNUAL REPORT 2017–2018
BRITISH COLUMBIA INVESTMENT MANAGEMENT CORPORATION
Notes to Consolidated Financial Statements(Tabular amounts expressed in thousands of dollars, unless otherwise indicated) Year ended March 31, 2018, with comparative information for 2017
LIABILITIES AND SHAREHOLDER’S EQUITY AS REPORTED ADJUSTMENTS BALANCES WITHOUT ADOPTION OF IFRS 15
Current liabilities:
Trade and other payables 180,893 – 180,893
Employee benefits 44,818 – 44,818
Term loan facility 1,819 – 1,819
Contract liabilities 15,614 (15,614) –
Total current liabilities 243,144 (15,614) 227,530
Non-current liabilities:
Trade and other payables 5,011 – 5,011
Employee benefits 11,597 – 11,597
Term loan facility 16,847 – 16,847
Total non-current liabilities 33,455 – 33,455
Total liabilities 276,599 (15,614) 260,985
Shareholder’s equity:
Retained earnings – 15,614 15,614
Total equity – 15,614 15,614
Total liabilities and shareholder’s equity 276,599 – 276,599
CONSOLIDATED STATEMENT OF FINANCIAL POSITION (CONTINUED)
(Expressed in thousands of dollars) As at March 31, 2018
IMPACT OF CHANGES IN ACCOUNTING POLICIES

62 ANNUAL REPORT 2017–2018
BRITISH COLUMBIA INVESTMENT MANAGEMENT CORPORATION
Notes to Consolidated Financial Statements(Tabular amounts expressed in thousands of dollars, unless otherwise indicated) Year ended March 31, 2018, with comparative information for 2017
AS REPORTED ADJUSTMENTS BALANCES WITHOUT ADOPTION OF IFRS 15
Revenue:
Recoveries of costs 415,795 (2,651) 413,144
Investment income 768 – 768
416,563 (2,651) 413,912
Expenses:
Internal:
Salaries and benefits 117,827 – 117,827
Information systems 19,059 – 19,059
Professional services 18,697 – 18,697
Office and business 8,285 – 8,285
Recruitment and training 4,724 – 4,724
Rent 4,351 – 4,351
Depreciation 4,110 – 4,110
External:
Investment management 209,105 – 209,105
Professional services 23,871 – 23,871
Custodial 6,534 – 6,534
416,563 – 416,563
Net loss and comprehensive loss – (2,651) (2,651)
CONSOLIDATED STATEMENT OF INCOME AND COMPREHENSIVE INCOME
(Expressed in thousands of dollars) Year ended March 31, 2018
IMPACT OF CHANGES IN ACCOUNTING POLICIES

63ANNUAL REPORT 2017–2018
BRITISH COLUMBIA INVESTMENT MANAGEMENT CORPORATION
Notes to Consolidated Financial Statements(Tabular amounts expressed in thousands of dollars, unless otherwise indicated) Year ended March 31, 2018, with comparative information for 2017
AS REPORTED ADJUSTMENTS BALANCES WITHOUT ADOPTION OF IFRS 15
Cash flows provided by (used in):
Operations:
Net income (loss) – (2,651) (2,651)
Items not involving cash:
Depreciation 4,110 – 4,110
Loss on write-off of premises and equipment 445 – 445
4,555 (2,651) 1,904
Changes in non-cash items:
Trade receivables (141,561) – (141,561)
Prepaid expenses (1,152) – (1,152)
Trade payables and employee benefits 138,972 – 138,972
Contract liabilities (2,651) 2,651 –
Net cash used in operating activities (1,837) – (1,837)
Investments:
Premises and equipment additions (21,034) – (21,034)
Proceeds from disposal of premises and equipment 1,031 – 1,031
Net cash used in investing activities (20,003) – (20,003)
Financing:
Proceeds from loan facility 20,000 – 20,000
Repayment of loan facility (1,334) – (1,334)
Net cash provided by financing activities 18,666 – 18,666
Increase in cash and cash equivalents (3,174) – (3,174)
Cash and cash equivalents, beginning of year 47,339 – 47,339
Cash and cash equivalents, end of year 44,165 – 44,165
CONSOLIDATED STATEMENT OF CASH FLOWS
(Expressed in thousands of dollars) As at March 31, 2018
IMPACT OF CHANGES IN ACCOUNTING POLICIES

64 ANNUAL REPORT 2017–2018
2018 CANADIAN U.S. TOTAL
Cash in bank 7,081 1,912 8,993
Short-term money market instruments 31,426 3,746 35,172
38,507 5,658 44,165
2017 CANADIAN U.S. TOTAL
Cash in bank 4,140 1,595 5,735
Short-term money market instruments 40,175 1,429 41,604
44,315 3,024 47,339
5. CASH AND CASH EQUIVALENTS:
BRITISH COLUMBIA INVESTMENT MANAGEMENT CORPORATION
Notes to Consolidated Financial Statements(Tabular amounts expressed in thousands of dollars, unless otherwise indicated) Year ended March 31, 2018, with comparative information for 2017
Short-term money market instruments consist of units in pooled investment portfolios managed by the Corporation, specifically the Canadian Money Market Fund ST2 and the US Money Market Fund ST3.
6. RELATED PARTY TRANSACTIONS:
Province of British Columbia:
The Corporation is related to all Province of British Columbia ministries, agencies and Crown corporations through common ownership. Transactions with these entities are in the normal course of operations and are recorded at the exchange amounts as follows:
2018 2017
Salaries and benefits 33 31
Information systems expenses 159 158
Office and business expenses 11 19
Trade and other payables 63 55

65ANNUAL REPORT 2017–2018
BRITISH COLUMBIA INVESTMENT MANAGEMENT CORPORATION
Notes to Consolidated Financial Statements(Tabular amounts expressed in thousands of dollars, unless otherwise indicated) Year ended March 31, 2018, with comparative information for 2017
2018 2017
Recoveries of costs 4,628 –
Trade and other receivables 9,104 19
6. RELATED PARTY TRANSACTIONS (CONTINUED):
Pension Plans:
The Corporation is related to the College, Municipal, Public Service and Teachers’ pension plans and the British Columbia Pension Corporation. The pension plan boards appoint members to the BCI board and BCI provides investment management services to various public sector pension funds, the Province of British Columbia, provincial government bodies and publicly administered trust funds. Transactions with these entities are in the normal course of operations and consist of the recovery of costs that are recorded at the exchange amounts.
QuadReal Property Group Limited Partnership (“QuadReal LP”):
QuadReal LP provides investment management services to real estate pooled investment portfolios. BCI provides administrative services to QuadReal LP on a cost recovery basis. Transactions with QuadReal LP are in the normal course of operations and are recorded at the exchange amounts as follows:
Key management personnel compensation:2018 2017
Base salary 3,319 3,746
Annual incentive plan 5,967 4,825
Long-term incentive plan 3,578 2,980
Other short-term benefits 809 626
Post-employment benefits - pension contributions 384 652
14,057 12,829

66 ANNUAL REPORT 2017–2018
BRITISH COLUMBIA INVESTMENT MANAGEMENT CORPORATION
Notes to Consolidated Financial Statements(Tabular amounts expressed in thousands of dollars, unless otherwise indicated) Year ended March 31, 2018, with comparative information for 2017
7. PREMISES AND EQUIPMENT:
FURNITURE & EQUIPMENT
COMPUTERS & RELATED SOFTWARE
LEASEHOLD IMPROVEMENTS &
INTERESTSTOTAL
Cost:
Balance, April 1, 2016 3,052 6,554 8,507 18,113
Additions 199 1,505 4,087 5,791
Disposals (89) (1,436) (27) (1,552)
Balance, March 31, 2017 3,162 6,623 12,567 22,352
Additions 4,453 1,438 15,143 21,034
Disposals (2,021) – (7,859) (9,880)
Balance, March 31, 2018 5,594 8,061 19,851 33,506
FURNITURE & EQUIPMENT
COMPUTERS & RELATED SOFTWARE
LEASEHOLD IMPROVEMENTS &
INTERESTSTOTAL
Accumulated depreciation:
Balance, April 1, 2016 367 2,758 2,681 5,806
Depreciation for the year 307 1,127 2,551 3,985
Disposals (71) (1,436) (18) (1,525)
Balance, March 31, 2017 603 2,449 5,214 8,266
Depreciation for the year 304 1,213 2,594 4,111
Disposals (597) – (7,808) (8,405)
Balance, March 31, 2018 310 3,662 – 3,972
Carrying amounts:
March 31, 2017 2,559 4,174 7,353 14,086
March 31, 2018 5,284 4,399 19,851 29,534

67ANNUAL REPORT 2017–2018
8. EMPLOYEE BENEFITS:
Current:2018 2017
Regular employee benefits 4,356 3,336
Annual incentive plan 30,945 26,571
Long term incentive plan (LTIP) 9,210 6,795
Long service retiring allowance (LSRA) 307 372
44,818 37,074
BRITISH COLUMBIA INVESTMENT MANAGEMENT CORPORATION
Notes to Consolidated Financial Statements(Tabular amounts expressed in thousands of dollars, unless otherwise indicated) Year ended March 31, 2018, with comparative information for 2017
Non-Current:2018 2017
Long term incentive plan (LTIP) 10,774 7,218
Long service retiring allowance (LSRA) 823 914
11,597 8,132
9. TERM LOAN FACILITY:
During the year, the Corporation secured a bank term loan facility to fund tenant leasehold improvements at the Corporation’s new head office located at 750 Pandora Avenue, Victoria, BC.
Interest is charged at a fixed rate of 2.5% per annum, payable quarterly in arrears. The loan principal and interest are payable in equal quarterly instalments of $566,000 until completion of the loan repayment at June 30, 2027.
The carrying amount of the term loan facility is considered a reasonable approximation of the fair value. There have been no defaults or breaches of the loan terms during the year. Movements in the carrying amount of the term loan facility are presented below:
2018 2017
Carrying amount, beginning of year – –
Proceeds 20,000 –
Repayment (1,334) –
Carrying amount, end of year 18,666 –
Current portion 1,819 –
Non-current portion 16,847 –
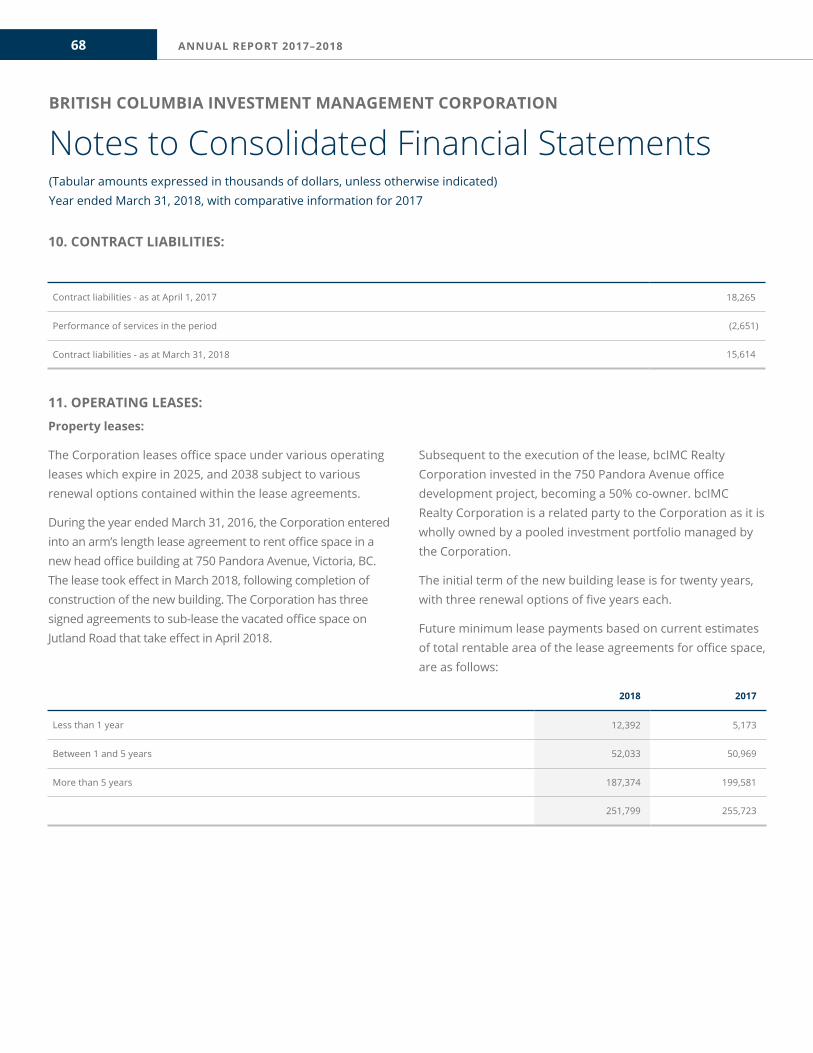
68 ANNUAL REPORT 2017–2018
BRITISH COLUMBIA INVESTMENT MANAGEMENT CORPORATION
Notes to Consolidated Financial Statements(Tabular amounts expressed in thousands of dollars, unless otherwise indicated) Year ended March 31, 2018, with comparative information for 2017
Contract liabilities - as at April 1, 2017 18,265
Performance of services in the period (2,651)
Contract liabilities - as at March 31, 2018 15,614
11. OPERATING LEASES:
Property leases:
The Corporation leases office space under various operating leases which expire in 2025, and 2038 subject to various renewal options contained within the lease agreements.
During the year ended March 31, 2016, the Corporation entered into an arm’s length lease agreement to rent office space in a new head office building at 750 Pandora Avenue, Victoria, BC. The lease took effect in March 2018, following completion of construction of the new building. The Corporation has three signed agreements to sub-lease the vacated office space on Jutland Road that take effect in April 2018.
Subsequent to the execution of the lease, bcIMC Realty Corporation invested in the 750 Pandora Avenue office development project, becoming a 50% co-owner. bcIMC Realty Corporation is a related party to the Corporation as it is wholly owned by a pooled investment portfolio managed by the Corporation.
The initial term of the new building lease is for twenty years, with three renewal options of five years each.
Future minimum lease payments based on current estimates of total rentable area of the lease agreements for office space, are as follows:
2018 2017
Less than 1 year 12,392 5,173
Between 1 and 5 years 52,033 50,969
More than 5 years 187,374 199,581
251,799 255,723
10. CONTRACT LIABILITIES:
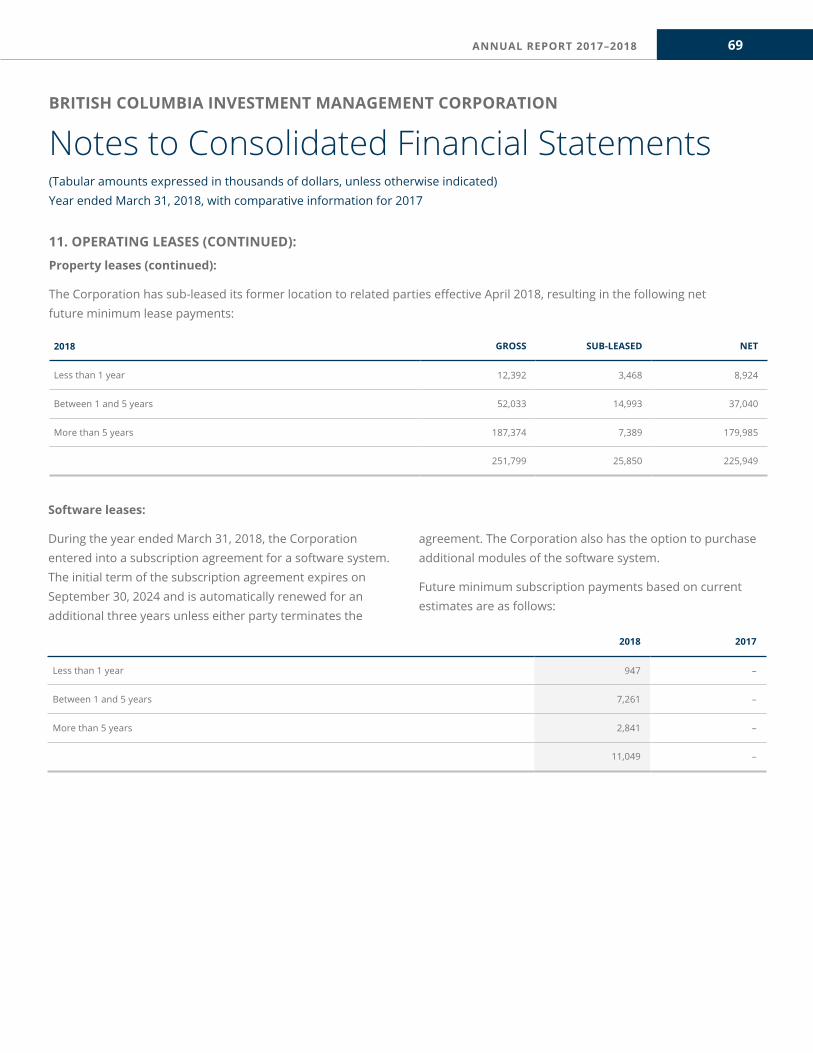
69ANNUAL REPORT 2017–2018
11. OPERATING LEASES (CONTINUED):
Property leases (continued):
The Corporation has sub-leased its former location to related parties effective April 2018, resulting in the following net future minimum lease payments:
2018 GROSS SUB-LEASED NET
Less than 1 year 12,392 3,468 8,924
Between 1 and 5 years 52,033 14,993 37,040
More than 5 years 187,374 7,389 179,985
251,799 25,850 225,949
BRITISH COLUMBIA INVESTMENT MANAGEMENT CORPORATION
Notes to Consolidated Financial Statements(Tabular amounts expressed in thousands of dollars, unless otherwise indicated) Year ended March 31, 2018, with comparative information for 2017
Software leases:
During the year ended March 31, 2018, the Corporation entered into a subscription agreement for a software system. The initial term of the subscription agreement expires on September 30, 2024 and is automatically renewed for an additional three years unless either party terminates the
agreement. The Corporation also has the option to purchase additional modules of the software system.
Future minimum subscription payments based on current estimates are as follows:
2018 2017
Less than 1 year 947 –
Between 1 and 5 years 7,261 –
More than 5 years 2,841 –
11,049 –

70 ANNUAL REPORT 2017–2018
BRITISH COLUMBIA INVESTMENT MANAGEMENT CORPORATION
Notes to Consolidated Financial Statements(Tabular amounts expressed in thousands of dollars, unless otherwise indicated) Year ended March 31, 2018, with comparative information for 2017
2018 2017
OTC:
Currencies:
US dollar 11,238,496 6,223,401
Euro 1,748,239 748,705
British pound 1,045,541 751,497
Australian dollar 1,351,395 621,947
Japanese yen 203,554 232,845
Other currencies 42,136 72,499
Fixed income 84,463 –
Equities 6,598,921 1,879,580
Listed:
Equities 4,259 33,814
Fixed income 72,465 439,470
22,389,469 11,003,758
12. DERIVATIVES:
Derivative financial instruments are financial contracts that are settled at a future date. The value of such instruments is derived from changes in the value of the underlying assets, interest or exchange rates. Derivative financial instruments do not, typically, require an initial net investment. Derivative financial instruments can be listed or traded over-the-counter (“OTC”). OTC instruments consist of those that are bilaterally negotiated and settled, and those that are cleared (“OTC cleared”) by a central clearing party.
The Corporation enters into derivative transactions for the benefit of its clients and pooled investment portfolios to manage exposure to currency fluctuations, to enhance
returns, or to replicate investments synthetically. As the Corporation does not have any beneficial interests in these derivative contracts, the contracts are not recognized in these financial statements.
As at March 31, 2018, the various forward currency, equity and fixed income contracts entered into on behalf of clients or pooled investment portfolios had an unrealized loss of $236,280,000 on a notional value of $22,389,469,000 (2017 - an unrealized loss of $30,317,000 on a notional value of $11,003,758,000).
Notional values under the current agreements are as follows:

71ANNUAL REPORT 2017–2018
BRITISH COLUMBIA INVESTMENT MANAGEMENT CORPORATION
Notes to Consolidated Financial Statements(Tabular amounts expressed in thousands of dollars, unless otherwise indicated) Year ended March 31, 2018, with comparative information for 2017
The Corporation posted collateral of $167,112,000 (2017 - $74,563,000) to secure the payable position. The counterparties for swap contracts are limited to those with at least an “A-” credit rating.
All derivatives mature within one year.
2018 2017
Salaries 64,658 42,019
Annual incentive plan 30,895 26,667
Long term incentive plan 12,767 7,692
Benefits:
Health 2,328 1,535
Pension 4,944 3,994
Retirement allowance (111) 55
Insurance and other 2,346 2,082
117,827 84,044
13. SALARIES AND BENEFITS:
12. DERIVATIVES (CONTINUED):
There were no OTC-cleared contracts outstanding at March 31, 2018 or March 31, 2017.
Notional values do not represent the potential gain or loss associated with the market or credit risk of such transactions. Rather, they serve as the basis upon which the cash flows and
the fair value of the contracts are determined.
The outstanding derivative contracts were entered into with thirteen (2017 - ten) counterparties. The terms of the agreements provide for right of offset with each counterparty. Net counterparty receivables and payables at March 31 are:
2018 2017
Receivables 1,339 65,109
Payables (237,619) (95,426)
(236,280) (30,317)
72 ANNUAL REPORT 2017–2018
BRITISH COLUMBIA INVESTMENT MANAGEMENT CORPORATION
Notes to Consolidated Financial Statements(Tabular amounts expressed in thousands of dollars, unless otherwise indicated) Year ended March 31, 2018, with comparative information for 2017
14. FAIR VALUE OF FINANCIAL INSTRUMENTS:
The fair value of the Corporation’s financial instruments which includes cash and cash equivalents, trade and other receivables, and trade and other payables, approximates their carrying value due to the short-term to maturity of these instruments.
Fair value measurements are classified into a three level hierarchy based on the significance of the inputs used in making the fair value measurements. Level 1 measurements are determined by reference to quoted prices in active markets for identical assets and liabilities. Level 2 measurements include those measured using inputs that are based on observable market data, either directly or indirectly. Level 3 measurements are based on unobservable inputs.
The Corporation’s financial assets and liabilities, which are measured at amortized cost are considered Level 2 because while observable prices are available, they are not quoted in an active market.
15. FINANCIAL RISK MANAGEMENT:
In the ordinary course of operations, the Corporation may be exposed to risk arising from its financial instruments as follows:
(A) CREDIT RISK: Credit risk is the risk of financial loss to the Corporation if a counterparty to a financial instrument fails to meet its contractual obligations, and arises principally from the Corporation’s cash equivalents and trade and other receivables.
The Corporation’s cash equivalents consist of units in money market investment portfolios managed by the Corporation. The trade and other receivables relate primarily to fees and receivables from pooled investment portfolios managed by the Corporation and are generally short-term in nature.
Due to the Corporation’s role as fund manager for the pooled investment portfolios and the highly liquid nature of the Corporation’s cash equivalents, management does not believe the Corporation is exposed to significant credit risk.
(B) LIQUIDITY RISK: Liquidity risk is the risk that the Corporation will not be able to meet its financial obligations as they fall due. The Corporation operates on a cost recovery basis and recovers all of its expenses through the pooled investment portfolios and segregated client accounts it manages on a timely basis. Accordingly, management does not believe that the Corporation is exposed to significant liquidity risk.

73ANNUAL REPORT 2017–2018
BRITISH COLUMBIA INVESTMENT MANAGEMENT CORPORATION
Notes to Consolidated Financial Statements(Tabular amounts expressed in thousands of dollars, unless otherwise indicated) Year ended March 31, 2018, with comparative information for 2017
MARCH 31, 2018 WITHIN 1 YEAR 1 TO 5 YEARS 5 TO 10 YEARS OVER 10 YEARS TOTAL
Trade and other payables 180,893 5,011 – – 185,904
Term loan facility 1,819 7,740 9,107 – 18,666
Contract liability 15,614 – – – 15,614
Regular employee benefits 4,357 – – – 4,357
Annual incentive plan /LTIP 40,155 10,774 – – 50,929
LSRA 306 177 326 320 1,129
243,144 23,702 9,433 320 276,599
MARCH 31, 2017 WITHIN 1 YEAR 1 TO 5 YEARS 5 TO 10 YEARS OVER 10 YEARS TOTAL
Trade and other payables 58,140 – – – 58,140
Regular employee benefits 3,336 – – – 3,336
Annual incentive plan /LTIP 33,366 7,218 – – 40,584
LSRA 372 186 413 315 1,286
95,214 7,404 413 315 103,346
15. FINANCIAL RISK MANAGEMENT (CONTINUED):
The following table shows the contractual maturities of the Corporation’s liabilities as at March 31:

74 ANNUAL REPORT 2017–2018
BRITISH COLUMBIA INVESTMENT MANAGEMENT CORPORATION
Notes to Consolidated Financial Statements(Tabular amounts expressed in thousands of dollars, unless otherwise indicated) Year ended March 31, 2018, with comparative information for 2017
15. FINANCIAL RISK MANAGEMENT (CONTINUED):
(C) CURRENCY RISK: Currency risk is the risk that the Corporation’s financial instruments will fluctuate in value from changes in value of foreign currencies in relation to the Canadian dollar. The Corporation does not hold significant net financial assets nor have significant net financial obligations denominated in currencies other than Canadian dollars. Accordingly, management does not believe the Corporation is exposed to significant currency risk. Cash and cash equivalents denominated in US dollars are disclosed in note 5.
(D) INTEREST RATE RISK: Interest rate risk refers to the effect on the fair value or future cash flows of financial instruments of fluctuations in both long-term and short-term nominal and real interest rates. The Corporation’s cash equivalents are in units of money market investment portfolios that are interest rate sensitive; however, the underlying financial instruments re-price on a frequent basis. Other financial assets and liabilities have a short term to maturity. As investment earnings are not material, management does not believe the Corporation is exposed to significant interest rate risk.
(E) OTHER PRICE RISK: Other price risk is the risk that the fair value of the Corporation’s financial instruments will fluctuate because of changes in market prices, other than those arising from currency risk or interest rate risk. Management does not believe the Corporation’s financial instruments are exposed to significant other price risk.
16. CAPITAL MANAGEMENT:The Corporation’s objectives in managing capital are to ensure compliance with the Act, whereby the Corporation must recover its operating costs and capital expenditures from amounts charged to the funds, persons, organizations and other clients or from investment income. The Corporation is not subject to any internal or external restrictions on its capital.

75ANNUAL REPORT 2017–2018
Our External Managers and PartnersAs at March 31, 2018
AUDITORS • Ernst & Young LLP
• KPMG LLP
FIXED INCOME • Bridgewater
• Hayfin Capital Management
GLOBAL CUSTODIAN
• Northern Trust
INFRASTRUCTURE & RENEWABLE RESOURCES • ArcLight Capital Partners, LLC • Azimuth Capital Management • Bonnefield Finanical Inc. • Brookfield Asset Management Inc. • Energy Capital Partners • First Reserve Corporation • Highstar Capital • Macquarie Infrastructure
and Real Assets
• TIAA CREF Financial Services
MORTGAGE • ACORE Capital • Bentall Kennedy (Canada) Limited
Partnership • BlackRock • CMLS Financial Ltd. • First National Financial LP • Greystone Managed Investments Inc. • Murray & Company Limited • Tricon Capital Group Inc. • Royal Bank of Canada
• RXR Realty
PRIVATE EQUITY • Adams Street Partners, LLC • Advent International Corporation • AEA Investors LP • Affinity Equity Partners • Apax Partners • Apollo Global Management, LLC • Asia Alternatives Management LLC • AsiaVest Partners TCW/YFY (Taiwan) Ltd. • ATL Partners • Avista Capital Partners
• Azimuth Capital Management • Bain Capital, LLC • Banyan Capital Partners • Birch Hill Equity Partners
Management Inc. • Bridgepoint • Brookfield Asset Management Inc. • CAI Private Equity • Canaan Partners • Cartesian Capital Group, LLC • Castik Capital • Castlelake, L.P. • Celtic House Venture Partners Inc. • Cinven Partners LLP • Clearspring Capital LP • CVC Capital Partners • FountainVest Partners • Francisco Partners • Fulcrum Capital Partners • Gamut Capital Management • Greenstone Venture Partners • GTCR, LLC • H&Q Asia Pacific • HarbourVest Partners, LLC • Hayfin Capital Management LLP • Hellman & Friedman LLC • India Value Fund Advisors • Jasper Ridge Partners • Leonard Green & Partners, L.P. • Lone Star Funds • McKenna Gale Capital Inc. • McLean Watson Capital • MBK Partners • MWI & Partners Inc. • Navis Capital Partners • New Mountain Capital, LLC • Newstone Capital Partners, LLC • Northstar Advisors Pte. Ltd. • Oaktree Capital Management, L.P. • Orchid Asia Group Management, Ltd. • Pacven Walden, Inc. • PAI Partners SAS • Pantheon Ventures (UK) LLP • Parallel49 Equity • Penfund
• PineBridge Investments • Polaris Partners • Richardson Capital Limited • RRJ Capital • Searchlight Capital Partners • Spring Lane Management, LLC • TA Associates Management, L.P. • The Carlyle Group • TorQuest Partners • TPG Capital • Trimble Hill Management Inc. • TriWest Capital Partners • Turkven • Vanedge Capital • Wayzata Investment Partners
• Yaletown Venture Partners
PUBLIC EQUITIES • Acadian Asset Management Inc. • Allianz Global Investors
Asia Pacific Limited • APS Asset Management Pte. Ltd. • Connor, Clark & Lunn Investment
Management Ltd. • Corston-Smith Asset Management Sdn
Bhd • Fidelity Investments Canada ULC • Green Court Capital Management Limited • J.P. Morgan Asset Management
(Canada) Inc. • Pier 21 Asset Management Inc./C
Worldwide • Quantum Advisors Private Limited, India • Red Gate Asset Management
Company Limited • Schroder Investment Management
(Hong Kong) Limited • Van Berkom and Associates Inc. • Vontobel Asset Management, Inc. • Walter Scott & Partners Limited
• Wellington Management Company LLP
REAL ESTATE • GWL Realty Advisors Inc. • Parkbridge Lifestyle Communities Inc. • Realstar Group • The Jawl Group • QuadReal Property Group

76 ANNUAL REPORT 2017–2018
Our Executive Management Team
Gordon J. Fyfe Chief Executive Officer / Chief Investment Officer
Shauna Lukaitis Chief Operating Officer
Dean Atkins Senior Vice President, Mortgage & Real Estate Investments
Stefan Dunatov Senior Vice President, Investment Strategy & Risk
Daniel Garant Senior Vice President, Public Markets
Norine Hale Senior Vice President, Human Resources
Michelle Ostermann Senior Vice President, Consulting & Client Services
Jim Pittman Senior Vice President, Private Equity
Lincoln Webb Senior Vice President, Infrastructure & Renewable Resources

77ANNUAL REPORT 2017–2018
ECO-AUDIT ENVIRONMENTAL BENEFITS STATEMENT
The BCI annual report is printed with vegetable-based inks, on paper that is made from 100 per
cent post-consumer recycled content. The stock is manufactured with renewable, non-polluting,
wind-generated electricity, and is sourced from certified suppliers that support the growth of
responsible forest management. By using this environmentally friendly paper, BCI has saved the
following resources:
Printed by Hemlock Printers Ltd. In addition to
being named the Most Environmentally Progressive Printer in Canada for ten of the last twelve years,
Hemlock Printers has the distinction of being the
first printing company in Canada to achieve carbon neutral status.
Photographs provided by: Derek Ford Studios and Shutterstock
We welcome your comments and suggestions on our annual report.
Please contact: Gwen-Ann Chittenden
Director, Communication and Government Relations
778 410 7310 | [email protected]
Environmental impact estimates were made using the Environmental Paper Network Calculator.For more information visit http://calculator.environmentalpaper.org
trees
16fully grown
water
4,920litres
solid waste
25kilograms
greenhouse gases
3,134kilograms
energy
6.8million BTU
100%

BRITISH COLUMBIA INVESTMENT MANAGEMENT CORPORATION750 Pandora Ave, Victoria BC V8W 0E4 CANADA / BCI.ca
BCI is the investment agent for many institutional clients; the views and opinions expressed in this report are those of BCI and do not necessarily represent the views of its clients. The information in this report is provided as of the date hereof. Neither the delivery of the report nor any further discussions in relation to BCI will under any circumstances create any implication that there has been no change in the affairs of BCI since the date of this report. All rights reserved. Contents copyright © BCI 2018.
This annual report has been made carbon neutral by Zerofootprint. Printed within a carbon neutral facility, the carbon emissions from paper manufacturing, transport, and disposal were offset with investments in ISO-compliant forestry projects.