Embed Size (px)
Citation preview

1
Cornelius Elementary
3rd and 4th Grade Science Fair Handbook Science can answer a world of questions.
Just follow these easy steps and you too can create a wonderful award winning science project.
Ms. Martinez / Ms. Putman 3rd and 4th Grade Science

2
2
Table of Contents
Letter to Parents and Guardians…………………………...………………………………………….Page 3 Project Schedule……….……………………………………...………………………………………….Page 4 Journal Requirements…………………………………………..……………………………….………Page 5 Notebook Requirements…………………………………………...………………..………….………Page 6 Problem Statement / Question………………………………………..…………………………..…Page 7-8 Research………………………………………………………………...…...…………………………….Page 9 Bibliography…………………………………………………………….……………………………….Page 10 Hypothesis…………………………………………………………………….………………………….Page 11 Testing the hypothesis by doing the experiment: Variables…………………..…………..……Page 12 Testing the hypothesis by doing an experiment: Materials………………………..……………Page 13 Testing the hypothesis by doing an experiment: Procedures……………………….…………Page 14 Testing the hypothesis by doing an experiment: Data Chart…………………………………Page 15
Graphs……………………………………………………..……..….……………..………….….....Page 16-17
Results……………………………………….………………………………..….……………………….Page 18
Conclusion………………………………….………………………………..….………………………Page 19
Display Board Guidelines…………………………………………………………………...…………Page 20
Display Board………………………………………………………………….………………………….Page 21 Model………………………………………………………………………….………………………......Page 22 Rubric …………………………………………………………………………………………………Page 23-24
3
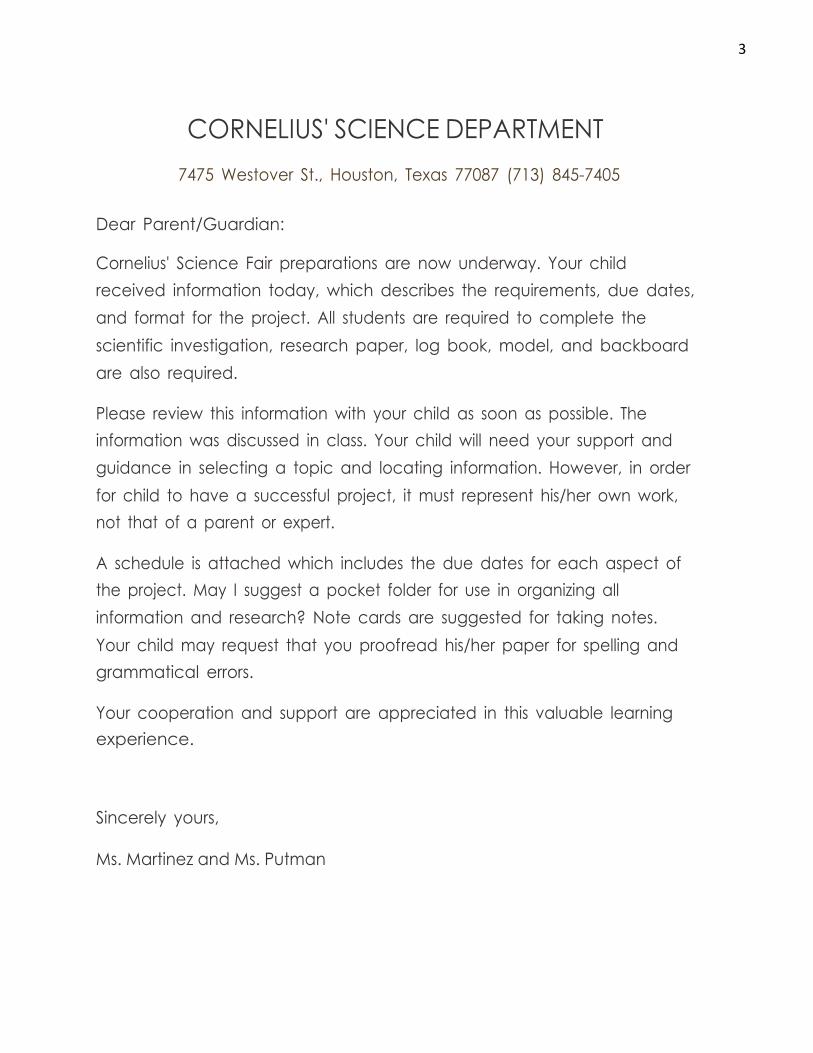
CORNELIUS' SCIENCE DEPARTMENT
7475 Westover St., Houston, Texas 77087 (713) 845-7405
Dear Parent/Guardian:
Cornelius' Science Fair preparations are now underway. Your child
received information today, which describes the requirements, due dates,
and format for the project. All students are required to complete the
scientific investigation, research paper, log book, model, and backboard
are also required.
Please review this information with your child as soon as possible. The
information was discussed in class. Your child will need your support and
guidance in selecting a topic and locating information. However, in order
for child to have a successful project, it must represent his/her own work,
not that of a parent or expert.
A schedule is attached which includes the due dates for each aspect of
the project. May I suggest a pocket folder for use in organizing all
information and research? Note cards are suggested for taking notes.
Your child may request that you proofread his/her paper for spelling and
grammatical errors.
Your cooperation and support are appreciated in this valuable learning
experience.
Sincerely yours,
Ms. Martinez and Ms. Putman

4
4
TO COMPLETE THE PROJECT ON TIME YOU MUST TRY TO ADHERE TO THIS SCHEDULE Week What should I be working on?
What is due at each CHECKPOINT? Due
Dates Completed
1 CHECKPOINT #1: Turn in your testable question and think about how you will investigate it / Identify dependent and independent variables.
Nov. 16-‐20
2
CHECKPOINT #2: Turn in your testable hypothesis. Nov. 30-‐4
CHECKPOINT #3: List of materials and procedures (plan).
Dec. 7
· Gather materials and begin your experiment. · Collect data. Keep careful, written records of results in a journal. Record the day and time you make observations. · Take photographs or draw diagrams of various stages of your project, if appropriate.
6
CHECKPOINT #4: Continue to conduct your experiment and collect data. Turn in data chart, graph, and written results.
Dec. 14
CHECKPOINT #5: Conclusion · Organize your data and results in a table AND in a graph (bar graph, line graph, circle graph, stem & leaf, etc.). · Analyze your results. Calculate mean, median, and/or mode, if appropriate. · Write results in a written paragraph · Form and write a conclusion including all necessary parts.
Dec. 18
7
CHECKPOINT #6: FINAL Research and bibliography Jan. 5
Type the final Report to be included with your display Jan. 7
8 · Construct your exhibit. Use a display board to mount information showing each part of your well-designed investigation. Include headings for each section. Also include graphs, charts, illustrations, photographs, and models. · Prepare a brief oral presentation (less than 5 minutes).
9 Bring your completed display board, model, journal, and typed report to school in a bag. Bring it to class on your assigned date (presentation calendar).
Assigned Date

5
______________________________________________________________Journal Requirement
Keep a Journal Use the composition journal that I gave you for recording all measurements and observations.
!
! ! !
Begin recording in your journal as soon as your topic is approved.
Keep all information recorded until the project is completed. Record when you get your materials, each time you work on your project, any observations you make throughout this process, and the results of any experiments. Include every step of the scientific method (including a table of contents, brainstorming, introduction (why did you choose this project and how do you plan on doing it), problem statement, research, bibliography, hypothesis, materials, procedures, variables, data chart, graphs, results, conclusion, sketch of the board)
***You will need everything that is in your journal for your notebook and board***
Record information on a daily basis and consider the following things:
! !
!
!
!
!
Make sure that accurate metric measurements are given in your data. Give masses in grams, volumes in milliliters, and linear measurements in centimeters.
It is better to have too much data than not enough so keep a lot of notes.
When making an observation, write down the date and time.
Keep track of the materials used, their quantities and cost.
Consider taking photographs to be used in your display. (Please don’t show student faces in these photos.)
When you make your project model, make sure you document how you made it.

6
6
______________________________________________________Notebook Requirements
Your 3-ring binder must contain, in the following order, the following sections:
✁ Every Page in your notebook (binder) MUST be typed and double-spaced
using 14-font / include a page number on the bottom right corner, which you’ll
use in the table of contents / each page should contain a centered title on top,
except for the title page
1. Cover Page (Title / Teachers Name / Date)
2. Table of contents
3. Introduction
4. Problem Statement
5. Research (2-3 Pages / 14 font / Times font / doubled-spaced)
6. Hypothesis
7. Materials
8. Procedures
9. Variables
10. Data Chart (computer generated)
11. Graph (computer generated)
12. Results
13. Conclusion
14. Bibliography
(search engines are NOT resources such as Google or Yahoo)

7
7
_______________________________________ Problem Statement (Testable Question)
A science fair project begins with a good testable question. For many students, the hardest part of a science fair project is selecting a good question. Select a question that is interesting to you. The question should lead to an experiment where something is changed and the result is measured. A good question:
" Must lead to an investigation (experiment) not a report, demonstration or model. The question may ask about the effect of one thing on another.
" Is one from which you can collect measurable data or direct observations rather than opinions.
" Should be very narrow and specific, not broad. " Is one in which the materials needed to experiment are easy to find.
To come up with a testable question, begin by thinking about something you’ve OBSERVED. For example, have you ever played with a parachute? Think about what VARIABLES may affect the speed at which the parachute falls (size, shape, weight, material, length of strings, number of strings, etc.).
Select one variable to test and formulate your testable question. Example: How does the type of material of the parachute’s canopy affect the rate at which it falls?
To give you an idea of what we mean you can start off by filling in the question blanks with the following list of words:
The Effect Question What is the effect of __________________ on ____________________?
sunlight the growth of plants eye color pupil dilation brands of soda a piece of meat
The How Does Affect Question How do / does the ___________________ affect ___________________?
color of light the growth of plants humidity the growth of fungi color of a material its absorption of heat

8
8
The Which/What and Verb Question Which/What _____________________ (verb) ______________________?
paper towel is most absorbent foods do meal worms prefer detergent makes the most bubbles
Which __(detergent brand)__ is more effective for __(removing stains)__?
Which ______(battery brand)______ last the longest?
Which type of _____(seed)______ do ______(birds)_____ prefer? Examples of good questions:
" How does temperature affect the bounce of a ball?
" What shape container will allow water to evaporate the quickest?
" Does the drop height of an object affect the size crater it will make?
Examples of poor questions: " How do volcanoes erupt? This question is poor because it is a model not an
experiment, is too vague/broad, and will not involve data collection.
" Why are there craters on the moon? The question is not an experiment and would require only research, not experimentation to answer.
" How do bean plants grow? This question is too broad and would require research rather than experimentation and collecting data.
9
9
____________________________________________________________________Research
So you’ve picked your category and you’ve chosen a topic. You even wrote a question using our cool fill in the blank template. Now it is time to research your problem as much as possible. Becoming an expert at your topic is what real scientists do in real labs. So how do you become an expert? YOU READ!!!! READ about your topic. READ encyclopedias. READ magazine articles and books from the library. READ articles from the internet. Take note of any new science words you learn and use them. It makes you sound more like a real scientist. Keep Track of all the books and articles you read. You’ll need that list for later. YOU DISCUSS!! Talk about it with your parents. Talk about it with your teachers. Talk about it with experts like Veterinarians, Doctors, Weathermen or others who work with the things you are studying. Research: My problem is about this subject: __________________________________ (sample topics could be magnetism, electricity, buoyancy, absorbency, taste, plant growth, simple machines or other scientific topics that relate to your problem. If you are having problems finding out what the topic is, ask your teacher or an adult to help you on this one….) Books I found in the library on my topic are: Title: Author: ______________________________________________________________________________ ______________________________________________________________________________
Internet sites that I found on my topic are: ______________________________________________________________________________ ______________________________________________________________________________
People I talked to about my topic are: ______________________________________________________________________________ ______________________________________________________________________________
Some important points that I learned about my topic are ______________________________________________________________________________ ______________________________________________________________________________ ______________________________________________________________________________ ______________________________________________________________________________

10
10
_________________________________________________________________Bibliography
Writing a Bibliography When you write a bibliography, you are listing all of the sources of information you used to write your paper in alphabetical order. For the different types of sources follow the examples listed below.
BOOKS Author (last name, fist name). Title of the book. City where book is published: Publisher, Copyright date.
Tillerman, Jon. The Way the Earth Moves. Chicago: McMillian, 1998.
MAGAZINES Author (last name, fist name). “Title of the article.” Title of Magazine Date (day month year): page numbers of article.
Smith, Sarah J. “Why Don’t We Fall from Rollercoasters?” Science News 8 July 2000: 77-79.
FILMS, SLIDES. or VIDEO TAPES Title. Medium (state if it is a film, slide, video tape, laser disc etc). Production company, date. Time length
Under the Microscope- Amoebas. Videocassette. Science and Kids Productions, 1994. 15 minutes.
INTERVIEWS Person you interviewed (last name, first name). Type of interview. Date.
Aberwitz, Shelly. Personal interview. 20 Sept. 2002.
ON LINE SOURCES (Websites) Author (last name, first name – if there is one) “Title of Article”. Title of Website or Publication. Date of Publication (or last update). On-line. Date of access (when you went to website). Available website address.
“Deserts”. BrainPop. 2002. Online. 13 May 2002. Available: http://www.brainpop.com/science/ecology/desert/index.weml

11
11
___________________________________________________________________Hypothesis The HYPOTHESIS is another name for a PREDICTION. When you are writing the hypothesis you are trying to predict the answer to your question. You should always give a reason for your prediction either from your own experiences or from research you have done. What do you think will happen, (even before you start your experiment)? A hypothesis is stated in one sentence. No more, no less. All hypotheses should be written in an “If…then…because” format. If you have a difficult time summarizing your hypothesis into one sentence, then it’s clear that you need to narrow down your study. For example: Question: Does soaking the bean seed before planting it affect how fast it will grow? Possible Predictions: If I plant bean plants that have their seeds soaked before planting then they will grow faster because it will make the hard seed covering soft.
-or-
If I do not plant bean plants that have their seeds soaked before planting then they will grow faster because they will just make the seed mushy.
(This hypothesis not only predicts what will happen in the experiment, but also shows that the “Scientist” used research to back up his prediction.)
Now it’s your turn Write down the hypothesis based on what you have researched.
Hypothesis:
______________________________________________________________________________
______________________________________________________________________________
______________________________________________________________________________
______________________________________________________________________________

12
12
____________________________________________________________________Variables
There are three types of variables that must be considered when determining the procedure to be followed:
" Independent variable – the factor that you will change on purpose during the experiment to find out what effect it has on something else.
Example: different types of materials (silk, felt, canvas, paper, tissues, etc.) to construct a parachute to observe the effect the type of material has on the drop time of the parachute
" Dependent variable – the factor that is observed and measured to see if it is affected by the change made in the independent variable.
Example: The dependent variable in the parachute investigation would be the time the parachute took to drop.
" Control /Constant variables – the factors in the experiment that must be kept exactly the same to make sure that they are not having any effect on the dependent variable. They ensure that you are conducting a fair test.
Example: Variables that would need to be controlled in the parachute experiment would be the size of each parachute made, the same mass tied to the parachute, and the height the parachute were dropped from.
The procedure should reflect that you collected enough data to support your conclusion. Therefore, make sure you use a large sample or conduct multiple trials for your experiment. The larger your sample size or the more trials you conduct, the more conclusive and better your results will be. For example, when working with plants, do not just plant one seed in the light and one seed in the dark and use the results from those two plants as your data. Planting twenty or more seeds in the light and twenty or more seeds in the dark would provide a large sample size. In the parachute experiment, drop the parachute 6 times to test how fast it drops rather than just dropping it one time.
Use a large sample size to obtain more conclusive (valid) results.

13
13
____________________________________________________________________Materials
Testing your Hypothesis by doing an Experiment
Now we’ve come to the good part. The part that all scientists can’t wait to get their grubby little hands on… you guessed it… The EXPERIMENT! Designing an experiment is really cool because you get to use your imagination to come up with a test for your problem, and most of all, you get to prove (or disprove) your Hypothesis. Now Science Fair Rules state that you cannot perform your experiment live, so you’ll have to take plenty of pictures as you go through these seven very simple steps.
First: Materials
Your MATERIALS is a list of all of the items you will need in order to conduct your experiment. As you develop your procedure, you may need to add to your materials list. Oh, did we mention to take pictures or draw pictures of your materials. This will come in handy when you are making your board display.
Remember to: ! ! !
Be specific Give amounts and sizes Use METRIC measurements (grams, centimeters, meters, milliliters, Celsius)
Good Listings
3 – 15x15cm. Sq. each of: Brawny, Gala, Scott, and Generic paper towels
250 ml graduated cylinder
750 ml water 20 degrees Celsius
1- 20x20 cm. Sq. cake pan
Celsius Thermometer
Clock with a second hand
Poor Listings
Paper Towels
Measuring Cup
Water
Container
Celsius Thermometer Clock

14
14
___________________________________________________________________Procedures
Testing your Hypothesis by doing an Experiment Second: Write a PROCEDURE (Step-by-Step)
PROCEDURES are a detailed step-by-step set of directions of how to conduct the experiment. Details are very important here. Be sure to tell exact amounts of things such as materials, time it will take, etc. It is important that anyone be able to follow your steps and repeat your experiment exactly as you did it. You MUST have at least 3 repeated trials and clearly identify what you are keeping the same and what you are changing (variables) to ensure a well-designed investigation.
Did we mention to take pictures of you doing the steps? The materials and procedure should be listed in bulleted format. Simply list the materials you used with bullets and list your procedure steps with numbers.
An example: Question: Do all brands of paper towels absorb the same amount of water? Procedures:
1. Cut 3 – 15x15 cm. Sq. from each brand of paper towels 2. Label each cut piece with brand name 3. Pour 50 ml. of 20 degrees Celsius of water into 20x20 cm. Sq. pan 4. Place 1 square of generic brand of paper towel into the water and pan 5. Leave for 30 seconds 6. Remove the paper towel out of the water 7. Measure the water remaining in pan and record 8. Dry the cake pan 9. Repeat steps 4-3 for each brand of paper towel
10. Repeat the entire process two more times for each brand of paper towel (multiple trials)
Fourth: TEST, TEST, TEST. Remember that the judges expect your results to be consistent in order to be a good experiment; in other words, when you cook from a recipe you expect the outcomes to be the same if you followed the directions (or procedure) step by step. So that means you need to do the experiment more than once in order to test it properly. We recommend three times or more. More is better! Don’t forget to take pictures of the science project being done and the results.

15
15
column heading
___________________________________________________________________Data Chart
Testing your Hypothesis by doing an Experiment Before you start conducting your experiment, it is important that you have thought out your data collection. Fifth: Collect your DATA. This means write down or record the results of the experiment every time you test it. Most scientists use tables, graphs and other organizers to show their results. Organizing makes the results easy to read, and much easier to recognize patterns that might be occurring in your results. But don’t make a graph or table because we asked you to, use it to benefit your project and to help you make sense of the results. There is nothing worse than having graphs and tables that have nothing to do with answering the question of a science project.
Use a chart to organize and record the measurements that you make. Steps:
1. Title and number your data chart/table 2. Decide how you will organize the table into columns and rows 3. Any units, such as seconds or degrees, should be included in column
headings, not in the individual cells
Always number and title Dependent Variable
Independent Variable
Plants Need Water
data tables/chart
Put UNITS in
6 Columns — Vertical — Up and Down
Remember you will need accurate data to create a graph, report your results, and draw a conclusion.
Amount of water
Plant Growth (cm) Trial 1 Trial 2 Trial 3 Trial 4 Trial 5
10 ml
20 ml
30 ml Horizon
tal 4 Row
s

16
16
______________________________________________________________________Graphs
All information that you collect and write about in your results section will also be represented in a graph and a data table. Your results, graphs and data tables will include the same information throughout, but the information will be displayed in different ways.
Your graphs and data tables must be computer generated. Hand drawn work will not be accepted and you will receive a zero for this section as a result.
Graphs When choosing a graph, be sure to use the most appropriate one. Line graphs should be used to display continuous data. Experiments that have dependent variables that involve temperature, time, mass, height or distance will usually result in data that can be graphed on a line graph. On a line graph, the horizontal (x) axis is always the independent variable and the vertical (y) axis is always the dependent variable. It should also have:
! ! !
Numbers (scale) in even intervals (1’s, 2’s, 5’s, 10’s, 100’s, etc.) Labels for the horizontal and vertical axes. A title that reflects the information that is being graphed.
Bar Graphs should be used to display data that separate or that is distinct from other pieces of data. The data in a bar graph can be displayed either vertically or horizontally. A bar graph should include:
! ! !
Numbers (scale) in even intervals (1’s, 2’s, 5’s, 10’s, 100’s, etc.) Labels for the horizontal and vertical axes. A title that reflects the information that is being graphed.
Pie Graphs should be used only when the results are best shown as a percentage of a whole. The data of a pie graph should include:
! !
! !
A circle that is divided into the necessary number of parts. Sections (or slices) of the pie should be sized accurately according to the data. Each section of the pie should be labeled or color-coded with a key. A title that reflects the information being graphed.
Be extra careful when using a computer to create your graphs. The computer will create any graph you want, whether it is the correct graph or not. Also, many computer graphs leave off important titles and labels.
20

17
17
______________________________________________________________________Graphs
Website that can help you make a graph http://nces.ed.gov/nceskids/createagraph/default.aspx
What should be on you graph? You will need to draw the graph in your composition journal in pencil first, and then create it on the computer. 1. Collect your data. After you have it all in one place, you should have one independent variable and one dependent variable. 2. Determine the range of your data. In order to determine how big a graph to make, we need to determine how much the numbers vary. The independent variable will go on the x-axis (the one parallel to the bottom of the page), and the dependent variable will go on the y-axis (parallel to the left hand side of the page). So, draw axes that are big enough for all the data. 3. Label your graph and your axes. THIS IS VERY IMPORTANT! When presented with your graph, other people should be able to figure out what is plotted without asking you.
! ! !
Titles of graphs are usually "Y versus X" Labels on the axes must have units! (such as centimeters, seconds) Remember to write the numbers on the graph, too. The numbers should be evenly and logically spaced - what I mean by this is the following: for our position data here, the y-axis should be marked off in increments like (1,2,3,4,5,6) or (2,4,6,8), NOT (1.3, 2.6, 4.8,..) or anything else weird.
4. Plot your data.
21

18
18
_______________________________________________________________________Results
The results are also required and should be at least a paragraph long. The purpose of the results is to help explain the data displayed in the chart and graph. RESULTS may also include photographs and diagrams that help to display and understand the data. The results are a brief explanation of the data on the chart and graph. It can include any trends (pattern) that may occur in the data. This is not the conclusion. It is simply a summary of what the data shows.
The purpose of a science fair project is to determine if there is a relationship between the independent and dependent variables tested in the experiment. Once you have done your experiment and collected all of your data, you will need to summarize your findings and report them in your results and analysis section. You will simply take all of the data written down in the research journal over the time it took you to finish your experiment and convert that information into a paper that describes in detail what your results were. If feeding mint plants different liquids was the study, listing how much each of the plants grew and how long it took them to grow would be information that is listed in the results section. The key to this section is detail. Be specific. A few extra words can be the difference in a well-written paper.
Your results should follow these guidelines:
1. Include what you wanted to accomplish and prove during your experiment.
2. Write your data on graph or chart into complete sentences.
3. Describe and report what you discovered. Be sure to include any data that might have been collected. It is important to show this data even if it did not support your hypothesis. The process of completing the experiment with true data is what is important.
4. The function of the Results section is to objectively present your key results, without interpretation.
5. Make sure you use a large sample or conduct multiple trials for your experiment. The larger the sample size or the more trials you conduct, the more conclusive and better your results be.

19
19
___________________________________________________________________Conclusion
The conclusion includes how the results were interpreted. The conclusion should start with a single sentence that directly parallels the hypothesis. For example, After performing this experiment I can conclude that my hypothesis was (supported/not supported)…because…
This section is reserved for your thoughts. Why did you come up with the results you did? Were there any differences or similarities between your findings and the findings of others? Is there anything you would do differently the next time around? Did anything surprise you as you did this experiment?
All of those questions are worth answering for any scientific experiment. Once again, this section needs to be detailed and specific. Convince the reader that your results prove something. Convince the reader that you proved something to be true or false. Pretend that the person reading this has no previous knowledge on this subject and that it is your job to provide them with accurate information.
Write a Conclusion
!
!
!
!
!
!
Now tell us what you learned from this and if you were able to prove your hypothesis.
Did it work? Why did it work or why didn’t it work?
Were there any problems with the investigation or things I would do differently?
What did the results tell you? Sometimes not being able to prove a hypothesis is important because you still proved something.
How does what I learned apply to the real world?
What did you prove? What would you do in the future?
20
20
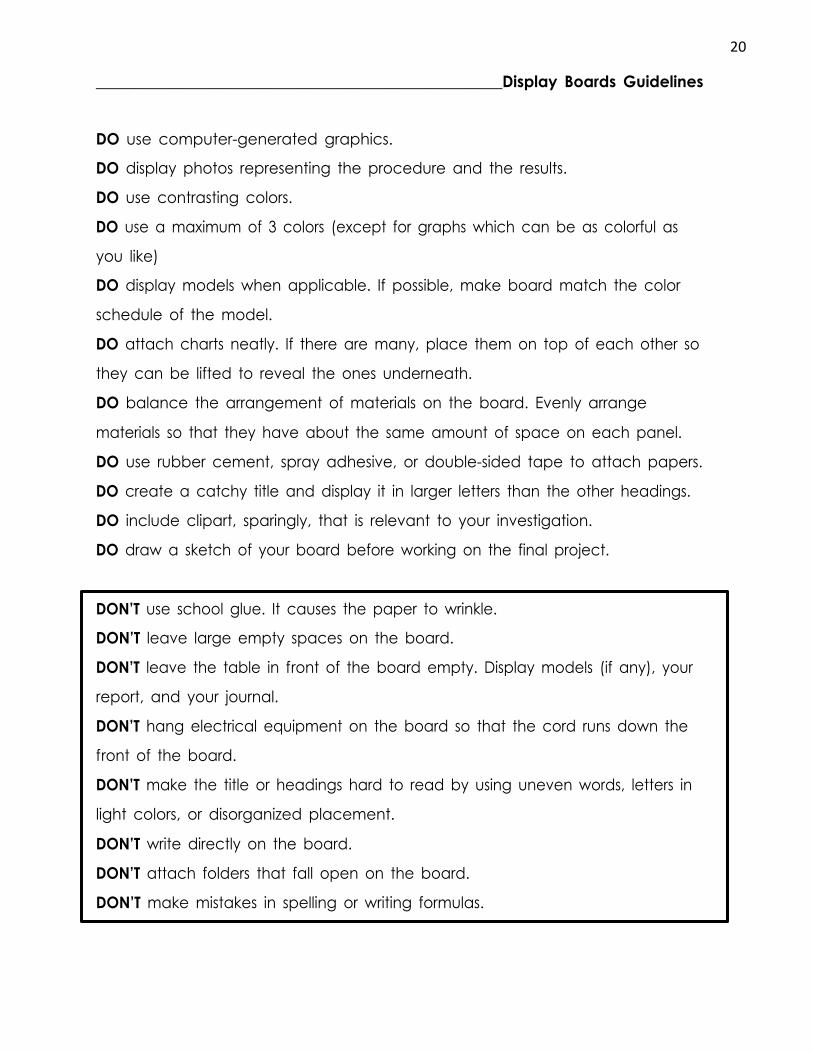
____________________________________________________Display Boards Guidelines
DO use computer-generated graphics.
DO display photos representing the procedure and the results.
DO use contrasting colors.
DO use a maximum of 3 colors (except for graphs which can be as colorful as
you like)
DO display models when applicable. If possible, make board match the color
schedule of the model.
DO attach charts neatly. If there are many, place them on top of each other so
they can be lifted to reveal the ones underneath.
DO balance the arrangement of materials on the board. Evenly arrange
materials so that they have about the same amount of space on each panel.
DO use rubber cement, spray adhesive, or double-sided tape to attach papers.
DO create a catchy title and display it in larger letters than the other headings.
DO include clipart, sparingly, that is relevant to your investigation.
DO draw a sketch of your board before working on the final project.
DON’T use school glue. It causes the paper to wrinkle.
DON’T leave large empty spaces on the board.
DON’T leave the table in front of the board empty. Display models (if any), your
report, and your journal.
DON’T hang electrical equipment on the board so that the cord runs down the
front of the board.
DON’T make the title or headings hard to read by using uneven words, letters in
light colors, or disorganized placement.
DON’T write directly on the board.
DON’T attach folders that fall open on the board.
DON’T make mistakes in spelling or writing formulas.

21
21
Board, Journal, Notebook, and Model should be in a bag
(garbage bag) and your name should be on the bag!
_______________________________________________________________Display Boards
Problem Research Hypothesis Materials
TITLE
IMAGE 1 IMAGE 2 IMAGE 3
DATA
CHART/TABLE GRAPH
Procedures
Variables
Results
Conclusion
Bibliography
LOGBOOK
MODEL NOTEBOOK
22
22
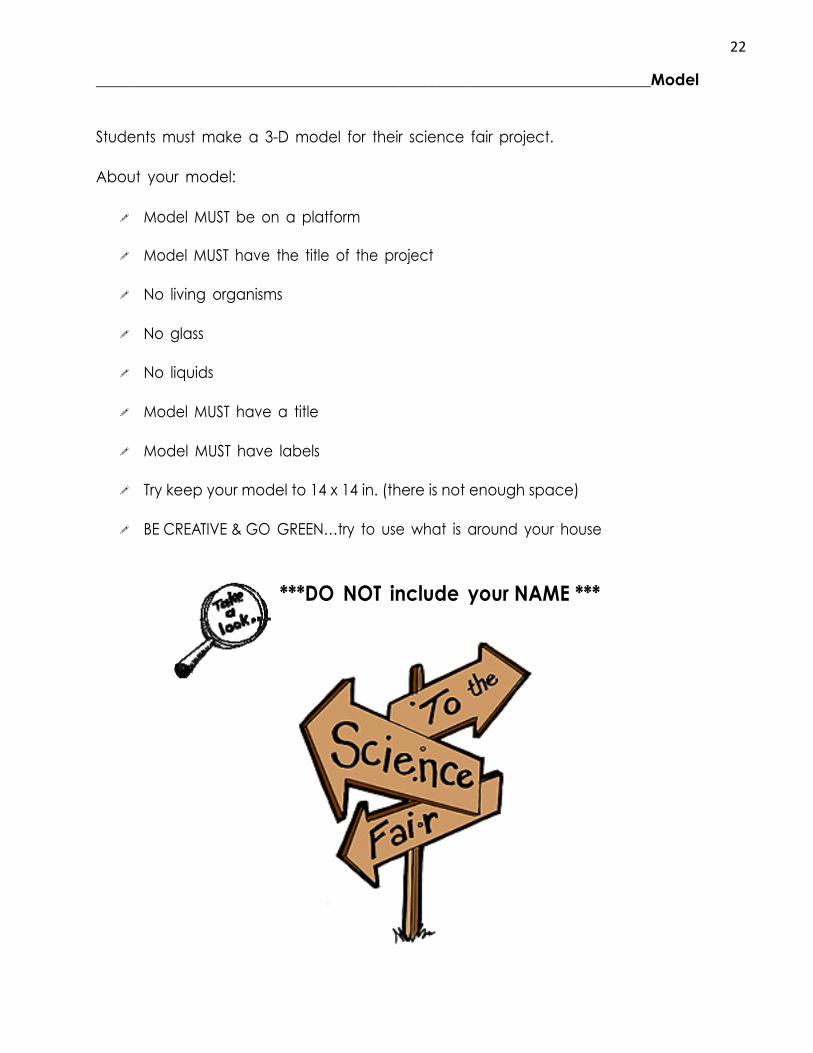
_______________________________________________________________________Model
Students must make a 3-D model for their science fair project.
About your model:
!
!
!
!
!
!
!
!
!
Model MUST be on a platform
Model MUST have the title of the project
No living organisms
No glass
No liquids
Model MUST have a title
Model MUST have labels
Try keep your model to 14 x 14 in. (there is not enough space)
BE CREATIVE & GO GREEN…try to use what is around your house
***DO NOT include your NAME ***
23
23
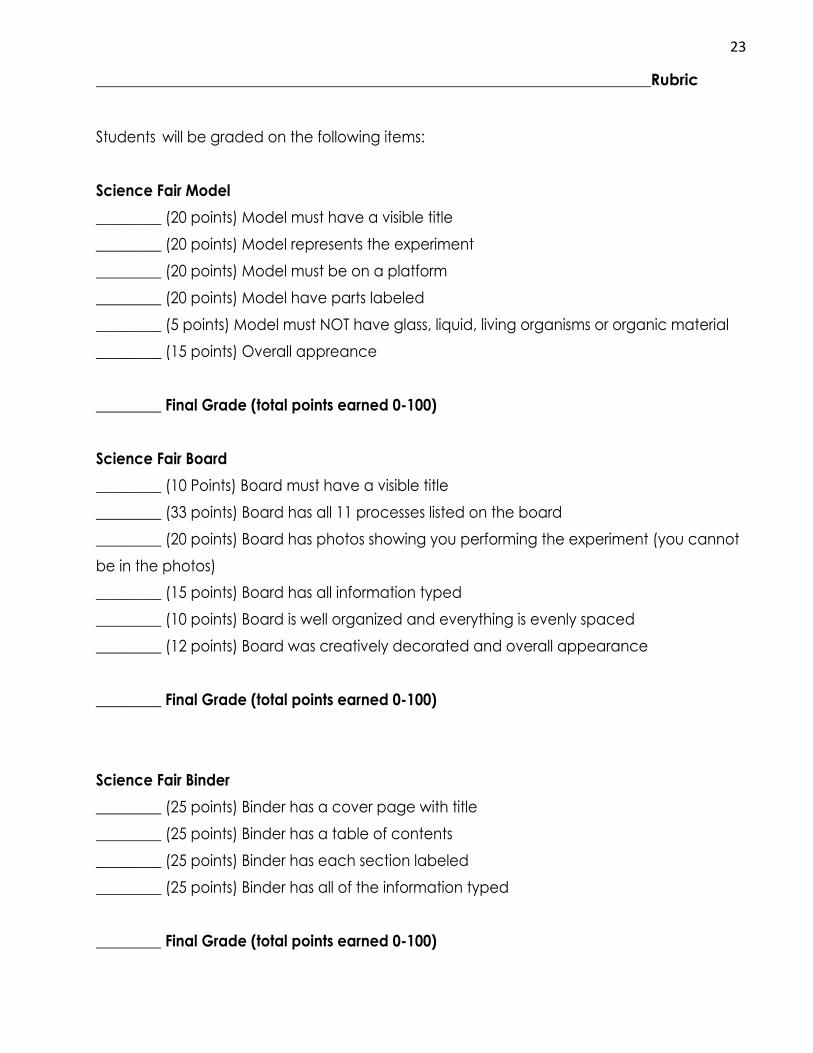
_______________________________________________________________________Rubric
Students will be graded on the following items:
Science Fair Model
_________ (20 points) Model must have a visible title
_________ (20 points) Model represents the experiment
_________ (20 points) Model must be on a platform
_________ (20 points) Model have parts labeled
_________ (5 points) Model must NOT have glass, liquid, living organisms or organic material
_________ (15 points) Overall appreance
_________ Final Grade (total points earned 0-100)
Science Fair Board
_________ (10 Points) Board must have a visible title
_________ (33 points) Board has all 11 processes listed on the board
_________ (20 points) Board has photos showing you performing the experiment (you cannot
be in the photos)
_________ (15 points) Board has all information typed
_________ (10 points) Board is well organized and everything is evenly spaced
_________ (12 points) Board was creatively decorated and overall appearance
_________ Final Grade (total points earned 0-100)
Science Fair Binder
_________ (25 points) Binder has a cover page with title
_________ (25 points) Binder has a table of contents
_________ (25 points) Binder has each section labeled
_________ (25 points) Binder has all of the information typed
_________ Final Grade (total points earned 0-100)

24
24
Science Fair Journal (Everything must be handwritten or points will be deducted for each page)
_________ (5 points) Journal has a cover with title
_________ (5 points) Journal has a table of contents
_________ (5 points) Journal has pages numbered
_________ (5 points) Journal has a written introduction (explains why you chose this project)
_________ (5 points) Journal has a problem statement/question with an independent and
dependent variable
_________ (15 points) Journal has a hypothesis written correctly (if…then…because)
_________ (15 points) Journal has 2-3 pages of research on the topic
_________ (5 points) Journal has 3 or more resources for bibliography
_________ (5 points) Journal has all materials listed with accurate measurments
_________ (5 points) Journal has the independent, dependent, and constant variable listed
_________ (5 points) Journal has procedures/steps accurately stated and in sequential order
_________ (5 points) Journal has a data chart
_________ (5 points) Journal has a graph (graph must include the x-axis and y-axis labels)
_________ (5 points) Journal has results with an explaination but summerizes the data patterns
and trends
_________ (10 points) Journal has a conclusion that reflects whether the hypothesis was
supported or not supported, data, any variables/factors that could have effected the
experiment, and future statement
_________ Final Grade (total points earned 0-100)
Science Fair Presentation
_________ (25 points) Student must speak loud and clearly
_________ (25 points) Student face the audience and not the board
_________ (25 points) Student must be able to answer questions about the project
_________ (25 points) Student must be knowledgable about experiment they performed
_________ Final Grade (total points earned 0-100)