Embed Size (px)
Citation preview

Coral thermal microclimate:
Investigating the effects of irradiance, flow and
coral thermophysical properties
Isabel Margarita Jimenez-Denness
(Dipl. Eng. Physics)
A thesis submitted for the degree of Doctor of Philosopy
Department of Environmental Sciences
University of Technology, Sydney, Australia
January 2009

Certificate
I certify that this thesis has not already been submitted for any degree and is not being
submitted as part of candidature for any other degree.
I also certify that the thesis has been written by me. Any help that I have received in
my research work and the preparation of the thesis itself has been acknowledged. All
information sources and literature used are indicated in the thesis.
Signature of Candidate
I. M. Jimenez-Denness

Acknowledgements
I first would like to thank my principal supervisor, Assoc. Prof. Peter Ralph for contin-
uous support, indispensable advice and remarkable patience throughout my PhD. I also
want to thank Prof. Tony Larkum for his encouragement and precious advice, and Prof.
Michael Kilhl for teaching me microsensor techniques and for contributing to make my
first field campaign a very inspiring one. Prof. Greg Skilbeck provided indispensable
assistance in the materials testing component of my project, and all my supervisors con-
tributed inspiring and stimulating discussions throughout this journey.
I am very grateful for the advice and assistance of Rod Hungerford and Norman Booth
in the preparation of samples and the measurement of skeleton thermal diffusivity. The
help of Greg Evans, Paul Panos and Greg Dalsanto in the maintenance and preparation
of equipment was instrumental in the timely completion of field work. I also want to
extend my gratitude to the staff at Heron Island Research Station for their generous as-
sistance during field campaigns, and to Neil Ralph for constructing many components of
laboratory and field equipment. I especially want to thank members of the Aquatic Photo-
synthesis Group for the many good laughs these past few years, and occasionally helping
me keep my sanity during field campaigns.
The opportunity to embark on this project was first made possible by an International
Postgraduate Research Scholarship and a Faculty of Science Stipend, awarded to me by
the University of Technology, Sydney. I was able to attend conferences thanks to financial
support from the Australian Coral Reef Society and internal research allowances from the
University of Technology, Sydney.
Finally, I want to thank my family and friends, here and abroad, for support, encour-
agement and the occasional healthy dose of gossip. To Simon, thank you for your unwa-
vering, generous and uplifting encouragements, for putting up with the stress, frustrations
and financial hardship of this journey, and especially for making me laugh through panic
attacks. To my mum, thank you for understanding and accepting my relocation to the
other side of the world, I know it wasn't easy, and thank you for the regular shipments of
Swiss chocolate, that got me through the toughest spells of writer's block.
11

Contents
Certificate . . . . . .
Acknowledgements
Table of contents
List of figures
List of tables .
ii
lll
Vll
xiv
Abstract . . . xvi
1 Introduction 1
1.1 Coral reefs in an era of climatic warming 1
1.2 Microclimatic controls of coral physiology . 2
1.3 Bleaching patterns and possible links to the thermal microclimate 4
1.3.1 Intraspecific bleaching patterns . 4
1.3.2 Interspecific bleaching patterns ..
1.4 A biophysical approach .
4
5
1.5 Thesis outline . . . . . . 6
2 Theoretical and experimental overview of the thermal environment of corals 8
2.1 Introduction . . . . . . . . 8
2.2 Theoretical considerations l 0
2.2.1 Heat budget of a coral exposed to solar radiation and water flow . 10
2.2.2 Diffusive and thermal boundary layers . . . . . . . . . . . . . . 15
2.2.3 Heat and oxygen flux across the thermal and diffusive boundary
layers . . . . . 16
2.3 Materials and Methods 18
2.3.1 Corals . .... 18
ll1
2.3.2 Temperature microenvironment 18
2.3.3 Solar heating ......... 20
2.3.4 In situ temperature dynamics . . 20
2.4 Results ........... 22
2.4.1 Transient response ..... . .... 22
2.4.2 Steady state experiments 23
2.4.3 Thermal boundary layer 24
2.4.4 In situ temperature dynamics . . 28
2.5 Discussion . . . . . . . . 31
2.5.1 Boundary layers 33
2.5.2 Influence of flow rate . 34
2.5.3 Size and shape of corals 35
2.5.4 Implications for mass coral bleaching 37
3 In situ thermal dynamics of shallow water corals 40
3.1 Introduction . . . . . . . 40
3.2 Materials and Methods 42
3.2.l Site and sampling periods 42
3.2.2 Coral specimens .. . . 42
3.2.3 Coral optical properties . 42
3.2.4 Coral temperature measurements . 43
3.2.5 Coral photosynthetic health 44
3.2.6 Statistical analysis 44
3.3 Results ........... 45
3.3.1 Noon low tide experiments . ..... 45
3.3.2 Noon high tide experiment . 49
3.3.3 Chlorophyll a fluorescence measurements . 50
3.4 Discussion . . . . . . . . . . . . 51
3.4.1 Coral thermal dynamics 51
3.4.2 Interspecific differences 52
3.4.3 Physiological implications 53
IV

3 .5 Conclusion . . . . . . . . . . . . . . . . . . . . . . . . . . . . . . . . . 54
4 Effects of flow and colony morphology on the thermal boundary layer of
corals 55
4.1 Introduction . . . . . .
4.2 Materials and methods
4.2.1 Corals . . . . .
4.2.2 Boundary layer measurements
4.2.3 Polyp-scale thermal microenvironment
4.2.4 Flow experiment . . . . . . . . . . . . .
4.2.5 Dimensional analysis of heat and mass transfer
4.2.6 Coral reflectance spectra
4.2.7 Statistical analysis
4.3 Results . . . . . . . . . . . . . . . .
4.3.1 Thermal boundary layer mapping
4.3.2
4.3.3
4.3.4
4.3.5
4.3.6
Coral surface temperature ...
Surface oxygen concentration
Thermal and diffusive boundary layers .
Dimensional analysis of heat and mass transfer
Coral absorptivity ..
4.4 Discussion . . . . . . . . . .
4.4. l
4.4.2
4.4.3
4.4.4
4.4.5
4.4.6
Flow effects on coral surface temperature
Intra-colonial heterogeneity in thermal boundary layer
Inter-specific variability in coral heat budget .
Heat versus mass transfer . . . . . . . . .
Dimensional analysis as a modelling tool
Extrapolation to field conditions
4.5 Conclusion . . . . . . . . . . . . . . .
5 Thermal effects of coral optical characteristics
5.1 Introduction ... .. .
5.2 Materials and Method .
v
55
57
57
58
58
58
59
60
61
62
62
63
65
66
67
68
69
69
70
71
72
74
75
75
77
77
79

5.2.1 Corals ............ 79
5.2.2 Temperature measurements 80
5.2.3 Bleaching experiment ... 80
5.2.4 Coral thermal action spectrum 82
5.2.5 Statistical analysis 83
5.3 Results ... ........ ..... 84
5.3.1 Physiological response to the bleaching treatment . . . 84
5.3.2 Coral optical characteristics: reflectance spectra . 85
5.3.3 Coral thermal exposure and heat budget 87
5.3.4 Coral thermal action spectrum 88
5.4 Discussion . . . . . . . . . . . 91
5.4.1 Tissue light absorption 91
5.4.2 Potential influence of the skeleton 93
5.4.3 Interspecific differences in coral heat budget 93
5.4.4 Bleaching effects on coral tissue thermal exposure 95
5.4.5 Thermal effects of the spectral quality of absorbed light . . 95
5.5 Conclusion .... .. . . . . . . . . . . . . . . . . . . . . . . 98
6 A thermal model for corals 100
6.1 Introduction . . . . . . . 100
6.2 Materials and Methods 103
6.2.1 Model development . . 103
6.2.2 Parameter measurements . 106
6.2.3 Model validation 108
6.2.4 Sensitivity analysis . 108
6.2.5 Experimental procedures . . 109
6.3 Results ..... ... . . .. . . . 112
6.3.1 Thermo-physical properties of corals 112
6.3.2 Model validation 113
6.3.3 Sensitivity analysis . 114
6.3.4 Size and shape effects 116
VI

6.3.5 Field applications ..
6.4 Discussion . . . . . . . . .
6.5
6.4.1 Thermal role of the skeleton
6.4.2 Limitations . . . .
6.4.3 Field experiments .
Conclusion . .
7 General Discussion
7.1 Thesis outcomes .
7 .1.1 Insights from modelling heat transfer in corals
7 .1.2 Insights from microscale temperature measurements
7.1.3 Insights from absorptivity studies . . . . . . . . . . .
118
122
122
124
126
129
130
131
131
132
133
7. 1.4 Insights from field studies of in situ coral thermal dynamics 134
7 .2 Microclimatic effects on physiology and possible implications for bleaching 136
7.2.1 Intraspecific variability .
7 .2.2 Interspecific variability .
7.3 Summary of key findings
7.4 Conclusion
References
Appendices
A Measuring skeletal thermophysical properties
A.1 Skeleton specific heat ... .
A.2 Skeleton thermal diffusivity .
Vll
136
137
139
..... 140
141
164
166
166
168

List of Figures
2. l Conceptual diagrams of the relevant heat fluxes (and associated parame-
ters) in (a) a whole coral divided into sun exposed and shaded regions (of
surface areas A1 and A2 , respectively) and (b) in a small portion of sur-
face tissue: radiation absorption (absorptivity, a); heat loss to the skeleton
by conduction (skeleton conductance, K); heat loss to the water column
by convection (convection coefficient, h). Schematic temperature profile,
where Ttissue is the coral tissue temperature, Twater is the water temper-
ature away from the boundary layer, and Tskel is the skeleton core tem-
perature. Definition of the effective thickness (8) of the thermal boundary
layer (TBL), where b,.T is the coral surface warming (T - Twater) . . . . 11
2.2 Diagram of experimental setup used for measurements of temperature and
oxygen microenvironment. The temperature microsensor was mounted
on a motorized micromanipulator (MM) and connected to a thermocouple
meter (see text). For the 0 2 profiles, the temperature microsensor was
replaced by an 0 2 microelectrode connected to a picoammeter (see text). . 19
2.3 Polyp warming in response to a dark-light shift. (a) Hemispherical Cyphas-
trea serailia (50 mm diameter) and (b) Thin branch of Seriatopora hystrix
(3 mm branch thickness). . . . . . . . . . . . . . . . . . . . . . . . . . . 22
Vlll

2.4 Surface warming of branching Stylophora pistillata and hemispherical
Porites lobata placed in a flow chamber (0.2 cm s-1) under direct solar
irradiance. . . . . . . . . . . . . . . . . . . . . . . . . . . . . . . . . . . 23
2.5 Temperature and oxygen boundary layers for the hemispherical coral Favia
sp., measured in a flow chamber (0.2 cm s-1) under artificial light. Tem-
perature (0.2 cm s-1; 2080 µmol photons m-2 s-1); oxygen (0.2 cm s-1;
480 µmol photons m-2 s-1 ). . • . • • . . . • • • • • • • • . • • • • • • . 24
2.6 Effect of flow on the temperature profile for (a) a hemispherical Favia sp.
and (b) a branch of Stylophora pistillata, measured in a flow chamber and
artificial light ( 400 - 730 nm, 2080 µmol photons m- 2 s- 1 ) . • . . • . • • . 25
2.7 Effect of irradiance on the temperature profile in the thermal boundary
layer above a hemispherical Porites lobata (n = 4), measured in a flow
chamber (0.2 cm s- 1) under artificial light. . . . . . . . . . . . . . . . . . 27
2.8 In situ temperature dynamics of Cyphastrea serailia and Porites cylin-
drica colonies during days of noon low tide and days of noon high tide.
(a, b) Temperature gradient between coral skeleton (5 mm depth) and wa-
ter. (c, d) Incident PAR at the depth of the corals for the corresponding
days. The horizontal lines above the curve represent 2 h intervals centred
on the time of high tide (upper series) and low tide (lower series). (e,f)
Bulk water temperature.
3.1 Jn situ temperature measurements. (a) Submersible temperature logging
equipment (photo: I. Jimenez) and (b) close-up of a P. cylindrica colony
29
with inserted temperature sensor (photo: G. Holmes). . . . . . . . . . . . 43
ix
. ...

3.2 In situ temperature dynamics of hemispherical Porites lobata and branch-
ing Porites cylindrica colonies during 4-day periods of noon low Spring
tide in January and November 2007. (a, b) Incident PAR measured at the
depth of corals and tidal height at Heron Island. ( c, d) Water temperature.
( e-h) Temperature gradient between coral surface and water for the ( e, f)
P. lobata and (g, h) P. cylindrica specimens (Average± SE, n=4 and 5 in
January and November, respectively). . . . . . . . . . . . . . . . . . . . 46
3.3 Temperature dynamics of the Porites lobata on 22 November 2007 (Av-
erage ± SE, n=5). Maxima in coral surface warming are indicated by
arrows: (a) 14:30 hand (b) 15:30, and a sun indicates solar noon. Inset:
Temperature of water (solid line) and corals (dashed line).
3.4 In situ temperature dynamics of hemispherical Porites lobata and branch-
ing Porites cylindrica colonies during a 4-day period of noon high tide in
November 2007. (a) Incident PAR measured at the depth of corals and
48
tidal height at Heron Island. (b) Water temperature. (c, d) Temperature
gradient between coral surface and water for the ( c) P. lobata and ( d) P.
cylindrica specimens (Average ± SE, n=5). . . . . . . . . . . . . . . . . 49
3.5 Plots of (a) tidal height and underwater PAR during the noon-low and
noon-high tide sampling periods (November 2007), and (b) quantum yield
of PSII for Porites lobata and Porites cylindrica (averages ± SE, n = 5). . 50
4.1 Contour maps of the thermal boundary layer over (a) two neighbouring
polyps of Platygyra sp. and (b) an individual polyp of Favia sp., under
flow and light conditions of I cm s- 1 and430 W m- 2 (1500 µmol photons
m-2 s-1 ), respectively. For better illustration, the map for Favia sp. was
duplicated by right symmetry. (c) Schematic diagram of polyps of the
Platygyra sp. and Favia sp. specimens.
x
62

4.2 Effect of flow on the tissue surface warming of Stylophora pistillata branches
(n = 9) and hemispherical colonies of Porites lobata (n = 10), measured
in a flow chamber under high irradiance (1500 W m-2 ; 2500 µmol pho-
tons m- 2 s- 1 ). Averages ± SE are shown. The least square power-law
regressions are: !:l.T = 0.11 v-0·47 , r2= 0.99 and !:l.T = 0.31 v-0·59 , r2=
0.98 for S. pistillata and P. lobata, respectively. . . . . . . . . . . . . . . 63
4.3 Coral surface warming of Stylophora pistillata branches (n = 9) and hemi-
spherical colonies of Porites lobata (n = 10) plotted against the thickness
of the thermal boundary layer, measured under 1500 W m- 2 (2500 µmol
photons m-2 s-1) irradiance and flows ranging between 0.3 - 5.0 cm s-1•
The least square regression lines are: !:l.T = 1.1 10-4 8rBL - 6.9 10-2 ,
r2= 0.73, and !:l.T = 3.0 10-4 8rBL - 2.5 10-2 , r2= 0.73 for S. pistillata
and P. lobata, respectively. . . . . . . . . . . . . . . . . . . . . . . . . . 64
4.4 Effect of flow on the surface 0 2 concentration of Stylophora pistillata
branches (n = 7) and hemispherical colonies of Porites lobata (n = 8),
measured in a flow chamber and exposed to 430 µmol photons m-2 s- 1 •
Averages ± SE are shown. The least square power-law regressions are:
Cs = 161 v-0·20 , r2= 0.95 and Cs = 180 v-0·18 , r2= 0.99 for S. pistillata
and P. lobata, respectively. . . . . . . . . . . . . . . . . . . . . . . . . . 65
4.5 Effect of flow on 8rBL and 8DBL over Stylophora pistillata branches (n =
9) and hemispherical colonies of Porites lobata (n = 10). Averages± SE
are shown. The least square power-law regressions are: a) S. pistillata:
TBL = 1183 v-0·31 , r2 = 0.95 and DBL = 463 v-0·73 , r2 = 0.88; b) P.
lobata: TBL = 1294 v-0·41 , r2 = 0.99 and DBL= 297 v-0·72 , r2 = 0.97.. 66
Xl

4.6 Non-dimensional representation of Fig. 4.5, i.e. dimensional analysis
of flow-assisted transfer of a) heat and b) mass for colonies of Porites
lobata (n = 10 ± SE) and Stylophora pistillata (n= 9 ± SE). Nu: Nusselt
number; S h: Sherwood number; Re: Reynolds number. The slopes of the
plots were a) Nu-Re : 0.31 and 0.41 and b) Sh-Re: 0.73 and 0.72 for S.
pistillata and P. lobata, respectively. (See text, 4.2.5, for the calculation
of the dimensionless parameters as a function of coral dimensions, flow
velocity, and boundary layer thicknesses.) . . . . . . . . . . . . . . . . . 67
5.1 Relative change in photochemical efficiency (Fv/ Fm) in relation to pre-
treatment responses (n=3 ± SE) of the control (dashed lines) and treat-
ment (solid lines) of S. pistillata (triangles) and P. lobata (circles). The
three days of temperature ramping are indicated as the light grey bar, and
the control (25 °C) and treatment (32 °C) as the dark grey bar. . . . . . . 84
5.2 Spectral reflectance of a, c) P. lobata and b,d) S. pistillata measured dur-
ing the bleaching treatment. Data were normalized to a, b) the radiance
from a reference white diffusing surface and subsequently to c,d) the re-
flectance at 750 nm. Averages± SE are shown (n = 3). . . . . . . . . . . 86
5 .3 Action spectra of coral surface warming for bleached and control speci-
mens of (a,b,c) S. pistillata and (d,e,f) P. lobata. Coral surlace warming
at each wavelength was normalized to (a,d) an equivalent quantum irradi-
ance of 1500 µmol photons m-2 s-1 and (b,e) to an equivalent irradiance
of 1000 W m- 2 • Difference in spectral absorptivity between the bleached
and healthy coral samples are shown ( c,f). . . . . . . . . . . . . . . . . . 89
XU
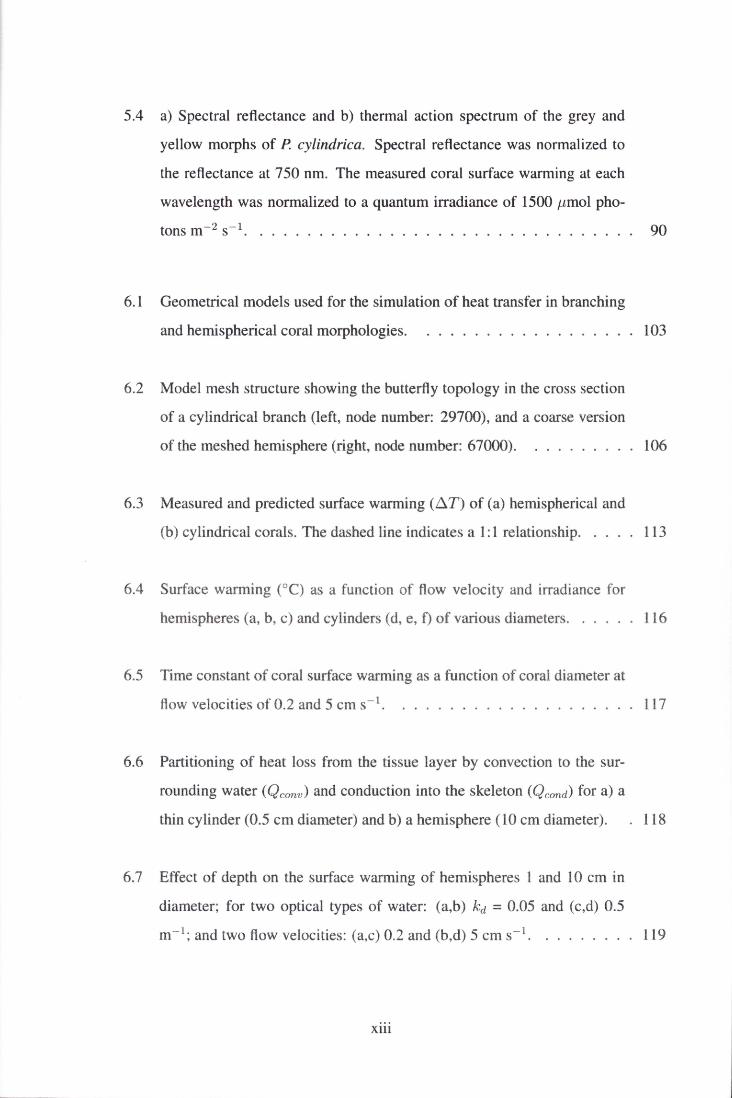
5.4 a) Spectral reflectance and b) thermal action spectrum of the grey and
yellow morphs of P. cylindrica. Spectral reflectance was normalized to
the reflectance at 750 nm. The measured coral surface warming at each
wavelength was normalized to a quantum irradiance of 1500 µmol pho-
tons m-2 s-1• • • . • • . . • . . • • • • . • • • • . • . . . . . . . • . • • 90
6.1 Geometrical models used for the simulation of heat transfer in branching
and hemispherical coral morphologies. . . . . . . . . . . . . . . . . . . 103
6.2 Model mesh structure showing the butterfly topology in the cross section
of a cylindrical branch (left, node number: 29700), and a coarse version
of the meshed hemisphere (right, node number: 67000). . . . . . . . . . 106
6.3 Measured and predicted surface warming (b:..T) of (a) hemispherical and
(b) cylindrical corals. The dashed line indicates a 1:1 relationship. . ... 113
6.4 Surface warming (°C) as a function of flow velocity and irradiance for
hemispheres (a, b, c) and cylinders (d, e, f) of various diameters. . . . . . 116
6.5 Time constant of coral smface warming as a function of coral diameter at
flow velocities of 0.2 and 5 cm s-1 .
6.6 Partitioning of heat loss from the tissue layer by convection to the sur-
rounding water (Qconv) and conduction into the skeleton (Qcond) for a) a
117
thin cylinder (0.5 cm diameter) and b) a hemisphere (10 cm diameter). . 118
6. 7 Effect of depth on the surface warming of hemispheres 1 and 10 cm in
diameter; for two optical types of water: (a,b) kd = 0.05 and (c,d) 0.5
m- 1; and two flow velocities: (a,c) 0.2 and (b,d) 5 cm s-1 .•....•.• 119
xm

6.8 Predicted surface warming of a hemispherical (10 cm diameter; solid
dark line) and cylindrical coral (1 cm diameter; solid green line), using
computed water level and irradiance, together with flow velocity esti-
mates (see section 6.2.5). Measured values of in situ surface warming
of colonies of P. lobata and P. cylindrica (n=4) are shown for compari-
son. Experimental data were collected in the shallow reef flat (depth <3
m) at Heron Island in the Southern Great Barrier Reef, as described in
Chapter 2. . . . . . . . . . . . . . . . . . . . . . . . . . . . . . . . . . 120
6.9 Contour plots of the computed (a,b) maximum surface warming (°C) and
(c,d) cumulated heat exposure (degree-heating-hour) on the horizontal
projection of a hemispherical coral (20 cm diameter). Low tide at noon
(a,c) and in the morning (b,d). . ...... . .......... . ... . 121
A. I Diagram of the experimental set up for the determination of the thermal
diffusivity of coral skeletons. 169
XlV

List of Tables
1 List of terms. . . . . . . . . . . . . . . . . . . . . . . . . . . . . . . . . xix
2.1 Constants of the model. . . . . . . . . . . . . . . . . . . . . . . . . . . . 14
2.2 Effect of flow on coral surface warming (~T), boundary layer thick-
ness (5), convective heat flux (Q), and convection coefficient (h) of the
hemispherical corals Favia sp. and Porites lobata and the branching Sty-
lophora pistillata. Mean ± standard error (SE) (n=3). . . . . . . . . . . . 26
2.3 Effect of irradiance on coral surface warming (~T), boundary layer thick-
ness (5), convective heat flux (Q), and convection coefficient (h) of a
Porites lobata colony. Mean± standard error (SE) (n=4). . . . . . . . . . 28
5.1 Zooxanthellae density (cells cm-2 x 10⁶), absorptivity (non dimensional)
and coral surface warming (°C) in P. lobata and S. pistillata. Measure-
ments were taken from the end of the control treatment (control), the first
measurement prior to exposure to bleaching conditions (pretreatment) and
the end of the exposure period (treatment). Averages± SE shown (n = 3),
and significant differences (JJ < 0.05) are denoted with superscript values. 85
xv

5.2 Absorbed irradiance (Qrad) and heat loss by convection (Qcanv) in P. lo-
bata and S. pistillata exposed to an irradiance of 1800 µmol photons m-2
s-1 (450 W m-2) and a flow velocity of 0.75 cm s-1 • Measurements were
taken at the end of the control treatment (control) and the exposure period
(exposure). Q rad was estimated as (ax 450 wm-2 ), and Q canv was esti-
mated as described in Chapter 2. Numbers represent averages± SE (n =
3). . . . . . . . . . . . . . . . . . . . . . . . . . . . . . . . . . . . . . . 88
6.1 Thermo-physical properties of coral skeletons of Stylophora pistillata,
Porites lobata and Porites cylindrica: thermal diffusivity (K, 10-7 m-2
s-1), specific heat (c, J kg-1 K- 1), density (p, kg m-3) and thermal con-
ductivity (k, W m-1 K-1 ). Averages ±SE are shown (n = 5), and signifi-
cant differences (p <0.05, ANOVA) are denoted with superscript letters .. 112
6.2 Model sensitivity analysis for steady-state surface warming (6.T) of two
hemispherical colonies 20 and 100 cm in diameter, at low and high flow
velocities (0.2 and 5 cm s- 1, respectively). Change in 6.T (°C) of colony
apex for a ± 10% change in each parameter. . . . . . . . . . . . . . . . . 114
6.3 Model sensitivity analysis for the transient response time (r ) of a large
hemispherical colony ( l 00 cm diameter) at low and high flow velocities
(0.2 and 5 cm s- 1, respectively). Change in r (s) of colony apex for a
±10% change in each parameter . .. . .... .. . .. .. . ....... 115
xvi

Abstract
Understanding the processes that drive the variability in thermal tolerance among scler-
actinian corals is key to predicting the impacts of rising worldwide temperatures on coral
reefs. This thesis explores the thermal microclimate of corals, and specifically examines
the thermal effects of environmental conditions of flow and irradiance, combined with the
optical, thermal and morphological characteristics of individual coral colonies.
The temperature of branching (Porites cylindrica) and hemispherical (Porites lobata
and Cyphastrea serailia) coral species was monitored on a shallow reef flat in the South-
ern Great Barrier Reef. This revealed a strong diurnal and tidal pattern in solar heating
of corals, whereby maximum coral surface warming of "'-'+0.6 °C occurred during low
Spring tides, under conditions of high irradiance and low water flow.
Microsensor temperature measurements were used to demonstrate for the first time
that at flow velocities < 5 cm s-1 heat transfer at the surface of corals was controlled
by a thermal boundary layer (TBL). Dimensionless analysis of heat transfer (Nusselt-
Reynolds number plots) confirmed that convective heat transfer at the surface of hemi-
spherical Porites lobata and branching colonies (Stylophora pistillata occurred through a
laminar boundary layer, consistent with predictions from engineering theory for simple
geometrical objects. For topographically more complex corals (Favia and Platygyra sp.)
both the TBL thickness and the surface temperature was spatially heterogeneous.
Temperature and spectral reflectance measurements were used to investigate close
links between the thermal and optical properties of corals. Coral surface temperature
could be expressed as a linear function of the tissue's absorptivity, but this relationship
was species-specific, and highlighted the thermal importance of the skeleton. The spec-
tral composition of light was important in determining the magnitude of coral surf ace
warming, and short wavelengths ( <500 nm) had the greatest heating efficiency.
Finally, a mechanistic thermal model of corals identified both irradiance absorption
and convective heat loss as the major controlling parameters of coral smface warming.
Conductive heat transfer into the skeleton was a negligible portion of the overall heat
budget, except for small coral diameters ("" 1 cm). Experimental and theoretical results
throughout this thesis revealed that the surface warming of hemispherical coral species
xvii
was greater than that of branching species, and indicates that massive species may tolerate
temperatures greater than previously thought. In light of the greater bleaching resistance
of massive compared to branching species, this warrants further investigation into the
effects of small temperature differences on the physiological response of morphologically
distinct, bleaching sensitive and resistant coral species.
xviii
8 f.
p
T
~T
~Tm tissue
~Tm skel
~F/Fm'
v
c DBL E F Fm' F~/Fm
h k K Le Nu PAR PSII Qr ad
Qcond
Qconv 1
qconv 2
Re Sh TBL Ttissue
Tskel
Twater
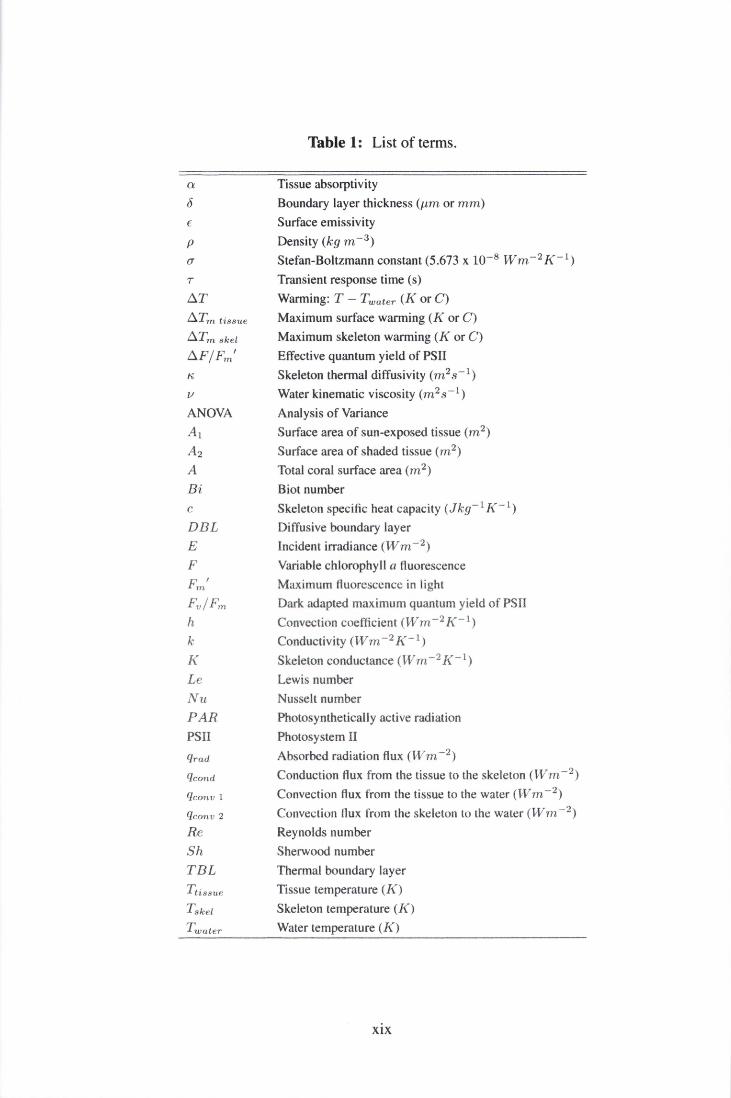
Table 1: List of terms.
Tissue absorptivity Boundary layer thickness (µm or mm)
Surface emissivity Density (kg m-3 )
Stefan-Boltzmann constant (5.673 x 10⁻⁸ W m-2 K- 1)
Transient response time (s) Warming: T - Twater (Kor C) Maximum surface wanning (Kor C)
Maximum skeleton wanning (Kor C)
Effective quantum yield of PSII Skeleton thermal diffusivity (m2 s- 1)
Water kinematic viscosity (m2 s- 1)
Analysis of Variance Surface area of sun-exposed tissue (m2)
Surface area of shaded tissue (m2 )
Total coral surface area (m2 )
Biot number Skeleton specific heat capacity (Jkg- 1 K- 1)
Diffusive boundary layer Incident irradiance (Wm- 2 )
Variable chlorophyll a fluorescence Maximum fluorescence in light Dark adapted maximum quantum yield of PSII Convection coefficient (W m-2 K- 1)
Conductivity (Wm- 2 K- 1)
Skeleton conductance (Wm- 2 K- 1)
Lewis number Nusselt number Photosynthetically active radiation Photosystem II Absorbed radiation flux (W m-2 )
Conduction flux from the tissue to the skeleton (W m-2 )
Convection flux from the tissue to the water (Wm- 2 )
Convection flux from the skeleton to the water (Wm- 2 )
Reynolds number Sherwood number Thermal boundary layer Tissue temperature (K)
Skeleton temperature (K)
Water temperature (K)
XIX