Embed Size (px)
Citation preview
Copyright © IRI, 2005. Confidential and proprietary.Consumer-driven Enterprise Management Solutions
Consumer-driven Sales Forecasting
Solution Overview
February, 2005

Copyright © IRI, 2005. Confidential and proprietary.
What is a Consumer Driven Sales Forecast?
Definition: The strategy and process of aligning an entire
enterprise to current and expected consumer actions

Copyright © IRI, 2005. Confidential and proprietary.
What is a Consumer Driven Sales Forecast?
AMR Says: “The Bottom Line: Consumer products manufacturers must
centrally manage all demand signal data, including POS, to create a Demand-Driven Supply Network (DDSN) that improves demand visibility to reduce stockouts by more than half and increase Perfect Order performance”
Reduce stockouts by 50%+
70% faster time to market
Increase perfect order performance by 17%
RESULTS

Copyright © IRI, 2005. Confidential and proprietary.
What is a Consumer Driven Sales Forecast?
P&G Says: “At Procter & Gamble, we're working toward a vision we call
"the consumer-driven supply network." That differs from our supply-chain strategy of the past in two significant ways: It puts the consumer first, and it envisions a network rather than a chain. The investment isn't trivial, but neither are the returns”
Reduced fulfillment times to the retail DC from 38 days to 16 days
In 2004 alone, P&G Inventory Turns improved by 11%
RESULTS
Copyright © IRI, 2005. Confidential and proprietary.
$0 $15 $149.73
$3,000
$3,100
$3,200
$3,300
$3,400
$3,500
$3,600
$3,700
$3,800
$3,900
$4,000
Beginning MarketValue
InventoryImprovement Impact
StockoutImprovement Impact
Ending Market Value
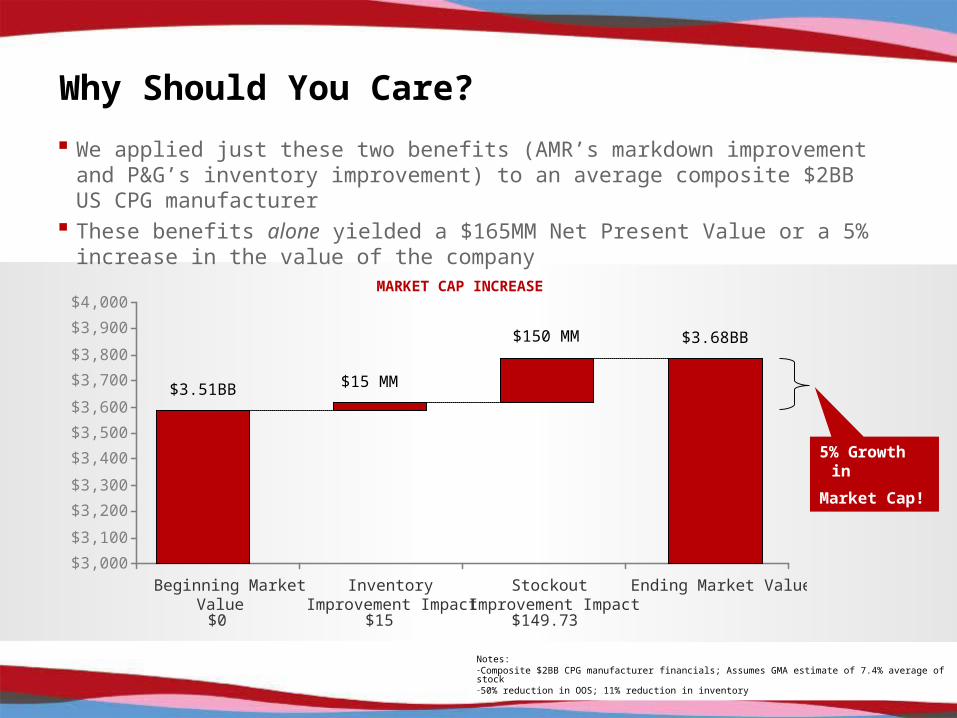
We applied just these two benefits (AMR’s markdown improvement and P&G’s inventory improvement) to an average composite $2BB US CPG manufacturer
These benefits alone yielded a $165MM Net Present Value or a 5% increase in the value of the company
Notes: -Composite $2BB CPG manufacturer financials; Assumes GMA estimate of 7.4% average of stock-50% reduction in OOS; 11% reduction in inventory
$3.51BB $15 MM
$150 MM $3.68BB
Why Should You Care?
MARKET CAP INCREASE
5% Growth in
Market Cap!

Copyright © IRI, 2005. Confidential and proprietary.
What Many CPG Manufacturers Face Today–Non-integrated Planning
Account teams generate customer POS plans to meet financial targets, primarily revenue, with little margin consideration
Supply Chain generates a demand plan, based on shipments, that does not take into account the current year’s retail price and promotion plans
Supply Chain produces and deploys to this forecast
TYPICAL CPG PLANNING CYCLE
CustomerPOS
Forecast
DRIVES
Production & Financial
Plans
Expected Shipment Demand
Sales plans that don’t maximize margin
Operations plans that are not tied to customer activity
Financial plans that try to guess the % expected demand that will be met or actualized
RESULTS

Copyright © IRI, 2005. Confidential and proprietary.
Closing the loop to Consumer-driven planning
Account teams generate price and promotion plans to meet financial targets with margin consideration
Supply Chain produces a demand plan that is driven by current price and promotional plans
Supply Chain tests the feasibility of the plan and suggests changes based on constraints Account teams iterate promotional and pricing plans to align to the feasibility of the plan Supply Chain produces to the sales forecast that it helped to influence
CONSUMER-DRIVEN PLANNING CYCLE
CustomerPOS
Forecast
DRIVES
Production & Financial
Plans
Expected Shipment Demand

Copyright © IRI, 2005. Confidential and proprietary.
Getting started on a road to closed loop planning:Consumer-driven Sales Forecasting
NEXT GENERATION SALES FORECASTING REQUIREMENTS
Capture a true demand signal
Few organizations systematically drive their business based on the demand signal, instead relying on shipments; IRI has unique access and understanding of POS demand data.
1 Continuously monitor performance
Most CPG sales forecasting processes are generated monthly – or less frequently. This allows for weekly market impacts to build up and catch planners by surprise. IRI can support a weekly monitoring process if required and will support daily monitoring over time.
4
Use consistent methodologies & discipline
The use of a single forecast tool and method, as well as the use of causal factors give your team the ability to have a consistent forecast across brands, channels and territories. IRI embeds a structured and consistent approach that eliminates variability among accounts.
5
Collaborate for input and output
Systematic collaboration across functional groups to gain input on the forecast is a key step of a consensus forecast. IRI’s Web-based front end enables multi-functional collaboration.
6
Use the best available causal model
The use of causal factors is critical to systematically include the impact of trade promotions and pricing. IRI delivers an efficient and proprietary causal model capability based on our 20 years of experience.
2
Forecast at the granular levels
Forecasts generated within the organization must be done at a granular-enough level of the business to translate easily. IRI’s Analytic Server has the ability to support interactive SKU and Account Level forecast simulations.
3

Copyright © IRI, 2005. Confidential and proprietary.
1. Sales Forecasting Challenge: Beyond sell-in data
Operations and Supply Chain Planning has traditionally focused on “shipments out” or “sell in” as the primary demand signal
“Sell in” –based planning systems typically fail in their ability to integrate recent shifts in retail POS activity which have a significant effect on business operations:
promotional activities that temporarily increase sales forward buying practices that front-load sales and reduce future sales competitive pricing that can decrease sales
The result is a significant disconnect between the sell-in forecast and what is truly going on at the account
Traditional Demand Planning Focus
Demand signal: Shipments Out/Sell-in
PROCUREMENT OPERATIONS CONSUMERSSALES MARKETING
SupplySources
ProductionDistribution
CentersDistributor
Retail Distribution
RetailSales IRI POS/
Retailer POS

Copyright © IRI, 2005. Confidential and proprietary.
1. Consumer-driven Sales Forecasting Response: POS-driven supply chain
Benefits: More rapid planning for consumer trends Forecast built on current promotional plan More efficient production planning More accurate financial planning
Consumer-driven Demand Planning Focus
Demand signal: Retail Consumption
PROCUREMENT OPERATIONS CONSUMERSSALES MARKETING
SupplySources
ProductionDistribution
CentersDistributor
Retail Distribution
RetailSales IRI POS/
Retailer POS

Copyright © IRI, 2005. Confidential and proprietary.
BASE DEMAND
More forecastable pattern Incorporates trend, seasonality but
excludes promotional effects
INCREMENTAL DEMAND
Includes only estimated effects ofpromotional volumes only
Estimate using events calendar
2. Use the best available causal model
Causal modeling allows manufacturers and retailers to separate the base demand from incremental demand, thereby enabling a more accurate forecast that includes promotional activities.
Difficult to forecast High peaks Little statistical pattern
TOTAL DEMAND

Copyright © IRI, 2005. Confidential and proprietary.
2. Use the best available causal model
By utilizing causal modeling and separating base volume from promoted/incremental volume, a Midwestern Retailer was able to generate a more accurate forecast for its gelatin products.
0
500
1000
1500
2000
2500
3000
3500
1 11 21 31 41 51 61 71 81 91 101 111 121
Base Incremental
0
500
1000
1500
2000
2500
3000
3500
1 11 21 31 41 51 61 71 81 91 101 111 121
Actual Fit/ForecastFitted values Forecasts

Copyright © IRI, 2005. Confidential and proprietary.
3. Forecast at the granular level
By forecasting at a relatively granular level, other functions that use or interact with the consumption forecast can easily translate consumption into a forecast that meets their implied requirements, thereby increasing the probability of reaching a “one number” forecast.
Consumption Forecast:Recommendation
GEOGRAPHY: Market
TIME: Weekly
PRODUCT: Promoted Product Group
ACCOUNT: Key Account
Financial
GEOGRAPHY: Total U.S.
TIME: Quarterly
PRODUCT: Category
ACCOUNT: All
Sales/Marketing
GEOGRAPHY: Total U.S.
TIME: Monthly
PRODUCT: Brand or PPG
ACCOUNT: Key Account
Operations
GEOGRAPHY: Region
TIME: Weekly/Daily
PRODUCT: SKU
ACCOUNT: All
AGGREGATION
AGGREGATION AGGREGATION + ALLOCATION TO SKU

Copyright © IRI, 2005. Confidential and proprietary.
4. Continuously monitor performance
Best practices in Performance Management dictate that continuously monitoring of forecast accuracy and actual results at all levels of the organization creates the greatest odds of meeting and exceeding product, group and division targets.
Volume to Date
PPG: All April May JuneEast Actuals 10000 -
Forecast 10000 12000 10000Plan 10000 12000 10000
Central Actuals 11000 -Forecast 12000 12000 10000
Plan 12000 12000 10000West Actuals 14000 -
Forecast 14000 12000 10000Plan 14000 12000 10000
EXECUTIVE
ANALYST
Month to Date Analysis Absolute Percent Error
Month To Date Volume Month To Date %PPG 346 Actuals 3500 78% PPG APE Alert
Forecast 4500 100% 346 98 NoPlan 4500 100% 347 97 No
PPG 347 Actuals 2900 104% 348 88 YesForecast 2800 100% 349 96 NoPlan 2800 100% 350 95 No
PPG 348 Actuals 2600 93% 351 96 NoForecast 2800 100% 352 98 NoPlan 2800 100% 353 97 No

Copyright © IRI, 2005. Confidential and proprietary.
5. Use Consistent Methodologies
Implementing a solution that incorporates causal modeling, due to analysis and other standard methods and approaches, lowers the risk of differences in results.
Some deeply experienced sales team members can intuit the impact of promotional activities on consumption
Other team members, perhaps due to a recent transfer or rotation in brand or account have less imbedded intuition on the impact of promotions
The use of causal modeling and due to’s eliminates the uncertainty and levels the playing field for a more standard approach to the forecast

Copyright © IRI, 2005. Confidential and proprietary.
6. Collaborate for inputs and ouputs
Putting together a systematic plan for gathering input to the forecast is a critical step in the achievement of a one-number forecast. Just as important, is planning for the outputs of the forecast in a way that encourages the entire business to utilize the consumption forecast.
Processes Impacted Quarterly/annual business plan Account planning Brand planning Supply Chain planning
Processes Impacted Quarterly/annual business plan Account planning Brand planning Supply Chain planning
Consumption Driven Sales Forecast
SalesFinanceExecs
OperationsMarketing

Copyright © IRI, 2005. Confidential and proprietary.
1. Determine causal drivers of sales(every 6 -12 months)
Sales Forecasting Solution Capabilities
2. Analyze the forecast results and causes(weekly/monthly)
4. Translate the forecast into functional views(weekly/monthly)
3. Simulate and execute the forecast
(weekly/monthly)

Copyright © IRI, 2005. Confidential and proprietary.
Outstanding Results
40%+ for DC/Item for one customer
36% for RMA/PPG for another customer
IRI FORECAST ERROR (MAPE) OTHER’S FORECAST ERROR
Regional grocery (regional/SKU is often the best metric for supply chain)
9.3% across Region-SKU-weeks
7.9% across Region-PPG-weeks
7.0% across Region-SKU-quads
5.8% across Region-PPG-quads
RMA (RMA/PPG is often the best metric for sales)
24.8% across RMA-UPC-weeks
22.3% across RMA-PPG-weeks
21.1% across RMA-UPC-quads
19.0% across RMA-PPG-quads

Copyright © IRI, 2005. Confidential and proprietary.
Existing Forecasting Customers
Dow Jones (Wall Street Journal and Barron’s) is implementing the integration capabilities and analytic engine of the BPM solution to drive the monthly circulation forecasting of the entire U.S. business.
The forecast is based on the weekly consumer transaction data, from both direct sales and channel sales and allows for collaboration and input from the marketing managers driving various monthly promotional campaigns.
The platform integrates data from multiple legacy systems and provides forecasting analysts with the ability to run rapid forecasting “what if” scenarios – calculating a 12 month forecast for the entire business in less than 5 minutes, allowing for an interactive sales forecasting process.
Polaroid is leveraging the flexibility and scalability of the BPM solution to provide a consistent "system of record" for demand and supply planning across the entire organization.
The weekly sales forecast generated by the solution is passed to SAP each Friday night, driving the production and MRP processes.
The solution is driving down planning cycle times and improving the effectiveness and efficiencies of the planning teams, thus enabling better and faster decision making.
Inventory, customer service, forecasting accuracy, and asset utilization are all metrics that are being improved.