Embed Size (px)
Citation preview

Copyright © 2014 Nelson Education Ltd. 3–1
PowerPoint Presentations for
Finance for Non-Financial Managers:
Seventh Edition
Prepared by
Pierre BergeronUniversity of Ottawa

Copyright © 2014 Nelson Education Ltd. 3–2
CHAPTER 3
Statement of
Cash Flows

Copyright © 2014 Nelson Education Ltd. 3–3
1. Explain the importance of managing cash flows.
2. Analyze cash flows by comparing two consecutive statements of financial position.
3. Describe the basic structure of the statement of cash flows.
4. Discuss the structure of the statement of cash flows for not-for-profit organizations.
Learning Objectives

Copyright © 2014 Nelson Education Ltd. 3–4
Key Cash Flow Drivers LO 2
Copyright © 2014 Nelson Education Ltd. 3–5
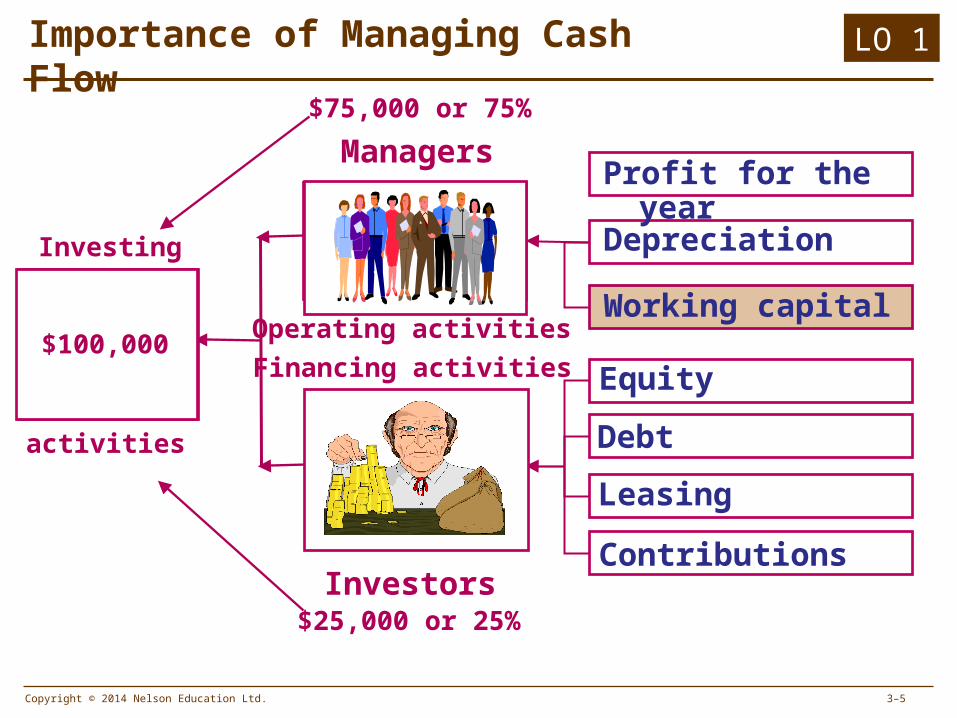
Importance of Managing Cash Flow
Internalinflow
Externalinflow
Profit for the year
Equity
Depreciation
Working capital
Debt
Leasing
Contributions
Outflow
Managers
Investors
Operating activities
Financing activities
Investing
activities
$100,000
$75,000 or 75%
$25,000 or 25%
LO 1

Copyright © 2014 Nelson Education Ltd. 3–6
Cash Flow Analysis
Mortgage
House
Term deposits
Automobile
Visa account
RRSP
Savings account
Total
$150,000
217,000
5,000
20,000
2,000
28,000
3,000
OutflowsInflows
$130,000
200,000
15,000
10,000
1,000
25,000
2,000
20122013Statements of Financial Position
---- 1,000
$ 31,000 $ 31,000
---- $ 17,000
10,000 ----
---- 10,000
1,000 ----
---- 3,000
$ 20,000 ----
LO 2

Copyright © 2014 Nelson Education Ltd. 3–7
John Badboy’s Statements of Financial Position
Assets House Car Trailer Furniture Term deposits Cash in the bank
Total assets
$ 178,000 30,000
10,000 14,000
---
1,000
$233,000
$ 168,00016,000 -----
12,000 2,000
2,000
$200,000
-----
---------------
$ 2,0001,000
$ 10,000 14,000
10,000 2,000
----- -----
Inflows Outflows2013 2012
$ 98,000 $ 5,000
Liabilities
Trust company
Bank loan Sears The Bay MasterCard Brother-in-law
Total liabilities
Total equity & liabilities
120,000
4,000
3,000
2,000
3,000
3,000
135,000
$233,000
$ 93,000
100,000
2,500
1,000
500
1,000
2,000
107,000
$200,000
20,000
1,500
2,000
1,500
2,000
1,000
$ 36,000
-----
-----
-----
-----
-----
-----
-----
$ 36,000
Equity
LO 2

Copyright © 2014 Nelson Education Ltd. 3–8
Comparative Statements of Financial Position (Futurama Ltd.)
2013 2012 Inflows Outflows
97,500$ 399,500
47,500$ 399,500
$ 300,000
255,000 555,000
$ 285,000
205,000 490,000
$352,000$352,000
800,000
195,000150,000
20,000 80,000 445,000
$1,800,000
600,000
175,000135,000
18,000 70,000 398,000
$1,488,000
20,000
15,000
2,000
10,000
-----
-----
-----
-----
-----
AssetsNon-current assets (at cost)Accumulated depreciationNon-current assets (net)
Current assets
Inventories
Trade receivables
Prepaid expenses Cash and cash equivalentsTotal current assetsTotal assets
Share capital
Retained earnings
Equity
Liabilities
Long-term borrowingsCurrent liabilities
Trade and other payables
Notes payable Accrued expenses Current income taxes payableTotal current liabilities
Total equity & liabilities
$1,340,000 (140,000) 1,200,000
218,000 300,000
60,000 22,000 600,000
$1,800,000
$ 1,050,000 (100,000)
950,000
185,000280,000
55,000 18,000 538,000$1,488,000
----- $40,000
----- -----
----- -----
15,000 50,000
200,000
$ 290,000 ----
33,000 20,0005,000
4,000
-----
-----
LO 2
Copyright © 2014 Nelson Education Ltd. 3–9
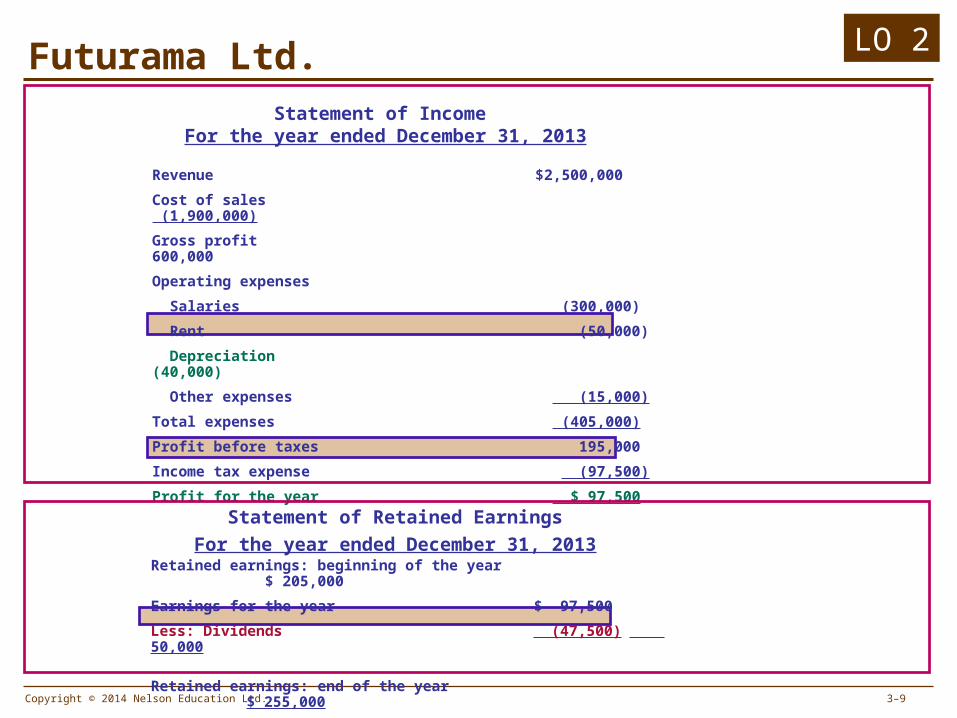
Futurama Ltd.
Revenue $2,500,000
Cost of sales (1,900,000)
Gross profit 600,000
Operating expenses
Salaries (300,000)
Rent (50,000)
Depreciation (40,000)
Other expenses (15,000)
Total expenses (405,000)
Profit before taxes 195,000
Income tax expense (97,500)
Profit for the year $ 97,500
Retained earnings: beginning of the year $ 205,000
Earnings for the year $ 97,500
Less: Dividends (47,500) 50,000
Retained earnings: end of the year $ 255,000
Statement of Retained Earnings
For the year ended December 31, 2013
Statement of Income For the year ended December 31, 2013
LO 2

Copyright © 2014 Nelson Education Ltd. 3–10
Rules to Identify Inflows and Outflows of Cash
Equity accounts
Asset accounts
Liability accounts
Outflows of cash
Inflows of cash
LO 2
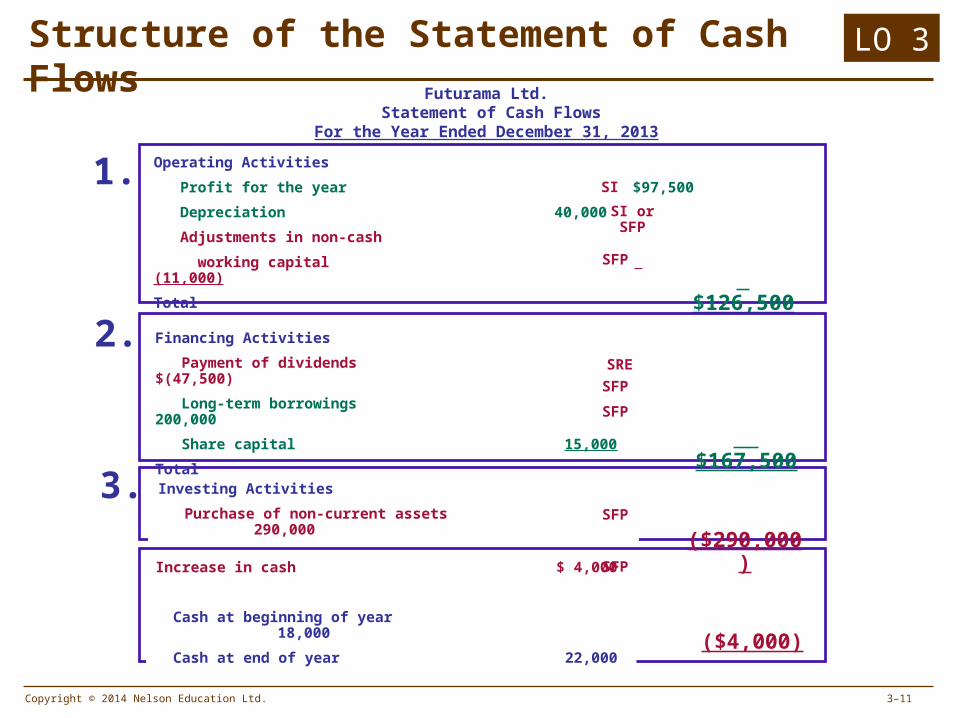
Copyright © 2014 Nelson Education Ltd. 3–11
Investing Activities
Purchase of non-current assets 290,000
3.
Structure of the Statement of Cash Flows
Increase in cash $ 4,000
Cash at beginning of year 18,000
Cash at end of year 22,000
$126,500
Futurama Ltd. Statement of Cash Flows
For the Year Ended December 31, 2013
1. Operating Activities
Profit for the year $97,500
Depreciation 40,000
Adjustments in non-cash
working capital (11,000)
Total
SI
SI or SFP
SFP
SFP
SFP
($290,000)
($4,000)
2. Financing Activities
Payment of dividends $(47,500)
Long-term borrowings 200,000
Share capital 15,000
Total $167,500SFP
SFP
SRE
LO 3

Copyright © 2014 Nelson Education Ltd. 3–12
Statement of Cash Flows for NFP
Net (decrease) Increase in Cash and Term Deposits Cash and term deposits, beginning of year
Cash and term deposits, end of year
Not-For-Profit OrganizationStatement of Cash Flows
For the Year Ended December 31, 2013
1. Operating Activities Excess of revenues over expenses
Depreciation of non-current assets
Adjustments in working capital
2. Financing and Investing Activities Purchase of investments
Purchase of capital assets
Mortgage
Contributions of cash endowments
3.
LO 4