Embed Size (px)
Citation preview

Copyright © 2010, Oracle. All rights reserved.

Copyright © 2010, Oracle. All rights reserved.
Agenda
Interactive Dashboards
• Master-Detail Linking
• New Prompt Controls
• Pivot Table Interactions
• Enhanced Dashboard Builder
• …
Analysis Editor
• Overview
• Working with the analysis editor – step by step
Praxisteil

Copyright © 2010, Oracle. All rights reserved.
Overview of OBIEE 11g Visualization
Improvements
• Oracle developed visualization components which are
standardized across Fusion Applications and OBIEE/OBI
Applications
• More consistency in how visualizations are built
• Scorecard Capabilities (featured in previous Immersion Series
Presentation)
• Spatial
• New Visualization controls and interactions
• Scrollable legend, sliders, master-detail linking
• New graph types
• Multi-pie, More informative Pop-ups
Copyright © 2010, Oracle. All rights reserved.
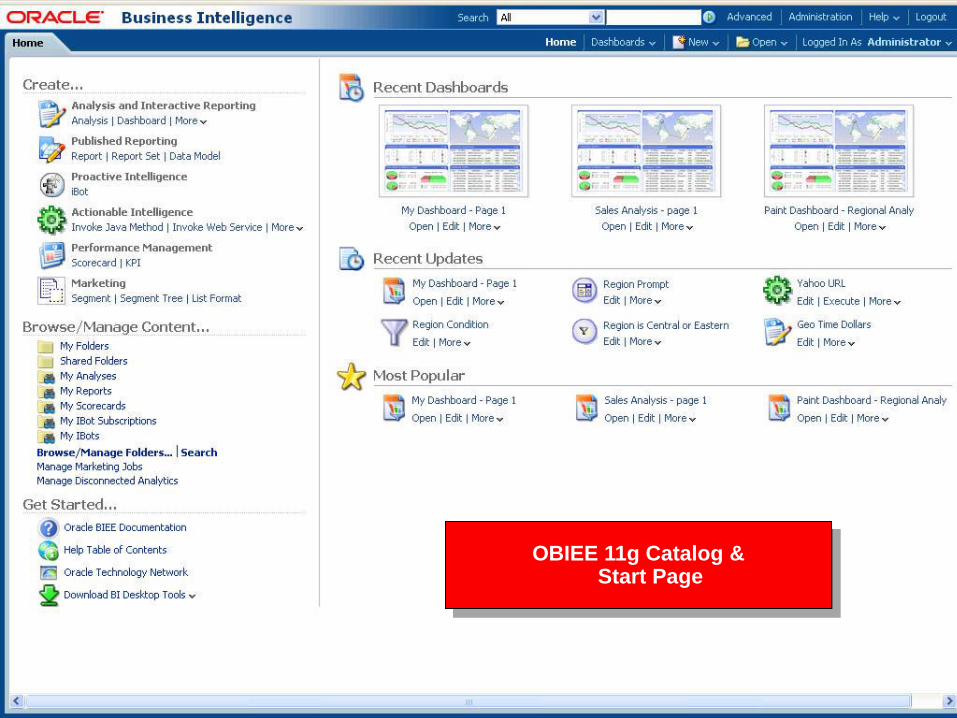
OBIEE 11g Catalog & Start Page

Copyright © 2010, Oracle. All rights reserved.
Master-Detail Linking
• View can Broadcast an Event
• Pivot Table
• Table
• Chart
• Map View
• View can Subscribe to an
Event
• Pivot Table
• Table
• Chart
• Any Number of Views can
Subscribe to the same Event
Copyright © 2010, Oracle. All rights reserved.
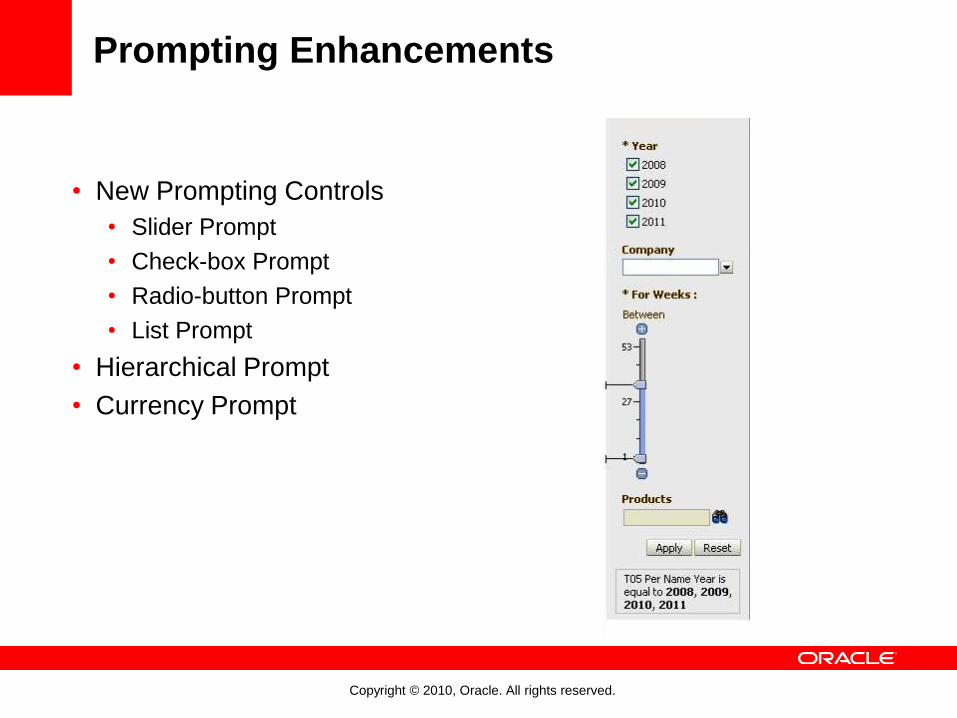
Prompting Enhancements
• New Prompting Controls
• Slider Prompt
• Check-box Prompt
• Radio-button Prompt
• List Prompt
• Hierarchical Prompt
• Currency Prompt
Copyright © 2010, Oracle. All rights reserved.
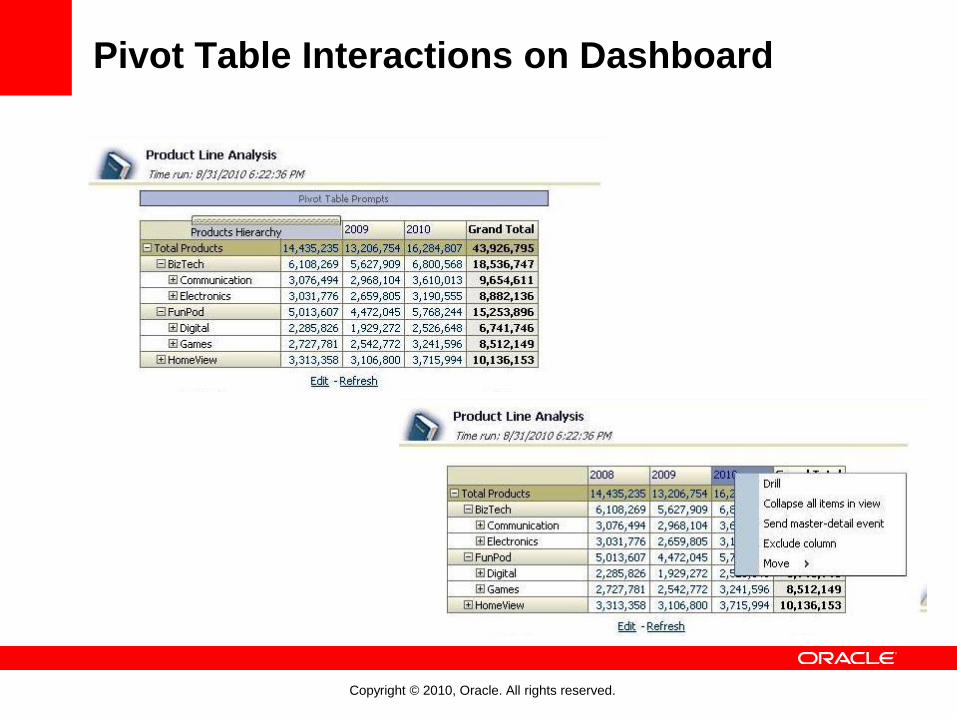
Pivot Table Interactions on Dashboard

Copyright © 2010, Oracle. All rights reserved.
Enhanced Dashboard Builder
• Easy and Intuitive approach to Dashboard Creation
• WYSIWIG
• Direct Manipulation
• Dashboard Preview
• Ability to Inherit Dashboard/Page Report Links
• Publish Page to Dashboard
• Prompt Scope Definition

Copyright © 2010, Oracle. All rights reserved.
New Features
• Dashboard Template
• Briefing Book
• MHTML
• New Dashboard Objects
• Action Link
• Scorecard/KPIs
Copyright © 2010, Oracle. All rights reserved.
Customizations
• Significantly Different Architecture and UI Elements in 11g
• Recommended Approach is to Start Customization from Scratch
• White paper on Customizations

Copyright © 2010, Oracle. All rights reserved.
Dashboard Enhancements
• New Interactions and UI Enhancements • Master-Detail Linking
• New Prompt Controls
• Pivot Table Interactions
• Enhanced Dashboard Builder
• New Features • Dashboard Template
• Publish Dashboard
• Briefing Book in PDF
• New Dashboard Objects
• Customizations • Skin-Style in 11g

Copyright © 2010, Oracle. All rights reserved.
Visualizations
• New visualizations engine
– ADF DVT
– Across OBIEE, ADF, Fusion Applications…
– Foundation for further enhancements
• Interactivity
– Master-Detail Linking
– Animated Transitions
– Range Sliders
– Section Sliders
• Spatial Data visualizations

Copyright © 2010, Oracle. All rights reserved.
Advanced Usage of Map Views
Maps Depicting Custom Spatial Boundaries
Multi-Measure, Mixed-Format Maps
Multi-Measure, Mixed-Format Maps With Underlying Heatmap-
based Background map
Multi-Measure, Multi-Level, Mixed-Format, Hi-Density Map

Copyright © 2010, Oracle. All rights reserved.
Key Terms
Term Definition
Analysis Answers a query against an organization’s data.
Column Object that indicates the data that an analysis returns; measure columns
contain numeric measures, while the membership of attribute columns are
descriptive, and that of hierarchies represent relationships.
Filter Mechanism that restricts the result set returned by an analysis.
Prompt Special kind of filter that restricts the result set returned by an analysis;
can be used to populate variables.
Selection Mechanism that determines column membership included in an analysis.
Criteria Set of columns and filters that are specified for an analysis.
Results Output returned from Oracle BI Server for a specified analysis.
Subject Area Logical object that organizes and presents data about a business.
Dashboard Page in a Business Intelligence application that displays content.
Dashboard Prompt
Filter object that filters all content on a dashboard page and can be used to
populate variables.
Query Underlying SQL issued to the Oracle BI Server for the specified analysis.

Copyright © 2010, Oracle. All rights reserved.
Agenda
Interactive Dashboards
• Master-Detail Linking
• New Prompt Controls
• Pivot Table Interactions
• Enhanced Dashboard Builder
• …
Analysis Editor
• Overview
• Working with the analysis editor – step by step
Praxisteil

Copyright © 2010, Oracle. All rights reserved.
Hierarchies
• Are definitions of contained-by or belongs-to relationship of
members.
• Nested levels of these many-to-one relationships
• Corresponding roll-up of measure values
• Either level-based or value-based (parent-child)
Value-
based
hierarchy
column
Measure
column
Collapse
hierarchy
Child
members
indent below
their parent. Expand
hierarchy
Copyright © 2010, Oracle. All rights reserved.
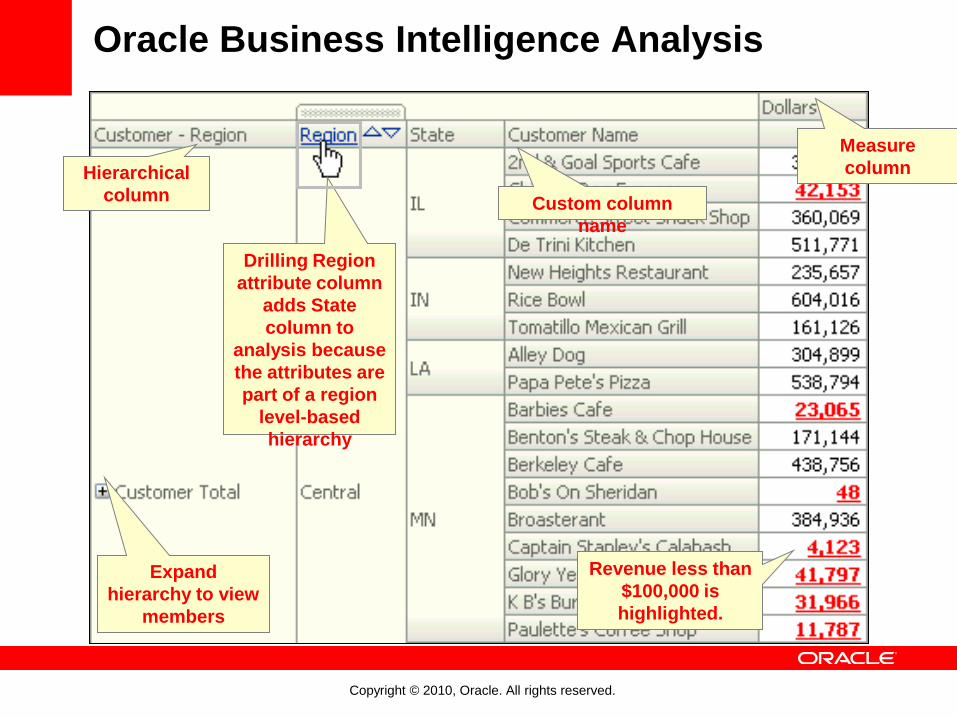
Oracle Business Intelligence Analysis
Revenue less than
$100,000 is
highlighted.
Custom column
name
Hierarchical
column
Expand
hierarchy to view
members
Drilling Region
attribute column
adds State
column to
analysis because
the attributes are
part of a region
level-based
hierarchy
Measure
column

Copyright © 2010, Oracle. All rights reserved.
Creating and Editing Analyses
• Multiple ways to create or edit analyses in the Analysis
Editor.
• Create or open from the Home page.
1 2
Copyright © 2010, Oracle. All rights reserved.
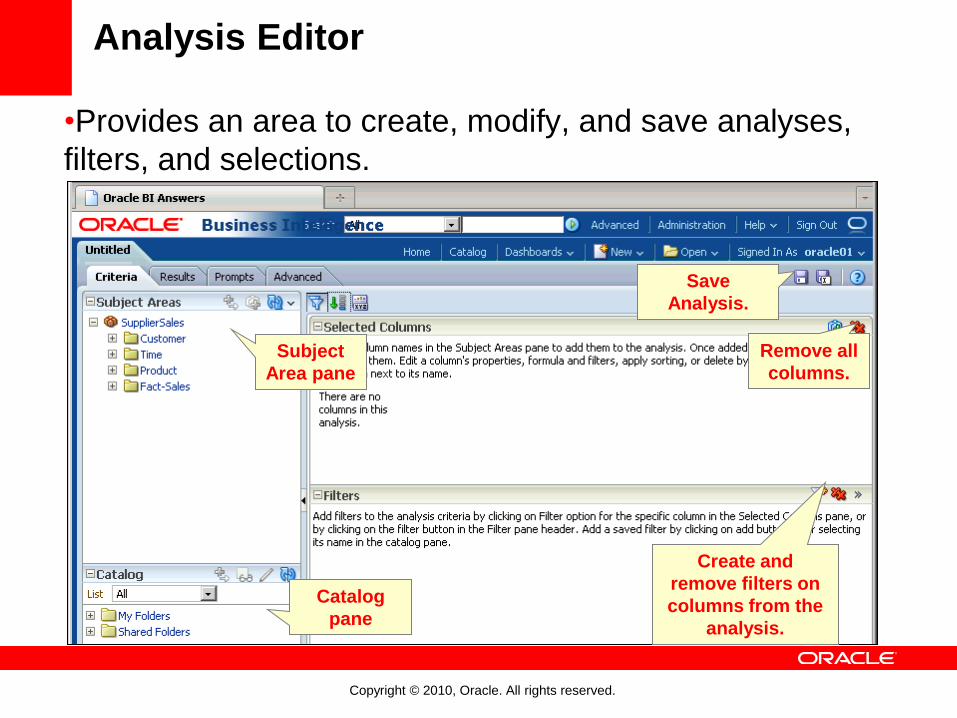
Analysis Editor
•Provides an area to create, modify, and save analyses,
filters, and selections.
Remove all
columns.
Create and
remove filters on
columns from the
analysis.
Save
Analysis.
Catalog
pane
Subject
Area pane
Copyright © 2010, Oracle. All rights reserved.
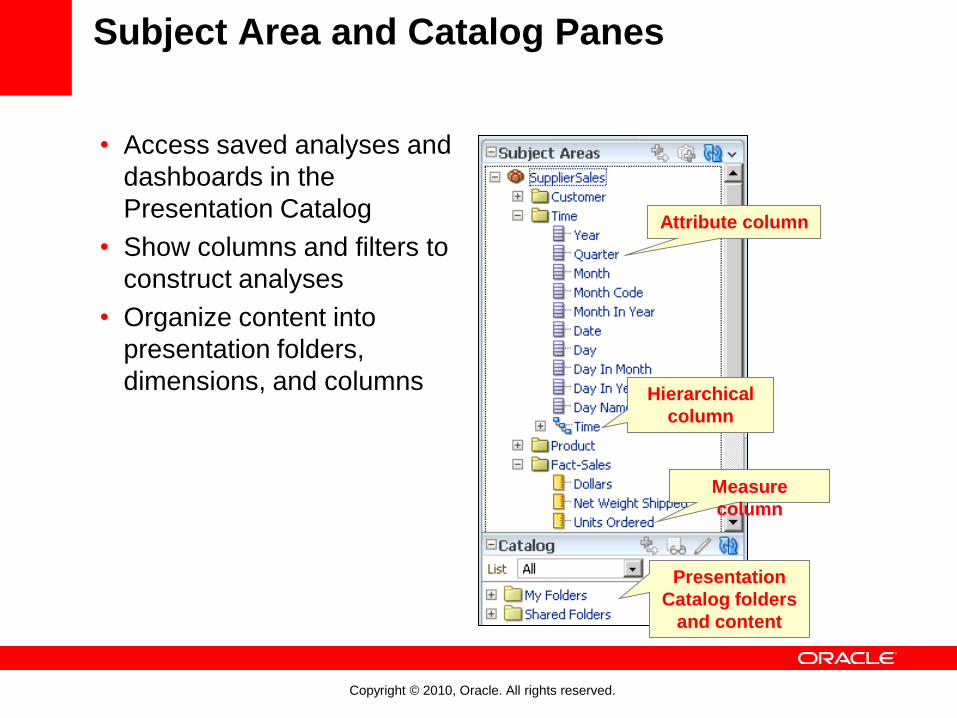
Subject Area and Catalog Panes
• Access saved analyses and
dashboards in the
Presentation Catalog
• Show columns and filters to
construct analyses
• Organize content into
presentation folders,
dimensions, and columns
Attribute column
Hierarchical
column
Measure
column
Presentation
Catalog folders
and content

Copyright © 2010, Oracle. All rights reserved.
Analysis Editor Tabs
•Contain on-screen information and buttons to create,
access, and manage analyses
View or modify
results of
analyses
Create
prompts to
filter
analyses
Work directly with XML
and SQL generated for
an analysis
View or change
columns and
filters for
analyses
Copyright © 2010, Oracle. All rights reserved.
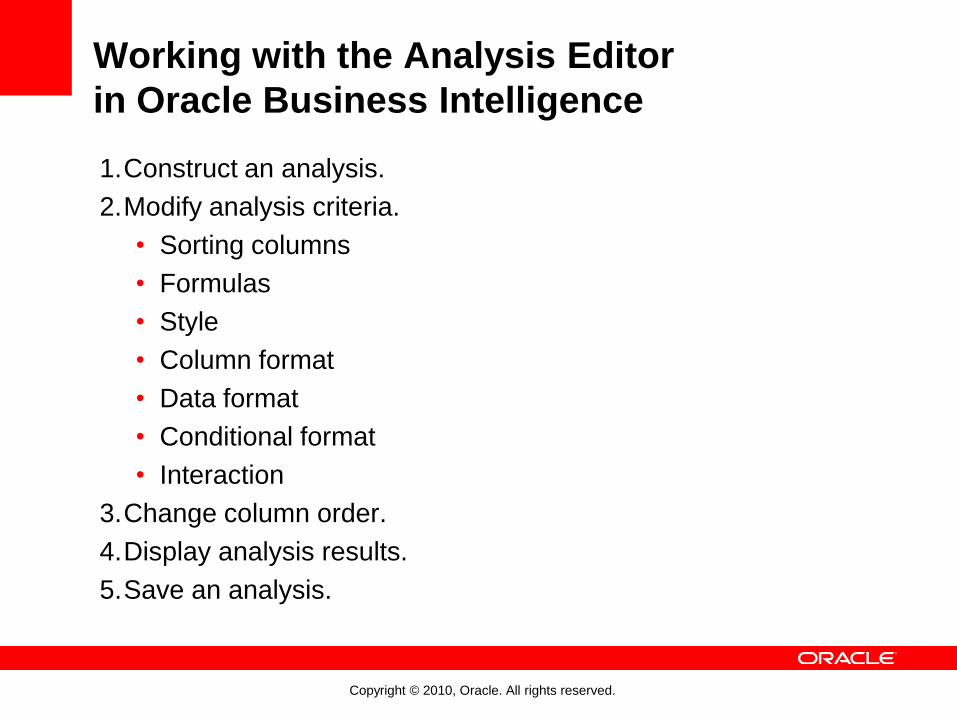
Working with the Analysis Editor
in Oracle Business Intelligence
1. Construct an analysis.
2. Modify analysis criteria.
• Sorting columns
• Formulas
• Style
• Column format
• Data format
• Conditional format
• Interaction
3. Change column order.
4. Display analysis results.
5. Save an analysis.

Copyright © 2010, Oracle. All rights reserved.
1. Construct an Analysis
•Select columns from subject area folders in the Subject
Areas pane to create analysis criteria.
1 2
3
4
Attribute
columns Analysis criteria are displayed
in the Selected Columns pane.
Hierarchical columns
Measure columns
Add Columns
button
More Options
button
Remove all
Columns from
Criteria button

Copyright © 2010, Oracle. All rights reserved.
Edit level
properties
to control
appearance
and
behavior
2. Modify Analysis Criteria
•Click the More Options button to modify analysis criteria
using the following options:
Add a new function (such
as ranking or moving
averages) Edit column properties to
control appearance and
behavior Limit data that
appears in a column
Remove column
from analysis
Determine sort
order
Hierarchical
column

Copyright © 2010, Oracle. All rights reserved.
2. Modify Analysis Criteria (Sorting Columns)
• Use the Sort button to choose a sort order for the desired
column
• Select the appropriate option to set the sort order:
This column sort occurs
after the primary sort.
This column sort occurs after the
secondary sort and in descending
sequence.
Primary
ascending
column sort
Choose a
sort option
for the
desired
columns in
your
analysis.
Copyright © 2010, Oracle. All rights reserved.
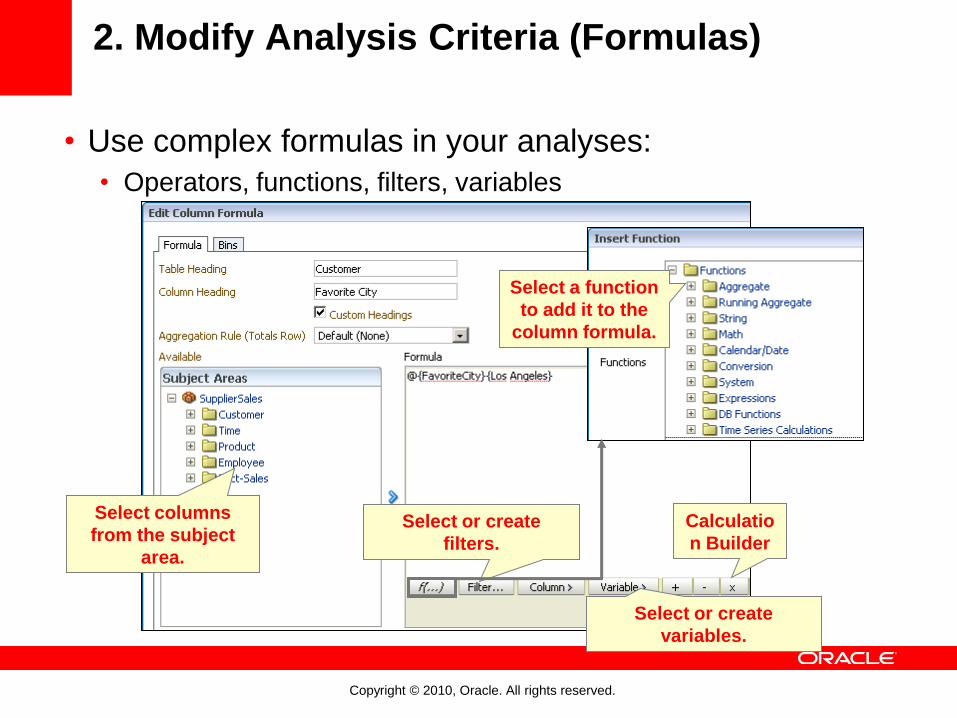
2. Modify Analysis Criteria (Formulas)
• Use complex formulas in your analyses:
• Operators, functions, filters, variables
Calculatio
n Builder
Select a function
to add it to the
column formula.
Select or create
filters.
Select columns
from the subject
area.
Select or create
variables.
Copyright © 2010, Oracle. All rights reserved.
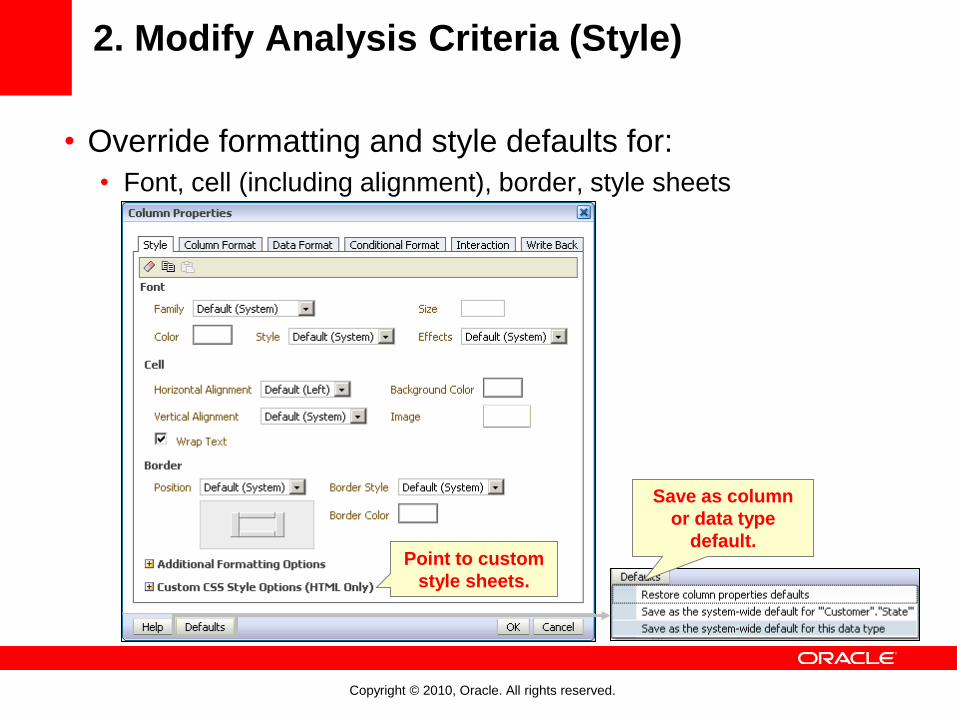
2. Modify Analysis Criteria (Style)
• Override formatting and style defaults for:
• Font, cell (including alignment), border, style sheets
Point to custom
style sheets.
Save as column
or data type
default.

Copyright © 2010, Oracle. All rights reserved.
2. Modify Analysis Criteria (Column Format)
• Override formatting defaults for:
• Column visibility, headings, data duplication, interaction
1
2
3

Copyright © 2010, Oracle. All rights reserved.
2. Modify Analysis Criteria (Data Format)
• Override the way data is displayed based on the data
type.
Text data: Treat as plain
text, HTML, link, and so
on
Numeric data: Treat as
number, percentage,
currency, and so on

Copyright © 2010, Oracle. All rights reserved.
2. Modify Analysis Criteria (Conditional Format)
• Direct attention to a data element that meets a certain
condition. Click Add Condition
for each condition.
Use a
Presentation
variable
Specify an operator and
a value to create a
condition.
Select an image
to display.
Specify a style for data
meeting the condition.

Copyright © 2010, Oracle. All rights reserved.
2. Modify Analysis Criteria (Interaction)
•Specify behavior when a user drills on a column heading
or a data value.
Default is to drill to the
next level in a
hierarchy.
Reset defaults
for a column.
Set an action to navigate to
another saved analysis.
Copyright © 2010, Oracle. All rights reserved.
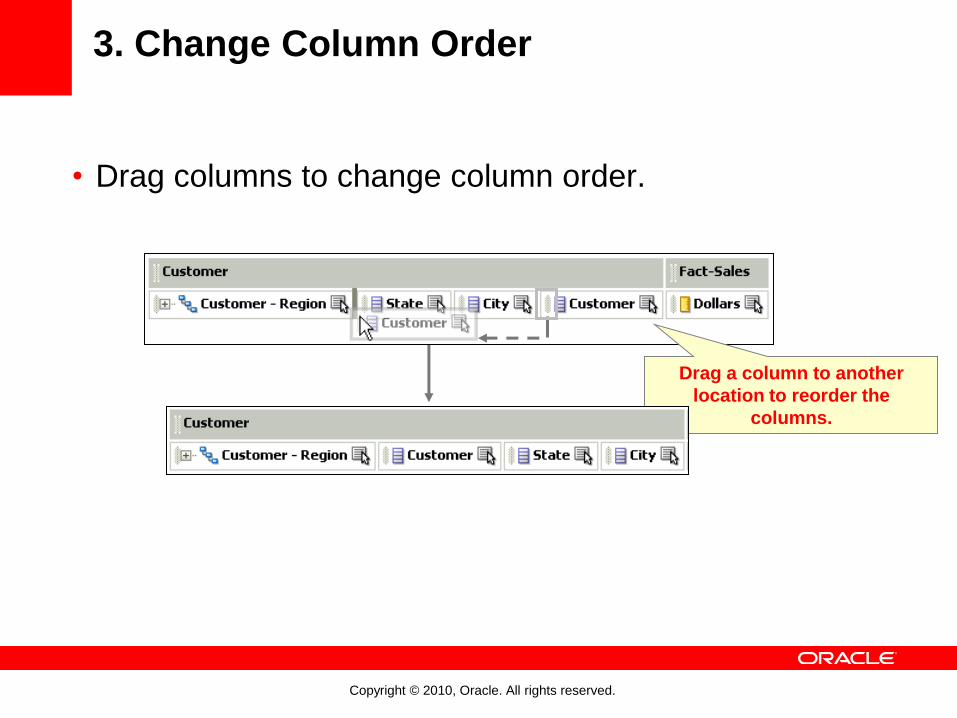
3. Change Column Order
• Drag columns to change column order.
Drag a column to another
location to reorder the
columns.

Copyright © 2010, Oracle. All rights reserved.
4. Display Analysis Results
• Click the Results tab to see the results of an analysis.
• An analysis can be displayed in many formats.
Select additional
views.

Copyright © 2010, Oracle. All rights reserved.
4. Display Analysis Results
• Data is automatically sorted by the first column and then sorted
by the second column.
• Sorting can be specified by the user.
• Repeating values are suppressed by default.
• Default can be overridden by the user.
• Click to see the next group or row.
• Click to see all rows.

Copyright © 2010, Oracle. All rights reserved.
5. Save An Analysis
• Click the Save Analysis button in the toolbar.
3
2 1
New Folder
Copyright © 2010, Oracle. All rights reserved.
Advanced Formatting
• Saving column settings as systemwide defaults
• Copying and pasting formatting attributes
• Using a saved analysis as a style template
• Using custom date-format strings

Copyright © 2010, Oracle. All rights reserved.
Saving Column Settings as Systemwide
Defaults
•Settings on column properties tabs can be saved
as systemwide defaults:
• Save defaults for
particular columns
or data types.
• User must have
appropriate permissions
to save.
• Subsequent users see
new default settings.
Save as
defaults for
column. Save as
defaults for
data type.

Copyright © 2010, Oracle. All rights reserved.
Copying and Pasting Formatting Attributes
•Copy a range of formatting attributes that are applied to
an object and then paste them to an object of the same
type:
• This is supported for rows, columns, and table cells in table, pivot
table, and chart views.
Restore
defaults Copy Paste

Copyright © 2010, Oracle. All rights reserved.
Using a Saved Analysis as a Style Template
• Use a customized saved analysis as a cosmetic style
template.
• Apply formatting from template to new or existing analyses.
• Supported in table, pivot table, and chart views
1
2

Copyright © 2010, Oracle. All rights reserved.
Customized Date and Time Format Strings
• Provide additional options for formatting columns that contain
time stamps, dates, and times
• Examples of general customized format strings:
Term Result Example
[FMT:dateShort] Formats date in locale’s short-date
format.
2/3/2008
[FMT:dateLong] Formats date in locale’s long-date
format.
Monday, February 3, 2008
[FMT:time] Formats time in locale’s time format. 12:00:00 AM
[FMT:timeHourMin]
Formats time in locale’s time format but
omits seconds.
12:00 AM
Copyright © 2010, Oracle. All rights reserved.
1
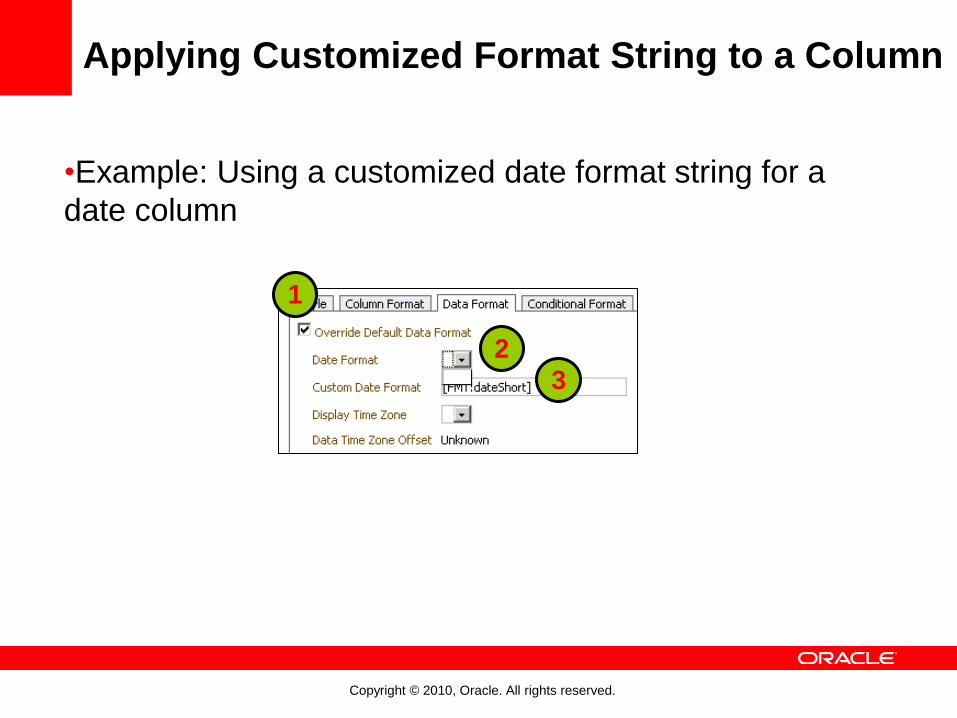
Applying Customized Format String to a Column
•Example: Using a customized date format string for a
date column
2
3

Copyright © 2010, Oracle. All rights reserved.
Writeback
•Set writeback settings for a column in the Column
Properties dialog box.
1

Copyright © 2010, Oracle. All rights reserved.
Questions and Answers

Copyright © 2010, Oracle. All rights reserved.
Agenda
Interactive Dashboards
• Master-Detail Linking
• New Prompt Controls
• Pivot Table Interactions
• Enhanced Dashboard Builder
• …
Analysis Editor
• Overview
• Working with the analysis editor – step by step
Praxisteil

45
Praxisteil
Lab 3: Advanced Reporting, Master Detail Linking

Copyright © 2010, Oracle. All rights reserved.