Embed Size (px)
Citation preview

Copyright © 2005 Information Resources, Inc. Confidential and proprietary.
July 2006 CONFIDENTIAL
An IRI Report for the Voucher Association
covering data up to Quarter 2, 2006

Copyright © 2005 Information Resources, Inc. Confidential and proprietary.
Dummy Data
Report Introduction1. The data contained in the report present estimates of the size of the Gift Voucher Market.
2. The data have been generated through a “pooling operation”, whereby members of the Voucher Association forwarded to IRI data on their individual businesses, which were then aggregated and analysed.
3. The market described is a “defined Market”, reflecting input from the following 30 companies – Argos Retail Services, Boots, Capital Incentives, Choice Gift Vouchers, eXhilaration, Experience More, Debenhams, Dixons, Gift Voucher Shop, Grass Roots, Halfords, House of Fraser, John Lewis Direct, Kingfisher, Lakeside Shopping Centre, Love2reward, Theatre Tokens, Thomson (Corporate Sales only), Maritz, Marks & Spencer, Marriott Incentives, Next, Red Letter Days plc, Sainsbury, Tesco, Thomas Cook, Thresher Group, Virgin Incentives, Whitbread and WH Smith.The Voucher Association and Information Resources aim to continue to recruit further members in the future in order to make the measurement as comprehensive as possible.
4. The data included covers the period Quarter 2, 2003 - Quarter 1, 2006
5. Any queries or comments should be forwarded to Simon Thickett of IRI, Eagle House, The Ring, Bracknell, Berkshire, RG12 1HS
Telephone: 01344 746000 Fax: 01344 746001

Copyright © 2005 Information Resources, Inc. Confidential and proprietary.
Dummy Data
Executive Summary
Latest Quarter Results The Voucher Association has enjoyed a successful quarter in Q2 06 with total
sales of £241,500,000 60.0% of these sales were Store sales
YOY Results Year on Year growth of the Total Market was +7.3% for Q2 06 This growth was driven by Store sales (+7.4%)
Account Performance Total market share is 4.1% in Q2 06 Total Year on Year Category Growth shows an increase of 7.3%, driven by OTC The Retail market has seen growth of 5.6% Year on Year with retailer share at
5.3% for Q2 06

Copyright © 2005 Information Resources, Inc. Confidential and proprietary.
Dummy Data
Value Sales each Quarter, starting quarter 3, 2003. Bars are in £000s.
Total Category Size
14
0,0
00
45
5,0
00
12
4,0
00
12
8,0
00
14
5,0
00
47
0,0
00
13
5,0
00
13
5,0
00
14
6,0
00
48
0,0
00
14
0,0
00
14
5,0
00
10
0,0
00
28
0,0
00
82
,00
0
84
,00
0
10
0,0
00
30
0,0
00
90
,00
0
90
,00
0
31
0,0
00
95
,00
0
96
,50
0
24
0,0
00
73
5,0
00
20
6,0
00
21
2,0
00
24
5,0
00
77
0,0
00
22
5,0
00
22
5,0
00
24
4,0
00
79
0,0
00
23
5,0
00
24
1,5
00
98
,00
0
Q3 2003 Q4 2003 Q1 2004 Q2 2004 Q3 2004 Q4 2004 Q1 2005 Q2 2005 Q3 2005 Q4 2005 Q1 2006 Q2 2006
STORE
CORP
TOTAL

Copyright © 2005 Information Resources, Inc. Confidential and proprietary.
Dummy Data
Value Sales in the latest year, starting in the year beginning quarter 1, 2002.
Total Category Size8
47
,00
0
88
5,0
00
91
1,0
00
54
6,0
00
58
0,0
00
59
9,5
00
1,3
93
,00
0
1,4
65
,00
0
1,5
10
,50
0
Q3 2003 to Q2 2004 Q3 2004 to Q2 2005 Q3 2005 to Q2 2006
STORE
CORP
TOTAL
Dummy Data

Copyright © 2005 Information Resources, Inc. Confidential and proprietary.
Dummy Data
Year On Year Growth of Total Market, by CategoryQuarter This Year Vs Quarter Last Year
19.0
12.0
5.4
9.1
6.9
2.0
8.2
5.8
1.33.0
3.7
7.4
22.0
2.0
-3.1-1.4
6.17.2
8.8
11.0
-0.6
6.55.6
7.2
20
8
1.9
4.5
6.5
4
8.5 7.9
0.5
4.7 4.4
7.3
Q3-03/Q3-
02
Q4-03/Q4-
02
Q1-04/Q1-
03
Q2-04/Q2-
03
Q3-04/Q3-
03
Q4-04/Q4-
03
Q1-05/Q1-
04
Q2-05/Q2-
04
Q3-05/Q3-
04
Q4-05/Q4-
04
Q1-06/Q1-
05
Q2-06/Q2-
05
STORE
CORP
TOTAL
Year on Year percent change, based on Market Sales data

Copyright © 2005 Information Resources, Inc. Confidential and proprietary.
Dummy Data
Contribution of each quarter to total year sales. Based on latest rolling full year of data
Category Seasonality: Quarter 3, 2005 - Quarter 2, 2006
Q1/0615.4%
Q3/0516.0%
Q4/0552.7%
Q2/0615.9%
Q1/0615.8%
Q3/0516.3%
Q4/0551.8%
Q2/0616.1%
B 2 C B 2 B
Dummy Data

Copyright © 2005 Information Resources, Inc. Confidential and proprietary.
Dummy Data
Total Market £260,000 £650,000 £201,000 £210,000 £245,000 £660,000 £215,000 £225,000 £247,000 £675,000 235,000 241,500
Q3 2003 Q4 2003 Q1 2004 Q2 2004 Q3 2004 Q4 2004 Q1 2005 Q2 2005 Q3 2005 Q4 2005 Q1 2006 Q2 2006
Category Segmentation Share Trends of Total Market
59.6 62.0 61.0 60.3 58.0 61.3 60.4 59.0 60.4 63.4 59.6 60.0
40.4 38.0 39.0 39.7 42.0 38.7 39.6 41.0 39.6 36.6 40.4 40.0
STORE CORP
Store & Corporate contribution to total sales each quarter. Value sale shown in the table is in £000s
Dummy Data

Copyright © 2005 Information Resources, Inc. Confidential and proprietary.
Dummy Data
Detailed Market BreakdownWhere the Market is broken down into the segmentation shown below, it is deemed to be representative of only the businesses that are listed below
- Boots
- Capital Incentives
- Debenhams
- Dixons Group Business Services
- Experience More
- Halfords
- House of Fraser
- Marriott Incentives
- Red Letter Days plc
- Sainsburys
- The High Street Voucher
- WH Smith
- Next
- Exhilaration
This information is only available to the companies listed above
Telephone: 01344 746000 Fax: 01344 746001
Total Market
B2B B2C
Reward/Incentive
Flexible Benefits
Legislative
Savings (incl Xmas Club)
Affinity Groups
E-commerce
E-commerce
OTC
Insurance Replacement
Savings (inc. Xmas club)

Copyright © 2005 Information Resources, Inc. Confidential and proprietary.
Dummy Data
Store 67,000 290,000 63,000 64,000 73,000 295,000 69,000 68,000 74,000 300000 80000 82000
Q3 2003
Q4 2003
Q1 2004
Q2 2004
Q3 2004
Q4 2004
Q1 2005
Q2 2005
Q3 2005
Q4 2005
Q1 2006
Q2 2006
Market Size, Split by Category B 2 CThis data is only available to members submitting this breakdown
3.2
45.0
0.1 2.0
46.0
0.2 0.5
45.9
0.0 0.11.6
1
2.5 2.53
2
3.3 4 3.6
3
3.2 4.2
95.2
54.0
97.5 97.4 95.0
52.0
96.7 95.8 95.9
51.1
96.8 95.7
OTC (B2C)
E-commerce (B2C)
Savings incl XmasClub (B2B)
Quarterly Value Sales, £000s. Market is defined as only the companies who submit the Breakdown.
Dummy Data

Copyright © 2005 Information Resources, Inc. Confidential and proprietary.
Dummy Data
corp 41,000 43,000 44,000 97,000 42,000 41,500 60,000 95,000 47,000 49,500 55,000 98,000
Q1 2003
Q2 2003
Q3 2003
Q4 2003
Q1 2004
Q2 2004
Q3 2004
Q4 2004
Q1 2005
Q2 2005
Q3 2005
Q4 2005
Market Size, Split by Category B 2 BThis data is only available to members submitting this breakdown
6862 59
69 7066 65 64
7065 66
7.011.5
12.0
9.5 6.7 13.0 12.0 13.07.0
12.0 13.00.50.4 1.0
0.6
0.90.1
0.41.0 0.3 0.5 1.0
1.0
2.8
13.0
1.52.7
2.0 10.50.5 0.5 4.0
10.0
0.00.0
0.9
1.95
2.95 5.5
5.2
4.9
6.5 75
5
76
0.02
0.4
0.2 0.6 0.2
0.5
0.5 0.523.2
9.7
21.05 20.2513.38
7.413.4 13.9 13.5
714.5 13.5
63.5
9.2
InsuranceReplacement (B2B)
E-commerce (B2B)
Affinity Groups (B2B)
Savings incl XmasClub (B2B)
Legislative (B2B)
Flexible Benefits(B2B)
Reward/Incentive(B2B)
Quarterly Value Sales, £000s. Market is defined as only the companies who submit the Breakdown.
Dummy Data

Copyright © 2005 Information Resources, Inc. Confidential and proprietary.
Dummy Data
STORE 7800 24000 8000 10000 11000 28000 8000 10000 9000 29000 8500 9000
CORP 250 1600 700 450 600 1700 500 550 700 2000 400 1000
TOTAL 8050 25600 8700 10450 11600 29700 8500 10550 9700 31000 8900 10000
Q3 03 Q4 03 Q1 04 Q2 04 Q3 04 Q4 04 Q1 05 Q2 05 Q3 05 Q4 05 Q1 2006 Q2 2006
Your percent share of market sales for Store, Corporate and Total. Table shows your sales figures in £000s.
Member Share Trend
7.0
8.0
7.0
6.0
5.0
8.0 8.0
4.0
5.0
8.5
6.1 6.2
2.0
1.0
2.0
1.0 1.0 1.0 1.0 1.0 1.0 1.0
0.4
1.0
3
4
3
4
3
4 4
2
3
4.3
3.84.1
STORECORPTOTAL
Dummy Data

Copyright © 2005 Information Resources, Inc. Confidential and proprietary.
Dummy Data
TOTAL £000 230,0 10,00 600,0 40,00 210,0 10,00 220,0 7,000 250,0 8,000 660,0 30,00 250,0 8,000 250,0 7,000 250,0 7,000 670,0 35,00 2E+0 8900 2E+0 1000
Q3-03 TM
Q3-03
MEM
Q4-03 TM
Q4-03
MEM
Q1-04 TM
Q1-04
MEM
Q2-04 TM
Q2-04
MEM
Q3-04 TM
Q3-04
MEM
Q4-04 TM
Q4-04
MEM
Q1-05 TM
Q1-05
MEM
Q2-05 TM
Q2-05
MEM
Q3-05 TM
Q3-05
MEM
Q4-05 TM
Q4-05
MEM
Q1-06 TM
Q1-06
MEM
Q2-06 TM
Q2-06
MEM
Store and Corporate segmentation of your Total Sales. Table shows Total Market sales and your Total Sales in £000s.
Member Sales Segmentation Compared to Total Market
59.0
92.0
55.0
95.0
60.0
94.0
61.0
90.0
60.0
90.0
53.0
92.0
60.0
94.0
61.0
92.0
60.0
93.0
55.0
96.0
59.6
95.5
60.0
90.0
41.0
8.0
45.0
5.0
40.0
6.0
39.0
10.0
40.0
10.0
47.0
8.0
40.0
6.0
39.0
8.0
40.0
7.0
45.0
4.0
40.4
4.5
40.0
10.0
STORE CORP
Dummy Data
Copyright © 2005 Information Resources, Inc. Confidential and proprietary.
Dummy Data
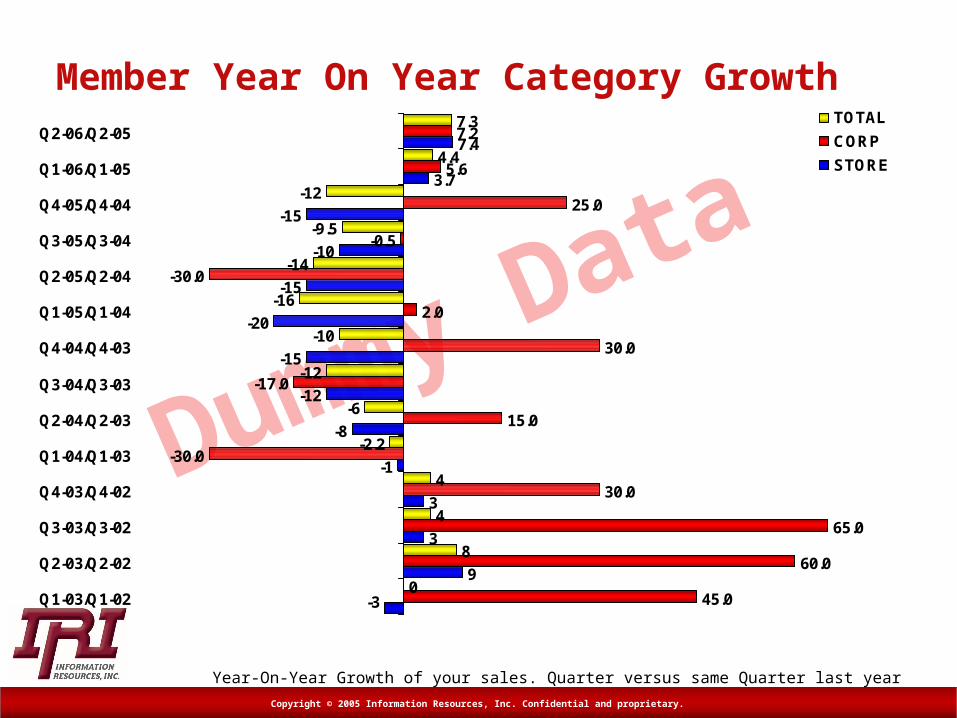
Member Year On Year Category Growth
-3
9
3
3
-1
-8
-12
-15
-20
-15
-10
-15
3.7
7.4
45.0
60.0
65.0
30.0
-30.0
15.0
-17.0
30.0
2.0
-30.0
-0.5
25.0
5.6
7.2
0
8
4
4
-2.2
-6
-12
-10
-16
-14
-9.5
-12
4.4
7.3
Q1-03/Q1-02
Q2-03/Q2-02
Q3-03/Q3-02
Q4-03/Q4-02
Q1-04/Q1-03
Q2-04/Q2-03
Q3-04/Q3-03
Q4-04/Q4-03
Q1-05/Q1-04
Q2-05/Q2-04
Q3-05/Q3-04
Q4-05/Q4-04
Q1-06/Q1-05
Q2-06/Q2-05TOTAL
CORP
STORE
Year-On-Year Growth of your sales. Quarter versus same Quarter last year

Copyright © 2005 Information Resources, Inc. Confidential and proprietary.
Dummy Data
Member YTD - - - - - - 1700 20000 -
Market YTD 20,185 600 6,000 4,000 500 20,000 100000 210000 8,000
2006 YTD MEM Share - - - - - - 1.70% 9.50% -
Insurance Replaceme
nt (B2B)
E-commerce
(B2B)
Affinity Groups (B2B)
Savings incl Xmas Club
(B2B)
Legislative (B2B)
Flexible Benefits
(B2B)
Reward/Incentive (B2B)
OTC (B2C)E-
commerce (B2C)
30.2 1.3 0.3 0.1
2.9
15
30
1
8
92
Market YTD
Member YTD
Corporate Sales Store Sales
Member & the Detailed Market Sales - Breakdown by SectorThe Market is defined as only the company’s who submit the detailed Breakdown. Chart shows the proportion of your sales in each breakdown, and how this compares to the Market
Detailed segmentation of your Total Sales. Table shows segmented Market sales and your Market share & Sales in £000s. Figures are YTD.

Copyright © 2005 Information Resources, Inc. Confidential and proprietary.
Dummy Data
Year On Year Growth in Member & the Segmented Market
-8.0
600.0
-25.0
80.0
-15.0
25.0
-18.0
7.0
20.0
-2.5
9.4
Insurance Replacement (B2B)
E-commerce (B2B)
Affinitv Groups (B2B)
Savings (B2B)
Legislative (B2B)
Flexible Benefits (B2B)
Reward/Incentive (B2B)
OTC (B2C)
E-commerce (B2C)
Market Growth
Member Growth
Your growth of the segment versus the growth in the segmented Market, against the same period last year.

Copyright © 2005 Information Resources, Inc. Confidential and proprietary.
Dummy Data
Year On Year Growth in Member & the Segmented Market without Member
-8.0
600.0
-25.0
80.0
-15.0
25.0
-15.0
3.5
25.0
-2.5
9.4
Insurance Replacement (B2B)
E-commerce (B2B)
Affinitv Groups (B2B)
Savings (B2B)
Legislative (B2B)
Flexible Benefits (B2B)
Reward/Incentive (B2B)
OTC (B2C)
E-commerce (B2C)
Market Growth
Member Growth
Your growth of the segment versus the growth in the segmented Market, against the same period last year.

Copyright © 2005 Information Resources, Inc. Confidential and proprietary.
Dummy Data
Retail Market Breakdown
Within this report, there are additional charts, based on a new market split, which only includes the companies who are also members of the British Retail Consortium (the “Retail Market”)
The additional charts detail the proportion of your sales that split into Store & Corporate sales, and benchmarks this against the Retail Market.
The Retail Market includes the following retailers:
Argos Retail - Kingfisher Boots - Marks & Spencer Debenhams - Next Dixons Group Business Services - Sainsbury’s Halfords - Tesco House of Fraser - Thresher Group John Lewis Direct - WH Smith
This information is only available to the companies listed above
Telephone: 01344 746000 Fax: 01344 746001

Copyright © 2005 Information Resources, Inc. Confidential and proprietary.
Dummy Data
Value Sales each Quarter, starting quarter 3, 2002. Bars are in £000s.
Total ‘Retail Market’ Size
130,
000
250,
000
95,0
00 125,
000
130,
000
330,
000
130,
000
125,
000
140,
000
360,
000
135,
000
140,
000
60,0
00
110,
000
38,0
00
50,0
00
45,0
00
110,
000
45,0
00
55,0
00
60,0
00
115,
000
45,0
00
50,0
00
190,
000
360,
000
133,
000 17
5,00
0
175,
000
440,
000
175,
000
180,
000
200,
000
475,
000
1800
00
1900
00
Q3 03 Q4 03 Q1 04 Q2 04 Q3 04 Q4 04 Q1 05 Q2 05 Q3 05 Q4 05 Q1 06 Q2 06
STORE
CORP
TOTAL

Copyright © 2005 Information Resources, Inc. Confidential and proprietary.
Dummy Data
Year On Year Growth of Total ‘Retail Market’, by CategoryQuarter This Year Vs Quarter Last Year
14.4
11.0
5.0
9.0
6.0
0.5
8.05.0 5.0
7.0
3.8
12.0
28.6
-10.0 -9.0
-4.0
-15.0
8.06.0
2.0
19.0 20.0
0.0
-9.1
20.3
5.0
0.1
6.0
-1.0
4.0
7.0
4.0
9.0
12.0
2.95.6
Q3-03/Q3-02
Q4-03/Q4-02
Q1-04/Q1-03
Q2-04/Q2-03
Q3-04/Q3-03
Q4-04/Q3-04
Q1-05/Q1-04
Q2-05/Q2-04
Q3-05/Q3-04
Q4-05/Q4-04
Q1-06/Q1-05
Q2-06/Q2-05
STORE
CORP
TOTAL
Year on Year percent change, based on Market Sales data

Copyright © 2005 Information Resources, Inc. Confidential and proprietary.
Dummy Data
STORE 130,000 250,000 95,000 125,000 130,000 330,000 130,000 125,000 140,000 360,000 135000 140000
CORP 60,000 110,000 38,000 50,000 45,000 110,000 45,000 55,000 60,000 115,000 45000 50000
TOTAL 190,000 360,000 133,000 175,000 175,000 440,000 175,000 180,000 200,000 475,000 180000 190000
Q3 03 Q4 03 Q1 04 Q2 04 Q3 04 Q4 04 Q1 05 Q2 05 Q3 05 Q4 05 Q1 06 Q2 06
Your percent share of market sales for Store, Corporate and Total. Table shows ‘Retail Market’ sales figures in £000s.
Member Share of ‘Retail Market’ Sales
6.2
10.0
8.0
6.0
5.3
8.5
6.0
4.44.8
8.3
6.3 6.4
1.2 1.01.3 1.2 1.0
2.5
1.51.0 1.1
1.8
0.9
2.0
4.6
6.8
5.6
4.34
6.7
4.2
3.4 3.6
6.7
4.95.3
STORE
CORP
TOTAL
Dummy Data


![POS 프로그램 시작 - POSBANKword.posbank.co.kr/Resources/POPsRetail-POS-PBUM-S001E(Rev00… · Check Voucher [Checking voucher screen] 1. Select Check Voucher. 2. Check the Voucher](https://img.dokumen.tips/doc/110x75/5eae5638ce39362e99362a99/pos-eoeee-oe-rev00-check-voucher-checking-voucher-screen-1-select.jpg)