Embed Size (px)
Citation preview

Copyright © 2005 ESRI. All rights reserved. H&H Using ArcGIS
Introduction to NSS

2-2H&H Using ArcGISCopyright © 2005 ESRI. All rights reserved.
Stream Statistics Background

2-3H&H Using ArcGISCopyright © 2005 ESRI. All rights reserved.
Regression Equations
Used to estimate streamflow statistics for ungaged sites (in uncontrolled flow environment)
Relate streamflow statistics to measured basin characteristics
Developed by all 48 USGS Districts on a State-by-State basis through the cooperative program (usually sponsored by DOT)
Often not used because of large efforts needed to determine basin characteristics
Users often measure basin characteristics inaccurately

2-4H&H Using ArcGISCopyright © 2005 ESRI. All rights reserved.
Need for Streamflow Statistics
Water resources planning, management, and permitting by Federal, State, local agencies
Instream flow determinations for controlling pollution and protecting habitat
Designing and permitting facilities such as wastewater-treatment plants, hydropower plants, and water-supply reservoirs
Designing structures such as roads, bridges, culverts, dams, locks, and levees

2-5H&H Using ArcGISCopyright © 2005 ESRI. All rights reserved.
Example Regression Equation
Regression equations take the form:
Q100 = 0.471A0.715E0.827SH0.472
where:
A is drainage area, in square
miles
E is mean basin elevation, in feet
SH is a shape factor, dimensionless
2-6H&H Using ArcGISCopyright © 2005 ESRI. All rights reserved.
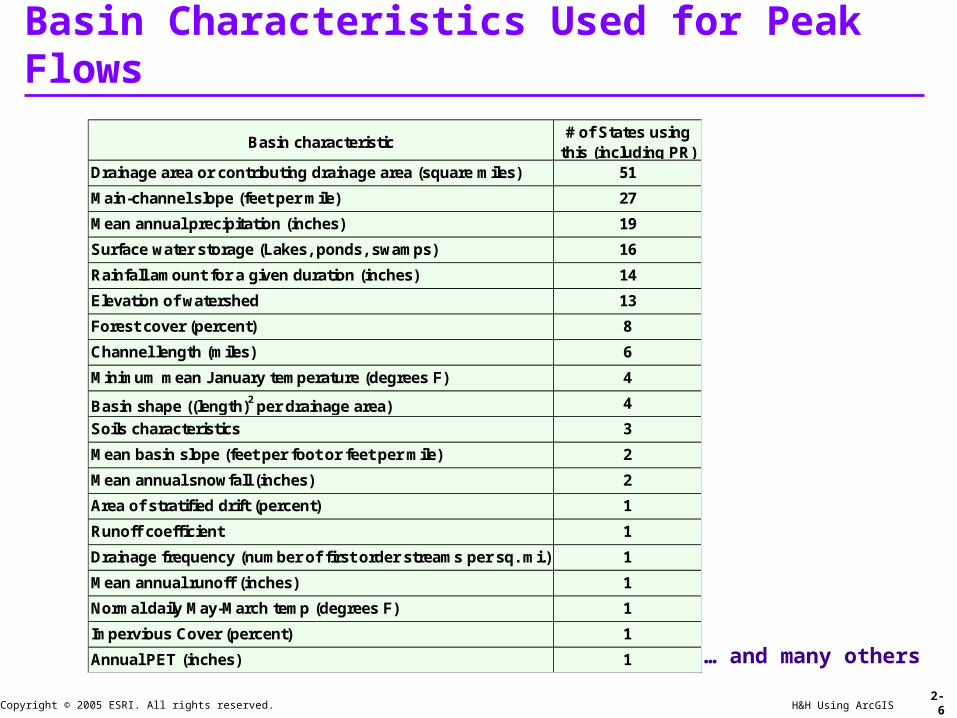
Basin Characteristics Used for Peak Flows
Basin characteristic# of States using
this (including PR)Drainage area or contributing drainage area (square miles) 51
Main-channel slope (feet per mile) 27
Mean annual precipitation (inches) 19
Surface water storage (Lakes, ponds, swamps) 16
Rainfall amount for a given duration (inches) 14
Elevation of watershed 13
Forest cover (percent) 8
Channel length (miles) 6
Minimum mean January temperature (degrees F) 4
Basin shape ((length)2 per drainage area) 4
Soils characteristics 3
Mean basin slope (feet per foot or feet per mile) 2
Mean annual snowfall (inches) 2
Area of stratified drift (percent) 1
Runoff coefficient 1
Drainage frequency (number of first order streams per sq. mi.) 1
Mean annual runoff (inches) 1
Normal daily May-March temp (degrees F) 1
Impervious Cover (percent) 1
Annual PET (inches) 1 … and many others

2-7H&H Using ArcGISCopyright © 2005 ESRI. All rights reserved.
Problems in Providing Statistics
Published streamflow statistics for data-collection stations are scattered among hundreds of reports nationally
Many publications are out of date and/or out of print
Labor cost for information requests is high
Streamflow statistics are not available everywhere they are needed

2-8H&H Using ArcGISCopyright © 2005 ESRI. All rights reserved.
Manually Determining Basin Characteristics
A 10-square mile basin takes an hour to a few days, depending on characteristics measured and source material
The required time increases exponentially with increasing watershed area because of the increasing dendritic patterns and logistical problems when matching between map sheets
The manual process is not completely repeatable
The error introduced by determining basin characteristics probably is as large as the uncertainty in the regression models

2-9H&H Using ArcGISCopyright © 2005 ESRI. All rights reserved.
Teamwork !
USGS:
Data development, server hosting, parameter extraction
methodology, equations, UI design
Aquaterra:
NSS – regression calculator
ESRI:
GIS WEB and desktop implementation, integration,
application and system design

2-10H&H Using ArcGISCopyright © 2005 ESRI. All rights reserved.
StreamStatsDB/NSS
StreamStatsDB – database (MS Access) with all the data that were used for derivation of regression equations, and their coefficients (cca. 5,200 gaging stations) Heavily normalized
All regression equation coefficients
Separate application for database editing
NSS - VB application for computing regression for known input parameters (regression calculator) – peak/low flows, rural/urban (if available) Uses data from StreamStatsDB so the application does not have
to change when the underlying data and equations change

2-11H&H Using ArcGISCopyright © 2005 ESRI. All rights reserved.
StreamStatsDB
… and many others

2-12H&H Using ArcGISCopyright © 2005 ESRI. All rights reserved.
NSS

2-13H&H Using ArcGISCopyright © 2005 ESRI. All rights reserved.
Role of GIS

2-14H&H Using ArcGISCopyright © 2005 ESRI. All rights reserved.
Role of GIS
Speedup the process (instead of hours – minutes)
Provide a common (single) access to the methodology (for users and maintenance)
Systematize methodology and datasets used in the process (repeatability)
Provide better tools for deriving characteristics for regression equation determination
Map-based user interface
WEB and desktop implementation based on Arc Hydro

2-15H&H Using ArcGISCopyright © 2005 ESRI. All rights reserved.
WEB vs. Desktop Implementation
Tradeoffs in each implementation WEB
Centralized location for data and software
End users do not need local software or data
Easy maintenance of the application and data but changes have global scope
Complex hardware and software requirements
Difficult customization
Desktop
Easy local updates to the data (latest and greatest for local area)
Easy modification (full ArcGIS capabilities)
Simpler hardware and software requirements
Can be local (i.e. only local data)
Integrated with other applications

2-16H&H Using ArcGISCopyright © 2005 ESRI. All rights reserved.
Steps in Implementation
Preprocess data (one time operation) Make sure all parameters can be computed and add functionality
if needed
Select point of interest
Delineate watershed
Display results and confirm validity of the area
Compute required characteristics Determine which characteristics are needed from
StreamStatsDB
Call NSS (in the background) Pass parameters from GIS and save results
Display results

2-17H&H Using ArcGISCopyright © 2005 ESRI. All rights reserved.
Arc Hydro Tools Role
StreamStats fully implemented within Arc Hydro environment Terrain preprocessing
Local and global watershed delineation
Extracting local characteristics
Assembly of global characteristics
Characteristics developed for StreamStats are available to wider audience (e.g. hydrologic modeling support)
Desktop implementation

2-18H&H Using ArcGISCopyright © 2005 ESRI. All rights reserved.
Arc Hydro Corollary
Define GIS processes for characteristics extraction
Define nomenclature Characteristics description
Database design (fields names and definitions)
Consistency in development approach

2-19H&H Using ArcGISCopyright © 2005 ESRI. All rights reserved.
Web Implementation

2-20H&H Using ArcGISCopyright © 2005 ESRI. All rights reserved.
Main Site (ID)

2-21H&H Using ArcGISCopyright © 2005 ESRI. All rights reserved.
Main Site - navigationNeed to zoom in before
watershed delineation tool becomes active:
see the stream to snap on

2-22H&H Using ArcGISCopyright © 2005 ESRI. All rights reserved.
Watershed Delineation - WEB

2-23H&H Using ArcGISCopyright © 2005 ESRI. All rights reserved.
Results - WEB
Watershed delineation 20-30 seconds, not much
difference with respect to size of the watershed
Parameter computations 10s – 1 minute, depends
on the region (what parameters to get) and somewhat on the size
Careful with concurrent user demand wait and wait and …

2-24H&H Using ArcGISCopyright © 2005 ESRI. All rights reserved.
WEB Implementation Issues (1)
Size (20 GB and counting - one state)
Speed (WEB) Watershed delineation (30 seconds)
Parameter extraction (40 seconds)
Projection issues (display in one projection, analysis in another)
WEB implementation ahead of time
Preprocessing requirements
User desire for interactive operations Edit resulting watershed before getting characteristics

2-25H&H Using ArcGISCopyright © 2005 ESRI. All rights reserved.
Inconsistency of parameter extraction techniques between GIS and gage properties (including data sources)
Hefty hardware and software requirements
Multi-state implementation
Implementation support
Implementation on both desktop and WEB
Systematization of data and procedures
Managing scale issues (global delineation)
Cool factor
WEB Implementation Issues (2)

2-26H&H Using ArcGISCopyright © 2005 ESRI. All rights reserved.
StreamStats Implementation Activities (7/2005)
Source: http://water.usgs.gov/osw/streamstats/ssonline.html
Red – operational; blue – work in progress

2-27H&H Using ArcGISCopyright © 2005 ESRI. All rights reserved.
Interested in StreamStats for your state?
Contact the USGS Water Resources District Chief for your state:http://water.usgs.gov/district_chief.html
Also, contact the StreamStats Team: [email protected]
For more information, seehttp://streamstats.usgs.gov/
For downloads, see http://water.usgs.gov/software/nff.html
Source: Al Rea, USGS

2-28H&H Using ArcGISCopyright © 2005 ESRI. All rights reserved.
Desktop Implementation

2-29H&H Using ArcGISCopyright © 2005 ESRI. All rights reserved.
Watershed Delineation - Desktop
Watershed delineation Use any Arc Hydro
technique

2-30H&H Using ArcGISCopyright © 2005 ESRI. All rights reserved.
Results - Desktop
Parameter computations Use “NSS Get Parameters”
function from the NSS ArcMap menu (custom toolbar)
Regression computations Batch process - use “NSS
Batch” function from the NSS ArcMap menu (runs NSS)
Interactive - use “NSS Interactive” function from the NSS ArcMap menu (starts Excel)

2-31H&H Using ArcGISCopyright © 2005 ESRI. All rights reserved.
Interactive Calculator - Desktop
Excel implementation – full flexibility

2-32H&H Using ArcGISCopyright © 2005 ESRI. All rights reserved.
Desktop Implementation Issues
Size (can be limited to smaller extents – e.g. Wisconsin has 13 regions)
Speed – faster than WEB implementation due to less overhead and more control over preprocessing
Projection issues (display and analysis in the same projection)
Proven technology
Interactive operations More control over the computations (can “play games” –
sensitivity analysis) – can easily implement their own equations on different data
Easy to add more functionality