Embed Size (px)
Citation preview


Copies of Splunk Inc.’s Annual Report, as well as other financial reports and news from Splunk Inc., may be read and downloaded from our website at http://investors.splunk.com. If you do not have online access, you may request printed materials by contacting Splunk Inc. Investor Relations at: 415.848.8476.
AuditorsPricewaterhouseCoopers LLPSan Jose, CA
Corporate CounselWilson Sonsini Goodrich & Rosati, Professional CorporationPalo Alto, CA
Stock Transfer Agent and Registrar of StockAST6201 15th Avenue Brooklyn, NY 11219Phone: 800.937.5449www.astfinancial.comEmail: [email protected]
Stock ListingSplunk Inc. common stock is traded on NASDAQ Global Select Market, listed under the symbol “SPLK”
Investor RelationsContact InformationSplunk Inc.3098 Olsen DriveSan Jose, CA 95128Email: [email protected]: 415.848.8476
Sara BaackChief Product Officer, Equinix
Sean BoyleCOO and CFO, Wildlife Studios Limited
Mark CargesFormer CTO, eBay
Doug MerrittPresident and Chief Executive Officer, Splunk
Patricia MorrisonFormer EVP, Customer Support Services, and CIO of Cardinal Health
Stephen NewberryFormer Chairman, Lam Research
Graham SmithIndependent Chair, Splunk
Elisa SteeleIndependent Board Member
Sri ViswanathCTO, Atlassian
General Dennis ViaEVP, Booz Allen Hamilton and Retired Four-Star U.S. Army General
Doug MerrittPresident and Chief Executive Officer
Teresa CarlsonPresident and Chief Growth Officer
Jason ChildSenior Vice President and Chief Financial Officer
Ammar MaraqaSenior Vice President, Chief Strategy Officer
Scott MorganSenior Vice President, Chief Legal Officer, Global Affairs and Secretary
Jeremy RishelSenior Vice President, Engineering
Kristen RobinsonSenior Vice President, Chief People Officer
John SabinoSenior Vice President, Chief Customer Officer
Sendur SellakumarSenior Vice President, Cloud and Chief Product Officer
Christian SmithSenior Vice President, Chief Revenue Officer
Tim TullySenior Vice President, Chief Technology Officer
2020 was an unforgettable year of tremendous challenges and remarkable moments of human kindness and ingenuity. The COVID-19 pandemic was — and remains — a global health crisis. Its disruptive effects were magnified by the necessary discussions raised by racial inequalities and social unrest compounded by the particularly fractious U.S. presidential election. These factors sparked protest, intense discussions and watchful concern worldwide. Just as the year was ending, the revelation of the SolarWinds hacks gave organizations around the world a new top-priority concern.
Now in 2021, a new, different life is starting to emerge. We’re not “going back” to anything. The future is being
aggressively and irrevocably shaped. 2020 changed us: Our idea of what is possible has shifted, and we’ve
never been more receptive to the new. In the face of so much change, it’s clear that data is powering many of
today’s radical transformations. Data truly is coming to everything.
As we near the halfway point in calendar 2021, systemic challenges remain. Still, the success of a record-
shattering vaccine rollout offers a return to greater economic stability, as well as a chance to catch our breath
and address all the ways our society needs to evolve. Forrester is now forecasting 6% growth in business and
government spending on tech in 2021 and 6.5% growth in 2022.
The heroic efforts of strategic leaders and IT teams who kept the lights on worldwide this past year have
underscored the transformative value of data. Our new vision feels right for this moment and the continuing
evolution of this Data Age: A world where data provides clarity, elevates discussion and accelerates progress.
Anyone who has had to adapt to remote work and communication — and marveled at the speed of vaccine
efforts — can feel that vision in action. And in this age of data-driven progress, we’ve crystalized Splunk’s
corporate mission: Remove the barriers between data and action so that everyone thrives in the Data Age.
Just as 2020 taught the world a fresh lesson about the value of disaster preparedness, 2021 may underscore
the value, also, of opportunity preparedness. Now is the time for the exponential.
A Year of Challenge and Gratitude
Splunk’s most recent fiscal year, 2021, was at once difficult and stunningly rewarding. Splunk responded to
COVID-19 with agility, extreme customer focus, and an unrelenting belief in the power of data to address these
challenges. I remain profoundly grateful to all Splunkers for their strength, commitment and resilience. Within
Splunk, we pivoted to an entirely virtual orientation within a matter of days, with a strong focus on ensuring
business continuity, customer success and employee productivity. Candidly, it was easier for us because we
are Splunk super-users.

Copies of Splunk Inc.’s Annual Report, as well as other financial reports and news from Splunk Inc., may be read and downloaded from our website at http://investors.splunk.com. If you do not have online access, you may request printed materials by contacting Splunk Inc. Investor Relations at: 415.848.8476.
AuditorsPricewaterhouseCoopers LLPSan Jose, CA
Corporate CounselWilson Sonsini Goodrich & Rosati, Professional CorporationPalo Alto, CA
Stock Transfer Agent and Registrar of StockAST6201 15th Avenue Brooklyn, NY 11219Phone: 800.937.5449www.astfinancial.comEmail: [email protected]
Stock ListingSplunk Inc. common stock is traded on NASDAQ Global Select Market, listed under the symbol “SPLK”
Investor RelationsContact InformationSplunk Inc.3098 Olsen DriveSan Jose, CA 95128Email: [email protected]: 415.848.8476
Sara BaackChief Product Officer, Equinix
Sean BoyleCOO and CFO, Wildlife Studios Limited
Mark CargesFormer CTO, eBay
Doug MerrittPresident and Chief Executive Officer, Splunk
Patricia MorrisonFormer EVP, Customer Support Services, and CIO of Cardinal Health
Stephen NewberryFormer Chairman, Lam Research
Graham SmithIndependent Chair, Splunk
Elisa SteeleIndependent Board Member
Sri ViswanathCTO, Atlassian
General Dennis ViaEVP, Booz Allen Hamilton and Retired Four-Star U.S. Army General
Doug MerrittPresident and Chief Executive Officer
Teresa CarlsonPresident and Chief Growth Officer
Jason ChildSenior Vice President and Chief Financial Officer
Ammar MaraqaSenior Vice President, Chief Strategy Officer
Scott MorganSenior Vice President, Chief Legal Officer, Global Affairs and Secretary
Jeremy RishelSenior Vice President, Engineering
Kristen RobinsonSenior Vice President, Chief People Officer
John SabinoSenior Vice President, Chief Customer Officer
Sendur SellakumarSenior Vice President, Cloud and Chief Product Officer
Christian SmithSenior Vice President, Chief Revenue Officer
Tim TullySenior Vice President, Chief Technology Officer
2020 was an unforgettable year of tremendous challenges and remarkable moments of human kindness and ingenuity. The COVID-19 pandemic was — and remains — a global health crisis. Its disruptive effects were magnified by the necessary discussions raised by racial inequalities and social unrest compounded by the particularly fractious U.S. presidential election. These factors sparked protest, intense discussions and watchful concern worldwide. Just as the year was ending, the revelation of the SolarWinds hacks gave organizations around the world a new top-priority concern.
MAY 2021
Dear Fellow Splunk Stockholders,
Now in 2021, a new, different life is starting to emerge. We’re not “going back” to anything. The future is being
aggressively and irrevocably shaped. 2020 changed us: Our idea of what is possible has shifted, and we’ve
never been more receptive to the new. In the face of so much change, it’s clear that data is powering many of
today’s radical transformations. Data truly is coming to everything.
As we near the halfway point in calendar 2021, systemic challenges remain. Still, the success of a record-
shattering vaccine rollout offers a return to greater economic stability, as well as a chance to catch our breath
and address all the ways our society needs to evolve. Forrester is now forecasting 6% growth in business and
government spending on tech in 2021 and 6.5% growth in 2022.
The heroic efforts of strategic leaders and IT teams who kept the lights on worldwide this past year have
underscored the transformative value of data. Our new vision feels right for this moment and the continuing
evolution of this Data Age: A world where data provides clarity, elevates discussion and accelerates progress.
Anyone who has had to adapt to remote work and communication — and marveled at the speed of vaccine
efforts — can feel that vision in action. And in this age of data-driven progress, we’ve crystalized Splunk’s
corporate mission: Remove the barriers between data and action so that everyone thrives in the Data Age.
Just as 2020 taught the world a fresh lesson about the value of disaster preparedness, 2021 may underscore
the value, also, of opportunity preparedness. Now is the time for the exponential.
A Year of Challenge and Gratitude
Splunk’s most recent fiscal year, 2021, was at once difficult and stunningly rewarding. Splunk responded to
COVID-19 with agility, extreme customer focus, and an unrelenting belief in the power of data to address these
challenges. I remain profoundly grateful to all Splunkers for their strength, commitment and resilience. Within
Splunk, we pivoted to an entirely virtual orientation within a matter of days, with a strong focus on ensuring
business continuity, customer success and employee productivity. Candidly, it was easier for us because we
are Splunk super-users.

Building From a Strong Foundation
Exceptional business execution is only possible because of exceptional Splunkers, and a strong focus on the
culture and work environment that we all help create. We again were recognized on multiple best workplace
lists, including Fortune’s list of the “100 Best Companies to Work For in 2021.” We were also honored to be
on the HRC Corporate Equality Index’s “Best Places to Work for LGBTQ Equality,” Fortune’s “Best Workplaces
for Women 2020,” and Great Place to Work’s “Best Workplaces for Parents 2020.” Further, we debuted
at No. 8 in our sector on Fortune’s list of “World’s Most Admired Companies,” scoring particularly high for
financial soundness, global competitiveness, use of corporate assets and social responsibility.
Everything, from the progress of our transformations and our dogged resilience in the face of 2020 to the
increasing importance of data in every aspect of our lives, convinces me that the future is bright both for
Splunk and the world.
Data will continue to deliver clarity, accelerate positive change, strengthen and lift communities, and
create a more just world. In fact, we could be on the cusp of the fastest-moving, fastest-growing, most
possibility-rich economy we’ve ever seen.
Thank you for your continued confidence in Splunk during our transformation. We’re more focused than ever
on helping customers bring data to everything. No matter what the future holds, we know that when the right
people have the right data, everything is possible.
Doug Merritt
President and CEO
Splunk Inc.
We also updated processes and expanded wellness programs to ensure that our people felt safe and
supported. Caring for our team made it possible for them to care for our customers. We dug deep to help
customers navigate new and complex environments, respond to massive security risks, and harness new
data opportunities. We provided ongoing support, implementation and consulting services, and we debuted
new offerings and flexible pricing terms.
In the face of massive uncertainty, we continued our run as one of the fastest-growing enterprise software
companies in history. By the end of our fiscal year 2021, Splunk Cloud grew by 83% year-over-year, with
cloud ARR reaching $810 million. We are incredibly proud of the cloud breakthroughs we’ve achieved. And
our success in cloud transformation gives us a unique ability to help our customers make their own radical
cloud transformations.
Just four years ago, cloud was less than 20% of our total software bookings, delivering $48 million in revenue,
and the upper end of allowable daily data volume was about 10TB per day. In our fiscal year 2021, cloud
revenue stood at $554 million, representing an 84% CAGR. We’re deploying 100TB+ footprints — with
customers taking advantage of workload pricing rather than our traditional data-ingest pricing. And in our
fourth quarter of fiscal year 2021, cloud represented the majority of new business, with 51% of our software
bookings coming from cloud.
Our accomplishments mean that the conversations I can have with the CEOs of our customers are
deep and meaningful. I know what it’s like to be the leader of a public company embarking on a radical
data transformation.
A key to our growth has been our commitment to company-wide transformations that we’ve been willing
to execute simultaneously. These transformations have delivered a richer portfolio of products, the
development of a modern cloud-native stack for the majority of our cloud services, the shift to cloud with
ARR as an important financial metric, significant investment in processes and tools, and category leadership.
Observability was among the standouts within our business in fiscal year 2021. It is a space with massive
potential: Enterprises increasingly strive to have real-time knowledge about almost unimaginable volumes of
rapidly changing data to fuel their businesses. Our acquisitions in fiscal year 2020 — SignalFx, Omnition and
Streamlio — were supplemented last fall when we added Plumbr, Rigor and Flowmill, leading to the recent
debut of our Observability Cloud, a portfolio of services unmatched in the industry.

How to Cast Your Vote
www.proxyvote.com Vote by Internet
1-800-690-6903 Vote by Telephone
Mail your signed proxy card Vote by Mail
Note for Street Name Holders: If you hold your shares through a broker, bank or other nominee, you must instruct your nominee how to vote the shares held in your account. The nominee will give you a voting instruction form.
Your vote is important. Please vote your shares as soon as possible.
See “Other Matters—Questions and Answers About the Proxy Materials and Our 2021 Annual Meeting” for details on voting requirements and additional information about the Annual Meeting, including how to vote at the Annual Meeting.
270 Brannan Street San Francisco, California 94107
Notice of Annual Meeting of StockholdersTo Be Held at 3:30 p.m. Pacific Time on June 17, 2021
To The Stockholders of Splunk Inc.:The 2021 Annual Meeting of Stockholders (the “Annual Meeting”) of Splunk Inc., a Delaware corporation (“Splunk,” “we,” or the “Company”), will be held virtually via live audio webcast on June 17, 2021, at 3:30 p.m. Pacific Time, for the following purposes, as more fully described in the accompanying proxy statement:
1. To elect four Class III directors to serve until the 2024 annual meeting of stockholders or until their successors are duly elected and qualified;
2. To ratify the appointment of PricewaterhouseCoopers LLP as our independent registered public accounting firm for our fiscal year ending January 31, 2022;
3. To conduct an advisory vote to approve the compensation of our named executive officers; and
4. To transact such other business as may properly come before the Annual Meeting or any adjournments or postponements thereof.
The Board of Directors of Splunk (the “Board”) fixed the close of business on April 21, 2021 as the record date for the Annual Meeting. Only holders of our common stock as of the record date are entitled to notice of and to vote at the Annual Meeting. Further information regarding voting rights and the matters to be voted upon is presented in the accompanying proxy statement.
On or about May 4, 2021, we mailed to our stockholders a Notice of Internet Availability of Proxy Materials (the “Notice”). The Notice provides instructions on how to vote online, by telephone, or by mail and includes instructions on how to receive a paper or e-mail copy of proxy materials if you choose. Instructions on how to access our proxy statement and our fiscal 2021 Annual Report may be found in the Notice or on our website at investors.splunk.com.
The Annual Meeting this year will be a virtual-only meeting, due to continuing public health and safety considerations posed by the COVID-19 pandemic and in order to allow all of our stockholders to join the meeting from any location. Stockholders will be able to attend and participate in the Annual Meeting, vote their shares electronically, submit questions, and examine a stockholder list during the live audio webcast of the Annual Meeting by visiting www.virtualshareholdermeeting.com/SPLK2021 and entering their control number. Stockholders may submit questions for the meeting in advance at www.proxyvote.com. We anticipate returning to an in-person, or transitioning to a hybrid, meeting format in future years.
YOUR VOTE IS IMPORTANT. Whether or not you plan to attend the Annual Meeting online, we urge you to submit your vote now via the Internet, telephone, or mail.
We appreciate your continued support of Splunk.
Very truly yours,
Scott Morgan Senior Vice President, Chief Legal Officer, Global Affairs and Secretary San Francisco, California May 4, 2021

1Splunk 2021 Proxy Statement
PR
OX
Y
Proxy Statement SummaryVoting Matters, Vote Recommendations and Rationale
PR
OP
OS
AL
1 Election of Class III DirectorsVote Recommendation “FOR” each nominee. (page 10)
The Board and the Nominating and Corporate Governance Committee believe that each of the nominees possesses the right skills, qualifications and experience to effectively oversee the Company’s long-term business strategy.
PR
OP
OS
AL
2 Ratification of Appointment of Independent Registered Public Accounting FirmVote Recommendation “FOR”. (page 35)
The Board and the Audit Committee believe that the retention of PricewaterhouseCoopers LLP for the fiscal year ending January 31, 2022 is in the best interests of the Company and its stockholders. As a matter of good corporate governance, stockholders are being asked to ratify the Audit Committee’s selection of the independent registered public accounting firm.
PR
OP
OS
AL
3 Advisory Vote to Approve Named Executive Officer CompensationVote Recommendation “FOR”. (page 39)
The Board and Compensation Committee believe our executive compensation program demonstrates the continuing evolution of our “pay for performance” philosophy, and reflects feedback received from stockholder engagement. We currently hold our Say-on-Pay advisory, non-binding vote annually.
Your vote is importantThis summary highlights information contained within this proxy statement. You should read the entire proxy statement carefully and consider all information before voting. Page references are supplied to help you find further information in this proxy statement.

2 Splunk 2021 Proxy Statement
Focusing on Employees and Customers During Unprecedented Business and Market Uncertainty
Ensuring Employee Health and Safety Supporting Customers and Partners
• We offer employees 30 days of pay for pandemic-related absences plus 4 wellbeing paid rest days
• We reimburse certain expenses related to remote working • We offer counseling, coaching and digital wellness
• We granted payment concession requests• We negotiated changes to contract durations
Helping Organizations Helping Communities
• Our Global Restart program is designed to guide businesses through ways that data can most effectively support their return to work
• Our Remote Work Insights (RWI) is a solution designed to ease uncertainty and challenges of a distributed workforce
• We built publicly available interactive COVID-19 tracking dashboards
• We developed a COVID-19 testing management platform with a coalition of private, public and non-profit partners
Corporate GovernanceWe believe that good corporate governance promotes the long-term interests of our stockholders, strengthens our Board and management accountability and leads to better business performance. For these reasons, we are committed to maintaining strong corporate governance practices.
The “Corporate Governance at Splunk” section beginning on page 10 describes our governance practices, which include the following highlights:
• 100% Independent Committee Members• Independent Chair• Majority Voting for Directors with Resignation Policy• Annual Board and Committee Evaluation• Board Continuing Education Program• Proxy Access Bylaws• Director Change in Circumstances with Resignation Policy• Qualified Diverse Candidate Pool Policy• Board Risk Oversight• Periodic Review of Committee Charters and
Governance Policies• Regular Meetings of Independent Directors Without
Management Present
• Formal CEO Evaluation Process• Clawback Policy• Annual Say-on-Pay Vote• Stockholder Engagement Program• Stock Ownership Guidelines for Directors and
Officers• Anti-Hedging and Anti-Pledging Policy• Code of Conduct for Directors, Officers and
Employees• Succession Planning Process• Inaugural Environmental, Social and Governance
(“ESG”) Update• Inaugural Diversity & Inclusion Annual Report
Stockholder EngagementWe believe that effective corporate governance includes regular, constructive conversations with our stockholders. We are committed to maintaining an active dialogue to understand the priorities and concerns of our stockholders and believe that ongoing engagement builds mutual trust and understanding with our stockholders. Stockholder engagement and feedback are critical components of our corporate governance practices and inform our decisions and programs.
Over the past several years, in response to stockholder feedback, and as part of our ongoing evaluation of best practices, the Board has incorporated enhancements to our executive compensation program and corporate governance practices such as those depicted in the timeline. In fiscal 2021, we solicited the views of institutional stockholders representing approximately 73% of our shares and engaged in substantive discussions with stockholders representing approximately 25% of our shares. These discussions have helped ensure that our Board’s decisions are informed by stockholder objectives.
Fiscal 2021 Business HighlightsIn fiscal 2021, we prioritized delivering growth with a focus on disciplined execution of our business objectives as we navigate our ongoing business transformation to a subscription model. Accordingly, in fiscal 2021, we and our investors focused on total annual recurring revenue (“ARR”) and operating cash flow metrics. Our ongoing efforts with respect to customer success and adoption led to continued top-line ARR growth. Our focus on capturing our large and growing market opportunity requires that we continue to invest in our business. Accordingly, in fiscal 2021, our executive compensation plans balanced growth and operational discipline in support of our long-term market opportunity. Our fiscal 2021 business highlights include achievement of the following ARR and operating cash flow results and other important metrics:
• Total ARR of $2.365 billion, up 41% year-over-year(1);
• Operating cash flow of negative $191 million with free cash flow of negative $228 million(2);
• Non-GAAP operating margin of negative 3.8%(2); and
• 510 customers with ARR greater than $1 million, up 44% year-over-year.
(1) Total ARR represents the annualized revenue run-rate of active subscription, term license, and maintenance contracts at the end of a reporting period as reported in our Annual Report on Form 10-K for the year ended January 31, 2021. Each contract is annualized by dividing the total contract value by the number of days in the contract term and then multiplying by 365. ARR should be viewed independently of revenue, and does not represent our revenue under GAAP on an annualized basis, as it is an operating metric that can be impacted by contract start and end dates and renewal rates. ARR is not intended to be a replacement or forecasts of revenue.
(2) To supplement our consolidated financial statements, which are prepared and presented in accordance with GAAP, we provide investors with certain non-GAAP financial measures, including non-GAAP operating margin and free cash flow. For a full reconciliation between GAAP and non-GAAP operating margin and between net cash used in operating activities and free cash flow, please see our Annual Report on Form 10-K for the year ended January 31, 2021.
Total ARR($ in millions) • FYE January 31
FY21FY20FY19FY18
$1,680
$1,091
$727
2,500
0
500
1,000
1,500
2,000$2,365
41%
54%
50%
Total Stockholder Return*FYE January 31
$357$335
$270
$200
$125$100
0
50
100
150
200
250
300
350
400
202120202019201820172016
* The chart shows the total return on our common stock through the end of fiscal 2021, assuming an initial investment of $100 at the end of fiscal 2016.
Proxy Statement SummaryProxy Statement Summary

3Splunk 2021 Proxy Statement
PR
OX
Y
Focusing on Employees and Customers During Unprecedented Business and Market Uncertainty
Ensuring Employee Health and Safety Supporting Customers and Partners
• We offer employees 30 days of pay for pandemic-related absences plus 4 wellbeing paid rest days
• We reimburse certain expenses related to remote working • We offer counseling, coaching and digital wellness
• We granted payment concession requests• We negotiated changes to contract durations
Helping Organizations Helping Communities
• Our Global Restart program is designed to guide businesses through ways that data can most effectively support their return to work
• Our Remote Work Insights (RWI) is a solution designed to ease uncertainty and challenges of a distributed workforce
• We built publicly available interactive COVID-19 tracking dashboards
• We developed a COVID-19 testing management platform with a coalition of private, public and non-profit partners
Corporate GovernanceWe believe that good corporate governance promotes the long-term interests of our stockholders, strengthens our Board and management accountability and leads to better business performance. For these reasons, we are committed to maintaining strong corporate governance practices.
The “Corporate Governance at Splunk” section beginning on page 10 describes our governance practices, which include the following highlights:
• 100% Independent Committee Members• Independent Chair• Majority Voting for Directors with Resignation Policy• Annual Board and Committee Evaluation• Board Continuing Education Program• Proxy Access Bylaws• Director Change in Circumstances with Resignation Policy• Qualified Diverse Candidate Pool Policy• Board Risk Oversight• Periodic Review of Committee Charters and
Governance Policies• Regular Meetings of Independent Directors Without
Management Present
• Formal CEO Evaluation Process• Clawback Policy• Annual Say-on-Pay Vote• Stockholder Engagement Program• Stock Ownership Guidelines for Directors and
Officers• Anti-Hedging and Anti-Pledging Policy• Code of Conduct for Directors, Officers and
Employees• Succession Planning Process• Inaugural Environmental, Social and Governance
(“ESG”) Update• Inaugural Diversity & Inclusion Annual Report
Stockholder EngagementWe believe that effective corporate governance includes regular, constructive conversations with our stockholders. We are committed to maintaining an active dialogue to understand the priorities and concerns of our stockholders and believe that ongoing engagement builds mutual trust and understanding with our stockholders. Stockholder engagement and feedback are critical components of our corporate governance practices and inform our decisions and programs.
Over the past several years, in response to stockholder feedback, and as part of our ongoing evaluation of best practices, the Board has incorporated enhancements to our executive compensation program and corporate governance practices such as those depicted in the timeline. In fiscal 2021, we solicited the views of institutional stockholders representing approximately 73% of our shares and engaged in substantive discussions with stockholders representing approximately 25% of our shares. These discussions have helped ensure that our Board’s decisions are informed by stockholder objectives.
Fiscal 2021 Business HighlightsIn fiscal 2021, we prioritized delivering growth with a focus on disciplined execution of our business objectives as we navigate our ongoing business transformation to a subscription model. Accordingly, in fiscal 2021, we and our investors focused on total annual recurring revenue (“ARR”) and operating cash flow metrics. Our ongoing efforts with respect to customer success and adoption led to continued top-line ARR growth. Our focus on capturing our large and growing market opportunity requires that we continue to invest in our business. Accordingly, in fiscal 2021, our executive compensation plans balanced growth and operational discipline in support of our long-term market opportunity. Our fiscal 2021 business highlights include achievement of the following ARR and operating cash flow results and other important metrics:
• Total ARR of $2.365 billion, up 41% year-over-year(1);
• Operating cash flow of negative $191 million with free cash flow of negative $228 million(2);
• Non-GAAP operating margin of negative 3.8%(2); and
• 510 customers with ARR greater than $1 million, up 44% year-over-year.
(1) Total ARR represents the annualized revenue run-rate of active subscription, term license, and maintenance contracts at the end of a reporting period as reported in our Annual Report on Form 10-K for the year ended January 31, 2021. Each contract is annualized by dividing the total contract value by the number of days in the contract term and then multiplying by 365. ARR should be viewed independently of revenue, and does not represent our revenue under GAAP on an annualized basis, as it is an operating metric that can be impacted by contract start and end dates and renewal rates. ARR is not intended to be a replacement or forecasts of revenue.
(2) To supplement our consolidated financial statements, which are prepared and presented in accordance with GAAP, we provide investors with certain non-GAAP financial measures, including non-GAAP operating margin and free cash flow. For a full reconciliation between GAAP and non-GAAP operating margin and between net cash used in operating activities and free cash flow, please see our Annual Report on Form 10-K for the year ended January 31, 2021.
Total ARR($ in millions) • FYE January 31
FY21FY20FY19FY18
$1,680
$1,091
$727
2,500
0
500
1,000
1,500
2,000$2,365
41%
54%
50%
Total Stockholder Return*FYE January 31
$357$335
$270
$200
$125$100
0
50
100
150
200
250
300
350
400
202120202019201820172016
* The chart shows the total return on our common stock through the end of fiscal 2021, assuming an initial investment of $100 at the end of fiscal 2016.
Proxy Statement SummaryProxy Statement Summary

4 Splunk 2021 Proxy Statement
Director Nominees and Other DirectorsEnsuring the Board is composed of directors who bring diverse viewpoints and perspectives, exhibit a variety of skills, experience, and backgrounds, and effectively represent the long-term interests of stockholders is a top priority of our Board and Nominating and Corporate Governance Committee. The Board believes periodic assessment of directors is integral to an effective governance structure and aims to strike a balance between ensuring that we retain directors with deep knowledge of the Company while adding directors who bring a fresh perspective. We have added three new directors since 2019, enhancing the Board’s breadth and depth of experience and diversity, while taking into account the Company’s evolving business model, the macro technology business environment and the changing governance landscape. See below for summary information about our Board and each director nominee and continuing director as of May 1, 2021. For purposes of the information below, a director is a member of an underrepresented community under California AB 979, defined as “an individual who self-identifies as Black, African American, Hispanic, Latino, Asian, Pacific Islander, Native American, Native Hawaiian, or Alaska Native, or who self-identifies as gay, lesbian, bisexual or transgender.” See pages 14 to 18 for more information.
Current Board OverviewDirector
IndependenceTenure Age Gender Diversity Underrepresented
Community Diversity1Non-independent
90%Independent
9Independent
110-13years
46-9years 2
3-5years
30-2
years
AverageTenure
4.9 years
240-49
years old
460-69years old
450-59
years old
AverageAge
56.9 years
7Men
3Women
30%Women
20% Under-representedCommunities
2Underrepresented
Community Diversity
8Other
Committees
Class AgeDirector
SinceCurrent Term
ExpiresExpiration of Term for
Which Nominated
20
21
Dir
ecto
r N
omin
ees
Sara Baack*Chief Product Officer, Equinix
III 49 2017 2021 2024
Sean Boyle*COO and CFO, Wildlife Studios Limited
III 53 2020 2021 2024
Douglas MerrittPresident and CEO, Splunk
III 57 2015 2021 2024
Graham Smith*Chair, Splunk
III 61 2011 2021 2024
Con
tinu
ing
Dir
ecto
rs
Mark Carges*Former CTO, eBay
I 59 2014 2022 —
Elisa Steele*Independent Board Member
I 54 2017 2022 —
Sri Viswanath*CTO, Atlassian
I 45 2019 2022 —
Patricia Morrison*Former EVP, Customer Support Services, and CIO, Cardinal Health
II 61 2013 2023 —
Stephen Newberry*Former Chairman, Lam Research
II 67 2013 2023 —
General Dennis Via*EVP, Booz Allen Hamilton and Retired Four-Star U.S. Army General
II 63 2020 2023 —
* Independent director Audit Committee Compensation Committee Nominating and Corporate Governance Committee
Chair Member Audit Committee Financial Expert
For additional information, see “Corporate Governance at Splunk—Stockholder Engagement” on page 31 of this proxy statement and “Executive Compensation—Compensation Discussion and Analysis—Executive Summary—Stockholder Engagement and Our 2020 Say-on-Pay Vote” on page 42 of this proxy statement.
2021 APRIL• Enhanced proxy disclosure of Board oversight of COVID-19 response• Added underrepresented community diversity of Board to proxy
2020 NOVEMBER• Released first ESG update
MARCH• Replaced revenue metric with annual recurring revenue in both our executive bonus plan and our PSU
program to align our incentives with key drivers of stockholder value and reflect our transition to a renewable business model
• Replaced non-GAAP operating margin metric with operating cash flow in our PSU program to reflect focus on disciplined execution of our business objectives during our transition to a renewable business model
2019 APRIL• Enhanced proxy disclosures of Board succession planning, risk oversight and corporate sustainability
2018 SEPTEMBER• Updated stock ownership guidelines
APRIL• Enhanced proxy disclosures of director qualifications and skills, the role of diversity in our director
nominations process, Board refreshment and corporate sustainability
MARCH• Added stock price modifier to PSU program
2017 DECEMBER• Adopted director change in circumstances with resignation policy• Adopted qualified diverse candidate pool policy
APRIL• Added collective director qualifications table to proxy
MARCH• Replaced operating cash flow metric with non-GAAP operating margin in our PSU program to reflect
increased strategic focus on a profitability measure
2016 APRIL• Added proxy disclosure regarding Board and Committee self-evaluations and succession planning
MARCH• Implemented proxy access Bylaws• Increased proportion of PSUs in long-term equity compensation program for all executive officers
2015 APRIL• Significantly enhanced readability and presentation of proxy
MARCH• Introduced performance-based equity awards (“PSUs”) with revenue and operating cash flow metrics
FEBRUARY• Adopted clawback policy
2014 SEPTEMBER• Launched formal stockholder engagement program• Adopted majority voting for directors with resignation policy• Adopted stock ownership guidelines
Proxy Statement SummaryProxy Statement Summary

5Splunk 2021 Proxy Statement
PR
OX
Y
Director Nominees and Other DirectorsEnsuring the Board is composed of directors who bring diverse viewpoints and perspectives, exhibit a variety of skills, experience, and backgrounds, and effectively represent the long-term interests of stockholders is a top priority of our Board and Nominating and Corporate Governance Committee. The Board believes periodic assessment of directors is integral to an effective governance structure and aims to strike a balance between ensuring that we retain directors with deep knowledge of the Company while adding directors who bring a fresh perspective. We have added three new directors since 2019, enhancing the Board’s breadth and depth of experience and diversity, while taking into account the Company’s evolving business model, the macro technology business environment and the changing governance landscape. See below for summary information about our Board and each director nominee and continuing director as of May 1, 2021. For purposes of the information below, a director is a member of an underrepresented community under California AB 979, defined as “an individual who self-identifies as Black, African American, Hispanic, Latino, Asian, Pacific Islander, Native American, Native Hawaiian, or Alaska Native, or who self-identifies as gay, lesbian, bisexual or transgender.” See pages 14 to 18 for more information.
Current Board OverviewDirector
IndependenceTenure Age Gender Diversity Underrepresented
Community Diversity1Non-independent
90%Independent
9Independent
110-13years
46-9years 2
3-5years
30-2
years
AverageTenure
4.9 years
240-49
years old
460-69years old
450-59
years old
AverageAge
56.9 years
7Men
3Women
30%Women
20% Under-representedCommunities
2Underrepresented
Community Diversity
8Other
Committees
Class AgeDirector
SinceCurrent Term
ExpiresExpiration of Term for
Which Nominated
20
21
Dir
ecto
r N
omin
ees
Sara Baack*Chief Product Officer, Equinix
III 49 2017 2021 2024
Sean Boyle*COO and CFO, Wildlife Studios Limited
III 53 2020 2021 2024
Douglas MerrittPresident and CEO, Splunk
III 57 2015 2021 2024
Graham Smith*Chair, Splunk
III 61 2011 2021 2024
Con
tinu
ing
Dir
ecto
rs
Mark Carges*Former CTO, eBay
I 59 2014 2022 —
Elisa Steele*Independent Board Member
I 54 2017 2022 —
Sri Viswanath*CTO, Atlassian
I 45 2019 2022 —
Patricia Morrison*Former EVP, Customer Support Services, and CIO, Cardinal Health
II 61 2013 2023 —
Stephen Newberry*Former Chairman, Lam Research
II 67 2013 2023 —
General Dennis Via*EVP, Booz Allen Hamilton and Retired Four-Star U.S. Army General
II 63 2020 2023 —
* Independent director Audit Committee Compensation Committee Nominating and Corporate Governance Committee
Chair Member Audit Committee Financial Expert
For additional information, see “Corporate Governance at Splunk—Stockholder Engagement” on page 31 of this proxy statement and “Executive Compensation—Compensation Discussion and Analysis—Executive Summary—Stockholder Engagement and Our 2020 Say-on-Pay Vote” on page 42 of this proxy statement.
2021 APRIL• Enhanced proxy disclosure of Board oversight of COVID-19 response• Added underrepresented community diversity of Board to proxy
2020 NOVEMBER• Released first ESG update
MARCH• Replaced revenue metric with annual recurring revenue in both our executive bonus plan and our PSU
program to align our incentives with key drivers of stockholder value and reflect our transition to a renewable business model
• Replaced non-GAAP operating margin metric with operating cash flow in our PSU program to reflect focus on disciplined execution of our business objectives during our transition to a renewable business model
2019 APRIL• Enhanced proxy disclosures of Board succession planning, risk oversight and corporate sustainability
2018 SEPTEMBER• Updated stock ownership guidelines
APRIL• Enhanced proxy disclosures of director qualifications and skills, the role of diversity in our director
nominations process, Board refreshment and corporate sustainability
MARCH• Added stock price modifier to PSU program
2017 DECEMBER• Adopted director change in circumstances with resignation policy• Adopted qualified diverse candidate pool policy
APRIL• Added collective director qualifications table to proxy
MARCH• Replaced operating cash flow metric with non-GAAP operating margin in our PSU program to reflect
increased strategic focus on a profitability measure
2016 APRIL• Added proxy disclosure regarding Board and Committee self-evaluations and succession planning
MARCH• Implemented proxy access Bylaws• Increased proportion of PSUs in long-term equity compensation program for all executive officers
2015 APRIL• Significantly enhanced readability and presentation of proxy
MARCH• Introduced performance-based equity awards (“PSUs”) with revenue and operating cash flow metrics
FEBRUARY• Adopted clawback policy
2014 SEPTEMBER• Launched formal stockholder engagement program• Adopted majority voting for directors with resignation policy• Adopted stock ownership guidelines
Proxy Statement SummaryProxy Statement Summary

6 Splunk 2021 Proxy Statement
Our Executive Compensation PracticesOur executive compensation policies and practices are designed to reinforce our pay for performance philosophy and align with sound governance principles. Listed below are highlights of our fiscal 2021 executive compensation policies and practices:
WHAT WE DO
• Performance-based cash and equity incentives
• Caps on performance-based cash and equity incentive compensation
• Annual review and approval of our executive compensation strategy
• Significant portion of executive compensation at risk based on corporate performance
• Clawback policy on cash and equity incentive compensation
• Stock ownership guidelines for executive officers and directors
• Multi-year vesting period for equity awards
• Independent compensation consultant engaged by the Compensation Committee
• 100% independent directors on the Compensation Committee
• Limited and modest perquisites
• Formal CEO evaluation tied to compensation decisions
• Ongoing engagement with our institutional stockholders regarding our compensation policies and practices
WHAT WE DON’T DO
• No “single trigger” change in control payments and benefits
• No post-termination retirement or pension-type non-cash benefits or perquisites for our executive officers that are not generally available to our employees
• No tax gross-ups for change in control related payments
• No short sales, hedging, or pledging of stock ownership positions and transactions involving derivatives of our common stock
• No strict benchmarking of compensation to a specific percentile of our peer group
Our Fiscal 2021 Named Executive Officer PayThe charts below show the pay mix of our CEO and other named executive officers (“NEOs”) and the components of their pay for fiscal 2021, specifically the base salary and cash bonus amounts earned and the grant date fair value of equity awards granted in fiscal 2021. These charts illustrate the predominance of at-risk and performance-based components in our regular executive compensation program. We believe these elements provide a compensation package that attracts and retains qualified individuals, links individual performance to Company performance, focuses the efforts of our NEOs and other executive officers on the achievement of both our short-term and long-term objectives and aligns the interests of our executive officers with those of our stockholders.
Executive Compensation HighlightsOur executive compensation program is designed to attract, motivate and retain the key executives who drive our success. Pay that reflects performance and aligns with the interests of long-term stockholders is key to our executive compensation program design and decisions. The Compensation Committee structures our executive compensation program to include significant performance attributes that are aligned with our business strategy and long-term stockholder value creation. The fiscal 2021 executive compensation program provided short-term cash bonuses designed to drive top-line growth and long-term equity awards designed to drive annual recurring revenue, operating cash flow and future stock price performance. The following chart summarizes the evolution of our long-term equity compensation design in response to stockholder feedback and other considerations.
Long-term equity compensation evolution*
Fiscal 2013 to 2015
Fiscal 2016 Fiscal 2017** Fiscal 2018Fiscal 2019 and 2020
Fiscal 2021
RSUs = 100%
RSUs = 50%
RSUs = 40% RSUs = 40% RSUs = 40% RSUs = 40%
PSUs = 60%
Payout range: 0-200%
Performance metrics:
revenue and operating
cash flow percentage
relative to revenue
growth rate
PSUs = 60%
Payout range: 0-200%
Performance metrics:
revenue and non-GAAP
operating margin
PSUs = 60%
Corporate PSUs
payout range: 0-200%
Corporate
performance
metrics: revenue
and non-GAAP
operating margin
Stock Price PSUs
payout range:
0-50% earned
corporate PSUs
PSUs = 60%
Corporate PSUs
payout range: 0-200%
Corporate
performance metrics:
annual recurring
revenue and operating
cash flow
Stock Price PSUs
payout range:
0-50% earned
corporate PSUs
PSUs = 50%
Payout range:
0-200%
Performance metrics:
revenue and operating
cash flow percentage
relative to revenue
growth rate
* Equity weightings are at the target performance level; the actual mix of equity will vary with PSU results.
** In fiscal 2017 only, long-term equity compensation for our CEO consisted of 25% RSUs and 75% PSUs.
Proxy Statement SummaryProxy Statement Summary

7Splunk 2021 Proxy Statement
PR
OX
Y
Our Executive Compensation PracticesOur executive compensation policies and practices are designed to reinforce our pay for performance philosophy and align with sound governance principles. Listed below are highlights of our fiscal 2021 executive compensation policies and practices:
WHAT WE DO
• Performance-based cash and equity incentives
• Caps on performance-based cash and equity incentive compensation
• Annual review and approval of our executive compensation strategy
• Significant portion of executive compensation at risk based on corporate performance
• Clawback policy on cash and equity incentive compensation
• Stock ownership guidelines for executive officers and directors
• Multi-year vesting period for equity awards
• Independent compensation consultant engaged by the Compensation Committee
• 100% independent directors on the Compensation Committee
• Limited and modest perquisites
• Formal CEO evaluation tied to compensation decisions
• Ongoing engagement with our institutional stockholders regarding our compensation policies and practices
WHAT WE DON’T DO
• No “single trigger” change in control payments and benefits
• No post-termination retirement or pension-type non-cash benefits or perquisites for our executive officers that are not generally available to our employees
• No tax gross-ups for change in control related payments
• No short sales, hedging, or pledging of stock ownership positions and transactions involving derivatives of our common stock
• No strict benchmarking of compensation to a specific percentile of our peer group
Our Fiscal 2021 Named Executive Officer PayThe charts below show the pay mix of our CEO and other named executive officers (“NEOs”) and the components of their pay for fiscal 2021, specifically the base salary and cash bonus amounts earned and the grant date fair value of equity awards granted in fiscal 2021. These charts illustrate the predominance of at-risk and performance-based components in our regular executive compensation program. We believe these elements provide a compensation package that attracts and retains qualified individuals, links individual performance to Company performance, focuses the efforts of our NEOs and other executive officers on the achievement of both our short-term and long-term objectives and aligns the interests of our executive officers with those of our stockholders.
Executive Compensation HighlightsOur executive compensation program is designed to attract, motivate and retain the key executives who drive our success. Pay that reflects performance and aligns with the interests of long-term stockholders is key to our executive compensation program design and decisions. The Compensation Committee structures our executive compensation program to include significant performance attributes that are aligned with our business strategy and long-term stockholder value creation. The fiscal 2021 executive compensation program provided short-term cash bonuses designed to drive top-line growth and long-term equity awards designed to drive annual recurring revenue, operating cash flow and future stock price performance. The following chart summarizes the evolution of our long-term equity compensation design in response to stockholder feedback and other considerations.
Long-term equity compensation evolution*
Fiscal 2013 to 2015
Fiscal 2016 Fiscal 2017** Fiscal 2018Fiscal 2019 and 2020
Fiscal 2021
RSUs = 100%
RSUs = 50%
RSUs = 40% RSUs = 40% RSUs = 40% RSUs = 40%
PSUs = 60%
Payout range: 0-200%
Performance metrics:
revenue and operating
cash flow percentage
relative to revenue
growth rate
PSUs = 60%
Payout range: 0-200%
Performance metrics:
revenue and non-GAAP
operating margin
PSUs = 60%
Corporate PSUs
payout range: 0-200%
Corporate
performance
metrics: revenue
and non-GAAP
operating margin
Stock Price PSUs
payout range:
0-50% earned
corporate PSUs
PSUs = 60%
Corporate PSUs
payout range: 0-200%
Corporate
performance metrics:
annual recurring
revenue and operating
cash flow
Stock Price PSUs
payout range:
0-50% earned
corporate PSUs
PSUs = 50%
Payout range:
0-200%
Performance metrics:
revenue and operating
cash flow percentage
relative to revenue
growth rate
* Equity weightings are at the target performance level; the actual mix of equity will vary with PSU results.
** In fiscal 2017 only, long-term equity compensation for our CEO consisted of 25% RSUs and 75% PSUs.
Proxy Statement SummaryProxy Statement Summary

8 Splunk 2021 Proxy Statement
Table of ContentsProxy Statement Summary 1
Corporate Governance at Splunk 10
Proposal 1: Election of Directors 10 Non-Employee Director Compensation
Stockholder Engagement
ESG Oversight and Highlights
Other Governance Policies and Practices
27
31
32
34
Board Composition
Board’s Role and Responsibilities
Board Effectiveness
Board Meetings and Committees
10
20
23
25
Audit Committee Matters 35
Proposal 2: Ratification of Appointment of Independent Registered Public Accounting Firm 35
Fees Paid to the Independent Registered Public Accounting Firm
Audit Committee Policy on Pre-Approval of Audit and Permissible Non-Audit Services of Independent Registered Public Accounting Firm
37
37
Report of the Audit Committee 36
Our Executive Officers 38
Executive Compensation 39
Proposal 3: Advisory Vote to Approve Named Executive Officer Compensation 39
Outstanding Equity Awards at Fiscal 2021 Year-End
Option Exercises and Stock Vested in Fiscal 2021
Pension Benefits and Nonqualified Deferred Compensation
Executive Employment Arrangements
Equity Acceleration Death Benefit
Potential Payments Upon Termination or Upon Termination in Connection With a Change in Control
CEO Pay Ratio
Equity Compensation Plan Information
66
67
67
67
68
69
70
71
Compensation Discussion and Analysis
Executive Summary
Discussion of Our Fiscal 2021 Executive Compensation Program
Other Compensation Policies and Information
Compensation Committee Report
Compensation Tables
Summary Compensation Table
Grants of Plan-Based Awards for Fiscal 2021
40
40
44
60
62
63
63
65
Stock Ownership Information 72Security Ownership of Certain Beneficial Owners
and Management
72Delinquent Section 16(a) Reports 73
Other Matters 74Questions and Answers About the Proxy Materials
and Our 2021 Annual Meeting
Stockholder Proposals
74
78
Fiscal 2021 Annual Report and SEC Filings 79
CEO
All Other NEOs
4%BaseSalary
4%CashBonus
74% Performance-Based
8%Short-TermCash
92%Long-Term Equity
70%PSUs
22%RSUs
3%BaseSalary
4%CashBonus
75% Performance-Based
7%Short-TermCash
93%Long-Term Equity
71%PSUs
22%RSUs
In addition, the chart below illustrates the short-term and long-term timeframe over which the various components of the NEOs’ fiscal 2021 compensation are earned and paid and serve to continue to retain and incentivize our NEOs.
FYE January 31 2021 2022 2023 2024
BASE SALARY Paid throughout fiscal 2021
CASH BONUS Fiscal 2021 annual cash bonus (Full fiscal 2021 achievement determined and paid in April 2021)
LONG-TERM EQUITY COMPENSATION (RSUs)Fiscal 2021 awards granted in March 2020 (25% vested in March 2021, remaining 75% vest quarterly thereafter over next three years)
LONG-TERM EQUITY COMPENSATION (PSUs)Fiscal 2021 awards granted in March 2020 (25% of earned corporate PSUs vested in March 2021, remaining 75% of earned corporate PSUs vest quarterly thereafter over next three years)
(stock price PSUs eligible to be earned and to vest beginning in June 2022 on a quarterly basis through the end of the four-year vesting period of the corporate PSUs on March 2024)
Proxy Statement Summary

9Splunk 2021 Proxy Statement
PR
OX
Y
Table of ContentsProxy Statement Summary 1
Corporate Governance at Splunk 10
Proposal 1: Election of Directors 10 Non-Employee Director Compensation
Stockholder Engagement
ESG Oversight and Highlights
Other Governance Policies and Practices
27
31
32
34
Board Composition
Board’s Role and Responsibilities
Board Effectiveness
Board Meetings and Committees
10
20
23
25
Audit Committee Matters 35
Proposal 2: Ratification of Appointment of Independent Registered Public Accounting Firm 35
Fees Paid to the Independent Registered Public Accounting Firm
Audit Committee Policy on Pre-Approval of Audit and Permissible Non-Audit Services of Independent Registered Public Accounting Firm
37
37
Report of the Audit Committee 36
Our Executive Officers 38
Executive Compensation 39
Proposal 3: Advisory Vote to Approve Named Executive Officer Compensation 39
Outstanding Equity Awards at Fiscal 2021 Year-End
Option Exercises and Stock Vested in Fiscal 2021
Pension Benefits and Nonqualified Deferred Compensation
Executive Employment Arrangements
Equity Acceleration Death Benefit
Potential Payments Upon Termination or Upon Termination in Connection With a Change in Control
CEO Pay Ratio
Equity Compensation Plan Information
66
67
67
67
68
69
70
71
Compensation Discussion and Analysis
Executive Summary
Discussion of Our Fiscal 2021 Executive Compensation Program
Other Compensation Policies and Information
Compensation Committee Report
Compensation Tables
Summary Compensation Table
Grants of Plan-Based Awards for Fiscal 2021
40
40
44
60
62
63
63
65
Stock Ownership Information 72Security Ownership of Certain Beneficial Owners
and Management
72Delinquent Section 16(a) Reports 73
Other Matters 74Questions and Answers About the Proxy Materials
and Our 2021 Annual Meeting
Stockholder Proposals
74
78
Fiscal 2021 Annual Report and SEC Filings 79
CEO
All Other NEOs
4%BaseSalary
4%CashBonus
74% Performance-Based
8%Short-TermCash
92%Long-Term Equity
70%PSUs
22%RSUs
3%BaseSalary
4%CashBonus
75% Performance-Based
7%Short-TermCash
93%Long-Term Equity
71%PSUs
22%RSUs
In addition, the chart below illustrates the short-term and long-term timeframe over which the various components of the NEOs’ fiscal 2021 compensation are earned and paid and serve to continue to retain and incentivize our NEOs.
FYE January 31 2021 2022 2023 2024
BASE SALARY Paid throughout fiscal 2021
CASH BONUS Fiscal 2021 annual cash bonus (Full fiscal 2021 achievement determined and paid in April 2021)
LONG-TERM EQUITY COMPENSATION (RSUs)Fiscal 2021 awards granted in March 2020 (25% vested in March 2021, remaining 75% vest quarterly thereafter over next three years)
LONG-TERM EQUITY COMPENSATION (PSUs)Fiscal 2021 awards granted in March 2020 (25% of earned corporate PSUs vested in March 2021, remaining 75% of earned corporate PSUs vest quarterly thereafter over next three years)
(stock price PSUs eligible to be earned and to vest beginning in June 2022 on a quarterly basis through the end of the four-year vesting period of the corporate PSUs on March 2024)
Proxy Statement Summary

10 Splunk 2021 Proxy Statement
Corporate Governance at SplunkP
RO
PO
SA
L
1 Election of DirectorsThe Board recommends a vote “FOR” each of the nominees named below.
Our business affairs are managed under the direction of our Board, which is currently composed of ten members. Nine of our directors are independent within the meaning of the independent director rules of The Nasdaq Stock Market. Our Board is divided into three classes of directors. At each annual meeting of stockholders, a class of directors will be elected for a three-year term to succeed the same class whose term is then expiring. Each director’s term continues until the expiration of the term for which he or she is elected and until the election and qualification of his or her successor, or his or her earlier death, resignation, or removal.
Any increase or decrease in the number of directors will be distributed among the three classes so that, as nearly as possible, each class will consist of one-third of the total number of directors. John Connors informed the Company on January 6, 2021 that he was resigning as a member of the Board, effective as of May 1, 2021. Promptly following his resignation, the size of our Board will be decreased from 11 to 10.
In an uncontested election, directors are elected by a majority vote. This means that in order for a nominee to be elected in an uncontested election, the number of votes cast “For” such nominee’s election must exceed the number of votes cast “Against” that nominee’s election. Broker non-votes and abstentions will have no effect on the outcome of such election. In addition to the majority vote standard for director elections, we have a director resignation policy described in “Other Matters-Questions and Answers About the Proxy Materials and Our 2021 Annual Meeting” on page 74.
In light of the individual qualifications and experiences of each of our director nominees, and the contributions that our nominees have made to our Board, our Board has recommended that each of our director nominees be elected by our stockholders. Biographies of all our directors are set forth below under “Nominees for Director” and “Continuing Directors.”
Board Composition
Considerations in Evaluating Director NomineesOur Board follows an annual director nomination process that promotes thoughtful and in-depth review of overall Board composition and director nominees throughout the year. At the beginning of the process, the Nominating and Corporate Governance Committee reviews current Board composition and any specific characteristics desired for future director candidates. In its review of incumbent director candidates, the Nominating and Corporate Governance Committee evaluates any changes in circumstances that may impact their candidacy and considers information from the Board evaluation process. Upon a recommendation from the Nominating and Corporate Governance Committee, the Board considers and approves the nomination of director candidates for election at the annual meeting of the stockholders. See “Board Refreshment and Succession Planning” below for a discussion of the characteristics identified in the most recent director searches that culminated in the appointment of Mr. Boyle and General Via (ret) to our Board during fiscal 2021.
In evaluating director candidates and considering incumbent directors for nomination to the Board, the Nominating and Corporate Governance Committee expects certain minimum qualifications and takes into consideration key factors, experiences, qualifications and skills that are relevant to the Board’s work and the Company’s strategy and strengthen the current Board’s mix of skills.
The Nominating and Corporate Governance Committee requires the following minimum qualifications to be satisfied by any nominee for a position on the Board:
Highest personal and professional ethics & integrity
Complementary skills to those of existing Board
Understanding of fiduciary duties
Sound business judgment
Ability to assist management and significantly contribute to our success
Commitment of time and energy
Proven achievement in nominee’s field
Key factors the Nominating and Corporate Governance Committee considers when selecting directors and refreshing the Board (in addition to the current size and composition of the Board and the needs of the Board and its committees) include:
Age and Tenure – While the Board does not have term limits, the Board seeks to establish appropriate levels of director turnover. New perspectives and new ideas are critical to an engaged forward-looking and strategic Board, as are the benefits of the valuable experience and familiarity that longer-serving directors bring.
Diversity – Our Corporate Governance Guidelines reflect our commitment to Board diversity, by explicitly stating the Board’s commitment to include qualified diverse candidates (including gender, race and ethnicity) in the pool from which nominees are considered. We believe that the judgment and perspective offered by a diverse board of directors improves the quality of decision making and enhances the Company’s business performance. We also believe such diversity can help the Board respond more effectively to the varying needs of our customers, stockholders, workforce and other stakeholders.
Experience – The Nominating and Corporate Governance Committee strives for a Board that spans a range of expertise and perspective in areas relevant to the Company’s business, strategic vision, governance and operating and innovation environment.
Full-time employment/Directorships – The Nominating and Corporate Governance Committee takes into consideration employment status and whether the director holds a current operating role or is retired, and the number of other public company boards on which the director serves to evaluate whether the nominee can commit the time and energy necessary to diligently carry out his or her fiduciary responsibilities and meaningfully contribute to the Company.
Independence – Having an independent Board is a core element of our governance philosophy. Our Corporate Governance Guidelines provide that a majority of our directors will be independent as defined under The Nasdaq Stock Market rules.
The Nominating and Corporate Governance Committee also considers and evaluates other factors it deems to be in our and our stockholders’ best interests. The Nominating and Corporate Governance Committee does not pre-assign any weighting or priority to any of these factors.
The Nominating and Corporate Governance Committee reviews with the Board on an annual or more frequent basis the director skills and experience qualifications that it believes are desirable to be represented on the Board. The Board and the Nominating and Corporate Governance Committee believe that the collective experiences and qualifications of the directors allow the Board to best fulfill its responsibilities to the long-term interest of our stockholders.
Corporate Governance at Splunk

PR
OX
Y
11Splunk 2021 Proxy Statement
Corporate Governance at Splunk
PR
OP
OS
AL
1 Election of DirectorsThe Board recommends a vote “FOR” each of the nominees named below.
Our business affairs are managed under the direction of our Board, which is currently composed of ten members. Nine of our directors are independent within the meaning of the independent director rules of The Nasdaq Stock Market. Our Board is divided into three classes of directors. At each annual meeting of stockholders, a class of directors will be elected for a three-year term to succeed the same class whose term is then expiring. Each director’s term continues until the expiration of the term for which he or she is elected and until the election and qualification of his or her successor, or his or her earlier death, resignation, or removal.
Any increase or decrease in the number of directors will be distributed among the three classes so that, as nearly as possible, each class will consist of one-third of the total number of directors. John Connors informed the Company on January 6, 2021 that he was resigning as a member of the Board, effective as of May 1, 2021. Promptly following his resignation, the size of our Board will be decreased from 11 to 10.
In an uncontested election, directors are elected by a majority vote. This means that in order for a nominee to be elected in an uncontested election, the number of votes cast “For” such nominee’s election must exceed the number of votes cast “Against” that nominee’s election. Broker non-votes and abstentions will have no effect on the outcome of such election. In addition to the majority vote standard for director elections, we have a director resignation policy described in “Other Matters-Questions and Answers About the Proxy Materials and Our 2021 Annual Meeting” on page 74.
In light of the individual qualifications and experiences of each of our director nominees, and the contributions that our nominees have made to our Board, our Board has recommended that each of our director nominees be elected by our stockholders. Biographies of all our directors are set forth below under “Nominees for Director” and “Continuing Directors.”
Board Composition
Considerations in Evaluating Director NomineesOur Board follows an annual director nomination process that promotes thoughtful and in-depth review of overall Board composition and director nominees throughout the year. At the beginning of the process, the Nominating and Corporate Governance Committee reviews current Board composition and any specific characteristics desired for future director candidates. In its review of incumbent director candidates, the Nominating and Corporate Governance Committee evaluates any changes in circumstances that may impact their candidacy and considers information from the Board evaluation process. Upon a recommendation from the Nominating and Corporate Governance Committee, the Board considers and approves the nomination of director candidates for election at the annual meeting of the stockholders. See “Board Refreshment and Succession Planning” below for a discussion of the characteristics identified in the most recent director searches that culminated in the appointment of Mr. Boyle and General Via (ret) to our Board during fiscal 2021.
In evaluating director candidates and considering incumbent directors for nomination to the Board, the Nominating and Corporate Governance Committee expects certain minimum qualifications and takes into consideration key factors, experiences, qualifications and skills that are relevant to the Board’s work and the Company’s strategy and strengthen the current Board’s mix of skills.
The Nominating and Corporate Governance Committee requires the following minimum qualifications to be satisfied by any nominee for a position on the Board:
Highest personal and professional ethics & integrity
Complementary skills to those of existing Board
Understanding of fiduciary duties
Sound business judgment
Ability to assist management and significantly contribute to our success
Commitment of time and energy
Proven achievement in nominee’s field
Key factors the Nominating and Corporate Governance Committee considers when selecting directors and refreshing the Board (in addition to the current size and composition of the Board and the needs of the Board and its committees) include:
Age and Tenure – While the Board does not have term limits, the Board seeks to establish appropriate levels of director turnover. New perspectives and new ideas are critical to an engaged forward-looking and strategic Board, as are the benefits of the valuable experience and familiarity that longer-serving directors bring.
Diversity – Our Corporate Governance Guidelines reflect our commitment to Board diversity, by explicitly stating the Board’s commitment to include qualified diverse candidates (including gender, race and ethnicity) in the pool from which nominees are considered. We believe that the judgment and perspective offered by a diverse board of directors improves the quality of decision making and enhances the Company’s business performance. We also believe such diversity can help the Board respond more effectively to the varying needs of our customers, stockholders, workforce and other stakeholders.
Experience – The Nominating and Corporate Governance Committee strives for a Board that spans a range of expertise and perspective in areas relevant to the Company’s business, strategic vision, governance and operating and innovation environment.
Full-time employment/Directorships – The Nominating and Corporate Governance Committee takes into consideration employment status and whether the director holds a current operating role or is retired, and the number of other public company boards on which the director serves to evaluate whether the nominee can commit the time and energy necessary to diligently carry out his or her fiduciary responsibilities and meaningfully contribute to the Company.
Independence – Having an independent Board is a core element of our governance philosophy. Our Corporate Governance Guidelines provide that a majority of our directors will be independent as defined under The Nasdaq Stock Market rules.
The Nominating and Corporate Governance Committee also considers and evaluates other factors it deems to be in our and our stockholders’ best interests. The Nominating and Corporate Governance Committee does not pre-assign any weighting or priority to any of these factors.
The Nominating and Corporate Governance Committee reviews with the Board on an annual or more frequent basis the director skills and experience qualifications that it believes are desirable to be represented on the Board. The Board and the Nominating and Corporate Governance Committee believe that the collective experiences and qualifications of the directors allow the Board to best fulfill its responsibilities to the long-term interest of our stockholders.
Corporate Governance at Splunk

12 Splunk 2021 Proxy Statement
Below is a summary of the primary experience, qualifications and skills that our director nominees and continuing directors bring to the Board:
Capability DescriptionNumber of directorswith the capability
Technology infrastructure
Deep insight in technology infrastructure, business prioritization, customer drivers and cybersecurity risk
Scaling a SaaS business
Experience growing successful SaaS companies, reaching scale and maturity
InvestmentExperience creating long term value through investment, acquisitions, and growth strategies
CEO experienceExpertise shaping strategy, performance, prioritization, and scale leadership
Modern cloud technologist
Deep knowledge in technology architecture, including SaaS, cloud-based platforms, integrated solutions and customers’ data journey
SalesExperience building global sales capability for cloud services and enterprise software
MarketingMarketing and brand-building capability in rapidly changing industries, including new markets and opportunities for innovation and disruption
Key customer segment insight
Depth of insight into current and potential target markets and geographies
FinanceFinancial expert with expertise in financial strategy, accounting, reporting
People and compensation
Expertise in aligning company culture, performance, reward and talent with strategy as well as remote and flexible work strategies
Governance, risk and compliance
Experience in public company corporate governance, privacy, compliance, policy, activism and creating long term sustainable value
Strong capability Moderate capability
Board Refreshment and Succession PlanningThe Nominating and Corporate Governance Committee, together with our Board, practices a long-term approach to Board refreshment. With the assistance of an independent search firm, the Nominating and Corporate Governance Committee focuses on identifying, considering and evaluating potential Board candidates with the goal of evolving the composition of our Board in line with the strategic needs of the Company. As the Company innovates, implements new technologies and enters new markets, its business model may require directors with new or different skill sets. Our succession planning process takes the Company’s evolution into account to ensure the Board remains a strategic asset capable of addressing the risks, trends, and opportunities that the Company will face in the future.
The following describes the Company’s selection process for new directors:
Source Candidate Pool from
• Independent Search Firm
• Stockholders
• Independent Directors
• Our Management Team
In-Depth Review and Oversight
by the Nominating and Corporate Governance Committee
• Consider skills mix and needs
• Consider diversity screen qualifications
• Review independence and potential conflicts
Meeting with Candidate
• Chair
• CEO
• CFO
• CLO
• Chair of each committee
• Opportunity for all other directors to meet
Recommend Selected Candidate for Appointment to our Board
Review and Appointment by full Board
Select Director 3 new directors since 2019
This past year, as part of the Board succession planning and refreshment process, and in line with its multi-year view of potential director departures and leadership changes, the Nominating and Corporate Governance Committee, together with the Board, discussed the Board’s future composition needs. This discussion included the desired skills and attributes of successors for long-tenured directors, including Mr. Connors, who resigned from the Board this year, as well as successors for our Chair and committee chairs. It also took into account the current and long-term needs of our business and the skills composition of our Board and our committees. Through this process we identified finance and accounting expertise in the technology industry and public sector, leadership and policy experience as important priorities for overall Board composition. The Nominating and Corporate Governance Committee worked with a third-party search firm to identify candidates with these skills and attributes. A year-long, robust and deliberate search process culminated in August 2020 with the appointment of Sean Boyle, former Vice President and Chief Financial Officer of Amazon Web Services, Inc. and current Chief Operating Officer and Chief Financial Officer of Wildlife Studios Limited, and in November 2020 with the appointment of Dennis Via, retired four-star U.S. Army general and current Executive Vice President of Booz Allen Hamilton, to our Board.
Mr. Connors resigned from the Board effective May 1, 2021. In addition, the Board appointed Mr. Boyle as a member and chair of the Audit Committee, replacing Mr. Connors, and General Via (ret) as a member of the Nominating and Corporate Governance Committee.
Corporate Governance at SplunkCorporate Governance at Splunk

PR
OX
Y
13Splunk 2021 Proxy Statement
Below is a summary of the primary experience, qualifications and skills that our director nominees and continuing directors bring to the Board:
Capability DescriptionNumber of directorswith the capability
Technology infrastructure
Deep insight in technology infrastructure, business prioritization, customer drivers and cybersecurity risk
Scaling a SaaS business
Experience growing successful SaaS companies, reaching scale and maturity
InvestmentExperience creating long term value through investment, acquisitions, and growth strategies
CEO experienceExpertise shaping strategy, performance, prioritization, and scale leadership
Modern cloud technologist
Deep knowledge in technology architecture, including SaaS, cloud-based platforms, integrated solutions and customers’ data journey
SalesExperience building global sales capability for cloud services and enterprise software
MarketingMarketing and brand-building capability in rapidly changing industries, including new markets and opportunities for innovation and disruption
Key customer segment insight
Depth of insight into current and potential target markets and geographies
FinanceFinancial expert with expertise in financial strategy, accounting, reporting
People and compensation
Expertise in aligning company culture, performance, reward and talent with strategy as well as remote and flexible work strategies
Governance, risk and compliance
Experience in public company corporate governance, privacy, compliance, policy, activism and creating long term sustainable value
Strong capability Moderate capability
Board Refreshment and Succession PlanningThe Nominating and Corporate Governance Committee, together with our Board, practices a long-term approach to Board refreshment. With the assistance of an independent search firm, the Nominating and Corporate Governance Committee focuses on identifying, considering and evaluating potential Board candidates with the goal of evolving the composition of our Board in line with the strategic needs of the Company. As the Company innovates, implements new technologies and enters new markets, its business model may require directors with new or different skill sets. Our succession planning process takes the Company’s evolution into account to ensure the Board remains a strategic asset capable of addressing the risks, trends, and opportunities that the Company will face in the future.
The following describes the Company’s selection process for new directors:
Source Candidate Pool from
• Independent Search Firm
• Stockholders
• Independent Directors
• Our Management Team
In-Depth Review and Oversight
by the Nominating and Corporate Governance Committee
• Consider skills mix and needs
• Consider diversity screen qualifications
• Review independence and potential conflicts
Meeting with Candidate
• Chair
• CEO
• CFO
• CLO
• Chair of each committee
• Opportunity for all other directors to meet
Recommend Selected Candidate for Appointment to our Board
Review and Appointment by full Board
Select Director 3 new directors since 2019
This past year, as part of the Board succession planning and refreshment process, and in line with its multi-year view of potential director departures and leadership changes, the Nominating and Corporate Governance Committee, together with the Board, discussed the Board’s future composition needs. This discussion included the desired skills and attributes of successors for long-tenured directors, including Mr. Connors, who resigned from the Board this year, as well as successors for our Chair and committee chairs. It also took into account the current and long-term needs of our business and the skills composition of our Board and our committees. Through this process we identified finance and accounting expertise in the technology industry and public sector, leadership and policy experience as important priorities for overall Board composition. The Nominating and Corporate Governance Committee worked with a third-party search firm to identify candidates with these skills and attributes. A year-long, robust and deliberate search process culminated in August 2020 with the appointment of Sean Boyle, former Vice President and Chief Financial Officer of Amazon Web Services, Inc. and current Chief Operating Officer and Chief Financial Officer of Wildlife Studios Limited, and in November 2020 with the appointment of Dennis Via, retired four-star U.S. Army general and current Executive Vice President of Booz Allen Hamilton, to our Board.
Mr. Connors resigned from the Board effective May 1, 2021. In addition, the Board appointed Mr. Boyle as a member and chair of the Audit Committee, replacing Mr. Connors, and General Via (ret) as a member of the Nominating and Corporate Governance Committee.
Corporate Governance at SplunkCorporate Governance at Splunk

14 Splunk 2021 Proxy Statement
Nominees for DirectorSara Baack Ms. Baack possesses specific attributes that qualify
her to serve as a director, including her knowledge and experience in the information technology services industry and professional experience serving in leadership positions at other public companies.
Sara Baack has served as a member of our Board since 2017. Since April 2019, Ms. Baack has served as Chief Product Officer of Equinix, Inc., a global interconnection and data center company. Previously, she was Equinix’s Chief Marketing Officer from 2012 to April 2019. Prior to joining Equinix, she served in various executive positions at Level 3 Communications Inc., a provider of integrated communications services, most recently as Senior Vice President, Voice Services from 2007 to 2012 and in other leadership positions in the company from 2000 to 2007. Prior to Level 3, she worked in financial services investing private equity for PaineWebber Capital (since acquired by UBS Group AG). Ms. Baack has served as a member of the board of directors of Crucible Acquisitions Corporation, a special purchase acquisition company, since 2021. Ms. Baack holds a B.A. from Rice University and an M.B.A. from Harvard Business School.
Ms. Baack brings the following primary experiences, qualifications and skills to the Board:
Technology infrastructure
Scaling a SaaS business
Investment
Modern cloud technologist
Sales Marketing
Key customer segment insight
Finance People and compensation
Governance, risk and
compliance
Independent
Chief Product Officer of Equinix
Age 49
Director Since 2017
Splunk Committee(s): Nominating and Corporate Governance Committee
Sean Boyle Mr. Boyle possesses specific attributes that qualify him to serve as a director, including his financial expertise and professional experience serving in leadership positions at other public companies.
Sean Boyle has served as a member of our Board since 2020. Since December 2020, Mr. Boyle has served as Chief Operating Officer and Chief Financial Officer of Wildlife Studios Limited, a mobile gaming company. Previously, he served in various roles at Amazon and Amazon Web Services, Inc., a cloud computing and infrastructure company, from 2006 to 2020, including most recently as Vice President in 2020, Vice President and Chief Financial Officer from 2015 to 2020 and before that in various finance leadership roles. Mr. Boyle holds a B.Com. (Hons) and an M.B.A. from the University of Windsor.
Mr. Boyle brings the following primary experiences, qualifications and skills to the Board:
Technology infrastructure
Scaling a SaaS business
Investment
Modern cloud technologist
Key customer segment insight
Finance
People and compensation
Independent
Chief Operating Officer and Chief Financial Officer of Wildlife Studios Limited
Age 53
Director Since 2020
Splunk Committee(s): Audit Committee
Corporate Governance at Splunk
Douglas Merritt Mr. Merritt possesses specific attributes that qualify him to serve as a director, including the knowledge and perspective he brings through his experience as our CEO and our former Senior Vice President of Field Operations, and his experience as a public company executive and as a member of the board of directors of private companies in the enterprise software industry.
Douglas Merritt has served as our President, CEO and a member of our Board since 2015. Mr. Merritt served as our Senior Vice President of Field Operations from 2014 to 2015. Prior to joining us, he served as Senior Vice President of Products and Solutions Marketing at Cisco Systems, Inc., a networking company, from 2012 to 2014. From 2011 to 2012, he served as Chief Executive Officer of Baynote, Inc., a behavioral personalization and marketing technology company. Previously, Mr. Merritt served in a number of executive roles and as a member of the extended Executive Board at SAP A.G., an enterprise software company, from 2005 to 2011. From 2001 to 2004, Mr. Merritt served as Group Vice President and General Manager of the Human Capital Management Product Division at PeopleSoft Inc., a software company (acquired by Oracle Corporation). He also co-founded and served as Chief Executive Officer of Icarian, Inc., a cloud-based company (since acquired by Workstream Corp.), from 1996 to 2001. Mr. Merritt has served as a member of the board of directors of Dragoneer Growth Opportunities Corp., a special purchase acquisition company, since 2020. Mr. Merritt holds a B.S. from The University of the Pacific in Stockton, California.
Mr. Merritt brings the following primary experiences, qualifications and skills to the Board:
Technology infrastructure
Scaling a SaaS business
Investment
CEO experience
Modern cloud technologist
Sales
Marketing Key customer segment insight
Finance
People and compensation
Governance, risk and
compliance
President and CEO of Splunk
Age 57
Director Since 2015
Splunk Committee(s): None
Graham Smith Mr. Smith possesses specific attributes that qualify him to serve as a director, including his financial expertise and professional experience as an executive and as a member of the board of directors of other public software companies.
Graham Smith has served as a member of our Board since 2011 and Chair since 2019. Mr. Smith served in various leadership positions at salesforce.com, inc., a provider of enterprise cloud computing software, from 2007 to 2015, including as Chief Financial Officer and most recently as Executive Vice President. Prior to joining salesforce, Mr. Smith served as Chief Financial Officer at Advent Software Inc., a portfolio accounting software company, from 2003 to 2007. Mr. Smith has served as a member of the board of directors of BlackLine, Inc., a provider of cloud-based solutions for finance and accounting since 2015, and Slack Technologies, Inc., a provider of cloud-based professional collaboration tools, since 2018. Mr. Smith previously served on the board of directors of Citrix Systems, Inc., an enterprise software company, from 2015 to 2018, MINDBODY, Inc., a cloud-based wellness services marketplace (acquired by Vista Equity Partners), from 2015 to 2019, and Xero Limited, an online accounting software company, from 2015 to 2020. Mr. Smith holds a B.Sc. from Bristol University in England and qualified as a chartered accountant in England and Wales.
Mr. Smith brings the following primary experiences, qualifications and skills to the Board:
Scaling a SaaS business
Investment Modern cloud technologist
Key customer segment insight
Finance People and compensation
Governance, risk and
compliance
Independent
Chair of Splunk
Age 61
Director Since 2011
Splunk Committee(s): Audit Committee
Corporate Governance at SplunkCorporate Governance at Splunk

PR
OX
Y
15Splunk 2021 Proxy Statement
Nominees for DirectorSara Baack Ms. Baack possesses specific attributes that qualify
her to serve as a director, including her knowledge and experience in the information technology services industry and professional experience serving in leadership positions at other public companies.
Sara Baack has served as a member of our Board since 2017. Since April 2019, Ms. Baack has served as Chief Product Officer of Equinix, Inc., a global interconnection and data center company. Previously, she was Equinix’s Chief Marketing Officer from 2012 to April 2019. Prior to joining Equinix, she served in various executive positions at Level 3 Communications Inc., a provider of integrated communications services, most recently as Senior Vice President, Voice Services from 2007 to 2012 and in other leadership positions in the company from 2000 to 2007. Prior to Level 3, she worked in financial services investing private equity for PaineWebber Capital (since acquired by UBS Group AG). Ms. Baack has served as a member of the board of directors of Crucible Acquisitions Corporation, a special purchase acquisition company, since 2021. Ms. Baack holds a B.A. from Rice University and an M.B.A. from Harvard Business School.
Ms. Baack brings the following primary experiences, qualifications and skills to the Board:
Technology infrastructure
Scaling a SaaS business
Investment
Modern cloud technologist
Sales Marketing
Key customer segment insight
Finance People and compensation
Governance, risk and
compliance
Independent
Chief Product Officer of Equinix
Age 49
Director Since 2017
Splunk Committee(s): Nominating and Corporate Governance Committee
Sean Boyle Mr. Boyle possesses specific attributes that qualify him to serve as a director, including his financial expertise and professional experience serving in leadership positions at other public companies.
Sean Boyle has served as a member of our Board since 2020. Since December 2020, Mr. Boyle has served as Chief Operating Officer and Chief Financial Officer of Wildlife Studios Limited, a mobile gaming company. Previously, he served in various roles at Amazon and Amazon Web Services, Inc., a cloud computing and infrastructure company, from 2006 to 2020, including most recently as Vice President in 2020, Vice President and Chief Financial Officer from 2015 to 2020 and before that in various finance leadership roles. Mr. Boyle holds a B.Com. (Hons) and an M.B.A. from the University of Windsor.
Mr. Boyle brings the following primary experiences, qualifications and skills to the Board:
Technology infrastructure
Scaling a SaaS business
Investment
Modern cloud technologist
Key customer segment insight
Finance
People and compensation
Independent
Chief Operating Officer and Chief Financial Officer of Wildlife Studios Limited
Age 53
Director Since 2020
Splunk Committee(s): Audit Committee
Corporate Governance at Splunk
Douglas Merritt Mr. Merritt possesses specific attributes that qualify him to serve as a director, including the knowledge and perspective he brings through his experience as our CEO and our former Senior Vice President of Field Operations, and his experience as a public company executive and as a member of the board of directors of private companies in the enterprise software industry.
Douglas Merritt has served as our President, CEO and a member of our Board since 2015. Mr. Merritt served as our Senior Vice President of Field Operations from 2014 to 2015. Prior to joining us, he served as Senior Vice President of Products and Solutions Marketing at Cisco Systems, Inc., a networking company, from 2012 to 2014. From 2011 to 2012, he served as Chief Executive Officer of Baynote, Inc., a behavioral personalization and marketing technology company. Previously, Mr. Merritt served in a number of executive roles and as a member of the extended Executive Board at SAP A.G., an enterprise software company, from 2005 to 2011. From 2001 to 2004, Mr. Merritt served as Group Vice President and General Manager of the Human Capital Management Product Division at PeopleSoft Inc., a software company (acquired by Oracle Corporation). He also co-founded and served as Chief Executive Officer of Icarian, Inc., a cloud-based company (since acquired by Workstream Corp.), from 1996 to 2001. Mr. Merritt has served as a member of the board of directors of Dragoneer Growth Opportunities Corp., a special purchase acquisition company, since 2020. Mr. Merritt holds a B.S. from The University of the Pacific in Stockton, California.
Mr. Merritt brings the following primary experiences, qualifications and skills to the Board:
Technology infrastructure
Scaling a SaaS business
Investment
CEO experience
Modern cloud technologist
Sales
Marketing Key customer segment insight
Finance
People and compensation
Governance, risk and
compliance
President and CEO of Splunk
Age 57
Director Since 2015
Splunk Committee(s): None
Graham Smith Mr. Smith possesses specific attributes that qualify him to serve as a director, including his financial expertise and professional experience as an executive and as a member of the board of directors of other public software companies.
Graham Smith has served as a member of our Board since 2011 and Chair since 2019. Mr. Smith served in various leadership positions at salesforce.com, inc., a provider of enterprise cloud computing software, from 2007 to 2015, including as Chief Financial Officer and most recently as Executive Vice President. Prior to joining salesforce, Mr. Smith served as Chief Financial Officer at Advent Software Inc., a portfolio accounting software company, from 2003 to 2007. Mr. Smith has served as a member of the board of directors of BlackLine, Inc., a provider of cloud-based solutions for finance and accounting since 2015, and Slack Technologies, Inc., a provider of cloud-based professional collaboration tools, since 2018. Mr. Smith previously served on the board of directors of Citrix Systems, Inc., an enterprise software company, from 2015 to 2018, MINDBODY, Inc., a cloud-based wellness services marketplace (acquired by Vista Equity Partners), from 2015 to 2019, and Xero Limited, an online accounting software company, from 2015 to 2020. Mr. Smith holds a B.Sc. from Bristol University in England and qualified as a chartered accountant in England and Wales.
Mr. Smith brings the following primary experiences, qualifications and skills to the Board:
Scaling a SaaS business
Investment Modern cloud technologist
Key customer segment insight
Finance People and compensation
Governance, risk and
compliance
Independent
Chair of Splunk
Age 61
Director Since 2011
Splunk Committee(s): Audit Committee
Corporate Governance at SplunkCorporate Governance at Splunk

16 Splunk 2021 Proxy Statement
Continuing DirectorsMark Carges Mr. Carges possesses specific attributes that qualify
him to serve as a director, including his knowledge and experience in the software industry and professional experience serving in leadership positions at various technology companies.
Mark Carges has served as a member of our Board since 2014. Mr. Carges previously served as the Chief Technology Officer of eBay Inc., an e-commerce company, from September 2009 to September 2014. From September 2009 to November 2013, he also served as eBay’s Senior Vice President, Global Products, Marketplaces. From September 2008 to September 2009, he served as eBay’s Senior Vice President, Technology. From November 2005 to May 2008, Mr. Carges served as Executive Vice President, Products and General Manager of the Business Interaction Division of BEA Systems, Inc., a software company (acquired by Oracle Corporation). Mr. Carges has served as a member of the board of directors of Veeva Systems Inc., a provider of industry cloud solutions for the global life sciences industry, since 2017. Mr. Carges holds a B.A. from the University of California, Berkeley and an M.S. from New York University.
Mr. Carges brings the following primary experiences, qualifications and skills to the Board:
Technology infrastructure
Scaling a SaaS business
Modern cloud technologist
Key customer segment insight
People and compensation
Governance, risk and
compliance
Independent
Former CTO of eBay
Age 59
Director Since 2014
Splunk Committee(s): Compensation Committee
Elisa Steele Ms. Steele possesses specific attributes that qualify her to serve as a director, including her knowledge and experience in the software industry and professional experience as a former executive of various technology companies.
Elisa Steele has served as a member of our Board since 2017. Ms. Steele previously served as Chief Executive Officer of Namely, Inc., a financial and human capital management software company, from 2018 to 2019. Prior to joining Namely, Ms. Steele served as Chief Executive Officer and President of Jive Software, Inc., a collaboration software company (acquired by Aurea Software, Inc.), from 2015 to 2017, and was a member of the executive leadership team since 2014. Prior to joining Jive Software, Ms. Steele served as Chief Marketing Officer and Corporate Vice President, Consumer Apps & Services at Microsoft Corporation, a worldwide provider of software, services and solutions, and Chief Marketing Officer of Skype, an Internet communications company, from 2012 to 2014. Ms. Steele also has held executive leadership positions at Yahoo! Inc. and NetApp, Inc. Ms. Steele has served as a member of the board of directors of Cornerstone OnDemand, Inc., a learning and human capital management software company, since 2018, JFrog Ltd., an enterprise software company, since 2020, and Bumble Inc., an online dating and social networking platform, since 2020. Ms. Steele holds a B.S. from the University of New Hampshire and an M.B.A. from San Francisco State University.
Ms. Steele brings the following primary experiences, qualifications and skills to the Board:
Scaling a SaaS business
CEO experience
Modern cloud technologist
Sales Marketing Key customer segment insight
People and compensation
Governance, risk and
compliance
Independent
Independent Board Member
Age 54
Director Since 2017
Splunk Committee(s): Compensation Committee
Sri Viswanath Mr. Viswanath possesses specific attributes that qualify him to serve as a director, including his product and engineering expertise, his knowledge and experience in the software industry and professional experience serving in leadership positions at other public companies.
Sri Viswanath has served as a member of our Board since 2019. Since 2016, Mr. Viswanath has served as Chief Technology Officer at Atlassian Corporation Plc, a provider of team collaboration and productivity software. Prior to joining Atlassian, Mr. Viswanath served as Senior Vice President of Engineering and Operations from April 2013 to October 2014 and Chief Technology Officer from October 2014 to January 2016 at Groupon, Inc., an e-commerce company. From 2012 to 2013, he served as Vice President of Research and Development for mobile computing at VMware, Inc., a provider of cloud and virtualization software and services. His previous experience also includes senior-level product positions at Glam Media, Inc. and Ning Inc. (acquired by Glam Media). He began his career in engineering roles at Sun Microsystems, Inc. Mr. Viswanath previously served on the board of directors of SendGrid, Inc., a provider of a cloud-based customer communication platform (acquired by Twilio Inc.), from 2017 to 2019. Mr. Viswanath holds a B.E. from Bangalore University, and a M.S. from each of Clemson University and Stanford University.
Mr. Viswanath brings the following primary experiences, qualifications and skills to the Board:
Technology infrastructure
Scaling a SaaS business
Modern cloud technologist
Marketing Key customer segment insight
People and compensation
Independent
CTO of Atlassian
Age 45
Director Since 2019
Splunk Committee(s): Nominating and Corporate Governance Committee
Patricia Morrison
Ms. Morrison possesses specific attributes that qualify her to serve as a director, including her information technology expertise and professional experience as an executive and as a member of the board of directors of other public companies.
Patricia Morrison has served as a member of our Board since 2013. Ms. Morrison was Executive Vice President, Customer Support Services and Chief Information Officer at Cardinal Health, Inc., a provider of healthcare services, from 2009 to 2018. Prior to joining Cardinal Health, Ms. Morrison was Chief Executive Officer of Mainstay Partners, a technology advisory firm, from 2008 to 2009, and Executive Vice President and Chief Information Officer at Motorola, Inc., a designer, manufacturer, marketer and seller of mobility products, from 2005 to 2008. Her previous experience also includes Chief Information Officer of Office Depot, Inc. and senior-level information technology positions at PepsiCo, Inc., The Quaker Oats Company, General Electric Company and The Procter & Gamble Company. Ms. Morrison has served as a member of the board of directors of Baxter International Inc., a global medical products company, since 2019. Ms. Morrison previously served as a member of the board of directors of Aramark, a global provider of food, facilities and uniform services, from 2017 to 2019, and Virtusa Corporation, a global provider of digital strategy, digital engineering, and IT services and solutions, from 2020 to 2021. Ms. Morrison holds a B.A. and B.S. from Miami University in Oxford, Ohio.
Ms. Morrison brings the following primary experiences, qualifications and skills to the Board:
Technology infrastructure
Modern cloud technologist
Key customer segment insight
People and compensation
Governance, risk and
compliance
Independent
Former EVP, Customer Support Services, and CIO of Cardinal Health
Age 61
Director Since 2013
Splunk Committee(s): Audit Committee; Nominating and Corporate Governance Committee
Corporate Governance at SplunkCorporate Governance at Splunk

PR
OX
Y
17Splunk 2021 Proxy Statement
Continuing DirectorsMark Carges Mr. Carges possesses specific attributes that qualify
him to serve as a director, including his knowledge and experience in the software industry and professional experience serving in leadership positions at various technology companies.
Mark Carges has served as a member of our Board since 2014. Mr. Carges previously served as the Chief Technology Officer of eBay Inc., an e-commerce company, from September 2009 to September 2014. From September 2009 to November 2013, he also served as eBay’s Senior Vice President, Global Products, Marketplaces. From September 2008 to September 2009, he served as eBay’s Senior Vice President, Technology. From November 2005 to May 2008, Mr. Carges served as Executive Vice President, Products and General Manager of the Business Interaction Division of BEA Systems, Inc., a software company (acquired by Oracle Corporation). Mr. Carges has served as a member of the board of directors of Veeva Systems Inc., a provider of industry cloud solutions for the global life sciences industry, since 2017. Mr. Carges holds a B.A. from the University of California, Berkeley and an M.S. from New York University.
Mr. Carges brings the following primary experiences, qualifications and skills to the Board:
Technology infrastructure
Scaling a SaaS business
Modern cloud technologist
Key customer segment insight
People and compensation
Governance, risk and
compliance
Independent
Former CTO of eBay
Age 59
Director Since 2014
Splunk Committee(s): Compensation Committee
Elisa Steele Ms. Steele possesses specific attributes that qualify her to serve as a director, including her knowledge and experience in the software industry and professional experience as a former executive of various technology companies.
Elisa Steele has served as a member of our Board since 2017. Ms. Steele previously served as Chief Executive Officer of Namely, Inc., a financial and human capital management software company, from 2018 to 2019. Prior to joining Namely, Ms. Steele served as Chief Executive Officer and President of Jive Software, Inc., a collaboration software company (acquired by Aurea Software, Inc.), from 2015 to 2017, and was a member of the executive leadership team since 2014. Prior to joining Jive Software, Ms. Steele served as Chief Marketing Officer and Corporate Vice President, Consumer Apps & Services at Microsoft Corporation, a worldwide provider of software, services and solutions, and Chief Marketing Officer of Skype, an Internet communications company, from 2012 to 2014. Ms. Steele also has held executive leadership positions at Yahoo! Inc. and NetApp, Inc. Ms. Steele has served as a member of the board of directors of Cornerstone OnDemand, Inc., a learning and human capital management software company, since 2018, JFrog Ltd., an enterprise software company, since 2020, and Bumble Inc., an online dating and social networking platform, since 2020. Ms. Steele holds a B.S. from the University of New Hampshire and an M.B.A. from San Francisco State University.
Ms. Steele brings the following primary experiences, qualifications and skills to the Board:
Scaling a SaaS business
CEO experience
Modern cloud technologist
Sales Marketing Key customer segment insight
People and compensation
Governance, risk and
compliance
Independent
Independent Board Member
Age 54
Director Since 2017
Splunk Committee(s): Compensation Committee
Sri Viswanath Mr. Viswanath possesses specific attributes that qualify him to serve as a director, including his product and engineering expertise, his knowledge and experience in the software industry and professional experience serving in leadership positions at other public companies.
Sri Viswanath has served as a member of our Board since 2019. Since 2016, Mr. Viswanath has served as Chief Technology Officer at Atlassian Corporation Plc, a provider of team collaboration and productivity software. Prior to joining Atlassian, Mr. Viswanath served as Senior Vice President of Engineering and Operations from April 2013 to October 2014 and Chief Technology Officer from October 2014 to January 2016 at Groupon, Inc., an e-commerce company. From 2012 to 2013, he served as Vice President of Research and Development for mobile computing at VMware, Inc., a provider of cloud and virtualization software and services. His previous experience also includes senior-level product positions at Glam Media, Inc. and Ning Inc. (acquired by Glam Media). He began his career in engineering roles at Sun Microsystems, Inc. Mr. Viswanath previously served on the board of directors of SendGrid, Inc., a provider of a cloud-based customer communication platform (acquired by Twilio Inc.), from 2017 to 2019. Mr. Viswanath holds a B.E. from Bangalore University, and a M.S. from each of Clemson University and Stanford University.
Mr. Viswanath brings the following primary experiences, qualifications and skills to the Board:
Technology infrastructure
Scaling a SaaS business
Modern cloud technologist
Marketing Key customer segment insight
People and compensation
Independent
CTO of Atlassian
Age 45
Director Since 2019
Splunk Committee(s): Nominating and Corporate Governance Committee
Patricia Morrison
Ms. Morrison possesses specific attributes that qualify her to serve as a director, including her information technology expertise and professional experience as an executive and as a member of the board of directors of other public companies.
Patricia Morrison has served as a member of our Board since 2013. Ms. Morrison was Executive Vice President, Customer Support Services and Chief Information Officer at Cardinal Health, Inc., a provider of healthcare services, from 2009 to 2018. Prior to joining Cardinal Health, Ms. Morrison was Chief Executive Officer of Mainstay Partners, a technology advisory firm, from 2008 to 2009, and Executive Vice President and Chief Information Officer at Motorola, Inc., a designer, manufacturer, marketer and seller of mobility products, from 2005 to 2008. Her previous experience also includes Chief Information Officer of Office Depot, Inc. and senior-level information technology positions at PepsiCo, Inc., The Quaker Oats Company, General Electric Company and The Procter & Gamble Company. Ms. Morrison has served as a member of the board of directors of Baxter International Inc., a global medical products company, since 2019. Ms. Morrison previously served as a member of the board of directors of Aramark, a global provider of food, facilities and uniform services, from 2017 to 2019, and Virtusa Corporation, a global provider of digital strategy, digital engineering, and IT services and solutions, from 2020 to 2021. Ms. Morrison holds a B.A. and B.S. from Miami University in Oxford, Ohio.
Ms. Morrison brings the following primary experiences, qualifications and skills to the Board:
Technology infrastructure
Modern cloud technologist
Key customer segment insight
People and compensation
Governance, risk and
compliance
Independent
Former EVP, Customer Support Services, and CIO of Cardinal Health
Age 61
Director Since 2013
Splunk Committee(s): Audit Committee; Nominating and Corporate Governance Committee
Corporate Governance at SplunkCorporate Governance at Splunk

18 Splunk 2021 Proxy Statement
Stephen Newberry
Mr. Newberry possesses specific attributes that qualify him to serve as a director, including the perspective and experience he brings as a former executive of global technology companies.
Stephen Newberry has served as a member of our Board since 2013. Mr. Newberry served as a director of Lam Research Corporation, a supplier of wafer fabrication equipment and services, from 2005 to 2019, and served as the Chairman of the board of Lam Research from 2012 to 2019. He served as Lam Research’s Chief Executive Officer from 2005 to 2011, President from 1998 to 2010, and Chief Operating Officer from 1997 to 2005. Prior to joining Lam Research, Mr. Newberry held various executive positions at Applied Materials, Inc., a provider of manufacturing solutions for the semiconductor, flat panel display and solar industries. Mr. Newberry holds a B.S. from the United States Naval Academy and is a graduate of the Program for Management Development at Harvard Business School.
Mr. Newberry brings the following primary experiences, qualifications and skills to the Board:
Scaling a SaaS business
CEO experience
Sales
Marketing Key customer segment insight
People and compensation
Governance, risk and
compliance
Independent
Former Chairman of Lam Research
Age 67
Director Since 2013
Splunk Committee(s): Compensation Committee
General Dennis Via
General Via (ret) possesses specific attributes that qualify him to serve as a director, including his information technology expertise and extensive government and leadership experience.
General Dennis L. Via, US Army, Retired, has served on our Board since 2020. General Via (ret) has served as an Executive Vice President in the Global Defense Group’s Joint Combatant Command since 2018 and a fellow for Defense Futures since 2017 at Booz Allen Hamilton Inc., a management and information technology consulting firm, and prior to this role, he served as Senior Executive Advisor from 2017 to 2018. Prior to joining Booz Allen, he served in the United States Army from 1980 to 2016, holding multiple command and senior leadership positions, including as the Commander of the U.S. Army Materiel Command from 2012 to 2016 and retiring as a four-star General. He holds a B.S. from Virginia State University and a Master of Education from Boston University.
General Via (ret) brings the following primary experiences, qualifications and skills to the Board:
Technology infrastructure
CEO experience
Modern cloud technologist
Key customer segment insight
People and compensation
Governance, risk and
compliance
Independent
Executive Vice President, Booz Allen Hamilton and Retired Four-Star U.S. Army General
Age 63
Director Since 2020
Splunk Committee(s): Nominating and Corporate Governance Committee
Director IndependenceOur common stock is listed on The Nasdaq Global Select Market. Under the rules of The Nasdaq Stock Market, independent directors must comprise a majority of a listed company’s board of directors, and subject to specified limited exceptions, all members of its audit, compensation, and nominating and corporate governance committees must be independent. Under those rules, a director is independent only if a company’s board of directors makes an affirmative determination that the director has no material relationship with the company that would impair his or her independence.
Our Board has undertaken a review of the independence of each director. In making this determination, our Board considered the relationships that each non-employee director has with us and all other facts and circumstances that our Board deemed relevant in determining their independence, including the beneficial ownership of our capital stock of each non-employee director, as well as relationships that our directors may have with our customers and vendors. Based on this review, our Board has determined that Ms. Baack, Mr. Boyle, Mr. Carges, Ms. Morrison, Mr. Newberry, Mr. Smith, Ms. Steele, General Via (ret) and Mr. Viswanath, representing nine of our ten directors, are “independent” as that term is defined under the rules of The Nasdaq Stock Market for purposes of serving on our Board and committees of our Board. In addition, our Board determined that Mr. Connors, who served as a director until his resignation on May 1, 2021, was independent during the time he served as a director.
Stockholder RecommendationsThe Nominating and Corporate Governance Committee will consider candidates for director recommended by stockholders holding at least one percent of our fully diluted capitalization continuously for at least 12 months. The Nominating and Corporate Governance Committee will evaluate such recommendations in accordance with its charter, our Bylaws, our policies and procedures for director candidates, as well as the nominee criteria described above. This process is designed to ensure that the Board includes members with diverse backgrounds, skills and experience, including appropriate financial and other expertise relevant to our business. Stockholders meeting the applicable requirements that wish to recommend a candidate for nomination should contact our Corporate Secretary in writing. Such recommendations must include the candidate’s name, home and business contact information, detailed biographical data, relevant qualifications, a statement of support by the recommending stockholder, evidence of the recommending stockholder’s ownership of our stock and a signed letter from the candidate confirming willingness to serve on our Board. The Nominating and Corporate Governance Committee has discretion to decide which individuals to recommend for nomination as directors. We did not receive any stockholder recommendations in 2020.
Stockholder NominationsOur Bylaws permit stockholders to nominate director candidates through proxy access for inclusion in our proxy statement.
PROXY ACCESS PROCESS
1 2 3 a single stockholder, or group
of up to 20 stockholders (or 25 stockholders, if our annual revenues
are greater than $4 billion for the most recently completed fiscal year)
owning 3% outstanding stock for
at least 3 years consecutively
the individual or group may submit
up to 20% (if there are 10 or more directors in
office) or
up to 25% (if there are nine or fewer directors in office) of the directors then in office,
but in no case less than
one nominee
stockholders and nominees who satisfy the requirements specified by our Bylaws are included in the
proxy statement
Corporate Governance at SplunkCorporate Governance at Splunk

PR
OX
Y
19Splunk 2021 Proxy Statement
Stephen Newberry
Mr. Newberry possesses specific attributes that qualify him to serve as a director, including the perspective and experience he brings as a former executive of global technology companies.
Stephen Newberry has served as a member of our Board since 2013. Mr. Newberry served as a director of Lam Research Corporation, a supplier of wafer fabrication equipment and services, from 2005 to 2019, and served as the Chairman of the board of Lam Research from 2012 to 2019. He served as Lam Research’s Chief Executive Officer from 2005 to 2011, President from 1998 to 2010, and Chief Operating Officer from 1997 to 2005. Prior to joining Lam Research, Mr. Newberry held various executive positions at Applied Materials, Inc., a provider of manufacturing solutions for the semiconductor, flat panel display and solar industries. Mr. Newberry holds a B.S. from the United States Naval Academy and is a graduate of the Program for Management Development at Harvard Business School.
Mr. Newberry brings the following primary experiences, qualifications and skills to the Board:
Scaling a SaaS business
CEO experience
Sales
Marketing Key customer segment insight
People and compensation
Governance, risk and
compliance
Independent
Former Chairman of Lam Research
Age 67
Director Since 2013
Splunk Committee(s): Compensation Committee
General Dennis Via
General Via (ret) possesses specific attributes that qualify him to serve as a director, including his information technology expertise and extensive government and leadership experience.
General Dennis L. Via, US Army, Retired, has served on our Board since 2020. General Via (ret) has served as an Executive Vice President in the Global Defense Group’s Joint Combatant Command since 2018 and a fellow for Defense Futures since 2017 at Booz Allen Hamilton Inc., a management and information technology consulting firm, and prior to this role, he served as Senior Executive Advisor from 2017 to 2018. Prior to joining Booz Allen, he served in the United States Army from 1980 to 2016, holding multiple command and senior leadership positions, including as the Commander of the U.S. Army Materiel Command from 2012 to 2016 and retiring as a four-star General. He holds a B.S. from Virginia State University and a Master of Education from Boston University.
General Via (ret) brings the following primary experiences, qualifications and skills to the Board:
Technology infrastructure
CEO experience
Modern cloud technologist
Key customer segment insight
People and compensation
Governance, risk and
compliance
Independent
Executive Vice President, Booz Allen Hamilton and Retired Four-Star U.S. Army General
Age 63
Director Since 2020
Splunk Committee(s): Nominating and Corporate Governance Committee
Director IndependenceOur common stock is listed on The Nasdaq Global Select Market. Under the rules of The Nasdaq Stock Market, independent directors must comprise a majority of a listed company’s board of directors, and subject to specified limited exceptions, all members of its audit, compensation, and nominating and corporate governance committees must be independent. Under those rules, a director is independent only if a company’s board of directors makes an affirmative determination that the director has no material relationship with the company that would impair his or her independence.
Our Board has undertaken a review of the independence of each director. In making this determination, our Board considered the relationships that each non-employee director has with us and all other facts and circumstances that our Board deemed relevant in determining their independence, including the beneficial ownership of our capital stock of each non-employee director, as well as relationships that our directors may have with our customers and vendors. Based on this review, our Board has determined that Ms. Baack, Mr. Boyle, Mr. Carges, Ms. Morrison, Mr. Newberry, Mr. Smith, Ms. Steele, General Via (ret) and Mr. Viswanath, representing nine of our ten directors, are “independent” as that term is defined under the rules of The Nasdaq Stock Market for purposes of serving on our Board and committees of our Board. In addition, our Board determined that Mr. Connors, who served as a director until his resignation on May 1, 2021, was independent during the time he served as a director.
Stockholder RecommendationsThe Nominating and Corporate Governance Committee will consider candidates for director recommended by stockholders holding at least one percent of our fully diluted capitalization continuously for at least 12 months. The Nominating and Corporate Governance Committee will evaluate such recommendations in accordance with its charter, our Bylaws, our policies and procedures for director candidates, as well as the nominee criteria described above. This process is designed to ensure that the Board includes members with diverse backgrounds, skills and experience, including appropriate financial and other expertise relevant to our business. Stockholders meeting the applicable requirements that wish to recommend a candidate for nomination should contact our Corporate Secretary in writing. Such recommendations must include the candidate’s name, home and business contact information, detailed biographical data, relevant qualifications, a statement of support by the recommending stockholder, evidence of the recommending stockholder’s ownership of our stock and a signed letter from the candidate confirming willingness to serve on our Board. The Nominating and Corporate Governance Committee has discretion to decide which individuals to recommend for nomination as directors. We did not receive any stockholder recommendations in 2020.
Stockholder NominationsOur Bylaws permit stockholders to nominate director candidates through proxy access for inclusion in our proxy statement.
PROXY ACCESS PROCESS
1 2 3 a single stockholder, or group
of up to 20 stockholders (or 25 stockholders, if our annual revenues
are greater than $4 billion for the most recently completed fiscal year)
owning 3% outstanding stock for
at least 3 years consecutively
the individual or group may submit
up to 20% (if there are 10 or more directors in
office) or
up to 25% (if there are nine or fewer directors in office) of the directors then in office,
but in no case less than
one nominee
stockholders and nominees who satisfy the requirements specified by our Bylaws are included in the
proxy statement
Corporate Governance at SplunkCorporate Governance at Splunk

20 Splunk 2021 Proxy Statement
To be timely for our 2022 annual meeting of stockholders, our Corporate Secretary must receive a stockholder’s notice of a proxy access nomination at our principal executive offices:
• not earlier than December 5, 2021; and
• not later than the close of business on January 4, 2022.
Advance Notice ProceduresOur Bylaws also permit stockholders to nominate directors for election at an annual meeting of stockholders. To nominate a director, the stockholder must provide the information required by our Bylaws. In addition, the stockholder must give timely notice to our Corporate Secretary in accordance with our Bylaws, which, in general, require that the notice be received by our Corporate Secretary within the time period described under “Other Matters—Stockholder Proposals” for stockholder proposals that are not intended to be included in our proxy statement.
Board’s Role and ResponsibilitiesStockholders elect the Board to oversee our management team and to serve stockholders’ long-term interests. In exercising their fiduciary duties, the Board represents and acts in the interests of our stockholders and is committed to strong corporate governance. The Board is deeply involved in the Company’s strategic planning process, risk oversight, human capital management, succession planning and selecting and evaluating the performance of our CEO.
Long-Term Strategic PlanningOur Board recognizes the importance of assuring that our overall business strategy is designed to create long-term, sustainable value for our stockholders. As a result, our Board maintains an active oversight role in helping our management team formulate, plan and implement the Company’s strategy. The Board and our management team routinely discuss the execution of our long-term strategic plans, the status of key initiatives and the key opportunities and risks facing the Company. At least annually, the Board participates in an in-depth review of the Company’s overall strategy with our management team. The Board and our management team discuss the industry and competitive landscapes, and short- and long-term plans and priorities. In addition to our business strategy, the Board reviews the Company’s financial plan for the upcoming year, which is aligned to the Company’s long-term strategic plans and priorities.
Risk OversightOur Board recognizes the importance of effective risk oversight in running a successful business and in fulfilling its fiduciary responsibilities to the Company and its stockholders. Our Board is responsible for assuring that an appropriate culture of risk management exists within the Company and for setting the right “tone at the top,” overseeing our risk management programs and practices, which includes areas such as strategic risks, including risks related to product, go-to-market and sales strategies, competitive risks, financial risks, brand and reputation risks, legal, compliance, governance and geo-political risks, operational risks and cybersecurity and technology risks.
Our Board exercises its risk oversight responsibility both directly and through its three standing committees, each of which is delegated specific risks and keeps our Board informed of its oversight responsibilities through regular reports by the committee chairs. Our management team is responsible for the day-to-day management of risks we face and members of our management team engage with the Board and its three standing committees regularly regarding such risks. Throughout the year, our Board and each committee spend a portion of their time reviewing and discussing specific risk topics.
The following are the key oversight responsibilities of our Board and its committees:
BOARD OF DIRECTORS
Oversees Major Risks
• Strategic and competitive
• Operational
• Financial
• Data protection and cybersecurity
• Brand and reputational
• Succession planning
• Legal, compliance and geo-political
• Culture
AUDIT COMMITTEE COMPENSATION COMMITTEENOMINATING & CORPORATE GOVERNANCE COMMITTEE
Primary Risk Oversight
• Risk management framework
• Financial statements, financial reporting and internal controls
• Data protection and cybersecurity
• Legal and compliance
Primary Risk Oversight
• Employee compensation policies and practices
• Non-executive director compensation policies and practices
• Human capital management
• CEO and management succession planning
Primary Risk Oversight
• Governance framework
• Board effectiveness
• Board succession planning
• Conflicts of interest and compliance
• ESG activities, programs and public disclosure
MANAGEMENT
Identification, assessment, and mitigation of risks
Board Oversight of Response to COVID-19Our Board, together with the Audit Committee and the Compensation Committee, has been actively engaged with our management team in monitoring the severe market developments and other effects of the ongoing COVID-19 pandemic, and our management team is in regular communication with the Board about the assessment and management of the significant risks to the Company, our employees, our customers and other stakeholders. These risks include the impact of the COVID-19 pandemic on our business and the overall economic environment, compliance with measures by private industry and governments to protect the public health, operational challenges and increased risk of cybersecurity related breaches. The Compensation Committee regularly assessed compensation-related risks resulting from the impacts and uncertainties associated with the COVID-19 pandemic on our business coupled with the complexities associated with business model transformations. In October 2020, in consultation with its independent compensation consultant Compensia (“Compensia”), the Compensation Committee made adjustments to our short-term and long-term incentive metrics given such uncertainties and complexities. In addition, the Board has overseen our management team’s initiatives to ensure the health and safety of our employees and to provide support to our customers, partners and the communities in which we operate.
Corporate Governance at SplunkCorporate Governance at Splunk

PR
OX
Y
21Splunk 2021 Proxy Statement
To be timely for our 2022 annual meeting of stockholders, our Corporate Secretary must receive a stockholder’s notice of a proxy access nomination at our principal executive offices:
• not earlier than December 5, 2021; and
• not later than the close of business on January 4, 2022.
Advance Notice ProceduresOur Bylaws also permit stockholders to nominate directors for election at an annual meeting of stockholders. To nominate a director, the stockholder must provide the information required by our Bylaws. In addition, the stockholder must give timely notice to our Corporate Secretary in accordance with our Bylaws, which, in general, require that the notice be received by our Corporate Secretary within the time period described under “Other Matters—Stockholder Proposals” for stockholder proposals that are not intended to be included in our proxy statement.
Board’s Role and ResponsibilitiesStockholders elect the Board to oversee our management team and to serve stockholders’ long-term interests. In exercising their fiduciary duties, the Board represents and acts in the interests of our stockholders and is committed to strong corporate governance. The Board is deeply involved in the Company’s strategic planning process, risk oversight, human capital management, succession planning and selecting and evaluating the performance of our CEO.
Long-Term Strategic PlanningOur Board recognizes the importance of assuring that our overall business strategy is designed to create long-term, sustainable value for our stockholders. As a result, our Board maintains an active oversight role in helping our management team formulate, plan and implement the Company’s strategy. The Board and our management team routinely discuss the execution of our long-term strategic plans, the status of key initiatives and the key opportunities and risks facing the Company. At least annually, the Board participates in an in-depth review of the Company’s overall strategy with our management team. The Board and our management team discuss the industry and competitive landscapes, and short- and long-term plans and priorities. In addition to our business strategy, the Board reviews the Company’s financial plan for the upcoming year, which is aligned to the Company’s long-term strategic plans and priorities.
Risk OversightOur Board recognizes the importance of effective risk oversight in running a successful business and in fulfilling its fiduciary responsibilities to the Company and its stockholders. Our Board is responsible for assuring that an appropriate culture of risk management exists within the Company and for setting the right “tone at the top,” overseeing our risk management programs and practices, which includes areas such as strategic risks, including risks related to product, go-to-market and sales strategies, competitive risks, financial risks, brand and reputation risks, legal, compliance, governance and geo-political risks, operational risks and cybersecurity and technology risks.
Our Board exercises its risk oversight responsibility both directly and through its three standing committees, each of which is delegated specific risks and keeps our Board informed of its oversight responsibilities through regular reports by the committee chairs. Our management team is responsible for the day-to-day management of risks we face and members of our management team engage with the Board and its three standing committees regularly regarding such risks. Throughout the year, our Board and each committee spend a portion of their time reviewing and discussing specific risk topics.
The following are the key oversight responsibilities of our Board and its committees:
BOARD OF DIRECTORS
Oversees Major Risks
• Strategic and competitive
• Operational
• Financial
• Data protection and cybersecurity
• Brand and reputational
• Succession planning
• Legal, compliance and geo-political
• Culture
AUDIT COMMITTEE COMPENSATION COMMITTEENOMINATING & CORPORATE GOVERNANCE COMMITTEE
Primary Risk Oversight
• Risk management framework
• Financial statements, financial reporting and internal controls
• Data protection and cybersecurity
• Legal and compliance
Primary Risk Oversight
• Employee compensation policies and practices
• Non-executive director compensation policies and practices
• Human capital management
• CEO and management succession planning
Primary Risk Oversight
• Governance framework
• Board effectiveness
• Board succession planning
• Conflicts of interest and compliance
• ESG activities, programs and public disclosure
MANAGEMENT
Identification, assessment, and mitigation of risks
Board Oversight of Response to COVID-19Our Board, together with the Audit Committee and the Compensation Committee, has been actively engaged with our management team in monitoring the severe market developments and other effects of the ongoing COVID-19 pandemic, and our management team is in regular communication with the Board about the assessment and management of the significant risks to the Company, our employees, our customers and other stakeholders. These risks include the impact of the COVID-19 pandemic on our business and the overall economic environment, compliance with measures by private industry and governments to protect the public health, operational challenges and increased risk of cybersecurity related breaches. The Compensation Committee regularly assessed compensation-related risks resulting from the impacts and uncertainties associated with the COVID-19 pandemic on our business coupled with the complexities associated with business model transformations. In October 2020, in consultation with its independent compensation consultant Compensia (“Compensia”), the Compensation Committee made adjustments to our short-term and long-term incentive metrics given such uncertainties and complexities. In addition, the Board has overseen our management team’s initiatives to ensure the health and safety of our employees and to provide support to our customers, partners and the communities in which we operate.
Corporate Governance at SplunkCorporate Governance at Splunk

22 Splunk 2021 Proxy Statement
Human Capital Management OversightThe tone and culture of the Company is set at the Board level and the standing committees have responsibility for specific areas of human capital management oversight. The Nominating and Corporate Governance Committee is responsible for director appointments and ensuring a diverse pool of director candidates are considered. The Compensation Committee periodically reviews and discusses with our management team the Company’s human capital management activities including, among other things, matters related to talent management and development, talent acquisition, employee engagement and diversity and inclusion. The Audit Committee oversees compliance with the Code of Business Conduct and Ethics (the “Code”). Our management team is responsible for ensuring that our policies and processes reflect and reinforce our desired corporate culture. We publish a Diversity & Inclusion Report annually in which we use our own data to identify and assess what we have achieved and understand what we need to do to increase our diversity in the workplace.
Other Core Business Functions OversightIn addition, those employees representing certain core business functions also regularly engage with the Board and its committees. For example, some of these functions include:
• Our Chief Information Security Officer (“CISO”) provides periodic updates to the Audit Committee and the Board on cybersecurity and other risks relevant to our information technology environment. The Audit Committee and the Board also receive updates about the results of periodic exercises and response readiness assessments led by our CISO and outside advisors who provide a third-party independent assessment of our cyber risk management program and our internal response preparedness.
• Reporting to the Audit Committee, our internal audit function provides objective audit, investigative, and advisory services aimed at providing assurance to our management team and the Board that the Company is anticipating, identifying, assessing, and appropriately prioritizing and mitigating risks.
• Representatives from our Legal Department update our Board regularly on material legal, ethics, compliance, governance and geo-political matters. Our Chief Ethics and Compliance Officer oversees risks related to ethics and compliance, labor and employment and disputes and litigation, and provides regular reports to the Audit Committee on these areas.
• Our Strategy and Corporate Development team, along with others, assists the Board in its governance of strategic acquisitions and investments and assessments of the competitive landscape.
Our Board believes that its current leadership structure, described in detail under “Board Effectiveness” on page 23, supports the risk oversight function of our Board by providing for open communication between our management team and our Board. In addition, independent directors chair the various committees involved in assisting with risk oversight, and all directors are involved in the risk oversight function.
Leadership Development and Management Succession PlanningThe Board and management team recognize the importance of continuously developing our executive talent. The Compensation Committee periodically reviews the performance of, and succession planning for, our management team and reports its findings and recommendations to the Board, works with the Board in evaluating potential successors to management positions and confers with the CEO to encourage our management team’s employee development programs. The Compensation Committee also periodically reviews a succession plan for the CEO position, using formal criteria to evaluate potential successors, and reporting such information to the Board. In conducting its evaluation, the Compensation Committee considers current and future organizational needs, competitive challenges, leadership/ management potential and development, and emergency situations.
The Nominating and Corporate Governance Committee regularly oversees and plans for director succession and refreshment of the Board to ensure a mix of skills, experience, tenure and diversity, as described under “Board Composition—Board Refreshment and Succession Planning” beginning on page 13.
CEO Evaluation ProcessOur Board conducts an annual CEO evaluation process, consisting of both a performance review and, with the Compensation Committee, a compensation analysis. For fiscal 2021, the performance evaluation component was led by our Chair of the Board and the chair of the Compensation Committee and included an assessment of the CEO’s performance in light of set objectives and a detailed CEO self-assessment. Separately, Compensia conducted a market analysis to assess alignment of CEO compensation with competitive market practices and provided its findings to the Compensation Committee. Once all the relevant performance data had been collected, our Chair and the chair of the Compensation Committee met with the CEO to discuss his performance and then prepared and presented their evaluation on CEO performance to the Board. The Compensation Committee then met in executive session to discuss the CEO performance evaluation results and CEO compensation. After reviewing all the collected data regarding performance, the Compensation Committee made its decision regarding CEO compensation for fiscal 2022. Our CEO abstained from participating in all discussions of the Compensation Committee and Board related to the final determination of his compensation.
Board Effectiveness
Leadership StructureMr. Smith, one of the Company’s independent directors, currently serves as Chair of our Board. The Chair presides over meetings of the Board, presides over meetings of stockholders, works with our management team to prepare agendas for meetings of the Board, serves as a liaison between our management team and the directors, and performs additional duties as the Board determines. Our Board believes that its leadership structure appropriately and effectively allocates authority, responsibility, and oversight between our management team and the members of our Board. It gives primary responsibility for the operational leadership and strategic direction of the Company to our CEO, while the Chair facilitates our Board’s independent oversight of our management team, promotes communication between our management team and our Board, engages with stockholders, when appropriate, and leads our Board’s consideration of key governance matters.
Our Corporate Governance Guidelines require an independent director to serve as Lead Independent Director if the Chair is not an independent director. As the current Chair is an independent director, we do not currently have a Lead Independent Director.
The Nominating and Corporate Governance Committee periodically reviews the Board’s leadership structure and when appropriate, recommends changes to the Board’s leadership structure, taking into consideration the needs of the Board and the Company at such time.
Executive SessionsThe independent members of our Board and all committees of the Board generally meet in executive session without our management team present during their regularly scheduled board and committee meetings. For as long as we have independent Board and committee chairs, the Chairs will preside over these meetings.
Board EvaluationsEach year, the Nominating and Corporate Governance Committee reviews the format and framework of the Board and committee evaluation process and oversees the process itself.
The evaluation process has historically taken one of two forms: an internal assessment led by the independent Chair or Lead Independent Director (when we do not have an independent Chair) or an assessment using the services of an independent consultant. In either instance, the purpose of the evaluation is to focus on areas in which the Board or the committees believe contributions can be made going forward to increase the effectiveness of the Board or the committees. While this formal evaluation is conducted on an annual basis, directors share perspectives, feedback and suggestions year-round.
Corporate Governance at SplunkCorporate Governance at Splunk

PR
OX
Y
23Splunk 2021 Proxy Statement
Human Capital Management OversightThe tone and culture of the Company is set at the Board level and the standing committees have responsibility for specific areas of human capital management oversight. The Nominating and Corporate Governance Committee is responsible for director appointments and ensuring a diverse pool of director candidates are considered. The Compensation Committee periodically reviews and discusses with our management team the Company’s human capital management activities including, among other things, matters related to talent management and development, talent acquisition, employee engagement and diversity and inclusion. The Audit Committee oversees compliance with the Code of Business Conduct and Ethics (the “Code”). Our management team is responsible for ensuring that our policies and processes reflect and reinforce our desired corporate culture. We publish a Diversity & Inclusion Report annually in which we use our own data to identify and assess what we have achieved and understand what we need to do to increase our diversity in the workplace.
Other Core Business Functions OversightIn addition, those employees representing certain core business functions also regularly engage with the Board and its committees. For example, some of these functions include:
• Our Chief Information Security Officer (“CISO”) provides periodic updates to the Audit Committee and the Board on cybersecurity and other risks relevant to our information technology environment. The Audit Committee and the Board also receive updates about the results of periodic exercises and response readiness assessments led by our CISO and outside advisors who provide a third-party independent assessment of our cyber risk management program and our internal response preparedness.
• Reporting to the Audit Committee, our internal audit function provides objective audit, investigative, and advisory services aimed at providing assurance to our management team and the Board that the Company is anticipating, identifying, assessing, and appropriately prioritizing and mitigating risks.
• Representatives from our Legal Department update our Board regularly on material legal, ethics, compliance, governance and geo-political matters. Our Chief Ethics and Compliance Officer oversees risks related to ethics and compliance, labor and employment and disputes and litigation, and provides regular reports to the Audit Committee on these areas.
• Our Strategy and Corporate Development team, along with others, assists the Board in its governance of strategic acquisitions and investments and assessments of the competitive landscape.
Our Board believes that its current leadership structure, described in detail under “Board Effectiveness” on page 23, supports the risk oversight function of our Board by providing for open communication between our management team and our Board. In addition, independent directors chair the various committees involved in assisting with risk oversight, and all directors are involved in the risk oversight function.
Leadership Development and Management Succession PlanningThe Board and management team recognize the importance of continuously developing our executive talent. The Compensation Committee periodically reviews the performance of, and succession planning for, our management team and reports its findings and recommendations to the Board, works with the Board in evaluating potential successors to management positions and confers with the CEO to encourage our management team’s employee development programs. The Compensation Committee also periodically reviews a succession plan for the CEO position, using formal criteria to evaluate potential successors, and reporting such information to the Board. In conducting its evaluation, the Compensation Committee considers current and future organizational needs, competitive challenges, leadership/ management potential and development, and emergency situations.
The Nominating and Corporate Governance Committee regularly oversees and plans for director succession and refreshment of the Board to ensure a mix of skills, experience, tenure and diversity, as described under “Board Composition—Board Refreshment and Succession Planning” beginning on page 13.
CEO Evaluation ProcessOur Board conducts an annual CEO evaluation process, consisting of both a performance review and, with the Compensation Committee, a compensation analysis. For fiscal 2021, the performance evaluation component was led by our Chair of the Board and the chair of the Compensation Committee and included an assessment of the CEO’s performance in light of set objectives and a detailed CEO self-assessment. Separately, Compensia conducted a market analysis to assess alignment of CEO compensation with competitive market practices and provided its findings to the Compensation Committee. Once all the relevant performance data had been collected, our Chair and the chair of the Compensation Committee met with the CEO to discuss his performance and then prepared and presented their evaluation on CEO performance to the Board. The Compensation Committee then met in executive session to discuss the CEO performance evaluation results and CEO compensation. After reviewing all the collected data regarding performance, the Compensation Committee made its decision regarding CEO compensation for fiscal 2022. Our CEO abstained from participating in all discussions of the Compensation Committee and Board related to the final determination of his compensation.
Board Effectiveness
Leadership StructureMr. Smith, one of the Company’s independent directors, currently serves as Chair of our Board. The Chair presides over meetings of the Board, presides over meetings of stockholders, works with our management team to prepare agendas for meetings of the Board, serves as a liaison between our management team and the directors, and performs additional duties as the Board determines. Our Board believes that its leadership structure appropriately and effectively allocates authority, responsibility, and oversight between our management team and the members of our Board. It gives primary responsibility for the operational leadership and strategic direction of the Company to our CEO, while the Chair facilitates our Board’s independent oversight of our management team, promotes communication between our management team and our Board, engages with stockholders, when appropriate, and leads our Board’s consideration of key governance matters.
Our Corporate Governance Guidelines require an independent director to serve as Lead Independent Director if the Chair is not an independent director. As the current Chair is an independent director, we do not currently have a Lead Independent Director.
The Nominating and Corporate Governance Committee periodically reviews the Board’s leadership structure and when appropriate, recommends changes to the Board’s leadership structure, taking into consideration the needs of the Board and the Company at such time.
Executive SessionsThe independent members of our Board and all committees of the Board generally meet in executive session without our management team present during their regularly scheduled board and committee meetings. For as long as we have independent Board and committee chairs, the Chairs will preside over these meetings.
Board EvaluationsEach year, the Nominating and Corporate Governance Committee reviews the format and framework of the Board and committee evaluation process and oversees the process itself.
The evaluation process has historically taken one of two forms: an internal assessment led by the independent Chair or Lead Independent Director (when we do not have an independent Chair) or an assessment using the services of an independent consultant. In either instance, the purpose of the evaluation is to focus on areas in which the Board or the committees believe contributions can be made going forward to increase the effectiveness of the Board or the committees. While this formal evaluation is conducted on an annual basis, directors share perspectives, feedback and suggestions year-round.
Corporate Governance at SplunkCorporate Governance at Splunk

24 Splunk 2021 Proxy Statement
For fiscal 2021, as with the last several years, the Nominating and Corporate Governance Committee used an independent consultant, experienced in corporate governance matters, to assist with the Board and committee evaluation process. Using a combination of online surveys and interviews by the consultant, directors provided feedback on individual directors, committees and the Board in general. The topics covered included, among other things, Board and committee processes, Board composition and expertise, Board refreshment and succession planning processes, and other matters designed to elicit information to be used in improving Board and committee operation, performance and capability. In addition, certain members of our management team completed an online survey regarding Board performance and Board engagement with our management team.
The consultant synthesized the results and comments received during the interviews. The consultant presented the findings to the Nominating and Corporate Governance Committee and the Board, followed by review and discussion by the full Board.
Over the past few years, the evaluation process has led to a broader scope of topics covered in Board meetings and improvements in Board process.
IMP
RO
VEM
ENTS
• These improvements include changes relating to the preparation and distribution of Board materials, adjustments to the timing and location of Board and committee meetings, a directors’ education day, an annual in-depth review of the Company’s overall strategy with our management team and a more fluid discussion of anticipated future director skills.
• The Board and management team also developed a shared understanding on Board dynamics, progress made and agreed on areas of focus for improved performance.
• The process has also informed Board and committee composition and leadership roles, which includes evolution of the director skills and experience qualifications criteria to meet the current and anticipated needs of the business and improved structure and transparency around Board refreshment and succession planning.
RES
ULT
S Results of the process, including review of contributions and performance of each director, are used by the Nominating and Corporate Governance Committee when considering whether to nominate the director for re-election to the Board.
Director Onboarding and Continuing EducationAs part of our onboarding process, all new directors participate in an orientation program which familiarizes them with the Company’s business, operations, strategies and corporate governance practices, and assists them in developing Company and industry knowledge to optimize their service on the Board. Our onboarding process also includes meetings with members of our management team to accelerate their effectiveness to engage fully in deliberations of our Board.
The Company encourages directors to participate in continuing education programs focused on the Company’s business and industry, committee roles and responsibilities and legal and ethical responsibilities of directors. The Company reimburses directors for their expenses associated with this participation. We provide membership in the National Association of Corporate Directors to all Board members. We also encourage our directors to attend Splunk events such as our annual users’ conference and take virtual Splunk education classes. Continuing director education is also provided during Board meetings and other Board discussions as part of the formal meetings and may include internally developed materials and presentations as well as programs presented by third parties.
Board Meetings and CommitteesDuring our fiscal year ended January 31, 2021, the Board held ten meetings, and no director attended fewer than 75% of the total number of meetings of the Board during the period for which he or she has been a director and the committees of which such director was a member during the periods that he or she served.
Although we do not have a formal policy regarding attendance by members of our Board at annual meetings of stockholders, we encourage directors to attend. All then-serving directors attended our 2020 annual meeting of stockholders. Our Board has an Audit Committee, a Compensation Committee, and a Nominating and Corporate Governance Committee, each of which has the composition and responsibilities described below. Members serve on these committees until their resignation or until otherwise determined by our Board.
Sean BoyleChair
Our Audit Committee operates under a written charter that was adopted by our Board and satisfies the applicable standards of the SEC and The Nasdaq Stock Market. A copy of the Audit Committee Charter is available on our investor website at http://investors. splunk.com/corporate-governance.
AUDIT COMMITTEEThe current members of our Audit Committee are Mr. Boyle, Ms. Morrison and Mr. Smith. Our Board has determined that each of the members of our Audit Committee satisfies the requirements for independence and financial literacy under the rules and regulations of The Nasdaq Stock Market and the Securities and Exchange Commission (“SEC”) applicable to Audit Committee members. Mr. Connors, who served on the Audit Committee until May 2021, was independent during his service. Our Board also determined that Mr. Boyle, Mr. Connors and Mr. Smith are audit committee financial experts as contemplated by the rules of the SEC implementing Section 407 of the Sarbanes Oxley Act of 2002. The Audit Committee held 14 meetings during the fiscal year ended January 31, 2021.
Our Audit Committee oversees our accounting and financial reporting processes and the audit of our financial statements and assists our Board in monitoring our financial systems and our legal and regulatory compliance. Our Audit Committee is responsible for, among other things:
• appointing, compensating and overseeing the work of our independent auditors, including resolving disagreements between our management team and the independent registered public accounting firm regarding financial reporting and any other required communications described in applicable accounting standards, including critical audit matters;
• approving engagements of the independent registered public accounting firm to render any audit or permissible non-audit services;
• reviewing the qualifications and independence of the independent registered public accounting firm;
• reviewing our financial statements and related disclosures and reviewing our critical accounting policies and practices;
• reviewing the adequacy and effectiveness of our internal control over financial reporting;
• establishing procedures for the receipt, retention and treatment of accounting, internal accounting controls or auditing matters, the prompt internal reporting of violations of the Code that could have a significant impact on our financial statements, and procedures for the confidential, anonymous submission by employees of concerns regarding questionable accounting or auditing matters;
• preparing the audit committee report required by SEC rules to be included in our annual proxy statement;
• reviewing and discussing with our management team and the independent registered public accounting firm the results of our annual audit, our quarterly financial statements and our publicly filed reports;
• reviewing and maintaining the related person transaction policy to ensure compliance with applicable law and that any proposed related person transactions are disclosed as required;
• overseeing the internal audit function;
• overseeing compliance with the Code and reviewing material legal and ethical matters;
• overseeing the adequacy and effectiveness of the Company’s enterprise risk management framework; and
• reviewing our cybersecurity and other information technology risks, controls and procedures.
Corporate Governance at SplunkCorporate Governance at Splunk

PR
OX
Y
25Splunk 2021 Proxy Statement
For fiscal 2021, as with the last several years, the Nominating and Corporate Governance Committee used an independent consultant, experienced in corporate governance matters, to assist with the Board and committee evaluation process. Using a combination of online surveys and interviews by the consultant, directors provided feedback on individual directors, committees and the Board in general. The topics covered included, among other things, Board and committee processes, Board composition and expertise, Board refreshment and succession planning processes, and other matters designed to elicit information to be used in improving Board and committee operation, performance and capability. In addition, certain members of our management team completed an online survey regarding Board performance and Board engagement with our management team.
The consultant synthesized the results and comments received during the interviews. The consultant presented the findings to the Nominating and Corporate Governance Committee and the Board, followed by review and discussion by the full Board.
Over the past few years, the evaluation process has led to a broader scope of topics covered in Board meetings and improvements in Board process.
IMP
RO
VEM
ENTS
• These improvements include changes relating to the preparation and distribution of Board materials, adjustments to the timing and location of Board and committee meetings, a directors’ education day, an annual in-depth review of the Company’s overall strategy with our management team and a more fluid discussion of anticipated future director skills.
• The Board and management team also developed a shared understanding on Board dynamics, progress made and agreed on areas of focus for improved performance.
• The process has also informed Board and committee composition and leadership roles, which includes evolution of the director skills and experience qualifications criteria to meet the current and anticipated needs of the business and improved structure and transparency around Board refreshment and succession planning.
RES
ULT
S Results of the process, including review of contributions and performance of each director, are used by the Nominating and Corporate Governance Committee when considering whether to nominate the director for re-election to the Board.
Director Onboarding and Continuing EducationAs part of our onboarding process, all new directors participate in an orientation program which familiarizes them with the Company’s business, operations, strategies and corporate governance practices, and assists them in developing Company and industry knowledge to optimize their service on the Board. Our onboarding process also includes meetings with members of our management team to accelerate their effectiveness to engage fully in deliberations of our Board.
The Company encourages directors to participate in continuing education programs focused on the Company’s business and industry, committee roles and responsibilities and legal and ethical responsibilities of directors. The Company reimburses directors for their expenses associated with this participation. We provide membership in the National Association of Corporate Directors to all Board members. We also encourage our directors to attend Splunk events such as our annual users’ conference and take virtual Splunk education classes. Continuing director education is also provided during Board meetings and other Board discussions as part of the formal meetings and may include internally developed materials and presentations as well as programs presented by third parties.
Board Meetings and CommitteesDuring our fiscal year ended January 31, 2021, the Board held ten meetings, and no director attended fewer than 75% of the total number of meetings of the Board during the period for which he or she has been a director and the committees of which such director was a member during the periods that he or she served.
Although we do not have a formal policy regarding attendance by members of our Board at annual meetings of stockholders, we encourage directors to attend. All then-serving directors attended our 2020 annual meeting of stockholders. Our Board has an Audit Committee, a Compensation Committee, and a Nominating and Corporate Governance Committee, each of which has the composition and responsibilities described below. Members serve on these committees until their resignation or until otherwise determined by our Board.
Sean BoyleChair
Our Audit Committee operates under a written charter that was adopted by our Board and satisfies the applicable standards of the SEC and The Nasdaq Stock Market. A copy of the Audit Committee Charter is available on our investor website at http://investors. splunk.com/corporate-governance.
AUDIT COMMITTEEThe current members of our Audit Committee are Mr. Boyle, Ms. Morrison and Mr. Smith. Our Board has determined that each of the members of our Audit Committee satisfies the requirements for independence and financial literacy under the rules and regulations of The Nasdaq Stock Market and the Securities and Exchange Commission (“SEC”) applicable to Audit Committee members. Mr. Connors, who served on the Audit Committee until May 2021, was independent during his service. Our Board also determined that Mr. Boyle, Mr. Connors and Mr. Smith are audit committee financial experts as contemplated by the rules of the SEC implementing Section 407 of the Sarbanes Oxley Act of 2002. The Audit Committee held 14 meetings during the fiscal year ended January 31, 2021.
Our Audit Committee oversees our accounting and financial reporting processes and the audit of our financial statements and assists our Board in monitoring our financial systems and our legal and regulatory compliance. Our Audit Committee is responsible for, among other things:
• appointing, compensating and overseeing the work of our independent auditors, including resolving disagreements between our management team and the independent registered public accounting firm regarding financial reporting and any other required communications described in applicable accounting standards, including critical audit matters;
• approving engagements of the independent registered public accounting firm to render any audit or permissible non-audit services;
• reviewing the qualifications and independence of the independent registered public accounting firm;
• reviewing our financial statements and related disclosures and reviewing our critical accounting policies and practices;
• reviewing the adequacy and effectiveness of our internal control over financial reporting;
• establishing procedures for the receipt, retention and treatment of accounting, internal accounting controls or auditing matters, the prompt internal reporting of violations of the Code that could have a significant impact on our financial statements, and procedures for the confidential, anonymous submission by employees of concerns regarding questionable accounting or auditing matters;
• preparing the audit committee report required by SEC rules to be included in our annual proxy statement;
• reviewing and discussing with our management team and the independent registered public accounting firm the results of our annual audit, our quarterly financial statements and our publicly filed reports;
• reviewing and maintaining the related person transaction policy to ensure compliance with applicable law and that any proposed related person transactions are disclosed as required;
• overseeing the internal audit function;
• overseeing compliance with the Code and reviewing material legal and ethical matters;
• overseeing the adequacy and effectiveness of the Company’s enterprise risk management framework; and
• reviewing our cybersecurity and other information technology risks, controls and procedures.
Corporate Governance at SplunkCorporate Governance at Splunk

26 Splunk 2021 Proxy Statement
Stephen NewberryChair
Our Compensation Committee operates under a written charter that was adopted by our Board and satisfies the applicable standards of the SEC and The Nasdaq Stock Market. A copy of the Compensation Committee Charter is available on our investor website at http:// investors. splunk.com/ corporate-governance.
COMPENSATION COMMITTEEThe current members of our Compensation Committee are Mr. Carges, Mr. Newberry and Ms. Steele. Our Board has determined that each of the members of our Compensation Committee is independent within the meaning of the independence requirements of The Nasdaq Stock Market. Our Board also determined that the composition of our Compensation Committee meets the requirements for independence under, and the functioning of our Compensation Committee complies with, any applicable requirements of The Nasdaq Stock Market and SEC rules and regulations. The Compensation Committee held seven meetings during the fiscal year ended January 31, 2021.
Our Compensation Committee oversees our compensation policies, plans and programs. Our Compensation Committee is responsible for, among other things:
• reviewing our policies, strategies and progress related to human capital management activities, including the disclosure of such activities in public filings and reports;
• reviewing periodically the succession planning for our CEO and other executive officers;
• annually reviewing and approving the primary components of compensation for our CEO and other executive officers;
• reviewing and approving compensation and corporate goals and objectives relevant to the compensation for our CEO and other executive officers;
• evaluating the performance of our CEO and other executive officers in light of established goals and objectives;
• periodically evaluating the competitiveness of the compensation of our CEO and other executive officers and our overall compensation plans;
• providing oversight of our overall compensation plans and of our 401(k) plan;
• reviewing and discussing with our management team the risks arising from our compensation policies and practices for all employees to determine if there is a reasonable likelihood of a material adverse effect on us;
• evaluating and making recommendations regarding director compensation;
• approving and overseeing compliance with any clawback policies; and
• administering our equity compensation plans for our employees and directors.
Our Compensation Committee has delegated certain day-to-day administrative and ministerial functions to our officers under our equity compensation plans and our 401(k) plan.
Compensation Committee Interlocks and Insider Participation. None of Mr. Carges, Mr. Newberry or Ms. Steele, who serves or has served during the past fiscal year as a member of our Compensation Committee, is an officer or employee of our Company. None of our executive officers currently serves, or in the past fiscal year has served, as a member of the board of directors or compensation committee of any entity that has one or more executive officers serving on our Board or Compensation Committee.
Patricia MorrisonChair
Our Nominating and Corporate Governance Committee operates under a written charter that was adopted by our Board and satisfies the applicable standards of the SEC and The Nasdaq Stock Market. A copy of the Nominating and Corporate Governance Committee Charter is available on our investor website at http://investors. splunk.com/corporate-governance.
NOMINATING AND CORPORATE GOVERNANCE COMMITTEEThe current members of our Nominating and Corporate Governance Committee are Ms. Baack, Ms. Morrison, General Via (ret) and Mr. Viswanath. Our Board has determined that each of the members of our Nominating and Corporate Governance Committee is independent within the meaning of the independence requirements of The Nasdaq Stock Market. The Nominating and Corporate Governance Committee held four meetings during the fiscal year ended January 31, 2021.
Our Nominating and Corporate Governance Committee oversees and assists our Board in reviewing and recommending corporate governance policies and nominees for election to our Board and its committees. The Nominating and Corporate Governance Committee is responsible for, among other things:
• recommending desired qualifications for Board and committee membership and conducting searches for potential members of our Board;
• evaluating and making recommendations regarding the organization and governance of our Board and its committees and changes to our Certificate of Incorporation, Bylaws, the Code and stockholder communications;
• assessing the performance of board members and making recommendations regarding committee and chair assignments and composition and the size of our Board and its committees;
• evaluating and making recommendations regarding the creation of additional committees or the change in mandate or dissolution of committees;
• reviewing and making recommendations with regard to our Corporate Governance Guidelines and compliance with laws and regulations;
• reviewing and approving conflicts of interest of our directors and corporate officers, other than related person transactions reviewed by the Audit Committee;
• providing oversight of our stockholder engagement program; and
• overseeing and reviewing our ESG activities, programs and public disclosure, including in light of any stockholder feedback.
Non-Employee Director CompensationOur non-employee director compensation program is designed to attract, retain and reward qualified non-employee directors and align the financial interests of the non-employee directors with those of our stockholders. Pursuant to this program, each member of our Board who is not our employee receives the cash and equity compensation for Board service described below. We also reimburse our non-employee directors for expenses incurred in connection with attending Board and committee meetings, assisting with other Company business, such as meeting with potential officer and director candidates, as well as continuing director education.
Our Compensation Committee has the primary responsibility for reviewing the compensation paid to our non-employee directors and making recommendations for adjustments, as appropriate, to the full Board. The Compensation Committee undertakes an annual review of the type and form of compensation paid to our non-employee directors, which includes a market assessment and analysis by Compensia. As part of this analysis, Compensia reviews non-employee director compensation trends and data from companies comprising the same executive compensation peer group used by the Compensation Committee in connection with its review of executive compensation. Following a market assessment and analysis in early fiscal 2022 by Compensia, our Board approved an increase in the award value of the annual RSU award from $250,000 to $270,000, effective as of March 11, 2021. No changes were made to the cash compensation of our non-employee directors. The Board made this change in order to continue to attract, retain and reward qualified non-employee directors, consistent with market practices and the demands placed on our Board.
Corporate Governance at SplunkCorporate Governance at Splunk

PR
OX
Y
27Splunk 2021 Proxy Statement
Stephen NewberryChair
Our Compensation Committee operates under a written charter that was adopted by our Board and satisfies the applicable standards of the SEC and The Nasdaq Stock Market. A copy of the Compensation Committee Charter is available on our investor website at http:// investors. splunk.com/ corporate-governance.
COMPENSATION COMMITTEEThe current members of our Compensation Committee are Mr. Carges, Mr. Newberry and Ms. Steele. Our Board has determined that each of the members of our Compensation Committee is independent within the meaning of the independence requirements of The Nasdaq Stock Market. Our Board also determined that the composition of our Compensation Committee meets the requirements for independence under, and the functioning of our Compensation Committee complies with, any applicable requirements of The Nasdaq Stock Market and SEC rules and regulations. The Compensation Committee held seven meetings during the fiscal year ended January 31, 2021.
Our Compensation Committee oversees our compensation policies, plans and programs. Our Compensation Committee is responsible for, among other things:
• reviewing our policies, strategies and progress related to human capital management activities, including the disclosure of such activities in public filings and reports;
• reviewing periodically the succession planning for our CEO and other executive officers;
• annually reviewing and approving the primary components of compensation for our CEO and other executive officers;
• reviewing and approving compensation and corporate goals and objectives relevant to the compensation for our CEO and other executive officers;
• evaluating the performance of our CEO and other executive officers in light of established goals and objectives;
• periodically evaluating the competitiveness of the compensation of our CEO and other executive officers and our overall compensation plans;
• providing oversight of our overall compensation plans and of our 401(k) plan;
• reviewing and discussing with our management team the risks arising from our compensation policies and practices for all employees to determine if there is a reasonable likelihood of a material adverse effect on us;
• evaluating and making recommendations regarding director compensation;
• approving and overseeing compliance with any clawback policies; and
• administering our equity compensation plans for our employees and directors.
Our Compensation Committee has delegated certain day-to-day administrative and ministerial functions to our officers under our equity compensation plans and our 401(k) plan.
Compensation Committee Interlocks and Insider Participation. None of Mr. Carges, Mr. Newberry or Ms. Steele, who serves or has served during the past fiscal year as a member of our Compensation Committee, is an officer or employee of our Company. None of our executive officers currently serves, or in the past fiscal year has served, as a member of the board of directors or compensation committee of any entity that has one or more executive officers serving on our Board or Compensation Committee.
Patricia MorrisonChair
Our Nominating and Corporate Governance Committee operates under a written charter that was adopted by our Board and satisfies the applicable standards of the SEC and The Nasdaq Stock Market. A copy of the Nominating and Corporate Governance Committee Charter is available on our investor website at http://investors. splunk.com/corporate-governance.
NOMINATING AND CORPORATE GOVERNANCE COMMITTEEThe current members of our Nominating and Corporate Governance Committee are Ms. Baack, Ms. Morrison, General Via (ret) and Mr. Viswanath. Our Board has determined that each of the members of our Nominating and Corporate Governance Committee is independent within the meaning of the independence requirements of The Nasdaq Stock Market. The Nominating and Corporate Governance Committee held four meetings during the fiscal year ended January 31, 2021.
Our Nominating and Corporate Governance Committee oversees and assists our Board in reviewing and recommending corporate governance policies and nominees for election to our Board and its committees. The Nominating and Corporate Governance Committee is responsible for, among other things:
• recommending desired qualifications for Board and committee membership and conducting searches for potential members of our Board;
• evaluating and making recommendations regarding the organization and governance of our Board and its committees and changes to our Certificate of Incorporation, Bylaws, the Code and stockholder communications;
• assessing the performance of board members and making recommendations regarding committee and chair assignments and composition and the size of our Board and its committees;
• evaluating and making recommendations regarding the creation of additional committees or the change in mandate or dissolution of committees;
• reviewing and making recommendations with regard to our Corporate Governance Guidelines and compliance with laws and regulations;
• reviewing and approving conflicts of interest of our directors and corporate officers, other than related person transactions reviewed by the Audit Committee;
• providing oversight of our stockholder engagement program; and
• overseeing and reviewing our ESG activities, programs and public disclosure, including in light of any stockholder feedback.
Non-Employee Director CompensationOur non-employee director compensation program is designed to attract, retain and reward qualified non-employee directors and align the financial interests of the non-employee directors with those of our stockholders. Pursuant to this program, each member of our Board who is not our employee receives the cash and equity compensation for Board service described below. We also reimburse our non-employee directors for expenses incurred in connection with attending Board and committee meetings, assisting with other Company business, such as meeting with potential officer and director candidates, as well as continuing director education.
Our Compensation Committee has the primary responsibility for reviewing the compensation paid to our non-employee directors and making recommendations for adjustments, as appropriate, to the full Board. The Compensation Committee undertakes an annual review of the type and form of compensation paid to our non-employee directors, which includes a market assessment and analysis by Compensia. As part of this analysis, Compensia reviews non-employee director compensation trends and data from companies comprising the same executive compensation peer group used by the Compensation Committee in connection with its review of executive compensation. Following a market assessment and analysis in early fiscal 2022 by Compensia, our Board approved an increase in the award value of the annual RSU award from $250,000 to $270,000, effective as of March 11, 2021. No changes were made to the cash compensation of our non-employee directors. The Board made this change in order to continue to attract, retain and reward qualified non-employee directors, consistent with market practices and the demands placed on our Board.
Corporate Governance at SplunkCorporate Governance at Splunk

28 Splunk 2021 Proxy Statement
Among the Highlights of Our Program:
• Periodic market assessments and analyses by the Compensation Committee’s independent compensation consultants; most recently completed assessment in fiscal 2022 indicated average non-employee director total compensation (excluding the Chair of the Board) was below the peer median.
• Equity makes up a meaningful portion of the non-employee directors’ overall compensation mix to align interests with stockholders.
• Reasonable cash retainers for leadership roles and committee membership to recognize additional time commitment.
• Stock ownership guidelines of the lesser of five times the annual Board membership cash retainer and 4,000 shares support alignment with stockholders’ interests.
• No short sales, hedging, or pledging of stock ownership positions and transactions involving derivatives of our common stock.
• No additional fees are paid for Board meeting attendance.
Cash CompensationOur non-employee directors are entitled to receive the following cash compensation for their services:
• $50,000 per year for service as a Board member;
• $25,000 per year for service as chair of the Audit Committee;
• $20,000 per year for service as chair of the Compensation Committee;
• $10,000 per year for service as a member of the Audit Committee or the Compensation Committee;
• $12,500 per year for service as chair of the Nominating and Corporate Governance Committee;
• $5,000 per year for service as a member of the Nominating and Corporate Governance Committee;
• $30,000 per year for service as Lead Independent Director; and
• $50,000 per year for service as non-executive Chair of the Board.
All cash payments to our non-employee directors are paid quarterly in arrears.
Equity CompensationInitial Award. Each non-employee director who first joins our Board automatically will be granted an initial RSU award having an award value of $350,000 on the date on which such person becomes a non-employee director (unless otherwise determined by the Board), whether through election by our stockholders or appointment by our Board to fill a vacancy. An employee director who ceases to be an employee but remains a director will not receive this initial RSU award. An initial RSU award will vest as to one-third of the shares subject to the award on each of the first three anniversaries of the grant date, subject to continued service as a member of our Board through each such vesting date.
Annual Award. During fiscal 2021 and through March 11, 2021, each then-serving non-employee director was automatically granted an RSU award having an award value of $250,000 on the date of each annual meeting of stockholders. If a non-employee director’s commencement date is other than the date of an annual meeting of stockholders, such non-employee director may be granted, on such non-employee director’s commencement date, an annual award having an award value prorated based on the number of days between such director’s commencement date and the next annual meeting of stockholders. Grants of annual RSU awards will vest as to one-fourth of the shares subject to the award on September 10, December 10, March 10 and June 10 (or our next annual meeting of stockholders if earlier), subject to continued service as a member of our Board through each such vesting date.
Discretionary Award. In addition, our Board may grant a non-employee director a discretionary supplemental equity award at any time and for any reason. No such awards were granted in fiscal 2021.
Change in Control. Under the terms of our 2012 Equity Incentive Plan, as amended (the “2012 Plan”), if the Company experiences a change in control and our non-employee director equity awards are not assumed or substituted, those awards will accelerate and become fully vested. If those awards are assumed or substituted and the director subsequently is terminated or resigns at the request of the acquiring company, those awards will accelerate and become fully vested.
Death. Under the terms of our 2012 Plan, if a non-employee director dies, 100% of such non-employee director’s outstanding equity awards will immediately vest (or 50% in the event he or she has been in service with us for less than a year.)
Fiscal 2021 Director CompensationThe following table sets forth information regarding total compensation, in accordance with our non-employee director compensation program, for each person who served as a non-employee director during the year ended January 31, 2021.
Director Name
Fees Earned or Paid in Cash
($)
Stock Awards
($)(1)(2)Total
($)
Sara Baack 55,000 301,960 356,960
Sean Boyle 25,924 (3) 613,591 (4) 639,515
Mark Carges 60,000 301,960 361,960
John Connors(5) 75,000 301,960 376,960
Patricia Morrison 72,500 301,960 374,460
Stephen Newberry 70,000 301,960 371,960
Graham Smith 110,000 301,960 411,960
Elisa Steele 60,000 301,960 361,960
General Dennis Via 11,005 (6) 474,582 (7) 485,587
Sri Viswanath 55,000 301,960 356,960
(1) The amounts reported in this column reflect the aggregate grant date fair value of the RSUs granted to our non-employee directors during fiscal 2021 as computed in accordance with Financial Accounting Standards Board Accounting Standards Codification Topic 718 (“ASC Topic 718”). These amounts do not necessarily correspond to the actual value recognized by the non-employee directors. The assumptions used in the valuation of these awards are consistent with the valuation methodologies specified in the notes to our consolidated financial statements included in our Annual Report on Form 10-K for the fiscal year ended January 31, 2021.
(2) Other than Mr. Boyle and General Via (ret), each non-employee director was granted an award of 1,738 RSUs on June 11, 2020, with a grant date fair value of $301,960. Twenty-five percent of the RSUs vest on each of September 10, 2020, December 10, 2020, March 10, 2021 and June 10, 2021 (or the next annual meeting of stockholders if earlier), subject to the director’s continued service through such date.
(3) Mr. Boyle was appointed to our Board effective August 26, 2020, and his Board and committee fees were prorated based on the number of days he served as a director or committee member, in fiscal 2021.
(4) Mr. Boyle was granted an initial award of 1,775 RSUs on August 26, 2020, with a grant date fair value of $384,714, one-third of these RSUs will vest each year over three years following the date of grant, subject to his continued service as a director through each such vesting date. Mr. Boyle was granted an additional prorated annual award of 1,056 RSUs on August 26, 2020 with a grant date fair value of $228,877. The RSUs subject to this award will vest on the day prior to the Annual Meeting.
(5) Mr. Connors resigned from our Board effective May 1, 2021. Upon his resignation date, Mr. Connors forfeited any unvested RSUs.(6) General Via (ret) was appointed to our Board effective November 12, 2020, and his Board fees were prorated based on the number of days he served as a
director in fiscal 2021.(7) General Via (ret) was granted an initial award of 1,749 RSUs on November 12, 2020, with a grant date fair value of $335,371, one-third of these RSUs will vest each
year over three years following the date of grant, subject to his continued service as a director through each such date. General Via (ret) was granted an additional prorated annual award of 726 RSUs on November 12, 2020 with a grant date fair value of $139,211. The RSUs subject to this award will vest on the day prior to the Annual Meeting.
Corporate Governance at SplunkCorporate Governance at Splunk

PR
OX
Y
29Splunk 2021 Proxy Statement
Among the Highlights of Our Program:
• Periodic market assessments and analyses by the Compensation Committee’s independent compensation consultants; most recently completed assessment in fiscal 2022 indicated average non-employee director total compensation (excluding the Chair of the Board) was below the peer median.
• Equity makes up a meaningful portion of the non-employee directors’ overall compensation mix to align interests with stockholders.
• Reasonable cash retainers for leadership roles and committee membership to recognize additional time commitment.
• Stock ownership guidelines of the lesser of five times the annual Board membership cash retainer and 4,000 shares support alignment with stockholders’ interests.
• No short sales, hedging, or pledging of stock ownership positions and transactions involving derivatives of our common stock.
• No additional fees are paid for Board meeting attendance.
Cash CompensationOur non-employee directors are entitled to receive the following cash compensation for their services:
• $50,000 per year for service as a Board member;
• $25,000 per year for service as chair of the Audit Committee;
• $20,000 per year for service as chair of the Compensation Committee;
• $10,000 per year for service as a member of the Audit Committee or the Compensation Committee;
• $12,500 per year for service as chair of the Nominating and Corporate Governance Committee;
• $5,000 per year for service as a member of the Nominating and Corporate Governance Committee;
• $30,000 per year for service as Lead Independent Director; and
• $50,000 per year for service as non-executive Chair of the Board.
All cash payments to our non-employee directors are paid quarterly in arrears.
Equity CompensationInitial Award. Each non-employee director who first joins our Board automatically will be granted an initial RSU award having an award value of $350,000 on the date on which such person becomes a non-employee director (unless otherwise determined by the Board), whether through election by our stockholders or appointment by our Board to fill a vacancy. An employee director who ceases to be an employee but remains a director will not receive this initial RSU award. An initial RSU award will vest as to one-third of the shares subject to the award on each of the first three anniversaries of the grant date, subject to continued service as a member of our Board through each such vesting date.
Annual Award. During fiscal 2021 and through March 11, 2021, each then-serving non-employee director was automatically granted an RSU award having an award value of $250,000 on the date of each annual meeting of stockholders. If a non-employee director’s commencement date is other than the date of an annual meeting of stockholders, such non-employee director may be granted, on such non-employee director’s commencement date, an annual award having an award value prorated based on the number of days between such director’s commencement date and the next annual meeting of stockholders. Grants of annual RSU awards will vest as to one-fourth of the shares subject to the award on September 10, December 10, March 10 and June 10 (or our next annual meeting of stockholders if earlier), subject to continued service as a member of our Board through each such vesting date.
Discretionary Award. In addition, our Board may grant a non-employee director a discretionary supplemental equity award at any time and for any reason. No such awards were granted in fiscal 2021.
Change in Control. Under the terms of our 2012 Equity Incentive Plan, as amended (the “2012 Plan”), if the Company experiences a change in control and our non-employee director equity awards are not assumed or substituted, those awards will accelerate and become fully vested. If those awards are assumed or substituted and the director subsequently is terminated or resigns at the request of the acquiring company, those awards will accelerate and become fully vested.
Death. Under the terms of our 2012 Plan, if a non-employee director dies, 100% of such non-employee director’s outstanding equity awards will immediately vest (or 50% in the event he or she has been in service with us for less than a year.)
Fiscal 2021 Director CompensationThe following table sets forth information regarding total compensation, in accordance with our non-employee director compensation program, for each person who served as a non-employee director during the year ended January 31, 2021.
Director Name
Fees Earned or Paid in Cash
($)
Stock Awards
($)(1)(2)Total
($)
Sara Baack 55,000 301,960 356,960
Sean Boyle 25,924 (3) 613,591 (4) 639,515
Mark Carges 60,000 301,960 361,960
John Connors(5) 75,000 301,960 376,960
Patricia Morrison 72,500 301,960 374,460
Stephen Newberry 70,000 301,960 371,960
Graham Smith 110,000 301,960 411,960
Elisa Steele 60,000 301,960 361,960
General Dennis Via 11,005 (6) 474,582 (7) 485,587
Sri Viswanath 55,000 301,960 356,960
(1) The amounts reported in this column reflect the aggregate grant date fair value of the RSUs granted to our non-employee directors during fiscal 2021 as computed in accordance with Financial Accounting Standards Board Accounting Standards Codification Topic 718 (“ASC Topic 718”). These amounts do not necessarily correspond to the actual value recognized by the non-employee directors. The assumptions used in the valuation of these awards are consistent with the valuation methodologies specified in the notes to our consolidated financial statements included in our Annual Report on Form 10-K for the fiscal year ended January 31, 2021.
(2) Other than Mr. Boyle and General Via (ret), each non-employee director was granted an award of 1,738 RSUs on June 11, 2020, with a grant date fair value of $301,960. Twenty-five percent of the RSUs vest on each of September 10, 2020, December 10, 2020, March 10, 2021 and June 10, 2021 (or the next annual meeting of stockholders if earlier), subject to the director’s continued service through such date.
(3) Mr. Boyle was appointed to our Board effective August 26, 2020, and his Board and committee fees were prorated based on the number of days he served as a director or committee member, in fiscal 2021.
(4) Mr. Boyle was granted an initial award of 1,775 RSUs on August 26, 2020, with a grant date fair value of $384,714, one-third of these RSUs will vest each year over three years following the date of grant, subject to his continued service as a director through each such vesting date. Mr. Boyle was granted an additional prorated annual award of 1,056 RSUs on August 26, 2020 with a grant date fair value of $228,877. The RSUs subject to this award will vest on the day prior to the Annual Meeting.
(5) Mr. Connors resigned from our Board effective May 1, 2021. Upon his resignation date, Mr. Connors forfeited any unvested RSUs.(6) General Via (ret) was appointed to our Board effective November 12, 2020, and his Board fees were prorated based on the number of days he served as a
director in fiscal 2021.(7) General Via (ret) was granted an initial award of 1,749 RSUs on November 12, 2020, with a grant date fair value of $335,371, one-third of these RSUs will vest each
year over three years following the date of grant, subject to his continued service as a director through each such date. General Via (ret) was granted an additional prorated annual award of 726 RSUs on November 12, 2020 with a grant date fair value of $139,211. The RSUs subject to this award will vest on the day prior to the Annual Meeting.
Corporate Governance at SplunkCorporate Governance at Splunk

30 Splunk 2021 Proxy Statement
As of January 31, 2021, each individual who served as a non-employee director during fiscal 2021 held the following aggregate number of shares subject to outstanding RSUs:
Director Name
Aggregate Number of Stock Awards
Outstanding as of January 31, 2021
Sara Baack 869
Sean Boyle 2,831
Mark Carges 869
John Connors 869
Patricia Morrison 869
Stephen Newberry 869
Graham Smith 869
Elisa Steele 869
General Dennis Via 2,475
Sri Viswanath 2,631
Stock Ownership GuidelinesOur Board believes that our directors and executive officers should hold a meaningful financial stake in the Company in order to further align their interests with those of our stockholders. To promote this belief, our Board adopted stock ownership guidelines requiring our non-employee directors to achieve certain stock ownership levels within five years of the later of September 13, 2018 or such non-employee director’s appointment or election date, as applicable. The current stock ownership guidelines are set forth below:
• Each non-employee director must own the lesser of (i) Company stock with a value of five times the annual cash retainer for Board service and (ii) 4,000 shares.
As of the end of fiscal 2021, all of our directors met, exceeded, or are on track to meet, these guidelines based on their current rate of stock accumulations in the time frames set out in the guidelines.
See “Executive Compensation—Compensation Discussion and Analysis—Other Compensation Policies and Information—Stock Ownership Guidelines” for information about the guidelines applicable to our executive officers.
Stockholder EngagementWe believe that effective corporate governance includes regular, constructive conversations with our stockholders on a broad range of governance and business topics, including business strategy and execution, Board refreshment, executive compensation practices, risk oversight, ESG, culture and human capital management. Stockholders provide valuable insights into emerging issues and feedback on our related programs. We believe that ongoing engagement builds mutual trust and understanding with our stockholders and is essential to our long-term success.
We Reached out to Institutional Stockholders
Representing:
We Engaged with Institutional Stockholders
Representing:
73%of Shares
Outstanding
25%of Shares
Outstanding
In general, our stockholders have a long-term outlook and understand that we are currently in a dynamic, high-growth phase and have historically faced a talent war. We received positive feedback on our compensation and corporate governance practices. Feedback was provided to the relevant committees and the full Board. See “Executive Compensation—Compensation Discussion and Analysis—Executive Summary—Stockholder Engagement and Our 2020 Say-on-Pay Vote” for stockholder feedback on our executive compensation program.
Annual Stockholder Engagement Cycle
SUMMER
We review the results of the annual meeting, together with governance trends and best practices, and regulatory developments. We start preparing our agenda for engagement in the fall. FALL
We speak with our major stockholders and others who request meetings about significant governance and executive compensation changes, ESG updates, and other developments at the Company. We solicit feedback on topics that are important to them.
SPRING
We publish our proxy statement and annual report to our stockholders. We reach out to our major stockholders and speak with those wanting to engage about important topics to be addressed at our annual meeting. Stockholders vote on election of directors, executive compensation, ratification of our auditors, and such other matters as may arise at our annual meeting.
WINTER
We communicate to the Board and its committees any feedback received and consider those perspectives in upcoming governance and executive compensation discussions. We consider disclosure enhancements.
Corporate Governance at SplunkCorporate Governance at Splunk

PR
OX
Y
31Splunk 2021 Proxy Statement
As of January 31, 2021, each individual who served as a non-employee director during fiscal 2021 held the following aggregate number of shares subject to outstanding RSUs:
Director Name
Aggregate Number of Stock Awards
Outstanding as of January 31, 2021
Sara Baack 869
Sean Boyle 2,831
Mark Carges 869
John Connors 869
Patricia Morrison 869
Stephen Newberry 869
Graham Smith 869
Elisa Steele 869
General Dennis Via 2,475
Sri Viswanath 2,631
Stock Ownership GuidelinesOur Board believes that our directors and executive officers should hold a meaningful financial stake in the Company in order to further align their interests with those of our stockholders. To promote this belief, our Board adopted stock ownership guidelines requiring our non-employee directors to achieve certain stock ownership levels within five years of the later of September 13, 2018 or such non-employee director’s appointment or election date, as applicable. The current stock ownership guidelines are set forth below:
• Each non-employee director must own the lesser of (i) Company stock with a value of five times the annual cash retainer for Board service and (ii) 4,000 shares.
As of the end of fiscal 2021, all of our directors met, exceeded, or are on track to meet, these guidelines based on their current rate of stock accumulations in the time frames set out in the guidelines.
See “Executive Compensation—Compensation Discussion and Analysis—Other Compensation Policies and Information—Stock Ownership Guidelines” for information about the guidelines applicable to our executive officers.
Stockholder EngagementWe believe that effective corporate governance includes regular, constructive conversations with our stockholders on a broad range of governance and business topics, including business strategy and execution, Board refreshment, executive compensation practices, risk oversight, ESG, culture and human capital management. Stockholders provide valuable insights into emerging issues and feedback on our related programs. We believe that ongoing engagement builds mutual trust and understanding with our stockholders and is essential to our long-term success.
We Reached out to Institutional Stockholders
Representing:
We Engaged with Institutional Stockholders
Representing:
73%of Shares
Outstanding
25%of Shares
Outstanding
In general, our stockholders have a long-term outlook and understand that we are currently in a dynamic, high-growth phase and have historically faced a talent war. We received positive feedback on our compensation and corporate governance practices. Feedback was provided to the relevant committees and the full Board. See “Executive Compensation—Compensation Discussion and Analysis—Executive Summary—Stockholder Engagement and Our 2020 Say-on-Pay Vote” for stockholder feedback on our executive compensation program.
Annual Stockholder Engagement Cycle
SUMMER
We review the results of the annual meeting, together with governance trends and best practices, and regulatory developments. We start preparing our agenda for engagement in the fall. FALL
We speak with our major stockholders and others who request meetings about significant governance and executive compensation changes, ESG updates, and other developments at the Company. We solicit feedback on topics that are important to them.
SPRING
We publish our proxy statement and annual report to our stockholders. We reach out to our major stockholders and speak with those wanting to engage about important topics to be addressed at our annual meeting. Stockholders vote on election of directors, executive compensation, ratification of our auditors, and such other matters as may arise at our annual meeting.
WINTER
We communicate to the Board and its committees any feedback received and consider those perspectives in upcoming governance and executive compensation discussions. We consider disclosure enhancements.
Corporate Governance at SplunkCorporate Governance at Splunk

32 Splunk 2021 Proxy Statement
Stockholder Communications with the BoardWe have a practice of regularly engaging with stockholders to seek their feedback. Stockholders may also communicate with the Board or with an individual member of the Board by writing to the Board or to the particular member of the Board and mailing the correspondence to: c/o Corporate Secretary, Splunk Inc., 270 Brannan Street, San Francisco, California 94107. All such stockholder communications will be reviewed initially by our Corporate Secretary or the Legal Department and, if appropriate, will be forwarded to the appropriate member or members of the Board, or if none is specified, to the Chair of the Board. This process assists the Board in reviewing and responding to stockholder communications in an appropriate manner. The Corporate Secretary reports regularly to the Nominating and Corporate Governance Committee on all correspondence received that, in their opinion, involves functions of the Board or its committees or that they otherwise determine merits Board attention.
ESG Oversight and HighlightsThe Board believes operating sustainably benefits the Company’s many different stakeholders and drives long-term value creation. We believe that data can deliver clarity, accelerate positive change, strengthen and lift up communities, and create a more just world. We work to conduct our business in ways that are principled, transparent and accountable to our stakeholders. We focus our efforts where we can have the most positive impact on our business stakeholders and communities and are committed to effectively govern and manage the environmental and social risks and opportunities that arise from our core business strategy.
Oversight of ESGGeneral oversight of our ESG strategy and reporting is the responsibility of the Nominating and Corporate Governance Committee. The other Board committees, as well as the full Board, oversee ESG issues associated with their respective areas of responsibility. For example, oversight of Splunk’s enterprise risk management framework and cybersecurity and other information technology risks is the responsibility of the Audit Committee. Oversight of a range of human capital management activities, including talent management and development, talent acquisition, employee engagement and diversity, equity and inclusion, is the responsibility of the Compensation Committee.
Our ESG Pillars and HighlightsIn fiscal 2021, we released our first ESG update (“ESG Update”) to provide transparency and outline our aspirations in critical areas, establishing a benchmark for progress over time. The ESG Update highlights how we are working to address our ESG priorities in the three core areas of Data Privacy and Security, Inclusive and Ethical Growth and Societal Impact. Our stakeholders expressed significant interest in these topics, and they also represent the areas where we believe we have the ability to drive the most change.
Data Privacy and Security
Inclusive and Ethical Growth
Societal Impact
We know how important robust data privacy and security practices are to any successful business. That’s why we invest in governance and technology to protect the data entrusted to us.
• Our Data Protection Officer is responsible for overseeing compliance with the legal requirements related to our collection and use of data entrusted to us.
• Our Chief Information and Security Officer is responsible for overseeing Splunk’s information security practices and programs.
• With cloud driving our next phase of growth, we intend to continue investing in security, compliance and monitoring to ensure the protection of data entrusted to us. We expect these to include continued implementation of incremental security, process and data controls across our technology infrastructure and deployment of additional security tools and security layers.
We understand our responsibility extends to all our stakeholders. Business today requires going beyond compliance. As we continue to grow, we’re committed to building and sustaining a culture of inclusion and ethical responsibility.
• We focus on hiring, retaining and promoting diverse talent through the organization at all levels and have published our results in our first in-depth Diversity & Inclusion Annual Report.
• We documented our Commitment to Racial Equity and Social Justice for All, signed by our executive staff, reinforcing that racism and social injustice have no place at Splunk.
• We are actively enhancing our procurement program with a focus on inclusive and environmentally conscious suppliers.
We remain more convinced than ever that data is a key component of addressing the world’s most complex and pressing social and environmental challenges. We will continue to leverage our technology and talent to find solutions to these challenges.
• We launched a $50 million Splunk Social Impact Venture fund focused on accelerating the growth of companies that are using data to improve society, solve problems and promote positive change.
• We began calculating our greenhouse gas emissions and water footprint to understand the most significant impact of our operations in fiscal 2020.
• Looking forward, we will continue to take a holistic approach to our work and ensure that our programs and services are driven through collaboration across sectors and bridge the gap to help close the data divide.
For more information please see our ESG Update (available at: https://www.splunk.com/en_us/about-us/esg-overview.html). The contents of our ESG Update are referenced for general information only and are not incorporated by reference in this proxy statement.
Corporate Governance at SplunkCorporate Governance at Splunk

PR
OX
Y
33Splunk 2021 Proxy Statement
Stockholder Communications with the BoardWe have a practice of regularly engaging with stockholders to seek their feedback. Stockholders may also communicate with the Board or with an individual member of the Board by writing to the Board or to the particular member of the Board and mailing the correspondence to: c/o Corporate Secretary, Splunk Inc., 270 Brannan Street, San Francisco, California 94107. All such stockholder communications will be reviewed initially by our Corporate Secretary or the Legal Department and, if appropriate, will be forwarded to the appropriate member or members of the Board, or if none is specified, to the Chair of the Board. This process assists the Board in reviewing and responding to stockholder communications in an appropriate manner. The Corporate Secretary reports regularly to the Nominating and Corporate Governance Committee on all correspondence received that, in their opinion, involves functions of the Board or its committees or that they otherwise determine merits Board attention.
ESG Oversight and HighlightsThe Board believes operating sustainably benefits the Company’s many different stakeholders and drives long-term value creation. We believe that data can deliver clarity, accelerate positive change, strengthen and lift up communities, and create a more just world. We work to conduct our business in ways that are principled, transparent and accountable to our stakeholders. We focus our efforts where we can have the most positive impact on our business stakeholders and communities and are committed to effectively govern and manage the environmental and social risks and opportunities that arise from our core business strategy.
Oversight of ESGGeneral oversight of our ESG strategy and reporting is the responsibility of the Nominating and Corporate Governance Committee. The other Board committees, as well as the full Board, oversee ESG issues associated with their respective areas of responsibility. For example, oversight of Splunk’s enterprise risk management framework and cybersecurity and other information technology risks is the responsibility of the Audit Committee. Oversight of a range of human capital management activities, including talent management and development, talent acquisition, employee engagement and diversity, equity and inclusion, is the responsibility of the Compensation Committee.
Our ESG Pillars and HighlightsIn fiscal 2021, we released our first ESG update (“ESG Update”) to provide transparency and outline our aspirations in critical areas, establishing a benchmark for progress over time. The ESG Update highlights how we are working to address our ESG priorities in the three core areas of Data Privacy and Security, Inclusive and Ethical Growth and Societal Impact. Our stakeholders expressed significant interest in these topics, and they also represent the areas where we believe we have the ability to drive the most change.
Data Privacy and Security
Inclusive and Ethical Growth
Societal Impact
We know how important robust data privacy and security practices are to any successful business. That’s why we invest in governance and technology to protect the data entrusted to us.
• Our Data Protection Officer is responsible for overseeing compliance with the legal requirements related to our collection and use of data entrusted to us.
• Our Chief Information and Security Officer is responsible for overseeing Splunk’s information security practices and programs.
• With cloud driving our next phase of growth, we intend to continue investing in security, compliance and monitoring to ensure the protection of data entrusted to us. We expect these to include continued implementation of incremental security, process and data controls across our technology infrastructure and deployment of additional security tools and security layers.
We understand our responsibility extends to all our stakeholders. Business today requires going beyond compliance. As we continue to grow, we’re committed to building and sustaining a culture of inclusion and ethical responsibility.
• We focus on hiring, retaining and promoting diverse talent through the organization at all levels and have published our results in our first in-depth Diversity & Inclusion Annual Report.
• We documented our Commitment to Racial Equity and Social Justice for All, signed by our executive staff, reinforcing that racism and social injustice have no place at Splunk.
• We are actively enhancing our procurement program with a focus on inclusive and environmentally conscious suppliers.
We remain more convinced than ever that data is a key component of addressing the world’s most complex and pressing social and environmental challenges. We will continue to leverage our technology and talent to find solutions to these challenges.
• We launched a $50 million Splunk Social Impact Venture fund focused on accelerating the growth of companies that are using data to improve society, solve problems and promote positive change.
• We began calculating our greenhouse gas emissions and water footprint to understand the most significant impact of our operations in fiscal 2020.
• Looking forward, we will continue to take a holistic approach to our work and ensure that our programs and services are driven through collaboration across sectors and bridge the gap to help close the data divide.
For more information please see our ESG Update (available at: https://www.splunk.com/en_us/about-us/esg-overview.html). The contents of our ESG Update are referenced for general information only and are not incorporated by reference in this proxy statement.
Corporate Governance at SplunkCorporate Governance at Splunk

34 Splunk 2021 Proxy Statement
Other Governance Policies and Practices
Related Party and Other Transactions
Policies and Procedures for Related Party TransactionsThe Audit Committee of our Board has the primary responsibility for reviewing and approving or ratifying transactions with related parties. We have adopted a formal written policy providing that related parties, which includes our executive officers, directors, nominees for election as directors, beneficial owners of more than 5% of any class of our common stock, and any member of the immediate family of any of the foregoing persons, are not permitted to enter into a related party transaction with us, other than certain standing pre-approved transactions under the policy, without the prior consent of our Audit Committee.
In approving or rejecting any such proposal, our Audit Committee considers the relevant facts and circumstances available and deemed relevant to our Audit Committee, including, but not limited to, whether the transaction is on terms no less favorable than terms generally available to an unaffiliated third party under the same or similar circumstances, the extent of the related party’s interest in the transaction and their involvement in the transaction, if any.
In the event we become aware of a related party transaction that was not previously approved or ratified under the policy, our Audit Committee will evaluate all options available, including whether to ratify, amend, terminate, rescind or take other action as appropriate.
From time to time, we engage in ordinary course commercial transactions with other entities whose officers or directors are also directors of the Company, whose directors are officers of the Company, or whose officers or directors are immediate family members of an officer or director of the Company. Such transactions are conducted on an arm’s-length basis and our related parties do not have a material interest in such transactions. The Audit Committee has adopted standing pre-approvals under the policy for these and certain other transactions that do not create or involve a direct or indirect material interest.
Since the beginning of our last fiscal year, there were no related person transactions, and there are not currently any proposed related person transactions, that would require disclosure under the SEC rules.
Employment Arrangements and Indemnification AgreementsWe have entered into employment arrangements with certain current executive officers. See “Executive Compensation—Compensation Tables—Executive Employment Arrangements.”
We have also entered into indemnification agreements with certain directors and officers. The indemnification agreements and our Certificate of Incorporation and Bylaws require us to indemnify our directors and officers to the fullest extent permitted by Delaware law.
Anti-Hedging and Anti-Pledging Policy; Stock Trading PracticesWe maintain an Insider Trading Policy that, among other things, prohibits our officers, directors and employees from trading during quarterly and special blackout periods. We also prohibit all employees and directors, certain partners with access to confidential information and third parties identified from time to time by our Insider Trading Compliance Officer from engaging in short sales, hedging, swaps, exchange funds and similar transactions designed to decrease the risks associated with holding the Company’s securities, as well as pledging the Company’s securities as collateral for loans and transactions involving derivative securities relating to our common stock. None of the Company’s subsidiaries have publicly traded equity securities. Our Insider Trading Policy requires all directors, the CEO, Section 16 officers and employees identified by the Insider Trading Compliance Officer to obtain written pre-clearance from the Insider Trading Compliance Officer or his or her designee prior to buying, selling, or engaging in any other transaction in the Company’s securities.
Further, we have adopted Rule 10b5-1 Trading Plan Guidelines that permit our directors and certain employees to adopt Rule 10b5-1 trading plans (“10b5-1 plans”). Under our 10b5-1 Trading Plan Guidelines, 10b5-1 plans may only be adopted or modified during an open trading window under our Insider Trading Policy and only when such individual does not otherwise possess material nonpublic information about the Company. The first trade under a 10b5-1 plan may not occur until the completion of the next quarterly blackout period following the adoption or modification of the 10b5-1 plan, as applicable.
Audit Committee Matters
PR
OP
OS
AL
2 Ratification of Appointment of Independent Registered Public Accounting FirmThe Board recommends a vote “FOR” the Ratification of the Appointment of PricewaterhouseCoopers LLP as our Independent Registered Public Accounting Firm for the fiscal year ending January 31, 2022.
The Audit Committee of the Board has appointed PricewaterhouseCoopers LLP (“PwC”), independent registered public accountants, to audit our financial statements for the fiscal year ending January 31, 2022. During our fiscal year ended January 31, 2021, PwC served as our independent registered public accounting firm.
Notwithstanding its selection and even if our stockholders ratify the selection, our Audit Committee, in its discretion, may appoint another independent registered public accounting firm at any time during the year if the Audit Committee believes that such a change would be in the best interests of Splunk and its stockholders. At the Annual Meeting, the stockholders are being asked to ratify the appointment of PwC as our independent registered public accounting firm for the fiscal year ending January 31, 2022. Our Audit Committee is submitting the selection of PwC to our stockholders because we value our stockholders’ views on our independent registered public accounting firm and as a matter of good corporate governance. Representatives of PwC will be present at the Annual Meeting, and they will have an opportunity to make statements and will be available to respond to appropriate questions from stockholders.
The ratification of the appointment of PwC must receive the affirmative vote of at least a majority of the shares present in person (virtually) or by proxy at the meeting and entitled to vote thereon to be approved. Abstentions are considered votes cast and thus will have the same effect as votes “Against” the proposal. Broker non-votes will have no effect on the outcome of the vote. If the stockholders do not ratify the appointment of PwC, the Board or Audit Committee will reconsider the appointment.
Corporate Governance at Splunk

PR
OX
Y
35Splunk 2021 Proxy Statement
Other Governance Policies and Practices
Related Party and Other Transactions
Policies and Procedures for Related Party TransactionsThe Audit Committee of our Board has the primary responsibility for reviewing and approving or ratifying transactions with related parties. We have adopted a formal written policy providing that related parties, which includes our executive officers, directors, nominees for election as directors, beneficial owners of more than 5% of any class of our common stock, and any member of the immediate family of any of the foregoing persons, are not permitted to enter into a related party transaction with us, other than certain standing pre-approved transactions under the policy, without the prior consent of our Audit Committee.
In approving or rejecting any such proposal, our Audit Committee considers the relevant facts and circumstances available and deemed relevant to our Audit Committee, including, but not limited to, whether the transaction is on terms no less favorable than terms generally available to an unaffiliated third party under the same or similar circumstances, the extent of the related party’s interest in the transaction and their involvement in the transaction, if any.
In the event we become aware of a related party transaction that was not previously approved or ratified under the policy, our Audit Committee will evaluate all options available, including whether to ratify, amend, terminate, rescind or take other action as appropriate.
From time to time, we engage in ordinary course commercial transactions with other entities whose officers or directors are also directors of the Company, whose directors are officers of the Company, or whose officers or directors are immediate family members of an officer or director of the Company. Such transactions are conducted on an arm’s-length basis and our related parties do not have a material interest in such transactions. The Audit Committee has adopted standing pre-approvals under the policy for these and certain other transactions that do not create or involve a direct or indirect material interest.
Since the beginning of our last fiscal year, there were no related person transactions, and there are not currently any proposed related person transactions, that would require disclosure under the SEC rules.
Employment Arrangements and Indemnification AgreementsWe have entered into employment arrangements with certain current executive officers. See “Executive Compensation—Compensation Tables—Executive Employment Arrangements.”
We have also entered into indemnification agreements with certain directors and officers. The indemnification agreements and our Certificate of Incorporation and Bylaws require us to indemnify our directors and officers to the fullest extent permitted by Delaware law.
Anti-Hedging and Anti-Pledging Policy; Stock Trading PracticesWe maintain an Insider Trading Policy that, among other things, prohibits our officers, directors and employees from trading during quarterly and special blackout periods. We also prohibit all employees and directors, certain partners with access to confidential information and third parties identified from time to time by our Insider Trading Compliance Officer from engaging in short sales, hedging, swaps, exchange funds and similar transactions designed to decrease the risks associated with holding the Company’s securities, as well as pledging the Company’s securities as collateral for loans and transactions involving derivative securities relating to our common stock. None of the Company’s subsidiaries have publicly traded equity securities. Our Insider Trading Policy requires all directors, the CEO, Section 16 officers and employees identified by the Insider Trading Compliance Officer to obtain written pre-clearance from the Insider Trading Compliance Officer or his or her designee prior to buying, selling, or engaging in any other transaction in the Company’s securities.
Further, we have adopted Rule 10b5-1 Trading Plan Guidelines that permit our directors and certain employees to adopt Rule 10b5-1 trading plans (“10b5-1 plans”). Under our 10b5-1 Trading Plan Guidelines, 10b5-1 plans may only be adopted or modified during an open trading window under our Insider Trading Policy and only when such individual does not otherwise possess material nonpublic information about the Company. The first trade under a 10b5-1 plan may not occur until the completion of the next quarterly blackout period following the adoption or modification of the 10b5-1 plan, as applicable.
Audit Committee Matters
PR
OP
OS
AL
2 Ratification of Appointment of Independent Registered Public Accounting FirmThe Board recommends a vote “FOR” the Ratification of the Appointment of PricewaterhouseCoopers LLP as our Independent Registered Public Accounting Firm for the fiscal year ending January 31, 2022.
The Audit Committee of the Board has appointed PricewaterhouseCoopers LLP (“PwC”), independent registered public accountants, to audit our financial statements for the fiscal year ending January 31, 2022. During our fiscal year ended January 31, 2021, PwC served as our independent registered public accounting firm.
Notwithstanding its selection and even if our stockholders ratify the selection, our Audit Committee, in its discretion, may appoint another independent registered public accounting firm at any time during the year if the Audit Committee believes that such a change would be in the best interests of Splunk and its stockholders. At the Annual Meeting, the stockholders are being asked to ratify the appointment of PwC as our independent registered public accounting firm for the fiscal year ending January 31, 2022. Our Audit Committee is submitting the selection of PwC to our stockholders because we value our stockholders’ views on our independent registered public accounting firm and as a matter of good corporate governance. Representatives of PwC will be present at the Annual Meeting, and they will have an opportunity to make statements and will be available to respond to appropriate questions from stockholders.
The ratification of the appointment of PwC must receive the affirmative vote of at least a majority of the shares present in person (virtually) or by proxy at the meeting and entitled to vote thereon to be approved. Abstentions are considered votes cast and thus will have the same effect as votes “Against” the proposal. Broker non-votes will have no effect on the outcome of the vote. If the stockholders do not ratify the appointment of PwC, the Board or Audit Committee will reconsider the appointment.
Corporate Governance at Splunk

36 Splunk 2021 Proxy Statement
Report of the Audit CommitteeThe Audit Committee is a committee of the Board comprised solely of independent directors, as required by the listing standards of The Nasdaq Stock Market and rules of the SEC. The Audit Committee operates under a written charter approved by the Board, which is available on our investor website at http://investors.splunk.com/corporate-governance. The composition of the Audit Committee, the attributes of its members and the responsibilities of the Audit Committee, as reflected in its charter, are intended to comply with applicable requirements for corporate audit committees. The Audit Committee reviews and assesses the adequacy of its charter and the Audit Committee’s performance on an annual basis.
As of the date this report was approved, the Audit Committee consisted of four members: Sean Boyle, John Connors, Patricia Morrison, and Graham Smith. Mr. Boyle, Mr. Connors and Mr. Smith are “audit committee financial experts” as defined under SEC rules and regulations. With respect to the Company’s financial reporting process, the management of the Company is responsible for (1) establishing and maintaining internal controls and (2) preparing the Company’s consolidated financial statements. PwC is responsible for auditing these financial statements. It is the responsibility of the Audit Committee to oversee these activities. It is not the responsibility of the Audit Committee to prepare or certify the Company’s financial statements or guarantee the audits or reports of PwC. These are the fundamental responsibilities of management and PwC. In the performance of its oversight function, the Audit Committee has:
• reviewed and discussed the audited financial statements with management and PwC;
• discussed with PwC the applicable requirements of the Public Company Accounting Oversight Board; and
• received the written disclosures and the letter from PwC required by applicable requirements of the Public Company Accounting Oversight Board regarding PwC’s communications with the Audit Committee concerning independence, and has discussed with PwC its independence
Based on the Audit Committee’s review and discussions with management and PwC, the Audit Committee recommended to the Board that the audited financial statements be included in the Annual Report on Form 10-K for the fiscal year ended January 31, 2021 for filing with the SEC.
Respectfully submitted by the members of the Audit Committee of the Board:
Sean Boyle (Chair)John Connors(1) Patricia Morrison Graham Smith
(1) Mr. Connors resigned from the Board effective May 1, 2021.
Fees Paid to the Independent Registered Public Accounting FirmThe following table presents fees for professional audit services and other services rendered to us by PwC for the fiscal years ended January 31, 2020 and 2021. All fees were pre-approved by the Audit Committee in accordance with the policy described below.
2020($)
2021($)
Audit Fees(1) 4,011,196 4,626,990
Audit-Related Fees — —
Tax Fees(2) 852,659 968,767
All Other Fees(3) 3,870 152,870
Total: 4,867,725 5,748,626
(1) Audit fees consist of fees for professional services provided in connection with the integrated audit of our annual financial statements, management’s report on internal controls, the review of our quarterly consolidated financial statements, and audit services that are normally provided by independent registered public accounting firms in connection with statutory and regulatory filings or engagements for those fiscal years, such as statutory audits.
(2) Tax fees consist of fees billed for tax compliance, consultation and planning services.(3) All other fees consist of fees billed for access to online accounting and tax research software. These fees include ERP system implementation for the fiscal year
ended January 31, 2021.
Audit Committee Policy on Pre-Approval of Audit and Permissible Non-Audit Services of Independent Registered Public Accounting FirmConsistent with requirements of the SEC and the Public Company Accounting Oversight Board, regarding auditor independence, our Audit Committee is responsible for the appointment, compensation and oversight of the work of our independent registered public accounting firm. In recognition of this responsibility, our Audit Committee has established a policy for the pre-approval of all audit and permissible non-audit services provided by the independent registered public accounting firm. These services may include audit services, audit-related services, tax services and other services.
Before engagement of the independent registered public accounting firm for the next year’s audit, the independent registered public accounting firm submits a description of services expected to be rendered during that year to the Audit Committee for approval.
The Audit Committee pre-approves particular services or categories of services on a case-by-case basis. The fees are budgeted, and the Audit Committee requires the independent registered public accounting firm and our management team to report actual fees versus budgeted fees periodically throughout the year by category of service. During the year, circumstances may arise when it may become necessary to engage the independent registered public accounting firm for additional services not contemplated in the original pre-approval. In those instances, the services must be pre-approved by the Audit Committee before the independent registered public accounting firm is engaged.
Audit Committee MattersAudit Committee Matters

PR
OX
Y
37Splunk 2021 Proxy Statement
Report of the Audit CommitteeThe Audit Committee is a committee of the Board comprised solely of independent directors, as required by the listing standards of The Nasdaq Stock Market and rules of the SEC. The Audit Committee operates under a written charter approved by the Board, which is available on our investor website at http://investors.splunk.com/corporate-governance. The composition of the Audit Committee, the attributes of its members and the responsibilities of the Audit Committee, as reflected in its charter, are intended to comply with applicable requirements for corporate audit committees. The Audit Committee reviews and assesses the adequacy of its charter and the Audit Committee’s performance on an annual basis.
As of the date this report was approved, the Audit Committee consisted of four members: Sean Boyle, John Connors, Patricia Morrison, and Graham Smith. Mr. Boyle, Mr. Connors and Mr. Smith are “audit committee financial experts” as defined under SEC rules and regulations. With respect to the Company’s financial reporting process, the management of the Company is responsible for (1) establishing and maintaining internal controls and (2) preparing the Company’s consolidated financial statements. PwC is responsible for auditing these financial statements. It is the responsibility of the Audit Committee to oversee these activities. It is not the responsibility of the Audit Committee to prepare or certify the Company’s financial statements or guarantee the audits or reports of PwC. These are the fundamental responsibilities of management and PwC. In the performance of its oversight function, the Audit Committee has:
• reviewed and discussed the audited financial statements with management and PwC;
• discussed with PwC the applicable requirements of the Public Company Accounting Oversight Board; and
• received the written disclosures and the letter from PwC required by applicable requirements of the Public Company Accounting Oversight Board regarding PwC’s communications with the Audit Committee concerning independence, and has discussed with PwC its independence
Based on the Audit Committee’s review and discussions with management and PwC, the Audit Committee recommended to the Board that the audited financial statements be included in the Annual Report on Form 10-K for the fiscal year ended January 31, 2021 for filing with the SEC.
Respectfully submitted by the members of the Audit Committee of the Board:
Sean Boyle (Chair)John Connors(1) Patricia Morrison Graham Smith
(1) Mr. Connors resigned from the Board effective May 1, 2021.
Fees Paid to the Independent Registered Public Accounting FirmThe following table presents fees for professional audit services and other services rendered to us by PwC for the fiscal years ended January 31, 2020 and 2021. All fees were pre-approved by the Audit Committee in accordance with the policy described below.
2020($)
2021($)
Audit Fees(1) 4,011,196 4,626,990
Audit-Related Fees — —
Tax Fees(2) 852,659 968,767
All Other Fees(3) 3,870 152,870
Total: 4,867,725 5,748,626
(1) Audit fees consist of fees for professional services provided in connection with the integrated audit of our annual financial statements, management’s report on internal controls, the review of our quarterly consolidated financial statements, and audit services that are normally provided by independent registered public accounting firms in connection with statutory and regulatory filings or engagements for those fiscal years, such as statutory audits.
(2) Tax fees consist of fees billed for tax compliance, consultation and planning services.(3) All other fees consist of fees billed for access to online accounting and tax research software. These fees include ERP system implementation for the fiscal year
ended January 31, 2021.
Audit Committee Policy on Pre-Approval of Audit and Permissible Non-Audit Services of Independent Registered Public Accounting FirmConsistent with requirements of the SEC and the Public Company Accounting Oversight Board, regarding auditor independence, our Audit Committee is responsible for the appointment, compensation and oversight of the work of our independent registered public accounting firm. In recognition of this responsibility, our Audit Committee has established a policy for the pre-approval of all audit and permissible non-audit services provided by the independent registered public accounting firm. These services may include audit services, audit-related services, tax services and other services.
Before engagement of the independent registered public accounting firm for the next year’s audit, the independent registered public accounting firm submits a description of services expected to be rendered during that year to the Audit Committee for approval.
The Audit Committee pre-approves particular services or categories of services on a case-by-case basis. The fees are budgeted, and the Audit Committee requires the independent registered public accounting firm and our management team to report actual fees versus budgeted fees periodically throughout the year by category of service. During the year, circumstances may arise when it may become necessary to engage the independent registered public accounting firm for additional services not contemplated in the original pre-approval. In those instances, the services must be pre-approved by the Audit Committee before the independent registered public accounting firm is engaged.
Audit Committee MattersAudit Committee Matters

38
Our Executive OfficersThe following table identifies certain information about our executive officers as of May 1, 2021. Executive officers are appointed by the Board to hold office until their successors are elected and qualified.
Name Age Position(s)
Douglas Merritt 57 President, CEO and Director
Teresa Carlson 58 President and Chief Growth Officer
Jason Child 52 Senior Vice President and Chief Financial Officer
Scott Morgan 50 Senior Vice President, Chief Legal Officer, Global Affairs and Secretary
Timothy Tully 43 Senior Vice President, Chief Technology Officer
Douglas Merritt has served as our President, CEO and a member of our Board since 2015. Mr. Merritt served as our Senior Vice President of Field Operations from 2014 to 2015. Prior to joining us, he served as Senior Vice President of Products and Solutions Marketing at Cisco Systems, Inc., a networking company, from 2012 to 2014. From 2011 to 2012, he served as Chief Executive Officer of Baynote, Inc., a behavioral personalization and marketing technology company. Previously, Mr. Merritt served in a number of executive roles and as a member of the extended Executive Board at SAP A.G., an enterprise software company, from 2005 to 2011. From 2001 to 2004, Mr. Merritt served as Group Vice President and General Manager of the Human Capital Management Product Division at PeopleSoft Inc., a software company (acquired by Oracle Corporation). He also co-founded and served as Chief Executive Officer of Icarian, Inc., a cloud-based company (since acquired by Workstream Corp.), from 1996 to 2001. Mr. Merritt has served as a member of the board of directors of Dragoneer Growth Opportunities Corp., a special purchase acquisition company, since 2020. Mr. Merritt holds a B.S. from The University of the Pacific in Stockton, California.
Teresa Carlson has served as our President and Chief Growth Officer since 2021. Prior to joining us, Ms. Carlson served as Vice President, Worldwide Public Sector and Industries of Amazon Web Services, Inc., a cloud computing and infrastructure company, from 2010 to 2021. Previously, Ms. Carlson led sales, marketing and business development organizations at Microsoft Corporation, a technology company, Lexign, Inc. (formerly Keyfile Corporation), a software company, and NovaCare Rehabilitation, a provider of physical therapy services. Ms. Carlson holds a B.A. and M.S. from Western Kentucky University.
Jason Child has served as our Senior Vice President and Chief Financial Officer since 2019. Prior to joining us, Mr. Child served as Chief Financial Officer at Opendoor Labs Inc., an online real estate marketplace, from 2017 to 2019. From 2015 to 2016, Mr. Child was Chief Financial Officer at AliphCom, Inc. (d/b/a Jawbone), a consumer technology and wearable products company. Mr. Child served as Chief Financial Officer at Groupon, Inc., an e-commerce company, from 2010 to 2015. Previously, he spent over 11 years leading various global finance teams at Amazon.com, Inc., an e-commerce and cloud computing company. Mr. Child began his career at Arthur Andersen LLP. He holds a B.A. from the University of Washington.
Scott Morgan has served as our Senior Vice President, Chief Legal Officer since 2019 and our Secretary since 2018. Mr. Morgan has also led our Global Affairs organizations since 2020. Prior to this role, Mr. Morgan served as our General Counsel from 2017 to 2019, as our Vice President, Associate General Counsel from 2014 to 2017 and as our Associate General Counsel from 2012 to 2014. He also served as our Assistant Secretary from 2012 to 2018. Prior to joining us, Mr. Morgan served as legal counsel at Autodesk, Inc., a design software and services company and Tellabs, Inc., a provider of access networks solutions. Mr. Morgan began his career as an associate at Morrison & Foerster LLP and at Thoits, Love, Hershberger & McClean LLP. Mr. Morgan holds a B.A. from the University of California, Berkeley and a J.D. from the University of California, Hastings College of the Law.
Timothy Tully has served as our Senior Vice President, Chief Technology Officer since 2018. Prior to this role, Mr. Tully served as our Chief Technology Officer in 2017. Prior to joining us, Mr. Tully served in various roles at Yahoo! Inc., a digital information discovery company, from 2003 to 2017, including most recently as Vice President, Engineering from 2014 to 2017 and before that in engineering leadership roles including Distinguished Engineer and Chief Data Architect. Mr. Tully began his career as a Member of Technical Staff on the JavaSoft team at Sun Microsystems, Inc., a provider of network computing infrastructure solutions, and also spent time at several startup companies. Mr. Tully holds an M.S. from Carnegie Mellon University and a B.S. from the University of California, Davis. In April 2021, Mr. Tully informed us of his decision to resign as our Senior Vice President, Chief Technology Officer, effective as of May 4, 2021.

PR
OX
Y
39Splunk 2021 Proxy Statement
Executive Compensation
PR
OP
OS
AL
3 Advisory Vote to Approve Named Executive Officer CompensationThe Board recommends a vote “FOR” the Approval, on an Advisory Basis, of our Named Executive Officer Compensation.
As required by SEC rules, we are asking our stockholders to approve, on an advisory, non-binding basis, the compensation of our named executive officers as disclosed in the “Compensation Discussion and Analysis” section beginning on page 40, the compensation tables and the related narratives appearing in this proxy statement. This proposal, commonly known as a “Say-on-Pay” proposal, gives our stockholders the opportunity to express their views on our named executive officers’ compensation as a whole. This vote is not intended to address any specific item of compensation or any specific named executive officer, but rather the overall compensation of all of our named executive officers and the philosophy, policies and practices described in this proxy statement. We currently hold our Say-on-Pay vote every year.
The Say-on-Pay vote must receive the affirmative vote of at least a majority of the shares present in person (virtually) or by proxy at the meeting and entitled to vote thereon to be approved. Abstentions are considered votes cast and thus have the same effect as votes “Against” the proposal. Broker non-votes will have no effect on the outcome of the vote. The Say-on-Pay vote is advisory, and therefore is not binding on us, our Compensation Committee or our Board. The Say-on-Pay vote will, however, provide information to us regarding investor sentiment about our executive compensation philosophy, policies and practices, which the Compensation Committee will consider when determining executive compensation for the remainder of the current fiscal year and beyond. Our Board and our Compensation Committee value the opinions of our stockholders. To the extent there is any significant vote against the named executive officer compensation as disclosed in this proxy statement, we will endeavor to engage with stockholders to better understand the concerns that influenced the vote and consider our stockholders’ concerns. The Compensation Committee will evaluate whether any actions are necessary to address those concerns.
We believe that our executive compensation program is effective in achieving the Company’s objectives of:
• Recruiting, incentivizing and retaining highly qualified executive officers who possess the skills and leadership necessary to grow our business;
• Directly linking incentive compensation for our executive officers with achieving or exceeding our strategic and financial performance goals;
• Providing meaningful long-term incentives to align the interests of our executive officers with those of our stockholders;
• Reflecting our long-term strategy, which includes a financial strategy of disciplined investing for our future growth;
• Promoting a healthy approach to risk and sensitivity to underperformance as well as outperformance; and
• Providing compensation packages that are competitive, reasonable and fair relative to peers, the overall market and performance.
Accordingly, we ask our stockholders to vote “FOR” the following resolution at the Annual Meeting:
“RESOLVED, that the stockholders approve, on an advisory basis, the compensation paid to the named executive officers, as disclosed in the proxy statement for the 2021 Annual Meeting pursuant to the compensation disclosure rules of the SEC, including the compensation discussion and analysis, compensation tables and narrative discussion, and other related disclosure.”

40 Splunk 2021 Proxy Statement
Compensation Discussion and Analysis
Executive Summary Our executive compensation program is designed to attract, motivate and retain the key executives who drive our success. Pay that reflects performance and aligns with the interests of long-term stockholders is key to our compensation program design and decisions. We structure our executive compensation program to include significant performance metrics that are aligned with our business strategy and long-term stockholder value creation.
The fiscal 2021 executive compensation program provided short-term cash bonuses designed to drive top-line growth and long-term equity awards designed to drive annual recurring revenue (“ARR”), operating cash flow and stock price performance. We believe that both ARR growth and operating cash flow performance are critical to long-term stockholder value creation and that incorporating stock price growth as part of our long-term equity award design further aligns our executives’ and stockholders’ interests.
Strategic Context and Fiscal 2021 Business HighlightsWe provide innovative cloud and software offerings that deliver and operationalize insights from the data generated by digital systems. This data is growing significantly as a direct result of the prevalence and importance of digital systems used by today’s organizations. Decades of investment in digital transformation have integrated the hardware and software that comprise digital systems into every aspect of how modern organizations operate. The data generated by these systems contains a comprehensive, real-time record of operations, interactions, and transactions for organizations that, in turn, our offerings convert into insights that improve technology and business outcomes for our customers. Our solutions for Security, Information Technology (“IT”) Operations, and Observability empower users in technology roles, including cybersecurity, IT operations, and application development to monitor and secure digital systems more quickly and efficiently. Business users leverage our offerings to gain visibility to their digital processes in order to deliver better experiences, improve decisions and drive better results in areas including supply chain, inbound and outbound logistics, manufacturing, sales, and service.
Our offerings provide visibility to our customers’ diverse technology infrastructure including systems deployed on the edge, on premises, and in private and public cloud environments, running software ranging from embedded applications to cloud native ones. We also believe our offerings empower operational transformation, helping customers move from reactive, non-scalable and ineffective approaches to proactive, automated, and AI-assisted processes that drive better outcomes even as the scale and complexity of their infrastructures grow.
The events of 2020 significantly increased the importance of being a digital, data-driven enterprise. The COVID-19 pandemic is exerting an enormous amount of pressure on organizations of all kinds to support new ways of working, to deliver better experiences and outcomes, and to enable entirely new offerings and business models. We believe that Splunk enables organizations to rise to these challenges by leveraging technology to achieve greater efficiency, agility, security, and drive a sustained competitive advantage.
We have reached a key milestone in our ongoing business transformation to a subscription model, where cloud services represent the majority of our total software bookings. Our revenue mix has shifted from sales of licenses to sales of cloud services and we expect it will continue to shift in favor of cloud services. Our transition to a predominantly cloud services delivery model has impacted, and it will continue to impact the timing of our recognition of revenue as an increasing percentage of our sales becomes recognized ratably, as well as impact our operating margins as cloud services become a larger percentage of our sales. Our shift to a subscription model has happened faster than we expected, and our ability to predict our revenue and margins in any particular period has been, and may continue to be, limited. We have also shifted from generally invoicing our multi-year contracts upfront to invoicing on an annual basis. Accordingly, we have seen the timing of our cash collections extend over a longer period of time with the transition to a subscription model than it has historically, and we expect this to negatively impact operating cash flows through at least fiscal 2022.
In fiscal 2021, we prioritized delivering growth with a focus on disciplined execution of our business objectives as we navigate our ongoing business transformation to a subscription model. We believe ARR is an optimal indicator of growth because it cuts through the timing and therefore variability of our recognition of revenue to better reflect the underlying growth of our business during the transformation. Accordingly, in fiscal 2021, we and our investors focused on total annual recurring revenue (“ARR”) and operating cash flow metrics. Our ongoing efforts with respect to customer success and adoption led to continued top-line ARR growth. Our focus on capturing our large and growing market opportunity requires that we continue to invest in our business. Accordingly, in fiscal 2021 our executive compensation plans balanced growth and operational discipline in support of our long-term market opportunity.
In March 2020, the Compensation Committee established target levels for ARR and ACV performance for fiscal 2021 that it considered very aggressive, yet achievable with focused effort and execution by our NEOs, and that reflected a rigorous increase in growth relative to our prior fiscal year ARR and ACV achievement. In October 2020, the Compensation Committee took the unprecedented step of adjusting the targets as well as the tiers of the ARR and ACV metrics payout multiples relative to target for the executive bonus plan and PSUs in fiscal 2021 given the uncertainties in the macro environment, including the impact of the COVID-19 pandemic on our business and that of our customers and the overall environment being coupled with the complexities associated with business model transformations. We believe that our effort and performance were strong in fiscal 2021, as demonstrated by our business highlights below.
Our fiscal 2021 business highlights include achievement of the following ARR and operating cash flow results and other important metrics:
• Total ARR of $2.365 billion, up 41% year-over-year(1);
• Operating cash flow of negative $191 million with free cash flow of negative $228 million(2);
• Non-GAAP operating margin of negative 3.8%(2); and
• 510 customers with ARR greater than $1 million, up 44% year-over-year.
(1) Total ARR represents the annualized revenue run-rate of active subscription, term license, and maintenance contracts at the end of a reporting period as reported in our Annual Report on Form 10-K for the year ended January 31, 2021. Each contract is annualized by dividing the total contract value by the number of days in the contract term and then multiplying by 365. ARR should be viewed independently of revenue, and does not represent our revenue under GAAP on an annualized basis, as it is an operating metric that can be impacted by contract start and end dates and renewal rates. ARR is not intended to be a replacement or forecasts of revenue.
(2) To supplement our consolidated financial statements, which are prepared and presented in accordance with GAAP, we provide investors with certain non-GAAP financial measures, including non-GAAP operating margin and free cash flow. For a full reconciliation between GAAP and non-GAAP operating margin and between net cash used in operating activities and free cash flow, please see our Annual Report on Form 10-K for the year ended January 31, 2021.
Total ARR($ in millions) • FYE January 31
FY21FY20FY19FY18
$1,680
$1,091
$727
2,500
0
500
1,000
1,500
2,000$2,365
41%
54%
50%
Total Stockholder Return*FYE January 31
$357$335
$270
$200
$125$100
0
50
100
150
200
250
300
350
400
202120202019201820172016
* The chart shows the total return on our common stock through the end of fiscal 2021, assuming an initial investment of $100 at the end of fiscal 2016.
We believe our executive compensation program structure incentivized our NEOs to drive towards our strong growth, financial performance and execution for fiscal 2021. In addition, we believe our NEOs’ compensation for fiscal 2021 appropriately reflected and rewarded their collective contributions to our performance. We have an executive management team of seasoned and accomplished leaders focused on executing on our market opportunity and leading us through our next phase of growth.
Executive CompensationExecutive Compensation

PR
OX
Y
41Splunk 2021 Proxy Statement
Compensation Discussion and Analysis
Executive Summary Our executive compensation program is designed to attract, motivate and retain the key executives who drive our success. Pay that reflects performance and aligns with the interests of long-term stockholders is key to our compensation program design and decisions. We structure our executive compensation program to include significant performance metrics that are aligned with our business strategy and long-term stockholder value creation.
The fiscal 2021 executive compensation program provided short-term cash bonuses designed to drive top-line growth and long-term equity awards designed to drive annual recurring revenue (“ARR”), operating cash flow and stock price performance. We believe that both ARR growth and operating cash flow performance are critical to long-term stockholder value creation and that incorporating stock price growth as part of our long-term equity award design further aligns our executives’ and stockholders’ interests.
Strategic Context and Fiscal 2021 Business HighlightsWe provide innovative cloud and software offerings that deliver and operationalize insights from the data generated by digital systems. This data is growing significantly as a direct result of the prevalence and importance of digital systems used by today’s organizations. Decades of investment in digital transformation have integrated the hardware and software that comprise digital systems into every aspect of how modern organizations operate. The data generated by these systems contains a comprehensive, real-time record of operations, interactions, and transactions for organizations that, in turn, our offerings convert into insights that improve technology and business outcomes for our customers. Our solutions for Security, Information Technology (“IT”) Operations, and Observability empower users in technology roles, including cybersecurity, IT operations, and application development to monitor and secure digital systems more quickly and efficiently. Business users leverage our offerings to gain visibility to their digital processes in order to deliver better experiences, improve decisions and drive better results in areas including supply chain, inbound and outbound logistics, manufacturing, sales, and service.
Our offerings provide visibility to our customers’ diverse technology infrastructure including systems deployed on the edge, on premises, and in private and public cloud environments, running software ranging from embedded applications to cloud native ones. We also believe our offerings empower operational transformation, helping customers move from reactive, non-scalable and ineffective approaches to proactive, automated, and AI-assisted processes that drive better outcomes even as the scale and complexity of their infrastructures grow.
The events of 2020 significantly increased the importance of being a digital, data-driven enterprise. The COVID-19 pandemic is exerting an enormous amount of pressure on organizations of all kinds to support new ways of working, to deliver better experiences and outcomes, and to enable entirely new offerings and business models. We believe that Splunk enables organizations to rise to these challenges by leveraging technology to achieve greater efficiency, agility, security, and drive a sustained competitive advantage.
We have reached a key milestone in our ongoing business transformation to a subscription model, where cloud services represent the majority of our total software bookings. Our revenue mix has shifted from sales of licenses to sales of cloud services and we expect it will continue to shift in favor of cloud services. Our transition to a predominantly cloud services delivery model has impacted, and it will continue to impact the timing of our recognition of revenue as an increasing percentage of our sales becomes recognized ratably, as well as impact our operating margins as cloud services become a larger percentage of our sales. Our shift to a subscription model has happened faster than we expected, and our ability to predict our revenue and margins in any particular period has been, and may continue to be, limited. We have also shifted from generally invoicing our multi-year contracts upfront to invoicing on an annual basis. Accordingly, we have seen the timing of our cash collections extend over a longer period of time with the transition to a subscription model than it has historically, and we expect this to negatively impact operating cash flows through at least fiscal 2022.
In fiscal 2021, we prioritized delivering growth with a focus on disciplined execution of our business objectives as we navigate our ongoing business transformation to a subscription model. We believe ARR is an optimal indicator of growth because it cuts through the timing and therefore variability of our recognition of revenue to better reflect the underlying growth of our business during the transformation. Accordingly, in fiscal 2021, we and our investors focused on total annual recurring revenue (“ARR”) and operating cash flow metrics. Our ongoing efforts with respect to customer success and adoption led to continued top-line ARR growth. Our focus on capturing our large and growing market opportunity requires that we continue to invest in our business. Accordingly, in fiscal 2021 our executive compensation plans balanced growth and operational discipline in support of our long-term market opportunity.
In March 2020, the Compensation Committee established target levels for ARR and ACV performance for fiscal 2021 that it considered very aggressive, yet achievable with focused effort and execution by our NEOs, and that reflected a rigorous increase in growth relative to our prior fiscal year ARR and ACV achievement. In October 2020, the Compensation Committee took the unprecedented step of adjusting the targets as well as the tiers of the ARR and ACV metrics payout multiples relative to target for the executive bonus plan and PSUs in fiscal 2021 given the uncertainties in the macro environment, including the impact of the COVID-19 pandemic on our business and that of our customers and the overall environment being coupled with the complexities associated with business model transformations. We believe that our effort and performance were strong in fiscal 2021, as demonstrated by our business highlights below.
Our fiscal 2021 business highlights include achievement of the following ARR and operating cash flow results and other important metrics:
• Total ARR of $2.365 billion, up 41% year-over-year(1);
• Operating cash flow of negative $191 million with free cash flow of negative $228 million(2);
• Non-GAAP operating margin of negative 3.8%(2); and
• 510 customers with ARR greater than $1 million, up 44% year-over-year.
(1) Total ARR represents the annualized revenue run-rate of active subscription, term license, and maintenance contracts at the end of a reporting period as reported in our Annual Report on Form 10-K for the year ended January 31, 2021. Each contract is annualized by dividing the total contract value by the number of days in the contract term and then multiplying by 365. ARR should be viewed independently of revenue, and does not represent our revenue under GAAP on an annualized basis, as it is an operating metric that can be impacted by contract start and end dates and renewal rates. ARR is not intended to be a replacement or forecasts of revenue.
(2) To supplement our consolidated financial statements, which are prepared and presented in accordance with GAAP, we provide investors with certain non-GAAP financial measures, including non-GAAP operating margin and free cash flow. For a full reconciliation between GAAP and non-GAAP operating margin and between net cash used in operating activities and free cash flow, please see our Annual Report on Form 10-K for the year ended January 31, 2021.
Total ARR($ in millions) • FYE January 31
FY21FY20FY19FY18
$1,680
$1,091
$727
2,500
0
500
1,000
1,500
2,000$2,365
41%
54%
50%
Total Stockholder Return*FYE January 31
$357$335
$270
$200
$125$100
0
50
100
150
200
250
300
350
400
202120202019201820172016
* The chart shows the total return on our common stock through the end of fiscal 2021, assuming an initial investment of $100 at the end of fiscal 2016.
We believe our executive compensation program structure incentivized our NEOs to drive towards our strong growth, financial performance and execution for fiscal 2021. In addition, we believe our NEOs’ compensation for fiscal 2021 appropriately reflected and rewarded their collective contributions to our performance. We have an executive management team of seasoned and accomplished leaders focused on executing on our market opportunity and leading us through our next phase of growth.
Executive CompensationExecutive Compensation

42 Splunk 2021 Proxy Statement
Our Executive Compensation PracticesOur executive compensation policies and practices are designed to reinforce our pay for performance philosophy and align with sound governance principles. The following chart highlights our fiscal 2021 executive compensation policies and practices:
WHAT WE DO
• Performance-based cash and equity incentives
• Caps on performance-based cash and equity incentive compensation
• Annual review and approval of our executive compensation strategy
• Significant portion of executive compensation at risk based on corporate performance
• Clawback policy on cash and equity incentive compensation
• Stock ownership guidelines for executive officers and directors
• Multi-year equity award vesting periods for equity awards
• Independent compensation consultant engaged by the Compensation Committee
• 100% independent directors on the Compensation Committee
• Limited and modest perquisites
• Formal CEO evaluation tied to compensation decisions
• Ongoing engagement with our institutional stockholders regarding our compensation policies and practices
WHAT WE DON’T DO
• No “single trigger” change in control payments and benefits
• No post-termination retirement or pension-type non-cash benefits or perquisites for our executive officers that are not generally available to our employees
• No tax gross-ups for change in control related payments
• No short sales, hedging, or pledging of stock ownership positions and transactions involving derivatives of our common stock
• No strict benchmarking of compensation to a specific percentile of our peer group
Stockholder Engagement and Our 2020 Say-On-Pay VoteWe value our stockholders’ continued interest and feedback. We are committed to maintaining an active dialogue to understand the priorities and concerns of our stockholders and believe that ongoing engagement builds mutual trust and alignment with our stockholders and is essential to our long-term success.
We Reached out to Institutional Stockholders
Representing:
We Engaged with Institutional Stockholders
Representing:Say-On-Pay Approval:
73%of Shares
Outstanding
25%of Shares
Outstanding
88%of Stockholders
Approved our2020 Say-On-Pay Proposal
In the course of 12 meetings with our institutional stockholders and a global stewardship provider, we received valuable feedback on our executive compensation program, policies and practices as described in the chart below. We discussed with these stockholders the reasons for their support of, and for a small percentage their opposition to, our 2020 Say-on-Pay resolution, which was approved by approximately 88% of the votes cast at our 2020 annual meeting of stockholders. Stockholders generally viewed the evolution of our executive compensation program as consistent with what we previously communicated in our outreach over the past several years and consistent with our strategy and pay for performance philosophy. Based on input from stockholders in fiscal 2020, the Compensation Committee determined that the fiscal 2021 executive compensation program was consistent with our philosophy, policies and practices. The key feedback from our stockholders related to our executive compensation program and our responses are shown in the chart below. See “Corporate Governance at Splunk—Stockholder Engagement” on page 31 of this proxy statement for more information on our stockholder engagement program.
Area of Focus What We Heard from Investors How We Responded
Performance Metrics and Performance Period
• Current performance metrics tie to our business strategy and are appropriate given our ongoing business model transformation
• Consider additional metrics in the short-term bonus plan
• Consider a longer performance period for performance-based equity awards as we complete our business model transformation
• Open to mid-year adjustments to fiscal 2021 performance metrics, as long as comprehensively disclosed in the proxy statement
• Maintained ARR metric in fiscal 2022 short-term bonus plan and PSU program to align our incentives with key drivers of stockholder value during our ongoing business transformation to a subscription model with a focus on cloud services
• Maintained operating cash flow metric in fiscal 2022 PSU program to reflect focus on disciplined execution of our business objectives during our ongoing business model transformation
• Considered other metrics, but determined not appropriate at this stage in our maturity where our and our investors’ focus is on continued scale, growth and innovation
• Continued to include a multi-year stock price performance metric in fiscal 2022 PSU program for long-term stock price performance that exceeds index performance to further align the interests of our NEOs and stockholders
• Assessed our PSU performance period length and confirmed that one year continues to be appropriate in light of our ongoing business transformation and growth trajectory and that the component of the PSU program that rewards multi-year stock price performance adds further incentive over a longer timeframe
• Expanded proxy disclosure to provide transparency about the rationale for our mid-year adjustments to our fiscal 2021 performance metrics. See “Discussion of our Fiscal 2021 Executive Compensation Program—Components of our Compensation Program and Fiscal 2021 Compensation-—Cash Bonuses—Mid-Year Changes to Fiscal 2021 Performance Objectives.”
Quantum of CEO and NEO Pay
• Amount of pay generally reasonable given talent war and performance
• Appropriate mix of short- and long-term incentives, as well as proportion of performance- and time-based equity awards
• Continued to assess executive compensation in the context of our business strategy and our strong performance, as well as against market practices in consultation with independent compensation consultant
Executive CompensationExecutive Compensation

PR
OX
Y
43Splunk 2021 Proxy Statement
Our Executive Compensation PracticesOur executive compensation policies and practices are designed to reinforce our pay for performance philosophy and align with sound governance principles. The following chart highlights our fiscal 2021 executive compensation policies and practices:
WHAT WE DO
• Performance-based cash and equity incentives
• Caps on performance-based cash and equity incentive compensation
• Annual review and approval of our executive compensation strategy
• Significant portion of executive compensation at risk based on corporate performance
• Clawback policy on cash and equity incentive compensation
• Stock ownership guidelines for executive officers and directors
• Multi-year equity award vesting periods for equity awards
• Independent compensation consultant engaged by the Compensation Committee
• 100% independent directors on the Compensation Committee
• Limited and modest perquisites
• Formal CEO evaluation tied to compensation decisions
• Ongoing engagement with our institutional stockholders regarding our compensation policies and practices
WHAT WE DON’T DO
• No “single trigger” change in control payments and benefits
• No post-termination retirement or pension-type non-cash benefits or perquisites for our executive officers that are not generally available to our employees
• No tax gross-ups for change in control related payments
• No short sales, hedging, or pledging of stock ownership positions and transactions involving derivatives of our common stock
• No strict benchmarking of compensation to a specific percentile of our peer group
Stockholder Engagement and Our 2020 Say-On-Pay VoteWe value our stockholders’ continued interest and feedback. We are committed to maintaining an active dialogue to understand the priorities and concerns of our stockholders and believe that ongoing engagement builds mutual trust and alignment with our stockholders and is essential to our long-term success.
We Reached out to Institutional Stockholders
Representing:
We Engaged with Institutional Stockholders
Representing:Say-On-Pay Approval:
73%of Shares
Outstanding
25%of Shares
Outstanding
88%of Stockholders
Approved our2020 Say-On-Pay Proposal
In the course of 12 meetings with our institutional stockholders and a global stewardship provider, we received valuable feedback on our executive compensation program, policies and practices as described in the chart below. We discussed with these stockholders the reasons for their support of, and for a small percentage their opposition to, our 2020 Say-on-Pay resolution, which was approved by approximately 88% of the votes cast at our 2020 annual meeting of stockholders. Stockholders generally viewed the evolution of our executive compensation program as consistent with what we previously communicated in our outreach over the past several years and consistent with our strategy and pay for performance philosophy. Based on input from stockholders in fiscal 2020, the Compensation Committee determined that the fiscal 2021 executive compensation program was consistent with our philosophy, policies and practices. The key feedback from our stockholders related to our executive compensation program and our responses are shown in the chart below. See “Corporate Governance at Splunk—Stockholder Engagement” on page 31 of this proxy statement for more information on our stockholder engagement program.
Area of Focus What We Heard from Investors How We Responded
Performance Metrics and Performance Period
• Current performance metrics tie to our business strategy and are appropriate given our ongoing business model transformation
• Consider additional metrics in the short-term bonus plan
• Consider a longer performance period for performance-based equity awards as we complete our business model transformation
• Open to mid-year adjustments to fiscal 2021 performance metrics, as long as comprehensively disclosed in the proxy statement
• Maintained ARR metric in fiscal 2022 short-term bonus plan and PSU program to align our incentives with key drivers of stockholder value during our ongoing business transformation to a subscription model with a focus on cloud services
• Maintained operating cash flow metric in fiscal 2022 PSU program to reflect focus on disciplined execution of our business objectives during our ongoing business model transformation
• Considered other metrics, but determined not appropriate at this stage in our maturity where our and our investors’ focus is on continued scale, growth and innovation
• Continued to include a multi-year stock price performance metric in fiscal 2022 PSU program for long-term stock price performance that exceeds index performance to further align the interests of our NEOs and stockholders
• Assessed our PSU performance period length and confirmed that one year continues to be appropriate in light of our ongoing business transformation and growth trajectory and that the component of the PSU program that rewards multi-year stock price performance adds further incentive over a longer timeframe
• Expanded proxy disclosure to provide transparency about the rationale for our mid-year adjustments to our fiscal 2021 performance metrics. See “Discussion of our Fiscal 2021 Executive Compensation Program—Components of our Compensation Program and Fiscal 2021 Compensation-—Cash Bonuses—Mid-Year Changes to Fiscal 2021 Performance Objectives.”
Quantum of CEO and NEO Pay
• Amount of pay generally reasonable given talent war and performance
• Appropriate mix of short- and long-term incentives, as well as proportion of performance- and time-based equity awards
• Continued to assess executive compensation in the context of our business strategy and our strong performance, as well as against market practices in consultation with independent compensation consultant
Executive CompensationExecutive Compensation

44 Splunk 2021 Proxy Statement
Discussion of Our Fiscal 2021 Executive Compensation ProgramWe align our executive compensation program with our business strategy and focus on what we believe to be key to our success—growth, execution, innovation and disruption. This section provides an overview of the philosophy, objectives and components of our executive compensation program. In addition, we explain how and why the Compensation Committee arrived at the specific compensation policies and decisions for our executive officers during fiscal 2021.
Our NEOs for fiscal 2021 are:
• Douglas Merritt, our President, CEO and member of the Board;
• Jason Child, our Senior Vice President and Chief Financial Officer;
• Scott Morgan, our Senior Vice President, Chief Legal Officer, Global Affairs and Secretary;
• Susan St. Ledger, our former President, Worldwide Field Operations(1); and
• Timothy Tully, our Senior Vice President, Chief Technology Officer(2).
(1) Ms. St. Ledger resigned as President, Worldwide Field Operations in September 2020, and continued her employment as an advisor to our CEO until January 31, 2021.(2) In April 2021, Mr. Tully informed us of his decision to resign as Senior Vice President, Chief Technology Officer, effective as of May 4, 2021.
Philosophy and ObjectivesOur “Pay for Performance” Philosophy. We operate in a highly competitive business environment within a rapidly evolving and extremely competitive talent market. To successfully compete and grow our business in this dynamic environment, we need to recruit, incentivize and retain talented and seasoned technology leaders. Our success critically depends on the skill, acumen and motivation of our executives and employees to rapidly execute at the highest level. To that end, our executive compensation program is shaped by our “pay for performance” philosophy.
Our Current Objectives. The current objectives of our executive compensation program are to:
• Recruit, incentivize and retain highly qualified executive officers who possess the skills and leadership necessary to grow our business;
• Directly link incentive compensation for our executive officers with achieving or exceeding our strategic and financial performance goals;
• Provide meaningful long-term incentives to align the interests of our executive officers with those of our stockholders;
• Reflect our long-term strategy, which includes a financial strategy of disciplined investing for our future growth;
• Promote a healthy approach to risk and be sensitive to underperformance as well as outperformance; and
• Provide compensation packages that are competitive, reasonable and fair relative to peers, the overall market and performance.
Intense Competition For Talent; How We’ve Responded. We actively compete with other companies in seeking to attract and retain a skilled executive management team. This is particularly prevalent in our industry, where there are a number of rapidly expanding technology companies intensely competing for highly qualified candidates. In addition, the success and prominence of our business in the emerging big data market is increasingly attracting the attention of competitors and other companies. This has caused us to increase our focus on retaining employees, including our executives, as we are seen as a company with experienced employee talent that has successfully and rapidly scaled our technology business.
We have responded to this intense competition for talent by implementing compensation practices designed to motivate our employees, including our executive officers, to pursue our corporate objectives while incentivizing them to create long-term value for our stockholders. Our executive compensation program combines short-term and long-term components, including salary, cash bonuses, and equity awards. While challenging to achieve, we believe we have found the proper mix of incentives that attracts, motivates and retains each executive officer.
We regularly review and, if appropriate, adjust our executive compensation program to match the maturity, size, scale and growth of our business. Because our ability to compete and succeed in this dynamic environment is directly correlated to our ability to recruit, incentivize and retain talented and seasoned technology leaders, we expect to continue to adjust our approach to executive compensation to respond to our needs and market conditions as they evolve.
Compensation Process
Role of Compensation CommitteePursuant to its charter, the Compensation Committee is responsible for annually reviewing and approving compensation arrangements for our executive officers, including our CEO, for reviewing and approving corporate goals and objectives relevant to these compensation arrangements, evaluating executive performance, and considering factors related to the performance of the Company, including accomplishment of the Company’s long-term business and financial goals. For additional information about the Compensation Committee, see “Corporate Governance at Splunk—Board Meetings and Committees—Compensation Committee” in this proxy statement.
In making executive compensation decisions, the Compensation Committee seeks the assistance of its independent compensation consultant, Compensia (“Compensia”), as well as our CEO and our management team (except with respect to their own compensation). The Compensation Committee reviews the cash and equity compensation of our executive officers to properly incentivize and reward them for their performance.
The Compensation Committee makes compensation decisions after consideration of many factors, including:
• The performance and experience of each executive officer;
• The scope and strategic impact of the executive officer’s responsibilities;
• Our past business performance and future expectations;
• Our long-term goals and strategies;
• The performance of our executive team as a whole;
• The difficulty and cost of replacing high-performing leaders with in-demand skills;
• The past compensation levels of each individual;
• The relative compensation among our executive officers; and
• The competitiveness of compensation relative to our peer group.
Role of ManagementThe Compensation Committee consults with members of our management team, including our CEO and our human resources, finance and legal professionals (except with respect to their own compensation) when making compensation decisions. Typically, our CEO and other members of our management team provide the Compensation Committee with information on corporate and individual performance and their perspective and recommendations on compensation matters. Our CEO makes recommendations to the Compensation Committee regarding compensation matters, including the compensation of our other executive officers. The Compensation Committee uses these recommendations as one of several factors in making compensation decisions, and those decisions do not necessarily follow the CEO’s recommendations.
Role of Compensation ConsultantThe Compensation Committee has the authority to retain the services and obtain the advice of external advisors, including compensation consultants, legal counsel or other advisors, to assist in the evaluation of executive officer compensation. For fiscal 2021, the Compensation Committee engaged Compensia to review our executive compensation policies and practices, to conduct an executive compensation market analysis and to review our equity practices to help ensure alignment with competitive market practices. Compensia reviewed and advised on all principal aspects of our executive compensation program for fiscal 2021, including:
• Assisting in developing a peer group of publicly traded companies to be used to help assess executive compensation;
• Assisting in assuring a competitive compensation framework and consistent executive compensation assessment practices relevant to a comparable public company at our stage;
• Meeting regularly with the Compensation Committee to review all elements of executive compensation, including the competitiveness of our executive compensation program against those of our peer companies and the design of our PSU program; and
• Assisting in the risk assessment of our compensation programs.
Representatives from Compensia attend the meetings of the Compensation Committee and communicate with members of the Compensation Committee and our management team outside the formal Compensation Committee meetings from time to time.
Executive CompensationExecutive Compensation

PR
OX
Y
45Splunk 2021 Proxy Statement
Discussion of Our Fiscal 2021 Executive Compensation ProgramWe align our executive compensation program with our business strategy and focus on what we believe to be key to our success—growth, execution, innovation and disruption. This section provides an overview of the philosophy, objectives and components of our executive compensation program. In addition, we explain how and why the Compensation Committee arrived at the specific compensation policies and decisions for our executive officers during fiscal 2021.
Our NEOs for fiscal 2021 are:
• Douglas Merritt, our President, CEO and member of the Board;
• Jason Child, our Senior Vice President and Chief Financial Officer;
• Scott Morgan, our Senior Vice President, Chief Legal Officer, Global Affairs and Secretary;
• Susan St. Ledger, our former President, Worldwide Field Operations(1); and
• Timothy Tully, our Senior Vice President, Chief Technology Officer(2).
(1) Ms. St. Ledger resigned as President, Worldwide Field Operations in September 2020, and continued her employment as an advisor to our CEO until January 31, 2021.(2) In April 2021, Mr. Tully informed us of his decision to resign as Senior Vice President, Chief Technology Officer, effective as of May 4, 2021.
Philosophy and ObjectivesOur “Pay for Performance” Philosophy. We operate in a highly competitive business environment within a rapidly evolving and extremely competitive talent market. To successfully compete and grow our business in this dynamic environment, we need to recruit, incentivize and retain talented and seasoned technology leaders. Our success critically depends on the skill, acumen and motivation of our executives and employees to rapidly execute at the highest level. To that end, our executive compensation program is shaped by our “pay for performance” philosophy.
Our Current Objectives. The current objectives of our executive compensation program are to:
• Recruit, incentivize and retain highly qualified executive officers who possess the skills and leadership necessary to grow our business;
• Directly link incentive compensation for our executive officers with achieving or exceeding our strategic and financial performance goals;
• Provide meaningful long-term incentives to align the interests of our executive officers with those of our stockholders;
• Reflect our long-term strategy, which includes a financial strategy of disciplined investing for our future growth;
• Promote a healthy approach to risk and be sensitive to underperformance as well as outperformance; and
• Provide compensation packages that are competitive, reasonable and fair relative to peers, the overall market and performance.
Intense Competition For Talent; How We’ve Responded. We actively compete with other companies in seeking to attract and retain a skilled executive management team. This is particularly prevalent in our industry, where there are a number of rapidly expanding technology companies intensely competing for highly qualified candidates. In addition, the success and prominence of our business in the emerging big data market is increasingly attracting the attention of competitors and other companies. This has caused us to increase our focus on retaining employees, including our executives, as we are seen as a company with experienced employee talent that has successfully and rapidly scaled our technology business.
We have responded to this intense competition for talent by implementing compensation practices designed to motivate our employees, including our executive officers, to pursue our corporate objectives while incentivizing them to create long-term value for our stockholders. Our executive compensation program combines short-term and long-term components, including salary, cash bonuses, and equity awards. While challenging to achieve, we believe we have found the proper mix of incentives that attracts, motivates and retains each executive officer.
We regularly review and, if appropriate, adjust our executive compensation program to match the maturity, size, scale and growth of our business. Because our ability to compete and succeed in this dynamic environment is directly correlated to our ability to recruit, incentivize and retain talented and seasoned technology leaders, we expect to continue to adjust our approach to executive compensation to respond to our needs and market conditions as they evolve.
Compensation Process
Role of Compensation CommitteePursuant to its charter, the Compensation Committee is responsible for annually reviewing and approving compensation arrangements for our executive officers, including our CEO, for reviewing and approving corporate goals and objectives relevant to these compensation arrangements, evaluating executive performance, and considering factors related to the performance of the Company, including accomplishment of the Company’s long-term business and financial goals. For additional information about the Compensation Committee, see “Corporate Governance at Splunk—Board Meetings and Committees—Compensation Committee” in this proxy statement.
In making executive compensation decisions, the Compensation Committee seeks the assistance of its independent compensation consultant, Compensia (“Compensia”), as well as our CEO and our management team (except with respect to their own compensation). The Compensation Committee reviews the cash and equity compensation of our executive officers to properly incentivize and reward them for their performance.
The Compensation Committee makes compensation decisions after consideration of many factors, including:
• The performance and experience of each executive officer;
• The scope and strategic impact of the executive officer’s responsibilities;
• Our past business performance and future expectations;
• Our long-term goals and strategies;
• The performance of our executive team as a whole;
• The difficulty and cost of replacing high-performing leaders with in-demand skills;
• The past compensation levels of each individual;
• The relative compensation among our executive officers; and
• The competitiveness of compensation relative to our peer group.
Role of ManagementThe Compensation Committee consults with members of our management team, including our CEO and our human resources, finance and legal professionals (except with respect to their own compensation) when making compensation decisions. Typically, our CEO and other members of our management team provide the Compensation Committee with information on corporate and individual performance and their perspective and recommendations on compensation matters. Our CEO makes recommendations to the Compensation Committee regarding compensation matters, including the compensation of our other executive officers. The Compensation Committee uses these recommendations as one of several factors in making compensation decisions, and those decisions do not necessarily follow the CEO’s recommendations.
Role of Compensation ConsultantThe Compensation Committee has the authority to retain the services and obtain the advice of external advisors, including compensation consultants, legal counsel or other advisors, to assist in the evaluation of executive officer compensation. For fiscal 2021, the Compensation Committee engaged Compensia to review our executive compensation policies and practices, to conduct an executive compensation market analysis and to review our equity practices to help ensure alignment with competitive market practices. Compensia reviewed and advised on all principal aspects of our executive compensation program for fiscal 2021, including:
• Assisting in developing a peer group of publicly traded companies to be used to help assess executive compensation;
• Assisting in assuring a competitive compensation framework and consistent executive compensation assessment practices relevant to a comparable public company at our stage;
• Meeting regularly with the Compensation Committee to review all elements of executive compensation, including the competitiveness of our executive compensation program against those of our peer companies and the design of our PSU program; and
• Assisting in the risk assessment of our compensation programs.
Representatives from Compensia attend the meetings of the Compensation Committee and communicate with members of the Compensation Committee and our management team outside the formal Compensation Committee meetings from time to time.
Executive CompensationExecutive Compensation

46 Splunk 2021 Proxy Statement
CEO
All Other NEOs
4%BaseSalary
4%CashBonus
74% Performance-Based
8%Short-TermCash
92%Long-Term Equity
70%PSUs
22%RSUs
3%BaseSalary
4%CashBonus
75% Performance-Based
7%Short-TermCash
93%Long-Term Equity
71%PSUs
22%RSUs
In addition, the chart below illustrates the short-term and long-term timeframe over which the various components of the NEOs’ fiscal 2021 compensation are earned and paid and serve to continue to retain and incentivize our NEOs.
FYE January 31 2021 2022 2023 2024
BASE SALARY Paid throughout fiscal 2021
CASH BONUS Fiscal 2021 annual cash bonus (Full fiscal 2021 achievement determined and paid in April 2021)
LONG-TERM EQUITY COMPENSATION (RSUs)Fiscal 2021 awards granted in March 2020 (25% vested in March 2021, remaining 75% vest quarterly thereafter over next three years)
LONG-TERM EQUITY COMPENSATION (PSUs)Fiscal 2021 awards granted in March 2020 (25% of earned corporate PSUs vested in March 2021, remaining 75% of earned corporate PSUs vest quarterly thereafter over next three years)
(stock price PSUs eligible to be earned and to vest beginning in June 2022 on a quarterly basis through the end of the four-year vesting period of the corporate PSUs on March 2024)
During fiscal 2021, Compensia also performed services for us at the direction of the Compensation Committee relating to equity utilization, proxy statement support, and general Compensation Committee support. Compensia also advised the Compensation Committee on market practice and current trends and developments around executive compensation, in light of the COVID-19 pandemic.
Based on the consideration of the factors specified in the rules of the SEC and the listing standards of The NASDAQ Stock Market, the Compensation Committee does not believe that its relationship with Compensia and the work of Compensia on behalf of the Compensation Committee has raised any conflict of interest. The Compensation Committee reviews these factors on an annual basis. As part of the Compensation Committee’s determination of Compensia’s independence, it received written confirmation from Compensia addressing these factors and supporting the independence determination.
Peer GroupThe Compensation Committee reviews market data of companies that it believes are comparable to us. With Compensia’s assistance, the Compensation Committee developed a peer group for use when making its fiscal 2021 compensation decisions, which consisted of publicly traded software and software services companies headquartered in the U.S. that generally had revenue between 0.33x and 3.0x of our revenue, generally had experienced strong year-over-year revenue growth, and/or had a market capitalization between 0.33x and 3.0x of our market capitalization. The Compensation Committee referred to compensation data from this peer group when making fiscal 2021 base salary, cash bonus and equity award decisions for our executive officers. The following is a list of the public companies that comprised our fiscal 2021 peer group:
Akamai Technologies ANSYS
Arista Networks Autodesk
Citrix Systems
FortinetGuidewire Software
Intuit Palo Alto Networks
ServiceNow
Square SS&C Technologies
HoldingsTwitter
Veeva Systems
VerisignVMWare Workday
Zillow Group
For fiscal 2021, the Compensation Committee removed Red Hat, Tableau Software and The Ultimate Software Group from the peer group used in fiscal 2020 because they were acquired, and added Citrix Systems, Intuit and VMWare as additional peers based on the criteria described above. The remainder of the peer group was unchanged.
The Compensation Committee considers compensation data from our peer group as one of several factors that informs its judgment of appropriate parameters for compensation levels. The Compensation Committee does not strictly benchmark compensation to a specific percentile of our peer group, nor does it apply a formula or assign relative weightings to specific compensation elements. The Compensation Committee believes that over-reliance on benchmarking can result in compensation that is unrelated to the value delivered by our executive officers because compensation benchmarking does not take into account the specific performance of the executive officers, the relative size, growth, and performance of the Company, or any unique circumstances or strategic considerations of the Company.
Components of our Compensation Program and Fiscal 2021 CompensationOur executive compensation program consists of the following primary components:
• base salary;
• cash bonuses;
• long-term equity compensation; and
• severance and change in control-related payments and benefits.
We also provide our executive officers with comprehensive employee benefit programs such as medical, dental and vision insurance, a 401(k) plan, life and disability insurance, flexible spending accounts, an employee stock purchase plan and other plans and programs made available to our eligible employees.
We believe these elements provide a compensation package that attracts and retains qualified individuals, links individual performance to Company performance, focuses the efforts of our NEOs and other executive officers on the achievement of both our short-term and long-term objectives and aligns the interests of our executive officers with those of our stockholders. The charts below show the pay mix of our CEO and other NEOs and the components of their pay for fiscal 2021, specifically the base salary and cash bonus amounts earned and the grant date fair value of equity awards granted in fiscal 2021.
Executive CompensationExecutive Compensation

PR
OX
Y
47Splunk 2021 Proxy Statement
CEO
All Other NEOs
4%BaseSalary
4%CashBonus
74% Performance-Based
8%Short-TermCash
92%Long-Term Equity
70%PSUs
22%RSUs
3%BaseSalary
4%CashBonus
75% Performance-Based
7%Short-TermCash
93%Long-Term Equity
71%PSUs
22%RSUs
In addition, the chart below illustrates the short-term and long-term timeframe over which the various components of the NEOs’ fiscal 2021 compensation are earned and paid and serve to continue to retain and incentivize our NEOs.
FYE January 31 2021 2022 2023 2024
BASE SALARY Paid throughout fiscal 2021
CASH BONUS Fiscal 2021 annual cash bonus (Full fiscal 2021 achievement determined and paid in April 2021)
LONG-TERM EQUITY COMPENSATION (RSUs)Fiscal 2021 awards granted in March 2020 (25% vested in March 2021, remaining 75% vest quarterly thereafter over next three years)
LONG-TERM EQUITY COMPENSATION (PSUs)Fiscal 2021 awards granted in March 2020 (25% of earned corporate PSUs vested in March 2021, remaining 75% of earned corporate PSUs vest quarterly thereafter over next three years)
(stock price PSUs eligible to be earned and to vest beginning in June 2022 on a quarterly basis through the end of the four-year vesting period of the corporate PSUs on March 2024)
During fiscal 2021, Compensia also performed services for us at the direction of the Compensation Committee relating to equity utilization, proxy statement support, and general Compensation Committee support. Compensia also advised the Compensation Committee on market practice and current trends and developments around executive compensation, in light of the COVID-19 pandemic.
Based on the consideration of the factors specified in the rules of the SEC and the listing standards of The NASDAQ Stock Market, the Compensation Committee does not believe that its relationship with Compensia and the work of Compensia on behalf of the Compensation Committee has raised any conflict of interest. The Compensation Committee reviews these factors on an annual basis. As part of the Compensation Committee’s determination of Compensia’s independence, it received written confirmation from Compensia addressing these factors and supporting the independence determination.
Peer GroupThe Compensation Committee reviews market data of companies that it believes are comparable to us. With Compensia’s assistance, the Compensation Committee developed a peer group for use when making its fiscal 2021 compensation decisions, which consisted of publicly traded software and software services companies headquartered in the U.S. that generally had revenue between 0.33x and 3.0x of our revenue, generally had experienced strong year-over-year revenue growth, and/or had a market capitalization between 0.33x and 3.0x of our market capitalization. The Compensation Committee referred to compensation data from this peer group when making fiscal 2021 base salary, cash bonus and equity award decisions for our executive officers. The following is a list of the public companies that comprised our fiscal 2021 peer group:
Akamai Technologies ANSYS
Arista Networks Autodesk
Citrix Systems
FortinetGuidewire Software
Intuit Palo Alto Networks
ServiceNow
Square SS&C Technologies
HoldingsTwitter
Veeva Systems
VerisignVMWare Workday
Zillow Group
For fiscal 2021, the Compensation Committee removed Red Hat, Tableau Software and The Ultimate Software Group from the peer group used in fiscal 2020 because they were acquired, and added Citrix Systems, Intuit and VMWare as additional peers based on the criteria described above. The remainder of the peer group was unchanged.
The Compensation Committee considers compensation data from our peer group as one of several factors that informs its judgment of appropriate parameters for compensation levels. The Compensation Committee does not strictly benchmark compensation to a specific percentile of our peer group, nor does it apply a formula or assign relative weightings to specific compensation elements. The Compensation Committee believes that over-reliance on benchmarking can result in compensation that is unrelated to the value delivered by our executive officers because compensation benchmarking does not take into account the specific performance of the executive officers, the relative size, growth, and performance of the Company, or any unique circumstances or strategic considerations of the Company.
Components of our Compensation Program and Fiscal 2021 CompensationOur executive compensation program consists of the following primary components:
• base salary;
• cash bonuses;
• long-term equity compensation; and
• severance and change in control-related payments and benefits.
We also provide our executive officers with comprehensive employee benefit programs such as medical, dental and vision insurance, a 401(k) plan, life and disability insurance, flexible spending accounts, an employee stock purchase plan and other plans and programs made available to our eligible employees.
We believe these elements provide a compensation package that attracts and retains qualified individuals, links individual performance to Company performance, focuses the efforts of our NEOs and other executive officers on the achievement of both our short-term and long-term objectives and aligns the interests of our executive officers with those of our stockholders. The charts below show the pay mix of our CEO and other NEOs and the components of their pay for fiscal 2021, specifically the base salary and cash bonus amounts earned and the grant date fair value of equity awards granted in fiscal 2021.
Executive CompensationExecutive Compensation

48 Splunk 2021 Proxy Statement
Base SalariesWe pay base salaries to our NEOs to compensate them for their services and provide predictable income. The salaries typically reflect each NEO’s experience, skills, knowledge and responsibilities, although market data also plays a role in setting salary levels. We do not apply specific formulas to determine changes in salaries. Instead, the salaries of our NEOs are reviewed on an annual basis by the Compensation Committee based on our compensation philosophy and objectives.
FISCAL 2021 BASE SALARIESThe Compensation Committee determined the fiscal 2021 base salary of each of our NEOs after considering market practice survey data of our peer group provided by Compensia, the recommendations of our CEO, other than with respect to his own base salary, and other factors described in “Compensation Process—Role of Compensation Committee” above. In particular, the Compensation Committee took note of Compensia’s findings that the fiscal 2020 base salary of our CEO was well-below our peer group median even after a modest increase in his base salary during the prior fiscal year. At the beginning of fiscal 2021, the Compensation Committee increased the base salaries for each of our NEOs to reflect each individual’s responsibilities and performance and to bring their base salaries to more competitive levels. As increased, our CEO’s fiscal 2021 base salary remained slightly below our peer group median.
The table below sets forth the annual base salaries for our NEOs for fiscal 2021.
NEOBase
SalaryPercentage Increase from
Fiscal 2020 Base Salary
Douglas Merritt $850,000 26%
Jason Child $485,000 5%
Scott Morgan $430,000 15%
Susan St. Ledger(1) $ 525,000 11%
Timothy Tully $ 475,000 13%
(1) Ms. St. Ledger’s employment with the Company terminated on January 31, 2021.
Cash BonusesA key objective of our compensation philosophy is to tie a significant portion of each NEO’s compensation to our performance. To help accomplish this objective, we provide annual performance-based cash bonus opportunities for our NEOs, which are earned based on our achievement against corporate performance objectives established at the beginning of the fiscal year.
At the beginning of fiscal 2021, our Board approved our fiscal 2021 operating plan, which included performance objectives that the Compensation Committee and our CEO used to design our NEOs’ cash bonus opportunity for fiscal 2021. For purposes of our executive bonus plan, the Compensation Committee considered a number of factors in selecting the performance objectives applicable to our NEOs’ annual cash bonus opportunities, including stockholder feedback to consider performance objectives that tie to our business strategy and are appropriate for our ongoing business transformation to a subscription model. The Compensation Committee determined that revenue-related objectives were of critical importance and aligned with the key drivers of success during this phase of our business model transformation and reflected the health of our business during the transformation.
FISCAL 2021 TARGET ANNUAL CASH BONUS OPPORTUNITIES
As in prior years, the target annual cash bonus opportunities for our NEOs were expressed as a percentage of their respective base salaries. At the beginning of fiscal 2021, the Compensation Committee, taking market data into consideration and in consultation with Mr. Merritt (other than with respect to himself), increased the percentages for certain of our NEOs’ (other than Mr. Merritt and Ms. St. Ledger) target cash bonus opportunities. The Compensation Committee decided to maintain the percentages for Mr. Merritt’s and Ms. St. Ledger’s target cash bonus opportunities but due to the base salary increases described above, the dollar amount of the target cash bonus opportunities increased for Mr. Merritt and Ms. St. Ledger. The table below shows the target annual cash bonus opportunity for each NEO as a percentage of his or her base salary and as a corresponding dollar amount:
NEO
Fiscal 2021 Target Bonus as a
Percentage of Salary
Fiscal 2021 Target Bonus as a
Dollar Amount
Change from Fiscal2020 Target Bonus as a
Percentage of Salary
Douglas Merritt 125% $1,062,500 0%
Jason Child 80% $388,000 5%
Scott Morgan 70% $301,000 10%
Susan St. Ledger 100% $525,000 0%
Timothy Tully 80% $380,000 10%
Fiscal 2021 bonuses were capped at 200% of target for our non-sales executive NEOs and at 300% of target for Ms. St. Ledger, our former senior sales executive. Ms. St. Ledger’s maximum annual cash bonus opportunity was higher given the strong link between her job responsibilities and our sales quota achievement.
FISCAL 2021 PERFORMANCE OBJECTIVESFor purposes of the executive bonus plan, in March 2020 the Compensation Committee selected annual recurring revenue (“ARR”) and, in the case of Ms. St. Ledger, annual contract value (“ACV”), as the performance objectives for fiscal 2021. ARR represents the annualized revenue run-rate of active term license, maintenance, and subscription contracts at the end of a reporting period as reported in our Annual Report on Form 10-K for fiscal 2021, but excluding any ARR recognized during the performance period from acquisitions made during the performance period.
In March 2020, the Compensation Committee, to motivate Mr. Merritt and our other NEOs to continue to grow and develop our business during our business model transformation, established target levels for ARR and ACV performance for fiscal 2021 that it considered very aggressive, yet achievable with focused effort and execution by our NEOs, and that reflected a rigorous increase in growth relative to our prior fiscal year ARR and ACV achievement. For example, our fiscal 2021 ARR target established in March 2020 reflected an increase of 45% over our fiscal 2020 ARR results, and maximum achievement required an increase of 48% or more over our fiscal 2020 ARR results. These performance objectives were selected and designed to drive increased ARR and ACV, which the Compensation Committee believed would increase stockholder value consistent with our overall growth strategy. When the performance matrices were set in March 2020, the Compensation Committee believed they offered meaningful incentives to our NEOs to focus on long-term value creation and grow our business during the business model transformation. However, the Compensation Committee made the specific determination, in light of the unknown impact of the COVID-19 pandemic, to retain its discretion to modify performance matrices at mid-year due to, among other things, extraordinary factors, if the Compensation Committee determined that the performance matrices no longer offered the appropriate performance incentives.
Executive CompensationExecutive Compensation

PR
OX
Y
49Splunk 2021 Proxy Statement
Base SalariesWe pay base salaries to our NEOs to compensate them for their services and provide predictable income. The salaries typically reflect each NEO’s experience, skills, knowledge and responsibilities, although market data also plays a role in setting salary levels. We do not apply specific formulas to determine changes in salaries. Instead, the salaries of our NEOs are reviewed on an annual basis by the Compensation Committee based on our compensation philosophy and objectives.
FISCAL 2021 BASE SALARIESThe Compensation Committee determined the fiscal 2021 base salary of each of our NEOs after considering market practice survey data of our peer group provided by Compensia, the recommendations of our CEO, other than with respect to his own base salary, and other factors described in “Compensation Process—Role of Compensation Committee” above. In particular, the Compensation Committee took note of Compensia’s findings that the fiscal 2020 base salary of our CEO was well-below our peer group median even after a modest increase in his base salary during the prior fiscal year. At the beginning of fiscal 2021, the Compensation Committee increased the base salaries for each of our NEOs to reflect each individual’s responsibilities and performance and to bring their base salaries to more competitive levels. As increased, our CEO’s fiscal 2021 base salary remained slightly below our peer group median.
The table below sets forth the annual base salaries for our NEOs for fiscal 2021.
NEOBase
SalaryPercentage Increase from
Fiscal 2020 Base Salary
Douglas Merritt $850,000 26%
Jason Child $485,000 5%
Scott Morgan $430,000 15%
Susan St. Ledger(1) $ 525,000 11%
Timothy Tully $ 475,000 13%
(1) Ms. St. Ledger’s employment with the Company terminated on January 31, 2021.
Cash BonusesA key objective of our compensation philosophy is to tie a significant portion of each NEO’s compensation to our performance. To help accomplish this objective, we provide annual performance-based cash bonus opportunities for our NEOs, which are earned based on our achievement against corporate performance objectives established at the beginning of the fiscal year.
At the beginning of fiscal 2021, our Board approved our fiscal 2021 operating plan, which included performance objectives that the Compensation Committee and our CEO used to design our NEOs’ cash bonus opportunity for fiscal 2021. For purposes of our executive bonus plan, the Compensation Committee considered a number of factors in selecting the performance objectives applicable to our NEOs’ annual cash bonus opportunities, including stockholder feedback to consider performance objectives that tie to our business strategy and are appropriate for our ongoing business transformation to a subscription model. The Compensation Committee determined that revenue-related objectives were of critical importance and aligned with the key drivers of success during this phase of our business model transformation and reflected the health of our business during the transformation.
FISCAL 2021 TARGET ANNUAL CASH BONUS OPPORTUNITIES
As in prior years, the target annual cash bonus opportunities for our NEOs were expressed as a percentage of their respective base salaries. At the beginning of fiscal 2021, the Compensation Committee, taking market data into consideration and in consultation with Mr. Merritt (other than with respect to himself), increased the percentages for certain of our NEOs’ (other than Mr. Merritt and Ms. St. Ledger) target cash bonus opportunities. The Compensation Committee decided to maintain the percentages for Mr. Merritt’s and Ms. St. Ledger’s target cash bonus opportunities but due to the base salary increases described above, the dollar amount of the target cash bonus opportunities increased for Mr. Merritt and Ms. St. Ledger. The table below shows the target annual cash bonus opportunity for each NEO as a percentage of his or her base salary and as a corresponding dollar amount:
NEO
Fiscal 2021 Target Bonus as a
Percentage of Salary
Fiscal 2021 Target Bonus as a
Dollar Amount
Change from Fiscal2020 Target Bonus as a
Percentage of Salary
Douglas Merritt 125% $1,062,500 0%
Jason Child 80% $388,000 5%
Scott Morgan 70% $301,000 10%
Susan St. Ledger 100% $525,000 0%
Timothy Tully 80% $380,000 10%
Fiscal 2021 bonuses were capped at 200% of target for our non-sales executive NEOs and at 300% of target for Ms. St. Ledger, our former senior sales executive. Ms. St. Ledger’s maximum annual cash bonus opportunity was higher given the strong link between her job responsibilities and our sales quota achievement.
FISCAL 2021 PERFORMANCE OBJECTIVESFor purposes of the executive bonus plan, in March 2020 the Compensation Committee selected annual recurring revenue (“ARR”) and, in the case of Ms. St. Ledger, annual contract value (“ACV”), as the performance objectives for fiscal 2021. ARR represents the annualized revenue run-rate of active term license, maintenance, and subscription contracts at the end of a reporting period as reported in our Annual Report on Form 10-K for fiscal 2021, but excluding any ARR recognized during the performance period from acquisitions made during the performance period.
In March 2020, the Compensation Committee, to motivate Mr. Merritt and our other NEOs to continue to grow and develop our business during our business model transformation, established target levels for ARR and ACV performance for fiscal 2021 that it considered very aggressive, yet achievable with focused effort and execution by our NEOs, and that reflected a rigorous increase in growth relative to our prior fiscal year ARR and ACV achievement. For example, our fiscal 2021 ARR target established in March 2020 reflected an increase of 45% over our fiscal 2020 ARR results, and maximum achievement required an increase of 48% or more over our fiscal 2020 ARR results. These performance objectives were selected and designed to drive increased ARR and ACV, which the Compensation Committee believed would increase stockholder value consistent with our overall growth strategy. When the performance matrices were set in March 2020, the Compensation Committee believed they offered meaningful incentives to our NEOs to focus on long-term value creation and grow our business during the business model transformation. However, the Compensation Committee made the specific determination, in light of the unknown impact of the COVID-19 pandemic, to retain its discretion to modify performance matrices at mid-year due to, among other things, extraordinary factors, if the Compensation Committee determined that the performance matrices no longer offered the appropriate performance incentives.
Executive CompensationExecutive Compensation

50 Splunk 2021 Proxy Statement
In prior years, after the midpoint of a fiscal year, the Compensation Committee, with input from our management team, has reviewed our financial performance against the revenue target applicable to the target annual cash bonus opportunities of our NEOs and determined whether to pay out semi-annual bonuses provided we were on track to achieve our annual targets. This year, in light of the degree of uncertainty in the Company’s business outlook and the measures we had implemented to reduce our expenses, the Compensation Committee, after consultation with our management team, agreed to not award the semi-annual bonus payments to our NEOs. This decision was in alignment with the action taken to suspend payout of the second and third quarter bonuses for all employees.
The Compensation Committee, in consultation with Compensia, evaluated whether the target levels and bonus payout multiples set in March 2020 would still offer the appropriate incentives for our NEOs to drive growth in our business over the remainder of fiscal 2021, given the uncertainties identified by the Compensation Committee, and the increased efforts needed from our NEOs due to such uncertainties in the macro environment, including the impact of the COVID-19 pandemic on our business being coupled with the complexities associated with business model transformations. As a result of this evaluation, in October 2020, the Compensation Committee exercised its discretion and adjusted the targets as well as the tiers of the ARR and ACV metrics payout multiples relative to target for the executive bonus plan. The adjustments to the ARR metric also applied to the corporate bonus plan for our non-sales employees.
In connection with Ms. St. Ledger’s resignation as President, Worldwide Field Operations in September 2020, and her transition to an advisory role to our CEO, the Compensation Committee determined it was appropriate to transition Ms. St. Ledger’s fiscal 2021 performance objectives under the executive bonus plan from ACV to ARR effective as of October 1, 2020. Ms. St. Ledger’s fiscal 2021 performance objectives under the executive bonus plan are adjusted ACV from February 1, 2020 through September 30, 2020 and adjusted ARR from October 1, 2020 through January 31, 2021.
Our Non-Sales Executive NEOs. In light of the uncertainties and complexities described above, the Compensation Committee, in consultation with Compensia, believed that adjusting our fiscal 2021 ARR target from a 45% ARR growth rate to a 40% ARR growth rate reflected a more appropriate growth goal given the unprecedented macro environment while continuing to incentivize our executives to persevere in their commitment to achieve an aggressive growth rate that would reflect a high level of achievement and ultimately deliver value to our stockholders. In light of the increased efforts required of our NEOs due to the uncertainties in the macro environment, including the impact of the COVID-19 pandemic on our business being coupled with the complexities associated with business model transformations, the Compensation Committee determined that the adjusted ARR target growth rate of 40% was appropriate and in the best interests of the Company’s stockholders. In October 2020, the Compensation Committee adjusted target bonus opportunities based on ARR achievement and bonus payout multiples for fiscal 2021 as follows:
Fiscal 2021 ARR (in millions)(1)
YoY ARR Growth
Bonus Payout Multiple Relative
to TargetMax $2,453 or more 46.0% 200%
$2,440 45.2% 175%
$2,394 42.5% 150%
$2,374 41.3% 125%
Target $2,352 40.0% 100%
$2,332 38.8% 87.5%
$2,285 36.0% 75%
Threshold $2,268 35.0% 50%
Less than $2,268 Less than 35.0% 0%
(1) Excluding ARR recognized during the fiscal year from acquisitions made during the fiscal year.
Our Non-Sales Executive NEOs. The target annual cash bonus opportunities for our NEOs (other than Ms. St. Ledger) were based on our ARR performance. The following chart presents the tiers of the bonus payout multiples relative to the target bonus opportunity based on ARR achievement (with linear interpolation in between tiers).
Fiscal 2021 ARR (in millions)(1)
YoY ARR Growth
Bonus Payout Multiple Relative to Target
Max $2,495 or more 48% 200%
$2,480 48% 165%
$2,465 47% 130%
$2,453 46% 110%
Target $2,440 45% 100%
$2,422 44% 75%
Threshold $2,404 43% 50%
Less than $2,404 Less than 43% 0%
(1) Excluding ARR recognized during the fiscal year from acquisitions made during the fiscal year.
Our Sales Executive NEO. The fiscal 2021 target annual cash bonus opportunity for Ms. St. Ledger was initially based entirely on our ACV performance. We are not disclosing the target level for this performance objective because we believe disclosure would be competitively harmful, as it would give our competitors insight into our strategic and financial planning process. The following chart presents certain tiers of the bonus payout multiples based on the percentage attainment of the ACV target (with linear interpolation in between tiers).
Percentage Attainment of TargetBonus Payout Multiple
Relative to Target112% or more 300%
110% 260%
109% 240%
107% 200%
103% 140%
102% 105%
100% 100%
97.5% 75%
95% 50%
Less than 95% 0%
MID-YEAR CHANGES TO FISCAL 2021 PERFORMANCE OBJECTIVESAfter setting target levels and bonus payout multiples under our executive bonus plan in March 2020, the Compensation Committee continued to monitor the evolving and unpredictable impact of the COVID-19 pandemic on our customers, partners, global economies and financial markets and the corresponding impact to our business and ARR and ACV generation.
Following our first quarter of fiscal 2021, we reported for the period some impacts to our business as customers across all sectors tried to understand the economic impacts of the pandemic, including shorter contract durations and limited visibility over the next few quarters primarily due to the macro environment. In addition, we withdrew our guidance for revenue and operating margin given the unpredictability of our accelerating business model transformation and variability and duration.
Following our second quarter of fiscal 2021, we reported for the period some customer hesitancy to commit to long-term contracts, especially for larger orders. We noted seeing many businesses under pressure with increasing scrutiny on spend, as well as uncertainty in our public sector business. We also experienced hindered collectability of receivables and certain customers decreased or delayed their information technology spending, purchased shorter term contracts or requested payment concessions, which resulted in decreased ARR and ACV. Correspondingly, the Compensation Committee identified continuing uncertainties in the macro environment, including the impact of the COVID-19 pandemic on our business being coupled with the complexities associated with business model transformations, which led the Compensation Committee to reexamine target levels and bonus and PSU payout multiples for fiscal 2021 previously set by it in March 2020.
Executive CompensationExecutive Compensation

PR
OX
Y
51Splunk 2021 Proxy Statement
In prior years, after the midpoint of a fiscal year, the Compensation Committee, with input from our management team, has reviewed our financial performance against the revenue target applicable to the target annual cash bonus opportunities of our NEOs and determined whether to pay out semi-annual bonuses provided we were on track to achieve our annual targets. This year, in light of the degree of uncertainty in the Company’s business outlook and the measures we had implemented to reduce our expenses, the Compensation Committee, after consultation with our management team, agreed to not award the semi-annual bonus payments to our NEOs. This decision was in alignment with the action taken to suspend payout of the second and third quarter bonuses for all employees.
The Compensation Committee, in consultation with Compensia, evaluated whether the target levels and bonus payout multiples set in March 2020 would still offer the appropriate incentives for our NEOs to drive growth in our business over the remainder of fiscal 2021, given the uncertainties identified by the Compensation Committee, and the increased efforts needed from our NEOs due to such uncertainties in the macro environment, including the impact of the COVID-19 pandemic on our business being coupled with the complexities associated with business model transformations. As a result of this evaluation, in October 2020, the Compensation Committee exercised its discretion and adjusted the targets as well as the tiers of the ARR and ACV metrics payout multiples relative to target for the executive bonus plan. The adjustments to the ARR metric also applied to the corporate bonus plan for our non-sales employees.
In connection with Ms. St. Ledger’s resignation as President, Worldwide Field Operations in September 2020, and her transition to an advisory role to our CEO, the Compensation Committee determined it was appropriate to transition Ms. St. Ledger’s fiscal 2021 performance objectives under the executive bonus plan from ACV to ARR effective as of October 1, 2020. Ms. St. Ledger’s fiscal 2021 performance objectives under the executive bonus plan are adjusted ACV from February 1, 2020 through September 30, 2020 and adjusted ARR from October 1, 2020 through January 31, 2021.
Our Non-Sales Executive NEOs. In light of the uncertainties and complexities described above, the Compensation Committee, in consultation with Compensia, believed that adjusting our fiscal 2021 ARR target from a 45% ARR growth rate to a 40% ARR growth rate reflected a more appropriate growth goal given the unprecedented macro environment while continuing to incentivize our executives to persevere in their commitment to achieve an aggressive growth rate that would reflect a high level of achievement and ultimately deliver value to our stockholders. In light of the increased efforts required of our NEOs due to the uncertainties in the macro environment, including the impact of the COVID-19 pandemic on our business being coupled with the complexities associated with business model transformations, the Compensation Committee determined that the adjusted ARR target growth rate of 40% was appropriate and in the best interests of the Company’s stockholders. In October 2020, the Compensation Committee adjusted target bonus opportunities based on ARR achievement and bonus payout multiples for fiscal 2021 as follows:
Fiscal 2021 ARR (in millions)(1)
YoY ARR Growth
Bonus Payout Multiple Relative
to TargetMax $2,453 or more 46.0% 200%
$2,440 45.2% 175%
$2,394 42.5% 150%
$2,374 41.3% 125%
Target $2,352 40.0% 100%
$2,332 38.8% 87.5%
$2,285 36.0% 75%
Threshold $2,268 35.0% 50%
Less than $2,268 Less than 35.0% 0%
(1) Excluding ARR recognized during the fiscal year from acquisitions made during the fiscal year.
Our Non-Sales Executive NEOs. The target annual cash bonus opportunities for our NEOs (other than Ms. St. Ledger) were based on our ARR performance. The following chart presents the tiers of the bonus payout multiples relative to the target bonus opportunity based on ARR achievement (with linear interpolation in between tiers).
Fiscal 2021 ARR (in millions)(1)
YoY ARR Growth
Bonus Payout Multiple Relative to Target
Max $2,495 or more 48% 200%
$2,480 48% 165%
$2,465 47% 130%
$2,453 46% 110%
Target $2,440 45% 100%
$2,422 44% 75%
Threshold $2,404 43% 50%
Less than $2,404 Less than 43% 0%
(1) Excluding ARR recognized during the fiscal year from acquisitions made during the fiscal year.
Our Sales Executive NEO. The fiscal 2021 target annual cash bonus opportunity for Ms. St. Ledger was initially based entirely on our ACV performance. We are not disclosing the target level for this performance objective because we believe disclosure would be competitively harmful, as it would give our competitors insight into our strategic and financial planning process. The following chart presents certain tiers of the bonus payout multiples based on the percentage attainment of the ACV target (with linear interpolation in between tiers).
Percentage Attainment of TargetBonus Payout Multiple
Relative to Target112% or more 300%
110% 260%
109% 240%
107% 200%
103% 140%
102% 105%
100% 100%
97.5% 75%
95% 50%
Less than 95% 0%
MID-YEAR CHANGES TO FISCAL 2021 PERFORMANCE OBJECTIVESAfter setting target levels and bonus payout multiples under our executive bonus plan in March 2020, the Compensation Committee continued to monitor the evolving and unpredictable impact of the COVID-19 pandemic on our customers, partners, global economies and financial markets and the corresponding impact to our business and ARR and ACV generation.
Following our first quarter of fiscal 2021, we reported for the period some impacts to our business as customers across all sectors tried to understand the economic impacts of the pandemic, including shorter contract durations and limited visibility over the next few quarters primarily due to the macro environment. In addition, we withdrew our guidance for revenue and operating margin given the unpredictability of our accelerating business model transformation and variability and duration.
Following our second quarter of fiscal 2021, we reported for the period some customer hesitancy to commit to long-term contracts, especially for larger orders. We noted seeing many businesses under pressure with increasing scrutiny on spend, as well as uncertainty in our public sector business. We also experienced hindered collectability of receivables and certain customers decreased or delayed their information technology spending, purchased shorter term contracts or requested payment concessions, which resulted in decreased ARR and ACV. Correspondingly, the Compensation Committee identified continuing uncertainties in the macro environment, including the impact of the COVID-19 pandemic on our business being coupled with the complexities associated with business model transformations, which led the Compensation Committee to reexamine target levels and bonus and PSU payout multiples for fiscal 2021 previously set by it in March 2020.
Executive CompensationExecutive Compensation

52 Splunk 2021 Proxy Statement
The following chart summarizes the target and actual total cash bonus payments made to our NEOs for fiscal 2021:
Douglas Merritt Jason Child
Fiscal 2021 Target Cash Bonus
Scott Morgan Susan St. Ledger Timothy Tully
$1,062,500$1,132,306
$388,000$301,000 $320,776
$525,000 $516,828
$380,000 $404,966$413,492
Fiscal 2021 Cash Bonus Paid
$0
$200,000
$400,000
$600,000
$800,000
$1,000,000
$1,200,000
Under the original target levels and bonus payment multiples for our executive bonus plan approved in March 2020, no NEO (other than Ms. St. Ledger) would have earned a bonus in fiscal 2021. Ms. St. Ledger would have earned approximately half of her fiscal 2021 target annual cash bonus opportunity. As described above, in October 2020, we modified the targets as well as the tiers of the ARR and ACV metrics payout multiples relative to target under our executive bonus plan to ensure adequate incentives for our NEOs to persevere in their commitment to aggressively drive growth in our business for the remainder of fiscal 2021. These revised metrics were developed with input from our management team and Compensia, and were set at levels that the Compensation Committee determined to be appropriate, particularly given the uncertainties in the macro environment at the time, including the impact of the COVID-19 pandemic on our business being coupled with the complexities associated with business model transformations, and the increased efforts required from our NEOs. Due to the strong finish to a volatile year in the fourth quarter of fiscal 2021 and the leadership of our NEOs in ending the year with total ARR of $2.365 billion, up 41% over the previous fiscal year, the executive bonus plan funded at above target, in accordance with the revised target levels and payout multiples. The Compensation Committee believed it was appropriate to reward our NEOs for this outstanding accomplishment and leadership, and not make any adjustments to our NEOs’ fiscal 2021 bonus payments that otherwise would be earned under the revised metrics.
Long-Term Equity CompensationOur equity compensation program focuses the efforts of our NEOs and other executive officers on the achievement of long-term objectives and aligns the interests of our executive officers with those of our stockholders through the grant of equity awards, the value of which depends on our stock performance and other performance measures, to achieve strong long-term performance.
These equity awards consist of time-based RSUs and performance-based PSUs granted to our executive officers. We believe that RSUs offer predictable value delivery and promote retention of our executive officers while aligning their interests with the long-term interests of our stockholders in a manner consistent with competitive market practices. We believe that PSUs directly link a significant portion of our executive officers’ target total direct compensation to our financial and stock price performance based on the achievement of multiple, distinct and pre-established financial and stock price performance metrics. Together, RSUs and PSUs are important tools to motivate and retain our highly valuable executive officers since the value of the awards is delivered to our executive officers over a four-year period subject to their continued service. We may modify our equity award program, including performance targets, to our executive officers, including our NEOs, to continue to maintain a strong alignment of their interests with the interests of our stockholders.
The Compensation Committee, in consultation with our CEO (other than with respect to himself) and Compensia determines the size, mix, material terms and, in the case of PSUs, performance metrics of the equity awards granted to our executive officers, taking into account a number of factors as described in “Compensation Process—Role of Compensation Committee” above.
Our Sales Executive NEO. In light of the uncertainties and complexities described above, the Compensation Committee, in consultation with Compensia, believed that corresponding changes to the ACV targets were appropriate. We are not disclosing the target level for ACV performance as we believe disclosure would be competitively harmful, as it would give our competitors insight into our strategic and financial planning process. The following chart presents certain tiers of the adjusted bonus payout multiples based on the percentage attainment of the adjusted ACV target (with linear interpolation between tiers):
Percentage Attainment of TargetBonus Payout Multiple
Relative to Target112% or more 300%110% 260%109% 240%107% 200%103% 150%101% 125%100% 100%95% 75%94% 50%Less than 94% 0%
FISCAL 2021 CASH BONUS PAYMENTS
As mentioned above, following our second quarter of fiscal 2021, the Compensation Committee, after consultation with our management team, agreed to not award semi-annual bonus payments of 50% of each of our NEO’s fiscal 2021 target annual cash bonus opportunity.
Our Non-Sales Executive NEOs. After the conclusion of fiscal 2021, the Compensation Committee evaluated our performance against the adjusted ARR target for the full year. The Compensation Committee determined that we had achieved ARR of $2.365 billion, which represented a 41% increase from our fiscal 2020 ARR. In accordance with the adjusted payout multiples established under the executive bonus plan, the Compensation Committee approved bonus payments to our NEOs (other than Ms. St. Ledger) in an amount that resulted in total fiscal 2021 bonus payments for each equaling 106.57% of his respective fiscal 2021 target annual cash bonus opportunity.
Our Sales Executive NEO. After the conclusion of fiscal 2021, the Compensation Committee evaluated our performance against the ACV target for the full year and determined that we achieved approximately 94.33% of the adjusted ACV target. As described above, Ms. St. Ledger’s fiscal 2021 bonus payout was determined in accordance with the adjusted payout multiples established under the executive bonus plan, and prorated based on the adjusted ACV metric from February 1, 2020 through September 30, 2020 and on the adjusted ARR metric from October 1, 2020 through January 31, 2021. Accordingly, the Compensation Committee approved a bonus payment to Ms. St. Ledger in an amount that resulted in a total fiscal 2021 bonus payment equaling 98.44% of her fiscal 2021 target annual cash bonus opportunity.
Executive CompensationExecutive Compensation

PR
OX
Y
53Splunk 2021 Proxy Statement
The following chart summarizes the target and actual total cash bonus payments made to our NEOs for fiscal 2021:
Douglas Merritt Jason Child
Fiscal 2021 Target Cash Bonus
Scott Morgan Susan St. Ledger Timothy Tully
$1,062,500$1,132,306
$388,000$301,000 $320,776
$525,000 $516,828
$380,000 $404,966$413,492
Fiscal 2021 Cash Bonus Paid
$0
$200,000
$400,000
$600,000
$800,000
$1,000,000
$1,200,000
Under the original target levels and bonus payment multiples for our executive bonus plan approved in March 2020, no NEO (other than Ms. St. Ledger) would have earned a bonus in fiscal 2021. Ms. St. Ledger would have earned approximately half of her fiscal 2021 target annual cash bonus opportunity. As described above, in October 2020, we modified the targets as well as the tiers of the ARR and ACV metrics payout multiples relative to target under our executive bonus plan to ensure adequate incentives for our NEOs to persevere in their commitment to aggressively drive growth in our business for the remainder of fiscal 2021. These revised metrics were developed with input from our management team and Compensia, and were set at levels that the Compensation Committee determined to be appropriate, particularly given the uncertainties in the macro environment at the time, including the impact of the COVID-19 pandemic on our business being coupled with the complexities associated with business model transformations, and the increased efforts required from our NEOs. Due to the strong finish to a volatile year in the fourth quarter of fiscal 2021 and the leadership of our NEOs in ending the year with total ARR of $2.365 billion, up 41% over the previous fiscal year, the executive bonus plan funded at above target, in accordance with the revised target levels and payout multiples. The Compensation Committee believed it was appropriate to reward our NEOs for this outstanding accomplishment and leadership, and not make any adjustments to our NEOs’ fiscal 2021 bonus payments that otherwise would be earned under the revised metrics.
Long-Term Equity CompensationOur equity compensation program focuses the efforts of our NEOs and other executive officers on the achievement of long-term objectives and aligns the interests of our executive officers with those of our stockholders through the grant of equity awards, the value of which depends on our stock performance and other performance measures, to achieve strong long-term performance.
These equity awards consist of time-based RSUs and performance-based PSUs granted to our executive officers. We believe that RSUs offer predictable value delivery and promote retention of our executive officers while aligning their interests with the long-term interests of our stockholders in a manner consistent with competitive market practices. We believe that PSUs directly link a significant portion of our executive officers’ target total direct compensation to our financial and stock price performance based on the achievement of multiple, distinct and pre-established financial and stock price performance metrics. Together, RSUs and PSUs are important tools to motivate and retain our highly valuable executive officers since the value of the awards is delivered to our executive officers over a four-year period subject to their continued service. We may modify our equity award program, including performance targets, to our executive officers, including our NEOs, to continue to maintain a strong alignment of their interests with the interests of our stockholders.
The Compensation Committee, in consultation with our CEO (other than with respect to himself) and Compensia determines the size, mix, material terms and, in the case of PSUs, performance metrics of the equity awards granted to our executive officers, taking into account a number of factors as described in “Compensation Process—Role of Compensation Committee” above.
Our Sales Executive NEO. In light of the uncertainties and complexities described above, the Compensation Committee, in consultation with Compensia, believed that corresponding changes to the ACV targets were appropriate. We are not disclosing the target level for ACV performance as we believe disclosure would be competitively harmful, as it would give our competitors insight into our strategic and financial planning process. The following chart presents certain tiers of the adjusted bonus payout multiples based on the percentage attainment of the adjusted ACV target (with linear interpolation between tiers):
Percentage Attainment of TargetBonus Payout Multiple
Relative to Target112% or more 300%110% 260%109% 240%107% 200%103% 150%101% 125%100% 100%95% 75%94% 50%Less than 94% 0%
FISCAL 2021 CASH BONUS PAYMENTS
As mentioned above, following our second quarter of fiscal 2021, the Compensation Committee, after consultation with our management team, agreed to not award semi-annual bonus payments of 50% of each of our NEO’s fiscal 2021 target annual cash bonus opportunity.
Our Non-Sales Executive NEOs. After the conclusion of fiscal 2021, the Compensation Committee evaluated our performance against the adjusted ARR target for the full year. The Compensation Committee determined that we had achieved ARR of $2.365 billion, which represented a 41% increase from our fiscal 2020 ARR. In accordance with the adjusted payout multiples established under the executive bonus plan, the Compensation Committee approved bonus payments to our NEOs (other than Ms. St. Ledger) in an amount that resulted in total fiscal 2021 bonus payments for each equaling 106.57% of his respective fiscal 2021 target annual cash bonus opportunity.
Our Sales Executive NEO. After the conclusion of fiscal 2021, the Compensation Committee evaluated our performance against the ACV target for the full year and determined that we achieved approximately 94.33% of the adjusted ACV target. As described above, Ms. St. Ledger’s fiscal 2021 bonus payout was determined in accordance with the adjusted payout multiples established under the executive bonus plan, and prorated based on the adjusted ACV metric from February 1, 2020 through September 30, 2020 and on the adjusted ARR metric from October 1, 2020 through January 31, 2021. Accordingly, the Compensation Committee approved a bonus payment to Ms. St. Ledger in an amount that resulted in a total fiscal 2021 bonus payment equaling 98.44% of her fiscal 2021 target annual cash bonus opportunity.
Executive CompensationExecutive Compensation

54 Splunk 2021 Proxy Statement
FISCAL 2021 EQUITY AWARDSAnnual Equity Awards. In March 2020, the Compensation Committee granted RSUs and PSUs to each of our NEOs. The following table sets forth the number of shares of our common stock subject to the RSUs and PSUs granted to each NEO.
NEONature of
Equity AwardsPercentage of
Award as RSUsRSUs
(number of shares)Percentage of
Award as PSUsTarget PSUs
(number of shares)
Total Target Value
($)(1)
Douglas Merritt Annual 40% 57,313 60% 85,970 16,475,665
Jason Child Annual 40% 24,268 60% 36,402 6,976,306
Scott Morgan Annual 40% 15,490 60% 23,235 4,452,921
Susan St. Ledger Annual 40% 25,817 60% 38,725 7,421,504
Timothy Tully Annual 40% 24,268 60% 36,402 6,976,306
(1) Excludes the aggregate incremental fair value generated by the modification of the fiscal 2021 PSUs as described in footnote 1 of the 2021 Summary Compensation Table. See “Mid-Year Changes to Fiscal 2021 Performance Objectives” below.
Each grant to the NEOs in fiscal 2021 was made by our Compensation Committee in consultation with Compensia and after considering the factors described above. The annual RSUs granted to the NEOs in fiscal 2021 vest over four years with 25% vesting approximately one year after the grant date, and 75% vesting quarterly thereafter over the remaining three years, subject to the NEO’s continued service with us on each vesting date. The annual PSUs granted to the NEOs in fiscal 2021 vest over four years and may be earned based on corporate performance metrics and a stock price performance modifier. The corporate performance metrics have a one-year performance period, with 25% of earned corporate PSUs vesting shortly following the end of the performance period and 75% vesting quarterly thereafter over the remaining three years, subject to the NEO’s continued service with us on each vesting date. In order to further align the interests of our NEOs and stockholders, a modifier to any earned corporate PSUs provides an opportunity to earn additional PSUs based on the Company’s stock price growth rate over a multi-year performance period. Other terms and conditions are described in the “PSU Award Design” section below.
PSU Award Design. The principal terms and conditions of the fiscal 2021 PSUs, as well as the rationale for our design approach, are set forth in the following table:
PSU Feature Our Approach Our Rationale
Corporate PSUs
Corporate Performance Metrics
• Two corporate metrics–70% based on ARR achievement and 30% based on operating cash flow achievement
• ARR represents the annualized revenue run-rate of active term license, maintenance, and subscription contracts at the end of a reporting period as reported in our Annual Report on Form 10-K for fiscal 2021, but excluding any ARR recognized during the performance period from acquisitions made during the performance period
• The operating cash flow metric is as determined under GAAP, but excluding the impact from any acquisitions made during the performance period
• Motivate and incentivize our executives to drive top-line growth in our business while enhancing their focus on specific financial goals considered important to the Company’s long-term growth
• Use of ARR as both a PSU metric and an executive bonus plan metric underscores the importance of top-line growth and is a key driver of stockholder value during our ongoing business transformation to a subscription model. ARR is currently a key performance metric to assess the health and trajectory of our business and the success of our business model transformation
• Use of operating cash flow as a performance metric reflects focus on disciplined execution of our business objectives during our ongoing business transformation to a subscription model
• Belief that our strategy of investing in our business for growth is appropriate given the significant market opportunity available to us
• Once the business model transformation is complete, and as our business matures and financial results become more predictable, we intend to consider different and longer-term metrics that continue to align with our stockholders’ interests
PSU Feature Our Approach Our Rationale
Corporate PSUs
Targets for Corporate Performance Metrics
• Target ARR and operating cash flow were initially set based on public financial guidance at the beginning of fiscal 2021; target ARR was adjusted in October 2020 based on an appropriate growth goal given the uncertainties in the macro environment, including the impact of the COVID-19 pandemic on our business being coupled with the complexities associated with business model transformations, and the level of effort and leadership required to achieve such results in such circumstances, while continuing to incentivize our executives to achieve an aggressive growth rate that would reflect a high level of achievement
• Adjusted target ARR for fiscal 2021 reflected an increase of 40% over our fiscal 2020 ARR results, and maximum achievement required an increase of 46% or more over our fiscal 2020 ARR results
• Align the interests of our executives with those of our stockholders through performance targets that correlate with key drivers of stockholder value
• Minimum (threshold) and maximum performance levels provide accountability for underperformance and incentive for overperformance
• Capped, maximum payouts only possible when the Company has exceptional performance
Corporate Performance Period
• One-year performance period for corporate performance metrics in fiscal 2021
• Earned corporate PSUs will not fully vest until approximately four years after date of grant, thus placing awards at-risk for a prolonged period
• Our rapid growth and ongoing transition to a subscription model makes performance periods difficult to estimate over a longer period
• Allows for adjusted priorities in a rapidly changing competitive business environment
• Our historical financial outperformance• Risk of setting inappropriate target levels that may
not align with our stockholders’ interests if we were to project more than one year in advance
Corporate PSU Vesting Schedule
• 25% of earned corporate PSUs vested shortly following the end of the performance period and upon approval of our fiscal 2021 audited financial statements
• Remainder will vest quarterly over the next three years, subject to continued service through each vesting date
• Time-based vesting schedule for earned corporate PSUs provides additional long-term retention incentives and encourages our NEOs to take a long-term view of our business
Stock Price Modifier
• Up to an additional 50% of the number of earned corporate PSUs can be earned if our stock price growth rate is (a) equal to or greater than that of the SPDR S&P Software & Services ETF (or its successor) stock price growth rate and (b) at least 46.41% over four years
• Stock price growth rate measured over four-year performance period through March 2024, with stock price PSUs eligible to be earned quarterly beginning in June 2022 if stock price hurdles are achieved on each measurement date
• Requiring our stock price to outperform an index of other software and services companies as a threshold in order for any additional PSUs to be earned helps reward our relative performance not just stock market performance
• Below-index stockholder returns will not be rewarded• Aligns the interests of our NEOs and stockholders, and
rewards, retains and incentivizes our NEOs for above-market stockholder returns
• Eligibility for any stock price PSUs to be earned does not begin until over two years after grant, providing long-term incentive and alignment
The target number of shares subject to the fiscal 2021 PSUs represents the number of shares eligible to be earned and subsequently eligible to vest based on the target level performance of both the ARR metric and the operating cash flow metric for fiscal 2021, without giving effect to the stock price modifier.
Executive CompensationExecutive Compensation

PR
OX
Y
55Splunk 2021 Proxy Statement
FISCAL 2021 EQUITY AWARDSAnnual Equity Awards. In March 2020, the Compensation Committee granted RSUs and PSUs to each of our NEOs. The following table sets forth the number of shares of our common stock subject to the RSUs and PSUs granted to each NEO.
NEONature of
Equity AwardsPercentage of
Award as RSUsRSUs
(number of shares)Percentage of
Award as PSUsTarget PSUs
(number of shares)
Total Target Value
($)(1)
Douglas Merritt Annual 40% 57,313 60% 85,970 16,475,665
Jason Child Annual 40% 24,268 60% 36,402 6,976,306
Scott Morgan Annual 40% 15,490 60% 23,235 4,452,921
Susan St. Ledger Annual 40% 25,817 60% 38,725 7,421,504
Timothy Tully Annual 40% 24,268 60% 36,402 6,976,306
(1) Excludes the aggregate incremental fair value generated by the modification of the fiscal 2021 PSUs as described in footnote 1 of the 2021 Summary Compensation Table. See “Mid-Year Changes to Fiscal 2021 Performance Objectives” below.
Each grant to the NEOs in fiscal 2021 was made by our Compensation Committee in consultation with Compensia and after considering the factors described above. The annual RSUs granted to the NEOs in fiscal 2021 vest over four years with 25% vesting approximately one year after the grant date, and 75% vesting quarterly thereafter over the remaining three years, subject to the NEO’s continued service with us on each vesting date. The annual PSUs granted to the NEOs in fiscal 2021 vest over four years and may be earned based on corporate performance metrics and a stock price performance modifier. The corporate performance metrics have a one-year performance period, with 25% of earned corporate PSUs vesting shortly following the end of the performance period and 75% vesting quarterly thereafter over the remaining three years, subject to the NEO’s continued service with us on each vesting date. In order to further align the interests of our NEOs and stockholders, a modifier to any earned corporate PSUs provides an opportunity to earn additional PSUs based on the Company’s stock price growth rate over a multi-year performance period. Other terms and conditions are described in the “PSU Award Design” section below.
PSU Award Design. The principal terms and conditions of the fiscal 2021 PSUs, as well as the rationale for our design approach, are set forth in the following table:
PSU Feature Our Approach Our Rationale
Corporate PSUs
Corporate Performance Metrics
• Two corporate metrics–70% based on ARR achievement and 30% based on operating cash flow achievement
• ARR represents the annualized revenue run-rate of active term license, maintenance, and subscription contracts at the end of a reporting period as reported in our Annual Report on Form 10-K for fiscal 2021, but excluding any ARR recognized during the performance period from acquisitions made during the performance period
• The operating cash flow metric is as determined under GAAP, but excluding the impact from any acquisitions made during the performance period
• Motivate and incentivize our executives to drive top-line growth in our business while enhancing their focus on specific financial goals considered important to the Company’s long-term growth
• Use of ARR as both a PSU metric and an executive bonus plan metric underscores the importance of top-line growth and is a key driver of stockholder value during our ongoing business transformation to a subscription model. ARR is currently a key performance metric to assess the health and trajectory of our business and the success of our business model transformation
• Use of operating cash flow as a performance metric reflects focus on disciplined execution of our business objectives during our ongoing business transformation to a subscription model
• Belief that our strategy of investing in our business for growth is appropriate given the significant market opportunity available to us
• Once the business model transformation is complete, and as our business matures and financial results become more predictable, we intend to consider different and longer-term metrics that continue to align with our stockholders’ interests
PSU Feature Our Approach Our Rationale
Corporate PSUs
Targets for Corporate Performance Metrics
• Target ARR and operating cash flow were initially set based on public financial guidance at the beginning of fiscal 2021; target ARR was adjusted in October 2020 based on an appropriate growth goal given the uncertainties in the macro environment, including the impact of the COVID-19 pandemic on our business being coupled with the complexities associated with business model transformations, and the level of effort and leadership required to achieve such results in such circumstances, while continuing to incentivize our executives to achieve an aggressive growth rate that would reflect a high level of achievement
• Adjusted target ARR for fiscal 2021 reflected an increase of 40% over our fiscal 2020 ARR results, and maximum achievement required an increase of 46% or more over our fiscal 2020 ARR results
• Align the interests of our executives with those of our stockholders through performance targets that correlate with key drivers of stockholder value
• Minimum (threshold) and maximum performance levels provide accountability for underperformance and incentive for overperformance
• Capped, maximum payouts only possible when the Company has exceptional performance
Corporate Performance Period
• One-year performance period for corporate performance metrics in fiscal 2021
• Earned corporate PSUs will not fully vest until approximately four years after date of grant, thus placing awards at-risk for a prolonged period
• Our rapid growth and ongoing transition to a subscription model makes performance periods difficult to estimate over a longer period
• Allows for adjusted priorities in a rapidly changing competitive business environment
• Our historical financial outperformance• Risk of setting inappropriate target levels that may
not align with our stockholders’ interests if we were to project more than one year in advance
Corporate PSU Vesting Schedule
• 25% of earned corporate PSUs vested shortly following the end of the performance period and upon approval of our fiscal 2021 audited financial statements
• Remainder will vest quarterly over the next three years, subject to continued service through each vesting date
• Time-based vesting schedule for earned corporate PSUs provides additional long-term retention incentives and encourages our NEOs to take a long-term view of our business
Stock Price Modifier
• Up to an additional 50% of the number of earned corporate PSUs can be earned if our stock price growth rate is (a) equal to or greater than that of the SPDR S&P Software & Services ETF (or its successor) stock price growth rate and (b) at least 46.41% over four years
• Stock price growth rate measured over four-year performance period through March 2024, with stock price PSUs eligible to be earned quarterly beginning in June 2022 if stock price hurdles are achieved on each measurement date
• Requiring our stock price to outperform an index of other software and services companies as a threshold in order for any additional PSUs to be earned helps reward our relative performance not just stock market performance
• Below-index stockholder returns will not be rewarded• Aligns the interests of our NEOs and stockholders, and
rewards, retains and incentivizes our NEOs for above-market stockholder returns
• Eligibility for any stock price PSUs to be earned does not begin until over two years after grant, providing long-term incentive and alignment
The target number of shares subject to the fiscal 2021 PSUs represents the number of shares eligible to be earned and subsequently eligible to vest based on the target level performance of both the ARR metric and the operating cash flow metric for fiscal 2021, without giving effect to the stock price modifier.
Executive CompensationExecutive Compensation

56 Splunk 2021 Proxy Statement
FISCAL 2021 PERFORMANCE OBJECTIVESThe following chart presents the tiers of the ARR metric payout multiples relative to target (with linear interpolation in between tiers) approved by the Compensation Committee in March 2020.
Fiscal 2021 ARR (in millions)(1)
YoY ARR Growth
Payout Multiple Relative to Target
Max $2,495 or more 48% 200%
$2,480 48% 165%
$2,465 47% 130%
$2,453 46% 110%
Target $2,440 45% 100%
$2,422 44% 75%
Threshold $2,404 43% 50%
Less than $2,404 Less than 43% 0%
(1) Excluding ARR recognized during the fiscal year from acquisitions made during the fiscal year.
The following chart presents certain tiers of the operating cash flow metric payout multiples relative to target (with linear interpolation in between tiers) approved by the Compensation Committee in March 2020.
Fiscal 2021 Operating Cash Flow
(in millions)(1)Payout Multiple
Relative to Target
Max $(200.0) 200%
Target $(280.0) 100%
Threshold $(360.0) 50%
Less than $(360.0) 0%
(1) Excluding the impact of acquisitions made during the fiscal year.
A summary of the stock price modifier approved by the Compensation Committee in March 2020 is shown below.
Company Stock Price Growth Rate
Stock Price Modifier Relative to Earned
Corporate PSUs (with linear interpolation
in between tiers)
Company stock price growth rate equal to or greater than SPDR S&P Software & Services ETF stock price growth rate
74.90% (or $272.84) 50%
46.41% or below (or $228.40 or below) 0%
MID-YEAR CHANGES TO FISCAL 2021 PERFORMANCE OBJECTIVESIn October 2020, in consultation with Compensia, for the reasons discussed above in “Cash Bonuses—Mid-Year Changes to Fiscal 2021 Performance Objectives,” the Compensation Committee adjusted the target as well as the tiers of the ARR metric payout multiples relative to target (with linear interpolation in between tiers) as set forth below. No changes were made to the operating cash flow metric or stock price modifier.
Fiscal 2021 ARR (in millions)(1)
YoY ARR Growth
Payout Multiple Relative to Target
Max $2,453 or more 46.0% 200%
$2,440 45.2% 175%
$2,394 42.5% 150%
$2,374 41.3% 125%
Target $2,352 40.0% 100%
$2,332 38.8% 87.5%
$2,285 36.0% 75%
Threshold $2,268 35.0% 50%
Less than $2,268 Less than 35.0% 0%
(1) Excluding ARR recognized during the fiscal year from acquisitions made during the fiscal year.
Earned Corporate PSU Awards. In fiscal 2021, we achieved ARR of $2.365 billion, representing a 41% increase from our fiscal 2020 ARR, and operating cash flow of negative $191 million. The Compensation Committee excluded the impact of acquisitions in fiscal 2021 both to the ARR metric and to the operating cash flow metric, in accordance with the terms of the fiscal 2021 PSUs.
Based on our actual performance, the Compensation Committee determined that 134.60% of each continuing NEO’s target PSU award was earned as corporate PSUs. The following chart summarizes the target and actual number of corporate PSUs earned by each NEO:
Douglas Merritt Jason Child Scott Morgan Susan St. Ledger Timothy Tully
85,970
115,715
36,402
23,23531,274
38,725
N/A(1)
36,402
48,99748,997
0
25,000
50,000
75,000
100,000
125,000
150,000
Target PSUs (number of shares) Number of Earned Corporate PSUs
(1) In connection with Ms. St. Ledger’s termination of employment with the Company on January 31, 2021, the unearned fiscal 2021 corporate PSUs were forfeited in accordance with the terms of her PSU award agreement.
Executive CompensationExecutive Compensation

PR
OX
Y
57Splunk 2021 Proxy Statement
FISCAL 2021 PERFORMANCE OBJECTIVESThe following chart presents the tiers of the ARR metric payout multiples relative to target (with linear interpolation in between tiers) approved by the Compensation Committee in March 2020.
Fiscal 2021 ARR (in millions)(1)
YoY ARR Growth
Payout Multiple Relative to Target
Max $2,495 or more 48% 200%
$2,480 48% 165%
$2,465 47% 130%
$2,453 46% 110%
Target $2,440 45% 100%
$2,422 44% 75%
Threshold $2,404 43% 50%
Less than $2,404 Less than 43% 0%
(1) Excluding ARR recognized during the fiscal year from acquisitions made during the fiscal year.
The following chart presents certain tiers of the operating cash flow metric payout multiples relative to target (with linear interpolation in between tiers) approved by the Compensation Committee in March 2020.
Fiscal 2021 Operating Cash Flow
(in millions)(1)Payout Multiple
Relative to Target
Max $(200.0) 200%
Target $(280.0) 100%
Threshold $(360.0) 50%
Less than $(360.0) 0%
(1) Excluding the impact of acquisitions made during the fiscal year.
A summary of the stock price modifier approved by the Compensation Committee in March 2020 is shown below.
Company Stock Price Growth Rate
Stock Price Modifier Relative to Earned
Corporate PSUs (with linear interpolation
in between tiers)
Company stock price growth rate equal to or greater than SPDR S&P Software & Services ETF stock price growth rate
74.90% (or $272.84) 50%
46.41% or below (or $228.40 or below) 0%
MID-YEAR CHANGES TO FISCAL 2021 PERFORMANCE OBJECTIVESIn October 2020, in consultation with Compensia, for the reasons discussed above in “Cash Bonuses—Mid-Year Changes to Fiscal 2021 Performance Objectives,” the Compensation Committee adjusted the target as well as the tiers of the ARR metric payout multiples relative to target (with linear interpolation in between tiers) as set forth below. No changes were made to the operating cash flow metric or stock price modifier.
Fiscal 2021 ARR (in millions)(1)
YoY ARR Growth
Payout Multiple Relative to Target
Max $2,453 or more 46.0% 200%
$2,440 45.2% 175%
$2,394 42.5% 150%
$2,374 41.3% 125%
Target $2,352 40.0% 100%
$2,332 38.8% 87.5%
$2,285 36.0% 75%
Threshold $2,268 35.0% 50%
Less than $2,268 Less than 35.0% 0%
(1) Excluding ARR recognized during the fiscal year from acquisitions made during the fiscal year.
Earned Corporate PSU Awards. In fiscal 2021, we achieved ARR of $2.365 billion, representing a 41% increase from our fiscal 2020 ARR, and operating cash flow of negative $191 million. The Compensation Committee excluded the impact of acquisitions in fiscal 2021 both to the ARR metric and to the operating cash flow metric, in accordance with the terms of the fiscal 2021 PSUs.
Based on our actual performance, the Compensation Committee determined that 134.60% of each continuing NEO’s target PSU award was earned as corporate PSUs. The following chart summarizes the target and actual number of corporate PSUs earned by each NEO:
Douglas Merritt Jason Child Scott Morgan Susan St. Ledger Timothy Tully
85,970
115,715
36,402
23,23531,274
38,725
N/A(1)
36,402
48,99748,997
0
25,000
50,000
75,000
100,000
125,000
150,000
Target PSUs (number of shares) Number of Earned Corporate PSUs
(1) In connection with Ms. St. Ledger’s termination of employment with the Company on January 31, 2021, the unearned fiscal 2021 corporate PSUs were forfeited in accordance with the terms of her PSU award agreement.
Executive CompensationExecutive Compensation

58 Splunk 2021 Proxy Statement
Under the original target level for ARR performance approved in March 2020, 60% of each NEO’s target fiscal 2021 PSUs would have been earned as corporate PSUs. As described above, in October 2020, we modified the target as well as the tiers of the ARR metric payout multiples relative to target for the fiscal 2021 PSUs to ensure adequate incentives for our NEOs to persevere in their commitment to aggressively drive growth in our business for the remainder of the fiscal year. These revised metrics were developed with input from our management team and Compensia, and were set at levels that the Compensation Committee determined to be appropriate, particularly given the uncertainties in the macro environment at the time, including the impact of the COVID-19 pandemic on our business being coupled with the complexities associated with business model transformations, and the increased efforts required from our NEOs. Due to the strong finish to a volatile year in the fourth quarter of fiscal 2021 and the leadership of our NEOs in ending the year with total ARR of $2.365 billion, up 41% over the previous fiscal year, the fiscal 2021 PSUs were earned at above target in accordance with the revised target level and payout multiples. The Compensation Committee believed it was appropriate to reward our NEOs for this outstanding accomplishment and leadership, and not make any adjustments to our NEOs’ fiscal 2021 corporate PSU awards that otherwise would be earned under the revised metrics.
As described above, 25% of these earned corporate PSUs vested upon the Compensation Committee’s certification of our ARR and operating cash flow results for fiscal 2021, and the remainder will vest quarterly over the next three years, so long as the NEO continues to be a service provider through each vesting date.
The following chart presents the number of stock price PSUs that will be eligible to be earned and vest beginning in June 2022 through March 2024, as described above:
NEONumber of Stock Price PSUs
Eligible to be Earned
Douglas Merritt 57,857
Jason Child 24,498
Scott Morgan 15,637
Susan St. Ledger N/A
Timothy Tully 24,498
PAYOUT OF FISCAL 2019 STOCK PRICE PSUs Earned Stock Price PSUs. As previously disclosed, the fiscal 2019 PSU program included an overall modifier to any earned corporate PSUs that provided for an opportunity to earn additional stock price PSUs beginning in June 2020, depending on our stock price growth rate. Our stock price growth rate from March 1, 2018 to December 10, 2020, as certified by an independent consultant, was greater than the SPDR S&P Software & Services ETF stock price growth rate. Based on our stock price growth rate for that period, as certified by an independent consultant, an additional 24.67% to 50% of each continuing NEO’s earned corporate PSUs were earned as stock price PSUs on June 10, 2020, September 10, 2020 and December 10, 2020. The number of stock price PSUs earned in fiscal 2021 by each continuing NEO was as follows:
NEONumber of Earned Stock Price PSUs
Douglas Merritt 17,467
Jason Child(1) N/A
Scott Morgan(2) N/A
Susan St. Ledger 11,313
Timothy Tully 8,228
(1) Mr. Child was not eligible to earn stock price PSUs as he joined the Company in fiscal 2020.(2) Mr. Morgan was not eligible to earn stock price PSUs as he first became eligible to earn PSUs in fiscal 2020.
These earned stock price PSUs vested when earned as described above.
Severance and Change in Control-Related BenefitsOur executive officers, including our NEOs, are provided certain protections in the event of their termination of employment under specified circumstances, including following a change in control of the Company. We believe that these protections serve our retention objectives by helping our NEOs maintain continued focus and dedication to their responsibilities to maximize stockholder value, including in the event of a transaction that could result in a change in control of the Company. The chart below describes the material terms of these benefits for our continuing NEOs.
Triggering Event(s) Benefits
Within three months after signing of a definitive agreement that ultimately results in a change in control or 18 months after a change in control AND Employment is terminated without cause or NEO resigns for good reason
• A lump sum payment equal to 12 months of NEO’s then-current base salary (24 months, in the case of our CEO), plus 100% of NEO’s annual target bonus for the year of termination (24 months of annual target bonus plus a pro-rated portion of annual target bonus for the year of termination, in the case of our CEO), less any amounts already paid for such year;
• Payment by us for up to 12 months of COBRA premiums to continue health insurance coverage for NEO and eligible dependents (18 months, in the case of our CEO), or a lump sum payment of $24,000 ($36,000, in the case of our CEO) if paying for COBRA premiums would result in an excise tax to us;
• 100% accelerated vesting of NEO’s outstanding equity awards; and
• Six-month post-termination exercise period for NEO’s outstanding options.
In each case subject to NEO timely signing a release of claims that becomes effective.
Employment is terminated without cause (other than in connection with a change in control)
• A lump sum payment equal to six months of NEO’s then-current base salary (18 months, in the case of our CEO), plus a pro-rated portion of NEO’s annual target bonus for the year of termination, less any amounts already paid for such year;
• Payment by us for up to six months of COBRA premiums to continue health insurance coverage for NEO and eligible dependents (12 months, in the case of our CEO), or a lump sum payment of $12,000 ($24,000, in the case of our CEO) if paying for COBRA premiums would result in an excise tax to us;
• Six months accelerated vesting of NEO’s outstanding equity awards (12 months, in the case of our CEO); and
• Six-month post-termination exercise period for NEO’s outstanding options.
In each case subject to NEO timely signing a release of claims that becomes effective.
In addition, in the event any of the payments provided for under the executive employment letters, or otherwise payable to the NEO, would constitute “parachute payments” within the meaning of Section 280G of the Internal Revenue Code and could be subject to the related excise tax under Section 4999 of the Internal Revenue Code, he or she would be entitled to receive either full payment of benefits or such lesser amount which would result in no portion of the benefits being subject to the excise tax, whichever results in the greater amount of after-tax benefits to such executive. No employment letter with any of our NEOs provides for any tax gross-up payments.
Under our 2012 Plan, our employees, including our executive officers, and our non-employee directors are entitled to vesting acceleration benefits in the event of their death. See “Compensation Tables—Equity Acceleration Death Benefit” below for further information.
Executive CompensationExecutive Compensation

PR
OX
Y
59Splunk 2021 Proxy Statement
Under the original target level for ARR performance approved in March 2020, 60% of each NEO’s target fiscal 2021 PSUs would have been earned as corporate PSUs. As described above, in October 2020, we modified the target as well as the tiers of the ARR metric payout multiples relative to target for the fiscal 2021 PSUs to ensure adequate incentives for our NEOs to persevere in their commitment to aggressively drive growth in our business for the remainder of the fiscal year. These revised metrics were developed with input from our management team and Compensia, and were set at levels that the Compensation Committee determined to be appropriate, particularly given the uncertainties in the macro environment at the time, including the impact of the COVID-19 pandemic on our business being coupled with the complexities associated with business model transformations, and the increased efforts required from our NEOs. Due to the strong finish to a volatile year in the fourth quarter of fiscal 2021 and the leadership of our NEOs in ending the year with total ARR of $2.365 billion, up 41% over the previous fiscal year, the fiscal 2021 PSUs were earned at above target in accordance with the revised target level and payout multiples. The Compensation Committee believed it was appropriate to reward our NEOs for this outstanding accomplishment and leadership, and not make any adjustments to our NEOs’ fiscal 2021 corporate PSU awards that otherwise would be earned under the revised metrics.
As described above, 25% of these earned corporate PSUs vested upon the Compensation Committee’s certification of our ARR and operating cash flow results for fiscal 2021, and the remainder will vest quarterly over the next three years, so long as the NEO continues to be a service provider through each vesting date.
The following chart presents the number of stock price PSUs that will be eligible to be earned and vest beginning in June 2022 through March 2024, as described above:
NEONumber of Stock Price PSUs
Eligible to be Earned
Douglas Merritt 57,857
Jason Child 24,498
Scott Morgan 15,637
Susan St. Ledger N/A
Timothy Tully 24,498
PAYOUT OF FISCAL 2019 STOCK PRICE PSUs Earned Stock Price PSUs. As previously disclosed, the fiscal 2019 PSU program included an overall modifier to any earned corporate PSUs that provided for an opportunity to earn additional stock price PSUs beginning in June 2020, depending on our stock price growth rate. Our stock price growth rate from March 1, 2018 to December 10, 2020, as certified by an independent consultant, was greater than the SPDR S&P Software & Services ETF stock price growth rate. Based on our stock price growth rate for that period, as certified by an independent consultant, an additional 24.67% to 50% of each continuing NEO’s earned corporate PSUs were earned as stock price PSUs on June 10, 2020, September 10, 2020 and December 10, 2020. The number of stock price PSUs earned in fiscal 2021 by each continuing NEO was as follows:
NEONumber of Earned Stock Price PSUs
Douglas Merritt 17,467
Jason Child(1) N/A
Scott Morgan(2) N/A
Susan St. Ledger 11,313
Timothy Tully 8,228
(1) Mr. Child was not eligible to earn stock price PSUs as he joined the Company in fiscal 2020.(2) Mr. Morgan was not eligible to earn stock price PSUs as he first became eligible to earn PSUs in fiscal 2020.
These earned stock price PSUs vested when earned as described above.
Severance and Change in Control-Related BenefitsOur executive officers, including our NEOs, are provided certain protections in the event of their termination of employment under specified circumstances, including following a change in control of the Company. We believe that these protections serve our retention objectives by helping our NEOs maintain continued focus and dedication to their responsibilities to maximize stockholder value, including in the event of a transaction that could result in a change in control of the Company. The chart below describes the material terms of these benefits for our continuing NEOs.
Triggering Event(s) Benefits
Within three months after signing of a definitive agreement that ultimately results in a change in control or 18 months after a change in control AND Employment is terminated without cause or NEO resigns for good reason
• A lump sum payment equal to 12 months of NEO’s then-current base salary (24 months, in the case of our CEO), plus 100% of NEO’s annual target bonus for the year of termination (24 months of annual target bonus plus a pro-rated portion of annual target bonus for the year of termination, in the case of our CEO), less any amounts already paid for such year;
• Payment by us for up to 12 months of COBRA premiums to continue health insurance coverage for NEO and eligible dependents (18 months, in the case of our CEO), or a lump sum payment of $24,000 ($36,000, in the case of our CEO) if paying for COBRA premiums would result in an excise tax to us;
• 100% accelerated vesting of NEO’s outstanding equity awards; and
• Six-month post-termination exercise period for NEO’s outstanding options.
In each case subject to NEO timely signing a release of claims that becomes effective.
Employment is terminated without cause (other than in connection with a change in control)
• A lump sum payment equal to six months of NEO’s then-current base salary (18 months, in the case of our CEO), plus a pro-rated portion of NEO’s annual target bonus for the year of termination, less any amounts already paid for such year;
• Payment by us for up to six months of COBRA premiums to continue health insurance coverage for NEO and eligible dependents (12 months, in the case of our CEO), or a lump sum payment of $12,000 ($24,000, in the case of our CEO) if paying for COBRA premiums would result in an excise tax to us;
• Six months accelerated vesting of NEO’s outstanding equity awards (12 months, in the case of our CEO); and
• Six-month post-termination exercise period for NEO’s outstanding options.
In each case subject to NEO timely signing a release of claims that becomes effective.
In addition, in the event any of the payments provided for under the executive employment letters, or otherwise payable to the NEO, would constitute “parachute payments” within the meaning of Section 280G of the Internal Revenue Code and could be subject to the related excise tax under Section 4999 of the Internal Revenue Code, he or she would be entitled to receive either full payment of benefits or such lesser amount which would result in no portion of the benefits being subject to the excise tax, whichever results in the greater amount of after-tax benefits to such executive. No employment letter with any of our NEOs provides for any tax gross-up payments.
Under our 2012 Plan, our employees, including our executive officers, and our non-employee directors are entitled to vesting acceleration benefits in the event of their death. See “Compensation Tables—Equity Acceleration Death Benefit” below for further information.
Executive CompensationExecutive Compensation

60 Splunk 2021 Proxy Statement
The salary multiples above are consistent with current market practices, and the alternative share number thresholds are intended to provide our executive officers with certainty as to whether the guidelines are met, regardless of our then-current stock price.
If an executive officer fails to meet the ownership guidelines within the applicable compliance period, he or she will be required to hold 50% of shares acquired (which will be calculated based on net shares after taxes) through our equity incentive plans until such time as he or she meets the required ownership guidelines.
As of the end of fiscal 2021, all of our NEOs have met, exceeded, or are on track to meet, these guidelines based on their current rate of stock accumulations in the time frames set out in the guidelines.
See “Corporate Governance at Splunk—Non-Employee Director Compensation—Stock Ownership Guidelines” for information about the guidelines applicable to our non-employee directors.
Clawback PolicyWe have a Clawback Policy pursuant to which we may seek the recovery of cash performance-based incentive compensation paid by us as well as performance-based equity awards, including PSUs. The Clawback Policy applies to our CEO and to all officers who report directly to the CEO, including our NEOs. The Clawback Policy provides that if (i) we restate our financial statements as a result of a material error; (ii) the amount of cash incentive compensation or performance-based equity compensation that was paid or is payable based on achievement of specific financial results paid to a participant would have been less if the financial statements had been correct; (iii) no more than two years have elapsed since the original filing date of the financial statements upon which the incentive compensation was determined; and (iv) the Compensation Committee unanimously concludes, in its sole discretion, that fraud or intentional misconduct by such participant caused the material error and it would be in our best interests to seek from such participant recovery of the excess compensation, then the Compensation Committee may, in its sole discretion, seek from such participant repayment to the Company.
Anti-Hedging and Anti-Pledging Policy; Stock Trading PracticesWe maintain an Insider Trading Policy that, among other things, prohibits our NEOs from trading during quarterly and special closed trading windows. We also prohibit our NEOs from engaging in short sales, hedging, swaps, exchange funds and similar transactions designed to decrease the risks associated with holding the Company’s securities, as well as pledging the Company’s securities as collateral for loans and transactions involving derivative securities relating to our common stock. None of the Company’s subsidiaries have publicly traded equity securities. Our Insider Trading Policy requires all NEOs to obtain written pre-clearance from the Insider Trading Compliance Officer or his or her designee prior to buying, selling, or engaging in any other transaction in the Company’s securities.
Further, we have adopted Rule 10b5-1 Trading Plan Guidelines that permit our NEOs to adopt Rule 10b5-1 trading plans (“10b5-1 plans”). Under our 10b5-1 Trading Plan Guidelines, 10b5-1 plans may only be adopted or modified during an open trading window under our Insider Trading Policy and only when such NEO does not otherwise possess material nonpublic information about the Company. The first trade under a 10b5-1 plan may not occur until the completion of the next quarterly closed trading window following the adoption or modification of the 10b5-1 plan, as applicable.
Impact of Accounting and Tax Requirements on Compensation
Deductibility of Executive CompensationGenerally, Section 162(m) of the Internal Revenue Code of 1986, as amended (the “Tax Code”), or Section 162(m), disallows a tax deduction to any publicly-held corporation for any remuneration in excess of $1 million paid in any taxable year to its chief executive officer and certain other current and former highly compensated officers that qualify as covered employees within the meaning of Section 162(m).
We have not previously taken the deductibility limit imposed by Section 162(m) into consideration in setting compensation for our current and former executive officers and do not currently have any immediate plans to do so. The Compensation Committee may, in its judgment, authorize compensation payments that are not fully tax deductible when it believes that such payments are appropriate to attract and retain executive talent or meet other business objectives. The Compensation Committee intends to continue to compensate our current and former executive officers in a manner consistent with our best interests and the best interests of our stockholders.
Other Compensation Policies and Information
Recent Fiscal 2022 Compensation DecisionsThe Compensation Committee, in consultation with Compensia, reviewed our compensation philosophy and objectives for our executive officers, including our continuing NEOs, and on February 14, 2021 approved changes to the vesting schedule for equity awards, effective as of February 1, 2021. The fiscal 2022 equity awards will vest over three years, with 33.33% of the equity awards vesting on or about one year from the vesting commencement date, and 8.33% vesting quarterly thereafter, subject to continued service to us. The stock price PSUs have the same construct but will now vest over the last three quarters in the third year and the first quarter of the fourth year. The change to three-year vesting of awards granted to our executive officers, including our continuing NEOs, aligns with the vesting schedule for the rest of our employees and allows us to attract and retain talent in a highly competitive technology market during our ongoing business transformation to a subscription model.
In March 2021, the Compensation Committee conducted its annual executive compensation review and made fiscal 2022 compensation decisions for our continuing NEOs as set forth below. In making these decisions, the Compensation Committee considered, among other factors, pay levels of our NEOs relative to peers and the overall competitive market, performance of each continuing NEO, the continued talent war for experienced leadership in our industry and the feedback from our stockholders as discussed above.
• Increased the base salaries of continuing NEOs by 6% to 18% of their fiscal 2021 base salaries.
• Increased certain NEO’s target annual cash bonus percentage by 14% to 25% to align more closely to the market.
• Maintained the mix of fiscal 2022 equity awards for all continuing NEOs, including our CEO, at 60% PSUs and 40% RSUs. This mix is consistent with that of fiscal 2021 equity awards.
• Maintained a stock price modifier to any earned corporate PSUs that provides for an opportunity to earn additional stock price PSUs based on the Company’s stock price growth rate measured over a three-year performance period through March 2024, subject to a threshold performance requirement relative to an index of other software and services companies.
Employee Benefits and PerquisitesWe provide employee benefits to all eligible employees in the United States, including our NEOs, which the Compensation Committee believes are reasonable and consistent with its overall compensation objective to better enable us to attract and retain employees. These benefits include medical, dental and vision insurance, health savings account, a 401(k) plan, life and disability insurance, flexible spending accounts, an employee stock purchase plan and other plans and programs.
We have special long-term disability coverage for our executive officers, including our NEOs, who are eligible for disability coverage until approximately age 66 if they cannot return to their occupation. We pay for certain spousal travel expenses and certain tax gross-ups. During the COVID-19 pandemic, we have paid certain limited travel expenses, primarily for travel by our CEO for events or matters at the request of the Company, and in order to comply with potential SEC requirements, have disclosed the incremental costs of such travel expenses in our summary compensation table.
Stock Ownership GuidelinesOur Board believes that our directors and executive officers should hold a meaningful financial stake in the Company in order to further align their interests with those of our stockholders. To promote this belief, our Board adopted stock ownership guidelines requiring our executive officers to achieve certain stock ownership levels within five years of the later of September 13, 2018 or such executive officer’s hire, appointment, promotion or election date, as applicable. The current stock ownership guidelines are set forth below:
• Our CEO must own the lesser of (i) Company stock with a value of five times his or her annual base salary and (ii) 50,000 shares; and
• Each other executive officer must own the lesser of (i) Company stock with a value of two times his or her annual base salary and (ii) 12,000 shares.
Executive CompensationExecutive Compensation

PR
OX
Y
61Splunk 2021 Proxy Statement
The salary multiples above are consistent with current market practices, and the alternative share number thresholds are intended to provide our executive officers with certainty as to whether the guidelines are met, regardless of our then-current stock price.
If an executive officer fails to meet the ownership guidelines within the applicable compliance period, he or she will be required to hold 50% of shares acquired (which will be calculated based on net shares after taxes) through our equity incentive plans until such time as he or she meets the required ownership guidelines.
As of the end of fiscal 2021, all of our NEOs have met, exceeded, or are on track to meet, these guidelines based on their current rate of stock accumulations in the time frames set out in the guidelines.
See “Corporate Governance at Splunk—Non-Employee Director Compensation—Stock Ownership Guidelines” for information about the guidelines applicable to our non-employee directors.
Clawback PolicyWe have a Clawback Policy pursuant to which we may seek the recovery of cash performance-based incentive compensation paid by us as well as performance-based equity awards, including PSUs. The Clawback Policy applies to our CEO and to all officers who report directly to the CEO, including our NEOs. The Clawback Policy provides that if (i) we restate our financial statements as a result of a material error; (ii) the amount of cash incentive compensation or performance-based equity compensation that was paid or is payable based on achievement of specific financial results paid to a participant would have been less if the financial statements had been correct; (iii) no more than two years have elapsed since the original filing date of the financial statements upon which the incentive compensation was determined; and (iv) the Compensation Committee unanimously concludes, in its sole discretion, that fraud or intentional misconduct by such participant caused the material error and it would be in our best interests to seek from such participant recovery of the excess compensation, then the Compensation Committee may, in its sole discretion, seek from such participant repayment to the Company.
Anti-Hedging and Anti-Pledging Policy; Stock Trading PracticesWe maintain an Insider Trading Policy that, among other things, prohibits our NEOs from trading during quarterly and special closed trading windows. We also prohibit our NEOs from engaging in short sales, hedging, swaps, exchange funds and similar transactions designed to decrease the risks associated with holding the Company’s securities, as well as pledging the Company’s securities as collateral for loans and transactions involving derivative securities relating to our common stock. None of the Company’s subsidiaries have publicly traded equity securities. Our Insider Trading Policy requires all NEOs to obtain written pre-clearance from the Insider Trading Compliance Officer or his or her designee prior to buying, selling, or engaging in any other transaction in the Company’s securities.
Further, we have adopted Rule 10b5-1 Trading Plan Guidelines that permit our NEOs to adopt Rule 10b5-1 trading plans (“10b5-1 plans”). Under our 10b5-1 Trading Plan Guidelines, 10b5-1 plans may only be adopted or modified during an open trading window under our Insider Trading Policy and only when such NEO does not otherwise possess material nonpublic information about the Company. The first trade under a 10b5-1 plan may not occur until the completion of the next quarterly closed trading window following the adoption or modification of the 10b5-1 plan, as applicable.
Impact of Accounting and Tax Requirements on Compensation
Deductibility of Executive CompensationGenerally, Section 162(m) of the Internal Revenue Code of 1986, as amended (the “Tax Code”), or Section 162(m), disallows a tax deduction to any publicly-held corporation for any remuneration in excess of $1 million paid in any taxable year to its chief executive officer and certain other current and former highly compensated officers that qualify as covered employees within the meaning of Section 162(m).
We have not previously taken the deductibility limit imposed by Section 162(m) into consideration in setting compensation for our current and former executive officers and do not currently have any immediate plans to do so. The Compensation Committee may, in its judgment, authorize compensation payments that are not fully tax deductible when it believes that such payments are appropriate to attract and retain executive talent or meet other business objectives. The Compensation Committee intends to continue to compensate our current and former executive officers in a manner consistent with our best interests and the best interests of our stockholders.
Other Compensation Policies and Information
Recent Fiscal 2022 Compensation DecisionsThe Compensation Committee, in consultation with Compensia, reviewed our compensation philosophy and objectives for our executive officers, including our continuing NEOs, and on February 14, 2021 approved changes to the vesting schedule for equity awards, effective as of February 1, 2021. The fiscal 2022 equity awards will vest over three years, with 33.33% of the equity awards vesting on or about one year from the vesting commencement date, and 8.33% vesting quarterly thereafter, subject to continued service to us. The stock price PSUs have the same construct but will now vest over the last three quarters in the third year and the first quarter of the fourth year. The change to three-year vesting of awards granted to our executive officers, including our continuing NEOs, aligns with the vesting schedule for the rest of our employees and allows us to attract and retain talent in a highly competitive technology market during our ongoing business transformation to a subscription model.
In March 2021, the Compensation Committee conducted its annual executive compensation review and made fiscal 2022 compensation decisions for our continuing NEOs as set forth below. In making these decisions, the Compensation Committee considered, among other factors, pay levels of our NEOs relative to peers and the overall competitive market, performance of each continuing NEO, the continued talent war for experienced leadership in our industry and the feedback from our stockholders as discussed above.
• Increased the base salaries of continuing NEOs by 6% to 18% of their fiscal 2021 base salaries.
• Increased certain NEO’s target annual cash bonus percentage by 14% to 25% to align more closely to the market.
• Maintained the mix of fiscal 2022 equity awards for all continuing NEOs, including our CEO, at 60% PSUs and 40% RSUs. This mix is consistent with that of fiscal 2021 equity awards.
• Maintained a stock price modifier to any earned corporate PSUs that provides for an opportunity to earn additional stock price PSUs based on the Company’s stock price growth rate measured over a three-year performance period through March 2024, subject to a threshold performance requirement relative to an index of other software and services companies.
Employee Benefits and PerquisitesWe provide employee benefits to all eligible employees in the United States, including our NEOs, which the Compensation Committee believes are reasonable and consistent with its overall compensation objective to better enable us to attract and retain employees. These benefits include medical, dental and vision insurance, health savings account, a 401(k) plan, life and disability insurance, flexible spending accounts, an employee stock purchase plan and other plans and programs.
We have special long-term disability coverage for our executive officers, including our NEOs, who are eligible for disability coverage until approximately age 66 if they cannot return to their occupation. We pay for certain spousal travel expenses and certain tax gross-ups. During the COVID-19 pandemic, we have paid certain limited travel expenses, primarily for travel by our CEO for events or matters at the request of the Company, and in order to comply with potential SEC requirements, have disclosed the incremental costs of such travel expenses in our summary compensation table.
Stock Ownership GuidelinesOur Board believes that our directors and executive officers should hold a meaningful financial stake in the Company in order to further align their interests with those of our stockholders. To promote this belief, our Board adopted stock ownership guidelines requiring our executive officers to achieve certain stock ownership levels within five years of the later of September 13, 2018 or such executive officer’s hire, appointment, promotion or election date, as applicable. The current stock ownership guidelines are set forth below:
• Our CEO must own the lesser of (i) Company stock with a value of five times his or her annual base salary and (ii) 50,000 shares; and
• Each other executive officer must own the lesser of (i) Company stock with a value of two times his or her annual base salary and (ii) 12,000 shares.
Executive CompensationExecutive Compensation

62
Taxation of “Parachute” Payments and Deferred CompensationWe do not provide our NEOs with a “gross-up” or other reimbursement payment for any tax liability that he or she might owe as a result of the application of Sections 280G, 4999, or 409A of the Tax Code. Sections 280G and 4999 of the Tax Code provide that executive officers and directors who hold significant equity interests and certain other service providers may be subject to an excise tax if they receive payments or benefits in connection with a change in control that exceeds certain prescribed limits, and that the Company, or a successor, may forfeit a deduction on the amounts subject to this additional tax. Section 409A also imposes additional significant taxes on the individual in the event that an executive officer, director or other service provider receives “deferred compensation” that does not meet certain requirements of Section 409A of the Tax Code.
Accounting for Stock-Based CompensationWe follow ASC Topic 718 for our stock-based awards. ASC Topic 718 requires companies to measure the compensation expense for all share-based payment awards made to employees and directors, including stock options, restricted stock unit awards and performance units, based on the grant date “fair value” of these awards. This calculation is performed for accounting purposes and reported in the compensation tables below. ASC Topic 718 also requires companies to recognize the compensation cost of their stock-based compensation awards in their income statements over the period that a NEO is required to render service in exchange for the option or other award.
For performance units, stock-based compensation expense recognized may be adjusted over the performance period based on interim estimates of performance against pre-set objectives.
Compensation Risk AssessmentThe Compensation Committee, with the assistance of Compensia, assesses and considers potential risks when reviewing and approving our compensation programs, policies and practices for our executive officers and our employees. We designed our compensation programs, including our incentive compensation plans, with features to address potential risks while rewarding employees for achieving financial and strategic objectives through prudent business judgment and appropriate risk taking. Based upon its assessment, the Compensation Committee believes that any risks arising from our compensation programs do not create disproportionate incentives for our employees to take risks that could have a material adverse effect on us in the future.
Compensation Committee ReportThe Compensation Committee of the Board has reviewed and discussed the Compensation Discussion and Analysis required by Item 402(b) of Regulation S-K with management and, based on such review and discussions, the Compensation Committee recommended to the Board that the Compensation Discussion and Analysis be included in this proxy statement.
COMPENSATION COMMITTEE OF THE BOARD OF DIRECTORS
Stephen Newberry (Chair) Mark Carges Elisa Steele
Executive Compensation

PR
OX
Y
63Splunk 2021 Proxy Statement
Compensation Tables
Summary Compensation TableThe following table summarizes the compensation that we paid to or was earned by each of our NEOs for the fiscal years ended January 31, 2021, 2020 and 2019.
Name and Principal Position
Fiscal Year
Salary ($)
Bonus ($)
Stock Awards
($)(1)
Non-Equity Incentive Plan
Compensation ($)
All Other Compensation
($)Total
($)
Douglas MerrittPresident, CEO and Director
2021 850,000 — 25,351,450 1,132,306 50,055(2) 27,383,811
2020 675,000 — 14,100,955 874,125 60,565(3) 15,710,645
2019 650,000 — 11,174,462 1,625,000 56,333(4) 13,505,796
Jason ChildSenior Vice President andChief Financial Officer
2021 485,000 — 10,734,528 413,492 4,010(2) 11,637,030
2020 341,534(5) 500,000(6) 16,294,280 265,372(5) 84,623(3) 17,485,809
Scott MorganSenior Vice President,Chief Legal Officer, GlobalAffairs and Secretary
2021 430,000 — 6,851,708 320,776 3,545(2) 7,606,029
2020 375,000 5,853,518 233,100 10,599(3) 6,472,217
Susan St. LedgerFormer President,Worldwide Field Operations
2021 525,000 — 11,419,666 516,828 6,153(2) 12,467,647
2020 475,000 — 8,064,755 780,425 21,556(3) 9,341,736
2019 460,000 — 7,237,736 1,357,000 40,244(4) 9,094,980
Timothy TullySenior Vice President,Chief Technology Officer
2021 475,000 — 10,734,528 404,966 3,957(2) 11,618,451
2020 420,000 8,064,755 304,584 10,464(3) 8,799,803
2019 400,000 — 5,263,808 560,000 25,490(4) 6,249,298
(1) The amounts reported in the Stock Awards column reflects the aggregate grant date fair value of the RSUs granted to our NEOs in fiscal 2021, 2020 and 2019 and the PSUs granted to our NEOs in fiscal 2021, 2020 and 2019, as computed in accordance with FASB ASC Topic 718. For fiscal 2020 and 2019, the estimated fair value of PSUs is calculated based on the probable outcome of the performance measures for the applicable performance period as of the date on which the PSUs are granted for accounting purposes. The estimated fair value of the fiscal 2021 PSUs is calculated based on (a) the probable outcome of the performance measures for the awards granted in March 2020 and (b) the incremental fair value of the modification based on the probable outcome of the performance measures calculated as of October 27, 2020, the date on which the PSUs granted in March 2020 were modified. We accounted for this change as a Type III modification under ASC 718 as the expectation of the achievement of certain performance conditions related to these awards changed from improbable to probable post-modification. As a result, we reversed $10.8 million of stock-based compensation expense previously recognized for these awards, during fiscal 2021. Post-modification stock-based compensation expense related to these awards will be recognized based on the modification date fair value over their remaining service period, under the graded-vesting attribution method. The fiscal 2021 PSUs include both corporate performance and market-related (stock price modifier) goals. Consistent with the applicable accounting standards, the grant date fair value of the stock price modifier component has been determined using a Monte Carlo simulation model. The assumptions used in the valuation of these awards are consistent with the valuation methodologies specified in the notes to our consolidated financial statements included in our Annual Report on Form 10-K for the fiscal year ended January 31, 2021. The following table summarizes the elements included in the “Stock Awards” column reported for fiscal 2021.
Name
Aggregate Grant DateFair Value of the RSU Awards
Granted in March 2020 ($)
Aggregate Grant DateFair Value of the PSU Awards
Granted in March 2020 ($)
Aggregate Incremental Fair Value of the PSUs
Modified in October 2020 ($)
Total Stock Awards for Fiscal 2021
($)
Douglas Merritt 6,018,438 10,457,227 8,875,785 25,351,450
Jason Child 2,548,383 4,427,923 3,758,222 10,734,528
Scott Morgan 1,626,605 2,826,316 2,398,787 6,851,708
Susan St. Ledger 2,711,043 4,710,461 3,998,162 11,419,666
Timothy Tully 2,548,383 4,427,923 3,758,222 10,734,528
Executive Compensation
Executive Compensation

64 Splunk 2021 Proxy Statement
Assuming the highest level of performance is achieved under the applicable performance measures for the fiscal 2021 PSUs, the maximum possible value of the fiscal 2021 PSUs using the grant date fair value is presented below. The estimated fair value for PSUs is different from (and lower than) the maximum value of PSUs set forth below. These amounts do not necessarily correspond to the actual value recognized by our NEOs.
Name
Maximum Value of Fiscal 2021 PSUs (as of Modification Date for Accounting Purposes)
($)
Douglas Merritt 57,999,036
Jason Child 24,558,434
Scott Morgan 15,675,310
Susan St. Ledger 26,125,869
Timothy Tully 24,558,434
(2) For Mr. Merritt, this amount represents $1,136 in tax gross-ups; spousal expenses associated with attendance at our annual sales achievement event and a gift provided to all attendees at the event; $1,962 in a matching contribution and $2,000 in a discretionary contribution to Mr. Merritt’s 401(k) plan account, which contributions were made to all eligible participants; a premium payment for long-term disability benefits; and $44,957 in expenses for travel that Mr. Merritt engaged in for business purposes that could be required to be reported as All Other Compensation under the SEC’s proxy disclosure rules. For Mr. Child, this amount represents $847 in tax gross-ups; and $1,163 in a matching contribution and $2,000 in a discretionary contribution to Mr. Child’s 401(k) plan account, which contributions were made to all eligible participants. For Mr. Morgan, this amount represents $553 in tax gross-ups; and $992 in a matching contribution and $2,000 in a discretionary contribution to Mr. Morgan’s 401(k) plan account, which contributions were made to all eligible participants. For Ms. St. Ledger, this amount represents $973 in tax gross-ups; and $3,180 in a matching contribution and $2,000 in a discretionary contribution to Ms. St. Ledger’s 401(k) plan account, which contributions were made to all eligible participants. For Mr. Tully, this amount represents $638 in tax gross-ups; and $1,319 in a matching contribution and $2,000 in a discretionary contribution to Mr. Tully’s 401(k) plan account, which contributions were made to all eligible participants.
(3) For Mr. Merritt, this amount represents $5,562 in tax gross-ups; spousal expenses associated with attendance at our annual sales achievement event and a gift presented to all attendees at the event; $42,698 in one-time home security installation, equipment and monitoring cost; $2,000 in a matching contribution and $2,000 in a discretionary contribution to Mr. Merritt’s 401(k) plan account, which contributions were made to all eligible participants; and a premium payment for long-term disability benefits. For Mr. Child, this amount represents $24,830 in tax gross-ups; spousal expenses associated with attendance at our annual sales achievement event and a gift presented to all attendees at the event; $48,807 reimbursement of relocation expenses provided as part of his offer letter; $1,769 in a matching contribution and $2,000 in a discretionary contribution to Mr. Childs’ 401(k) plan account, which contributions were made to all eligible participants; and a premium payment for long-term disability benefits. For Mr. Morgan, this amount represents $6,599 in tax gross-ups; and $2,000 in a matching contribution and $2,000 in a discretionary contribution to Mr. Morgan’s 401(k) plan account, which contributions were made to all eligible participants. For Ms. St. Ledger, this amount represents $7,196 in tax gross-ups; guest expenses associated with attendance at our annual sales achievement event and a gift presented to all attendees at the event; $2,000 in a matching contribution and $2,000 in a discretionary contribution to Ms. St. Ledger’s 401(k) plan account, which contributions were made to all eligible participants; and a premium payment for long-term disability benefits. For Mr. Tully, this amount represents $6,225 in tax gross-ups; and $2,239 in a matching contribution and $2,000 in a discretionary contribution to Mr. Tully’s 401(k) plan account, which contributions were made to all eligible participants.
(4) For Mr. Merritt, this amount represents $21,817 in tax gross-ups; $25,662 in spousal expenses associated with attendance at our annual sales achievement event and a gift presented to all attendees at the event; $4,000 in a matching contribution and $3,000 in a discretionary contribution to Mr. Merritt’s 401(k) plan account, which contributions were made to all eligible participants; and a premium payment of $1,854 for long-term disability benefits. For Ms. St. Ledger, this amount represents $14,405 in tax gross-ups; guest expenses associated with attendance at our annual sales achievement event and a gift presented to all attendees at the event; $4,000 in a matching contribution and $3,000 in a discretionary contribution to Ms. St. Ledger’s 401(k) plan account, which contributions were made to all eligible participants; and a premium payment for long-term disability benefits. For Mr. Tully, this amount represents $8,708 in tax gross-ups; a Company gift; spousal expenses associated with attendance at our annual sales achievement event and a gift presented to all attendees at the event; and $3,538 in a matching contribution and $3,000 in a discretionary contribution to Mr. Tully’s 401(k) plan account, which contributions were made to all eligible participants.
(5) Mr. Child joined the Company on May 6, 2019. The salary and non-equity incentive plan compensation amounts presented for Mr. Child are prorated based on the number of days in fiscal 2020 during which he was employed with us.
(6) Pursuant to his offer letter, Mr. Child received a cash signing bonus, subject to reimbursement if he voluntarily resigns from the Company without good reason within 12 months of his start date.
Grants of Plan-Based Awards for Fiscal 2021The following table presents, for each of our NEOs, information concerning grants of plan-based awards made during fiscal 2021. This information supplements the information about these awards set forth in the Summary Compensation Table.
Name Grant Date
Estimated Future Payouts Under Non-Equity Incentive Plan
Awards(1)
Estimated Future Payouts Under Equity Incentive Plan
Awards(2)
All Other Stock
Awards: Number of
Shares or Units (#)(3)
Grant Date Fair Value
of Stock Awards
($)(4)Threshold
($)Target
($)Maximum
($)Threshold
(#)Target
(#)Maximum
(#)
Douglas Merritt — 531,250 1,062,500 2,125,000 — — — — —
RSUs 03/12/2020 — — — — — — 57,313 6,018,438
PSUs 03/12/2020 — — — 42,985 85,970 257,910 — 19,333,012
Jason Child — 194,000 388,000 776,000 — — — — —
RSUs 03/12/2020 — — — — — — 24,268 2,548,383
PSUs 03/12/2020 — — — 18,201 36,402 109,206 — 8,186,145
Scott Morgan — 150,500 301,000 602,000 — — — — —
RSUs 03/12/2020 — — — — — — 15,490 1,626,605
PSUs 03/12/2020 — — — 11,617 23,235 69,705 — 5,225,103
Susan St. Ledger — 262,500 525,000 1,575,000 — — — — —
RSUs 03/12/2020 — — — — — — 25,817 2,711,043
PSUs 03/12/2020 — — — 19,362 38,725 116,175 — 8,708,623
Timothy Tully — 190,000 380,000 760,000 — — — — —
RSUs 03/12/2020 — — — — — — 24,268 2,548,383
PSUs 03/12/2020 — — — 18,201 36,402 109,206 — 8,186,145
(1) Amounts in the “Estimated Future Payouts Under Non-Equity Incentive Plan Awards” columns relate to cash incentive compensation opportunities under each NEO’s individual compensation arrangement. Payments under these plans are subject to a threshold limitation based on achieving at least 96.4% of the target corporate performance objective. Target payment amounts assume achievement of 100% of the target corporate performance objective. Payments to Mr. Merritt, Mr. Child, Mr. Morgan and Mr. Tully under these plans are subject to a maximum payment of 200%, based on achievement of 104.3% or more of the target corporate performance objective. ACV-based payments to Ms. St. Ledger were capped at a maximum of 300% for achievement of 112% or greater of the target corporate performance objective. The actual amounts paid to our NEOs are set forth in the “Summary Compensation Table” above, and the calculation of the actual amounts paid is discussed more fully in “Compensation Discussion and Analysis—Discussion of Our Fiscal 2021 Executive Compensation Program—Components of Compensation Program and Fiscal 2021 Compensation—Cash Bonuses” above.
(2) Amounts in the “Estimated Future Payouts Under Equity Incentive Plan Awards” columns relate to estimated payouts of the fiscal 2021 PSUs. The amounts shown in the Threshold column reflect the corporate PSUs if the minimum annual recurring revenue metric and operating cash flow metric are met and are 50% of the amounts shown under the Target column. The amounts shown in the Target column reflect the corporate PSUs if the annual recurring revenue metric and operating cash flow metric are at target. The amounts shown in the Maximum column reflect the corporate PSUs if the maximum annual recurring revenue metric and operating cash flow metric are met and are 200% of the amounts shown under the Target column, plus the maximum number of stock price PSUs eligible to be earned, which is 50% of the maximum number of corporate PSUs. The PSUs vest over four years, subject to continued service to us. On March 31, 2021, 134.60% of each NEO’s target fiscal 2021 PSUs were earned based upon our fiscal 2021 financial results applying the revised metrics, and one-fourth of these earned corporate PSUs vested on March 31, 2021 and 1/16th vest quarterly thereafter, beginning on June 10, 2021, over the remaining three years, subject to continued service to us.
(3) The RSUs vest over four years, with one-fourth of the RSUs vesting one year following the vesting commencement date and 1/16th vesting quarterly thereafter over the remaining three years, subject to continued service to us.
(4) The amounts reported in this column reflect the aggregate grant date fair value of the RSUs and PSUs granted to our NEOs in fiscal 2021 as computed in accordance with ASC Topic 718. For accounting purposes, the estimated fair value of PSUs was calculated based on the probable outcome of the performance measures for the fiscal 2021 performance period as of October 27, 2020, the date on which the PSUs granted in March 2020 were modified. The fiscal 2021 PSUs include both corporate performance and market-related (stock price modifier) goals. Consistent with the applicable accounting standards, the grant date fair value of the stock price modifier component has been determined using a Monte Carlo simulation model. These amounts do not necessarily correspond to the actual value recognized by NEOs. The assumptions used in the valuation of these awards are consistent with the valuation methodologies specified in the notes to our consolidated financial statements included in our Annual Report on Form 10-K for the fiscal year ended January 31, 2021.
Executive CompensationExecutive Compensation

PR
OX
Y
65Splunk 2021 Proxy Statement
Assuming the highest level of performance is achieved under the applicable performance measures for the fiscal 2021 PSUs, the maximum possible value of the fiscal 2021 PSUs using the grant date fair value is presented below. The estimated fair value for PSUs is different from (and lower than) the maximum value of PSUs set forth below. These amounts do not necessarily correspond to the actual value recognized by our NEOs.
Name
Maximum Value of Fiscal 2021 PSUs (as of Modification Date for Accounting Purposes)
($)
Douglas Merritt 57,999,036
Jason Child 24,558,434
Scott Morgan 15,675,310
Susan St. Ledger 26,125,869
Timothy Tully 24,558,434
(2) For Mr. Merritt, this amount represents $1,136 in tax gross-ups; spousal expenses associated with attendance at our annual sales achievement event and a gift provided to all attendees at the event; $1,962 in a matching contribution and $2,000 in a discretionary contribution to Mr. Merritt’s 401(k) plan account, which contributions were made to all eligible participants; a premium payment for long-term disability benefits; and $44,957 in expenses for travel that Mr. Merritt engaged in for business purposes that could be required to be reported as All Other Compensation under the SEC’s proxy disclosure rules. For Mr. Child, this amount represents $847 in tax gross-ups; and $1,163 in a matching contribution and $2,000 in a discretionary contribution to Mr. Child’s 401(k) plan account, which contributions were made to all eligible participants. For Mr. Morgan, this amount represents $553 in tax gross-ups; and $992 in a matching contribution and $2,000 in a discretionary contribution to Mr. Morgan’s 401(k) plan account, which contributions were made to all eligible participants. For Ms. St. Ledger, this amount represents $973 in tax gross-ups; and $3,180 in a matching contribution and $2,000 in a discretionary contribution to Ms. St. Ledger’s 401(k) plan account, which contributions were made to all eligible participants. For Mr. Tully, this amount represents $638 in tax gross-ups; and $1,319 in a matching contribution and $2,000 in a discretionary contribution to Mr. Tully’s 401(k) plan account, which contributions were made to all eligible participants.
(3) For Mr. Merritt, this amount represents $5,562 in tax gross-ups; spousal expenses associated with attendance at our annual sales achievement event and a gift presented to all attendees at the event; $42,698 in one-time home security installation, equipment and monitoring cost; $2,000 in a matching contribution and $2,000 in a discretionary contribution to Mr. Merritt’s 401(k) plan account, which contributions were made to all eligible participants; and a premium payment for long-term disability benefits. For Mr. Child, this amount represents $24,830 in tax gross-ups; spousal expenses associated with attendance at our annual sales achievement event and a gift presented to all attendees at the event; $48,807 reimbursement of relocation expenses provided as part of his offer letter; $1,769 in a matching contribution and $2,000 in a discretionary contribution to Mr. Childs’ 401(k) plan account, which contributions were made to all eligible participants; and a premium payment for long-term disability benefits. For Mr. Morgan, this amount represents $6,599 in tax gross-ups; and $2,000 in a matching contribution and $2,000 in a discretionary contribution to Mr. Morgan’s 401(k) plan account, which contributions were made to all eligible participants. For Ms. St. Ledger, this amount represents $7,196 in tax gross-ups; guest expenses associated with attendance at our annual sales achievement event and a gift presented to all attendees at the event; $2,000 in a matching contribution and $2,000 in a discretionary contribution to Ms. St. Ledger’s 401(k) plan account, which contributions were made to all eligible participants; and a premium payment for long-term disability benefits. For Mr. Tully, this amount represents $6,225 in tax gross-ups; and $2,239 in a matching contribution and $2,000 in a discretionary contribution to Mr. Tully’s 401(k) plan account, which contributions were made to all eligible participants.
(4) For Mr. Merritt, this amount represents $21,817 in tax gross-ups; $25,662 in spousal expenses associated with attendance at our annual sales achievement event and a gift presented to all attendees at the event; $4,000 in a matching contribution and $3,000 in a discretionary contribution to Mr. Merritt’s 401(k) plan account, which contributions were made to all eligible participants; and a premium payment of $1,854 for long-term disability benefits. For Ms. St. Ledger, this amount represents $14,405 in tax gross-ups; guest expenses associated with attendance at our annual sales achievement event and a gift presented to all attendees at the event; $4,000 in a matching contribution and $3,000 in a discretionary contribution to Ms. St. Ledger’s 401(k) plan account, which contributions were made to all eligible participants; and a premium payment for long-term disability benefits. For Mr. Tully, this amount represents $8,708 in tax gross-ups; a Company gift; spousal expenses associated with attendance at our annual sales achievement event and a gift presented to all attendees at the event; and $3,538 in a matching contribution and $3,000 in a discretionary contribution to Mr. Tully’s 401(k) plan account, which contributions were made to all eligible participants.
(5) Mr. Child joined the Company on May 6, 2019. The salary and non-equity incentive plan compensation amounts presented for Mr. Child are prorated based on the number of days in fiscal 2020 during which he was employed with us.
(6) Pursuant to his offer letter, Mr. Child received a cash signing bonus, subject to reimbursement if he voluntarily resigns from the Company without good reason within 12 months of his start date.
Grants of Plan-Based Awards for Fiscal 2021The following table presents, for each of our NEOs, information concerning grants of plan-based awards made during fiscal 2021. This information supplements the information about these awards set forth in the Summary Compensation Table.
Name Grant Date
Estimated Future Payouts Under Non-Equity Incentive Plan
Awards(1)
Estimated Future Payouts Under Equity Incentive Plan
Awards(2)
All Other Stock
Awards: Number of
Shares or Units (#)(3)
Grant Date Fair Value
of Stock Awards
($)(4)Threshold
($)Target
($)Maximum
($)Threshold
(#)Target
(#)Maximum
(#)
Douglas Merritt — 531,250 1,062,500 2,125,000 — — — — —
RSUs 03/12/2020 — — — — — — 57,313 6,018,438
PSUs 03/12/2020 — — — 42,985 85,970 257,910 — 19,333,012
Jason Child — 194,000 388,000 776,000 — — — — —
RSUs 03/12/2020 — — — — — — 24,268 2,548,383
PSUs 03/12/2020 — — — 18,201 36,402 109,206 — 8,186,145
Scott Morgan — 150,500 301,000 602,000 — — — — —
RSUs 03/12/2020 — — — — — — 15,490 1,626,605
PSUs 03/12/2020 — — — 11,617 23,235 69,705 — 5,225,103
Susan St. Ledger — 262,500 525,000 1,575,000 — — — — —
RSUs 03/12/2020 — — — — — — 25,817 2,711,043
PSUs 03/12/2020 — — — 19,362 38,725 116,175 — 8,708,623
Timothy Tully — 190,000 380,000 760,000 — — — — —
RSUs 03/12/2020 — — — — — — 24,268 2,548,383
PSUs 03/12/2020 — — — 18,201 36,402 109,206 — 8,186,145
(1) Amounts in the “Estimated Future Payouts Under Non-Equity Incentive Plan Awards” columns relate to cash incentive compensation opportunities under each NEO’s individual compensation arrangement. Payments under these plans are subject to a threshold limitation based on achieving at least 96.4% of the target corporate performance objective. Target payment amounts assume achievement of 100% of the target corporate performance objective. Payments to Mr. Merritt, Mr. Child, Mr. Morgan and Mr. Tully under these plans are subject to a maximum payment of 200%, based on achievement of 104.3% or more of the target corporate performance objective. ACV-based payments to Ms. St. Ledger were capped at a maximum of 300% for achievement of 112% or greater of the target corporate performance objective. The actual amounts paid to our NEOs are set forth in the “Summary Compensation Table” above, and the calculation of the actual amounts paid is discussed more fully in “Compensation Discussion and Analysis—Discussion of Our Fiscal 2021 Executive Compensation Program—Components of Compensation Program and Fiscal 2021 Compensation—Cash Bonuses” above.
(2) Amounts in the “Estimated Future Payouts Under Equity Incentive Plan Awards” columns relate to estimated payouts of the fiscal 2021 PSUs. The amounts shown in the Threshold column reflect the corporate PSUs if the minimum annual recurring revenue metric and operating cash flow metric are met and are 50% of the amounts shown under the Target column. The amounts shown in the Target column reflect the corporate PSUs if the annual recurring revenue metric and operating cash flow metric are at target. The amounts shown in the Maximum column reflect the corporate PSUs if the maximum annual recurring revenue metric and operating cash flow metric are met and are 200% of the amounts shown under the Target column, plus the maximum number of stock price PSUs eligible to be earned, which is 50% of the maximum number of corporate PSUs. The PSUs vest over four years, subject to continued service to us. On March 31, 2021, 134.60% of each NEO’s target fiscal 2021 PSUs were earned based upon our fiscal 2021 financial results applying the revised metrics, and one-fourth of these earned corporate PSUs vested on March 31, 2021 and 1/16th vest quarterly thereafter, beginning on June 10, 2021, over the remaining three years, subject to continued service to us.
(3) The RSUs vest over four years, with one-fourth of the RSUs vesting one year following the vesting commencement date and 1/16th vesting quarterly thereafter over the remaining three years, subject to continued service to us.
(4) The amounts reported in this column reflect the aggregate grant date fair value of the RSUs and PSUs granted to our NEOs in fiscal 2021 as computed in accordance with ASC Topic 718. For accounting purposes, the estimated fair value of PSUs was calculated based on the probable outcome of the performance measures for the fiscal 2021 performance period as of October 27, 2020, the date on which the PSUs granted in March 2020 were modified. The fiscal 2021 PSUs include both corporate performance and market-related (stock price modifier) goals. Consistent with the applicable accounting standards, the grant date fair value of the stock price modifier component has been determined using a Monte Carlo simulation model. These amounts do not necessarily correspond to the actual value recognized by NEOs. The assumptions used in the valuation of these awards are consistent with the valuation methodologies specified in the notes to our consolidated financial statements included in our Annual Report on Form 10-K for the fiscal year ended January 31, 2021.
Executive CompensationExecutive Compensation

66 Splunk 2021 Proxy Statement
Outstanding Equity Awards at Fiscal 2021 Year-EndThe following table sets forth information concerning outstanding equity awards held by our NEOs as of January 31, 2021.
Stock Awards
Name
Vesting Commencement
Date
Number of Shares
or Units of Stock
That Have Not
Vested (#)
Market Value of Shares
or Units of Stock That
Have Not Vested ($)(1)
Equity Incentive Plan Awards: Number of
Unearned Shares, Units or Other Rights
That Have Not Vested
(#)
Equity Incentive Plan Awards: Market
or Payout Value of Unearned Shares,
Units or Other Rights That Have Not Vested
($)(1)
Douglas Merritt 3/10/2017 3,334(2) 550,210 — —
3/10/2017 8,434(3) 1,391,863 — —
3/10/2018 11,676(2) 1,926,890 — —
3/10/2018 35,028(4) 5,780,671 — —
3/10/2019 20,700(2) 3,416,121 — —
3/10/2019 46,590(5) 7,688,748 — —
3/12/2020 57,313(2) 9,458,364 — —
3/12/2020 — — 115,715(6) 19,096,446
Jason Child 6/10/2019 25,961(2) 4,284,344 —
3/10/2019 52,588(5) 8,678,598 —
3/12/2020 24,268(2) 4,004,948 —
3/12/2020 — — 48,997(6) 8,085,975
Scott Morgan 3/10/2017 1,250(2) 206,288 — —
12/10/2017 3,250(2) 536,348 — —
9/10/2018 4,375(2) 722,006 — —
3/10/2019 8,593(2) 1,418,103 — —
3/10/2019 19,341(5) 3,191,845 — —
3/12/2020 15,490(2) 2,556,315 — —
3/12/2020 — — 31,274(6) 5,161,148
Susan St. Ledger(7) — — — — —
Timothy Tully 9/10/2017 14,325(2) 2,364,055 — —
3/10/2018 5,500(2) 907,665 — —
3/10/2018 16,500(4) 2,722,995 — —
3/10/2019 11,839(2) 1,953,790 — —
3/10/2019 26,646(5) 4,397,389 — —
3/12/2020 24,268(2) 4,004,948 — —
3/12/2020 — — 48,997(6) 8,085,975
(1) Market Value is calculated based on the closing price of our common stock on The NASDAQ Global Select Market on January 29, 2021 (the last trading day of our fiscal year), which was $165.03.
(2) The RSUs vest over four years, with one-fourth of the RSUs vesting one year following the vesting commencement date and 1/16th vesting quarterly thereafter over the remaining three years, subject to continued service to us.
(3) On March 30, 2018, 168.67% of each NEO’s target fiscal 2018 PSUs were deemed earned based upon our fiscal 2018 financial results. The earned PSUs vest over four years, subject to continued service to us. For Mr. Merritt, one-fourth of the PSUs granted on March 9, 2017 vested on March 30, 2018 and 1/16th vest quarterly thereafter, beginning on June 10, 2018, over the remaining three years.
(4) On March 27, 2019, 200% of each NEO’s target fiscal 2019 PSUs were deemed earned based upon our fiscal 2019 financial results, and one-fourth of these earned corporate PSUs vested on March 27, 2019 and 1/16th vest quarterly thereafter, beginning on June 10, 2019, over the remaining three years, subject to continued service to us. The number of corporate PSUs earned were 112,088 and 52,800 shares for Mr. Merritt and Mr. Tully, respectively. The number of stock price PSUs that will be eligible to be earned and vest beginning in June 2020 through March 2022 are 56,044 and 26,400 for Mr. Merritt and Mr. Tully, respectively. An additional 24.67% to 50% of each continuing NEO’s earned corporate PSUs were earned as stock price PSUs on June 10, 2020, September 10, 2020 and December 10, 2020. The number of stock price PSUs earned were 17,467 and 8,228 for Mr. Merritt and Mr. Tully, respectively.
(5) On March 26, 2020, 150.05% of each NEO’s target fiscal 2020 PSUs were deemed earned based upon our fiscal 2020 financial results, and one-fourth of these earned corporate PSUs vested on March 26, 2020 and 1/16th vest quarterly thereafter, beginning on June 10, 2020, over the remaining three years, subject to continued service to us. The number of corporate PSUs earned were 82,827, 93,488, 34,382 and 47,370 shares for Mr. Merritt, Mr. Child, Mr. Morgan and Mr. Tully, respectively. The number of stock price PSUs that will be eligible to be earned and vest beginning in June 2021 through March 2023 are 41,413, 46,744, 17,191 and 23,685 for Mr. Merritt, Mr. Child, Mr. Morgan and Mr. Tully, respectively.
(6) On March 31, 2021, 134.60% of each NEO’s target fiscal 2021 PSUs were deemed earned based upon our fiscal 2021 financial results, and one-fourth of these earned corporate PSUs vested on March 31, 2021 and 1/16th vest quarterly thereafter, beginning on June 11, 2021, over the remaining three years, subject to continued service to us. The number of corporate PSUs earned were 115,715, 48,997, 31,274 and 48,997 shares for Mr. Merritt, Mr. Child, Mr. Morgan and Mr. Tully, respectively. The number of stock price PSUs that will be eligible to be earned and vest beginning in June 2022 through March 2024 are 57,857, 24,498, 15,637 and 24,498 for Mr. Merritt, Mr. Child, Mr. Morgan and Mr. Tully, respectively.
(7) In connection with Ms. St. Ledger’s termination of employment with the Company on January 31, 2021, all outstanding equity awards were forfeited to the Company.
Option Exercises and Stock Vested in Fiscal 2021The following table sets forth the number of shares acquired and the value realized upon the exercise of stock options and the vesting of RSUs during fiscal 2021 by each of our NEOs.
Name
Option Awards Stock Awards
Number of Shares Acquired on Exercise (#)
Value Realized on Exercise ($)
Number of Shares Acquired on Vesting (#)
Value Realized on Vesting ($)(1)
Douglas Merritt — — 162,543 26,106,363
Jason Child — — 56,476 8,978,744
Scott Morgan — — 33,349 5,206,009
Susan St. Ledger — — 138,228 22,507,344
Timothy Tully — — 74,860 12,063,378
(1) The value realized on vesting is calculated by multiplying the number of shares of stock by the market value of the underlying shares on each vesting date.
Pension Benefits and Nonqualified Deferred CompensationWe do not provide a pension plan for our employees, and none of our NEOs participated in a nonqualified deferred compensation plan during fiscal 2021.
Executive Employment ArrangementsThe initial terms and conditions of employment for each of our NEOs are set forth in written employment offer letters. The letter for Mr. Merritt was negotiated on our behalf by Mr. Sullivan, our then CEO. The letters for Mr. Child, Mr. Morgan, Ms. St. Ledger and Mr. Tully were negotiated on our behalf by Mr. Merritt. All of the employment offer letters were negotiated with the oversight and approval of our Board or Compensation Committee. Each of the employment offer letters with our NEOs sets forth the terms and conditions of such executive’s employment with us and provides for severance and change in control payments and benefits, as described above under “Compensation Discussion and Analysis—Discussion of Our Fiscal 2021 Executive Compensation Program—Components of our Compensation Program and Fiscal 2021 Compensation—Severance and Change in Control-Related Benefits.”
Douglas MerrittWe entered into an initial employment offer letter dated April 7, 2014 with Mr. Merritt, our former Senior Vice President, Field Operations that was superseded by a revised employment offer letter dated November 16, 2015 in connection with his appointment as our President and CEO. Mr. Merritt’s severance and change in control benefits were amended by letter agreements effective as of March 20, 2019 and April 24, 2020 – see “Severance and Change in Control-Related Benefits” section above. Mr. Merritt’s current base salary for fiscal 2022 is $900,000 and his annual target cash bonus is 125% of his base salary.
Executive CompensationExecutive Compensation

PR
OX
Y
67Splunk 2021 Proxy Statement
Outstanding Equity Awards at Fiscal 2021 Year-EndThe following table sets forth information concerning outstanding equity awards held by our NEOs as of January 31, 2021.
Stock Awards
Name
Vesting Commencement
Date
Number of Shares
or Units of Stock
That Have Not
Vested (#)
Market Value of Shares
or Units of Stock That
Have Not Vested ($)(1)
Equity Incentive Plan Awards: Number of
Unearned Shares, Units or Other Rights
That Have Not Vested
(#)
Equity Incentive Plan Awards: Market
or Payout Value of Unearned Shares,
Units or Other Rights That Have Not Vested
($)(1)
Douglas Merritt 3/10/2017 3,334(2) 550,210 — —
3/10/2017 8,434(3) 1,391,863 — —
3/10/2018 11,676(2) 1,926,890 — —
3/10/2018 35,028(4) 5,780,671 — —
3/10/2019 20,700(2) 3,416,121 — —
3/10/2019 46,590(5) 7,688,748 — —
3/12/2020 57,313(2) 9,458,364 — —
3/12/2020 — — 115,715(6) 19,096,446
Jason Child 6/10/2019 25,961(2) 4,284,344 —
3/10/2019 52,588(5) 8,678,598 —
3/12/2020 24,268(2) 4,004,948 —
3/12/2020 — — 48,997(6) 8,085,975
Scott Morgan 3/10/2017 1,250(2) 206,288 — —
12/10/2017 3,250(2) 536,348 — —
9/10/2018 4,375(2) 722,006 — —
3/10/2019 8,593(2) 1,418,103 — —
3/10/2019 19,341(5) 3,191,845 — —
3/12/2020 15,490(2) 2,556,315 — —
3/12/2020 — — 31,274(6) 5,161,148
Susan St. Ledger(7) — — — — —
Timothy Tully 9/10/2017 14,325(2) 2,364,055 — —
3/10/2018 5,500(2) 907,665 — —
3/10/2018 16,500(4) 2,722,995 — —
3/10/2019 11,839(2) 1,953,790 — —
3/10/2019 26,646(5) 4,397,389 — —
3/12/2020 24,268(2) 4,004,948 — —
3/12/2020 — — 48,997(6) 8,085,975
(1) Market Value is calculated based on the closing price of our common stock on The NASDAQ Global Select Market on January 29, 2021 (the last trading day of our fiscal year), which was $165.03.
(2) The RSUs vest over four years, with one-fourth of the RSUs vesting one year following the vesting commencement date and 1/16th vesting quarterly thereafter over the remaining three years, subject to continued service to us.
(3) On March 30, 2018, 168.67% of each NEO’s target fiscal 2018 PSUs were deemed earned based upon our fiscal 2018 financial results. The earned PSUs vest over four years, subject to continued service to us. For Mr. Merritt, one-fourth of the PSUs granted on March 9, 2017 vested on March 30, 2018 and 1/16th vest quarterly thereafter, beginning on June 10, 2018, over the remaining three years.
(4) On March 27, 2019, 200% of each NEO’s target fiscal 2019 PSUs were deemed earned based upon our fiscal 2019 financial results, and one-fourth of these earned corporate PSUs vested on March 27, 2019 and 1/16th vest quarterly thereafter, beginning on June 10, 2019, over the remaining three years, subject to continued service to us. The number of corporate PSUs earned were 112,088 and 52,800 shares for Mr. Merritt and Mr. Tully, respectively. The number of stock price PSUs that will be eligible to be earned and vest beginning in June 2020 through March 2022 are 56,044 and 26,400 for Mr. Merritt and Mr. Tully, respectively. An additional 24.67% to 50% of each continuing NEO’s earned corporate PSUs were earned as stock price PSUs on June 10, 2020, September 10, 2020 and December 10, 2020. The number of stock price PSUs earned were 17,467 and 8,228 for Mr. Merritt and Mr. Tully, respectively.
(5) On March 26, 2020, 150.05% of each NEO’s target fiscal 2020 PSUs were deemed earned based upon our fiscal 2020 financial results, and one-fourth of these earned corporate PSUs vested on March 26, 2020 and 1/16th vest quarterly thereafter, beginning on June 10, 2020, over the remaining three years, subject to continued service to us. The number of corporate PSUs earned were 82,827, 93,488, 34,382 and 47,370 shares for Mr. Merritt, Mr. Child, Mr. Morgan and Mr. Tully, respectively. The number of stock price PSUs that will be eligible to be earned and vest beginning in June 2021 through March 2023 are 41,413, 46,744, 17,191 and 23,685 for Mr. Merritt, Mr. Child, Mr. Morgan and Mr. Tully, respectively.
(6) On March 31, 2021, 134.60% of each NEO’s target fiscal 2021 PSUs were deemed earned based upon our fiscal 2021 financial results, and one-fourth of these earned corporate PSUs vested on March 31, 2021 and 1/16th vest quarterly thereafter, beginning on June 11, 2021, over the remaining three years, subject to continued service to us. The number of corporate PSUs earned were 115,715, 48,997, 31,274 and 48,997 shares for Mr. Merritt, Mr. Child, Mr. Morgan and Mr. Tully, respectively. The number of stock price PSUs that will be eligible to be earned and vest beginning in June 2022 through March 2024 are 57,857, 24,498, 15,637 and 24,498 for Mr. Merritt, Mr. Child, Mr. Morgan and Mr. Tully, respectively.
(7) In connection with Ms. St. Ledger’s termination of employment with the Company on January 31, 2021, all outstanding equity awards were forfeited to the Company.
Option Exercises and Stock Vested in Fiscal 2021The following table sets forth the number of shares acquired and the value realized upon the exercise of stock options and the vesting of RSUs during fiscal 2021 by each of our NEOs.
Name
Option Awards Stock Awards
Number of Shares Acquired on Exercise (#)
Value Realized on Exercise ($)
Number of Shares Acquired on Vesting (#)
Value Realized on Vesting ($)(1)
Douglas Merritt — — 162,543 26,106,363
Jason Child — — 56,476 8,978,744
Scott Morgan — — 33,349 5,206,009
Susan St. Ledger — — 138,228 22,507,344
Timothy Tully — — 74,860 12,063,378
(1) The value realized on vesting is calculated by multiplying the number of shares of stock by the market value of the underlying shares on each vesting date.
Pension Benefits and Nonqualified Deferred CompensationWe do not provide a pension plan for our employees, and none of our NEOs participated in a nonqualified deferred compensation plan during fiscal 2021.
Executive Employment ArrangementsThe initial terms and conditions of employment for each of our NEOs are set forth in written employment offer letters. The letter for Mr. Merritt was negotiated on our behalf by Mr. Sullivan, our then CEO. The letters for Mr. Child, Mr. Morgan, Ms. St. Ledger and Mr. Tully were negotiated on our behalf by Mr. Merritt. All of the employment offer letters were negotiated with the oversight and approval of our Board or Compensation Committee. Each of the employment offer letters with our NEOs sets forth the terms and conditions of such executive’s employment with us and provides for severance and change in control payments and benefits, as described above under “Compensation Discussion and Analysis—Discussion of Our Fiscal 2021 Executive Compensation Program—Components of our Compensation Program and Fiscal 2021 Compensation—Severance and Change in Control-Related Benefits.”
Douglas MerrittWe entered into an initial employment offer letter dated April 7, 2014 with Mr. Merritt, our former Senior Vice President, Field Operations that was superseded by a revised employment offer letter dated November 16, 2015 in connection with his appointment as our President and CEO. Mr. Merritt’s severance and change in control benefits were amended by letter agreements effective as of March 20, 2019 and April 24, 2020 – see “Severance and Change in Control-Related Benefits” section above. Mr. Merritt’s current base salary for fiscal 2022 is $900,000 and his annual target cash bonus is 125% of his base salary.
Executive CompensationExecutive Compensation

68 Splunk 2021 Proxy Statement
Executive Compensation
Jason ChildWe entered into an initial employment offer letter dated April 16, 2019 with Mr. Child, our Senior Vice President and Chief Financial Officer. Mr. Child received a cash signing bonus in the amount of $500,000, subject to reimbursement if he voluntarily resigns from the Company without good reason within 12 months of his start date. Mr. Child’s current base salary for fiscal 2022 is $540,000 and his annual target cash bonus is 100% of his base salary.
Scott MorganWe entered into an initial employment offer letter dated January 24, 2012, as amended on March 28, 2012, with Mr. Morgan, our Senior Vice President, Chief Legal Officer, Global Affairs and Secretary, that was superseded by a revised employment offer letter dated October 30, 2018. Mr. Morgan’s severance and change in control benefits were amended by a letter agreement effective as of March 20, 2019 – see “Severance and Change in Control-Related Benefits” section above. Mr. Morgan’s current base salary for fiscal 2022 is $475,000 and his annual target cash bonus is 80% of his base salary.
Susan St. LedgerWe entered into an employment offer letter dated March 3, 2016 with Ms. St. Ledger, our former Senior Vice President, Chief Revenue Officer. We subsequently entered into a letter agreement dated October 3, 2017 with Ms. St. Ledger in connection with her promotion to President, Worldwide Field Operations. Ms. St. Ledger’s severance and change in control benefits were amended by a letter agreement effective as of March 20, 2019 – see “Severance and Change in Control-Related Benefits” section above. Ms. St. Ledger’s employment with the Company terminated on January 31, 2021.
Timothy TullyWe entered into an employment offer letter dated July 22, 2017 with Mr. Tully, our former Chief Technology Officer that was superseded by a revised employment offer letter dated April 25, 2018 in connection with his promotion to Senior Vice President, Chief Technology Officer. Mr. Tully’s severance and change in control benefits were amended by a letter agreement effective as of March 20, 2019 – see “Severance and Change in Control-Related Benefits” section above. Mr. Tully’s current base salary for fiscal 2022 is $560,000 and his annual target cash bonus is 100% of his base salary. In April 2021, Mr. Tully informed us of his decision to resign as our Senior Vice President, Chief Technology Officer, effective as of May 4, 2021.
Equity Acceleration Death BenefitUnder our 2012 Plan, each of our employees and non-employee directors is eligible to receive the following vesting acceleration upon such person’s death:
• 100% of the shares underlying plan awards held by that person (including any plan awards previously earned based on the achievement of designated performance goals) will vest, and with respect to stock options and stock appreciation rights, become immediately exercisable, and
• where the achievement of designated performance goals has been determined, all performance goals or other applicable vesting criteria required to be met for any plan awards held by that person to be earned will be deemed achieved and all other terms and conditions will be deemed satisfied and that person will immediately become vested in 100% of the earned plan awards, except that
• where the achievement of designated performance goals has not yet been determined, all performance goals or other vesting criteria required to be met for such awards to be earned will be deemed achieved at target levels, and except further that
• if that person’s death occurs following the end of the performance period for any performance goal but prior to the determination of the achievement of such performance goal, then the achievement of such performance goal will be determined based on actual performance.
In the event the person has not continuously served as an employee or non-employee director for at least 12 months prior to his or her death, all references to 100% in this paragraph mean 50%.
Potential Payments Upon Termination or Upon Termination in Connection With a Change in ControlThe following table provides information concerning the estimated payments and benefits that would be provided in the circumstances described below, assuming that the triggering event took place on January 31, 2021.
NEOTermination Without
Cause ($)Termination Without Cause or Resignation for Good
Reason in Connection with a Change in Control ($)(1)
Douglas Merritt
Severance payment(2) 2,337,500 3,825,000
Continued health coverage 30,317 45,476
Accelerated vesting(3) 25,535,865 49,309,274
Total: 27,903,682 53,179,750
Jason Child
Severance payment(2) 630,500 873,000
Continued health coverage 14,868 29,736
Accelerated vesting(3) 6,563,260(4) 25,053,881(5)
Total: 7,208,628 25,956,617
Scott Morgan
Severance payment(2) 516,000 731,000
Continued health coverage 14,924 29,848
Accelerated vesting(3) 4,116,325(4) 13,792,142(5)
Total: 4,647,249 14,552,990
Susan St. Ledger(6)
Severance payment —(7) —(8)
Continued health coverage —(7) —(8)
Accelerated vesting —(7) —(8)
Total: 0 0
Timothy Tully(9)
Severance payment(2) 617,500 855,000
Continued health coverage 9,152 18,304
Accelerated vesting(3) 8,217,686(4) 24,436,834(5)
Total: 8,844,338 25,310,138
(1) A qualifying termination of employment is considered “in connection with a change in control” if such termination occurs within the period commencing three months before and ending 18 months after a “change in control.” Payments upon termination without cause or termination with a change in control require the execution of a release by the recipient in favor of Splunk as described “Compensation Discussion and Analysis—Discussion of Our Fiscal 2021 Executive Compensation Program—Components of our Compensation Program and Fiscal 2021 Compensation—Severance and Change in Control-Related Benefits.”
(2) Each NEO’s base salary plus target bonus amounts, in each case, as was in effect as of January 31, 2021, are used in calculating severance payment amounts.(3) For purposes of valuing accelerated vesting, the values indicated in the table are calculated as follows: (i) with respect to RSUs, as the fair market value of a share of
our common stock on January 29, 2021, which was $165.03, multiplied by the number of unvested RSUs accelerated in accordance with the change in control and severance provisions of such NEO’s offer letter, and (ii) with respect to corporate PSUs, as the fair market value of a share of our common stock on January 31, 2021 multiplied by the earned amounts of the fiscal 2021 PSUs (134.60% of each NEO’s target fiscal 2021 PSUs) in accordance with such NEO’s PSU award agreement.
(4) For purposes of valuing accelerated vesting with respect to stock price PSUs, unearned stock price PSUs are deemed forfeited in accordance with the terms of such NEO’s PSU award agreement.
(5) For purposes of valuing accelerated vesting with respect to stock price PSUs before a determination date, any unearned stock price PSUs are deemed earned based on the price per share paid in the change in control transaction. Using the closing price of our common stock on The NASDAQ Global Select Market on January 29, 2021 (the last trading day of our fiscal year), which was $165.03, as the assumed per share price paid in the change in control transaction, results in no earned stock price PSUs because such price was below the stock price multiplier thresholds.
(6) Ms. St. Ledger’s employment with us terminated on January 31, 2021. On March 10, 2021, the Compensation Committee exercised its discretion under the executive bonus plan to approve a bonus payment to Ms. St. Ledger in an amount that resulted in a total fiscal 2021 bonus payment equaling 98.44% of her fiscal 2021 target annual cash bonus opportunity. This payment could be required to be reported as a payment made upon termination under the SEC’s proxy disclosure rules. This payment is disclosed above in the Non-Equity Incentive Plan Compensation column in the Summary Compensation Table.
Executive CompensationExecutive Compensation

PR
OX
Y
69Splunk 2021 Proxy Statement
Executive Compensation
Jason ChildWe entered into an initial employment offer letter dated April 16, 2019 with Mr. Child, our Senior Vice President and Chief Financial Officer. Mr. Child received a cash signing bonus in the amount of $500,000, subject to reimbursement if he voluntarily resigns from the Company without good reason within 12 months of his start date. Mr. Child’s current base salary for fiscal 2022 is $540,000 and his annual target cash bonus is 100% of his base salary.
Scott MorganWe entered into an initial employment offer letter dated January 24, 2012, as amended on March 28, 2012, with Mr. Morgan, our Senior Vice President, Chief Legal Officer, Global Affairs and Secretary, that was superseded by a revised employment offer letter dated October 30, 2018. Mr. Morgan’s severance and change in control benefits were amended by a letter agreement effective as of March 20, 2019 – see “Severance and Change in Control-Related Benefits” section above. Mr. Morgan’s current base salary for fiscal 2022 is $475,000 and his annual target cash bonus is 80% of his base salary.
Susan St. LedgerWe entered into an employment offer letter dated March 3, 2016 with Ms. St. Ledger, our former Senior Vice President, Chief Revenue Officer. We subsequently entered into a letter agreement dated October 3, 2017 with Ms. St. Ledger in connection with her promotion to President, Worldwide Field Operations. Ms. St. Ledger’s severance and change in control benefits were amended by a letter agreement effective as of March 20, 2019 – see “Severance and Change in Control-Related Benefits” section above. Ms. St. Ledger’s employment with the Company terminated on January 31, 2021.
Timothy TullyWe entered into an employment offer letter dated July 22, 2017 with Mr. Tully, our former Chief Technology Officer that was superseded by a revised employment offer letter dated April 25, 2018 in connection with his promotion to Senior Vice President, Chief Technology Officer. Mr. Tully’s severance and change in control benefits were amended by a letter agreement effective as of March 20, 2019 – see “Severance and Change in Control-Related Benefits” section above. Mr. Tully’s current base salary for fiscal 2022 is $560,000 and his annual target cash bonus is 100% of his base salary. In April 2021, Mr. Tully informed us of his decision to resign as our Senior Vice President, Chief Technology Officer, effective as of May 4, 2021.
Equity Acceleration Death BenefitUnder our 2012 Plan, each of our employees and non-employee directors is eligible to receive the following vesting acceleration upon such person’s death:
• 100% of the shares underlying plan awards held by that person (including any plan awards previously earned based on the achievement of designated performance goals) will vest, and with respect to stock options and stock appreciation rights, become immediately exercisable, and
• where the achievement of designated performance goals has been determined, all performance goals or other applicable vesting criteria required to be met for any plan awards held by that person to be earned will be deemed achieved and all other terms and conditions will be deemed satisfied and that person will immediately become vested in 100% of the earned plan awards, except that
• where the achievement of designated performance goals has not yet been determined, all performance goals or other vesting criteria required to be met for such awards to be earned will be deemed achieved at target levels, and except further that
• if that person’s death occurs following the end of the performance period for any performance goal but prior to the determination of the achievement of such performance goal, then the achievement of such performance goal will be determined based on actual performance.
In the event the person has not continuously served as an employee or non-employee director for at least 12 months prior to his or her death, all references to 100% in this paragraph mean 50%.
Potential Payments Upon Termination or Upon Termination in Connection With a Change in ControlThe following table provides information concerning the estimated payments and benefits that would be provided in the circumstances described below, assuming that the triggering event took place on January 31, 2021.
NEOTermination Without
Cause ($)Termination Without Cause or Resignation for Good
Reason in Connection with a Change in Control ($)(1)
Douglas Merritt
Severance payment(2) 2,337,500 3,825,000
Continued health coverage 30,317 45,476
Accelerated vesting(3) 25,535,865 49,309,274
Total: 27,903,682 53,179,750
Jason Child
Severance payment(2) 630,500 873,000
Continued health coverage 14,868 29,736
Accelerated vesting(3) 6,563,260(4) 25,053,881(5)
Total: 7,208,628 25,956,617
Scott Morgan
Severance payment(2) 516,000 731,000
Continued health coverage 14,924 29,848
Accelerated vesting(3) 4,116,325(4) 13,792,142(5)
Total: 4,647,249 14,552,990
Susan St. Ledger(6)
Severance payment —(7) —(8)
Continued health coverage —(7) —(8)
Accelerated vesting —(7) —(8)
Total: 0 0
Timothy Tully(9)
Severance payment(2) 617,500 855,000
Continued health coverage 9,152 18,304
Accelerated vesting(3) 8,217,686(4) 24,436,834(5)
Total: 8,844,338 25,310,138
(1) A qualifying termination of employment is considered “in connection with a change in control” if such termination occurs within the period commencing three months before and ending 18 months after a “change in control.” Payments upon termination without cause or termination with a change in control require the execution of a release by the recipient in favor of Splunk as described “Compensation Discussion and Analysis—Discussion of Our Fiscal 2021 Executive Compensation Program—Components of our Compensation Program and Fiscal 2021 Compensation—Severance and Change in Control-Related Benefits.”
(2) Each NEO’s base salary plus target bonus amounts, in each case, as was in effect as of January 31, 2021, are used in calculating severance payment amounts.(3) For purposes of valuing accelerated vesting, the values indicated in the table are calculated as follows: (i) with respect to RSUs, as the fair market value of a share of
our common stock on January 29, 2021, which was $165.03, multiplied by the number of unvested RSUs accelerated in accordance with the change in control and severance provisions of such NEO’s offer letter, and (ii) with respect to corporate PSUs, as the fair market value of a share of our common stock on January 31, 2021 multiplied by the earned amounts of the fiscal 2021 PSUs (134.60% of each NEO’s target fiscal 2021 PSUs) in accordance with such NEO’s PSU award agreement.
(4) For purposes of valuing accelerated vesting with respect to stock price PSUs, unearned stock price PSUs are deemed forfeited in accordance with the terms of such NEO’s PSU award agreement.
(5) For purposes of valuing accelerated vesting with respect to stock price PSUs before a determination date, any unearned stock price PSUs are deemed earned based on the price per share paid in the change in control transaction. Using the closing price of our common stock on The NASDAQ Global Select Market on January 29, 2021 (the last trading day of our fiscal year), which was $165.03, as the assumed per share price paid in the change in control transaction, results in no earned stock price PSUs because such price was below the stock price multiplier thresholds.
(6) Ms. St. Ledger’s employment with us terminated on January 31, 2021. On March 10, 2021, the Compensation Committee exercised its discretion under the executive bonus plan to approve a bonus payment to Ms. St. Ledger in an amount that resulted in a total fiscal 2021 bonus payment equaling 98.44% of her fiscal 2021 target annual cash bonus opportunity. This payment could be required to be reported as a payment made upon termination under the SEC’s proxy disclosure rules. This payment is disclosed above in the Non-Equity Incentive Plan Compensation column in the Summary Compensation Table.
Executive CompensationExecutive Compensation

70 Splunk 2021 Proxy Statement
(7) Ms. St. Ledger’s employment with us terminated on January 31, 2021 and was not considered “termination without cause” and therefore she was not entitled to any such payments.
(8) Ms. St. Ledger’s employment with us terminated on January 31, 2021 and was not considered “in connection with a change in control” and therefore she was not entitled to any such payments.
(9) In April 2021, Mr. Tully informed us of his decision to resign as our Senior Vice President, Chief Technology Officer, effective as of May 4, 2021.
CEO Pay RatioUnder SEC rules, we are required to provide information regarding the relationship between the annual total compensation of Mr. Merritt, our President and CEO, and the annual total compensation of our median employee. For our last completed fiscal year, which ended January 31, 2021:
• The median of the annual total compensation of all of our employees (other than Mr. Merritt), including our consolidated subsidiaries, was approximately $251,207. This annual total compensation is calculated in accordance with Item 402(c)(2) (x) of Regulation S-K, and reflects, among other things, salary and bonus earned and aggregate “grant date fair value” of RSU awards granted during the 12-month period ended January 31, 2021.
• Mr. Merritt’s annual total compensation, as reported in the Summary Compensation Table included in this Proxy Statement, was $27,383,811.
• Based on the above, for fiscal 2021, the ratio of Mr. Merritt’s annual total compensation to the median of the annual total compensation of all employees was approximately 109 to 1.
The fiscal 2021 pay ratio would have been 74 to 1 if not for the adjustments to the target as well as the tiers of the ARR metric payout multiples relative to target for the fiscal 2021 PSUs that were made to continue to incentivize our NEOs in light of the increased demands placed upon them due to the uncertainties in the macro environment, including the impact of the COVID-19 pandemic on our business being coupled with the complexities associated with business model transformations. If not for the PSU modifications, the CEO’s annual total compensation would have been $18,508,026. As described in footnote 1 of the 2021 Summary Compensation Table, the additional stock award values included for fiscal 2021 reflect the aggregate incremental fair value generated by the modification of previously granted PSU awards.
Our median employee for fiscal 2020 experienced a significant change in compensation in fiscal 2021. Given this circumstance, we selected a new median employee. We identified the new median employee this fiscal year using the same methodology we used to identify last year’s median employee.
• We determined the median of the annual total compensation of our employees as of January 31, 2021 at which time we (including our consolidated subsidiaries) had approximately 6,513 full-time and part-time employees, including interns, of which approximately 4,638 were U.S. employees, and approximately 1,875 (or approximately 28.8% of our total employee population as of January 31, 2021, excluding acquired employees) were located outside of the United States. In accordance with the SEC’s permitted methodology for determining the “median employee,” we excluded from our calculations 36 employees (or approximately 0.5% of our total employee population as of January 31, 2021) who were hired in connection with the following mergers and acquisitions that we completed in fiscal 2021: OÜ Plumbr, Rigor, Inc. and Flowmill, Inc.
• We then compared the sum of (i) the annual base salary of each of these employees for fiscal 2021, plus (ii) the total annual cash incentive bonus or commission, as applicable, earned by each of these employees for fiscal 2021 as reflected in our payroll records, plus (iii) the aggregate grant date fair value of equity awards (as determined in accordance with footnote 1 of the 2021 Summary Compensation Table) granted to these employees in fiscal 2021, to determine the median employee. Compensation paid in foreign currency was converted to U.S. dollars using a spot exchange rate on March 1, 2021. In determining the median total compensation of all employees, we did not make any cost-of-living adjustments to the compensation paid to any employee outside of the U.S.
Once we identified our median employee, we estimated the median employee’s annual total compensation in accordance with the requirements of Item 402(c)(2)(x) of Regulation S-K, yielding the median annual total compensation disclosed above.
The pay ratio is a reasonable estimate calculated in a manner consistent with Item 402(u) of Regulation S-K under the Securities Act of 1933, as amended, and based upon our reasonable judgment and assumptions. The SEC rules do not specify a single methodology for identification of the median employee or calculation of the pay ratio, and other companies may use assumptions and methodologies that are different from those used by us in calculating their pay ratio. Accordingly, the pay ratio disclosed by other companies may not be comparable to our pay ratio as disclosed above.
Equity Compensation Plan InformationThe following table provides information as of January 31, 2021 with respect to the shares of our common stock that may be issued under our existing equity compensation plans.
Plan Category
(a) Number of
Securities to be Issued Upon
Exercise of Outstanding
Options, Warrants and
Rights
(b) Weighted
Average Exercise Price
of Outstanding Options,
Warrants and Rights
($)(2)
(c) Number of Securities
Remaining Available for Future Issuance
Under Equity Compensation
Plans (Excluding Securities Reflected in
Column (a))
Equity compensation plans approved by stockholders(1) 11,655,646 11.37 43,064,837
Equity compensation plans not approved by stockholders — — —
Total 11,655,646 11.37 43,064,837
(1) Includes the following plans: 2012 Equity Incentive Plan (“2012 Plan”), 2003 Equity Incentive Plan and 2012 Employee Stock Purchase Plan (“2012 ESPP”). Our 2012 Plan provides that on the first day of each fiscal year, the number of shares authorized for issuance under the 2012 Plan is automatically increased by a number equal to the least of (i) ten million (10,000,000) shares of common stock, (ii) five percent (5%) of the aggregate number of shares of common stock outstanding on the last day of the immediately preceding fiscal year, or (iii) such number of shares of common stock that may be determined by our Board. Our 2012 ESPP provides that on the first day of each fiscal year, the number of shares authorized for issuance under the 2012 ESPP is automatically increased by a number equal to the least of (i) four million (4,000,000) shares of common stock, (ii) two percent (2%) of the aggregate number of outstanding shares of common stock on the last day of the immediately preceding fiscal year, or (iii) an amount determined by our Board or any committee designated by the Board to administer the 2012 ESPP.
(2) Does not include shares issuable upon vesting of outstanding RSU awards, which have no exercise price.
Executive CompensationExecutive Compensation

PR
OX
Y
71Splunk 2021 Proxy Statement
(7) Ms. St. Ledger’s employment with us terminated on January 31, 2021 and was not considered “termination without cause” and therefore she was not entitled to any such payments.
(8) Ms. St. Ledger’s employment with us terminated on January 31, 2021 and was not considered “in connection with a change in control” and therefore she was not entitled to any such payments.
(9) In April 2021, Mr. Tully informed us of his decision to resign as our Senior Vice President, Chief Technology Officer, effective as of May 4, 2021.
CEO Pay RatioUnder SEC rules, we are required to provide information regarding the relationship between the annual total compensation of Mr. Merritt, our President and CEO, and the annual total compensation of our median employee. For our last completed fiscal year, which ended January 31, 2021:
• The median of the annual total compensation of all of our employees (other than Mr. Merritt), including our consolidated subsidiaries, was approximately $251,207. This annual total compensation is calculated in accordance with Item 402(c)(2) (x) of Regulation S-K, and reflects, among other things, salary and bonus earned and aggregate “grant date fair value” of RSU awards granted during the 12-month period ended January 31, 2021.
• Mr. Merritt’s annual total compensation, as reported in the Summary Compensation Table included in this Proxy Statement, was $27,383,811.
• Based on the above, for fiscal 2021, the ratio of Mr. Merritt’s annual total compensation to the median of the annual total compensation of all employees was approximately 109 to 1.
The fiscal 2021 pay ratio would have been 74 to 1 if not for the adjustments to the target as well as the tiers of the ARR metric payout multiples relative to target for the fiscal 2021 PSUs that were made to continue to incentivize our NEOs in light of the increased demands placed upon them due to the uncertainties in the macro environment, including the impact of the COVID-19 pandemic on our business being coupled with the complexities associated with business model transformations. If not for the PSU modifications, the CEO’s annual total compensation would have been $18,508,026. As described in footnote 1 of the 2021 Summary Compensation Table, the additional stock award values included for fiscal 2021 reflect the aggregate incremental fair value generated by the modification of previously granted PSU awards.
Our median employee for fiscal 2020 experienced a significant change in compensation in fiscal 2021. Given this circumstance, we selected a new median employee. We identified the new median employee this fiscal year using the same methodology we used to identify last year’s median employee.
• We determined the median of the annual total compensation of our employees as of January 31, 2021 at which time we (including our consolidated subsidiaries) had approximately 6,513 full-time and part-time employees, including interns, of which approximately 4,638 were U.S. employees, and approximately 1,875 (or approximately 28.8% of our total employee population as of January 31, 2021, excluding acquired employees) were located outside of the United States. In accordance with the SEC’s permitted methodology for determining the “median employee,” we excluded from our calculations 36 employees (or approximately 0.5% of our total employee population as of January 31, 2021) who were hired in connection with the following mergers and acquisitions that we completed in fiscal 2021: OÜ Plumbr, Rigor, Inc. and Flowmill, Inc.
• We then compared the sum of (i) the annual base salary of each of these employees for fiscal 2021, plus (ii) the total annual cash incentive bonus or commission, as applicable, earned by each of these employees for fiscal 2021 as reflected in our payroll records, plus (iii) the aggregate grant date fair value of equity awards (as determined in accordance with footnote 1 of the 2021 Summary Compensation Table) granted to these employees in fiscal 2021, to determine the median employee. Compensation paid in foreign currency was converted to U.S. dollars using a spot exchange rate on March 1, 2021. In determining the median total compensation of all employees, we did not make any cost-of-living adjustments to the compensation paid to any employee outside of the U.S.
Once we identified our median employee, we estimated the median employee’s annual total compensation in accordance with the requirements of Item 402(c)(2)(x) of Regulation S-K, yielding the median annual total compensation disclosed above.
The pay ratio is a reasonable estimate calculated in a manner consistent with Item 402(u) of Regulation S-K under the Securities Act of 1933, as amended, and based upon our reasonable judgment and assumptions. The SEC rules do not specify a single methodology for identification of the median employee or calculation of the pay ratio, and other companies may use assumptions and methodologies that are different from those used by us in calculating their pay ratio. Accordingly, the pay ratio disclosed by other companies may not be comparable to our pay ratio as disclosed above.
Equity Compensation Plan InformationThe following table provides information as of January 31, 2021 with respect to the shares of our common stock that may be issued under our existing equity compensation plans.
Plan Category
(a) Number of
Securities to be Issued Upon
Exercise of Outstanding
Options, Warrants and
Rights
(b) Weighted
Average Exercise Price
of Outstanding Options,
Warrants and Rights
($)(2)
(c) Number of Securities
Remaining Available for Future Issuance
Under Equity Compensation
Plans (Excluding Securities Reflected in
Column (a))
Equity compensation plans approved by stockholders(1) 11,655,646 11.37 43,064,837
Equity compensation plans not approved by stockholders — — —
Total 11,655,646 11.37 43,064,837
(1) Includes the following plans: 2012 Equity Incentive Plan (“2012 Plan”), 2003 Equity Incentive Plan and 2012 Employee Stock Purchase Plan (“2012 ESPP”). Our 2012 Plan provides that on the first day of each fiscal year, the number of shares authorized for issuance under the 2012 Plan is automatically increased by a number equal to the least of (i) ten million (10,000,000) shares of common stock, (ii) five percent (5%) of the aggregate number of shares of common stock outstanding on the last day of the immediately preceding fiscal year, or (iii) such number of shares of common stock that may be determined by our Board. Our 2012 ESPP provides that on the first day of each fiscal year, the number of shares authorized for issuance under the 2012 ESPP is automatically increased by a number equal to the least of (i) four million (4,000,000) shares of common stock, (ii) two percent (2%) of the aggregate number of outstanding shares of common stock on the last day of the immediately preceding fiscal year, or (iii) an amount determined by our Board or any committee designated by the Board to administer the 2012 ESPP.
(2) Does not include shares issuable upon vesting of outstanding RSU awards, which have no exercise price.
Executive CompensationExecutive Compensation

72 Splunk 2021 Proxy Statement
Stock Ownership Information
Security Ownership of Certain Beneficial Owners and ManagementThe following table sets forth certain information with respect to the beneficial ownership of our common stock at March 31, 2021 for:
• each person or group of affiliated persons known by us to be the beneficial owner of more than 5% of our common stock;
• each of our NEOs;
• each of our directors; and
• all of our executive officers and directors as a group.
The information provided in the table is based on our records, information filed with the SEC, and information provided to us. For our 5% stockholders, to the extent we did not have more recent information, we relied upon such stockholders’ most recent filing with the SEC pursuant to Section 13(g) of the Exchange Act as noted below. We have determined beneficial ownership in accordance with the rules of the SEC, and the information is not necessarily indicative of beneficial ownership for any other purpose. Except as indicated by the footnotes below, we believe, based on information furnished to us, that the persons and entities named in the table below have sole voting and sole investment power with respect to all shares of common stock that they beneficially owned, subject to applicable community property laws.
Applicable percentage ownership is based on 163,842,462 shares of common stock outstanding at March 31, 2021. In computing the number of shares of common stock beneficially owned by a person or entity and the percentage ownership of such person or entity, we deemed to be outstanding all shares of common stock subject to shares held by the person that are currently exercisable or exercisable (or issuable upon vesting of RSUs) within 60 days of March 31, 2021. However, we did not deem such shares outstanding for the purpose of computing the percentage ownership of any other person.
Unless otherwise indicated in their respective footnote, the address of each beneficial owner listed in the table below is c/o Splunk Inc., 270 Brannan Street, San Francisco, California 94107.
Number of Shares
Percent of Shares
Outstanding
5% Stockholders:
T. Rowe Price Associates, Inc.(1) 25,466,761 15.5%
The Vanguard Group, Inc.(2) 14,386,846 8.8%
BlackRock, Inc.(3) 10,795,387 6.6%
NEOs and Directors:
Douglas Merritt 115,689 *
Jason Child 54,312 *
Scott Morgan 41,011 *
Susan St. Ledger 35,890 *
Timothy Tully 12,653 *
Sara Baack 13,412 *
Sean Boyle — *
Mark Carges 16,424 *
John Connors 70,276 *
Patricia Morrison 29,615 *
Stephen Newberry 39,913 *
Graham Smith 31,482 *
Elisa Steele 13,412 *
General Dennis Via (ret) — *
Sri Viswanath 5,488 *
All executive officers and directors as a group (14 persons) 443,687 *
* Represents beneficial ownership of less than one percent (1%).(1) As of December 31, 2020, the reporting date of T. Rowe Price Associates, Inc.’s most recent filing with the SEC pursuant to Section 13(g) of the Exchange Act
filed on February 16, 2021, T. Rowe Price Associates, Inc. (“Price Associates”), in its capacity as an investment adviser, has sole voting power with respect to 10,591,406 shares and sole dispositive power with respect to 25,466,761 shares reported as beneficially owned. Securities are beneficially owned by clients of Price Associates. The address for Price Associates is 100 E. Pratt Street, Baltimore, MD 21202.
(2) As of December 31, 2020, the reporting date of The Vanguard Group, Inc.’s most recent filing with the SEC pursuant to Section 13(g) of the Exchange Act filed on February 10, 2021, The Vanguard Group, Inc. (“Vanguard”), in its capacity as an investment advisor, has shared voting power with respect to 166,431 shares, sole dispositive power with respect to 14,004,523 shares, and shared dispositive power with respect to 382,323 shares reported as beneficially owned. The address for Vanguard is 100 Vanguard Blvd., Malvern, PA 19355.
(3) As of December 31, 2020, the reporting date of BlackRock, Inc.’s most recent filing with the SEC pursuant to Section 13(g) of the Exchange Act filed on February 5, 2021, BlackRock, Inc. (“BlackRock”), which is a parent holding company or control person, has sole voting power with respect to 9,719,840 shares and sole dispositive power with respect to 10,795,387 shares reported as beneficially owned. The address for BlackRock is 55 East 52nd Street, New York, NY 10055.
Delinquent Section 16(a) ReportsSection 16(a) of the Securities Exchange Act of 1934, as amended, requires that our executive officers and directors, and persons who own more than 10% of our common stock, file reports of ownership and changes of ownership with the SEC. Such directors, executive officers and 10% stockholders are required by SEC regulation to furnish us with copies of all Section 16(a) forms they file.
SEC regulations require us to identify in this proxy statement anyone who filed a required report late during the most recent fiscal year. Based on our review of forms we received, or written representations from reporting persons stating that they were not required to file these forms, we believe that during fiscal 2021, all Section 16(a) filing requirements were satisfied on a timely basis, except that we were late in filing a Form 4 for Timothy Emanuelson with respect to a transaction on November 16, 2020 that was reported on a Form 4 on November 19, 2020.
Stock Ownership Information

PR
OX
Y
73Splunk 2021 Proxy Statement
Stock Ownership Information
Security Ownership of Certain Beneficial Owners and ManagementThe following table sets forth certain information with respect to the beneficial ownership of our common stock at March 31, 2021 for:
• each person or group of affiliated persons known by us to be the beneficial owner of more than 5% of our common stock;
• each of our NEOs;
• each of our directors; and
• all of our executive officers and directors as a group.
The information provided in the table is based on our records, information filed with the SEC, and information provided to us. For our 5% stockholders, to the extent we did not have more recent information, we relied upon such stockholders’ most recent filing with the SEC pursuant to Section 13(g) of the Exchange Act as noted below. We have determined beneficial ownership in accordance with the rules of the SEC, and the information is not necessarily indicative of beneficial ownership for any other purpose. Except as indicated by the footnotes below, we believe, based on information furnished to us, that the persons and entities named in the table below have sole voting and sole investment power with respect to all shares of common stock that they beneficially owned, subject to applicable community property laws.
Applicable percentage ownership is based on 163,842,462 shares of common stock outstanding at March 31, 2021. In computing the number of shares of common stock beneficially owned by a person or entity and the percentage ownership of such person or entity, we deemed to be outstanding all shares of common stock subject to shares held by the person that are currently exercisable or exercisable (or issuable upon vesting of RSUs) within 60 days of March 31, 2021. However, we did not deem such shares outstanding for the purpose of computing the percentage ownership of any other person.
Unless otherwise indicated in their respective footnote, the address of each beneficial owner listed in the table below is c/o Splunk Inc., 270 Brannan Street, San Francisco, California 94107.
Number of Shares
Percent of Shares
Outstanding
5% Stockholders:
T. Rowe Price Associates, Inc.(1) 25,466,761 15.5%
The Vanguard Group, Inc.(2) 14,386,846 8.8%
BlackRock, Inc.(3) 10,795,387 6.6%
NEOs and Directors:
Douglas Merritt 115,689 *
Jason Child 54,312 *
Scott Morgan 41,011 *
Susan St. Ledger 35,890 *
Timothy Tully 12,653 *
Sara Baack 13,412 *
Sean Boyle — *
Mark Carges 16,424 *
John Connors 70,276 *
Patricia Morrison 29,615 *
Stephen Newberry 39,913 *
Graham Smith 31,482 *
Elisa Steele 13,412 *
General Dennis Via (ret) — *
Sri Viswanath 5,488 *
All executive officers and directors as a group (14 persons) 443,687 *
* Represents beneficial ownership of less than one percent (1%).(1) As of December 31, 2020, the reporting date of T. Rowe Price Associates, Inc.’s most recent filing with the SEC pursuant to Section 13(g) of the Exchange Act
filed on February 16, 2021, T. Rowe Price Associates, Inc. (“Price Associates”), in its capacity as an investment adviser, has sole voting power with respect to 10,591,406 shares and sole dispositive power with respect to 25,466,761 shares reported as beneficially owned. Securities are beneficially owned by clients of Price Associates. The address for Price Associates is 100 E. Pratt Street, Baltimore, MD 21202.
(2) As of December 31, 2020, the reporting date of The Vanguard Group, Inc.’s most recent filing with the SEC pursuant to Section 13(g) of the Exchange Act filed on February 10, 2021, The Vanguard Group, Inc. (“Vanguard”), in its capacity as an investment advisor, has shared voting power with respect to 166,431 shares, sole dispositive power with respect to 14,004,523 shares, and shared dispositive power with respect to 382,323 shares reported as beneficially owned. The address for Vanguard is 100 Vanguard Blvd., Malvern, PA 19355.
(3) As of December 31, 2020, the reporting date of BlackRock, Inc.’s most recent filing with the SEC pursuant to Section 13(g) of the Exchange Act filed on February 5, 2021, BlackRock, Inc. (“BlackRock”), which is a parent holding company or control person, has sole voting power with respect to 9,719,840 shares and sole dispositive power with respect to 10,795,387 shares reported as beneficially owned. The address for BlackRock is 55 East 52nd Street, New York, NY 10055.
Delinquent Section 16(a) ReportsSection 16(a) of the Securities Exchange Act of 1934, as amended, requires that our executive officers and directors, and persons who own more than 10% of our common stock, file reports of ownership and changes of ownership with the SEC. Such directors, executive officers and 10% stockholders are required by SEC regulation to furnish us with copies of all Section 16(a) forms they file.
SEC regulations require us to identify in this proxy statement anyone who filed a required report late during the most recent fiscal year. Based on our review of forms we received, or written representations from reporting persons stating that they were not required to file these forms, we believe that during fiscal 2021, all Section 16(a) filing requirements were satisfied on a timely basis, except that we were late in filing a Form 4 for Timothy Emanuelson with respect to a transaction on November 16, 2020 that was reported on a Form 4 on November 19, 2020.
Stock Ownership Information

74 Splunk 2021 Proxy Statement
Other Matters
Questions and Answers About the Proxy Materials and Our 2021 Annual MeetingThe information provided in the “question and answer” format below is for your convenience only and is merely a summary of the information contained in this proxy statement. You should read this entire proxy statement carefully.
How do I attend and participate in the Virtual Annual Meeting?This year’s Annual Meeting will be conducted as a virtual-only meeting of stockholders. We will host the Annual Meeting online through a live audio webcast. You are entitled to attend the Annual Meeting if you were a holder of our common stock as of the close of business on April 21, 2021, hold a valid proxy for the Annual Meeting or are an authorized guest of the Company. You will be able to attend the Annual Meeting and submit your questions during the Annual Meeting by visiting www.virtualshareholdermeeting.com/SPLK2021. You will need the control number included on your Notice or proxy card or in the instructions from your broker in order to attend and participate in the Annual Meeting virtually.
The format of the virtual Annual Meeting has been designed to ensure that our stockholders generally have the same rights and opportunities to participate as they would at an in-person meeting and we have endeavored to provide stockholder access, participation and communication through online tools. The virtual format facilitates stockholder attendance and participation by enabling stockholders to participate fully and equally from any location around the world. During the meeting, you will have the ability to submit a question real-time via the virtual meeting website. We will answer as many questions submitted in accordance with the meeting rules of conduct as possible in the time allotted for the meeting. Only questions that are relevant to our business operations will be answered. A copy of the Annual Meeting rules of conduct will be available online at the Annual Meeting.
Online check-in will begin at 3:15 p.m. Pacific Time on June 17, 2021, and you should allow ample time for the online check-in proceedings. If you encounter any difficulties accessing the Annual Meeting during the check-in or meeting time, please call the technical support number that will be posted on the Annual Meeting log-in page. Technical support will be available starting at 3:15 p.m. Pacific Time on the day of the meeting. If you wish to submit questions prior to the Annual Meeting, you may do so at www.proxyvote.com by signing in with your control number.
What matters am I voting on?You will be voting on:
• the election of four Class III directors to hold office until the 2024 annual meeting of stockholders or until their successors are duly elected and qualified;
• a proposal to ratify the appointment of PricewaterhouseCoopers LLP as our independent registered public accounting firm for the fiscal year ending January 31, 2022;
• an advisory vote to approve the compensation of our named executive officers, as described in this proxy statement; and
• any other business that may properly come before the meeting.
How does the Board recommend I vote on these proposals?The Board recommends a vote:
• FOR each of the nominees for election as Class III directors;
• FOR the ratification of the appointment of PricewaterhouseCoopers LLP as our independent registered public accounting firm for the fiscal year ending January 31, 2022; and
• FOR approval, on an advisory basis, of our named executive officer compensation.
Who is entitled to vote?Holders of our common stock as of the close of business on April 21, 2021 (the “Record Date”), may vote at the Annual Meeting. As of the Record Date, we had 163,902,668 shares of common stock outstanding. In deciding all matters at the Annual Meeting, each stockholder will be entitled to one vote for each share of common stock held on the Record Date. We do not have cumulative voting rights for the election of directors.
Registered Stockholders. If your shares are registered directly in your name with our transfer agent, you are considered the stockholder of record with respect to those shares, and the Notice was provided to you directly by us. As the stockholder of record, you have the right to grant your voting proxy directly to the individuals listed on the proxy card or to vote in person (electronically) at the Annual Meeting.
Street Name Stockholders. If your shares are held in a stock brokerage account or by a bank or other nominee, you are considered the beneficial owner of shares held in street name, or a street name stockholder, and the Notice was forwarded to you by your broker, bank or other nominee, who is considered the stockholder of record with respect to those shares. As the beneficial owner, you have the right to direct your broker, bank or other nominee on how to vote your shares. Beneficial owners are also invited to attend the Annual Meeting in person (virtually). Beneficial owners who did not receive a 16-digit control number from their broker or bank, who wish to attend the Annual Meeting in person (virtually) should follow the instructions from their broker or bank, including any requirement to obtain a legal proxy. Most brokers or banks allow a beneficial owner to obtain a legal proxy either online or by mail. If you request a printed copy of the proxy materials by mail, your broker, bank or other nominee will provide a voting instruction card for you to use to direct your broker, bank or other nominee how to vote your shares.
How do I vote?If you are a registered stockholder, you may:
• instruct the proxy holder or holders on how to vote your shares by using the Internet voting site or the toll-free telephone number listed on the Notice, 24 hours a day, seven days a week, until 11:59 p.m. Eastern Time on June 16, 2021 (have the Notice or proxy card in hand when you call or visit the website);
• instruct the proxy holder or holders on how to vote your shares by completing and mailing your proxy card to the address indicated on your proxy card (if you received printed proxy materials), which must be received by the time of the Annual Meeting; or
• vote your shares in person (electronically) at the Annual Meeting.
To attend and participate in the Annual Meeting virtually, stockholders of record will need to use their control number on their Notice or proxy card to log onto www.virtualshareholdermeeting.com/SPLK2021.
If you are a street name stockholder, you will receive instructions from your broker, bank or other nominee. The instructions from your broker, bank or other nominee will indicate if the various methods by which you may vote, including whether Internet or telephone voting, are available.
Can I change or revoke my vote?Yes. Subject to any rules your broker, bank or other nominee may have, you can change your vote or revoke your proxy before the Annual Meeting.
If you are a registered stockholder, you may change your vote by:
• entering a new vote via Internet or by telephone by 11:59 p.m. Eastern Time on June 16, 2021;
• returning a later-dated proxy card which must be received by the time of the Annual Meeting; or
• submitting a later-dated vote electronically at the Annual Meeting.
If you are a registered stockholder, you may also revoke your proxy by providing our Corporate Secretary with a written notice of revocation prior to your shares being voted at the Annual Meeting. Such written notice of revocation should be hand delivered to Splunk’s Corporate Secretary or mailed to and received by Splunk Inc. prior to the Annual Meeting at 270 Brannan Street, San Francisco, California 94107, Attention: Corporate Secretary.
Other Matters

PR
OX
Y
75Splunk 2021 Proxy Statement
Other Matters
Questions and Answers About the Proxy Materials and Our 2021 Annual MeetingThe information provided in the “question and answer” format below is for your convenience only and is merely a summary of the information contained in this proxy statement. You should read this entire proxy statement carefully.
How do I attend and participate in the Virtual Annual Meeting?This year’s Annual Meeting will be conducted as a virtual-only meeting of stockholders. We will host the Annual Meeting online through a live audio webcast. You are entitled to attend the Annual Meeting if you were a holder of our common stock as of the close of business on April 21, 2021, hold a valid proxy for the Annual Meeting or are an authorized guest of the Company. You will be able to attend the Annual Meeting and submit your questions during the Annual Meeting by visiting www.virtualshareholdermeeting.com/SPLK2021. You will need the control number included on your Notice or proxy card or in the instructions from your broker in order to attend and participate in the Annual Meeting virtually.
The format of the virtual Annual Meeting has been designed to ensure that our stockholders generally have the same rights and opportunities to participate as they would at an in-person meeting and we have endeavored to provide stockholder access, participation and communication through online tools. The virtual format facilitates stockholder attendance and participation by enabling stockholders to participate fully and equally from any location around the world. During the meeting, you will have the ability to submit a question real-time via the virtual meeting website. We will answer as many questions submitted in accordance with the meeting rules of conduct as possible in the time allotted for the meeting. Only questions that are relevant to our business operations will be answered. A copy of the Annual Meeting rules of conduct will be available online at the Annual Meeting.
Online check-in will begin at 3:15 p.m. Pacific Time on June 17, 2021, and you should allow ample time for the online check-in proceedings. If you encounter any difficulties accessing the Annual Meeting during the check-in or meeting time, please call the technical support number that will be posted on the Annual Meeting log-in page. Technical support will be available starting at 3:15 p.m. Pacific Time on the day of the meeting. If you wish to submit questions prior to the Annual Meeting, you may do so at www.proxyvote.com by signing in with your control number.
What matters am I voting on?You will be voting on:
• the election of four Class III directors to hold office until the 2024 annual meeting of stockholders or until their successors are duly elected and qualified;
• a proposal to ratify the appointment of PricewaterhouseCoopers LLP as our independent registered public accounting firm for the fiscal year ending January 31, 2022;
• an advisory vote to approve the compensation of our named executive officers, as described in this proxy statement; and
• any other business that may properly come before the meeting.
How does the Board recommend I vote on these proposals?The Board recommends a vote:
• FOR each of the nominees for election as Class III directors;
• FOR the ratification of the appointment of PricewaterhouseCoopers LLP as our independent registered public accounting firm for the fiscal year ending January 31, 2022; and
• FOR approval, on an advisory basis, of our named executive officer compensation.
Who is entitled to vote?Holders of our common stock as of the close of business on April 21, 2021 (the “Record Date”), may vote at the Annual Meeting. As of the Record Date, we had 163,902,668 shares of common stock outstanding. In deciding all matters at the Annual Meeting, each stockholder will be entitled to one vote for each share of common stock held on the Record Date. We do not have cumulative voting rights for the election of directors.
Registered Stockholders. If your shares are registered directly in your name with our transfer agent, you are considered the stockholder of record with respect to those shares, and the Notice was provided to you directly by us. As the stockholder of record, you have the right to grant your voting proxy directly to the individuals listed on the proxy card or to vote in person (electronically) at the Annual Meeting.
Street Name Stockholders. If your shares are held in a stock brokerage account or by a bank or other nominee, you are considered the beneficial owner of shares held in street name, or a street name stockholder, and the Notice was forwarded to you by your broker, bank or other nominee, who is considered the stockholder of record with respect to those shares. As the beneficial owner, you have the right to direct your broker, bank or other nominee on how to vote your shares. Beneficial owners are also invited to attend the Annual Meeting in person (virtually). Beneficial owners who did not receive a 16-digit control number from their broker or bank, who wish to attend the Annual Meeting in person (virtually) should follow the instructions from their broker or bank, including any requirement to obtain a legal proxy. Most brokers or banks allow a beneficial owner to obtain a legal proxy either online or by mail. If you request a printed copy of the proxy materials by mail, your broker, bank or other nominee will provide a voting instruction card for you to use to direct your broker, bank or other nominee how to vote your shares.
How do I vote?If you are a registered stockholder, you may:
• instruct the proxy holder or holders on how to vote your shares by using the Internet voting site or the toll-free telephone number listed on the Notice, 24 hours a day, seven days a week, until 11:59 p.m. Eastern Time on June 16, 2021 (have the Notice or proxy card in hand when you call or visit the website);
• instruct the proxy holder or holders on how to vote your shares by completing and mailing your proxy card to the address indicated on your proxy card (if you received printed proxy materials), which must be received by the time of the Annual Meeting; or
• vote your shares in person (electronically) at the Annual Meeting.
To attend and participate in the Annual Meeting virtually, stockholders of record will need to use their control number on their Notice or proxy card to log onto www.virtualshareholdermeeting.com/SPLK2021.
If you are a street name stockholder, you will receive instructions from your broker, bank or other nominee. The instructions from your broker, bank or other nominee will indicate if the various methods by which you may vote, including whether Internet or telephone voting, are available.
Can I change or revoke my vote?Yes. Subject to any rules your broker, bank or other nominee may have, you can change your vote or revoke your proxy before the Annual Meeting.
If you are a registered stockholder, you may change your vote by:
• entering a new vote via Internet or by telephone by 11:59 p.m. Eastern Time on June 16, 2021;
• returning a later-dated proxy card which must be received by the time of the Annual Meeting; or
• submitting a later-dated vote electronically at the Annual Meeting.
If you are a registered stockholder, you may also revoke your proxy by providing our Corporate Secretary with a written notice of revocation prior to your shares being voted at the Annual Meeting. Such written notice of revocation should be hand delivered to Splunk’s Corporate Secretary or mailed to and received by Splunk Inc. prior to the Annual Meeting at 270 Brannan Street, San Francisco, California 94107, Attention: Corporate Secretary.
Other Matters

76 Splunk 2021 Proxy Statement
If you are a street name stockholder, you may change your vote by:
• submitting new voting instructions to your broker, bank or other nominee pursuant to instructions provided by such broker, bank or other nominee; or
• submitting a later-dated vote electronically at the Annual Meeting; provided you have obtained a legal proxy from your broker, bank or other nominee giving you the right to vote the shares.
If you are a street name stockholder, you must contact your broker, bank or other nominee that holds your shares to find out how to revoke your proxy.
What is the effect of giving a proxy?Proxies are solicited by and on behalf of our Board. The persons named in the proxy have been designated as proxy holders. When proxies are properly dated, executed and returned, the shares represented by such proxies will be voted electronically at the Annual Meeting in accordance with the instructions of the stockholder. If the proxy is properly dated, executed and returned, but no specific instructions are given, the shares will be voted in accordance with the recommendations of our Board as described above. If any matter not described in the proxy statement is properly presented at the Annual Meeting, the proxy holders will use their own judgment to determine how to vote your shares. If the Annual Meeting is adjourned, the proxy holders can vote your shares on the new meeting date as well, unless you have properly revoked your proxy, as described above.
Why did I receive a notice regarding the availability of proxy materials on the internet instead of a full set of proxy materials?In accordance with the rules of the SEC, we have elected to furnish our proxy materials, including this proxy statement and our annual report to our stockholders, primarily via the Internet. On or about May 4, 2021, we mailed to our stockholders the Notice that contains instructions on how to access our proxy materials on the Internet, how to vote at the Annual Meeting, and how to request printed copies of the proxy materials and annual report. Stockholders may request to receive all future proxy materials in printed form by mail or electronically by e-mail by following the instructions contained in the Notice. We encourage stockholders to take advantage of the availability of the proxy materials on the Internet to help reduce the environmental impact of our annual meetings and keep our Annual Meeting process efficient.
What is a quorum?A quorum is the minimum number of shares required to be present at the scheduled time of the Annual Meeting in person (virtually) or by proxy for the meeting to be properly held under our Bylaws and Delaware law. The presence in person (virtually) or by proxy, of a majority of all issued and outstanding shares of common stock entitled to vote at the Annual Meeting will constitute a quorum at the Annual Meeting. A proxy submitted by a stockholder may indicate that all or a portion of the shares represented by the proxy are not being voted (“stockholder withholding”) with respect to a particular matter. Similarly, a broker may not be permitted to vote stock (“broker non-vote”) held in street name on a particular matter in the absence of instructions from the beneficial owner of the stock. See “How may my broker, bank or other nominee vote my shares if I fail to provide timely directions?” below. The shares subject to a proxy that are not being voted on a particular matter because of either stockholder withholding or broker non-vote will count for purposes of determining the presence of a quorum. Abstentions are also counted in the determination of a quorum.
How many votes are needed for approval of each matter?• Proposal 1: Each director nominee will be elected by a vote of the majority of the votes cast. A majority of the votes cast
means the number of votes cast “For” such nominee’s election exceeds the number of votes cast “Against” that nominee. You may vote “For,” “Against,” or “Abstain” with respect to each director nominee. Broker non-votes and abstentions, if any, will have no effect on the outcome of the election.
• Proposal 2: The ratification of the appointment of PricewaterhouseCoopers LLP must receive the affirmative vote of at least a majority of the shares present in person (virtually) or by proxy at the meeting and entitled to vote thereon to be approved. You may vote “For,” “Against,” or “Abstain” with respect to this proposal. Abstentions are considered votes cast and thus will have the same effect as a vote “Against” the proposal. Broker non-votes, if any, will have no effect on the outcome of this proposal.
• Proposal 3: The advisory vote to approve the compensation of our named executive officers must receive the affirmative vote of at least a majority of the shares present in person (virtually) or by proxy at the meeting and entitled to vote thereon to be approved. You may vote “For,” “Against,” or “Abstain” with respect to this proposal. Abstentions are considered votes cast and thus will have the same effect as votes “Against” the proposal. Broker non-votes, if any, will have no effect on the outcome of the vote. Because this vote is advisory only, it will not be binding on us, our Compensation Committee or our Board. However, we value our stockholders’ input and will take the vote into consideration when evaluating executive compensation decisions.
What happens if a director nominee who is duly nominated does not receive a majority vote?The Board nominates for election or re-election as director only candidates who have tendered, in advance of such nomination, an irrevocable, conditional resignation that will be effective only upon both (i) the failure to receive the required vote at the next annual meeting of stockholders at which they face re-election and (ii) the Board’s acceptance of such resignation. In an uncontested election, the Board, after taking into consideration the recommendation of the Nominating and Corporate Governance Committee, will determine whether or not to accept the pre-tendered resignation of any nominee for director who receives a greater number of votes “Against” such nominee’s election than votes “For” such nominee’s election. In the event of a contested election, the director nominees equal to the number of seats available who receive the largest number of votes cast “For” their election will be elected as directors.
How are proxies solicited for the Annual Meeting?The Board is soliciting proxies for use at the Annual Meeting. All expenses associated with this solicitation will be borne by us. We will reimburse brokers, banks or other nominees for reasonable expenses that they incur in sending these proxy materials to you, if a broker, bank or other nominee holds your shares.
How may my broker, bank or other nominee vote my shares if I fail to provide timely directions?Brokers, banks and other nominees holding shares in street name for their customers are generally required to vote such shares in the manner directed by their customers. In the absence of timely directions, your broker, bank or other nominee will have discretion to vote your shares on our sole “routine” matter—the proposal to ratify the appointment of PricewaterhouseCoopers LLP as our independent registered public accounting firm. Your broker, bank or other nominee will not have discretion to vote on the other matters submitted for a vote absent direction from you as they are “non-routine” matters.
Is my vote confidential?Proxy instructions, electronic votes, and voting tabulations that identify individual stockholders are handled in a manner that protects your voting privacy. Your vote will not be disclosed either within Splunk or to third parties, except as necessary to meet applicable legal requirements, to allow for the tabulation of votes and certification of the vote, to facilitate a successful proxy solicitation, or when you request or consent to disclosure.
Where can I find the voting results of the Annual Meeting?We will disclose voting results on a Current Report on Form 8-K to be filed with the SEC within four business days after the Annual Meeting. If final voting results are not available to us in time to include them in such Current Report on Form 8-K, we will file a Current Report on Form 8-K to publish preliminary results and will provide the final results in an amendment to the Current Report on Form 8-K as soon as final results become available.
Other MattersOther Matters

PR
OX
Y
77Splunk 2021 Proxy Statement
If you are a street name stockholder, you may change your vote by:
• submitting new voting instructions to your broker, bank or other nominee pursuant to instructions provided by such broker, bank or other nominee; or
• submitting a later-dated vote electronically at the Annual Meeting; provided you have obtained a legal proxy from your broker, bank or other nominee giving you the right to vote the shares.
If you are a street name stockholder, you must contact your broker, bank or other nominee that holds your shares to find out how to revoke your proxy.
What is the effect of giving a proxy?Proxies are solicited by and on behalf of our Board. The persons named in the proxy have been designated as proxy holders. When proxies are properly dated, executed and returned, the shares represented by such proxies will be voted electronically at the Annual Meeting in accordance with the instructions of the stockholder. If the proxy is properly dated, executed and returned, but no specific instructions are given, the shares will be voted in accordance with the recommendations of our Board as described above. If any matter not described in the proxy statement is properly presented at the Annual Meeting, the proxy holders will use their own judgment to determine how to vote your shares. If the Annual Meeting is adjourned, the proxy holders can vote your shares on the new meeting date as well, unless you have properly revoked your proxy, as described above.
Why did I receive a notice regarding the availability of proxy materials on the internet instead of a full set of proxy materials?In accordance with the rules of the SEC, we have elected to furnish our proxy materials, including this proxy statement and our annual report to our stockholders, primarily via the Internet. On or about May 4, 2021, we mailed to our stockholders the Notice that contains instructions on how to access our proxy materials on the Internet, how to vote at the Annual Meeting, and how to request printed copies of the proxy materials and annual report. Stockholders may request to receive all future proxy materials in printed form by mail or electronically by e-mail by following the instructions contained in the Notice. We encourage stockholders to take advantage of the availability of the proxy materials on the Internet to help reduce the environmental impact of our annual meetings and keep our Annual Meeting process efficient.
What is a quorum?A quorum is the minimum number of shares required to be present at the scheduled time of the Annual Meeting in person (virtually) or by proxy for the meeting to be properly held under our Bylaws and Delaware law. The presence in person (virtually) or by proxy, of a majority of all issued and outstanding shares of common stock entitled to vote at the Annual Meeting will constitute a quorum at the Annual Meeting. A proxy submitted by a stockholder may indicate that all or a portion of the shares represented by the proxy are not being voted (“stockholder withholding”) with respect to a particular matter. Similarly, a broker may not be permitted to vote stock (“broker non-vote”) held in street name on a particular matter in the absence of instructions from the beneficial owner of the stock. See “How may my broker, bank or other nominee vote my shares if I fail to provide timely directions?” below. The shares subject to a proxy that are not being voted on a particular matter because of either stockholder withholding or broker non-vote will count for purposes of determining the presence of a quorum. Abstentions are also counted in the determination of a quorum.
How many votes are needed for approval of each matter?• Proposal 1: Each director nominee will be elected by a vote of the majority of the votes cast. A majority of the votes cast
means the number of votes cast “For” such nominee’s election exceeds the number of votes cast “Against” that nominee. You may vote “For,” “Against,” or “Abstain” with respect to each director nominee. Broker non-votes and abstentions, if any, will have no effect on the outcome of the election.
• Proposal 2: The ratification of the appointment of PricewaterhouseCoopers LLP must receive the affirmative vote of at least a majority of the shares present in person (virtually) or by proxy at the meeting and entitled to vote thereon to be approved. You may vote “For,” “Against,” or “Abstain” with respect to this proposal. Abstentions are considered votes cast and thus will have the same effect as a vote “Against” the proposal. Broker non-votes, if any, will have no effect on the outcome of this proposal.
• Proposal 3: The advisory vote to approve the compensation of our named executive officers must receive the affirmative vote of at least a majority of the shares present in person (virtually) or by proxy at the meeting and entitled to vote thereon to be approved. You may vote “For,” “Against,” or “Abstain” with respect to this proposal. Abstentions are considered votes cast and thus will have the same effect as votes “Against” the proposal. Broker non-votes, if any, will have no effect on the outcome of the vote. Because this vote is advisory only, it will not be binding on us, our Compensation Committee or our Board. However, we value our stockholders’ input and will take the vote into consideration when evaluating executive compensation decisions.
What happens if a director nominee who is duly nominated does not receive a majority vote?The Board nominates for election or re-election as director only candidates who have tendered, in advance of such nomination, an irrevocable, conditional resignation that will be effective only upon both (i) the failure to receive the required vote at the next annual meeting of stockholders at which they face re-election and (ii) the Board’s acceptance of such resignation. In an uncontested election, the Board, after taking into consideration the recommendation of the Nominating and Corporate Governance Committee, will determine whether or not to accept the pre-tendered resignation of any nominee for director who receives a greater number of votes “Against” such nominee’s election than votes “For” such nominee’s election. In the event of a contested election, the director nominees equal to the number of seats available who receive the largest number of votes cast “For” their election will be elected as directors.
How are proxies solicited for the Annual Meeting?The Board is soliciting proxies for use at the Annual Meeting. All expenses associated with this solicitation will be borne by us. We will reimburse brokers, banks or other nominees for reasonable expenses that they incur in sending these proxy materials to you, if a broker, bank or other nominee holds your shares.
How may my broker, bank or other nominee vote my shares if I fail to provide timely directions?Brokers, banks and other nominees holding shares in street name for their customers are generally required to vote such shares in the manner directed by their customers. In the absence of timely directions, your broker, bank or other nominee will have discretion to vote your shares on our sole “routine” matter—the proposal to ratify the appointment of PricewaterhouseCoopers LLP as our independent registered public accounting firm. Your broker, bank or other nominee will not have discretion to vote on the other matters submitted for a vote absent direction from you as they are “non-routine” matters.
Is my vote confidential?Proxy instructions, electronic votes, and voting tabulations that identify individual stockholders are handled in a manner that protects your voting privacy. Your vote will not be disclosed either within Splunk or to third parties, except as necessary to meet applicable legal requirements, to allow for the tabulation of votes and certification of the vote, to facilitate a successful proxy solicitation, or when you request or consent to disclosure.
Where can I find the voting results of the Annual Meeting?We will disclose voting results on a Current Report on Form 8-K to be filed with the SEC within four business days after the Annual Meeting. If final voting results are not available to us in time to include them in such Current Report on Form 8-K, we will file a Current Report on Form 8-K to publish preliminary results and will provide the final results in an amendment to the Current Report on Form 8-K as soon as final results become available.
Other MattersOther Matters

78 Splunk 2021 Proxy Statement
I share an address with another stockholder, and we received multiple copies of the proxy materials. How may we obtain a single copy of the proxy materials?Stockholders who share an address and receive multiple copies of our proxy materials can request to receive a single copy in the future. To receive a single copy of the Notice and, if applicable, the proxy materials, stockholders may contact us as follows:
Splunk Inc. Attention: Investor Relations 3098 Olsen Drive San Jose, California 95128 (415) 848-8400
Stockholders who hold shares in street name may contact their brokerage firm, bank, broker-dealer or other similar organization to request information about householding.
Stockholder ProposalsStockholders may present proper proposals for inclusion in our proxy statement and for consideration at the next annual meeting of stockholders by submitting their proposals in writing to our Corporate Secretary in a timely manner. For a stockholder proposal to be considered for inclusion in our proxy statement for our 2022 annual meeting of stockholders, our Corporate Secretary must receive the written proposal at our principal executive offices not later than January 4, 2022. In addition, stockholder proposals must comply with the requirements of Rule 14a-8 regarding the inclusion of stockholder proposals in company-sponsored proxy materials. Proposals should be addressed to:
Splunk Inc. Attention: Corporate Secretary 270 Brannan Street San Francisco, California 94107
Our Bylaws also establish an advance notice procedure for stockholders who wish to present a proposal before an annual meeting of stockholders but do not intend for the proposal to be included in our proxy statement. Our Bylaws provide that the only business that may be conducted at an annual meeting is business that is (i) specified in our proxy materials with respect to such meeting, (ii) otherwise properly brought before the meeting by or at the direction of our Board, or (iii) properly brought before the meeting by a stockholder of record entitled to vote at the annual meeting who has delivered timely written notice to our Corporate Secretary, which notice must contain the information specified in our Bylaws. To be timely for our 2022 annual meeting of stockholders, our Corporate Secretary must receive the written notice at our principal executive offices:
• not earlier than February 18, 2022; and
• not later than the close of business on March 20, 2022.
If a stockholder who has notified us of his or her intention to present a proposal at an annual meeting does not appear to present his or her proposal at such meeting, we are not required to present the proposal for a vote at such meeting.
Please see “Corporate Governance at Splunk—Board Composition—Stockholder Recommendations” and “—Stockholder Nominations” on page 19 for further information about recommendations and nominations of director candidates.
Availability of Bylaws and Stockholder ListA copy of our Bylaws may be obtained by accessing our filings on the SEC’s website at www.sec.gov or on our investor website at http://investors.splunk.com/corporate-governance. You may also contact our Corporate Secretary at our principal executive offices for a copy of the relevant Bylaw provisions regarding the requirements for making stockholder proposals and nominating director candidates.
The Company’s list of stockholders as of April 21, 2021 will be available for inspection by any stockholder of record upon request via our Investor Relations website (https://investors.splunk.com/contact-us) during the 10-day period immediately prior to the date of the Annual Meeting. In addition, the list of stockholders will also be available to stockholders during the Annual Meeting at www.virtualshareholdermeeting.com/SPLK2021.
Fiscal 2021 Annual Report and SEC FilingsOur financial statements for the fiscal year ended January 31, 2021 are included in our Annual Report on Form 10-K, which was filed with the SEC and which we will make available to stockholders at the same time as this proxy statement. Our annual report and this proxy statement are posted on our website at www.splunk.com and are available from the SEC at its website at www.sec. gov. You may also obtain a copy of our annual report without charge by sending a written request to Investor Relations, Splunk Inc., 3098 Olsen Drive, San Jose, California 95128.
* * *
The Board does not know of any other matters to be presented at the Annual Meeting. If any additional matters are properly presented at the Annual Meeting, the persons named in the enclosed proxy card will have discretion to vote shares they represent in accordance with their own judgment on such matters.
It is important that your shares be represented at the Annual Meeting, regardless of the number of shares that you hold. You are, therefore, urged to vote by telephone or by using the Internet as instructed on the enclosed proxy card or execute and return, at your earliest convenience, the enclosed proxy card in the envelope that has also been provided.
THE BOARD OF DIRECTORS San Francisco, California May 4, 2021
Other MattersOther Matters

PR
OX
Y
79Splunk 2021 Proxy Statement
I share an address with another stockholder, and we received multiple copies of the proxy materials. How may we obtain a single copy of the proxy materials?Stockholders who share an address and receive multiple copies of our proxy materials can request to receive a single copy in the future. To receive a single copy of the Notice and, if applicable, the proxy materials, stockholders may contact us as follows:
Splunk Inc. Attention: Investor Relations 3098 Olsen Drive San Jose, California 95128 (415) 848-8400
Stockholders who hold shares in street name may contact their brokerage firm, bank, broker-dealer or other similar organization to request information about householding.
Stockholder ProposalsStockholders may present proper proposals for inclusion in our proxy statement and for consideration at the next annual meeting of stockholders by submitting their proposals in writing to our Corporate Secretary in a timely manner. For a stockholder proposal to be considered for inclusion in our proxy statement for our 2022 annual meeting of stockholders, our Corporate Secretary must receive the written proposal at our principal executive offices not later than January 4, 2022. In addition, stockholder proposals must comply with the requirements of Rule 14a-8 regarding the inclusion of stockholder proposals in company-sponsored proxy materials. Proposals should be addressed to:
Splunk Inc. Attention: Corporate Secretary 270 Brannan Street San Francisco, California 94107
Our Bylaws also establish an advance notice procedure for stockholders who wish to present a proposal before an annual meeting of stockholders but do not intend for the proposal to be included in our proxy statement. Our Bylaws provide that the only business that may be conducted at an annual meeting is business that is (i) specified in our proxy materials with respect to such meeting, (ii) otherwise properly brought before the meeting by or at the direction of our Board, or (iii) properly brought before the meeting by a stockholder of record entitled to vote at the annual meeting who has delivered timely written notice to our Corporate Secretary, which notice must contain the information specified in our Bylaws. To be timely for our 2022 annual meeting of stockholders, our Corporate Secretary must receive the written notice at our principal executive offices:
• not earlier than February 18, 2022; and
• not later than the close of business on March 20, 2022.
If a stockholder who has notified us of his or her intention to present a proposal at an annual meeting does not appear to present his or her proposal at such meeting, we are not required to present the proposal for a vote at such meeting.
Please see “Corporate Governance at Splunk—Board Composition—Stockholder Recommendations” and “—Stockholder Nominations” on page 19 for further information about recommendations and nominations of director candidates.
Availability of Bylaws and Stockholder ListA copy of our Bylaws may be obtained by accessing our filings on the SEC’s website at www.sec.gov or on our investor website at http://investors.splunk.com/corporate-governance. You may also contact our Corporate Secretary at our principal executive offices for a copy of the relevant Bylaw provisions regarding the requirements for making stockholder proposals and nominating director candidates.
The Company’s list of stockholders as of April 21, 2021 will be available for inspection by any stockholder of record upon request via our Investor Relations website (https://investors.splunk.com/contact-us) during the 10-day period immediately prior to the date of the Annual Meeting. In addition, the list of stockholders will also be available to stockholders during the Annual Meeting at www.virtualshareholdermeeting.com/SPLK2021.
Fiscal 2021 Annual Report and SEC FilingsOur financial statements for the fiscal year ended January 31, 2021 are included in our Annual Report on Form 10-K, which was filed with the SEC and which we will make available to stockholders at the same time as this proxy statement. Our annual report and this proxy statement are posted on our website at www.splunk.com and are available from the SEC at its website at www.sec. gov. You may also obtain a copy of our annual report without charge by sending a written request to Investor Relations, Splunk Inc., 3098 Olsen Drive, San Jose, California 95128.
* * *
The Board does not know of any other matters to be presented at the Annual Meeting. If any additional matters are properly presented at the Annual Meeting, the persons named in the enclosed proxy card will have discretion to vote shares they represent in accordance with their own judgment on such matters.
It is important that your shares be represented at the Annual Meeting, regardless of the number of shares that you hold. You are, therefore, urged to vote by telephone or by using the Internet as instructed on the enclosed proxy card or execute and return, at your earliest convenience, the enclosed proxy card in the envelope that has also been provided.
THE BOARD OF DIRECTORS San Francisco, California May 4, 2021
Other MattersOther Matters

UNITED STATESSECURITIES AND EXCHANGE COMMISSION
WASHINGTON, D. C. 20549
FORM 10-K
☒ANNUAL REPORT PURSUANT TO SECTION 13 OR 15(d) OF THE SECURITIES EXCHANGE ACT OF 1934
For the Fiscal Year Ended: January 31, 2021 OR
☐TRANSITION REPORT PURSUANT TO SECTION 13 OR 15(d) OF THE SECURITIES EXCHANGE ACT OF 1934
Commission File Number: 001-35498
Splunk Inc.
(Exact name of registrant as specified in its charter)
Delaware
86-1106510(State or other jurisdiction of
(I.R.S. Employerincorporation or organization)
Identification No.)
270 Brannan Street San Francisco, California 94107
(Address of principal executive offices)(Zip Code)
(415) 848-8400
(Registrant’s telephone number, including area code)
Securities Registered pursuant to Section 12(b) of the Act:
Title of each class Trading Symbol(s) Name of each exchange on which registeredCommon Stock, par value $0.001 per
shareSPLK The NASDAQ Global Select Market
Securities registered pursuant to Section 12(g) of the Act: None
Indicate by check mark if the Registrant is a well-known seasoned issuer, as defined in Rule 405 of the SecuritiesAct: Yes ☒ No ☐
Indicate by check mark if the Registrant is not required to file reports pursuant to Section 13 or Section 15(d) of the
Act: Yes ☐ No ☒
Indicate by check mark whether the Registrant (1) has filed all reports required to be filed by Section 13 or 15(d) of the Securities Exchange Act of 1934 during the preceding 12 months (or for such shorter period that the Registrant was required to file such reports), and (2) has been subject to such filing requirements for the past 90 days. Yes ☒ No ☐
Indicate by check mark whether the registrant has submitted electronically every Interactive Data File required to be submitted pursuant to Rule 405 of Regulation S-T during the preceding 12 months (or for such shorter period that the registrant was required to submit such files). Yes ☒ No ☐
Indicate by check mark whether the registrant is a large accelerated filer, an accelerated filer, a non-accelerated filer, a smaller reporting company, or an emerging growth company. See the definitions of “large accelerated filer,” “accelerated filer,” “smaller reporting company” and “emerging growth company” in Rule 12b-2 of the Exchange Act.
Large Accelerated Filer ☒ Accelerated Filer ☐
Non-Accelerated Filer ☐ Smaller Reporting Company ☐
Emerging Growth Company ☐
If an emerging growth company, indicate by check mark if the registrant has elected not to use the extended transition period for complying with any new or revised financial accounting standards provided pursuant to Section 13(a) of the Exchange Act. ☐
Indicate by check mark whether the registrant has filed a report on and attestation to its management’s assessment of the effectiveness of its internal control over financial reporting under Section 404(b) of the Sarbanes-Oxley Act (15 U.S.C. 7262(b)) by the registered public accounting firm that prepared or issued its audit report. ☒
Indicate by check mark whether the registrant is a shell company (as defined in Rule 12b-2 of the Exchange Act). Yes ☐ No ☒
The aggregate market value of shares of common stock held by non-affiliates of the registrant was $23,135,517,574, based on the number of shares held by non-affiliates and the last reported sale price of the registrant’s common stock on July 31, 2020 (the last business day of the registrant’s most recently completed second fiscal quarter).
The number of shares outstanding of the Registrant’s Common Stock as of March 19, 2021 was 163,839,113 shares.
Documents Incorporated by Reference
Portions of the registrant’s definitive Proxy Statement for the 2021 Annual Stockholders’ Meeting are incorporated by reference into Part III of this Annual Report on Form 10-K.

FOR
M 1
0-K
UNITED STATESSECURITIES AND EXCHANGE COMMISSION
WASHINGTON, D. C. 20549
FORM 10-K
☒ANNUAL REPORT PURSUANT TO SECTION 13 OR 15(d) OF THE SECURITIES EXCHANGE ACT OF 1934
For the Fiscal Year Ended: January 31, 2021 OR
☐TRANSITION REPORT PURSUANT TO SECTION 13 OR 15(d) OF THE SECURITIES EXCHANGE ACT OF 1934
Commission File Number: 001-35498
Splunk Inc.
(Exact name of registrant as specified in its charter)
Delaware
86-1106510(State or other jurisdiction of
(I.R.S. Employerincorporation or organization)
Identification No.)
270 Brannan Street San Francisco, California 94107
(Address of principal executive offices)(Zip Code)
(415) 848-8400
(Registrant’s telephone number, including area code)
Securities Registered pursuant to Section 12(b) of the Act:
Title of each class Trading Symbol(s) Name of each exchange on which registeredCommon Stock, par value $0.001 per
shareSPLK The NASDAQ Global Select Market
Securities registered pursuant to Section 12(g) of the Act: None
Indicate by check mark if the Registrant is a well-known seasoned issuer, as defined in Rule 405 of the SecuritiesAct: Yes ☒ No ☐
Indicate by check mark if the Registrant is not required to file reports pursuant to Section 13 or Section 15(d) of the
Act: Yes ☐ No ☒
Indicate by check mark whether the Registrant (1) has filed all reports required to be filed by Section 13 or 15(d) of the Securities Exchange Act of 1934 during the preceding 12 months (or for such shorter period that the Registrant was required to file such reports), and (2) has been subject to such filing requirements for the past 90 days. Yes ☒ No ☐
Indicate by check mark whether the registrant has submitted electronically every Interactive Data File required to be submitted pursuant to Rule 405 of Regulation S-T during the preceding 12 months (or for such shorter period that the registrant was required to submit such files). Yes ☒ No ☐
Indicate by check mark whether the registrant is a large accelerated filer, an accelerated filer, a non-accelerated filer, a smaller reporting company, or an emerging growth company. See the definitions of “large accelerated filer,” “accelerated filer,” “smaller reporting company” and “emerging growth company” in Rule 12b-2 of the Exchange Act.
Large Accelerated Filer ☒ Accelerated Filer ☐
Non-Accelerated Filer ☐ Smaller Reporting Company ☐
Emerging Growth Company ☐
If an emerging growth company, indicate by check mark if the registrant has elected not to use the extended transition period for complying with any new or revised financial accounting standards provided pursuant to Section 13(a) of the Exchange Act. ☐
Indicate by check mark whether the registrant has filed a report on and attestation to its management’s assessment of the effectiveness of its internal control over financial reporting under Section 404(b) of the Sarbanes-Oxley Act (15 U.S.C. 7262(b)) by the registered public accounting firm that prepared or issued its audit report. ☒
Indicate by check mark whether the registrant is a shell company (as defined in Rule 12b-2 of the Exchange Act). Yes ☐ No ☒
The aggregate market value of shares of common stock held by non-affiliates of the registrant was $23,135,517,574, based on the number of shares held by non-affiliates and the last reported sale price of the registrant’s common stock on July 31, 2020 (the last business day of the registrant’s most recently completed second fiscal quarter).
The number of shares outstanding of the Registrant’s Common Stock as of March 19, 2021 was 163,839,113 shares.
Documents Incorporated by Reference
Portions of the registrant’s definitive Proxy Statement for the 2021 Annual Stockholders’ Meeting are incorporated by reference into Part III of this Annual Report on Form 10-K.

Splunk Inc.
Table of Contents Page No. PART I 3 Item 1. Business 4Item 1A. Risk Factors 13Item 1B. Unresolved Staff Comments 42Item 2. Properties 43Item 3. Legal Proceedings 43Item 4. Mine and Safety Disclosures 43 PART II 44
Item 5. Market for Registrant’s Common Equity, Related Stockholder Matters and Issuer Purchases of Equity Securities 44
Item 6. Selected Financial Data 44Item 7. Management’s Discussion and Analysis of Financial Condition and Results of Operations 45Item 7A. Quantitative and Qualitative Disclosures About Market Risk 65Item 8. Financial Statements and Supplementary Data 67Item 9. Changes in and Disagreements with Accountants on Accounting and Financial Disclosure 107Item 9A. Controls and Procedures 107Item 9B. Other Information 108
PART III 109 Item 10. Directors, Executive Officers and Corporate Governance 109Item 11. Executive Compensation 109Item 12. Security Ownership of Certain Beneficial Owners and Management and Related Stockholder
Matters 109Item 13. Certain Relationships and Related Transactions, and Director Independence 109Item 14. Principal Accountant Fees and Services 109
PART IV 110
Item 15. Exhibits and Financial Statement Schedules 110Item 16. Form 10-K Summary 110
Signatures 115
2
PART I
NOTE REGARDING FORWARD-LOOKING STATEMENTS
This Annual Report on Form 10-K, including but not limited to the sections entitled “Business,” “Risk Factors,” and “Management’s Discussion and Analysis of Financial Condition and Results of Operations,” contains forward-looking statements that involve risks and uncertainties, as well as assumptions that, if they never materialize or prove incorrect, could cause our results to differ materially from those expressed or implied by such forward-looking statements. Statements that are not purely historical are forward-looking statements within the meaning of Section 27A of the Securities Act of 1933, as amended, and Section 21E of the Securities Exchange Act of 1934, as amended (the “Exchange Act”). Forward-looking statements are often identified by the use of words such as, but not limited to, “anticipate,” “believe,” “can,” “continue,” “could,” “estimate,” “expect,” “predict,” “intend,” “may,” “might,” “plan,” “project,” “potential,” “seek,” “should,” “target,” “will,” “would” and similar expressions or variations intended to identify forward-looking statements. These forward-looking statements include, but are not limited to, statements concerning the following:
• our future financial and operating results; including trends in and expectations regarding revenues, annual recurring revenue, deferred revenue, remaining performance obligations, gross margins, operating income and the proportion of transactions that will be recognized ratably;
• market opportunity; • expected benefits to customers and potential customers of our offerings and our user-driven ecosystem;• investment strategy, business strategy and growth strategy, including our business model transition and the use of
acquisitions to expand our business;• our sales and marketing strategy, including our international sales and channel partner strategy; • customer product adoption and purchasing patterns, including renewal, expansion and conversion from on-
premises to cloud services• management’s plans, beliefs and objectives for future operations; • our ability to provide compelling, uninterrupted and secure cloud services to our customers; • expectations about competition;• economic and industry trends or trend analysis; • expectations about the benefits of acquisitions;• expectations about seasonality; • revenue mix; • expected impact of changes in accounting rules or standards;• use of non-GAAP financial measures;• operating expenses, including changes in research and development, sales and marketing, facilities and general
and administrative expenses; • sufficiency of cash to meet cash needs for at least the next 12 months; • exposure to interest rate changes; • inflation; • anticipated income tax rates, tax estimates and tax standards; • capital expenditures, cash flows and liquidity; and• the impact of natural disasters and actual or threatened public health emergencies, such as COVID-19.
These statements represent the beliefs and assumptions of our management based on information currently available to us. Such forward-looking statements are subject to risks, uncertainties and other important factors that could cause actual results and the timing of certain events to differ materially from future results expressed or implied by such forward-looking statements. Factors that could cause or contribute to such differences include, but are not limited to, those identified below, and those discussed in the section titled “Risk Factors” included under Part I, Item 1A. Furthermore, such forward-looking statements speak only as of the date of this report. Except as required by law, we undertake no obligation to update any forward-looking statements to reflect events or circumstances that occur after the date of this report.
3

FOR
M 1
0-K
Splunk Inc.
Table of Contents Page No. PART I 3 Item 1. Business 4Item 1A. Risk Factors 13Item 1B. Unresolved Staff Comments 42Item 2. Properties 43Item 3. Legal Proceedings 43Item 4. Mine and Safety Disclosures 43 PART II 44
Item 5. Market for Registrant’s Common Equity, Related Stockholder Matters and Issuer Purchases of Equity Securities 44
Item 6. Selected Financial Data 44Item 7. Management’s Discussion and Analysis of Financial Condition and Results of Operations 45Item 7A. Quantitative and Qualitative Disclosures About Market Risk 65Item 8. Financial Statements and Supplementary Data 67Item 9. Changes in and Disagreements with Accountants on Accounting and Financial Disclosure 107Item 9A. Controls and Procedures 107Item 9B. Other Information 108
PART III 109 Item 10. Directors, Executive Officers and Corporate Governance 109Item 11. Executive Compensation 109Item 12. Security Ownership of Certain Beneficial Owners and Management and Related Stockholder
Matters 109Item 13. Certain Relationships and Related Transactions, and Director Independence 109Item 14. Principal Accountant Fees and Services 109
PART IV 110
Item 15. Exhibits and Financial Statement Schedules 110Item 16. Form 10-K Summary 110
Signatures 115
2
PART I
NOTE REGARDING FORWARD-LOOKING STATEMENTS
This Annual Report on Form 10-K, including but not limited to the sections entitled “Business,” “Risk Factors,” and “Management’s Discussion and Analysis of Financial Condition and Results of Operations,” contains forward-looking statements that involve risks and uncertainties, as well as assumptions that, if they never materialize or prove incorrect, could cause our results to differ materially from those expressed or implied by such forward-looking statements. Statements that are not purely historical are forward-looking statements within the meaning of Section 27A of the Securities Act of 1933, as amended, and Section 21E of the Securities Exchange Act of 1934, as amended (the “Exchange Act”). Forward-looking statements are often identified by the use of words such as, but not limited to, “anticipate,” “believe,” “can,” “continue,” “could,” “estimate,” “expect,” “predict,” “intend,” “may,” “might,” “plan,” “project,” “potential,” “seek,” “should,” “target,” “will,” “would” and similar expressions or variations intended to identify forward-looking statements. These forward-looking statements include, but are not limited to, statements concerning the following:
• our future financial and operating results; including trends in and expectations regarding revenues, annual recurring revenue, deferred revenue, remaining performance obligations, gross margins, operating income and the proportion of transactions that will be recognized ratably;
• market opportunity; • expected benefits to customers and potential customers of our offerings and our user-driven ecosystem;• investment strategy, business strategy and growth strategy, including our business model transition and the use of
acquisitions to expand our business;• our sales and marketing strategy, including our international sales and channel partner strategy; • customer product adoption and purchasing patterns, including renewal, expansion and conversion from on-
premises to cloud services• management’s plans, beliefs and objectives for future operations; • our ability to provide compelling, uninterrupted and secure cloud services to our customers; • expectations about competition;• economic and industry trends or trend analysis; • expectations about the benefits of acquisitions;• expectations about seasonality; • revenue mix; • expected impact of changes in accounting rules or standards;• use of non-GAAP financial measures;• operating expenses, including changes in research and development, sales and marketing, facilities and general
and administrative expenses; • sufficiency of cash to meet cash needs for at least the next 12 months; • exposure to interest rate changes; • inflation; • anticipated income tax rates, tax estimates and tax standards; • capital expenditures, cash flows and liquidity; and• the impact of natural disasters and actual or threatened public health emergencies, such as COVID-19.
These statements represent the beliefs and assumptions of our management based on information currently available to us. Such forward-looking statements are subject to risks, uncertainties and other important factors that could cause actual results and the timing of certain events to differ materially from future results expressed or implied by such forward-looking statements. Factors that could cause or contribute to such differences include, but are not limited to, those identified below, and those discussed in the section titled “Risk Factors” included under Part I, Item 1A. Furthermore, such forward-looking statements speak only as of the date of this report. Except as required by law, we undertake no obligation to update any forward-looking statements to reflect events or circumstances that occur after the date of this report.
3

Item 1. BusinessOverview
Splunk provides innovative cloud and software offerings that deliver and operationalize insights from data generated by digital systems. This data is growing significantly as a direct result of the prevalence and importance of digital systems used by today’s organizations. Decades of investment in digital transformation have integrated the hardware and software that comprise digital systems into every aspect of how modern organizations operate. The data generated by these systems contains a comprehensive, real-time record of operations, interactions, and transactions that our offerings convert into insights that improve technology and business outcomes. Our solutions for Security, Information Technology (“IT”) Operations, and Observability empower users in technology roles, including application development, IT operations, and cyber security, to monitor and secure digital systems more quickly and efficiently. Business users leverage our offerings to gain visibility to their digital processes in order to deliver better experiences, improve decisions and drive better results in areas including supply chain, inbound and outbound logistics, manufacturing, sales, and service.
Our offerings provide visibility to our customers’ diverse technology infrastructure including systems deployed on the edge, on premises, and in private and public cloud environments, running software ranging from embedded through monolithic apps to cloud native ones. We also believe our offerings empower operational transformation, helping customers move from reactive, non-scalable and ineffective approaches to proactive, automated, and AI-assisted processes that drive better outcomes even as the scale and complexity of their infrastructures continue to grow.
The events of 2020 significantly increased the importance of being a digital, data-driven enterprise. The COVID-19 pandemic is exerting an enormous amount of pressure on organizations of all kinds to support new ways of working, to deliver better experiences and outcomes, and to enable entirely new offerings and business models. We believe that Splunk enables organizations to rise to these challenges by leveraging technology to achieve greater efficiency, agility, security, and drive a sustained competitive advantage.
Splunk Product Offerings
Portfolio Overview
Our portfolio comprises three categories of offerings:
The Splunk Platform A broad set of configurable and extensible capabilities that can acquire and manage data and deliver insights from virtually any technology source.
Splunk Solutions Application offerings that leverage the Splunk Platform to provide deep, pre-built capabilities for Security, IT Operations, and Observability.
Ecosystem Solutions Content built by our field organization, partners, and customers that configures and extends the Splunk Platform and Splunk Solutions, accelerating customer time-to-value for a broad range of use cases.
We believe that the Splunk portfolio offers a unique breadth and depth of capabilities, including:
• Industry analyst-recognized market leadership in our Security, IT Operations, and Observability solutions, which can deliver best-in-class outcomes for customers.
• Creating greater cost efficiencies and better outcomes for customers by reducing data duplication, scaling investments across multiple functions and use cases, and enabling greater collaboration, common visibility, and tighter alignment across functions.
• The scalability, flexibility, and power of the Splunk Platform enables complete solutions for very large and complex technology infrastructures, and is proven across thousands of customers capable of ingesting and analyzing up to petabytes of data per day
4
• The combination of real-time stream transformation and analytical processing with near-real time and batch-oriented processing of large, complex data sets collected over long time periods. Together these capabilities provide support for a broad range of use cases spanning end-to-end operational processes, from historical analytics, forensic investigation, and machine learning model development to real-time monitoring, analytics, and machine model execution.
• The increasing use of machine learning across the portfolio to drive more sophisticated and valuable insights at ever growing scale. We apply our deep expertise in the Security, IT, and Observability domains to out-of-the-box machine learning analytics in Splunk Solutions to deliver more accurate and actionable insights, proactive monitoring, and prescriptive and automated responses. The Splunk Platform provides pre-built machine learning algorithms and model development capabilities and supports integration with external data science platforms, expanding the use of machine learning to complex, custom use cases.
The Splunk portfolio of offerings is delivered as a mix of cloud service offerings and licensed software (“software offerings”) that customers deploy on their premises or in their own cloud environments. We believe that the unique capabilities, rapid delivery, and streamlined adoption that cloud services enable make them the best delivery model for us and the majority of our customers. Accordingly, we will deliver a growing number of our offerings exclusively as cloud services to take full advantage of cloud capabilities like elastic scalability while maximizing the rate at which new features are adopted and validated. Where there is a need to deliver solutions as software offerings, we generally follow a cloud-first model, under which the most complete feature sets and frequent releases are provided in cloud services offerings, while subsets of cloud-validated features are released on a more measured cadence in software offerings.
The Splunk Platform
The Splunk portfolio of offerings is anchored by the Splunk Platform, a real-time data platform comprising collection, streaming, indexing, search, reporting, analysis, machine learning, alerting, monitoring and data management capabilities. Different combinations of the Splunk Platform capabilities are offered as services in Splunk Cloud, and in our Splunk Enterprise and Data Stream Processor software offerings. Key Splunk Platform capabilities include:
• Expansive data collection and instrumentation, including application programming interfaces (“APIs”), endpoints, and agents that can acquire data from an extensive set of hardware and software sources. Additionally, Splunk is a leading contributor to OpenTelemetry, a broadly-used open source project hosted by the Cloud Native Computing Foundation.
• Processing and analysis of very large volumes of data, both in real-time while in motion and at rest, in our proprietary, high-scale indexes and external data stores.
• A comprehensive, domain-specific language called the Search Processing Language (“SPL”), which provides a broad set of commands for preparing, exploring, monitoring, analyzing, and visualizing complex, time series-based data.
• Extensive machine learning capabilities, including out-of-the-box algorithms optimized for common data types and use cases and interfaces that allow data scientists to develop and deploy customized algorithms and models against our customers’ data.
• A wide range of interfaces for administrators, data engineers, analysts, and end users that includes tools providing a point-and-click experience for data preparation and investigation, highly-configurable dashboards, and a family of solutions purpose-built for mobile devices, smart watches, and Apple TV and Chromecast display devices.
• APIs and software development kits (“SDKs”) in major programming languages such as Java, JavaScript, C# and Python that enable the Splunk ecosystem, including Splunk customers and partners, to build applications and integrations that focus the power of the Splunk Platform on specific use cases.
Splunk Solutions
In addition to enabling a wide range of use cases, the Splunk Platform is also the foundation of the application offerings for Security, IT, and Observability.
5

FOR
M 1
0-K
Item 1. BusinessOverview
Splunk provides innovative cloud and software offerings that deliver and operationalize insights from data generated by digital systems. This data is growing significantly as a direct result of the prevalence and importance of digital systems used by today’s organizations. Decades of investment in digital transformation have integrated the hardware and software that comprise digital systems into every aspect of how modern organizations operate. The data generated by these systems contains a comprehensive, real-time record of operations, interactions, and transactions that our offerings convert into insights that improve technology and business outcomes. Our solutions for Security, Information Technology (“IT”) Operations, and Observability empower users in technology roles, including application development, IT operations, and cyber security, to monitor and secure digital systems more quickly and efficiently. Business users leverage our offerings to gain visibility to their digital processes in order to deliver better experiences, improve decisions and drive better results in areas including supply chain, inbound and outbound logistics, manufacturing, sales, and service.
Our offerings provide visibility to our customers’ diverse technology infrastructure including systems deployed on the edge, on premises, and in private and public cloud environments, running software ranging from embedded through monolithic apps to cloud native ones. We also believe our offerings empower operational transformation, helping customers move from reactive, non-scalable and ineffective approaches to proactive, automated, and AI-assisted processes that drive better outcomes even as the scale and complexity of their infrastructures continue to grow.
The events of 2020 significantly increased the importance of being a digital, data-driven enterprise. The COVID-19 pandemic is exerting an enormous amount of pressure on organizations of all kinds to support new ways of working, to deliver better experiences and outcomes, and to enable entirely new offerings and business models. We believe that Splunk enables organizations to rise to these challenges by leveraging technology to achieve greater efficiency, agility, security, and drive a sustained competitive advantage.
Splunk Product Offerings
Portfolio Overview
Our portfolio comprises three categories of offerings:
The Splunk Platform A broad set of configurable and extensible capabilities that can acquire and manage data and deliver insights from virtually any technology source.
Splunk Solutions Application offerings that leverage the Splunk Platform to provide deep, pre-built capabilities for Security, IT Operations, and Observability.
Ecosystem Solutions Content built by our field organization, partners, and customers that configures and extends the Splunk Platform and Splunk Solutions, accelerating customer time-to-value for a broad range of use cases.
We believe that the Splunk portfolio offers a unique breadth and depth of capabilities, including:
• Industry analyst-recognized market leadership in our Security, IT Operations, and Observability solutions, which can deliver best-in-class outcomes for customers.
• Creating greater cost efficiencies and better outcomes for customers by reducing data duplication, scaling investments across multiple functions and use cases, and enabling greater collaboration, common visibility, and tighter alignment across functions.
• The scalability, flexibility, and power of the Splunk Platform enables complete solutions for very large and complex technology infrastructures, and is proven across thousands of customers capable of ingesting and analyzing up to petabytes of data per day
4
• The combination of real-time stream transformation and analytical processing with near-real time and batch-oriented processing of large, complex data sets collected over long time periods. Together these capabilities provide support for a broad range of use cases spanning end-to-end operational processes, from historical analytics, forensic investigation, and machine learning model development to real-time monitoring, analytics, and machine model execution.
• The increasing use of machine learning across the portfolio to drive more sophisticated and valuable insights at ever growing scale. We apply our deep expertise in the Security, IT, and Observability domains to out-of-the-box machine learning analytics in Splunk Solutions to deliver more accurate and actionable insights, proactive monitoring, and prescriptive and automated responses. The Splunk Platform provides pre-built machine learning algorithms and model development capabilities and supports integration with external data science platforms, expanding the use of machine learning to complex, custom use cases.
The Splunk portfolio of offerings is delivered as a mix of cloud service offerings and licensed software (“software offerings”) that customers deploy on their premises or in their own cloud environments. We believe that the unique capabilities, rapid delivery, and streamlined adoption that cloud services enable make them the best delivery model for us and the majority of our customers. Accordingly, we will deliver a growing number of our offerings exclusively as cloud services to take full advantage of cloud capabilities like elastic scalability while maximizing the rate at which new features are adopted and validated. Where there is a need to deliver solutions as software offerings, we generally follow a cloud-first model, under which the most complete feature sets and frequent releases are provided in cloud services offerings, while subsets of cloud-validated features are released on a more measured cadence in software offerings.
The Splunk Platform
The Splunk portfolio of offerings is anchored by the Splunk Platform, a real-time data platform comprising collection, streaming, indexing, search, reporting, analysis, machine learning, alerting, monitoring and data management capabilities. Different combinations of the Splunk Platform capabilities are offered as services in Splunk Cloud, and in our Splunk Enterprise and Data Stream Processor software offerings. Key Splunk Platform capabilities include:
• Expansive data collection and instrumentation, including application programming interfaces (“APIs”), endpoints, and agents that can acquire data from an extensive set of hardware and software sources. Additionally, Splunk is a leading contributor to OpenTelemetry, a broadly-used open source project hosted by the Cloud Native Computing Foundation.
• Processing and analysis of very large volumes of data, both in real-time while in motion and at rest, in our proprietary, high-scale indexes and external data stores.
• A comprehensive, domain-specific language called the Search Processing Language (“SPL”), which provides a broad set of commands for preparing, exploring, monitoring, analyzing, and visualizing complex, time series-based data.
• Extensive machine learning capabilities, including out-of-the-box algorithms optimized for common data types and use cases and interfaces that allow data scientists to develop and deploy customized algorithms and models against our customers’ data.
• A wide range of interfaces for administrators, data engineers, analysts, and end users that includes tools providing a point-and-click experience for data preparation and investigation, highly-configurable dashboards, and a family of solutions purpose-built for mobile devices, smart watches, and Apple TV and Chromecast display devices.
• APIs and software development kits (“SDKs”) in major programming languages such as Java, JavaScript, C# and Python that enable the Splunk ecosystem, including Splunk customers and partners, to build applications and integrations that focus the power of the Splunk Platform on specific use cases.
Splunk Solutions
In addition to enabling a wide range of use cases, the Splunk Platform is also the foundation of the application offerings for Security, IT, and Observability.
5

Splunk Security Solutions
Splunk Security solutions help cybersecurity teams streamline the security operations workflow, accelerate threat detection and response, enhance threat visibility, and scale resources to increase analyst productivity through machine learning and runbook-driven automation. Built on the Splunk Platform, Splunk Security offerings include Splunk Enterprise Security, Splunk User Behavior Analytics and Splunk Phantom, and are available as a mix of cloud services and software offerings. Customers use the Splunk Security offerings to address a range of use cases including:
Investigation and Forensics Empower security teams to analyze and confirm high priority incidents to determine the circumstances and scope of an incident while appropriately handling incident investigation and response.
Security information and event management and Security Analytics Enable security teams to gain full visibility into their data and make analytics-driven security decisions using pre-built frameworks, workflows and dashboards. Specific use cases include real-time security monitoring, advanced threat detection, and incident investigation for efficient threat management.
Automation and Orchestration Provide security operations centers advanced orchestration, automation and response capabilities by integrating teams, processes and tools. Splunk Mission Control empowers security teams to detect, manage, investigate, hunt, contain and remediate threats from a unified security operations platform.
Splunk IT Solutions
Splunk IT solutions provide IT Operations teams visibility and control across cloud and on-premises environments. With improved visibility, IT Operations teams can predict and find outages, improve decision-making and take a service oriented approach to managing IT infrastructure and applications. Splunk IT offerings, which are built on the Splunk Platform and are available as a mix of cloud and software offerings, include Splunk IT Service Intelligence, Splunk On-Call and Splunk Infrastructure Monitoring. Customers use Splunk IT solutions to address a range of use cases including:
IT Investigation and Monitoring Monitor uptime, performance and response time with a unified view of their entire IT environment. Splunk offerings enable IT Operations teams to obtain insight across their data centers and cloud services so that they can accelerate outage investigations and reduce mean time to resolution by quickly identifying and resolving problems.
Event Analytics and Management Proactively resolve service issues by using Splunk machine learning capabilities to cluster, filter, and significantly reduce event noise. This results in less time sifting through false positives and the ability to prioritize alerts in terms of impact.
Service Monitoring and Insights Understand how multiple tiers of the service stack interact with each other and impact service degradation. Using machine learning, IT Operations teams can help prevent future outages based on predictive service health scores. IT Operations teams gain visibility across silos to understand high level business service health and performance, while also diving deep into investigations to find the root cause of an incident faster.
Incident Response and Automation Improve the experience of developers and IT Operations through incident response and automation focused on escalating outage and performance incidents to the right people and teams so they can triage and resolve problems most quickly.
AIOps Use big data analytics, machine learning and artificial intelligence to deliver increased accuracy and speed to IT Operations. The Splunk AIOps solution analyzes massive datasets from disparate sources and employs advanced analytics to automate common IT operations and improve data analysis.
Splunk Observability Solutions
The Splunk Observability solutions, offered only as cloud services, focus on application developers, DevOps engineers, site reliability engineers, and cloud operations teams that are responsible for building and maintaining modern infrastructure and applications. These teams are responsible for maintaining application uptime and performance, reducing time to recover from outages, gaining visibility into their constantly changing infrastructure and applications, and ensuring positive user experiences. Splunk Observability offerings include Splunk Infrastructure Monitoring, Splunk Application Performance
6
Monitoring (“APM”), Splunk Synthetic Monitoring and Splunk On-Call. These offerings can be consumed independently or as an integrated offering that provides full-stack visibility and complete service insights.
Customers use the Splunk Observability solutions to address a range of use cases including:
Cloud Infrastructure Monitoring Monitors cloud infrastructure and networks by streaming performance metrics to detect patterns, sending availability and performance alerts and analyzing performance trends. Splunk Infrastructure Monitoring offers infrastructure visibility across on-premises, hybrid-cloud, multi-cloud and cloud-native infrastructures, containers and orchestration systems such as Docker and Kubernetes and network performance using the eBPF (Extended Berkeley Packet Filter) technology.
APM Monitors applications, especially those based on microservices, to identify performance bottlenecks and outages caused by application issues. Splunk APM provides insights into how microservices and a wide range of application code, including Java, are performing.
Digital Experience Monitoring Monitors services by using both real user and synthetic transactions to analyze response time and issues that create bottlenecks in response time.
Log Investigation Helps identify the root cause of outages and issues by isolating log files that indicate a specific problem in a specific location.
Incident Response Incident response is focused on escalating outage and performance incidents to the right people and teams so they can triage and resolve problems quickly, while improving the experience of developers and DevOps teams.
Ecosystem Solutions
The Splunk Platform and Splunk Solutions, including Splunk On-Call, Splunk Infrastructure Monitoring, and Splunk Phantom, provide APIs, SDKs, and other interfaces that enable our ecosystem, including third-party developers, partners and customers, to build content that configures and extends Splunk solutions to accommodate specific use cases. This range of Ecosystem Solutions includes pre-built data inputs, workflows, searches, reports, alerts, custom dashboards, flexible UI components, custom data visualizations, and integration actions and methods.
Ecosystem Solutions content can be built for a customer or partner’s own internal use, or it can be made generally available for download, in free or premium offerings, from within the Splunk Platform, our Splunk Solutions, and via Splunkbase, an online community and marketplace for developers, partners, and customers to share apps and add-ons. Approximately 2,000 apps and add-ons are currently available on Splunkbase, most of which are built and maintained by third parties.
We do not receive any material revenues from the sale of apps or add-ons by third-party application providers. Many apps and add-ons posted to Splunkbase are provided at no additional cost to users. Partner apps and add-ons listed on Splunkbase that are not free are primarily licensed directly by the third party to the end user.
Customer Success
While customers can readily consume our cloud services and software offerings, our customer success team has developed scalable offerings that span the customer journey, with the explicit intent of providing the right outcome-focused adoption services that result in customer value. These offerings include adoption and implementation services, education services, and maintenance and customer support services that are appropriately tailored to scale to our customers’ size and maturity.
Adoption and Implementation Services
Our customer success planning includes proven on-boarding and adoption best practices on our offerings for all customers, using an outcome-focused approach. Our prescriptive adoption guidance and success planning are targeted to the specific use cases across Security, IT Operations and Observability, spanning a wide variety of industries. Guided by our
7

FOR
M 1
0-K
Splunk Security Solutions
Splunk Security solutions help cybersecurity teams streamline the security operations workflow, accelerate threat detection and response, enhance threat visibility, and scale resources to increase analyst productivity through machine learning and runbook-driven automation. Built on the Splunk Platform, Splunk Security offerings include Splunk Enterprise Security, Splunk User Behavior Analytics and Splunk Phantom, and are available as a mix of cloud services and software offerings. Customers use the Splunk Security offerings to address a range of use cases including:
Investigation and Forensics Empower security teams to analyze and confirm high priority incidents to determine the circumstances and scope of an incident while appropriately handling incident investigation and response.
Security information and event management and Security Analytics Enable security teams to gain full visibility into their data and make analytics-driven security decisions using pre-built frameworks, workflows and dashboards. Specific use cases include real-time security monitoring, advanced threat detection, and incident investigation for efficient threat management.
Automation and Orchestration Provide security operations centers advanced orchestration, automation and response capabilities by integrating teams, processes and tools. Splunk Mission Control empowers security teams to detect, manage, investigate, hunt, contain and remediate threats from a unified security operations platform.
Splunk IT Solutions
Splunk IT solutions provide IT Operations teams visibility and control across cloud and on-premises environments. With improved visibility, IT Operations teams can predict and find outages, improve decision-making and take a service oriented approach to managing IT infrastructure and applications. Splunk IT offerings, which are built on the Splunk Platform and are available as a mix of cloud and software offerings, include Splunk IT Service Intelligence, Splunk On-Call and Splunk Infrastructure Monitoring. Customers use Splunk IT solutions to address a range of use cases including:
IT Investigation and Monitoring Monitor uptime, performance and response time with a unified view of their entire IT environment. Splunk offerings enable IT Operations teams to obtain insight across their data centers and cloud services so that they can accelerate outage investigations and reduce mean time to resolution by quickly identifying and resolving problems.
Event Analytics and Management Proactively resolve service issues by using Splunk machine learning capabilities to cluster, filter, and significantly reduce event noise. This results in less time sifting through false positives and the ability to prioritize alerts in terms of impact.
Service Monitoring and Insights Understand how multiple tiers of the service stack interact with each other and impact service degradation. Using machine learning, IT Operations teams can help prevent future outages based on predictive service health scores. IT Operations teams gain visibility across silos to understand high level business service health and performance, while also diving deep into investigations to find the root cause of an incident faster.
Incident Response and Automation Improve the experience of developers and IT Operations through incident response and automation focused on escalating outage and performance incidents to the right people and teams so they can triage and resolve problems most quickly.
AIOps Use big data analytics, machine learning and artificial intelligence to deliver increased accuracy and speed to IT Operations. The Splunk AIOps solution analyzes massive datasets from disparate sources and employs advanced analytics to automate common IT operations and improve data analysis.
Splunk Observability Solutions
The Splunk Observability solutions, offered only as cloud services, focus on application developers, DevOps engineers, site reliability engineers, and cloud operations teams that are responsible for building and maintaining modern infrastructure and applications. These teams are responsible for maintaining application uptime and performance, reducing time to recover from outages, gaining visibility into their constantly changing infrastructure and applications, and ensuring positive user experiences. Splunk Observability offerings include Splunk Infrastructure Monitoring, Splunk Application Performance
6
Monitoring (“APM”), Splunk Synthetic Monitoring and Splunk On-Call. These offerings can be consumed independently or as an integrated offering that provides full-stack visibility and complete service insights.
Customers use the Splunk Observability solutions to address a range of use cases including:
Cloud Infrastructure Monitoring Monitors cloud infrastructure and networks by streaming performance metrics to detect patterns, sending availability and performance alerts and analyzing performance trends. Splunk Infrastructure Monitoring offers infrastructure visibility across on-premises, hybrid-cloud, multi-cloud and cloud-native infrastructures, containers and orchestration systems such as Docker and Kubernetes and network performance using the eBPF (Extended Berkeley Packet Filter) technology.
APM Monitors applications, especially those based on microservices, to identify performance bottlenecks and outages caused by application issues. Splunk APM provides insights into how microservices and a wide range of application code, including Java, are performing.
Digital Experience Monitoring Monitors services by using both real user and synthetic transactions to analyze response time and issues that create bottlenecks in response time.
Log Investigation Helps identify the root cause of outages and issues by isolating log files that indicate a specific problem in a specific location.
Incident Response Incident response is focused on escalating outage and performance incidents to the right people and teams so they can triage and resolve problems quickly, while improving the experience of developers and DevOps teams.
Ecosystem Solutions
The Splunk Platform and Splunk Solutions, including Splunk On-Call, Splunk Infrastructure Monitoring, and Splunk Phantom, provide APIs, SDKs, and other interfaces that enable our ecosystem, including third-party developers, partners and customers, to build content that configures and extends Splunk solutions to accommodate specific use cases. This range of Ecosystem Solutions includes pre-built data inputs, workflows, searches, reports, alerts, custom dashboards, flexible UI components, custom data visualizations, and integration actions and methods.
Ecosystem Solutions content can be built for a customer or partner’s own internal use, or it can be made generally available for download, in free or premium offerings, from within the Splunk Platform, our Splunk Solutions, and via Splunkbase, an online community and marketplace for developers, partners, and customers to share apps and add-ons. Approximately 2,000 apps and add-ons are currently available on Splunkbase, most of which are built and maintained by third parties.
We do not receive any material revenues from the sale of apps or add-ons by third-party application providers. Many apps and add-ons posted to Splunkbase are provided at no additional cost to users. Partner apps and add-ons listed on Splunkbase that are not free are primarily licensed directly by the third party to the end user.
Customer Success
While customers can readily consume our cloud services and software offerings, our customer success team has developed scalable offerings that span the customer journey, with the explicit intent of providing the right outcome-focused adoption services that result in customer value. These offerings include adoption and implementation services, education services, and maintenance and customer support services that are appropriately tailored to scale to our customers’ size and maturity.
Adoption and Implementation Services
Our customer success planning includes proven on-boarding and adoption best practices on our offerings for all customers, using an outcome-focused approach. Our prescriptive adoption guidance and success planning are targeted to the specific use cases across Security, IT Operations and Observability, spanning a wide variety of industries. Guided by our
7

customer success managers and advocacy team, customers have several ways to engage our experts: through OnDemand Subscription Services, Assigned Expert Subscription Services, or traditional Project-Based Implementation Services.
Education Services
We offer a robust portfolio of training courses and learning paths to our customers and partners. We have also implemented a comprehensive training certification program to ensure an understanding of our offerings.
Maintenance and Customer Support
We offer software maintenance and support services as part of our cloud services and software offerings. Maintenance and support entitlements provide customers the right to receive unspecified software updates, maintenance releases and patches, and access to our technical support services during the term of the subscription.
We maintain a customer support organization that offers multiple service levels. Standard or Premium support customers receive 24x7x365 access to subject matter experts for critical issues, direct telephone support, access to online support, and software upgrades. Additionally, Premium support provides much faster response/update times and targeted fix Service Level Objectives for all case priorities, providing proactive support and quarterly reviews of the customer’s mission-critical deployments. Our customer support organization has global coverage capabilities, delivering support with deep expertise in our cloud services and software offerings, complex IT environments and associated third-party infrastructure.
Our Growth Strategy
We are focused on providing the right capabilities through our products and services to remove the barriers between data and action. The key elements of our growth strategy are:
Cloud-first Platform and Solutions. We have reached a key milestone in our cloud transformation, where cloud services represent the majority of our total software bookings. Our cloud services customers have accelerated their time to value and achieved lower total cost of ownership. Most importantly, the rate at which new features and capabilities are delivered to and used by customers is accelerated when using cloud services offerings. Given our customers’ success adopting our cloud services offerings, we will continue to invest heavily in differentiated cloud services offerings delivered through a cloud-optimized go-to-market and support model. We will continue to invest in our software offerings to enable both standalone consumption and hybrid Splunk deployments that span customer on-premises and cloud environments. We expect our cloud services offerings will continue to be an important source of growth for Splunk and our customers.
Expand the Splunk value proposition with broader and deeper capabilities. We will continue to focus our product strategy and go-to-market approaches on our Security, IT Operations, and Observability users and we will expand the Splunk Platform and Splunk Solutions offerings that serve them. We intend to deliver new and enhanced capabilities, as well as services that provide faster time-to-value and easier adoption and expansion. We also plan to deliver new features tailored to meet the specific needs of users, including more comprehensive data reach, more powerful analytics, and AI/ML and automation capabilities. While we are focused on extending our industry analyst-recognized leadership across Security, IT Operations and Observability, our customers benefit from even greater value when multiple organizations are generating insight using the Splunk Platform.
Global Expansion. We continue to invest in go-to-market, operations and infrastructure to deliver our services to customers in targeted countries across multiple geographies. Splunk has had success in global expansion as evidenced by our increased mix of revenues outside of the U.S. and we continue to see this as a significant growth opportunity.
Research and Development
We invest substantial resources in research and development to enhance our offerings, develop new end-market specific solutions and apps, conduct software and quality assurance testing and improve our core technology. Our technical staff monitors and tests our software on a regular basis, and we maintain a regular release process to refine, update, and enhance our existing offerings. As we shift our focus to cloud services offerings we will make significant investments in a cloud-
8
optimized delivery model while continuing to invest in our software offerings, both for standalone consumption and for deployment in hybrid environments.
Acquisitions and Investments
We enhance and expand our offerings both through our own research and development efforts and through acquisitions and investments. We have made a number of acquisitions in the past and will continue to evaluate acquisition opportunities that can accelerate the delivery of new capabilities, entry into new market segments and our technical expertise.
Intellectual Property
We rely on patent, trademark, copyright and trade secret laws, confidentiality procedures, internal policies and contractual provisions to protect our technology and intellectual property rights. The nature and extent of legal protection of our intellectual property rights depends on, among other things, the type of intellectual property right and the jurisdiction in which such right arises. We believe that our intellectual property rights are valuable and important to our business. We file trademark, patent, and copyright applications to protect our intellectual property.
Generally, we retain ownership of software we develop. All software is licensed to users and primarily provided in object code or as a cloud service pursuant to browser-wrap, embedded or on-line license or service terms, or signed customer agreements. These agreements generally contain restrictions on duplication, disclosure, reverse engineering, transfer and license circumvention.
We use open source software in our offerings and business, including as incorporated into software we receive from third party commercial software vendors or technologies obtained through acquisitions, and expect to continue to use open source software in the future. Additionally, we, including companies that we have acquired, have intentionally made certain proprietary software available on an open source basis, both by contributing modifications back to existing open source projects, and by making certain internally developed tools available pursuant to open source licenses, and we plan to continue to do so in the future.
Sales and Marketing
Our sales and marketing organizations work together closely to expand market awareness, generate sales pipeline, and cultivate customer relationships to drive revenue growth and enablement for adoption and customer success.
Sales
We sell our offerings directly through field sales, inside sales and indirectly through different routes to market with various partners. We gather prospects through a broad range of marketing campaigns, programs and events. Our sales development teams handle lead qualifications. Large or complex transactions generally are handled by our globally distributed direct field sales teams. Our sales engineers help define customer use cases, pre-sales qualification and evaluation.
Our field sales teams are organized geographically across the Americas, Europe, Middle East and Africa (“EMEA”) and Asia Pacific (“APAC”). We also have a dedicated sales team focused on government customers, which includes United States federal, state and local government entities.
In addition to acquiring new customers, our sales teams are responsible for securing renewals of existing contracts, as well as increased adoption of our offerings by existing customers. To accomplish this, our field sales and customer success teams work closely with our customers to ensure adoption and overall account health, which fosters expanded usage through higher capacity or upgrades and additional use cases.
Marketing
We focus our marketing efforts on generating opportunities for our sales force and partners, increasing awareness of the Splunk brand, driving viral adoption, and communicating product advantages and business benefits. We market our offerings as a targeted solution for specific use cases and as an enterprise solution for a broad range of data and use cases. We
9

FOR
M 1
0-K
customer success managers and advocacy team, customers have several ways to engage our experts: through OnDemand Subscription Services, Assigned Expert Subscription Services, or traditional Project-Based Implementation Services.
Education Services
We offer a robust portfolio of training courses and learning paths to our customers and partners. We have also implemented a comprehensive training certification program to ensure an understanding of our offerings.
Maintenance and Customer Support
We offer software maintenance and support services as part of our cloud services and software offerings. Maintenance and support entitlements provide customers the right to receive unspecified software updates, maintenance releases and patches, and access to our technical support services during the term of the subscription.
We maintain a customer support organization that offers multiple service levels. Standard or Premium support customers receive 24x7x365 access to subject matter experts for critical issues, direct telephone support, access to online support, and software upgrades. Additionally, Premium support provides much faster response/update times and targeted fix Service Level Objectives for all case priorities, providing proactive support and quarterly reviews of the customer’s mission-critical deployments. Our customer support organization has global coverage capabilities, delivering support with deep expertise in our cloud services and software offerings, complex IT environments and associated third-party infrastructure.
Our Growth Strategy
We are focused on providing the right capabilities through our products and services to remove the barriers between data and action. The key elements of our growth strategy are:
Cloud-first Platform and Solutions. We have reached a key milestone in our cloud transformation, where cloud services represent the majority of our total software bookings. Our cloud services customers have accelerated their time to value and achieved lower total cost of ownership. Most importantly, the rate at which new features and capabilities are delivered to and used by customers is accelerated when using cloud services offerings. Given our customers’ success adopting our cloud services offerings, we will continue to invest heavily in differentiated cloud services offerings delivered through a cloud-optimized go-to-market and support model. We will continue to invest in our software offerings to enable both standalone consumption and hybrid Splunk deployments that span customer on-premises and cloud environments. We expect our cloud services offerings will continue to be an important source of growth for Splunk and our customers.
Expand the Splunk value proposition with broader and deeper capabilities. We will continue to focus our product strategy and go-to-market approaches on our Security, IT Operations, and Observability users and we will expand the Splunk Platform and Splunk Solutions offerings that serve them. We intend to deliver new and enhanced capabilities, as well as services that provide faster time-to-value and easier adoption and expansion. We also plan to deliver new features tailored to meet the specific needs of users, including more comprehensive data reach, more powerful analytics, and AI/ML and automation capabilities. While we are focused on extending our industry analyst-recognized leadership across Security, IT Operations and Observability, our customers benefit from even greater value when multiple organizations are generating insight using the Splunk Platform.
Global Expansion. We continue to invest in go-to-market, operations and infrastructure to deliver our services to customers in targeted countries across multiple geographies. Splunk has had success in global expansion as evidenced by our increased mix of revenues outside of the U.S. and we continue to see this as a significant growth opportunity.
Research and Development
We invest substantial resources in research and development to enhance our offerings, develop new end-market specific solutions and apps, conduct software and quality assurance testing and improve our core technology. Our technical staff monitors and tests our software on a regular basis, and we maintain a regular release process to refine, update, and enhance our existing offerings. As we shift our focus to cloud services offerings we will make significant investments in a cloud-
8
optimized delivery model while continuing to invest in our software offerings, both for standalone consumption and for deployment in hybrid environments.
Acquisitions and Investments
We enhance and expand our offerings both through our own research and development efforts and through acquisitions and investments. We have made a number of acquisitions in the past and will continue to evaluate acquisition opportunities that can accelerate the delivery of new capabilities, entry into new market segments and our technical expertise.
Intellectual Property
We rely on patent, trademark, copyright and trade secret laws, confidentiality procedures, internal policies and contractual provisions to protect our technology and intellectual property rights. The nature and extent of legal protection of our intellectual property rights depends on, among other things, the type of intellectual property right and the jurisdiction in which such right arises. We believe that our intellectual property rights are valuable and important to our business. We file trademark, patent, and copyright applications to protect our intellectual property.
Generally, we retain ownership of software we develop. All software is licensed to users and primarily provided in object code or as a cloud service pursuant to browser-wrap, embedded or on-line license or service terms, or signed customer agreements. These agreements generally contain restrictions on duplication, disclosure, reverse engineering, transfer and license circumvention.
We use open source software in our offerings and business, including as incorporated into software we receive from third party commercial software vendors or technologies obtained through acquisitions, and expect to continue to use open source software in the future. Additionally, we, including companies that we have acquired, have intentionally made certain proprietary software available on an open source basis, both by contributing modifications back to existing open source projects, and by making certain internally developed tools available pursuant to open source licenses, and we plan to continue to do so in the future.
Sales and Marketing
Our sales and marketing organizations work together closely to expand market awareness, generate sales pipeline, and cultivate customer relationships to drive revenue growth and enablement for adoption and customer success.
Sales
We sell our offerings directly through field sales, inside sales and indirectly through different routes to market with various partners. We gather prospects through a broad range of marketing campaigns, programs and events. Our sales development teams handle lead qualifications. Large or complex transactions generally are handled by our globally distributed direct field sales teams. Our sales engineers help define customer use cases, pre-sales qualification and evaluation.
Our field sales teams are organized geographically across the Americas, Europe, Middle East and Africa (“EMEA”) and Asia Pacific (“APAC”). We also have a dedicated sales team focused on government customers, which includes United States federal, state and local government entities.
In addition to acquiring new customers, our sales teams are responsible for securing renewals of existing contracts, as well as increased adoption of our offerings by existing customers. To accomplish this, our field sales and customer success teams work closely with our customers to ensure adoption and overall account health, which fosters expanded usage through higher capacity or upgrades and additional use cases.
Marketing
We focus our marketing efforts on generating opportunities for our sales force and partners, increasing awareness of the Splunk brand, driving viral adoption, and communicating product advantages and business benefits. We market our offerings as a targeted solution for specific use cases and as an enterprise solution for a broad range of data and use cases. We
9

engage with existing and potential customers to provide community-based education and awareness and to promote expanded use of our cloud services and software offerings within these customers. We engage business press, technology press, industry analysts and influential voices to create awareness for Splunk in our target markets. We host a number of events, including the SplunkLive! event series, across our sales regions to engage with both existing customers and new prospects, as well as deliver product training. We host our annual user conference, “.conf” and multiple partner conferences as other ways to support the Splunk community to foster collaboration and help our customers drive further business results from our offerings.
Partner Ecosystem
We maintain an extensive and active partner ecosystem through the Splunk Partner+ Program. Our partners assist us by selling, servicing or building solutions on top of the Splunk Platform. Selling partners identify new prospects or use cases through their technology and customer relationships. Partners offering professional services provide implementation and support to existing customers, up-selling for additional use cases and maintenance renewals. Partners building on top of Splunk create applications, add-ons and connectors that allow customers to leverage broader sets of data in Splunk, extending our overall market reach and total addressable market.
The Splunk Partner+ Program expands our geographic sales reach worldwide, across all of our sales theaters. Historically, the majority of EMEA, APAC and U.S. Public Sector sales rely heavily on engagement with our partners, and we expect this trend to continue.
Splunk has organized its partner ecosystem strategy to align with four partner-centric routes to market:
Cloud service providers (“CSP”) Strong partnerships with CSPs (e.g. Amazon Web Services and Google Cloud) are the cornerstone of our cloud focus. We have several coordinated, ongoing marketing and sales efforts with these key partners, to promote Splunk Cloud running on CSP infrastructure.
Distribution and resellers Splunk has a well-established and mature global network of distribution and resell partners. These partners are enabled to sell both our cloud services and software offerings and represent an important part of our focus on offering cloud-centric solutions to our customers worldwide. Splunk provides a wide range of support programs to our distribution and reseller partners via the Splunk Partner+ Program.
Global systems integrators, system integrators, and managed services providers Partners can deliver solutions and services to their customers with the Splunk Platform. These partners are independently developing and deploying the Splunk Platform-based solutions to their customers, extending our overall market reach and total addressable market.
Technology and ecosystem partners The Splunk Technology Alliance Partner Program enables and supports an ecosystem of over 750 software vendors who build integrations between Splunk and their products. Some also leverage the Splunk Platform to build data-centric solutions for their customers. Splunk provides a rich set of tools and documentation to help partners build integrations and solutions, adding value to our mutual customers’ investments. Partner integrations and apps are typically made available to customers via our online integration and solution repository, SplunkBase.
Splunk Community Engagement
We engage with the community of Splunk users, including Splunk employees, partners, and customers, through a variety of online and in-person forums to assist with Splunk skills development and use, empower the development of Ecosystem Solutions, cross-pollinate experiences and best practices, and get feedback on current and planned future offerings and capabilities.
Our primary online forums include Splunk Answers, Splunk User Groups, and Splunk Ideas. In Splunk Answers, users share best practices about how to build searches, create data visualizations, build implementations to address specific use-cases and configure and deploy our cloud services and software offerings. While our product, support, engineering and professional services teams participate in Splunk Answers, the majority of questions appearing on Splunk Answers are answered by other Splunk users, including the SplunkTrust, a peer-nominated, MVP group of Splunk users. Splunk Ideas is a forum through which the community can submit and vote on ideas for new product offerings and capabilities, providing a highly-refined set of inputs to our product development efforts. We also maintain active communities on leading social internet platforms, including Facebook, Twitter, LinkedIn and Slack.
10
Comprehensive enablement for Ecosystem Solutions developers is provided on our Splunk Dev portal. Splunk Dev contains resources for building apps, integrations, and other Ecosystem Solutions content that extends the Splunk offerings to new data, insights, and use cases. Developers can sign up for free licenses or access to support both their on-premises and cloud-native application needs. Additional resources made available through Splunk Dev include developer guides, API references, tutorials, downloads, tools and examples to help developers efficiently create new solutions.
We also continue to support the growth of the Splunk Community, with local Splunk User Groups around the world and a growing collection of Splunk-sponsored events, such as .conf, and regional/local events, such as SplunkLive!
Customers
We have customers in more than 130 countries and over 90 of the Fortune 100 companies, as of January 31, 2021. We provide offerings to customers of varying sizes, including enterprises, educational institutions and government entities. No individual customer represented more than 10% of our total revenues for any of the periods presented. Our current customer base spans numerous industry verticals, including education, financial services, government, healthcare/pharmaceuticals, industrials/manufacturing, media/entertainment, retail/ecommerce, technology, and telecommunications.
Backlog and Seasonality
Our backlog represents non-cancelable orders that have not been recognized as revenue and have not yet been invoiced. We had backlog of approximately $844.6 million and $794.9 million as of January 31, 2021 and 2020, respectively.
For information regarding the seasonality in the sale of our offerings, see Item 7, “Management’s Discussion and Analysis of Financial Condition and Results of Operations - Seasonality, Cyclicality and Quarterly Trends” of this Annual Report on Form 10-K.
Competition
Our industry is evolving rapidly and is becoming increasingly competitive. More and more vendors are competing across buying centers, security vendors are attempting to penetrate the IT Operations industry, IT competitors are targeting the security space, APM and Observability competitors are expanding their footprints in log management and machine data, and cloud service providers are extending their native operations and security capabilities across competing cloud environments. Additionally, a number of more domain-focused competitors continue to target specific use cases within the application, IT and security domains in an attempt to drive rapid penetration.
These dynamics position us in competition with a variety of large CSPs and software vendors, as well as smaller specialized companies, open source projects and custom development efforts, which provide solutions in the specific markets we address. Our principal competitors include:
• Cloud monitoring and APM/Observability vendors;
• Monitoring, troubleshooting, security and analytics services offered (embedded or add-ons) by major public cloud service providers;
• Companies targeting the data analytics industry;
• Legacy security, systems management and other IT vendors; and
• IT departments that undertake custom software development efforts to analyze and manage their operations data across their public and private cloud landscapes.
Human Capital
At the core of Splunk, we are a people-centric company. We believe that the best way to continue to deliver customer success and the best products and services is to focus on attracting the most qualified candidates to join our team (based on skills, knowledge and abilities). We also spend time and energy supporting, retaining and developing our high-performing and
11

FOR
M 1
0-K
engage with existing and potential customers to provide community-based education and awareness and to promote expanded use of our cloud services and software offerings within these customers. We engage business press, technology press, industry analysts and influential voices to create awareness for Splunk in our target markets. We host a number of events, including the SplunkLive! event series, across our sales regions to engage with both existing customers and new prospects, as well as deliver product training. We host our annual user conference, “.conf” and multiple partner conferences as other ways to support the Splunk community to foster collaboration and help our customers drive further business results from our offerings.
Partner Ecosystem
We maintain an extensive and active partner ecosystem through the Splunk Partner+ Program. Our partners assist us by selling, servicing or building solutions on top of the Splunk Platform. Selling partners identify new prospects or use cases through their technology and customer relationships. Partners offering professional services provide implementation and support to existing customers, up-selling for additional use cases and maintenance renewals. Partners building on top of Splunk create applications, add-ons and connectors that allow customers to leverage broader sets of data in Splunk, extending our overall market reach and total addressable market.
The Splunk Partner+ Program expands our geographic sales reach worldwide, across all of our sales theaters. Historically, the majority of EMEA, APAC and U.S. Public Sector sales rely heavily on engagement with our partners, and we expect this trend to continue.
Splunk has organized its partner ecosystem strategy to align with four partner-centric routes to market:
Cloud service providers (“CSP”) Strong partnerships with CSPs (e.g. Amazon Web Services and Google Cloud) are the cornerstone of our cloud focus. We have several coordinated, ongoing marketing and sales efforts with these key partners, to promote Splunk Cloud running on CSP infrastructure.
Distribution and resellers Splunk has a well-established and mature global network of distribution and resell partners. These partners are enabled to sell both our cloud services and software offerings and represent an important part of our focus on offering cloud-centric solutions to our customers worldwide. Splunk provides a wide range of support programs to our distribution and reseller partners via the Splunk Partner+ Program.
Global systems integrators, system integrators, and managed services providers Partners can deliver solutions and services to their customers with the Splunk Platform. These partners are independently developing and deploying the Splunk Platform-based solutions to their customers, extending our overall market reach and total addressable market.
Technology and ecosystem partners The Splunk Technology Alliance Partner Program enables and supports an ecosystem of over 750 software vendors who build integrations between Splunk and their products. Some also leverage the Splunk Platform to build data-centric solutions for their customers. Splunk provides a rich set of tools and documentation to help partners build integrations and solutions, adding value to our mutual customers’ investments. Partner integrations and apps are typically made available to customers via our online integration and solution repository, SplunkBase.
Splunk Community Engagement
We engage with the community of Splunk users, including Splunk employees, partners, and customers, through a variety of online and in-person forums to assist with Splunk skills development and use, empower the development of Ecosystem Solutions, cross-pollinate experiences and best practices, and get feedback on current and planned future offerings and capabilities.
Our primary online forums include Splunk Answers, Splunk User Groups, and Splunk Ideas. In Splunk Answers, users share best practices about how to build searches, create data visualizations, build implementations to address specific use-cases and configure and deploy our cloud services and software offerings. While our product, support, engineering and professional services teams participate in Splunk Answers, the majority of questions appearing on Splunk Answers are answered by other Splunk users, including the SplunkTrust, a peer-nominated, MVP group of Splunk users. Splunk Ideas is a forum through which the community can submit and vote on ideas for new product offerings and capabilities, providing a highly-refined set of inputs to our product development efforts. We also maintain active communities on leading social internet platforms, including Facebook, Twitter, LinkedIn and Slack.
10
Comprehensive enablement for Ecosystem Solutions developers is provided on our Splunk Dev portal. Splunk Dev contains resources for building apps, integrations, and other Ecosystem Solutions content that extends the Splunk offerings to new data, insights, and use cases. Developers can sign up for free licenses or access to support both their on-premises and cloud-native application needs. Additional resources made available through Splunk Dev include developer guides, API references, tutorials, downloads, tools and examples to help developers efficiently create new solutions.
We also continue to support the growth of the Splunk Community, with local Splunk User Groups around the world and a growing collection of Splunk-sponsored events, such as .conf, and regional/local events, such as SplunkLive!
Customers
We have customers in more than 130 countries and over 90 of the Fortune 100 companies, as of January 31, 2021. We provide offerings to customers of varying sizes, including enterprises, educational institutions and government entities. No individual customer represented more than 10% of our total revenues for any of the periods presented. Our current customer base spans numerous industry verticals, including education, financial services, government, healthcare/pharmaceuticals, industrials/manufacturing, media/entertainment, retail/ecommerce, technology, and telecommunications.
Backlog and Seasonality
Our backlog represents non-cancelable orders that have not been recognized as revenue and have not yet been invoiced. We had backlog of approximately $844.6 million and $794.9 million as of January 31, 2021 and 2020, respectively.
For information regarding the seasonality in the sale of our offerings, see Item 7, “Management’s Discussion and Analysis of Financial Condition and Results of Operations - Seasonality, Cyclicality and Quarterly Trends” of this Annual Report on Form 10-K.
Competition
Our industry is evolving rapidly and is becoming increasingly competitive. More and more vendors are competing across buying centers, security vendors are attempting to penetrate the IT Operations industry, IT competitors are targeting the security space, APM and Observability competitors are expanding their footprints in log management and machine data, and cloud service providers are extending their native operations and security capabilities across competing cloud environments. Additionally, a number of more domain-focused competitors continue to target specific use cases within the application, IT and security domains in an attempt to drive rapid penetration.
These dynamics position us in competition with a variety of large CSPs and software vendors, as well as smaller specialized companies, open source projects and custom development efforts, which provide solutions in the specific markets we address. Our principal competitors include:
• Cloud monitoring and APM/Observability vendors;
• Monitoring, troubleshooting, security and analytics services offered (embedded or add-ons) by major public cloud service providers;
• Companies targeting the data analytics industry;
• Legacy security, systems management and other IT vendors; and
• IT departments that undertake custom software development efforts to analyze and manage their operations data across their public and private cloud landscapes.
Human Capital
At the core of Splunk, we are a people-centric company. We believe that the best way to continue to deliver customer success and the best products and services is to focus on attracting the most qualified candidates to join our team (based on skills, knowledge and abilities). We also spend time and energy supporting, retaining and developing our high-performing and
11

innovative employees. Our commitment to diversity and inclusion is central to our core values. We strive to embrace each person’s unique individual value and the communities that matter to them. This commitment is an integral part of our Diversity, Equity & Inclusion (“DEI”) strategy. As of January 31, 2021, we employed over 6,500 employees, of which approximately 71.5% were in the United States and 28.5% were in our international locations.
We encourage you to visit our website for more detailed information regarding our human capital programs and initiatives. Nothing on our website shall be deemed incorporated by reference into this Annual Report on Form 10-K.
Diversity and Inclusion
A diverse and inclusive company helps us achieve our mission of bringing data to every question, decision and action to drive positive outcomes for our company, our communities and each other. Our company-wide inclusiveness effort, A Million Data Points, speaks powerfully to our holistic, multi-dimensional approach to diversity, illuminating cultural heritage, intersectionality, experiences and all the unique qualities and talents that each employee possesses. We also cultivate an inclusive culture through several employee resource groups (ERGs). In fiscal 2021, Splunk focused on the hiring, retention and representation rates of women and individuals from underrepresented groups. We provide DEI education and offerings to imbed inclusion and equity in our talent processes. We plan to conduct intersectional employee surveys that look at a combination of factors that include underrepresented groups and gender to check for variances in employee experiences.
We work to help provide access to new careers in technology with skills development and training, promoting a new generation of diverse talent through a global network of universities, community colleges and workforce partners like YearUp and Hire Military. Splunk is regularly recognized as an employer of choice in the technology industry and within the various locations that we operate. In fiscal 2021, we were named one of the Best Places to Work for LGBTQ Equality after earning a score of 100 on the Human Rights Campaign (HRC) Corporate Equality Index, and we were included in Fortune’s Best Workplaces for Women and Millennials and Best Workplaces in Technology. In fiscal 2020, we were included in Fortune’s Best Workplaces for Women, Parents, Millennials and Diversity.
Additional information on our diversity and inclusion strategy, diversity metrics and programs can be found in the Diversity Annual Report posted on our website.
Compensation, Benefits and Wellbeing
Splunk provides a comprehensive and competitive compensation and benefits package to attract, retain and engage the talented employees that make our company successful. We provide employees with competitive base salaries, incentive compensation and equity awards in the form of RSUs as well as the opportunity to participate in our Employee Stock Purchase Plan, which allows employees to purchase Splunk stock at a discount.
Our benefits offerings are designed to meet the unique needs of our employees. We believe we provide competitive benefits in each local market we operate in to help our employees care for themselves and their families. Common offerings are health benefits, retirement benefits, fertility and family planning benefits, paid time off, holidays and leave benefits.
In response to COVID-19, we offer a number of additional benefits to help our employees. These benefits include 30 days of paid time off that employees can use for any absence related to the pandemic or a natural disaster, four additional wellbeing paid rest days and reimbursement for certain expenses related to remote working. In addition, we have a global mental health offering through a third party provider who gives our employees and their families access to counseling, personal coaches and a variety of digital wellness resources.
Development
We believe in leadership and learning and invest in the development of all of our employees. Employees take advantage of live courses, leadership programs, online training, product training, sales training, technical training, mentor programs, team building events, seminars, conferences, lectures, university programs, peer-to-peer and manager-led training and other learning opportunities across the company.
Corporate Information
12
Our principal executive offices are located at 270 Brannan Street, San Francisco, California 94107, and our telephone number is (415) 848-8400. We were incorporated in California in October 2003 and were reincorporated in Delaware in May 2006.
Our website is located at www.splunk.com and our investor relations website is located at http://investors.splunk.com. The information posted on our website is not incorporated into this Annual Report on Form 10-K. Our Annual Report on Form 10-K, Quarterly Reports on Form 10-Q, Current Reports on Form 8-K and amendments to reports filed or furnished pursuant to Sections 13(a) and 15(d) of the Securities Exchange Act of 1934, as amended, are available free of charge on our investor relations website as soon as reasonably practicable after we electronically file such material with, or furnish it to, the SEC.
We webcast our earnings calls and certain events we participate in or host with members of the investment community on our investor relations website. Additionally, we provide notifications of news or announcements regarding our financial performance, including SEC filings, investor events, press and earnings releases, as part of our investor relations website. The contents of these websites are not intended to be incorporated by reference into this report or in any other report or document we file.
Item 1A. Risk Factors
Risk Factor Summary
Our business is subject to numerous risks and uncertainties, including those highlighted in Part I, Item 1A titled “Risk Factors.” These risks include, but are not limited to, the following:
Factors Related to Our Business and Results of Operations• our business model transition from sales of licenses to cloud subscriptions;• fluctuations in our operating results from period to period;• our organic and inorganic growth and the effectiveness of our controls, systems and procedures as we grow;• our history of losses and the prospect of profitability;• costly and continuous infrastructure investments required by our cloud services;• our ability to attract and retain leadership and key personnel, particularly within our industry;• expansion and integration related to past and future acquisitions;• our ability to obtain capital on acceptable terms to support our growth;• our ability to use our net operating losses and tax credits to offset future taxable income and tax; and• liability related to past or future sales and use, value added or similar taxes.
Factors Related to the Economy and the Markets in which We Operate• the impact of the COVID-19 pandemic on our business;• intense competition from large and small providers and vendors in the markets in which we operate;• market acceptance of our new and existing offerings and product enhancements;• economic and political conditions and uncertainty, both domestically and internationally, including those specific
to industries in which our customers participate; and• governmental export and import controls related to operation in international markets.
Factors Related to Customers and Sales• current and future customer demand, use case expansion and satisfaction;• our reliance on customer purchases, renewals, upgrades and expansions of term licenses, agreements for cloud
services and maintenance and support agreements;• our evolving pricing models and their impacts on our customers’ purchases, renewals, upgrades and expansions;• the length of time, expense and unpredictability associated with our sales;• our international sales and operations;• dependency on and challenges related to sales to federal, state, local and foreign governments; and• customer dissatisfaction, data loss or corruption arising from incorrect or improper implementation or use of our
products.
13

FOR
M 1
0-K
innovative employees. Our commitment to diversity and inclusion is central to our core values. We strive to embrace each person’s unique individual value and the communities that matter to them. This commitment is an integral part of our Diversity, Equity & Inclusion (“DEI”) strategy. As of January 31, 2021, we employed over 6,500 employees, of which approximately 71.5% were in the United States and 28.5% were in our international locations.
We encourage you to visit our website for more detailed information regarding our human capital programs and initiatives. Nothing on our website shall be deemed incorporated by reference into this Annual Report on Form 10-K.
Diversity and Inclusion
A diverse and inclusive company helps us achieve our mission of bringing data to every question, decision and action to drive positive outcomes for our company, our communities and each other. Our company-wide inclusiveness effort, A Million Data Points, speaks powerfully to our holistic, multi-dimensional approach to diversity, illuminating cultural heritage, intersectionality, experiences and all the unique qualities and talents that each employee possesses. We also cultivate an inclusive culture through several employee resource groups (ERGs). In fiscal 2021, Splunk focused on the hiring, retention and representation rates of women and individuals from underrepresented groups. We provide DEI education and offerings to imbed inclusion and equity in our talent processes. We plan to conduct intersectional employee surveys that look at a combination of factors that include underrepresented groups and gender to check for variances in employee experiences.
We work to help provide access to new careers in technology with skills development and training, promoting a new generation of diverse talent through a global network of universities, community colleges and workforce partners like YearUp and Hire Military. Splunk is regularly recognized as an employer of choice in the technology industry and within the various locations that we operate. In fiscal 2021, we were named one of the Best Places to Work for LGBTQ Equality after earning a score of 100 on the Human Rights Campaign (HRC) Corporate Equality Index, and we were included in Fortune’s Best Workplaces for Women and Millennials and Best Workplaces in Technology. In fiscal 2020, we were included in Fortune’s Best Workplaces for Women, Parents, Millennials and Diversity.
Additional information on our diversity and inclusion strategy, diversity metrics and programs can be found in the Diversity Annual Report posted on our website.
Compensation, Benefits and Wellbeing
Splunk provides a comprehensive and competitive compensation and benefits package to attract, retain and engage the talented employees that make our company successful. We provide employees with competitive base salaries, incentive compensation and equity awards in the form of RSUs as well as the opportunity to participate in our Employee Stock Purchase Plan, which allows employees to purchase Splunk stock at a discount.
Our benefits offerings are designed to meet the unique needs of our employees. We believe we provide competitive benefits in each local market we operate in to help our employees care for themselves and their families. Common offerings are health benefits, retirement benefits, fertility and family planning benefits, paid time off, holidays and leave benefits.
In response to COVID-19, we offer a number of additional benefits to help our employees. These benefits include 30 days of paid time off that employees can use for any absence related to the pandemic or a natural disaster, four additional wellbeing paid rest days and reimbursement for certain expenses related to remote working. In addition, we have a global mental health offering through a third party provider who gives our employees and their families access to counseling, personal coaches and a variety of digital wellness resources.
Development
We believe in leadership and learning and invest in the development of all of our employees. Employees take advantage of live courses, leadership programs, online training, product training, sales training, technical training, mentor programs, team building events, seminars, conferences, lectures, university programs, peer-to-peer and manager-led training and other learning opportunities across the company.
Corporate Information
12
Our principal executive offices are located at 270 Brannan Street, San Francisco, California 94107, and our telephone number is (415) 848-8400. We were incorporated in California in October 2003 and were reincorporated in Delaware in May 2006.
Our website is located at www.splunk.com and our investor relations website is located at http://investors.splunk.com. The information posted on our website is not incorporated into this Annual Report on Form 10-K. Our Annual Report on Form 10-K, Quarterly Reports on Form 10-Q, Current Reports on Form 8-K and amendments to reports filed or furnished pursuant to Sections 13(a) and 15(d) of the Securities Exchange Act of 1934, as amended, are available free of charge on our investor relations website as soon as reasonably practicable after we electronically file such material with, or furnish it to, the SEC.
We webcast our earnings calls and certain events we participate in or host with members of the investment community on our investor relations website. Additionally, we provide notifications of news or announcements regarding our financial performance, including SEC filings, investor events, press and earnings releases, as part of our investor relations website. The contents of these websites are not intended to be incorporated by reference into this report or in any other report or document we file.
Item 1A. Risk Factors
Risk Factor Summary
Our business is subject to numerous risks and uncertainties, including those highlighted in Part I, Item 1A titled “Risk Factors.” These risks include, but are not limited to, the following:
Factors Related to Our Business and Results of Operations• our business model transition from sales of licenses to cloud subscriptions;• fluctuations in our operating results from period to period;• our organic and inorganic growth and the effectiveness of our controls, systems and procedures as we grow;• our history of losses and the prospect of profitability;• costly and continuous infrastructure investments required by our cloud services;• our ability to attract and retain leadership and key personnel, particularly within our industry;• expansion and integration related to past and future acquisitions;• our ability to obtain capital on acceptable terms to support our growth;• our ability to use our net operating losses and tax credits to offset future taxable income and tax; and• liability related to past or future sales and use, value added or similar taxes.
Factors Related to the Economy and the Markets in which We Operate• the impact of the COVID-19 pandemic on our business;• intense competition from large and small providers and vendors in the markets in which we operate;• market acceptance of our new and existing offerings and product enhancements;• economic and political conditions and uncertainty, both domestically and internationally, including those specific
to industries in which our customers participate; and• governmental export and import controls related to operation in international markets.
Factors Related to Customers and Sales• current and future customer demand, use case expansion and satisfaction;• our reliance on customer purchases, renewals, upgrades and expansions of term licenses, agreements for cloud
services and maintenance and support agreements;• our evolving pricing models and their impacts on our customers’ purchases, renewals, upgrades and expansions;• the length of time, expense and unpredictability associated with our sales;• our international sales and operations;• dependency on and challenges related to sales to federal, state, local and foreign governments; and• customer dissatisfaction, data loss or corruption arising from incorrect or improper implementation or use of our
products.
13

Factors Related to IT, Privacy and Data Security• actual or perceived security breaches or unauthorized access to our customers’ data, our data or our cloud services;• interruptions or performance problems associated with our technology and infrastructure, and reliance on SaaS
technologies from third parties;• actual or perceived errors, failures or bugs in our offerings, including when new offerings, versions or updates are
released; and• legal requirements, contractual obligations and industry standards related to security, data protection and privacy.
Factors Related to Intellectual Property and Other Proprietary Rights• our ability to protect our trade secrets, trademarks, copyrights, patents, know-how, confidential information,
proprietary methods and technologies and other intellectual property and proprietary rights;• intellectual property rights claims by third parties that may be costly to defend, require us to pay significant
damages or limit our ability to use certain technologies;• maintenance, protection and enhancement of our brand; and• our use of “open source” software and related potential burdens, restrictions and litigation.
Factors Related to Reliance on Third Parties• our reliance on third party providers of cloud infrastructure services to deliver our offerings to users on our
platform;• our ability to maintain successful relationships with our partners, such as distributors and resellers, to license,
provide professional services and support our offerings;• our use of our community website, expansion of our developer ecosystem and support from third-party software
developers; and• third-party advice and information that may not be accurate that is provided to others utilizing our community
website and our products.
Factors Related to Our Securities• our debt servicing obligations;• the dilutive impact of the conversion of the Notes;• the conditional conversion feature of the Notes;• the accounting method for convertible debt securities, such as the Notes, including accounting for liability and
equity components of convertible debt instruments that may be settled entirely or partially in cash;• the potential impact on the value of our common stock on the Capped Calls;• counterparty risk related to the Capped Calls; and• the volatility of our common stock.
General Factors• the impact of climate change on our business;• tax liabilities related to federal, state, local and foreign taxes;• changes in accounting pronouncements and other financial and nonfinancial reporting standards;• the strain on resources and diversion of management attention caused by the requirements of being a public
company and related complexities; and• anti-takeover provisions in our charter, bylaws and afforded to us under Delaware law that may have the effect of
delaying or preventing a change of control or changes in our management.
Risk Factors
Our operations and financial results are subject to various risks and uncertainties including those described below. The risks and uncertainties described below are not the only ones we face. Additional risks and uncertainties that we are unaware of, or that we currently believe are not material, also may become important factors that affect us. If any of the following risks or others not specified below materialize, our business, financial condition and results of operations could be materially adversely affected. In that case, the trading price of our common stock could decline.
If we fail to successfully manage our business model transition, our operating results could be negatively impacted.
14
Historically we generated a majority of our revenues from sales of licenses, whereby we generally recognize the license fee portion of the arrangement upfront, assuming all revenue recognition criteria are satisfied. However, our revenue mix has shifted from sales of licenses to sales of cloud subscriptions and we expect it will continue to shift in favor of cloud subscriptions. Generally, as we shifted our licensing model and invoicing practices and continue the shift to cloud subscriptions, we have seen and will continue to see longer periods over which we collect cash from customers, with a negative impact on our operating cash flows; moreover, as cloud services become a larger percentage of our sales, we expect operating margins and the timing of our recognition of revenue will continue to be impacted. Our shift to cloud subscription agreements has happened faster than we expected, and our ability to predict our revenue and margins has been, and may continue to be, limited. For example, the recent increase in remote work as a result of the COVID-19 pandemic appears to have accelerated our customers’ shift to cloud subscriptions, the continued effects of which are uncertain and unpredictable. Whether our business model transition will prove successful and will accomplish our business and financial objectives is subject to numerous uncertainties, including but not limited to: customer demand, renewal and expansion rates, our ability to further develop and scale infrastructure, tax and accounting implications, pricing, and our costs. In addition, we expect the metrics we use to gauge the status of our business model transition, and evaluate and describe our business, may continue to evolve over the course of this transition as significant trends emerge. If we do not successfully execute this transition, our business and future operating results could be adversely affected.
Our future operating results may fluctuate significantly and our operating results may not be a good indication of future performance.
Our revenues, operating margins, cash flows and other operating results could vary significantly from period to period as a result of various factors, many of which are outside of our control. Comparing our revenues and operating results on a period-to-period basis may not be meaningful, and our past results should not be relied upon as an indication of our future performance. For example, we generally recognize license revenues upfront and recognize revenues associated with our cloud services ratably over the term of the agreement. At the beginning of each period, we cannot predict the ratio of orders with revenues that will be recognized upfront and those with revenues that will be recognized ratably that we will enter into during the quarter, due to the fact that our customers have the ability to choose between a term license and cloud subscription agreement. Our customers may choose shorter duration term licenses ahead of migrating to cloud subscriptions and may choose shorter duration cloud subscriptions when transitioning from on-premises to cloud services. In addition, the size of our licenses and orders varies greatly and can result in fluctuations in our revenues and operating results. A portion of revenue recognized in any given quarter is a result of ratably recognized agreements entered into during previous quarters, including agreements for our cloud services and maintenance and support agreements. Consequently, a decline in business from such ratably recognized agreements in any quarter may not be reflected in our revenue results for that quarter. Any such decline, however, will negatively affect our revenues in future quarters. Accordingly, the effect of downturns in sales and market acceptance of our offerings may not be fully reflected in our results of operations until future periods.
We may not be able to accurately predict our future revenues or results of operations. For example, although our shift to a subscription model generates recurring revenue and cash flows that are expected to be more predictable over time, we may not be able to accurately forecast our revenue, cash flows and other financial results in the near term due to a number of variables, including the timing of our collection of cash, increased annual invoicing, revenue mix, our customers’ rate of adoption of our cloud services model as compared to term licenses, contract durations, the extent and continued impact of the COVID-19 pandemic on our business and overall economic environment and the timing of revenue recognition. We base our current and future expense levels on our operating plans and sales forecasts, and our operating costs are expected to be relatively fixed in the short-term. As a result, we may not be able to reduce our costs sufficiently to compensate for an unexpected shortfall in revenues, and even a small shortfall in revenues could disproportionately and adversely affect our financial results for that quarter.
In addition to other risk factors described elsewhere in this “Risk Factors” section, factors that may cause our financial results to fluctuate from quarter to quarter include:
• the impact of our business model transition on our revenue mix, which may impact our revenue, deferred revenue,
remaining performance obligations, gross margins and operating income;
• the timing of our sales during the quarter, particularly because a large portion of our sales occur toward the end of the quarter
• the loss or delay of a few large transactions;
15

FOR
M 1
0-K
Factors Related to IT, Privacy and Data Security• actual or perceived security breaches or unauthorized access to our customers’ data, our data or our cloud services;• interruptions or performance problems associated with our technology and infrastructure, and reliance on SaaS
technologies from third parties;• actual or perceived errors, failures or bugs in our offerings, including when new offerings, versions or updates are
released; and• legal requirements, contractual obligations and industry standards related to security, data protection and privacy.
Factors Related to Intellectual Property and Other Proprietary Rights• our ability to protect our trade secrets, trademarks, copyrights, patents, know-how, confidential information,
proprietary methods and technologies and other intellectual property and proprietary rights;• intellectual property rights claims by third parties that may be costly to defend, require us to pay significant
damages or limit our ability to use certain technologies;• maintenance, protection and enhancement of our brand; and• our use of “open source” software and related potential burdens, restrictions and litigation.
Factors Related to Reliance on Third Parties• our reliance on third party providers of cloud infrastructure services to deliver our offerings to users on our
platform;• our ability to maintain successful relationships with our partners, such as distributors and resellers, to license,
provide professional services and support our offerings;• our use of our community website, expansion of our developer ecosystem and support from third-party software
developers; and• third-party advice and information that may not be accurate that is provided to others utilizing our community
website and our products.
Factors Related to Our Securities• our debt servicing obligations;• the dilutive impact of the conversion of the Notes;• the conditional conversion feature of the Notes;• the accounting method for convertible debt securities, such as the Notes, including accounting for liability and
equity components of convertible debt instruments that may be settled entirely or partially in cash;• the potential impact on the value of our common stock on the Capped Calls;• counterparty risk related to the Capped Calls; and• the volatility of our common stock.
General Factors• the impact of climate change on our business;• tax liabilities related to federal, state, local and foreign taxes;• changes in accounting pronouncements and other financial and nonfinancial reporting standards;• the strain on resources and diversion of management attention caused by the requirements of being a public
company and related complexities; and• anti-takeover provisions in our charter, bylaws and afforded to us under Delaware law that may have the effect of
delaying or preventing a change of control or changes in our management.
Risk Factors
Our operations and financial results are subject to various risks and uncertainties including those described below. The risks and uncertainties described below are not the only ones we face. Additional risks and uncertainties that we are unaware of, or that we currently believe are not material, also may become important factors that affect us. If any of the following risks or others not specified below materialize, our business, financial condition and results of operations could be materially adversely affected. In that case, the trading price of our common stock could decline.
If we fail to successfully manage our business model transition, our operating results could be negatively impacted.
14
Historically we generated a majority of our revenues from sales of licenses, whereby we generally recognize the license fee portion of the arrangement upfront, assuming all revenue recognition criteria are satisfied. However, our revenue mix has shifted from sales of licenses to sales of cloud subscriptions and we expect it will continue to shift in favor of cloud subscriptions. Generally, as we shifted our licensing model and invoicing practices and continue the shift to cloud subscriptions, we have seen and will continue to see longer periods over which we collect cash from customers, with a negative impact on our operating cash flows; moreover, as cloud services become a larger percentage of our sales, we expect operating margins and the timing of our recognition of revenue will continue to be impacted. Our shift to cloud subscription agreements has happened faster than we expected, and our ability to predict our revenue and margins has been, and may continue to be, limited. For example, the recent increase in remote work as a result of the COVID-19 pandemic appears to have accelerated our customers’ shift to cloud subscriptions, the continued effects of which are uncertain and unpredictable. Whether our business model transition will prove successful and will accomplish our business and financial objectives is subject to numerous uncertainties, including but not limited to: customer demand, renewal and expansion rates, our ability to further develop and scale infrastructure, tax and accounting implications, pricing, and our costs. In addition, we expect the metrics we use to gauge the status of our business model transition, and evaluate and describe our business, may continue to evolve over the course of this transition as significant trends emerge. If we do not successfully execute this transition, our business and future operating results could be adversely affected.
Our future operating results may fluctuate significantly and our operating results may not be a good indication of future performance.
Our revenues, operating margins, cash flows and other operating results could vary significantly from period to period as a result of various factors, many of which are outside of our control. Comparing our revenues and operating results on a period-to-period basis may not be meaningful, and our past results should not be relied upon as an indication of our future performance. For example, we generally recognize license revenues upfront and recognize revenues associated with our cloud services ratably over the term of the agreement. At the beginning of each period, we cannot predict the ratio of orders with revenues that will be recognized upfront and those with revenues that will be recognized ratably that we will enter into during the quarter, due to the fact that our customers have the ability to choose between a term license and cloud subscription agreement. Our customers may choose shorter duration term licenses ahead of migrating to cloud subscriptions and may choose shorter duration cloud subscriptions when transitioning from on-premises to cloud services. In addition, the size of our licenses and orders varies greatly and can result in fluctuations in our revenues and operating results. A portion of revenue recognized in any given quarter is a result of ratably recognized agreements entered into during previous quarters, including agreements for our cloud services and maintenance and support agreements. Consequently, a decline in business from such ratably recognized agreements in any quarter may not be reflected in our revenue results for that quarter. Any such decline, however, will negatively affect our revenues in future quarters. Accordingly, the effect of downturns in sales and market acceptance of our offerings may not be fully reflected in our results of operations until future periods.
We may not be able to accurately predict our future revenues or results of operations. For example, although our shift to a subscription model generates recurring revenue and cash flows that are expected to be more predictable over time, we may not be able to accurately forecast our revenue, cash flows and other financial results in the near term due to a number of variables, including the timing of our collection of cash, increased annual invoicing, revenue mix, our customers’ rate of adoption of our cloud services model as compared to term licenses, contract durations, the extent and continued impact of the COVID-19 pandemic on our business and overall economic environment and the timing of revenue recognition. We base our current and future expense levels on our operating plans and sales forecasts, and our operating costs are expected to be relatively fixed in the short-term. As a result, we may not be able to reduce our costs sufficiently to compensate for an unexpected shortfall in revenues, and even a small shortfall in revenues could disproportionately and adversely affect our financial results for that quarter.
In addition to other risk factors described elsewhere in this “Risk Factors” section, factors that may cause our financial results to fluctuate from quarter to quarter include:
• the impact of our business model transition on our revenue mix, which may impact our revenue, deferred revenue,
remaining performance obligations, gross margins and operating income;
• the timing of our sales during the quarter, particularly because a large portion of our sales occur toward the end of the quarter
• the loss or delay of a few large transactions;
15

• changes in the mix of our revenues between term licenses and cloud subscriptions, as well as the duration;
• the mix of revenues attributable to larger transactions as opposed to smaller transactions and the impact that a few large transactions or a change in mix may have on our overall financial results as well as the overall average selling price (“ASP”) of our offerings;
• the renewal and usage rates of our customers;
• changes in the competitive dynamics of our market;
• changes in customers’ budgets and in the timing of their purchasing decisions and in the length of sales cycles;
• changes in our pricing models and practices or those of our competitors;
• changes to our invoicing practices;
• customers delaying purchasing decisions in anticipation of new offerings or software enhancements by us or our competitors or for other reasons;
• customer acceptance of and willingness to pay for new versions of our offerings or new solutions for specific product and end markets;
• our ability to successfully introduce and monetize new offerings and licensing and service models for our new offerings;
• network outages or actual or perceived security breaches or incidents;
• the availability and performance of our cloud services, including Splunk Cloud;
• our ability to control costs, including our operating expenses;
• changes in laws and regulations that impact our business;
• general economic and political conditions and uncertainty, both domestically and internationally, as well as economic and political conditions and uncertainty specifically affecting industries in which our customers participate, including impacts from the COVID-19 pandemic;
• the amount and timing of our stock-based compensation expenses;
• changes in accounting standards, particularly those related to revenue recognition and sales commissions;
• use of estimates, judgments and assumptions under current accounting standards;
• the timing of satisfying revenue recognition criteria;
• our ability to qualify and successfully compete for government contracts; and
• the collectability of receivables from customers and resellers, which may be hindered or delayed, particularly as the COVID-19 pandemic continues.
Many of these factors are outside our control, and the variability and unpredictability of such factors could result in our failing to meet or exceed our financial expectations for a given period. We believe that quarter-to-quarter comparisons of our revenues, operating results and cash flows may not necessarily be indicative of our future performance.
If we fail to effectively manage our growth, our business and operating results could be adversely affected.
16
Although our business has experienced significant growth, we cannot provide any assurance that our business will continue to grow at the same rate or at all. We have experienced and expect to continue to experience growth in our headcount and operations, including from acquisitions, which has placed and will continue to place significant demands on our management and our operational and financial systems and infrastructure. As of January 31, 2021, approximately 24% of our workforce had been employed by us for less than one year. As we continue to grow, we must effectively integrate, develop and motivate a large number of new employees, while maintaining the effectiveness of our business execution and the beneficial aspects of our corporate culture and values, the challenges of which may be exacerbated due to remote working conditions associated with the COVID-19 pandemic. In particular, we intend to continue to make directed and substantial investments to expand our research and development, sales and marketing, and general and administrative organizations, as well as our international operations.
To effectively manage growth, we must continue to improve our operational, financial and management controls, and our reporting systems and procedures by, among other things:
• improving our key business applications, processes and IT infrastructure to support our business needs and appropriately documenting such systems and processes;
• enhancing information and communication systems to ensure that our employees and offices around the world are well-coordinated and can effectively communicate with each other and our growing base of customers and partners; and
• enhancing our internal controls to ensure timely and accurate reporting of all of our operations and financial results.
These systems enhancements and improvements will require significant capital expenditures and allocation of valuable management and employee resources. If we fail to implement these improvements effectively, our ability to manage our expected growth, ensure uninterrupted operation of key business systems and comply with the rules and regulations that are applicable to public reporting companies will be impaired. Additionally, if we do not effectively manage the growth of our business and operations, the quality of our offerings could suffer, which could negatively affect our brand, financial results and overall business.
We have a history of losses, and we may not be profitable in the future.
We have incurred net losses in each year since our inception. As a result, we had an accumulated deficit of $2.47 billion at January 31, 2021. Because our products and offerings, as well as the market for these products and offerings, continues to evolve, it is difficult for us to predict our future operating results. We expect our operating expenses to increase over the next several years as we hire additional personnel, expand and improve the effectiveness of our distribution channels, improve the performance and scalability of our technology architecture, and continue to develop features and functionality for our offerings. In addition, as a public company, we have incurred and will continue to incur significant legal, accounting and other operating expenses. If our revenues do not increase to offset these increases in our operating expenses, we may not be profitable in future periods. Our historical revenue growth has been inconsistent and should not be considered indicative of our future performance, particularly as our business model transitions. Further, in future periods, our revenue growth could slow, or our revenues could decline for a number of reasons, including slowing demand for our offerings, increasing competition, a decrease in the growth of our overall market, changes in our mix of revenues, or our failure, for any reason, to continue to capitalize on growth opportunities. Any failure by us to achieve, sustain or increase profitability on a consistent basis could cause the value of our common stock to decline.
Our cloud services, including Splunk Cloud, require costly and continual infrastructure investments, and market adoption of these cloud services could adversely affect our business.
A cloud-based model of software deployment is one in which a software provider typically licenses an application to customers for use as a service on demand through web browser technologies. Delivering software under a cloud-based model results in higher costs and expenses when compared to sales of software licenses for similar functionality. In recent years, companies have begun to expect that key software, such as customer relationship management and enterprise resource planning systems, be provided through a cloud-based model. Many of our offerings are now made available in the cloud as well as on-premises. Customers can sign up for our cloud services and avoid the need to provision, deploy and manage internal infrastructure. In order to provide our cloud services via a cloud-based deployment, we have made and will continue to make
17

FOR
M 1
0-K
• changes in the mix of our revenues between term licenses and cloud subscriptions, as well as the duration;
• the mix of revenues attributable to larger transactions as opposed to smaller transactions and the impact that a few large transactions or a change in mix may have on our overall financial results as well as the overall average selling price (“ASP”) of our offerings;
• the renewal and usage rates of our customers;
• changes in the competitive dynamics of our market;
• changes in customers’ budgets and in the timing of their purchasing decisions and in the length of sales cycles;
• changes in our pricing models and practices or those of our competitors;
• changes to our invoicing practices;
• customers delaying purchasing decisions in anticipation of new offerings or software enhancements by us or our competitors or for other reasons;
• customer acceptance of and willingness to pay for new versions of our offerings or new solutions for specific product and end markets;
• our ability to successfully introduce and monetize new offerings and licensing and service models for our new offerings;
• network outages or actual or perceived security breaches or incidents;
• the availability and performance of our cloud services, including Splunk Cloud;
• our ability to control costs, including our operating expenses;
• changes in laws and regulations that impact our business;
• general economic and political conditions and uncertainty, both domestically and internationally, as well as economic and political conditions and uncertainty specifically affecting industries in which our customers participate, including impacts from the COVID-19 pandemic;
• the amount and timing of our stock-based compensation expenses;
• changes in accounting standards, particularly those related to revenue recognition and sales commissions;
• use of estimates, judgments and assumptions under current accounting standards;
• the timing of satisfying revenue recognition criteria;
• our ability to qualify and successfully compete for government contracts; and
• the collectability of receivables from customers and resellers, which may be hindered or delayed, particularly as the COVID-19 pandemic continues.
Many of these factors are outside our control, and the variability and unpredictability of such factors could result in our failing to meet or exceed our financial expectations for a given period. We believe that quarter-to-quarter comparisons of our revenues, operating results and cash flows may not necessarily be indicative of our future performance.
If we fail to effectively manage our growth, our business and operating results could be adversely affected.
16
Although our business has experienced significant growth, we cannot provide any assurance that our business will continue to grow at the same rate or at all. We have experienced and expect to continue to experience growth in our headcount and operations, including from acquisitions, which has placed and will continue to place significant demands on our management and our operational and financial systems and infrastructure. As of January 31, 2021, approximately 24% of our workforce had been employed by us for less than one year. As we continue to grow, we must effectively integrate, develop and motivate a large number of new employees, while maintaining the effectiveness of our business execution and the beneficial aspects of our corporate culture and values, the challenges of which may be exacerbated due to remote working conditions associated with the COVID-19 pandemic. In particular, we intend to continue to make directed and substantial investments to expand our research and development, sales and marketing, and general and administrative organizations, as well as our international operations.
To effectively manage growth, we must continue to improve our operational, financial and management controls, and our reporting systems and procedures by, among other things:
• improving our key business applications, processes and IT infrastructure to support our business needs and appropriately documenting such systems and processes;
• enhancing information and communication systems to ensure that our employees and offices around the world are well-coordinated and can effectively communicate with each other and our growing base of customers and partners; and
• enhancing our internal controls to ensure timely and accurate reporting of all of our operations and financial results.
These systems enhancements and improvements will require significant capital expenditures and allocation of valuable management and employee resources. If we fail to implement these improvements effectively, our ability to manage our expected growth, ensure uninterrupted operation of key business systems and comply with the rules and regulations that are applicable to public reporting companies will be impaired. Additionally, if we do not effectively manage the growth of our business and operations, the quality of our offerings could suffer, which could negatively affect our brand, financial results and overall business.
We have a history of losses, and we may not be profitable in the future.
We have incurred net losses in each year since our inception. As a result, we had an accumulated deficit of $2.47 billion at January 31, 2021. Because our products and offerings, as well as the market for these products and offerings, continues to evolve, it is difficult for us to predict our future operating results. We expect our operating expenses to increase over the next several years as we hire additional personnel, expand and improve the effectiveness of our distribution channels, improve the performance and scalability of our technology architecture, and continue to develop features and functionality for our offerings. In addition, as a public company, we have incurred and will continue to incur significant legal, accounting and other operating expenses. If our revenues do not increase to offset these increases in our operating expenses, we may not be profitable in future periods. Our historical revenue growth has been inconsistent and should not be considered indicative of our future performance, particularly as our business model transitions. Further, in future periods, our revenue growth could slow, or our revenues could decline for a number of reasons, including slowing demand for our offerings, increasing competition, a decrease in the growth of our overall market, changes in our mix of revenues, or our failure, for any reason, to continue to capitalize on growth opportunities. Any failure by us to achieve, sustain or increase profitability on a consistent basis could cause the value of our common stock to decline.
Our cloud services, including Splunk Cloud, require costly and continual infrastructure investments, and market adoption of these cloud services could adversely affect our business.
A cloud-based model of software deployment is one in which a software provider typically licenses an application to customers for use as a service on demand through web browser technologies. Delivering software under a cloud-based model results in higher costs and expenses when compared to sales of software licenses for similar functionality. In recent years, companies have begun to expect that key software, such as customer relationship management and enterprise resource planning systems, be provided through a cloud-based model. Many of our offerings are now made available in the cloud as well as on-premises. Customers can sign up for our cloud services and avoid the need to provision, deploy and manage internal infrastructure. In order to provide our cloud services via a cloud-based deployment, we have made and will continue to make
17

capital investments and incur substantial costs to implement and maintain this alternative business model. In addition, as we look to deliver new or different cloud services, we are making significant technology investments to deliver new capabilities and advance our software to deliver cloud-native customer experiences. We expect that over time the percentage of our revenue attributable to our cloud services will continue to increase. If our cloud services, in particular Splunk Cloud, do not garner widespread market adoption, or there is a reduction in demand for cloud services caused by a lack of customer acceptance, technological challenges, weakening economic or political conditions, security or privacy concerns, inability to properly manage such services, competing technologies and products, decreases in corporate spending or otherwise, our financial results, business model and competitive position could suffer. If these investments do not yield the expected return, or we are unable to decrease the cost of providing our cloud services, our gross margins, overall financial results, business model and competitive position could suffer. Transitioning to a fully cloud-based model also impacts the way we recognize revenues, which may affect our operating results and could have an adverse effect on our business operations and financial results.
Even with these investments and costs, the cloud-based business model for our cloud services may not be successful, as some customers may desire only software licenses to our offerings. Our cloud services may raise concerns among customers, including concerns regarding changes to pricing models, service availability, scalability, ability to use customer-developed apps, information security of a cloud service and hosted data, and access to data while offline or once a subscription has expired. Market acceptance of our cloud services can be affected by a variety of factors, including but not limited to: security, reliability, performance, terms of service, support terms, customer preference, community engagement, customer concerns with entrusting a third party to store and manage their data, public concerns regarding data privacy or data protection, and the enactment of restrictive laws or regulations in the affected jurisdictions. If we or other providers of cloud services experience security incidents or breaches, loss of customer data, disruptions in delivery of services, network outages, disruptions in availability of the internet, unauthorized access or other problems, the market for cloud services as a whole, including Splunk Cloud, may be negatively affected. Moreover, sales of Splunk Cloud and other cloud services could displace sales of our software licenses. Alternatively, subscriptions to Splunk Cloud and other cloud services that exceed our expectations may unexpectedly increase our costs, lower our margins, lower our profits or increase our losses and otherwise negatively affect our projected financial results.
If we are unable to attract and retain leadership and key personnel, our business could be adversely affected.
We depend on the continued contributions of our leadership, senior management and other key personnel, the loss of whom could adversely affect our business. All of our executive officers and key employees are at-will employees, which means they may terminate their employment relationship with us at any time. We do not maintain a key-person life insurance policy on any of our officers or other employees.
Our future success also depends on our ability to identify, attract and retain highly skilled technical, managerial, finance and other personnel, particularly in our sales and marketing, research and development, general and administrative, and professional service departments. We face intense competition for qualified individuals from numerous software and other technology companies. We may incur significant costs to attract and retain these qualified individuals, and we may lose new employees to our competitors or other technology companies before we realize the benefit of our investment in recruiting and training them. As we move into new geographies, we will need to attract and recruit skilled personnel in those areas. If we are unable to attract and retain suitably qualified individuals who are capable of meeting our growing technical, operational and managerial requirements, on a timely basis or at all, our business will be adversely affected.
We continue to be substantially dependent on our sales force to effectively execute our sales strategies to obtain new customers and to drive additional use cases and adoption among our existing customers. We believe that there is significant competition for sales personnel with the skills and technical knowledge that we require, and further, the restrictions placed on recruiting, training and retention by the COVID-19 pandemic may further exacerbate our efforts to expand our sales force. Our ability to achieve significant revenue growth will depend, in large part, on our success in recruiting, training and retaining sufficient numbers of sales personnel to support our growth. In addition, as we continue to grow rapidly, a large percentage of our sales force is new to the company and our offerings. As our sales strategies evolve and offerings expand, additional training for new hires and our existing team may be required for our sales force to successfully execute on those strategies. We periodically adjust our sales organization and our compensation programs as part of our efforts to optimize our sales operations to grow revenue, drive incremental growth and support our business model transition. If we have not structured our sales organization or compensation for our sales personnel in a way that properly supports our company’s objectives, or if we fail to make changes in a timely fashion or do not effectively manage changes, our revenue growth could be adversely affected. Our growth creates additional challenges and risks with respect to attracting, integrating and retaining qualified employees, particularly sales personnel. If we are unable to hire and train sufficient numbers of effective sales personnel, or the sales personnel are not successful in obtaining new customers or increasing sales to our existing customer base, our business will be adversely affected.
18
Volatility or lack of performance in our stock price may also affect our ability to attract and retain our key employees. Many of our senior management personnel and other key employees have become, or will soon become, vested in a substantial amount of stock, restricted stock units or stock options. Employees may be more likely to leave us if the shares they own or the shares underlying their vested restricted stock units or options have significantly appreciated in value relative to the original purchase prices of the shares or the exercise prices of the options, or, conversely, if the exercise prices of the options that they hold are significantly above the market price of our common stock. If we are unable to retain our employees, or if we need to increase our compensation expenses to retain our employees, our business, results of operations, financial condition and cash flows would be adversely affected.
We have in the past made and may in the future make acquisitions that could prove difficult to integrate and/or adversely affect our business operations and financial results.
From time to time, we may choose to expand by making acquisitions that could be material to our business, results of operations, financial condition and cash flows. For example, we recently acquired several privately-owned companies, including, OÜ Plumbr, which offers auto-instrumentation, real user monitoring and application performance monitoring capabilities; Rigor, Inc. which offers advanced synthetic monitoring and optimization tools; Flowmill, Inc., a cloud network observability company; SignalFx, Inc., a SaaS provider of real-time monitoring and metrics for cloud infrastructure, microservices and applications; Omnition, which develops a platform for distributed tracing and application monitoring and Streamlio, Inc., which specializes in the design and operation of streaming data solutions. Our ability as an organization to successfully acquire and integrate technologies or businesses is unproven. Acquisitions involve many risks, including the following:
• an acquisition may negatively affect our financial results because it may require us to incur charges or assume substantial debt or other liabilities, may cause adverse tax consequences or unfavorable accounting treatment, may expose us to claims and disputes by third parties, including intellectual property claims and disputes, or may not generate sufficient financial return to offset additional costs and expenses related to the acquisition;
• we may incur potential goodwill impairment charges related to acquisitions;
• we may incur costs and experience potential difficulties associated with the requirement to test and assimilate the internal control processes of the acquired business;
• we may encounter difficulties or unforeseen expenditures in integrating the business, technologies, infrastructure, products, personnel or operations of any company that we acquire, particularly if key personnel of the acquired company decide not to work for us or if we are unable to retain key personnel;
• we may not realize the expected benefits of the acquisition;
• an acquisition may disrupt our ongoing business, divert resources, increase our expenses and distract our management;
• an acquisition may result in a delay or reduction of customer purchases for both us and the company acquired due to customer uncertainty about continuity and effectiveness of service from either company;
• relationships with existing customers, vendors and distributors as business partners may be impacted as a result of us acquiring another company or business that competes with or otherwise is incompatible with those existing relationships;
• our due diligence of an acquired company or business may not identify significant problems or liabilities, or we may underestimate the costs and effects of identified liabilities;
• we may be exposed to litigation or other claims in connection with, or inheritance of claims or litigation risk as a result of, an acquisition, including but not limited to claims from former employees, customers or other third parties, which may differ from or be more significant than the risks our business faces;
• we may encounter difficulties in, or may be unable to, successfully sell any acquired products;
19

FOR
M 1
0-K
capital investments and incur substantial costs to implement and maintain this alternative business model. In addition, as we look to deliver new or different cloud services, we are making significant technology investments to deliver new capabilities and advance our software to deliver cloud-native customer experiences. We expect that over time the percentage of our revenue attributable to our cloud services will continue to increase. If our cloud services, in particular Splunk Cloud, do not garner widespread market adoption, or there is a reduction in demand for cloud services caused by a lack of customer acceptance, technological challenges, weakening economic or political conditions, security or privacy concerns, inability to properly manage such services, competing technologies and products, decreases in corporate spending or otherwise, our financial results, business model and competitive position could suffer. If these investments do not yield the expected return, or we are unable to decrease the cost of providing our cloud services, our gross margins, overall financial results, business model and competitive position could suffer. Transitioning to a fully cloud-based model also impacts the way we recognize revenues, which may affect our operating results and could have an adverse effect on our business operations and financial results.
Even with these investments and costs, the cloud-based business model for our cloud services may not be successful, as some customers may desire only software licenses to our offerings. Our cloud services may raise concerns among customers, including concerns regarding changes to pricing models, service availability, scalability, ability to use customer-developed apps, information security of a cloud service and hosted data, and access to data while offline or once a subscription has expired. Market acceptance of our cloud services can be affected by a variety of factors, including but not limited to: security, reliability, performance, terms of service, support terms, customer preference, community engagement, customer concerns with entrusting a third party to store and manage their data, public concerns regarding data privacy or data protection, and the enactment of restrictive laws or regulations in the affected jurisdictions. If we or other providers of cloud services experience security incidents or breaches, loss of customer data, disruptions in delivery of services, network outages, disruptions in availability of the internet, unauthorized access or other problems, the market for cloud services as a whole, including Splunk Cloud, may be negatively affected. Moreover, sales of Splunk Cloud and other cloud services could displace sales of our software licenses. Alternatively, subscriptions to Splunk Cloud and other cloud services that exceed our expectations may unexpectedly increase our costs, lower our margins, lower our profits or increase our losses and otherwise negatively affect our projected financial results.
If we are unable to attract and retain leadership and key personnel, our business could be adversely affected.
We depend on the continued contributions of our leadership, senior management and other key personnel, the loss of whom could adversely affect our business. All of our executive officers and key employees are at-will employees, which means they may terminate their employment relationship with us at any time. We do not maintain a key-person life insurance policy on any of our officers or other employees.
Our future success also depends on our ability to identify, attract and retain highly skilled technical, managerial, finance and other personnel, particularly in our sales and marketing, research and development, general and administrative, and professional service departments. We face intense competition for qualified individuals from numerous software and other technology companies. We may incur significant costs to attract and retain these qualified individuals, and we may lose new employees to our competitors or other technology companies before we realize the benefit of our investment in recruiting and training them. As we move into new geographies, we will need to attract and recruit skilled personnel in those areas. If we are unable to attract and retain suitably qualified individuals who are capable of meeting our growing technical, operational and managerial requirements, on a timely basis or at all, our business will be adversely affected.
We continue to be substantially dependent on our sales force to effectively execute our sales strategies to obtain new customers and to drive additional use cases and adoption among our existing customers. We believe that there is significant competition for sales personnel with the skills and technical knowledge that we require, and further, the restrictions placed on recruiting, training and retention by the COVID-19 pandemic may further exacerbate our efforts to expand our sales force. Our ability to achieve significant revenue growth will depend, in large part, on our success in recruiting, training and retaining sufficient numbers of sales personnel to support our growth. In addition, as we continue to grow rapidly, a large percentage of our sales force is new to the company and our offerings. As our sales strategies evolve and offerings expand, additional training for new hires and our existing team may be required for our sales force to successfully execute on those strategies. We periodically adjust our sales organization and our compensation programs as part of our efforts to optimize our sales operations to grow revenue, drive incremental growth and support our business model transition. If we have not structured our sales organization or compensation for our sales personnel in a way that properly supports our company’s objectives, or if we fail to make changes in a timely fashion or do not effectively manage changes, our revenue growth could be adversely affected. Our growth creates additional challenges and risks with respect to attracting, integrating and retaining qualified employees, particularly sales personnel. If we are unable to hire and train sufficient numbers of effective sales personnel, or the sales personnel are not successful in obtaining new customers or increasing sales to our existing customer base, our business will be adversely affected.
18
Volatility or lack of performance in our stock price may also affect our ability to attract and retain our key employees. Many of our senior management personnel and other key employees have become, or will soon become, vested in a substantial amount of stock, restricted stock units or stock options. Employees may be more likely to leave us if the shares they own or the shares underlying their vested restricted stock units or options have significantly appreciated in value relative to the original purchase prices of the shares or the exercise prices of the options, or, conversely, if the exercise prices of the options that they hold are significantly above the market price of our common stock. If we are unable to retain our employees, or if we need to increase our compensation expenses to retain our employees, our business, results of operations, financial condition and cash flows would be adversely affected.
We have in the past made and may in the future make acquisitions that could prove difficult to integrate and/or adversely affect our business operations and financial results.
From time to time, we may choose to expand by making acquisitions that could be material to our business, results of operations, financial condition and cash flows. For example, we recently acquired several privately-owned companies, including, OÜ Plumbr, which offers auto-instrumentation, real user monitoring and application performance monitoring capabilities; Rigor, Inc. which offers advanced synthetic monitoring and optimization tools; Flowmill, Inc., a cloud network observability company; SignalFx, Inc., a SaaS provider of real-time monitoring and metrics for cloud infrastructure, microservices and applications; Omnition, which develops a platform for distributed tracing and application monitoring and Streamlio, Inc., which specializes in the design and operation of streaming data solutions. Our ability as an organization to successfully acquire and integrate technologies or businesses is unproven. Acquisitions involve many risks, including the following:
• an acquisition may negatively affect our financial results because it may require us to incur charges or assume substantial debt or other liabilities, may cause adverse tax consequences or unfavorable accounting treatment, may expose us to claims and disputes by third parties, including intellectual property claims and disputes, or may not generate sufficient financial return to offset additional costs and expenses related to the acquisition;
• we may incur potential goodwill impairment charges related to acquisitions;
• we may incur costs and experience potential difficulties associated with the requirement to test and assimilate the internal control processes of the acquired business;
• we may encounter difficulties or unforeseen expenditures in integrating the business, technologies, infrastructure, products, personnel or operations of any company that we acquire, particularly if key personnel of the acquired company decide not to work for us or if we are unable to retain key personnel;
• we may not realize the expected benefits of the acquisition;
• an acquisition may disrupt our ongoing business, divert resources, increase our expenses and distract our management;
• an acquisition may result in a delay or reduction of customer purchases for both us and the company acquired due to customer uncertainty about continuity and effectiveness of service from either company;
• relationships with existing customers, vendors and distributors as business partners may be impacted as a result of us acquiring another company or business that competes with or otherwise is incompatible with those existing relationships;
• our due diligence of an acquired company or business may not identify significant problems or liabilities, or we may underestimate the costs and effects of identified liabilities;
• we may be exposed to litigation or other claims in connection with, or inheritance of claims or litigation risk as a result of, an acquisition, including but not limited to claims from former employees, customers or other third parties, which may differ from or be more significant than the risks our business faces;
• we may encounter difficulties in, or may be unable to, successfully sell any acquired products;
19

• an acquisition may involve the entry into geographic or business markets in which we have little or no prior experience or where competitors have stronger market positions;
• an acquisition may require us to comply with additional laws and regulations, or to engage in substantial remediation efforts to cause the acquired company to comply with applicable laws or regulations, or result in liabilities resulting from the acquired company’s failure to comply with applicable laws or regulations;
• our use of cash to pay for an acquisition would limit other potential uses for our cash;
• if we incur debt to fund such acquisition, such debt may subject us to material restrictions on our ability to conduct our business as well as financial maintenance covenants; and
• to the extent that we issue a significant amount of equity securities in connection with future acquisitions, existing stockholders may be diluted and earnings per share may decrease.
The occurrence of any of these risks could have a material adverse effect on our business operations and financial results.
We may require additional capital to support business growth, and this capital might not be available on acceptable terms, if at all.
We intend to continue to make investments to support our business growth and may require additional funds to respond to business challenges, including the need to develop new features or enhance our offerings, improve our operating infrastructure or acquire complementary businesses and technologies. If the assumptions underlying our cash flow guidance are incorrect, for example, due to the unknown impacts of the COVID-19 pandemic or a more rapid transition in our business model than we expect, our business may not continue to generate cash flow from operations in the future sufficient to make planned capital expenditures. Accordingly, we have engaged in, and may need to engage in the future, in equity, equity-linked or debt financings to secure additional funds. The significant disruption of global financial markets due to the COVID-19 pandemic could reduce our ability to access capital, which could negatively affect our ability to secure these additional funds. If we raise additional funds through future issuances of equity or convertible debt securities, our existing stockholders could suffer significant dilution, and any new equity securities we issue could have rights, preferences and privileges superior to those of holders of our common stock. For example, if we elect to settle our conversion obligation under the Notes (as defined below) in shares of our common stock or a combination of cash and shares of our common stock, the issuance of such common stock may dilute the ownership interests of our stockholders and sales in the public market could adversely affect prevailing market prices. Any debt financing that we may secure in the future could involve restrictive covenants relating to our capital raising activities and other financial and operational matters, which may make it more difficult for us to obtain additional capital and to pursue business opportunities, including potential acquisitions, or otherwise reduce operational flexibility. We may not be able to obtain additional financing on terms favorable to us, if at all. If we are unable to obtain adequate financing or financing on terms satisfactory to us when we require it, our ability to continue to support our business growth and to respond to business challenges could be significantly impaired, and our business may be adversely affected.
Our ability to use our net operating losses and tax credits to offset future taxable income and tax may be subject to certain limitations.
Our unused net operating losses and tax credits generally carry forward to offset future taxable income and tax. We record an asset for these future tax benefits, with our U.S. federal and state benefits subject to a full valuation allowance. Federal, state and foreign taxing bodies often place limitations on net operating loss and tax credit carryforward benefits. As a result, we may not be able to utilize the net operating and tax credit assets reflected on our balance sheet, even if we attain profitability. Section 382 of the United States Internal Revenue Code of 1986 (the “Code”) is one such example of a limitation. A corporation that undergoes an ownership change is subject to limitations on its ability to utilize its pre-change net operating losses (“NOLs”) to offset future taxable income. Future changes in our stock ownership, some of which are outside of our control, could result in an ownership change under Section 382 of the Code. If our existing NOLs are subject to limitations arising from an ownership change, our ability to utilize NOLs could be limited by Section 382 of the Code, and a certain amount of our prior year NOLs could expire without benefit. Changes in the law may also impact our ability to use our net operating loss and tax credit carryforwards. For example, the legislation commonly referred to as the Tax Cuts and Jobs Act of 2017, as modified by the Coronavirus Aid, Relief, and Economic Security Act, modified certain limitations on the use of our federal NOLs, and California recently enacted legislation limiting the use of our state NOLs for taxable years 2020, 2021, and 2022.
20
Taxing authorities may successfully assert that we should have collected or in the future should collect sales and use, value added or similar taxes, and we could be subject to liability with respect to past or future sales, which could adversely affect our financial results.
We do not collect sales and use, value added and similar taxes in all jurisdictions in which we have sales, based on our belief that such taxes are not applicable. Certain jurisdictions in which we do not collect such taxes may successfully assert that such taxes are applicable or that our presence in such jurisdictions is sufficient to require us to collect taxes and that could result in tax assessments, penalties, interest and requirement to collect such taxes in the future. Such tax assessments, penalties, interest or future requirements to charge taxes to our customers may adversely affect our financial results.
The near and long-term impact of the global COVID-19 pandemic on our business, results of operations and cash flows remain uncertain.
In December 2019, COVID-19 was reported in China, in January 2020 the World Health Organization (“WHO”) declared it a Public Health Emergency of International Concern, and in March 2020 the WHO declared it a pandemic. This contagious disease has continued to spread across the globe and is materially and adversely impacting worldwide economic activity and financial markets.
The COVID-19 pandemic has affected how we and our customers and partners are operating our businesses, and the duration and extent to which this will impact our business, results of operations and cash flows is uncertain. Related to this uncertainty, certain customers have, and may in the future continue to, decrease or delay their information technology spending, purchase shorter term contracts or request payment concessions, any of which could result in decreased revenue and cash flows for us. We may experience customer losses, including due to bankruptcy or our customers ceasing operations, which may result in an inability to collect receivables from these customers. A decline in revenue or the collectability of our receivables would harm our business. In addition, the COVID-19 pandemic has disrupted and may continue to disrupt the operations of our customers and partners for an indefinite period of time, including as a result of local, state and federal government public health orders, travel restrictions and/or business shutdowns related to the continuance or resurgence of infection rates, all of which could negatively impact our business and results of operations, including cash flows. More generally, the COVID-19 pandemic has adversely affected economies and financial markets globally, and continued uncertainty could potentially lead to an economic downturn, which could decrease technology spending and adversely affect demand for our offerings and harm our business and results of operations.
The nature and extent of the impact of the COVID-19 pandemic on our customers and our customers’ response to the COVID-19 pandemic is difficult to assess or predict, and we may be unable to accurately forecast our revenues or financial results or other performance metrics, especially given that the near and long term impact of the pandemic remains uncertain. Our actual results could be materially above or below our forecasts, which could disappoint analysts and investors and/or cause our stock price to decline.
In light of the uncertain and rapidly evolving situation relating to the spread of COVID-19, we have taken precautionary measures intended to minimize the risk of the disease to our employees, our customers, and the communities in which we operate, which could negatively impact our business. Although we continue to monitor the situation and may adjust our current policies as more information and public health guidance become available, precautionary measures that have been adopted could negatively affect our customer success efforts, employee productivity, sales and marketing efforts, delay and lengthen our sales cycles, or create operational or other challenges, including as a result of travel restrictions, any of which could harm our business and results of operations. Additionally, with so many of our employees now working remotely, we are at increased risk of cyber security-related breaches. We continue to take steps to monitor and enhance the security of our systems, IT infrastructure, networks, and data; however, the unprecedented scale of remote work may require additional personnel and resources, which nevertheless cannot be guaranteed to fully safeguard all systems, IT infrastructure networks, and data upon which we rely.
It is not possible at this time to estimate the impact that the COVID-19 pandemic could have on our business, as the impact will depend on future developments, including the duration, spread, severity, and potential recurrence of a COVID-19 pandemic, which are highly uncertain and cannot be predicted. Furthermore, due to our shift to a subscription model, the effect of the COVID-19 pandemic may not be fully reflected in our results of operations until future periods.
21

FOR
M 1
0-K
• an acquisition may involve the entry into geographic or business markets in which we have little or no prior experience or where competitors have stronger market positions;
• an acquisition may require us to comply with additional laws and regulations, or to engage in substantial remediation efforts to cause the acquired company to comply with applicable laws or regulations, or result in liabilities resulting from the acquired company’s failure to comply with applicable laws or regulations;
• our use of cash to pay for an acquisition would limit other potential uses for our cash;
• if we incur debt to fund such acquisition, such debt may subject us to material restrictions on our ability to conduct our business as well as financial maintenance covenants; and
• to the extent that we issue a significant amount of equity securities in connection with future acquisitions, existing stockholders may be diluted and earnings per share may decrease.
The occurrence of any of these risks could have a material adverse effect on our business operations and financial results.
We may require additional capital to support business growth, and this capital might not be available on acceptable terms, if at all.
We intend to continue to make investments to support our business growth and may require additional funds to respond to business challenges, including the need to develop new features or enhance our offerings, improve our operating infrastructure or acquire complementary businesses and technologies. If the assumptions underlying our cash flow guidance are incorrect, for example, due to the unknown impacts of the COVID-19 pandemic or a more rapid transition in our business model than we expect, our business may not continue to generate cash flow from operations in the future sufficient to make planned capital expenditures. Accordingly, we have engaged in, and may need to engage in the future, in equity, equity-linked or debt financings to secure additional funds. The significant disruption of global financial markets due to the COVID-19 pandemic could reduce our ability to access capital, which could negatively affect our ability to secure these additional funds. If we raise additional funds through future issuances of equity or convertible debt securities, our existing stockholders could suffer significant dilution, and any new equity securities we issue could have rights, preferences and privileges superior to those of holders of our common stock. For example, if we elect to settle our conversion obligation under the Notes (as defined below) in shares of our common stock or a combination of cash and shares of our common stock, the issuance of such common stock may dilute the ownership interests of our stockholders and sales in the public market could adversely affect prevailing market prices. Any debt financing that we may secure in the future could involve restrictive covenants relating to our capital raising activities and other financial and operational matters, which may make it more difficult for us to obtain additional capital and to pursue business opportunities, including potential acquisitions, or otherwise reduce operational flexibility. We may not be able to obtain additional financing on terms favorable to us, if at all. If we are unable to obtain adequate financing or financing on terms satisfactory to us when we require it, our ability to continue to support our business growth and to respond to business challenges could be significantly impaired, and our business may be adversely affected.
Our ability to use our net operating losses and tax credits to offset future taxable income and tax may be subject to certain limitations.
Our unused net operating losses and tax credits generally carry forward to offset future taxable income and tax. We record an asset for these future tax benefits, with our U.S. federal and state benefits subject to a full valuation allowance. Federal, state and foreign taxing bodies often place limitations on net operating loss and tax credit carryforward benefits. As a result, we may not be able to utilize the net operating and tax credit assets reflected on our balance sheet, even if we attain profitability. Section 382 of the United States Internal Revenue Code of 1986 (the “Code”) is one such example of a limitation. A corporation that undergoes an ownership change is subject to limitations on its ability to utilize its pre-change net operating losses (“NOLs”) to offset future taxable income. Future changes in our stock ownership, some of which are outside of our control, could result in an ownership change under Section 382 of the Code. If our existing NOLs are subject to limitations arising from an ownership change, our ability to utilize NOLs could be limited by Section 382 of the Code, and a certain amount of our prior year NOLs could expire without benefit. Changes in the law may also impact our ability to use our net operating loss and tax credit carryforwards. For example, the legislation commonly referred to as the Tax Cuts and Jobs Act of 2017, as modified by the Coronavirus Aid, Relief, and Economic Security Act, modified certain limitations on the use of our federal NOLs, and California recently enacted legislation limiting the use of our state NOLs for taxable years 2020, 2021, and 2022.
20
Taxing authorities may successfully assert that we should have collected or in the future should collect sales and use, value added or similar taxes, and we could be subject to liability with respect to past or future sales, which could adversely affect our financial results.
We do not collect sales and use, value added and similar taxes in all jurisdictions in which we have sales, based on our belief that such taxes are not applicable. Certain jurisdictions in which we do not collect such taxes may successfully assert that such taxes are applicable or that our presence in such jurisdictions is sufficient to require us to collect taxes and that could result in tax assessments, penalties, interest and requirement to collect such taxes in the future. Such tax assessments, penalties, interest or future requirements to charge taxes to our customers may adversely affect our financial results.
The near and long-term impact of the global COVID-19 pandemic on our business, results of operations and cash flows remain uncertain.
In December 2019, COVID-19 was reported in China, in January 2020 the World Health Organization (“WHO”) declared it a Public Health Emergency of International Concern, and in March 2020 the WHO declared it a pandemic. This contagious disease has continued to spread across the globe and is materially and adversely impacting worldwide economic activity and financial markets.
The COVID-19 pandemic has affected how we and our customers and partners are operating our businesses, and the duration and extent to which this will impact our business, results of operations and cash flows is uncertain. Related to this uncertainty, certain customers have, and may in the future continue to, decrease or delay their information technology spending, purchase shorter term contracts or request payment concessions, any of which could result in decreased revenue and cash flows for us. We may experience customer losses, including due to bankruptcy or our customers ceasing operations, which may result in an inability to collect receivables from these customers. A decline in revenue or the collectability of our receivables would harm our business. In addition, the COVID-19 pandemic has disrupted and may continue to disrupt the operations of our customers and partners for an indefinite period of time, including as a result of local, state and federal government public health orders, travel restrictions and/or business shutdowns related to the continuance or resurgence of infection rates, all of which could negatively impact our business and results of operations, including cash flows. More generally, the COVID-19 pandemic has adversely affected economies and financial markets globally, and continued uncertainty could potentially lead to an economic downturn, which could decrease technology spending and adversely affect demand for our offerings and harm our business and results of operations.
The nature and extent of the impact of the COVID-19 pandemic on our customers and our customers’ response to the COVID-19 pandemic is difficult to assess or predict, and we may be unable to accurately forecast our revenues or financial results or other performance metrics, especially given that the near and long term impact of the pandemic remains uncertain. Our actual results could be materially above or below our forecasts, which could disappoint analysts and investors and/or cause our stock price to decline.
In light of the uncertain and rapidly evolving situation relating to the spread of COVID-19, we have taken precautionary measures intended to minimize the risk of the disease to our employees, our customers, and the communities in which we operate, which could negatively impact our business. Although we continue to monitor the situation and may adjust our current policies as more information and public health guidance become available, precautionary measures that have been adopted could negatively affect our customer success efforts, employee productivity, sales and marketing efforts, delay and lengthen our sales cycles, or create operational or other challenges, including as a result of travel restrictions, any of which could harm our business and results of operations. Additionally, with so many of our employees now working remotely, we are at increased risk of cyber security-related breaches. We continue to take steps to monitor and enhance the security of our systems, IT infrastructure, networks, and data; however, the unprecedented scale of remote work may require additional personnel and resources, which nevertheless cannot be guaranteed to fully safeguard all systems, IT infrastructure networks, and data upon which we rely.
It is not possible at this time to estimate the impact that the COVID-19 pandemic could have on our business, as the impact will depend on future developments, including the duration, spread, severity, and potential recurrence of a COVID-19 pandemic, which are highly uncertain and cannot be predicted. Furthermore, due to our shift to a subscription model, the effect of the COVID-19 pandemic may not be fully reflected in our results of operations until future periods.
21

We face intense competition in our markets, and we may be unable to compete effectively against our current and future competitors.
Although our offerings target the new and emerging market for software and cloud services that deliver real-time business insights from data, we compete against a variety of large cloud service providers and software vendors, as well as smaller specialized companies, open source projects and custom development efforts, which provide solutions in the specific markets we address. Our principal competitors include:
• Cloud monitoring and APM/Observability vendors;
• Monitoring, troubleshooting, security and analytics services offered (embedded or add-ons) by major public cloud service providers;
• Companies targeting the data analytics industry;
• Legacy security, systems management and other IT vendors; and
• IT departments that undertake custom software development efforts to analyze and manage their operations data across their public and private cloud landscapes.
The principal competitive factors in our markets include features, performance and support, scalability and flexibility, ease of deployment and use, total cost of ownership and time to value. Some of our current and potential competitors have advantages over us, such as longer operating histories, significantly greater financial, technical, marketing or other resources, stronger brand and business user recognition, larger intellectual property portfolios, broader global distribution networks and presence and more developed ecosystems of partners and skilled users. Further, competitors may be able to offer products or functionality similar to ours at a more attractive price than we can, such as by integrating or bundling their software products with their other product offerings. In addition, our industry is evolving rapidly and is becoming increasingly competitive. Larger and more established companies may focus on delivering real-time business insights from data and could directly compete with us. For example, companies may commercialize open source software in a manner that competes with our offerings or causes potential customers to believe that such product and our offerings perform the same function. If companies move a greater proportion of their data and computational needs to the cloud, new competitors may emerge that offer services comparable to ours or that are better suited for cloud-based data, and the demand for our offerings may decrease. Smaller companies could also launch new products and services that we do not offer and that could gain market acceptance quickly.
In recent years, there have been significant acquisitions and consolidation by and among our competitors. We anticipate this trend of consolidation will continue, which will present heightened competitive challenges to our business. In particular, consolidation in our industry increases the likelihood of our competitors offering bundled or integrated products, and we believe that it may increase the competitive pressures we face with respect to our offerings. If we are unable to differentiate our offerings from the integrated or bundled products of our competitors, such as by offering enhanced functionality, performance or value, we may see decreased demand for those offerings, which would adversely affect our business operations, financial results and growth prospects. Further, it is possible that continued industry consolidation may impact customers’ perceptions of the viability of smaller or even medium-sized software firms and consequently their willingness to use software solutions from such firms. Similarly, if customers seek to concentrate their software license purchases in the product portfolios of a few large providers, we may be at a competitive disadvantage regardless of the performance and features of our offerings. We believe that in order to remain competitive at the large enterprise level, we will need to develop and expand relationships with resellers and large system integrators that provide a broad range of products and services. If we are unable to anticipate competitive challenges or compete effectively, our business operations and financial results could be materially and adversely affected.
If our new and existing offerings and product enhancements do not achieve sufficient market acceptance, our financial results and competitive position will suffer.
Our business substantially depends on, and we expect our business to continue to substantially depend on, sales of licenses, maintenance and services related to Splunk Enterprise and sales of subscriptions related to Splunk Cloud. As such, the market acceptance of Splunk Enterprise and Splunk Cloud is critical to our continued success. Demand for Splunk Enterprise and Splunk Cloud are affected by a number of factors beyond our control, including continued market acceptance of Splunk Enterprise and Splunk Cloud by referenceable accounts for existing and new use cases, the timing of development and release of new products by our competitors, technological change, and growth or contraction in our market and the economy in general.
22
If we are unable to continue to meet customer demands or to achieve more widespread market acceptance of Splunk Enterprise and Splunk Cloud, our business operations, financial results and growth prospects will be materially and adversely affected.
We spend substantial amounts of time and money to research and develop or acquire new offerings and enhanced versions of our existing offerings to incorporate additional features, improve functionality or other enhancements in order to meet our customers’ rapidly evolving demands. In addition, we continue to invest in solutions that can be deployed on top of our platform to target specific use cases and to cultivate our community of application developers and users. When we develop a new or enhanced version of an existing offering, we typically incur expenses and expend resources upfront to market, promote and sell the new offering. Therefore, when we develop or acquire new or enhanced offerings, their introduction must achieve high levels of market acceptance in order to justify the amount of our investment in developing and bringing them to market. For example, if our recent product expansions and offerings, such as in Splunk Observability Suite, do not garner widespread market adoption and implementation, our financial results and competitive position could suffer.
Further, we may make changes to our offerings that our customers do not like, find useful or agree with. We may also discontinue certain features, begin to charge for certain features that are currently free or increase fees for any of our features or usage of our offerings.
Our new and existing offerings or product enhancements and changes to our existing offerings could fail to attain sufficient market acceptance for many reasons, including:
• our failure to predict market demand accurately in terms of product functionality and to supply offerings that meet this demand in a timely fashion;
• real or perceived defects, errors or failures;
• negative publicity about their performance or effectiveness;
• delays in releasing to the market our new offerings or enhancements to our existing offerings to the market;
• introduction or anticipated introduction of competing products by our competitors;
• inability to scale and perform to meet customer demands;
• poor business conditions for our end-customers, causing them to delay IT purchases; and
• reluctance of customers to purchase products incorporating open source software.
If our new or existing offerings or enhancements and changes do not achieve adequate acceptance in the market, our competitive position will be impaired, and our revenue, business and financial results will be negatively impacted. The adverse effect on our financial results may be particularly acute because of the significant research, development, marketing, sales and other expenses we will have incurred in connection with the new offerings or enhancements.
Prolonged economic uncertainties or downturns could materially adversely affect our business.
Prolonged economic uncertainties or downturns could adversely affect our business operations or financial results. Negative conditions in the general economy in either the United States or abroad, including conditions resulting from financial and credit market fluctuations, changes in economic policy, trade uncertainty, including changes in tariffs, sanctions, international treaties, and other trade restrictions, the occurrence of a natural disaster, outbreaks of pandemic diseases such as COVID-19, political unrest and social strife, armed conflicts and an act of terrorism on the United States, Europe, Asia Pacific or elsewhere, have caused and could continue to cause a decrease in corporate spending on enterprise software in general and negatively affect the rate of growth of our business.
These conditions could make it extremely difficult for our customers and us to forecast and plan future business activities accurately, and they could cause our customers to reevaluate their decision to purchase our offerings, which could delay and lengthen our sales cycles or result in cancellations of planned purchases. Furthermore, during challenging economic times our customers may face issues in gaining timely access to sufficient credit, which could result in an impairment of their ability to make timely payments to us. If that were to occur, we may be required to increase our allowance for doubtful accounts, which would adversely affect our financial results.
23

FOR
M 1
0-K
We face intense competition in our markets, and we may be unable to compete effectively against our current and future competitors.
Although our offerings target the new and emerging market for software and cloud services that deliver real-time business insights from data, we compete against a variety of large cloud service providers and software vendors, as well as smaller specialized companies, open source projects and custom development efforts, which provide solutions in the specific markets we address. Our principal competitors include:
• Cloud monitoring and APM/Observability vendors;
• Monitoring, troubleshooting, security and analytics services offered (embedded or add-ons) by major public cloud service providers;
• Companies targeting the data analytics industry;
• Legacy security, systems management and other IT vendors; and
• IT departments that undertake custom software development efforts to analyze and manage their operations data across their public and private cloud landscapes.
The principal competitive factors in our markets include features, performance and support, scalability and flexibility, ease of deployment and use, total cost of ownership and time to value. Some of our current and potential competitors have advantages over us, such as longer operating histories, significantly greater financial, technical, marketing or other resources, stronger brand and business user recognition, larger intellectual property portfolios, broader global distribution networks and presence and more developed ecosystems of partners and skilled users. Further, competitors may be able to offer products or functionality similar to ours at a more attractive price than we can, such as by integrating or bundling their software products with their other product offerings. In addition, our industry is evolving rapidly and is becoming increasingly competitive. Larger and more established companies may focus on delivering real-time business insights from data and could directly compete with us. For example, companies may commercialize open source software in a manner that competes with our offerings or causes potential customers to believe that such product and our offerings perform the same function. If companies move a greater proportion of their data and computational needs to the cloud, new competitors may emerge that offer services comparable to ours or that are better suited for cloud-based data, and the demand for our offerings may decrease. Smaller companies could also launch new products and services that we do not offer and that could gain market acceptance quickly.
In recent years, there have been significant acquisitions and consolidation by and among our competitors. We anticipate this trend of consolidation will continue, which will present heightened competitive challenges to our business. In particular, consolidation in our industry increases the likelihood of our competitors offering bundled or integrated products, and we believe that it may increase the competitive pressures we face with respect to our offerings. If we are unable to differentiate our offerings from the integrated or bundled products of our competitors, such as by offering enhanced functionality, performance or value, we may see decreased demand for those offerings, which would adversely affect our business operations, financial results and growth prospects. Further, it is possible that continued industry consolidation may impact customers’ perceptions of the viability of smaller or even medium-sized software firms and consequently their willingness to use software solutions from such firms. Similarly, if customers seek to concentrate their software license purchases in the product portfolios of a few large providers, we may be at a competitive disadvantage regardless of the performance and features of our offerings. We believe that in order to remain competitive at the large enterprise level, we will need to develop and expand relationships with resellers and large system integrators that provide a broad range of products and services. If we are unable to anticipate competitive challenges or compete effectively, our business operations and financial results could be materially and adversely affected.
If our new and existing offerings and product enhancements do not achieve sufficient market acceptance, our financial results and competitive position will suffer.
Our business substantially depends on, and we expect our business to continue to substantially depend on, sales of licenses, maintenance and services related to Splunk Enterprise and sales of subscriptions related to Splunk Cloud. As such, the market acceptance of Splunk Enterprise and Splunk Cloud is critical to our continued success. Demand for Splunk Enterprise and Splunk Cloud are affected by a number of factors beyond our control, including continued market acceptance of Splunk Enterprise and Splunk Cloud by referenceable accounts for existing and new use cases, the timing of development and release of new products by our competitors, technological change, and growth or contraction in our market and the economy in general.
22
If we are unable to continue to meet customer demands or to achieve more widespread market acceptance of Splunk Enterprise and Splunk Cloud, our business operations, financial results and growth prospects will be materially and adversely affected.
We spend substantial amounts of time and money to research and develop or acquire new offerings and enhanced versions of our existing offerings to incorporate additional features, improve functionality or other enhancements in order to meet our customers’ rapidly evolving demands. In addition, we continue to invest in solutions that can be deployed on top of our platform to target specific use cases and to cultivate our community of application developers and users. When we develop a new or enhanced version of an existing offering, we typically incur expenses and expend resources upfront to market, promote and sell the new offering. Therefore, when we develop or acquire new or enhanced offerings, their introduction must achieve high levels of market acceptance in order to justify the amount of our investment in developing and bringing them to market. For example, if our recent product expansions and offerings, such as in Splunk Observability Suite, do not garner widespread market adoption and implementation, our financial results and competitive position could suffer.
Further, we may make changes to our offerings that our customers do not like, find useful or agree with. We may also discontinue certain features, begin to charge for certain features that are currently free or increase fees for any of our features or usage of our offerings.
Our new and existing offerings or product enhancements and changes to our existing offerings could fail to attain sufficient market acceptance for many reasons, including:
• our failure to predict market demand accurately in terms of product functionality and to supply offerings that meet this demand in a timely fashion;
• real or perceived defects, errors or failures;
• negative publicity about their performance or effectiveness;
• delays in releasing to the market our new offerings or enhancements to our existing offerings to the market;
• introduction or anticipated introduction of competing products by our competitors;
• inability to scale and perform to meet customer demands;
• poor business conditions for our end-customers, causing them to delay IT purchases; and
• reluctance of customers to purchase products incorporating open source software.
If our new or existing offerings or enhancements and changes do not achieve adequate acceptance in the market, our competitive position will be impaired, and our revenue, business and financial results will be negatively impacted. The adverse effect on our financial results may be particularly acute because of the significant research, development, marketing, sales and other expenses we will have incurred in connection with the new offerings or enhancements.
Prolonged economic uncertainties or downturns could materially adversely affect our business.
Prolonged economic uncertainties or downturns could adversely affect our business operations or financial results. Negative conditions in the general economy in either the United States or abroad, including conditions resulting from financial and credit market fluctuations, changes in economic policy, trade uncertainty, including changes in tariffs, sanctions, international treaties, and other trade restrictions, the occurrence of a natural disaster, outbreaks of pandemic diseases such as COVID-19, political unrest and social strife, armed conflicts and an act of terrorism on the United States, Europe, Asia Pacific or elsewhere, have caused and could continue to cause a decrease in corporate spending on enterprise software in general and negatively affect the rate of growth of our business.
These conditions could make it extremely difficult for our customers and us to forecast and plan future business activities accurately, and they could cause our customers to reevaluate their decision to purchase our offerings, which could delay and lengthen our sales cycles or result in cancellations of planned purchases. Furthermore, during challenging economic times our customers may face issues in gaining timely access to sufficient credit, which could result in an impairment of their ability to make timely payments to us. If that were to occur, we may be required to increase our allowance for doubtful accounts, which would adversely affect our financial results.
23

We have a significant number of customers in the business services, energy, financial services, healthcare and pharmaceuticals, technology, manufacturing, media and entertainment, online services, retail, telecommunications and travel and transportation industries. A substantial downturn in any of these industries may cause firms to react to worsening conditions by reducing their capital expenditures in general or by specifically reducing their spending on information technology. Customers in these industries may delay or cancel information technology projects or seek to lower their costs by renegotiating vendor contracts. For example, the impact of the COVID-19 pandemic on the current economic environment has caused, and may in the future cause, customers to request concessions including extended payment terms or better pricing. To the extent purchases of our offerings are perceived by customers and potential customers to be discretionary, our revenues may be disproportionately affected by delays or reductions in general information technology spending. Also, customers may choose to develop in-house software as an alternative to using our offerings. Moreover, competitors may respond to market conditions by lowering prices and attempting to lure away our customers. In addition, the increased pace of consolidation in certain industries may result in reduced overall spending on our offerings.
We cannot predict the timing, strength or duration of any economic slowdown, instability or recovery, generally or within any particular industry or geography. If the economic conditions of the general economy or industries in which we operate worsen from present levels, our business operations and financial results could be adversely affected.
We are subject to governmental export and import controls that could impair our ability to compete in international markets or subject us to liability if we violate the controls.
Our offerings are subject to United States export controls, and we incorporate encryption technology into certain of our offerings. These encryption offerings and the underlying technology may be exported outside of the United States only with the required export authorizations, including by license.
Furthermore, our activities are subject to the U.S. economic sanctions laws and regulations that prohibit the shipment of certain products and services without the required export authorizations or export to countries, governments, and persons targeted by U.S. sanctions. While we take precautions to prevent our offerings from being exported in violation of these laws, including obtaining authorizations for our encryption offerings where appropriate, implementing IP address blocking and screenings against U.S. Government and international lists of restricted and prohibited persons, we cannot guarantee that the precautions we take will prevent violations of export control and sanctions laws. For example, downloads of our free software may have in the past been made in potential violation of the export control and economic sanctions laws.
We also note that if our partners fail to obtain appropriate import, export or re-export licenses or permits, we may also be adversely affected, through reputational harm as well as other negative consequences including government investigations and penalties. We presently incorporate export control compliance requirements in our partner and customer agreements. Complying with export control and sanctions regulations for a particular sale may be time-consuming and may result in the delay or loss of sales opportunities.
Violations of U.S. sanctions or export control laws can result in fines or penalties, including civil penalties of up to $300,000 or twice the value of the transaction, whichever is greater, per violation. In the event of criminal knowing and willful violations of these laws, fines of up to $1 million per violation and possible incarceration for responsible employees and managers could be imposed.
From time to time, as part of our acquisition activity, we have discovered a limited number of instances where certain activity raised concerns about potential violations of U.S. sanctions or export control laws. For example, we previously discovered that the SaaS platform or product of an acquired company was accessed (or attempted to be accessed) from IP addresses potentially located in embargoed countries. As a result, we have submitted and may, in the future, submit voluntary disclosures with the U.S. Treasury Department’s Office of Foreign Assets Control (“OFAC”) to alert the agency to these types of potential violations. If we (including the companies we acquire) are found to be in violation of U.S. economic sanctions or export control laws, it could result in fines and penalties. We may also be adversely affected through other penalties, reputational harm, loss of access to certain markets or otherwise.
Also, various countries, in addition to the United States, regulate the import and export of certain encryption and other technology, including import and export permitting and licensing requirements, and have enacted laws that could limit our ability to distribute our offerings or could limit our customers’ ability to implement our offerings in those countries. Changes in our offerings or future changes in export and import regulations may create delays in the introduction of our offerings in international markets, prevent our customers with international operations from deploying our offerings globally or, in some
24
cases, prevent the export or import of our offerings to certain countries, governments, or persons altogether. Any change in export or import regulations, economic sanctions or related legislation, or change in the countries, governments, persons or technologies targeted by such regulations, could result in decreased use of our offerings by, or in our decreased ability to export or sell our offerings to, existing or potential customers with international operations. Any decreased use of our offerings or limitation on our ability to export or sell our offerings would likely adversely affect our business operations and financial results.
If customers do not expand their use of our offerings beyond the current predominant use cases, our ability to grow our business and operating results may be adversely affected.
Most of our customers currently use our offerings to support application management, IT operations, security and compliance functions. Our ability to grow our business depends in part on our ability to help enable current and future customers to increase their use of our offerings for their existing use cases and expand their use of our offerings to additional use cases, such as facilities management, supply chain management, business analytics, IoT and customer analytics. If we fail to achieve market acceptance of our offerings for these applications, if we fail to predict demand for product functionality or respond to such demand in a timely fashion, if our customers are not satisfied with our offerings, or if a competitor establishes a more widely adopted solution for these applications, our ability to grow our business and financial results will be adversely affected.
Our business and growth depend substantially on customers entering into, renewing, upgrading and expanding their term licenses, agreements for cloud services and maintenance and support agreements with us. Any decline in our customer renewals, upgrades or expansions could adversely affect our future operating results.
We typically enter into term-based agreements for our licensed software offerings, cloud services, and maintenance and support services, which customers have discretion to renew or terminate at the end of the initial term. In order for us to improve our operating results, it is important that new customers enter into renewable agreements, and our existing customers renew, upgrade and expand their term-based agreements when the initial contract term expires. Our customers have no obligation to renew, upgrade or expand their agreements with us after the terms have expired. Our customers’ renewal, upgrade and expansion rates may decline or fluctuate as a result of a number of factors, including their satisfaction or dissatisfaction with our offerings, our pricing, the effects of general economic conditions, competitive offerings or alterations or reductions in our customers’ spending levels. For example, the impact of the COVID-19 pandemic on the current economic environment has caused, and may in the future cause, customers to request concessions such as extended payment terms or better pricing or be unwilling to commit to long-term contracts. If our customers do not renew, upgrade or expand their agreements with us or renew on terms less favorable to us, our revenues may decline.
We employ multiple and evolving pricing models, which subject us to various pricing and licensing challenges that could make it difficult for us to derive value from our customers and may adversely affect our operating results.
We employ multiple and evolving pricing models for our offerings. For example, we generally charge our customers for their use of Splunk Enterprise based on either the estimated daily data indexing capacity or compute resources our customers require. In addition, Splunk Cloud is generally priced based on either the volume of data indexed per day including a fixed amount of data storage, or purchased infrastructure, data storage and bandwidth our customers require, while Splunk Phantom and Splunk On-Call are priced by the number of seats or events used for the products. We offer term licensing options for software offerings and have some remaining perpetual licenses with existing customers, which each have different payment schedules, and depending on the mix of such licenses and cloud subscriptions, our revenues or deferred revenues could be adversely affected. Our pricing models may ultimately result in a higher total cost to our customers generally as data volumes increase over time, or may cause our customers to limit or decrease usage in order to stay within the limits of their existing licenses or cloud subscriptions, or lower their costs, making it more difficult for us to compete in our markets or negatively impacting our financial results. As the amount of data within our customers’ organizations grows, we face downward pressure from our customers regarding our pricing, which could adversely affect our revenues and operating margins. In addition, our pricing models may allow competitors with different pricing models to attract customers unfamiliar or uncomfortable with our pricing models, which would cause us to lose business or modify our pricing models, both of which could adversely affect our revenues and operating margins. We have introduced and expect to continue to introduce variations to our pricing models, including but not limited to, predictive pricing programs, workload-based pricing, data ingestion pricing, “rapid adoption” packages and other pricing programs that provide broader usage and cost predictability as well as tiered pricing based on deployment models, data source types, compute and storage units and customer environments. Any change in pricing models
25

FOR
M 1
0-K
We have a significant number of customers in the business services, energy, financial services, healthcare and pharmaceuticals, technology, manufacturing, media and entertainment, online services, retail, telecommunications and travel and transportation industries. A substantial downturn in any of these industries may cause firms to react to worsening conditions by reducing their capital expenditures in general or by specifically reducing their spending on information technology. Customers in these industries may delay or cancel information technology projects or seek to lower their costs by renegotiating vendor contracts. For example, the impact of the COVID-19 pandemic on the current economic environment has caused, and may in the future cause, customers to request concessions including extended payment terms or better pricing. To the extent purchases of our offerings are perceived by customers and potential customers to be discretionary, our revenues may be disproportionately affected by delays or reductions in general information technology spending. Also, customers may choose to develop in-house software as an alternative to using our offerings. Moreover, competitors may respond to market conditions by lowering prices and attempting to lure away our customers. In addition, the increased pace of consolidation in certain industries may result in reduced overall spending on our offerings.
We cannot predict the timing, strength or duration of any economic slowdown, instability or recovery, generally or within any particular industry or geography. If the economic conditions of the general economy or industries in which we operate worsen from present levels, our business operations and financial results could be adversely affected.
We are subject to governmental export and import controls that could impair our ability to compete in international markets or subject us to liability if we violate the controls.
Our offerings are subject to United States export controls, and we incorporate encryption technology into certain of our offerings. These encryption offerings and the underlying technology may be exported outside of the United States only with the required export authorizations, including by license.
Furthermore, our activities are subject to the U.S. economic sanctions laws and regulations that prohibit the shipment of certain products and services without the required export authorizations or export to countries, governments, and persons targeted by U.S. sanctions. While we take precautions to prevent our offerings from being exported in violation of these laws, including obtaining authorizations for our encryption offerings where appropriate, implementing IP address blocking and screenings against U.S. Government and international lists of restricted and prohibited persons, we cannot guarantee that the precautions we take will prevent violations of export control and sanctions laws. For example, downloads of our free software may have in the past been made in potential violation of the export control and economic sanctions laws.
We also note that if our partners fail to obtain appropriate import, export or re-export licenses or permits, we may also be adversely affected, through reputational harm as well as other negative consequences including government investigations and penalties. We presently incorporate export control compliance requirements in our partner and customer agreements. Complying with export control and sanctions regulations for a particular sale may be time-consuming and may result in the delay or loss of sales opportunities.
Violations of U.S. sanctions or export control laws can result in fines or penalties, including civil penalties of up to $300,000 or twice the value of the transaction, whichever is greater, per violation. In the event of criminal knowing and willful violations of these laws, fines of up to $1 million per violation and possible incarceration for responsible employees and managers could be imposed.
From time to time, as part of our acquisition activity, we have discovered a limited number of instances where certain activity raised concerns about potential violations of U.S. sanctions or export control laws. For example, we previously discovered that the SaaS platform or product of an acquired company was accessed (or attempted to be accessed) from IP addresses potentially located in embargoed countries. As a result, we have submitted and may, in the future, submit voluntary disclosures with the U.S. Treasury Department’s Office of Foreign Assets Control (“OFAC”) to alert the agency to these types of potential violations. If we (including the companies we acquire) are found to be in violation of U.S. economic sanctions or export control laws, it could result in fines and penalties. We may also be adversely affected through other penalties, reputational harm, loss of access to certain markets or otherwise.
Also, various countries, in addition to the United States, regulate the import and export of certain encryption and other technology, including import and export permitting and licensing requirements, and have enacted laws that could limit our ability to distribute our offerings or could limit our customers’ ability to implement our offerings in those countries. Changes in our offerings or future changes in export and import regulations may create delays in the introduction of our offerings in international markets, prevent our customers with international operations from deploying our offerings globally or, in some
24
cases, prevent the export or import of our offerings to certain countries, governments, or persons altogether. Any change in export or import regulations, economic sanctions or related legislation, or change in the countries, governments, persons or technologies targeted by such regulations, could result in decreased use of our offerings by, or in our decreased ability to export or sell our offerings to, existing or potential customers with international operations. Any decreased use of our offerings or limitation on our ability to export or sell our offerings would likely adversely affect our business operations and financial results.
If customers do not expand their use of our offerings beyond the current predominant use cases, our ability to grow our business and operating results may be adversely affected.
Most of our customers currently use our offerings to support application management, IT operations, security and compliance functions. Our ability to grow our business depends in part on our ability to help enable current and future customers to increase their use of our offerings for their existing use cases and expand their use of our offerings to additional use cases, such as facilities management, supply chain management, business analytics, IoT and customer analytics. If we fail to achieve market acceptance of our offerings for these applications, if we fail to predict demand for product functionality or respond to such demand in a timely fashion, if our customers are not satisfied with our offerings, or if a competitor establishes a more widely adopted solution for these applications, our ability to grow our business and financial results will be adversely affected.
Our business and growth depend substantially on customers entering into, renewing, upgrading and expanding their term licenses, agreements for cloud services and maintenance and support agreements with us. Any decline in our customer renewals, upgrades or expansions could adversely affect our future operating results.
We typically enter into term-based agreements for our licensed software offerings, cloud services, and maintenance and support services, which customers have discretion to renew or terminate at the end of the initial term. In order for us to improve our operating results, it is important that new customers enter into renewable agreements, and our existing customers renew, upgrade and expand their term-based agreements when the initial contract term expires. Our customers have no obligation to renew, upgrade or expand their agreements with us after the terms have expired. Our customers’ renewal, upgrade and expansion rates may decline or fluctuate as a result of a number of factors, including their satisfaction or dissatisfaction with our offerings, our pricing, the effects of general economic conditions, competitive offerings or alterations or reductions in our customers’ spending levels. For example, the impact of the COVID-19 pandemic on the current economic environment has caused, and may in the future cause, customers to request concessions such as extended payment terms or better pricing or be unwilling to commit to long-term contracts. If our customers do not renew, upgrade or expand their agreements with us or renew on terms less favorable to us, our revenues may decline.
We employ multiple and evolving pricing models, which subject us to various pricing and licensing challenges that could make it difficult for us to derive value from our customers and may adversely affect our operating results.
We employ multiple and evolving pricing models for our offerings. For example, we generally charge our customers for their use of Splunk Enterprise based on either the estimated daily data indexing capacity or compute resources our customers require. In addition, Splunk Cloud is generally priced based on either the volume of data indexed per day including a fixed amount of data storage, or purchased infrastructure, data storage and bandwidth our customers require, while Splunk Phantom and Splunk On-Call are priced by the number of seats or events used for the products. We offer term licensing options for software offerings and have some remaining perpetual licenses with existing customers, which each have different payment schedules, and depending on the mix of such licenses and cloud subscriptions, our revenues or deferred revenues could be adversely affected. Our pricing models may ultimately result in a higher total cost to our customers generally as data volumes increase over time, or may cause our customers to limit or decrease usage in order to stay within the limits of their existing licenses or cloud subscriptions, or lower their costs, making it more difficult for us to compete in our markets or negatively impacting our financial results. As the amount of data within our customers’ organizations grows, we face downward pressure from our customers regarding our pricing, which could adversely affect our revenues and operating margins. In addition, our pricing models may allow competitors with different pricing models to attract customers unfamiliar or uncomfortable with our pricing models, which would cause us to lose business or modify our pricing models, both of which could adversely affect our revenues and operating margins. We have introduced and expect to continue to introduce variations to our pricing models, including but not limited to, predictive pricing programs, workload-based pricing, data ingestion pricing, “rapid adoption” packages and other pricing programs that provide broader usage and cost predictability as well as tiered pricing based on deployment models, data source types, compute and storage units and customer environments. Any change in pricing models
25

bears inherent risks as it may provide customers a choice to go for the lower-cost option, therefore putting renewal and customer lifetime value at risk. Although we believe that these pricing models and variations to these models will drive net new customers and increase customer adoption, it is possible that they will not and may potentially cause customers to decline to purchase or renew licenses or cloud subscriptions, or confuse customers and reduce their lifetime value, which could negatively impact our revenue, business and financial results.
Furthermore, while our offerings can measure and limit customer usage for the most part, we removed metered license enforcement via our software under certain circumstances, and in other circumstances, such limitations may be improperly circumvented or otherwise bypassed by users. For those offerings where we are not fully able to track usage, customers may be consuming over their licensed capacity, which may reduce our revenue opportunities. Similarly, we provide our customers with an encrypted license key for enabling their use of our offerings. There is no guarantee that users of our offerings will abide by the terms of these license limitations or encrypted license keys, and if they do not, we may not be able to capture the full value for the use of our offerings. For example, our enterprise license is generally meant for our customers’ internal use only. If our internal use customers improperly make our offerings available to their customers or other third parties, for example, through a cloud or managed service offering not authorized by us, it may displace our end user sales. Additionally, if an internal use customer that has received a volume discount from us improperly makes available our offerings to its end customers, we may experience price erosion and be unable to capture the appropriate value from those end customers.
Our sales cycle is long and unpredictable, particularly with respect to large customers, and our sales efforts require considerable time and expense.
Our operating results may fluctuate, in part, because of the resource intensive nature of our sales efforts, the length and variability of the sales cycle of our offerings and the short-term difficulty in adjusting our operating expenses. Our operating results depend in part on sales to large customers. The length of our sales cycle, from initial evaluation to delivery of and payment for the software license, varies substantially from customer to customer. This variation is due to numerous factors, including in the expansion of our offerings and new pricing models, as well as the potential for different buying centers for the same offering. In addition, the introduction of Splunk Cloud has generated interest from our customers who are also considering purchasing and deploying Splunk Enterprise on-premises. In some cases, our customers may wish to consider a combination of these offerings, potentially further slowing our sales cycle. Our sales cycle can extend to more than a year for certain customers, particularly large customers. It is difficult to predict exactly when, or even if, an existing customer will convert from a perpetual license to term license or to cloud services, we will make a sale with a potential customer, or a user of a trial version of one of our offerings will upgrade to the paid version of that offering. As a result, large individual sales have, in some cases, occurred in quarters subsequent to those we anticipated, or have not occurred at all. The loss or delay of one or more large transactions in a quarter could impact our operating results for that quarter and any future quarters for which revenues from that transaction are lost or delayed. As a result of these factors, it is difficult for us to forecast our revenues accurately in any quarter. Because a substantial portion of our expenses are relatively fixed in the short-term (subject to rising fixed costs in the longer term as discussed above), our operating results will suffer if revenues fall below our expectations in a particular quarter.
Our international sales and operations subject us to additional risks and challenges that can adversely affect our business operations and financial results.
During fiscal 2021, we derived approximately 34% of our total revenues from customers outside the United States, and we are continuing to expand our international operations as part of our growth strategy. This strategy requires us to recruit and retain qualified technical and managerial employees, manage multiple remote locations performing complex software development projects and ensure intellectual property protection outside of the U.S. Additionally, we currently have sales personnel and sales and support operations in the United States and certain countries around the world. To the extent that we experience difficulties in recruiting, training, managing, or retaining non-U.S. staff, and specifically sales management and sales personnel staff, we may experience difficulties in sales productivity in, or market penetration of, non-U.S. markets. Additionally, our sales organization outside the United States is substantially smaller than our sales organization in the United States, and we rely heavily on our indirect sales channel for non-U.S. sales. Our ability to convince customers to expand their use of our offerings or renew their agreements with us is directly correlated to our direct engagement with the customer. To the extent we are unable to engage with non-U.S. customers effectively with our limited sales force, professional services and support capacity or our indirect sales model, we may be unable to grow sales to new or existing customers to the same degree we have experienced in the United States.
Our international operations subject us to a variety of risks and challenges, including:
26
• increased management, travel, infrastructure and legal compliance costs associated with having multiple international operations;
• reliance on partners, which may have different incentives or may sell competing products, as well as different approaches with respect to compliance with laws and regulations, business practices and other day-to-day activities;
• longer payment cycles and difficulties in collecting accounts receivable or satisfying revenue recognition criteria, especially in emerging markets;
• increased financial accounting and reporting burdens and complexities;
• general economic conditions in each country or region;
• political uncertainty around the world;
• compliance with multiple and changing foreign laws and regulations, including those governing employment, tax, privacy and data protection, data transfer and the risks and costs of non-compliance with such laws and regulations;
• compliance with laws and regulations for foreign operations, including the United States Foreign Corrupt Practices Act, the United Kingdom Bribery Act, import and export control laws, tariffs, trade barriers, economic sanctions and other regulatory or contractual limitations on our ability to sell our offerings in certain foreign markets, and the risks and costs of non-compliance, including as a result of any changes in trade relations, sanctioned parties or other restrictions;
• heightened risks of unfair or corrupt business practices in certain geographies and of improper or fraudulent sales arrangements that may impact financial results and result in restatements of financial statements and irregularities in financial statements;
• fluctuations in currency exchange rates and the related effect on our financial results;
• difficulties in repatriating or transferring funds from, or converting currencies in, certain countries;
• the need for localized software and licensing programs;
• reduced protection for intellectual property rights in some countries and practical difficulties of enforcing intellectual property and contract rights abroad; and
• natural disasters, diseases and pandemics, such as COVID-19, that may disproportionately affect areas in which we do business.
Recent geopolitical events may impact our operations and financial results. For example in December 2020, following a 2016 referendum in which voters in the United Kingdom approved an exit from the European Union (the “EU”) (often referred to as “Brexit”), the United Kingdom left the EU. The political and economic effects of Brexit are still uncertain and will depend, in part, on the Trade and Cooperation Agreement between the European Union and the European Atomic Energy Community, and the United Kingdom of Great Britain and Northern Ireland, signed on December 30, 2020. The departure of the United Kingdom from the EU may cause disruption to our business, including increased friction in our ability to deliver services across the EEA and Switzerland, difficulty in recruiting EU nationals in the United Kingdom due to new immigration requirements, and increased complexities in our relationships with existing and future customers, suppliers, and employees. For example, most of our sales to customers in the EU are transacted through our subsidiary incorporated in the United Kingdom and at this time, we are unable to determine the long-term effects of this arrangement. The economic and legal uncertainty caused by Brexit in the region and globally could also adversely affect the tax, operational, legal and regulatory regimes to which our business is subject in ways we do not yet anticipate.
Any of these risks could adversely affect our international operations, reduce our international revenues or increase our operating costs, adversely affecting our business operations, financial results and growth prospects.
27

FOR
M 1
0-K
bears inherent risks as it may provide customers a choice to go for the lower-cost option, therefore putting renewal and customer lifetime value at risk. Although we believe that these pricing models and variations to these models will drive net new customers and increase customer adoption, it is possible that they will not and may potentially cause customers to decline to purchase or renew licenses or cloud subscriptions, or confuse customers and reduce their lifetime value, which could negatively impact our revenue, business and financial results.
Furthermore, while our offerings can measure and limit customer usage for the most part, we removed metered license enforcement via our software under certain circumstances, and in other circumstances, such limitations may be improperly circumvented or otherwise bypassed by users. For those offerings where we are not fully able to track usage, customers may be consuming over their licensed capacity, which may reduce our revenue opportunities. Similarly, we provide our customers with an encrypted license key for enabling their use of our offerings. There is no guarantee that users of our offerings will abide by the terms of these license limitations or encrypted license keys, and if they do not, we may not be able to capture the full value for the use of our offerings. For example, our enterprise license is generally meant for our customers’ internal use only. If our internal use customers improperly make our offerings available to their customers or other third parties, for example, through a cloud or managed service offering not authorized by us, it may displace our end user sales. Additionally, if an internal use customer that has received a volume discount from us improperly makes available our offerings to its end customers, we may experience price erosion and be unable to capture the appropriate value from those end customers.
Our sales cycle is long and unpredictable, particularly with respect to large customers, and our sales efforts require considerable time and expense.
Our operating results may fluctuate, in part, because of the resource intensive nature of our sales efforts, the length and variability of the sales cycle of our offerings and the short-term difficulty in adjusting our operating expenses. Our operating results depend in part on sales to large customers. The length of our sales cycle, from initial evaluation to delivery of and payment for the software license, varies substantially from customer to customer. This variation is due to numerous factors, including in the expansion of our offerings and new pricing models, as well as the potential for different buying centers for the same offering. In addition, the introduction of Splunk Cloud has generated interest from our customers who are also considering purchasing and deploying Splunk Enterprise on-premises. In some cases, our customers may wish to consider a combination of these offerings, potentially further slowing our sales cycle. Our sales cycle can extend to more than a year for certain customers, particularly large customers. It is difficult to predict exactly when, or even if, an existing customer will convert from a perpetual license to term license or to cloud services, we will make a sale with a potential customer, or a user of a trial version of one of our offerings will upgrade to the paid version of that offering. As a result, large individual sales have, in some cases, occurred in quarters subsequent to those we anticipated, or have not occurred at all. The loss or delay of one or more large transactions in a quarter could impact our operating results for that quarter and any future quarters for which revenues from that transaction are lost or delayed. As a result of these factors, it is difficult for us to forecast our revenues accurately in any quarter. Because a substantial portion of our expenses are relatively fixed in the short-term (subject to rising fixed costs in the longer term as discussed above), our operating results will suffer if revenues fall below our expectations in a particular quarter.
Our international sales and operations subject us to additional risks and challenges that can adversely affect our business operations and financial results.
During fiscal 2021, we derived approximately 34% of our total revenues from customers outside the United States, and we are continuing to expand our international operations as part of our growth strategy. This strategy requires us to recruit and retain qualified technical and managerial employees, manage multiple remote locations performing complex software development projects and ensure intellectual property protection outside of the U.S. Additionally, we currently have sales personnel and sales and support operations in the United States and certain countries around the world. To the extent that we experience difficulties in recruiting, training, managing, or retaining non-U.S. staff, and specifically sales management and sales personnel staff, we may experience difficulties in sales productivity in, or market penetration of, non-U.S. markets. Additionally, our sales organization outside the United States is substantially smaller than our sales organization in the United States, and we rely heavily on our indirect sales channel for non-U.S. sales. Our ability to convince customers to expand their use of our offerings or renew their agreements with us is directly correlated to our direct engagement with the customer. To the extent we are unable to engage with non-U.S. customers effectively with our limited sales force, professional services and support capacity or our indirect sales model, we may be unable to grow sales to new or existing customers to the same degree we have experienced in the United States.
Our international operations subject us to a variety of risks and challenges, including:
26
• increased management, travel, infrastructure and legal compliance costs associated with having multiple international operations;
• reliance on partners, which may have different incentives or may sell competing products, as well as different approaches with respect to compliance with laws and regulations, business practices and other day-to-day activities;
• longer payment cycles and difficulties in collecting accounts receivable or satisfying revenue recognition criteria, especially in emerging markets;
• increased financial accounting and reporting burdens and complexities;
• general economic conditions in each country or region;
• political uncertainty around the world;
• compliance with multiple and changing foreign laws and regulations, including those governing employment, tax, privacy and data protection, data transfer and the risks and costs of non-compliance with such laws and regulations;
• compliance with laws and regulations for foreign operations, including the United States Foreign Corrupt Practices Act, the United Kingdom Bribery Act, import and export control laws, tariffs, trade barriers, economic sanctions and other regulatory or contractual limitations on our ability to sell our offerings in certain foreign markets, and the risks and costs of non-compliance, including as a result of any changes in trade relations, sanctioned parties or other restrictions;
• heightened risks of unfair or corrupt business practices in certain geographies and of improper or fraudulent sales arrangements that may impact financial results and result in restatements of financial statements and irregularities in financial statements;
• fluctuations in currency exchange rates and the related effect on our financial results;
• difficulties in repatriating or transferring funds from, or converting currencies in, certain countries;
• the need for localized software and licensing programs;
• reduced protection for intellectual property rights in some countries and practical difficulties of enforcing intellectual property and contract rights abroad; and
• natural disasters, diseases and pandemics, such as COVID-19, that may disproportionately affect areas in which we do business.
Recent geopolitical events may impact our operations and financial results. For example in December 2020, following a 2016 referendum in which voters in the United Kingdom approved an exit from the European Union (the “EU”) (often referred to as “Brexit”), the United Kingdom left the EU. The political and economic effects of Brexit are still uncertain and will depend, in part, on the Trade and Cooperation Agreement between the European Union and the European Atomic Energy Community, and the United Kingdom of Great Britain and Northern Ireland, signed on December 30, 2020. The departure of the United Kingdom from the EU may cause disruption to our business, including increased friction in our ability to deliver services across the EEA and Switzerland, difficulty in recruiting EU nationals in the United Kingdom due to new immigration requirements, and increased complexities in our relationships with existing and future customers, suppliers, and employees. For example, most of our sales to customers in the EU are transacted through our subsidiary incorporated in the United Kingdom and at this time, we are unable to determine the long-term effects of this arrangement. The economic and legal uncertainty caused by Brexit in the region and globally could also adversely affect the tax, operational, legal and regulatory regimes to which our business is subject in ways we do not yet anticipate.
Any of these risks could adversely affect our international operations, reduce our international revenues or increase our operating costs, adversely affecting our business operations, financial results and growth prospects.
27

In addition, compliance with laws and regulations applicable to our international operations increases our cost of doing business in foreign jurisdictions. We may be unable to keep current with changes in foreign government requirements and laws as they change from time to time. Failure to comply with these regulations could have adverse effects on our business. In many foreign countries, it is common for others to engage in business practices that are prohibited by our internal policies and procedures or United States regulations applicable to us. In addition, although we have implemented policies and procedures designed to ensure compliance with these laws and policies, there can be no assurance that all of our employees, contractors, partners and agents will comply with these laws and policies. Violations of laws or key control policies by our employees, contractors, partners or agents could result in delays in revenue recognition, financial reporting misstatements, fines, penalties, or the prohibition of the importation or exportation of our offerings and could have a material adverse effect on our business operations and financial results.
Our sales to public sector customers are subject to a number of additional challenges and risks.
We derive a portion of our revenues from contracts with U.S. federal, state and local and foreign governments, and we believe that the success and growth of our business will continue to depend on our successful procurement of government contracts. For our sales to these public sector customers, we must comply with laws and regulations relating to the formation, administration and performance of contracts, which affect how our partners and how we do business with governmental agencies. These laws and regulations provide public sector customers rights, many of which are not typically found in commercial contracts. Such rights may include price protection, the accuracy of information provided to the government, compliance with procurement integrity and government ethics, compliance with specified product certifications restrictions and pre-conditions for access to controlled or classified information, compliance with supply chain requirements, labor regulations and supplier diversity policies, and other terms that are particular to public sector customers. These laws and regulations may impose added costs on our business, and failure to comply with these or other applicable regulations and requirements, including non-compliance in the past, could lead to bid protests, contract cure actions, claims for damages or other relief, penalties, termination of contracts, loss of exclusive rights in our intellectual property, substantial audit or re-procurement costs and temporary suspension or permanent debarment from government contracting. Any such damages, penalties, disruptions or limitations in our ability to do business with the public sector could have a material adverse effect on our business operations and financial results.
In October 2019, we received authorization under the U.S. Federal Risk and Authorization Management Program (“FedRAMP”) that allows U.S. federal government agencies and contractors to have greater integration with our platform if and when they transition to cloud-based computing. At the same time, FedRAMP places an increased compliance burden upon us, which may increase our internal costs to provide services to government agencies. If we cannot adequately comply with FedRAMP compliance requirements, our growth could be adversely impacted, and we could incur significant liability and our reputation and business could be harmed.
Factors that could impede our ability to maintain or increase the amount of revenues derived from government contracts, include:
• changes in fiscal or contracting policies;
• decreases in available government funding;
• restrictions in the award of personal security clearances to our employees;
• ability to adapt to public sector budgetary cycles and funding authorizations, with funding reductions or delays having an adverse impact on public sector demand for our products;
• changes in government programs or applicable requirements;
• changes in government sanctions programs and related policies;
• the adoption of new laws or regulations or changes to existing laws or regulations;
• noncompliance with laws, contract provisions or government procurement or other applicable regulations, or the perception that any such noncompliance has occurred or is likely;
28
• changes in the political environment and budgeting, including before or after a change of leadership within the government administration, and any resulting uncertainty or changes in policy or priorities and resultant funding;
• ability to maintain the facility clearance required to perform on classified contracts for U.S. federal government agencies, or to maintain security clearances for our employees;
• changes to government certification requirements or approved product lists;
• ability to achieve or maintain one or more government certifications, including our existing FedRAMP certification;
• ability to maintain products on key government acquisition contracts;
• an extended government shutdown or other potential delays or changes in the government appropriations or other funding authorization processes including as a result of events such as war, incidents of terrorism, natural disasters, and public health concerns or epidemics, such as the recent COVID-19 pandemic;
• changes in the duration of our contracts with government customers;
• delays in the payment of our invoices by government payment offices; and
• bid protests by competitors
The occurrence of any of the foregoing could cause governments and governmental agencies to delay or refrain from purchasing licenses of our offerings in the future or otherwise have an adverse effect on our business operations and financial results. To the extent that we become more reliant on contracts with government entities, including foreign government entities, in the future, our exposure to such risks and challenges could increase, which in turn could adversely impact our business.
Incorrect or improper implementation or use of our software could result in customer dissatisfaction, customer data loss or corruption and negatively affect our business, operations, financial results and growth prospects.
Our software is deployed in a wide variety of technology environments. Increasingly, our software has been deployed in large scale, complex technology environments, and we believe our future success will depend on our ability to increase sales of our software licenses for use in such deployments. We often must assist our customers in achieving successful implementations for large, complex deployments. If we or our customers are unable to implement our software successfully, including related to technologies that we have obtained through acquisitions, are unable to do so in a timely manner or if an improper implementation or change in system configuration results in errors or loss of data, customer perceptions of our company may be impaired, our reputation and brand may suffer, and customers may choose not to increase their use of our offerings. In addition, our software imposes server load and index storage requirements for implementation. If our customers do not have the server load capacity or the storage capacity required, they may not be able to effectively implement and use our software and, therefore, may not choose to increase their use of our offerings.
Our customers and third-party partners may need training in the proper use of and the variety of benefits that can be derived from our software to maximize its potential. If our software is not implemented or used correctly or as intended, inadequate performance, errors, data loss or corruption may result. Because our customers rely on our software and maintenance and support services to manage a wide range of operations, the incorrect or improper implementation or use of our software, our failure to train customers on how to efficiently and effectively use our software, or our failure to provide maintenance services to our customers, may result in negative publicity or legal claims against us. Also, as we continue to expand our customer base, any failure by us to properly provide these services will likely result in lost opportunities for follow-on sales of our offerings.
If we or our third-party service providers experience a security breach or unauthorized parties otherwise obtain access to our customers’ data, our data, or our cloud services, our offerings may be perceived as not being secure, our reputation may be harmed, demand for our offerings may be reduced, and we may incur significant liabilities.
29

FOR
M 1
0-K
In addition, compliance with laws and regulations applicable to our international operations increases our cost of doing business in foreign jurisdictions. We may be unable to keep current with changes in foreign government requirements and laws as they change from time to time. Failure to comply with these regulations could have adverse effects on our business. In many foreign countries, it is common for others to engage in business practices that are prohibited by our internal policies and procedures or United States regulations applicable to us. In addition, although we have implemented policies and procedures designed to ensure compliance with these laws and policies, there can be no assurance that all of our employees, contractors, partners and agents will comply with these laws and policies. Violations of laws or key control policies by our employees, contractors, partners or agents could result in delays in revenue recognition, financial reporting misstatements, fines, penalties, or the prohibition of the importation or exportation of our offerings and could have a material adverse effect on our business operations and financial results.
Our sales to public sector customers are subject to a number of additional challenges and risks.
We derive a portion of our revenues from contracts with U.S. federal, state and local and foreign governments, and we believe that the success and growth of our business will continue to depend on our successful procurement of government contracts. For our sales to these public sector customers, we must comply with laws and regulations relating to the formation, administration and performance of contracts, which affect how our partners and how we do business with governmental agencies. These laws and regulations provide public sector customers rights, many of which are not typically found in commercial contracts. Such rights may include price protection, the accuracy of information provided to the government, compliance with procurement integrity and government ethics, compliance with specified product certifications restrictions and pre-conditions for access to controlled or classified information, compliance with supply chain requirements, labor regulations and supplier diversity policies, and other terms that are particular to public sector customers. These laws and regulations may impose added costs on our business, and failure to comply with these or other applicable regulations and requirements, including non-compliance in the past, could lead to bid protests, contract cure actions, claims for damages or other relief, penalties, termination of contracts, loss of exclusive rights in our intellectual property, substantial audit or re-procurement costs and temporary suspension or permanent debarment from government contracting. Any such damages, penalties, disruptions or limitations in our ability to do business with the public sector could have a material adverse effect on our business operations and financial results.
In October 2019, we received authorization under the U.S. Federal Risk and Authorization Management Program (“FedRAMP”) that allows U.S. federal government agencies and contractors to have greater integration with our platform if and when they transition to cloud-based computing. At the same time, FedRAMP places an increased compliance burden upon us, which may increase our internal costs to provide services to government agencies. If we cannot adequately comply with FedRAMP compliance requirements, our growth could be adversely impacted, and we could incur significant liability and our reputation and business could be harmed.
Factors that could impede our ability to maintain or increase the amount of revenues derived from government contracts, include:
• changes in fiscal or contracting policies;
• decreases in available government funding;
• restrictions in the award of personal security clearances to our employees;
• ability to adapt to public sector budgetary cycles and funding authorizations, with funding reductions or delays having an adverse impact on public sector demand for our products;
• changes in government programs or applicable requirements;
• changes in government sanctions programs and related policies;
• the adoption of new laws or regulations or changes to existing laws or regulations;
• noncompliance with laws, contract provisions or government procurement or other applicable regulations, or the perception that any such noncompliance has occurred or is likely;
28
• changes in the political environment and budgeting, including before or after a change of leadership within the government administration, and any resulting uncertainty or changes in policy or priorities and resultant funding;
• ability to maintain the facility clearance required to perform on classified contracts for U.S. federal government agencies, or to maintain security clearances for our employees;
• changes to government certification requirements or approved product lists;
• ability to achieve or maintain one or more government certifications, including our existing FedRAMP certification;
• ability to maintain products on key government acquisition contracts;
• an extended government shutdown or other potential delays or changes in the government appropriations or other funding authorization processes including as a result of events such as war, incidents of terrorism, natural disasters, and public health concerns or epidemics, such as the recent COVID-19 pandemic;
• changes in the duration of our contracts with government customers;
• delays in the payment of our invoices by government payment offices; and
• bid protests by competitors
The occurrence of any of the foregoing could cause governments and governmental agencies to delay or refrain from purchasing licenses of our offerings in the future or otherwise have an adverse effect on our business operations and financial results. To the extent that we become more reliant on contracts with government entities, including foreign government entities, in the future, our exposure to such risks and challenges could increase, which in turn could adversely impact our business.
Incorrect or improper implementation or use of our software could result in customer dissatisfaction, customer data loss or corruption and negatively affect our business, operations, financial results and growth prospects.
Our software is deployed in a wide variety of technology environments. Increasingly, our software has been deployed in large scale, complex technology environments, and we believe our future success will depend on our ability to increase sales of our software licenses for use in such deployments. We often must assist our customers in achieving successful implementations for large, complex deployments. If we or our customers are unable to implement our software successfully, including related to technologies that we have obtained through acquisitions, are unable to do so in a timely manner or if an improper implementation or change in system configuration results in errors or loss of data, customer perceptions of our company may be impaired, our reputation and brand may suffer, and customers may choose not to increase their use of our offerings. In addition, our software imposes server load and index storage requirements for implementation. If our customers do not have the server load capacity or the storage capacity required, they may not be able to effectively implement and use our software and, therefore, may not choose to increase their use of our offerings.
Our customers and third-party partners may need training in the proper use of and the variety of benefits that can be derived from our software to maximize its potential. If our software is not implemented or used correctly or as intended, inadequate performance, errors, data loss or corruption may result. Because our customers rely on our software and maintenance and support services to manage a wide range of operations, the incorrect or improper implementation or use of our software, our failure to train customers on how to efficiently and effectively use our software, or our failure to provide maintenance services to our customers, may result in negative publicity or legal claims against us. Also, as we continue to expand our customer base, any failure by us to properly provide these services will likely result in lost opportunities for follow-on sales of our offerings.
If we or our third-party service providers experience a security breach or unauthorized parties otherwise obtain access to our customers’ data, our data, or our cloud services, our offerings may be perceived as not being secure, our reputation may be harmed, demand for our offerings may be reduced, and we may incur significant liabilities.
29

Our offerings involve the storage and transmission of data, and security breaches and incidents could result in the loss of this information, litigation, indemnity obligations, fines, penalties and other liability. We may become the target of cyber-attacks by third parties seeking unauthorized access to our data or our customer’s data or to disrupt our ability to provide services. There is also a danger of industrial espionage, misuse, theft of information or assets (including source code), or damage to assets by people who have gained unauthorized access to our facilities, systems or information. Because there are many different techniques used to obtain unauthorized access to systems and data, and such techniques continue to evolve, we may be unable to anticipate attempted security breaches and incidents and proactively implement adequate preventative measures. Additionally, with so many of our employees now working remotely due to the COVID-19 pandemic, we may face an increased risk of attempted security breaches and incidents. While we have taken steps to protect the confidential information that we have access to, including confidential information we may obtain through our customer support services or customer usage of our cloud services, our security measures or those of our third-party service providers could be breached or otherwise fail to prevent unauthorized access to or disclosure, modification, misuse, loss or destruction of such information. Computer malware, viruses, social engineering (phishing attacks), and increasingly sophisticated network attacks have become more prevalent in our industry, particularly against cloud services. In the first quarter of fiscal 2019, we took corrective action against an attacker who utilized compromised credentials to access and delete compute capacity in the Splunk Cloud environment. In addition, we do not directly control content that customers store in our offerings. If customers use our offerings for the transmission or storage of personal information or other sensitive types of information and our security measures are, or are believed to have been breached as a result of third-party action, employee error, malfeasance or otherwise, our reputation could be damaged, our business may suffer, and we could incur significant liability.
We also process, store and transmit our own data as part of our business and operations. This data may include personal, confidential or proprietary information. We make use of third-party technology and systems for a variety of reasons, including, without limitation, encryption and authentication technology, employee email, content delivery to customers, back-office support, credit card processing, human resources services, customer relationship management, enterprise risk planning and other functions. Although we have developed systems and processes that are designed to protect our business and proprietary information and prevent data loss and other security breaches and incidents, and to reduce the impact of a security breach or incident at a third-party vendor, such measures cannot provide absolute security. There can be no assurance that any security measures that we or our third-party service providers, including third party providers of cloud infrastructure services (“Cloud Service Providers”), have implemented will be effective against current or future security threats. While we maintain measures designed to protect the integrity, confidentiality and security of our data, our security measures or those of our third-party service providers could fail and result in unauthorized access to or disclosure, modification, misuse, loss or destruction of such data.
Any security breach or other security incident, or the perception that one has occurred, could result in a loss of customer confidence in the security of our offerings and damage to our brand, reduce the demand for our offerings, disrupt normal business operations, require us to spend material resources to investigate or correct the breach and to prevent future security breaches and incidents, expose us to legal liabilities, including litigation, regulatory enforcement, and indemnity obligations, and adversely affect our revenues and operating results. These risks may increase as we continue to grow the number and scale of our cloud services, and process, store, and transmit increasing amounts of data.
Third parties may also conduct attacks designed to deny customers access to our cloud services. A significant disruption in access to, or ability to use, our cloud services could damage our reputation with current and potential customers, expose us to liability, cause us to lose customers or otherwise negatively affect our business.
Additionally, the recent attack against SolarWinds, in which hackers inserted malware into a SolarWinds software update, highlights the growing risk from the infection of software while it is under assembly, known as a supply chain attack. We could become a vector for a similar style attack or could become the subject of one through a supply chain compromise.
We cannot be certain that our insurance coverage will be adequate for data security liabilities incurred, will cover any indemnification claims against us relating to any incident, that insurance will continue to be available to us on economically reasonable terms, or at all, or that any insurer will not deny coverage as to any future claim. The successful assertion of one or more large claims against us that exceed available insurance coverage, or the occurrence of changes in our insurance policies, including premium increases or the imposition of large deductible or co-insurance requirements, could have a material adverse effect on our business, including our financial condition, operating results, and reputation.
Interruptions or performance problems associated with our technology and infrastructure, and our reliance on Software-as-a-Service (“SaaS”) technologies from third parties, may adversely affect our business operations and financial results.
30
Our continued growth depends in part on the ability of our existing and potential customers to use and access our cloud services or our website in order to download our software or encrypted access keys for our software within an acceptable amount of time. In addition, we rely heavily on hosted SaaS technologies from third parties in order to operate critical functions of our business, including enterprise resource planning services and customer relationship management services. We have experienced and may in the future experience real or perceived website and cloud service disruptions, storage failures, outages and other performance problems due to a variety of factors, including infrastructure changes, human or software errors, capacity constraints due to an overwhelming number of users accessing our website and services simultaneously, unauthorized access, denial of service, security or ransomware attacks. In some instances, we may not be able to identify the cause or causes of these website or service performance problems within an acceptable period of time. It may become increasingly difficult to maintain and improve our website and service performance, especially during peak usage times and as our offerings become more complex and our user traffic increases. If our website or cloud services are unavailable or if our users are unable to download our software or encrypted access keys within a reasonable amount of time or at all, we could suffer damage to our reputation with current and potential customers, be exposed to legal liability, and lose customers, all of which could negatively affect our business. We expect to continue to make significant investments to maintain and improve website and service performance and to enable rapid releases of new features and apps for our offerings. To the extent that we do not effectively address capacity constraints, upgrade our systems as needed and continually develop our technology and network architecture to accommodate actual and anticipated changes in technology, our business and operating results may be adversely affected.
Real or perceived errors, failures or bugs in our offerings could adversely affect our financial results and growth prospects.
Because our offerings are complex, undetected errors, failures or bugs may occur, especially when new offerings, versions or updates are released, including related to technologies that we have obtained through acquisitions. Our software is often installed and used in large-scale computing environments with different operating systems, system management software, and equipment and networking configurations, which may cause errors or failures of our software or other aspects of the computing environment into which it is deployed. In addition, deployment of our software into complicated, large-scale computing environments may expose undetected errors, failures or bugs in our software. Despite testing by us, errors, failures or bugs may not be found in our offerings until they are released to our customers. In the past, we have discovered errors, failures and bugs in some of our offerings after their introduction. Real or perceived errors, failures or bugs in our offerings could result in negative publicity, loss of or delay in market acceptance of our offerings, loss of competitive position or claims by customers for losses sustained by them. In such an event, we may be required, or may choose, for customer relations or other reasons, to expend additional resources in order to help correct the problem.
In addition, if an actual or perceived failure of our software occurs in a customer’s deployment or in our cloud services, regardless of whether the failure is attributable to our software, the market perception of the effectiveness of our offerings could be adversely affected. Alleviating any of these problems could require significant expenditures of our capital and other resources and could cause interruptions, delays or cessation of our licensing, which could cause us to lose existing or potential customers and could adversely affect our financial results and growth prospects.
We are subject to a number of legal requirements, contractual obligations and industry standards regarding security, data protection, and privacy, and any failure to comply with these requirements, obligations or standards could have an adverse effect on our reputation, business, financial condition and operating results.
Data privacy and security have become significant issues in the United States and in many other countries where we have employees and operations and where we offer licenses or cloud subscriptions to our offerings. The regulatory framework for data privacy and security issues worldwide is rapidly evolving and is likely to remain uncertain for the foreseeable future. These obligations may be interpreted and applied inconsistently from one jurisdiction to another and may conflict with one another, other regulatory requirements or our internal practices. The U.S. federal and various state and foreign government bodies and agencies have adopted or are considering adopting laws and regulations limiting, or laws and regulations regarding the collection, distribution, use, disclosure, storage, and security of certain types of information. For example, on January 1, 2020, the California Consumer Privacy Act (“CCPA”), which requires covered companies to provide new disclosures to California consumers, and afford such consumers new abilities to opt-out of certain sales of personal information, became operative. Additionally, the California Privacy Rights Act (“CPRA”) was approved by California voters in the November 3, 2020 election. The CPRA significantly modifies the CCPA, creating obligations relating to consumer data beginning on January 1, 2022, with implementing regulations expected on or before July 1, 2022, and enforcement beginning July 1, 2023. Aspects of the CCPA, the CPRA, and their interpretation remain unclear. We cannot yet fully predict the impact of the CCPA or CPRA on
31

FOR
M 1
0-K
Our offerings involve the storage and transmission of data, and security breaches and incidents could result in the loss of this information, litigation, indemnity obligations, fines, penalties and other liability. We may become the target of cyber-attacks by third parties seeking unauthorized access to our data or our customer’s data or to disrupt our ability to provide services. There is also a danger of industrial espionage, misuse, theft of information or assets (including source code), or damage to assets by people who have gained unauthorized access to our facilities, systems or information. Because there are many different techniques used to obtain unauthorized access to systems and data, and such techniques continue to evolve, we may be unable to anticipate attempted security breaches and incidents and proactively implement adequate preventative measures. Additionally, with so many of our employees now working remotely due to the COVID-19 pandemic, we may face an increased risk of attempted security breaches and incidents. While we have taken steps to protect the confidential information that we have access to, including confidential information we may obtain through our customer support services or customer usage of our cloud services, our security measures or those of our third-party service providers could be breached or otherwise fail to prevent unauthorized access to or disclosure, modification, misuse, loss or destruction of such information. Computer malware, viruses, social engineering (phishing attacks), and increasingly sophisticated network attacks have become more prevalent in our industry, particularly against cloud services. In the first quarter of fiscal 2019, we took corrective action against an attacker who utilized compromised credentials to access and delete compute capacity in the Splunk Cloud environment. In addition, we do not directly control content that customers store in our offerings. If customers use our offerings for the transmission or storage of personal information or other sensitive types of information and our security measures are, or are believed to have been breached as a result of third-party action, employee error, malfeasance or otherwise, our reputation could be damaged, our business may suffer, and we could incur significant liability.
We also process, store and transmit our own data as part of our business and operations. This data may include personal, confidential or proprietary information. We make use of third-party technology and systems for a variety of reasons, including, without limitation, encryption and authentication technology, employee email, content delivery to customers, back-office support, credit card processing, human resources services, customer relationship management, enterprise risk planning and other functions. Although we have developed systems and processes that are designed to protect our business and proprietary information and prevent data loss and other security breaches and incidents, and to reduce the impact of a security breach or incident at a third-party vendor, such measures cannot provide absolute security. There can be no assurance that any security measures that we or our third-party service providers, including third party providers of cloud infrastructure services (“Cloud Service Providers”), have implemented will be effective against current or future security threats. While we maintain measures designed to protect the integrity, confidentiality and security of our data, our security measures or those of our third-party service providers could fail and result in unauthorized access to or disclosure, modification, misuse, loss or destruction of such data.
Any security breach or other security incident, or the perception that one has occurred, could result in a loss of customer confidence in the security of our offerings and damage to our brand, reduce the demand for our offerings, disrupt normal business operations, require us to spend material resources to investigate or correct the breach and to prevent future security breaches and incidents, expose us to legal liabilities, including litigation, regulatory enforcement, and indemnity obligations, and adversely affect our revenues and operating results. These risks may increase as we continue to grow the number and scale of our cloud services, and process, store, and transmit increasing amounts of data.
Third parties may also conduct attacks designed to deny customers access to our cloud services. A significant disruption in access to, or ability to use, our cloud services could damage our reputation with current and potential customers, expose us to liability, cause us to lose customers or otherwise negatively affect our business.
Additionally, the recent attack against SolarWinds, in which hackers inserted malware into a SolarWinds software update, highlights the growing risk from the infection of software while it is under assembly, known as a supply chain attack. We could become a vector for a similar style attack or could become the subject of one through a supply chain compromise.
We cannot be certain that our insurance coverage will be adequate for data security liabilities incurred, will cover any indemnification claims against us relating to any incident, that insurance will continue to be available to us on economically reasonable terms, or at all, or that any insurer will not deny coverage as to any future claim. The successful assertion of one or more large claims against us that exceed available insurance coverage, or the occurrence of changes in our insurance policies, including premium increases or the imposition of large deductible or co-insurance requirements, could have a material adverse effect on our business, including our financial condition, operating results, and reputation.
Interruptions or performance problems associated with our technology and infrastructure, and our reliance on Software-as-a-Service (“SaaS”) technologies from third parties, may adversely affect our business operations and financial results.
30
Our continued growth depends in part on the ability of our existing and potential customers to use and access our cloud services or our website in order to download our software or encrypted access keys for our software within an acceptable amount of time. In addition, we rely heavily on hosted SaaS technologies from third parties in order to operate critical functions of our business, including enterprise resource planning services and customer relationship management services. We have experienced and may in the future experience real or perceived website and cloud service disruptions, storage failures, outages and other performance problems due to a variety of factors, including infrastructure changes, human or software errors, capacity constraints due to an overwhelming number of users accessing our website and services simultaneously, unauthorized access, denial of service, security or ransomware attacks. In some instances, we may not be able to identify the cause or causes of these website or service performance problems within an acceptable period of time. It may become increasingly difficult to maintain and improve our website and service performance, especially during peak usage times and as our offerings become more complex and our user traffic increases. If our website or cloud services are unavailable or if our users are unable to download our software or encrypted access keys within a reasonable amount of time or at all, we could suffer damage to our reputation with current and potential customers, be exposed to legal liability, and lose customers, all of which could negatively affect our business. We expect to continue to make significant investments to maintain and improve website and service performance and to enable rapid releases of new features and apps for our offerings. To the extent that we do not effectively address capacity constraints, upgrade our systems as needed and continually develop our technology and network architecture to accommodate actual and anticipated changes in technology, our business and operating results may be adversely affected.
Real or perceived errors, failures or bugs in our offerings could adversely affect our financial results and growth prospects.
Because our offerings are complex, undetected errors, failures or bugs may occur, especially when new offerings, versions or updates are released, including related to technologies that we have obtained through acquisitions. Our software is often installed and used in large-scale computing environments with different operating systems, system management software, and equipment and networking configurations, which may cause errors or failures of our software or other aspects of the computing environment into which it is deployed. In addition, deployment of our software into complicated, large-scale computing environments may expose undetected errors, failures or bugs in our software. Despite testing by us, errors, failures or bugs may not be found in our offerings until they are released to our customers. In the past, we have discovered errors, failures and bugs in some of our offerings after their introduction. Real or perceived errors, failures or bugs in our offerings could result in negative publicity, loss of or delay in market acceptance of our offerings, loss of competitive position or claims by customers for losses sustained by them. In such an event, we may be required, or may choose, for customer relations or other reasons, to expend additional resources in order to help correct the problem.
In addition, if an actual or perceived failure of our software occurs in a customer’s deployment or in our cloud services, regardless of whether the failure is attributable to our software, the market perception of the effectiveness of our offerings could be adversely affected. Alleviating any of these problems could require significant expenditures of our capital and other resources and could cause interruptions, delays or cessation of our licensing, which could cause us to lose existing or potential customers and could adversely affect our financial results and growth prospects.
We are subject to a number of legal requirements, contractual obligations and industry standards regarding security, data protection, and privacy, and any failure to comply with these requirements, obligations or standards could have an adverse effect on our reputation, business, financial condition and operating results.
Data privacy and security have become significant issues in the United States and in many other countries where we have employees and operations and where we offer licenses or cloud subscriptions to our offerings. The regulatory framework for data privacy and security issues worldwide is rapidly evolving and is likely to remain uncertain for the foreseeable future. These obligations may be interpreted and applied inconsistently from one jurisdiction to another and may conflict with one another, other regulatory requirements or our internal practices. The U.S. federal and various state and foreign government bodies and agencies have adopted or are considering adopting laws and regulations limiting, or laws and regulations regarding the collection, distribution, use, disclosure, storage, and security of certain types of information. For example, on January 1, 2020, the California Consumer Privacy Act (“CCPA”), which requires covered companies to provide new disclosures to California consumers, and afford such consumers new abilities to opt-out of certain sales of personal information, became operative. Additionally, the California Privacy Rights Act (“CPRA”) was approved by California voters in the November 3, 2020 election. The CPRA significantly modifies the CCPA, creating obligations relating to consumer data beginning on January 1, 2022, with implementing regulations expected on or before July 1, 2022, and enforcement beginning July 1, 2023. Aspects of the CCPA, the CPRA, and their interpretation remain unclear. We cannot yet fully predict the impact of the CCPA or CPRA on
31

our business or operations, but they may require us to modify our data processing practices and policies and to incur substantial costs and expenses in an effort to comply.
Internationally, virtually every jurisdiction in which we operate has established its own data security and privacy or data protection legal framework with which we or our customers must comply. Laws and regulations in these jurisdictions apply broadly to the collection, use, storage, disclosure and security of data that identifies or may be used to identify or locate an individual. These laws and regulations often are more restrictive than those in the United States and are rapidly evolving. For example, the EU General Data Protection Regulation (“GDPR”) became effective on May 25, 2018, and, in addition to imposing stringent obligations relating to data protection and security, authorizes fines up to 4% of global annual revenue for some violations. We relied in part upon the EU-U.S. Privacy Shield Framework developed by the U.S. Department of Commerce and the European Commission and the Swiss-U.S. Privacy Shield Framework developed by the U.S. Department of Commerce and the Swiss Administration to provide U.S. companies with a valid data transfer mechanism under EU and Swiss law to permit them to transfer personal data from the European Union and Switzerland to the United States. On July 16, 2020, the Court of Justice of the European Union (“CJEU”) invalidated the EU-U.S. Privacy Shield, concluding it did not provide adequate protection for personal data transferred to the U.S. On September 8, 2020, the Swiss Federal Data Protection and Information Commissioner invalidated the Swiss-US Privacy Shield on similar grounds. In its July 16, 2020 opinion, the CJEU imposed additional obligations on companies when relying on standard contractual clauses approved by the European Commission (“SCCs”) to transfer personal data. The CJEU decision may result in European data protection regulators applying differing standards for, and requiring ad hoc verification of, transfers of personal data from Europe to the U.S. In November 2020, the European Commission released a draft of revised SCCs addressing the CJEU concerns. The European Data Protection Board (“EDPB”) also issued recommendations, and in January 2021, the EDPB and the European Data Protection Supervisor issued a joint opinion regarding those revised SCCs. The revised SCCs, the foregoing recommendations and opinions of regulators, and other developments relating to cross-border data transfer, may require us to implement additional contractual and technical safeguards for any personal data transferred out of the European Economic Area (“EEA”), which may increase compliance costs, lead to increased regulatory scrutiny or liability, and which may adversely impact our business, financial condition and operating results.
The United Kingdom enacted a Data Protection Act in May 2018 that substantially implements the GDPR, and has implemented legislation referred to as the “UK GDPR” that generally provides for the GDPR to be implemented in the UK following Brexit and the transition period that ended on December 31, 2020. While the EU has published draft decisions that the United Kingdom may be deemed an “adequate country” to which personal data could be exported from the EEA, this decision may face challenges in the future, creating uncertainty regarding transfers of personal data to the United Kingdom from the EEA. Our EMEA headquarters is in London, causing this uncertainty to be particularly significant to our operations. Some countries also are considering or have passed legislation requiring local storage and processing of data, or similar requirements, which could increase the cost and complexity of delivering our services.
Complying with the GDPR, the CCPA and the CPRA, or other laws, regulations, or other obligations relating to privacy, data protection, data localization or security in the U.S. or other regions worldwide may cause us to incur substantial operational costs or require us to modify our data handling practices. Non-compliance could result in proceedings against us by governmental entities or others, could result in substantial fines or other liability, and may otherwise adversely impact our business, financial condition and operating results.
Some statutory requirements, both in the United States and abroad, such as the Health Insurance Portability and Accountability Act of 1996 (“HIPAA”) and numerous state statutes, include obligations of companies to notify individuals of security breaches involving certain types of personal information, which could result from breaches experienced by us or our service providers. Any actual or perceived security breach or incident could impact our reputation, harm our customer confidence, hurt our sales and expansion into new markets or cause us to lose existing customers, and could expose us to potential liability or require us to expend significant resources on data security and in responding to any such actual or perceived breach or incident.
In addition to government regulation, self-regulatory standards and other industry standards may legally or contractually apply to us, be argued to apply to us, or we may elect to comply with such standards or to facilitate our customers’ compliance with such standards. Because privacy, data protection and data security are critical competitive factors in our industry, we may make statements on our website, in marketing materials, or in other settings about our data processing and data security measures and our compliance with, or our ability to facilitate our customers’ compliance with, these standards. We also expect that laws, regulations, industry standards and other obligations relating to privacy, data protection and security will continue to evolve worldwide, and that there will continue to be new, modified, and re-interpreted laws, regulations, standards, and other obligations in these areas. We cannot yet determine the impact such future laws, regulations and standards, or
32
amendments to or re-interpretations of, existing laws and regulations, industry standards, or other obligations may have on our business. New laws, amendments to or re-interpretations of existing laws and regulations, industry standards, and contractual and other obligations may require us to incur additional costs and restrict our business operations. Because the interpretation and application of laws, standards, contractual obligations and other obligations relating to privacy and data protection are uncertain, these laws, standards, and contractual and other obligations may be interpreted and applied in a manner that is, or is alleged to be, inconsistent with our data management practices, our policies or procedures, or the features of our offerings. If so, in addition to the possibility of fines, lawsuits and other claims, we may find it necessary or appropriate to fundamentally change our business activities and practices, including the establishment of localized data storage or other data processing operations, or modify or cease offering certain offerings either generally or in certain geographic regions, any of which could have an adverse effect on our business. We may be unable to make such changes and modifications in a commercially reasonable manner or at all, and our ability to develop new offerings and features could be limited. Furthermore, the costs of compliance with, and other burdens imposed by, the laws, regulations, and policies that are applicable to the businesses of our customers may limit the use and adoption of, and reduce the overall demand for, our offerings. Any inability to adequately address privacy, data protection or security-related concerns, even if unfounded, or to successfully negotiate privacy, data protection or security-related contractual terms with customers, or to comply with applicable laws, regulations and other obligations relating to privacy, data protection, and security, could result in additional cost and liability to us, damage our reputation, inhibit sales, slow our sales cycles, and adversely affect our business. Privacy and personal security concerns, whether valid or not valid, may inhibit market adoption of our offerings, particularly in certain industries and foreign countries.
Failure to protect our intellectual property rights could adversely affect our business and our brand.
Our success and ability to compete depends, in part, on our ability to protect our trade secrets, trademarks, copyrights, patents, know-how, confidential information, proprietary methods and technologies and other intellectual property and proprietary rights, so that we can prevent others from using our inventions, proprietary information and property. We generally rely on patent, copyright, trade secret and trademark laws, and confidentiality or license agreements with our employees, consultants, vendors, customers, partners and others, and generally limit access to and distribution of our proprietary information, in order to protect our intellectual property rights and maintain our competitive position. However, we cannot guarantee that the steps we take to protect our intellectual property rights will be effective.
Our issued patents and any patents issued in the future may not provide us with any competitive advantages, and our patent applications may never be granted. Additionally, the process of obtaining patent protection is expensive and time-consuming, and we may not be able to file and prosecute all necessary or desirable patent applications, or we may not be able to do so at a reasonable cost or in a timely manner. Even if issued, there can be no assurance that these patents will adequately protect our intellectual property, as the legal standards relating to the infringement, validity, enforceability and scope of protection of patent and other intellectual property rights are complex and often uncertain. Any patents that are issued, and any of our other intellectual property rights may be challenged by others and invalidated or narrowed through administrative process, litigation, or similar proceedings, allowing other companies to develop offerings that compete with ours, which could adversely affect our competitive business position, business prospects and financial condition. In addition, issuance of a patent does not guarantee that we have a right to practice the patented invention. We cannot be certain that we were the first to use the inventions claimed in our issued patents or pending patent applications or otherwise used in our offerings, that we were the first to file patent applications, or that third parties do not have blocking patents that could be used to prevent us from marketing or practicing our offerings or technology. Effective patent, trademark, copyright and trade secret protection may not be available to us in every country in which our offerings are available. The laws of some foreign countries may not be as protective of intellectual property rights as those in the United States (in particular, some foreign jurisdictions do not permit patent protection for software, and even in the United States, this protection is limited), and mechanisms for enforcement of intellectual property rights may be inadequate. We have filed for patents in the United States and in limited non-U.S. jurisdictions, but such protections may not be available or adequate in all countries in which we operate or in which we seek to enforce our intellectual property rights, or may be difficult to enforce in practice. For example, many foreign countries have compulsory licensing laws under which a patent owner must grant licenses to third parties. In addition, many countries limit the enforceability of patents against certain third parties, including government agencies or government contractors. In these countries, patents may provide limited or no benefit. As we expand our international activities, our exposure to unauthorized copying and use of our products and platform capabilities and proprietary information will likely increase. We are currently unable to measure the full extent of this unauthorized use of our products, platform capabilities, software, and proprietary information. We believe, however, that such unauthorized use is and can be expected to be a persistent problem that negatively impacts our revenue and financial results. Additional uncertainty may result from recent and future changes to intellectual property legislation in the United States and other countries and from interpretations of the intellectual property laws of the United States and other countries by applicable courts and agencies. Further, although we endeavor to enter into non-disclosure agreements with our employees,
33

FOR
M 1
0-K
our business or operations, but they may require us to modify our data processing practices and policies and to incur substantial costs and expenses in an effort to comply.
Internationally, virtually every jurisdiction in which we operate has established its own data security and privacy or data protection legal framework with which we or our customers must comply. Laws and regulations in these jurisdictions apply broadly to the collection, use, storage, disclosure and security of data that identifies or may be used to identify or locate an individual. These laws and regulations often are more restrictive than those in the United States and are rapidly evolving. For example, the EU General Data Protection Regulation (“GDPR”) became effective on May 25, 2018, and, in addition to imposing stringent obligations relating to data protection and security, authorizes fines up to 4% of global annual revenue for some violations. We relied in part upon the EU-U.S. Privacy Shield Framework developed by the U.S. Department of Commerce and the European Commission and the Swiss-U.S. Privacy Shield Framework developed by the U.S. Department of Commerce and the Swiss Administration to provide U.S. companies with a valid data transfer mechanism under EU and Swiss law to permit them to transfer personal data from the European Union and Switzerland to the United States. On July 16, 2020, the Court of Justice of the European Union (“CJEU”) invalidated the EU-U.S. Privacy Shield, concluding it did not provide adequate protection for personal data transferred to the U.S. On September 8, 2020, the Swiss Federal Data Protection and Information Commissioner invalidated the Swiss-US Privacy Shield on similar grounds. In its July 16, 2020 opinion, the CJEU imposed additional obligations on companies when relying on standard contractual clauses approved by the European Commission (“SCCs”) to transfer personal data. The CJEU decision may result in European data protection regulators applying differing standards for, and requiring ad hoc verification of, transfers of personal data from Europe to the U.S. In November 2020, the European Commission released a draft of revised SCCs addressing the CJEU concerns. The European Data Protection Board (“EDPB”) also issued recommendations, and in January 2021, the EDPB and the European Data Protection Supervisor issued a joint opinion regarding those revised SCCs. The revised SCCs, the foregoing recommendations and opinions of regulators, and other developments relating to cross-border data transfer, may require us to implement additional contractual and technical safeguards for any personal data transferred out of the European Economic Area (“EEA”), which may increase compliance costs, lead to increased regulatory scrutiny or liability, and which may adversely impact our business, financial condition and operating results.
The United Kingdom enacted a Data Protection Act in May 2018 that substantially implements the GDPR, and has implemented legislation referred to as the “UK GDPR” that generally provides for the GDPR to be implemented in the UK following Brexit and the transition period that ended on December 31, 2020. While the EU has published draft decisions that the United Kingdom may be deemed an “adequate country” to which personal data could be exported from the EEA, this decision may face challenges in the future, creating uncertainty regarding transfers of personal data to the United Kingdom from the EEA. Our EMEA headquarters is in London, causing this uncertainty to be particularly significant to our operations. Some countries also are considering or have passed legislation requiring local storage and processing of data, or similar requirements, which could increase the cost and complexity of delivering our services.
Complying with the GDPR, the CCPA and the CPRA, or other laws, regulations, or other obligations relating to privacy, data protection, data localization or security in the U.S. or other regions worldwide may cause us to incur substantial operational costs or require us to modify our data handling practices. Non-compliance could result in proceedings against us by governmental entities or others, could result in substantial fines or other liability, and may otherwise adversely impact our business, financial condition and operating results.
Some statutory requirements, both in the United States and abroad, such as the Health Insurance Portability and Accountability Act of 1996 (“HIPAA”) and numerous state statutes, include obligations of companies to notify individuals of security breaches involving certain types of personal information, which could result from breaches experienced by us or our service providers. Any actual or perceived security breach or incident could impact our reputation, harm our customer confidence, hurt our sales and expansion into new markets or cause us to lose existing customers, and could expose us to potential liability or require us to expend significant resources on data security and in responding to any such actual or perceived breach or incident.
In addition to government regulation, self-regulatory standards and other industry standards may legally or contractually apply to us, be argued to apply to us, or we may elect to comply with such standards or to facilitate our customers’ compliance with such standards. Because privacy, data protection and data security are critical competitive factors in our industry, we may make statements on our website, in marketing materials, or in other settings about our data processing and data security measures and our compliance with, or our ability to facilitate our customers’ compliance with, these standards. We also expect that laws, regulations, industry standards and other obligations relating to privacy, data protection and security will continue to evolve worldwide, and that there will continue to be new, modified, and re-interpreted laws, regulations, standards, and other obligations in these areas. We cannot yet determine the impact such future laws, regulations and standards, or
32
amendments to or re-interpretations of, existing laws and regulations, industry standards, or other obligations may have on our business. New laws, amendments to or re-interpretations of existing laws and regulations, industry standards, and contractual and other obligations may require us to incur additional costs and restrict our business operations. Because the interpretation and application of laws, standards, contractual obligations and other obligations relating to privacy and data protection are uncertain, these laws, standards, and contractual and other obligations may be interpreted and applied in a manner that is, or is alleged to be, inconsistent with our data management practices, our policies or procedures, or the features of our offerings. If so, in addition to the possibility of fines, lawsuits and other claims, we may find it necessary or appropriate to fundamentally change our business activities and practices, including the establishment of localized data storage or other data processing operations, or modify or cease offering certain offerings either generally or in certain geographic regions, any of which could have an adverse effect on our business. We may be unable to make such changes and modifications in a commercially reasonable manner or at all, and our ability to develop new offerings and features could be limited. Furthermore, the costs of compliance with, and other burdens imposed by, the laws, regulations, and policies that are applicable to the businesses of our customers may limit the use and adoption of, and reduce the overall demand for, our offerings. Any inability to adequately address privacy, data protection or security-related concerns, even if unfounded, or to successfully negotiate privacy, data protection or security-related contractual terms with customers, or to comply with applicable laws, regulations and other obligations relating to privacy, data protection, and security, could result in additional cost and liability to us, damage our reputation, inhibit sales, slow our sales cycles, and adversely affect our business. Privacy and personal security concerns, whether valid or not valid, may inhibit market adoption of our offerings, particularly in certain industries and foreign countries.
Failure to protect our intellectual property rights could adversely affect our business and our brand.
Our success and ability to compete depends, in part, on our ability to protect our trade secrets, trademarks, copyrights, patents, know-how, confidential information, proprietary methods and technologies and other intellectual property and proprietary rights, so that we can prevent others from using our inventions, proprietary information and property. We generally rely on patent, copyright, trade secret and trademark laws, and confidentiality or license agreements with our employees, consultants, vendors, customers, partners and others, and generally limit access to and distribution of our proprietary information, in order to protect our intellectual property rights and maintain our competitive position. However, we cannot guarantee that the steps we take to protect our intellectual property rights will be effective.
Our issued patents and any patents issued in the future may not provide us with any competitive advantages, and our patent applications may never be granted. Additionally, the process of obtaining patent protection is expensive and time-consuming, and we may not be able to file and prosecute all necessary or desirable patent applications, or we may not be able to do so at a reasonable cost or in a timely manner. Even if issued, there can be no assurance that these patents will adequately protect our intellectual property, as the legal standards relating to the infringement, validity, enforceability and scope of protection of patent and other intellectual property rights are complex and often uncertain. Any patents that are issued, and any of our other intellectual property rights may be challenged by others and invalidated or narrowed through administrative process, litigation, or similar proceedings, allowing other companies to develop offerings that compete with ours, which could adversely affect our competitive business position, business prospects and financial condition. In addition, issuance of a patent does not guarantee that we have a right to practice the patented invention. We cannot be certain that we were the first to use the inventions claimed in our issued patents or pending patent applications or otherwise used in our offerings, that we were the first to file patent applications, or that third parties do not have blocking patents that could be used to prevent us from marketing or practicing our offerings or technology. Effective patent, trademark, copyright and trade secret protection may not be available to us in every country in which our offerings are available. The laws of some foreign countries may not be as protective of intellectual property rights as those in the United States (in particular, some foreign jurisdictions do not permit patent protection for software, and even in the United States, this protection is limited), and mechanisms for enforcement of intellectual property rights may be inadequate. We have filed for patents in the United States and in limited non-U.S. jurisdictions, but such protections may not be available or adequate in all countries in which we operate or in which we seek to enforce our intellectual property rights, or may be difficult to enforce in practice. For example, many foreign countries have compulsory licensing laws under which a patent owner must grant licenses to third parties. In addition, many countries limit the enforceability of patents against certain third parties, including government agencies or government contractors. In these countries, patents may provide limited or no benefit. As we expand our international activities, our exposure to unauthorized copying and use of our products and platform capabilities and proprietary information will likely increase. We are currently unable to measure the full extent of this unauthorized use of our products, platform capabilities, software, and proprietary information. We believe, however, that such unauthorized use is and can be expected to be a persistent problem that negatively impacts our revenue and financial results. Additional uncertainty may result from recent and future changes to intellectual property legislation in the United States and other countries and from interpretations of the intellectual property laws of the United States and other countries by applicable courts and agencies. Further, although we endeavor to enter into non-disclosure agreements with our employees,
33

licensees and others who may have access to confidential and proprietary information, we cannot assure that these agreements or other steps we have taken will prevent unauthorized use, disclosure or reverse engineering of our technology.
Moreover, third parties may independently develop technologies or products that compete with ours, and we may be unable to prevent this competition.
We might be required to spend significant resources to defend, monitor, and protect our intellectual property rights, such as by initiating claims or litigation against third parties for infringement of our proprietary rights or to establish the validity of our proprietary rights. However, we may not prevail in any lawsuits that we initiate, and the damages or other remedies awarded, if any, may not be adequate to compensate us for the harm suffered. Additionally, we may provoke third parties to assert counterclaims against us. Any litigation, whether or not it is resolved in our favor, could result in significant expense to us and divert the efforts of our technical and management personnel, which may adversely affect our business operations or financial results. For any of these reasons, despite our efforts, we may be unable to prevent third parties from infringing upon or misappropriating our intellectual property. If we fail to protect our intellectual property rights adequately, our competitors might gain access to our technology or use of our brand, and our business might be adversely affected.
We have been, and may in the future be, subject to intellectual property rights claims by third parties, which are extremely costly to defend, could require us to pay significant damages and could limit our ability to use certain technologies.
Companies in the software and technology industries, including some of our current and potential competitors, own large numbers of patents, copyrights, trademarks and trade secrets and frequently enter into litigation based on allegations of infringement or other violations of intellectual property rights. In addition, many of these companies have the capability to dedicate substantially greater resources to enforce their intellectual property rights and to defend claims that may be brought against them. The litigation may involve patent holding companies or other adverse patent owners that have no relevant product revenues and against which our patents may therefore provide little or no deterrence. From time-to-time, third parties, including certain of these leading companies and non-practicing entities, have asserted and may assert patent, copyright, trademark or other intellectual property rights against us, our partners, our technology partners or our customers. We have received, and may in the future receive, notices that claim we have misappropriated, misused, or infringed other parties’ intellectual property rights, including those obtained through acquisitions of new technologies, and, to the extent we gain greater market visibility, we face a higher risk of being the subject of intellectual property infringement claims, which is not uncommon with respect to the enterprise software market.
There may be third-party intellectual property rights, including issued or pending patents, that cover or claim to cover significant aspects of our technologies or business methods. We may be exposed to increased risk of being the subject of intellectual property infringement claims as a result of acquisitions, as, among other things, we have a lower level of visibility into the development process with respect to such technology or the care taken to safeguard against infringement risks. Any intellectual property claims, with or without merit, could be very time-consuming, could be expensive to settle or litigate and could divert our management’s attention and other resources. These claims could also subject us to significant liability for damages, potentially including treble damages or enhanced statutory damages if we are found to have willfully infringed patents or copyrights. These claims could also result in our having to stop using technology found to be in violation of a third-party’s rights. We might be required to seek a license for the intellectual property, which may not be available on reasonable terms or at all. Even if a license were available, we could be required to pay significant royalties, which would increase our operating expenses. As a result, we may be required to develop alternative non-infringing technology, which could require significant effort and expense. If we cannot license or develop technology for any infringing aspect of our business, we would be forced to limit or stop sales of our offerings and may be unable to compete effectively. Any of these results would adversely affect our business operations and financial results.
If we are not able to maintain and enhance our brand, our business and operating results may be adversely affected.
We believe that maintaining and enhancing the “Splunk” brand identity is critical to our relationships with current customers and partners and to our ability to attract new customers and partners. The successful promotion of our brand will depend largely upon our marketing efforts, our ability to continue to offer high-quality offerings and our ability to successfully differentiate our offerings from those of our competitors. For example, in September 2019, we launched the Data-to-Everything Platform marketing campaign to enhance the “Splunk” brand. This marketing campaign, as well as our general brand promotion activities, may not be successful or yield increased revenues. In addition, independent industry analysts often provide reviews of our offerings, as well as those of our competitors, and perception of our offerings in the marketplace may be significantly
34
influenced by these reviews. If these reviews are negative, or less positive as compared to those of our competitors’ products and services, our brand may be adversely affected.
Moreover, it may be difficult to maintain and enhance our brand in connection with sales through partners. We have and will continue to incur a substantial amount of expenditures in connection with our Data-to-Everything campaigns, and we anticipate that brand promotion expenditures will increase as our market becomes more competitive and as we attempt to grow our business. To the extent that these activities yield increased revenues, these revenues may not offset the increased expenses we incur. If we do not successfully maintain and enhance our brand, our business may not grow, we may have reduced pricing power relative to competitors with stronger brands, and we could lose customers and partners, all of which would adversely affect our business operations and financial results.
Our use of “open source” software could negatively affect our ability to sell our offerings and subject us to possible litigation, and our participation in open source projects may impose unanticipated burdens or restrictions.
We use open source software in our offerings and business, including as incorporated into software we receive from third party commercial software vendors or technologies obtained through acquisitions, and expect to continue to use open source software in the future. Use of open source software may entail greater risks than use of third-party commercial software. The terms of many open source licenses have not been interpreted by U.S. courts, and there is a risk that such licenses could be construed in a manner that imposes unanticipated conditions or restrictions on our ability to market or commercialize our products. We may face claims from others alleging breach of license requirements or infringement of intellectual property rights in what we believe to be licensed open source software. In addition, under the terms of some open source licenses, under certain conditions, we could be required to release our proprietary source code that was developed using, incorporating or linked with such open source software, or apply open source licenses to our proprietary software, including authorizing further modification and redistribution. These claims or requirements, including any change to the applicable license terms, could also result in litigation, require us to purchase a costly license, require us to devote additional research and development resources to change our offerings, or require us to cease offering the implicated products unless and until we can find alternative tools or re-engineer them to avoid infringement or release of our proprietary source code, any of which would have a negative effect on our business and operating results. In addition to risks related to license requirements, usage of open source software can lead to greater risks than use of third-party commercial software, as open source licensors generally do not provide updates, warranties, support, indemnities, assurances of title or controls on origin of the software, or other contractual protections regarding infringement claims or the quality of the code. Likewise, some open source projects have known security and other vulnerabilities and architectural instabilities, or are otherwise subject to security attacks due to their wide availability, and are provided on an “as-is” basis. Additionally, we, including companies that we acquired, have intentionally made certain proprietary software available on an open source basis, both by contributing modifications back to existing open source projects, and by making certain internally developed tools available pursuant to open source licenses, and we plan to continue to do so in the future. While we have established procedures, including a review process for any such contributions, which is designed to protect any code that may be competitively sensitive, we cannot guarantee that this process has always been applied consistently by us or by companies that we have acquired, prior to the acquisition. Even when applied, because any software source code we contribute to open source projects is publicly available, our ability to protect our intellectual property rights with respect to such software source code may be limited or lost entirely, and we may be unable to prevent our competitors or others from using such contributed software source code for competitive purposes, or for commercial or other purposes beyond what we intended. Many of these risks associated with usage of open source software could be difficult to eliminate or manage, and could, if not properly addressed, negatively affect the performance of our offerings and our business.
We increasingly rely on third-party providers of cloud infrastructure services to deliver our offerings to users on our platform, and any disruption of or interference with our use of these services could adversely affect our business.
Our cloud services, such as Splunk Cloud, are hosted exclusively by our Cloud Service Providers. We do not have control over the operations or the facilities of Cloud Service Providers that we use, and any changes in a Cloud Service Provider’s service levels, which may be less than 100%, may adversely affect our ability to meet the commitments we make to our customers and their requirements. We currently offer a 100% uptime service level agreement (“SLA”) for Splunk Cloud. It may become increasingly difficult to maintain and improve our performance, especially during peak usage times, as the usage of our offerings increases. If any of the services provided by the Cloud Service Providers fail or become unavailable due to extended outages, interruptions or because they are no longer available on commercially reasonable terms or prices, or if we are unable to deliver 100% uptime under our SLAs, our revenues could be reduced, our reputation could be damaged, we could be exposed to legal liability, expenses could increase, our ability to manage our finances could be interrupted and our processes for
35

FOR
M 1
0-K
licensees and others who may have access to confidential and proprietary information, we cannot assure that these agreements or other steps we have taken will prevent unauthorized use, disclosure or reverse engineering of our technology.
Moreover, third parties may independently develop technologies or products that compete with ours, and we may be unable to prevent this competition.
We might be required to spend significant resources to defend, monitor, and protect our intellectual property rights, such as by initiating claims or litigation against third parties for infringement of our proprietary rights or to establish the validity of our proprietary rights. However, we may not prevail in any lawsuits that we initiate, and the damages or other remedies awarded, if any, may not be adequate to compensate us for the harm suffered. Additionally, we may provoke third parties to assert counterclaims against us. Any litigation, whether or not it is resolved in our favor, could result in significant expense to us and divert the efforts of our technical and management personnel, which may adversely affect our business operations or financial results. For any of these reasons, despite our efforts, we may be unable to prevent third parties from infringing upon or misappropriating our intellectual property. If we fail to protect our intellectual property rights adequately, our competitors might gain access to our technology or use of our brand, and our business might be adversely affected.
We have been, and may in the future be, subject to intellectual property rights claims by third parties, which are extremely costly to defend, could require us to pay significant damages and could limit our ability to use certain technologies.
Companies in the software and technology industries, including some of our current and potential competitors, own large numbers of patents, copyrights, trademarks and trade secrets and frequently enter into litigation based on allegations of infringement or other violations of intellectual property rights. In addition, many of these companies have the capability to dedicate substantially greater resources to enforce their intellectual property rights and to defend claims that may be brought against them. The litigation may involve patent holding companies or other adverse patent owners that have no relevant product revenues and against which our patents may therefore provide little or no deterrence. From time-to-time, third parties, including certain of these leading companies and non-practicing entities, have asserted and may assert patent, copyright, trademark or other intellectual property rights against us, our partners, our technology partners or our customers. We have received, and may in the future receive, notices that claim we have misappropriated, misused, or infringed other parties’ intellectual property rights, including those obtained through acquisitions of new technologies, and, to the extent we gain greater market visibility, we face a higher risk of being the subject of intellectual property infringement claims, which is not uncommon with respect to the enterprise software market.
There may be third-party intellectual property rights, including issued or pending patents, that cover or claim to cover significant aspects of our technologies or business methods. We may be exposed to increased risk of being the subject of intellectual property infringement claims as a result of acquisitions, as, among other things, we have a lower level of visibility into the development process with respect to such technology or the care taken to safeguard against infringement risks. Any intellectual property claims, with or without merit, could be very time-consuming, could be expensive to settle or litigate and could divert our management’s attention and other resources. These claims could also subject us to significant liability for damages, potentially including treble damages or enhanced statutory damages if we are found to have willfully infringed patents or copyrights. These claims could also result in our having to stop using technology found to be in violation of a third-party’s rights. We might be required to seek a license for the intellectual property, which may not be available on reasonable terms or at all. Even if a license were available, we could be required to pay significant royalties, which would increase our operating expenses. As a result, we may be required to develop alternative non-infringing technology, which could require significant effort and expense. If we cannot license or develop technology for any infringing aspect of our business, we would be forced to limit or stop sales of our offerings and may be unable to compete effectively. Any of these results would adversely affect our business operations and financial results.
If we are not able to maintain and enhance our brand, our business and operating results may be adversely affected.
We believe that maintaining and enhancing the “Splunk” brand identity is critical to our relationships with current customers and partners and to our ability to attract new customers and partners. The successful promotion of our brand will depend largely upon our marketing efforts, our ability to continue to offer high-quality offerings and our ability to successfully differentiate our offerings from those of our competitors. For example, in September 2019, we launched the Data-to-Everything Platform marketing campaign to enhance the “Splunk” brand. This marketing campaign, as well as our general brand promotion activities, may not be successful or yield increased revenues. In addition, independent industry analysts often provide reviews of our offerings, as well as those of our competitors, and perception of our offerings in the marketplace may be significantly
34
influenced by these reviews. If these reviews are negative, or less positive as compared to those of our competitors’ products and services, our brand may be adversely affected.
Moreover, it may be difficult to maintain and enhance our brand in connection with sales through partners. We have and will continue to incur a substantial amount of expenditures in connection with our Data-to-Everything campaigns, and we anticipate that brand promotion expenditures will increase as our market becomes more competitive and as we attempt to grow our business. To the extent that these activities yield increased revenues, these revenues may not offset the increased expenses we incur. If we do not successfully maintain and enhance our brand, our business may not grow, we may have reduced pricing power relative to competitors with stronger brands, and we could lose customers and partners, all of which would adversely affect our business operations and financial results.
Our use of “open source” software could negatively affect our ability to sell our offerings and subject us to possible litigation, and our participation in open source projects may impose unanticipated burdens or restrictions.
We use open source software in our offerings and business, including as incorporated into software we receive from third party commercial software vendors or technologies obtained through acquisitions, and expect to continue to use open source software in the future. Use of open source software may entail greater risks than use of third-party commercial software. The terms of many open source licenses have not been interpreted by U.S. courts, and there is a risk that such licenses could be construed in a manner that imposes unanticipated conditions or restrictions on our ability to market or commercialize our products. We may face claims from others alleging breach of license requirements or infringement of intellectual property rights in what we believe to be licensed open source software. In addition, under the terms of some open source licenses, under certain conditions, we could be required to release our proprietary source code that was developed using, incorporating or linked with such open source software, or apply open source licenses to our proprietary software, including authorizing further modification and redistribution. These claims or requirements, including any change to the applicable license terms, could also result in litigation, require us to purchase a costly license, require us to devote additional research and development resources to change our offerings, or require us to cease offering the implicated products unless and until we can find alternative tools or re-engineer them to avoid infringement or release of our proprietary source code, any of which would have a negative effect on our business and operating results. In addition to risks related to license requirements, usage of open source software can lead to greater risks than use of third-party commercial software, as open source licensors generally do not provide updates, warranties, support, indemnities, assurances of title or controls on origin of the software, or other contractual protections regarding infringement claims or the quality of the code. Likewise, some open source projects have known security and other vulnerabilities and architectural instabilities, or are otherwise subject to security attacks due to their wide availability, and are provided on an “as-is” basis. Additionally, we, including companies that we acquired, have intentionally made certain proprietary software available on an open source basis, both by contributing modifications back to existing open source projects, and by making certain internally developed tools available pursuant to open source licenses, and we plan to continue to do so in the future. While we have established procedures, including a review process for any such contributions, which is designed to protect any code that may be competitively sensitive, we cannot guarantee that this process has always been applied consistently by us or by companies that we have acquired, prior to the acquisition. Even when applied, because any software source code we contribute to open source projects is publicly available, our ability to protect our intellectual property rights with respect to such software source code may be limited or lost entirely, and we may be unable to prevent our competitors or others from using such contributed software source code for competitive purposes, or for commercial or other purposes beyond what we intended. Many of these risks associated with usage of open source software could be difficult to eliminate or manage, and could, if not properly addressed, negatively affect the performance of our offerings and our business.
We increasingly rely on third-party providers of cloud infrastructure services to deliver our offerings to users on our platform, and any disruption of or interference with our use of these services could adversely affect our business.
Our cloud services, such as Splunk Cloud, are hosted exclusively by our Cloud Service Providers. We do not have control over the operations or the facilities of Cloud Service Providers that we use, and any changes in a Cloud Service Provider’s service levels, which may be less than 100%, may adversely affect our ability to meet the commitments we make to our customers and their requirements. We currently offer a 100% uptime service level agreement (“SLA”) for Splunk Cloud. It may become increasingly difficult to maintain and improve our performance, especially during peak usage times, as the usage of our offerings increases. If any of the services provided by the Cloud Service Providers fail or become unavailable due to extended outages, interruptions or because they are no longer available on commercially reasonable terms or prices, or if we are unable to deliver 100% uptime under our SLAs, our revenues could be reduced, our reputation could be damaged, we could be exposed to legal liability, expenses could increase, our ability to manage our finances could be interrupted and our processes for
35

managing sales of our offerings and supporting our customers could be impaired until equivalent services, if available, are identified, obtained and implemented, all of which could adversely affect our business, financial results and the usage of our offerings. If we are unable to renew our agreements with our Cloud Service Providers on commercially reasonable terms, or our agreement is prematurely terminated, or we need to add new Cloud Services Providers to increase capacity and uptime, we could experience interruptions, downtime, delays, and additional expenses related to transferring to and providing support for these new platforms. Any of the above circumstances or events may harm our reputation and brand, reduce the availability or usage of our platform and impair our ability to attract new users, any of which could adversely affect our business, financial condition and results of operations.
If we are unable to maintain successful relationships with our partners, and to help our partners enhance their ability to independently sell and deploy our offerings, our business operations, financial results and growth prospects could be adversely affected.
In addition to our direct sales force, we use partners, such as distributors and resellers, to license, provide professional services and support our offerings. Historically, we have relied on a limited number of such partners for a substantial portion of our total sales, particularly in the Europe, Middle East and Africa (“EMEA”) and Asia Pacific (“APAC”) regions, and for sales to government agencies. For example, sales through our top two partners represented 41% of our revenue in fiscal 2021. We expect that sales through partners in all regions will continue to be a significant portion of our revenues for the foreseeable future. As changes in our partner strategy are implemented, including potentially emphasizing partner-sourced transactions, results from sales through our partners may be adversely affected.
Our agreements with our partners are generally non-exclusive, meaning our partners may offer customers the products of several different companies, including products that compete with ours. If our partners do not effectively market and sell our offerings, choose to use greater efforts to market and sell their own products or those of our competitors, or fail to meet the needs of our customers, our ability to grow our business and sell our offerings may be adversely affected. Our partners may cease marketing our offerings with limited or no notice and with little or no penalty. The loss of a substantial number of our partners or any of our key partners, our possible inability to replace them, or the failure to recruit additional partners could materially and adversely affect our results of operations and could have an impact on the growth rate of our revenue as we work to obtain new partners or replacement relationships. In addition, sales by partners are more likely than direct sales to involve collectability and compliance concerns, in particular sales by our partners in developing markets, and accordingly, variations in the mix between revenues attributable to sales by partners and revenues attributable to direct sales may result in fluctuations in our operating results.
As we are transitioning our business model, the manner in which we conduct business with and compensate our partners, as well as the business demands placed upon our partners will likely change, requiring some of our historically effective partners to adapt their sales and marketing techniques to sell cloud services and term licenses. Such changes may lead to shorter duration contracts, which require more frequent customer contact by, and different business terms with, our partners. In some circumstances, new partners may be more effective in adapting to our new business model, particularly when such partners have experience selling cloud services. Therefore, our expectations for our partners, and our rubric for evaluating compatible partners may change, which may adversely impact our results of operations during the transition.
Our ability to achieve revenue growth in the future will depend in part on our success in maintaining successful relationships with our partners, and to help our partners enhance their ability to independently sell and deploy our offerings. In order to achieve these objectives, we may be required to adjust our incentives, pricing or discount programs for our partners, which could adversely affect our operating results. If we are unable to maintain our relationships with these partners, or otherwise develop and expand our indirect distribution channel, our business, results of operations, financial condition or cash flows could be adversely affected.
Our future performance depends in part on proper use of our community website, Splunkbase, expansion of our developer ecosystem, and support from third-party software developers.
Our offerings enable third-party software developers to build apps on top of our platform. We operate a community website, Splunkbase, for sharing these third-party apps, including add-ons and extensions. While we expect Splunkbase to support our sales and marketing efforts, it also presents certain risks to our business, including:
• third-party developers may not continue developing or supporting the software apps that they share on Splunkbase;
36
• we cannot guarantee that if and as we change the architecture of our products and services, third-party developers will evolve their existing software apps to be compatible or that they will participate in the creation of new apps utilizing the new architecture;
• we cannot provide any assurance that these apps meet the same quality and security standards that we apply to our own development efforts, and, to the extent they contain bugs, defects or security vulnerabilities, they may create disruptions in our customers’ use of our offerings or negatively affect our brand;
• we do not currently provide support for software apps developed by third-party software developers, and users may be left without support and potentially disappointed by their experience of using our offerings if the third-party software developers do not provide appropriate support for these apps;
• these third-party software developers may not possess the appropriate intellectual property rights to develop and share their apps or otherwise may not have assessed legal and compliance risks related to distributing their apps;
• some of these apps are hosted in external sites for a fee and are not controlled or reviewed by us, which may lead to a negative experience by customers that may impact our reputation; and
• some of these developers may use the insight they gain using our offerings and from documentation publicly available on our website to develop competing products.
Many of these risks are not within our control to prevent, and our brand may be damaged if these apps, add-ons and extensions do not perform to our customers’ satisfaction and that dissatisfaction is attributed to us.
If poor advice or misinformation is spread through our community website, Splunk Answers, users of our offerings may experience unsatisfactory results from using our offerings, which could adversely affect our reputation and our ability to grow our business.
We host Splunk Answers for sharing knowledge about how to perform certain functions with our offerings. Our users are increasingly turning to Splunk Answers for support in connection with their use of our offerings. We do not review or test the information that non-Splunk employees post on Splunk Answers to ensure its accuracy or efficacy in resolving technical issues. Therefore, we cannot ensure that all the information listed on Splunk Answers is accurate or that it will not adversely affect the performance of our offerings. Furthermore, users who post such information on Splunk Answers may not have adequate rights to the information to share it publicly, and we could be the subject of intellectual property claims based on our hosting of such information. If poor advice or misinformation is spread among users of Splunk Answers, our customers or other users of our offerings may experience unsatisfactory results from using our offerings, which could adversely affect our reputation and our ability to grow our business.
Servicing our debt requires a significant amount of cash, and we may not have sufficient cash flow from our business to pay our substantial debt.
Our ability to make scheduled payments of the principal of, to pay interest on or to refinance our indebtedness, including the $1.27 billion aggregate principal amount of 1.125% Convertible Senior Notes due 2027 (the “2027 Notes”), $776.7 million aggregate principal amount of 0.50% Convertible Senior Notes due 2023 (the “2023 Notes”) and $862.5 million aggregate principal amount of 1.125% Convertible Senior Notes due 2025 (the “2025 Notes” and collectively, the “Notes”) that we issued in June 2020 and September 2018, depends on our future performance, which is subject to economic, financial, competitive and other factors beyond our control. If the assumptions underlying our cash flow guidance are incorrect, for example, due to the unknown impacts of the COVID-19 pandemic, our business may not continue to generate cash flow from operations in the future sufficient to service our debt, including the Notes, and make necessary capital expenditures. If we are unable to generate such cash flow, we may be required to adopt one or more alternatives, such as selling assets, restructuring debt or issuing additional equity, equity-linked or debt instruments on terms that may be onerous or highly dilutive. Our ability to refinance our indebtedness will depend on the capital markets and our financial condition at such time. If we are unable to engage in any of these activities or engage in these activities on desirable terms, we may be unable to meet our debt obligations, including the Notes, which would materially and adversely impact our business, financial condition and operating results.
Conversion of the Notes may dilute the ownership interest of our stockholders or may otherwise depress the price of our common stock.
37

FOR
M 1
0-K
managing sales of our offerings and supporting our customers could be impaired until equivalent services, if available, are identified, obtained and implemented, all of which could adversely affect our business, financial results and the usage of our offerings. If we are unable to renew our agreements with our Cloud Service Providers on commercially reasonable terms, or our agreement is prematurely terminated, or we need to add new Cloud Services Providers to increase capacity and uptime, we could experience interruptions, downtime, delays, and additional expenses related to transferring to and providing support for these new platforms. Any of the above circumstances or events may harm our reputation and brand, reduce the availability or usage of our platform and impair our ability to attract new users, any of which could adversely affect our business, financial condition and results of operations.
If we are unable to maintain successful relationships with our partners, and to help our partners enhance their ability to independently sell and deploy our offerings, our business operations, financial results and growth prospects could be adversely affected.
In addition to our direct sales force, we use partners, such as distributors and resellers, to license, provide professional services and support our offerings. Historically, we have relied on a limited number of such partners for a substantial portion of our total sales, particularly in the Europe, Middle East and Africa (“EMEA”) and Asia Pacific (“APAC”) regions, and for sales to government agencies. For example, sales through our top two partners represented 41% of our revenue in fiscal 2021. We expect that sales through partners in all regions will continue to be a significant portion of our revenues for the foreseeable future. As changes in our partner strategy are implemented, including potentially emphasizing partner-sourced transactions, results from sales through our partners may be adversely affected.
Our agreements with our partners are generally non-exclusive, meaning our partners may offer customers the products of several different companies, including products that compete with ours. If our partners do not effectively market and sell our offerings, choose to use greater efforts to market and sell their own products or those of our competitors, or fail to meet the needs of our customers, our ability to grow our business and sell our offerings may be adversely affected. Our partners may cease marketing our offerings with limited or no notice and with little or no penalty. The loss of a substantial number of our partners or any of our key partners, our possible inability to replace them, or the failure to recruit additional partners could materially and adversely affect our results of operations and could have an impact on the growth rate of our revenue as we work to obtain new partners or replacement relationships. In addition, sales by partners are more likely than direct sales to involve collectability and compliance concerns, in particular sales by our partners in developing markets, and accordingly, variations in the mix between revenues attributable to sales by partners and revenues attributable to direct sales may result in fluctuations in our operating results.
As we are transitioning our business model, the manner in which we conduct business with and compensate our partners, as well as the business demands placed upon our partners will likely change, requiring some of our historically effective partners to adapt their sales and marketing techniques to sell cloud services and term licenses. Such changes may lead to shorter duration contracts, which require more frequent customer contact by, and different business terms with, our partners. In some circumstances, new partners may be more effective in adapting to our new business model, particularly when such partners have experience selling cloud services. Therefore, our expectations for our partners, and our rubric for evaluating compatible partners may change, which may adversely impact our results of operations during the transition.
Our ability to achieve revenue growth in the future will depend in part on our success in maintaining successful relationships with our partners, and to help our partners enhance their ability to independently sell and deploy our offerings. In order to achieve these objectives, we may be required to adjust our incentives, pricing or discount programs for our partners, which could adversely affect our operating results. If we are unable to maintain our relationships with these partners, or otherwise develop and expand our indirect distribution channel, our business, results of operations, financial condition or cash flows could be adversely affected.
Our future performance depends in part on proper use of our community website, Splunkbase, expansion of our developer ecosystem, and support from third-party software developers.
Our offerings enable third-party software developers to build apps on top of our platform. We operate a community website, Splunkbase, for sharing these third-party apps, including add-ons and extensions. While we expect Splunkbase to support our sales and marketing efforts, it also presents certain risks to our business, including:
• third-party developers may not continue developing or supporting the software apps that they share on Splunkbase;
36
• we cannot guarantee that if and as we change the architecture of our products and services, third-party developers will evolve their existing software apps to be compatible or that they will participate in the creation of new apps utilizing the new architecture;
• we cannot provide any assurance that these apps meet the same quality and security standards that we apply to our own development efforts, and, to the extent they contain bugs, defects or security vulnerabilities, they may create disruptions in our customers’ use of our offerings or negatively affect our brand;
• we do not currently provide support for software apps developed by third-party software developers, and users may be left without support and potentially disappointed by their experience of using our offerings if the third-party software developers do not provide appropriate support for these apps;
• these third-party software developers may not possess the appropriate intellectual property rights to develop and share their apps or otherwise may not have assessed legal and compliance risks related to distributing their apps;
• some of these apps are hosted in external sites for a fee and are not controlled or reviewed by us, which may lead to a negative experience by customers that may impact our reputation; and
• some of these developers may use the insight they gain using our offerings and from documentation publicly available on our website to develop competing products.
Many of these risks are not within our control to prevent, and our brand may be damaged if these apps, add-ons and extensions do not perform to our customers’ satisfaction and that dissatisfaction is attributed to us.
If poor advice or misinformation is spread through our community website, Splunk Answers, users of our offerings may experience unsatisfactory results from using our offerings, which could adversely affect our reputation and our ability to grow our business.
We host Splunk Answers for sharing knowledge about how to perform certain functions with our offerings. Our users are increasingly turning to Splunk Answers for support in connection with their use of our offerings. We do not review or test the information that non-Splunk employees post on Splunk Answers to ensure its accuracy or efficacy in resolving technical issues. Therefore, we cannot ensure that all the information listed on Splunk Answers is accurate or that it will not adversely affect the performance of our offerings. Furthermore, users who post such information on Splunk Answers may not have adequate rights to the information to share it publicly, and we could be the subject of intellectual property claims based on our hosting of such information. If poor advice or misinformation is spread among users of Splunk Answers, our customers or other users of our offerings may experience unsatisfactory results from using our offerings, which could adversely affect our reputation and our ability to grow our business.
Servicing our debt requires a significant amount of cash, and we may not have sufficient cash flow from our business to pay our substantial debt.
Our ability to make scheduled payments of the principal of, to pay interest on or to refinance our indebtedness, including the $1.27 billion aggregate principal amount of 1.125% Convertible Senior Notes due 2027 (the “2027 Notes”), $776.7 million aggregate principal amount of 0.50% Convertible Senior Notes due 2023 (the “2023 Notes”) and $862.5 million aggregate principal amount of 1.125% Convertible Senior Notes due 2025 (the “2025 Notes” and collectively, the “Notes”) that we issued in June 2020 and September 2018, depends on our future performance, which is subject to economic, financial, competitive and other factors beyond our control. If the assumptions underlying our cash flow guidance are incorrect, for example, due to the unknown impacts of the COVID-19 pandemic, our business may not continue to generate cash flow from operations in the future sufficient to service our debt, including the Notes, and make necessary capital expenditures. If we are unable to generate such cash flow, we may be required to adopt one or more alternatives, such as selling assets, restructuring debt or issuing additional equity, equity-linked or debt instruments on terms that may be onerous or highly dilutive. Our ability to refinance our indebtedness will depend on the capital markets and our financial condition at such time. If we are unable to engage in any of these activities or engage in these activities on desirable terms, we may be unable to meet our debt obligations, including the Notes, which would materially and adversely impact our business, financial condition and operating results.
Conversion of the Notes may dilute the ownership interest of our stockholders or may otherwise depress the price of our common stock.
37

The conversion of some or all of the Notes may dilute the ownership interests of our stockholders. Upon conversion of the Notes, we have the option to pay or deliver, as the case may be, cash, shares of our common stock, or a combination of cash and shares of our common stock. If we elect to settle our conversion obligation in shares of our common stock or a combination of cash and shares of our common stock, any sales in the public market of our common stock issuable upon such conversion could adversely affect prevailing market prices of our common stock. Holders of the Notes may hedge their positions in the Notes by entering into short positions with respect to the underlying common stock. In addition, any anticipated conversion of the Notes into shares of our common stock could depress the price of our common stock.
The conditional conversion feature of the Notes, if triggered, may adversely affect our financial condition and operating results.
In the event the conditional conversion feature of a series of Notes is triggered, holders of such Notes will be entitled under the applicable indenture governing such Notes to convert their Notes at any time during specified periods at their option. If one or more holders of a series of Notes elect to convert such Notes, unless we elect to satisfy our conversion obligation by delivering solely shares of our common stock, we would be required to settle a portion or all of our conversion obligation through the payment of cash, which could adversely affect our liquidity. In addition, in certain circumstances, such as conversion by holders or redemption, we could be required under applicable accounting rules to reclassify all or a portion of the outstanding principal of the relevant series of Notes as a current rather than long-term liability, which would result in a material reduction of our net working capital.
The accounting method for convertible debt securities that may be settled in cash, such as the Notes, could have a material effect on our reported financial results.
Under Accounting Standards Codification 470-20, Debt with Conversion and Other Options (“ASC 470-20”), an entity must separately account for the liability and equity components of the convertible debt instruments (such as the Notes) that may be settled entirely or partially in cash upon conversion in a manner that reflects the issuer’s economic interest cost. The effect of ASC 470-20 on the accounting for the Notes is that the equity component is required to be included in the additional paid-in capital section of stockholders’ equity in our consolidated balance sheet at issuance, and the value of the equity component is treated as a discount for purposes of accounting for the debt component of the Notes. As a result, we are required to record a greater amount of non-cash interest expense as a result of the amortization of the discounted carrying value of the Notes to their respective face amounts over their respective terms. We report larger net losses or lower net income in our financial results because ASC 470-20 requires interest to include both the amortization of the debt discount and the instrument’s coupon interest rate, which could adversely affect our reported or future financial results, the trading price of our common stock and the trading price of the Notes.
In addition, under certain circumstances, convertible debt instruments (such as the Notes) that may be settled entirely or partly in cash are currently accounted for utilizing the treasury stock method for earnings per share purposes, the effect of which is that the shares issuable upon conversion of a series of Notes are not included in the calculation of diluted earnings per share except to the extent that the conversion value of such series of Notes exceeds their principal amount. Under the treasury stock method, for diluted earnings per share purposes, the transaction is accounted for as if the number of shares of common stock that would be necessary to settle such excess, if we elected to settle such excess in shares, are issued.
We cannot be sure that the accounting standards in the future will continue to permit the use of the treasury stock method. For example, the FASB recently published an exposure draft proposing to amend these accounting standards to eliminate the treasury stock method for convertible instruments and instead require application of the “if-converted” method. Under that method, if it is adopted, diluted earnings per share would generally be calculated assuming that all the Notes were converted solely into shares of common stock at the beginning of the reporting period, unless the result would be anti-dilutive. If we are unable or otherwise elect not to use the treasury stock method in accounting for the shares issuable upon conversion of the Notes, then our diluted earnings per share would be negatively affected.
The Capped Calls may affect the value of our common stock.
In connection with the offerings of the Notes, we entered into privately negotiated capped call transactions with certain counterparties (collectively, the “Capped Calls”). The Capped Calls relating to the 2023 Notes cover, subject to customary adjustments, the number of shares of our common stock that will initially underlie the 2023 Notes, and the Capped Calls relating to the 2025 Notes cover, subject to customary adjustments, the number of shares of our common stock that will initially underlie the 2025 Notes, and the Capped Calls relating to the 2027 Notes cover, subject to customary adjustments, the number
38
of shares of our common stock that will initially underlie the 2027 Notes. The Capped Calls are expected generally to offset the potential dilution to our common stock as a result of any conversion of the relevant series of Notes. The counterparties to the Capped Calls may modify their hedge positions by entering into or unwinding various derivatives with respect to our common stock and/or purchasing or selling our common stock or other securities of ours in secondary market transactions prior to the maturity of the Notes (and are likely to do so on each exercise date for the Capped Calls, or following any termination of any portion of the Capped Calls in connection with any repurchase, redemption or early conversion of the Notes), which could increase or decrease the market price of our common stock. If any such Capped Calls fail to become effective, the counterparties may unwind their hedge positions with respect to our common stock, which could also adversely affect the price of our common stock.
We are subject to counterparty risk with respect to the Capped Calls.
The counterparties to the Capped Calls are financial institutions, and we will be subject to the risk that one or more of the counterparties may default, fail to perform or exercise their termination rights under the Capped Calls. Our exposure to the credit risk of the counterparties will not be secured by any collateral. If a counterparty to the Capped Calls becomes subject to insolvency proceedings, we will become an unsecured creditor in those proceedings with a claim equal to our exposure at the time under such transaction. Our exposure will depend on many factors but, generally, our exposure will increase if the market price or the volatility of our common stock increases. In addition, upon a default, failure to perform or a termination of the Capped Calls by a counterparty, we may suffer more dilution than we currently anticipate with respect to our common stock. We can provide no assurances as to the financial stability or viability of the counterparties.
Our stock price has been volatile, may continue to be volatile and may decline regardless of our financial performance.
The trading prices of the securities of technology companies have been highly volatile. The market price of our common stock has fluctuated significantly and may continue to fluctuate significantly in response to numerous factors, many of which are beyond our control, including:
• actual or anticipated fluctuations in our financial results;
• the financial projections we provide to the public, any changes in these projections or our failure to meet or exceed these projections;
• the impact of our shift to a subscription model, as well as increased annual invoicing and decreased multi-year upfront invoicing, which may impact our revenue, deferred revenue, cash collections, remaining performance obligations, gross margin and operating income;
• failure of securities analysts to initiate or maintain coverage of our company, changes in financial estimates by any securities analysts who follow our company, or our failure to meet these estimates or the expectations of investors;
• ratings changes by any securities analysts who follow our company;
• announcements by us or our competitors of significant technical innovations, acquisitions, strategic partnerships, joint ventures or capital commitments;
• changes in operating performance and stock market valuations of other technology companies generally, or those in our industry in particular;
• price and volume fluctuations in certain categories of companies or the overall stock market, including as a result of trends in the global economy;
• public health crises, such as the COVID-19 pandemic, and related measures by private industry and governments to protect the public health;
• general economic and political conditions and uncertainty, both domestically and internationally, as well as economic and political conditions and uncertainty specifically affecting industries in which our customers participate, including impacts from the COVID-19 pandemic;
• any major change in our board of directors or management;
39

FOR
M 1
0-K
The conversion of some or all of the Notes may dilute the ownership interests of our stockholders. Upon conversion of the Notes, we have the option to pay or deliver, as the case may be, cash, shares of our common stock, or a combination of cash and shares of our common stock. If we elect to settle our conversion obligation in shares of our common stock or a combination of cash and shares of our common stock, any sales in the public market of our common stock issuable upon such conversion could adversely affect prevailing market prices of our common stock. Holders of the Notes may hedge their positions in the Notes by entering into short positions with respect to the underlying common stock. In addition, any anticipated conversion of the Notes into shares of our common stock could depress the price of our common stock.
The conditional conversion feature of the Notes, if triggered, may adversely affect our financial condition and operating results.
In the event the conditional conversion feature of a series of Notes is triggered, holders of such Notes will be entitled under the applicable indenture governing such Notes to convert their Notes at any time during specified periods at their option. If one or more holders of a series of Notes elect to convert such Notes, unless we elect to satisfy our conversion obligation by delivering solely shares of our common stock, we would be required to settle a portion or all of our conversion obligation through the payment of cash, which could adversely affect our liquidity. In addition, in certain circumstances, such as conversion by holders or redemption, we could be required under applicable accounting rules to reclassify all or a portion of the outstanding principal of the relevant series of Notes as a current rather than long-term liability, which would result in a material reduction of our net working capital.
The accounting method for convertible debt securities that may be settled in cash, such as the Notes, could have a material effect on our reported financial results.
Under Accounting Standards Codification 470-20, Debt with Conversion and Other Options (“ASC 470-20”), an entity must separately account for the liability and equity components of the convertible debt instruments (such as the Notes) that may be settled entirely or partially in cash upon conversion in a manner that reflects the issuer’s economic interest cost. The effect of ASC 470-20 on the accounting for the Notes is that the equity component is required to be included in the additional paid-in capital section of stockholders’ equity in our consolidated balance sheet at issuance, and the value of the equity component is treated as a discount for purposes of accounting for the debt component of the Notes. As a result, we are required to record a greater amount of non-cash interest expense as a result of the amortization of the discounted carrying value of the Notes to their respective face amounts over their respective terms. We report larger net losses or lower net income in our financial results because ASC 470-20 requires interest to include both the amortization of the debt discount and the instrument’s coupon interest rate, which could adversely affect our reported or future financial results, the trading price of our common stock and the trading price of the Notes.
In addition, under certain circumstances, convertible debt instruments (such as the Notes) that may be settled entirely or partly in cash are currently accounted for utilizing the treasury stock method for earnings per share purposes, the effect of which is that the shares issuable upon conversion of a series of Notes are not included in the calculation of diluted earnings per share except to the extent that the conversion value of such series of Notes exceeds their principal amount. Under the treasury stock method, for diluted earnings per share purposes, the transaction is accounted for as if the number of shares of common stock that would be necessary to settle such excess, if we elected to settle such excess in shares, are issued.
We cannot be sure that the accounting standards in the future will continue to permit the use of the treasury stock method. For example, the FASB recently published an exposure draft proposing to amend these accounting standards to eliminate the treasury stock method for convertible instruments and instead require application of the “if-converted” method. Under that method, if it is adopted, diluted earnings per share would generally be calculated assuming that all the Notes were converted solely into shares of common stock at the beginning of the reporting period, unless the result would be anti-dilutive. If we are unable or otherwise elect not to use the treasury stock method in accounting for the shares issuable upon conversion of the Notes, then our diluted earnings per share would be negatively affected.
The Capped Calls may affect the value of our common stock.
In connection with the offerings of the Notes, we entered into privately negotiated capped call transactions with certain counterparties (collectively, the “Capped Calls”). The Capped Calls relating to the 2023 Notes cover, subject to customary adjustments, the number of shares of our common stock that will initially underlie the 2023 Notes, and the Capped Calls relating to the 2025 Notes cover, subject to customary adjustments, the number of shares of our common stock that will initially underlie the 2025 Notes, and the Capped Calls relating to the 2027 Notes cover, subject to customary adjustments, the number
38
of shares of our common stock that will initially underlie the 2027 Notes. The Capped Calls are expected generally to offset the potential dilution to our common stock as a result of any conversion of the relevant series of Notes. The counterparties to the Capped Calls may modify their hedge positions by entering into or unwinding various derivatives with respect to our common stock and/or purchasing or selling our common stock or other securities of ours in secondary market transactions prior to the maturity of the Notes (and are likely to do so on each exercise date for the Capped Calls, or following any termination of any portion of the Capped Calls in connection with any repurchase, redemption or early conversion of the Notes), which could increase or decrease the market price of our common stock. If any such Capped Calls fail to become effective, the counterparties may unwind their hedge positions with respect to our common stock, which could also adversely affect the price of our common stock.
We are subject to counterparty risk with respect to the Capped Calls.
The counterparties to the Capped Calls are financial institutions, and we will be subject to the risk that one or more of the counterparties may default, fail to perform or exercise their termination rights under the Capped Calls. Our exposure to the credit risk of the counterparties will not be secured by any collateral. If a counterparty to the Capped Calls becomes subject to insolvency proceedings, we will become an unsecured creditor in those proceedings with a claim equal to our exposure at the time under such transaction. Our exposure will depend on many factors but, generally, our exposure will increase if the market price or the volatility of our common stock increases. In addition, upon a default, failure to perform or a termination of the Capped Calls by a counterparty, we may suffer more dilution than we currently anticipate with respect to our common stock. We can provide no assurances as to the financial stability or viability of the counterparties.
Our stock price has been volatile, may continue to be volatile and may decline regardless of our financial performance.
The trading prices of the securities of technology companies have been highly volatile. The market price of our common stock has fluctuated significantly and may continue to fluctuate significantly in response to numerous factors, many of which are beyond our control, including:
• actual or anticipated fluctuations in our financial results;
• the financial projections we provide to the public, any changes in these projections or our failure to meet or exceed these projections;
• the impact of our shift to a subscription model, as well as increased annual invoicing and decreased multi-year upfront invoicing, which may impact our revenue, deferred revenue, cash collections, remaining performance obligations, gross margin and operating income;
• failure of securities analysts to initiate or maintain coverage of our company, changes in financial estimates by any securities analysts who follow our company, or our failure to meet these estimates or the expectations of investors;
• ratings changes by any securities analysts who follow our company;
• announcements by us or our competitors of significant technical innovations, acquisitions, strategic partnerships, joint ventures or capital commitments;
• changes in operating performance and stock market valuations of other technology companies generally, or those in our industry in particular;
• price and volume fluctuations in certain categories of companies or the overall stock market, including as a result of trends in the global economy;
• public health crises, such as the COVID-19 pandemic, and related measures by private industry and governments to protect the public health;
• general economic and political conditions and uncertainty, both domestically and internationally, as well as economic and political conditions and uncertainty specifically affecting industries in which our customers participate, including impacts from the COVID-19 pandemic;
• any major change in our board of directors or management;
39

• lawsuits threatened or filed against us;
• actual or perceived security breaches or incidents; and
• other events or factors, including those resulting from war, incidents of terrorism or responses to these events.
In addition, the stock markets, and in particular the market on which our common stock is listed, have experienced extreme price and volume fluctuations that have affected and continue to affect the market prices of equity securities of many technology companies. Stock prices of many technology companies have fluctuated in a manner unrelated or disproportionate to the financial performance of those companies. In the past, following periods of market volatility, securities class action litigation and stockholder derivative litigation have often been instituted. In December 2020, a putative class action lawsuit was filed in the U.S. District Court for the Northern District of California against us, our CEO and our CFO alleging violations of the Securities Exchange Act of 1934, as amended (the “Exchange Act”), for allegedly making materially false and misleading statements regarding our financial guidance. On March 16, 2021, the Court appointed lead plaintiff and lead counsel in the case. In February and March 2021, two derivative lawsuits related to the securities class action were filed. These lawsuits could subject us to substantial costs, divert resources and the attention of management from our business and adversely affect our business, results of operations, financial condition and cash flows. If we were to become involved in additional litigation in the future, it also could subject us to substantial costs, divert resources and the attention of management from our business and adversely affect our business, results of operations, financial condition and cash flows.
Climate change may have a long-term impact on our business.
The long-term effects of climate change on the global economy and the technology industry in particular are unclear, however we recognize that there are inherent climate related risks wherever business is conducted. Our business operations are subject to interruption by natural disasters, flooding, fire, power shortages, pandemics such as the COVID-19 pandemic, terrorism, political unrest, telecommunications failure, vandalism, cyber-attacks, geopolitical instability, war, the effects of climate change and other events beyond our control. For example, our California corporate offices are located near major seismic faults, and have also historically experienced, and are projected to continue to experience, climate-related events including drought and water scarcity, warmer temperatures, wildfires and air quality impacts and power shut-offs associated with wildfire prevention. Although we maintain crisis management and disaster response plans, such events could make it difficult or impossible for us to deliver our services to our customers, could decrease demand for our services, and could cause us to incur substantial expense. Our insurance may not be sufficient to cover losses or additional expenses that we may sustain. Climate-related events, including the increasing frequency of extreme weather events and their impact on critical infrastructure in the United States and elsewhere, have the potential to disrupt our business, our third-party suppliers, and/or the business of our customers, and may cause us to experience higher attrition, losses and additional costs to maintain and resume operations.
We could be subject to additional tax liabilities.
We are subject to federal, state and local taxes in the United States and numerous foreign jurisdictions. Significant judgment is required in evaluating our tax positions and our worldwide provision for taxes as there are many activities and transactions for which the ultimate tax determination is uncertain. The relevant taxing authorities may disagree with our determinations as to the income and expenses attributable to specific jurisdictions. If such a disagreement were to occur, and our position were not sustained, we could be required to pay additional taxes, interest and penalties, which could result in one-time tax charges, higher effective tax rates, reduced cash flows and lower overall profitability of our operations. At any given time, we are subject to routine inquiries from taxing jurisdictions worldwide and are working to resolve these various routine questions and potential errors. Our financial statements reflect our best judgement of needed reserves to cover known contingencies, but there can be no assurances on the final outcome of any tax assessment. In addition, our tax obligations and effective tax rates could be adversely affected by changes in the relevant tax, accounting and other laws, regulations, principles and interpretations, including those relating to income tax nexus, by our earnings being lower than anticipated in jurisdictions where we have lower statutory rates and higher than anticipated in jurisdictions where we have higher statutory rates, by challenges to our intercompany relationships and transfer pricing arrangements, by changes in foreign currency exchange rates, or by changes in the valuation of our deferred tax assets and liabilities. Many countries and organizations such as the Organization for Economic Cooperation and Development are actively considering changes to existing tax laws or have proposed or enacted new tax laws that could increase our tax liabilities in countries where we do business.
Changes in accounting pronouncements and other financial and nonfinancial reporting standards.
40
Generally accepted accounting principles in the United States (“U.S. GAAP”) are subject to interpretation by the Financial Accounting Standards Board (“FASB”), the SEC, and other various bodies formed to promulgate and interpret appropriate accounting principles. We regularly monitor our compliance with applicable financial reporting standards and review new pronouncements and interpretations that are relevant to us. As a result of new standards, changes to existing standards and changes in their interpretation, we may be required to change our accounting policies, to alter our operational policies to implement new or enhance existing systems so that they reflect new or amended financial reporting standards, and to adjust our published financial statements. Such changes may have an adverse effect on our business, financial position and operating results, or cause an adverse deviation from our revenue and operating profit targets, which may negatively impact our financial results.
In addition, as we work to align with the recommendations of the Sustainability Accounting Standards Board (“SASB”), and our own ESG materiality assessment, we have expanded and, in the future, may continue to expand our disclosures in these areas. Our failure to report accurately or achieve progress on our metrics on a timely basis, or at all, could adversely affect our reputation, business, financial performance and growth.
The requirements of being a public company and a growing and increasingly complex organization may strain our resources, divert management’s attention and affect our ability to attract and retain executive management and qualified board members.
We are subject to the reporting requirements of the Exchange Act, the Sarbanes-Oxley Act, the Dodd-Frank Act, the listing requirements of The NASDAQ Stock Market and other applicable securities rules and regulations. Compliance with these rules and regulations has increased and may continue to increase our legal and financial compliance costs, made some activities more difficult, time-consuming or costly and increased and will continue to increase demand on our systems and resources.
In addition, changing laws, regulations, standards and practices relating to corporate governance and public disclosure are creating uncertainty for public companies, increasing legal and financial compliance costs and making some activities more time consuming. These laws, regulations, standards and practices are subject to varying interpretations, in many cases due to their lack of specificity, and, as a result, their application in practice may evolve over time as regulatory and governing bodies provide new guidance or as market practices develop. This could result in continuing uncertainty regarding compliance matters and higher costs necessitated by ongoing revisions to disclosure and governance practices.
From time to time, public companies are subject to campaigns by investors seeking to increase short-term stockholder value through actions such as financial restructuring, increased debt, special dividends, stock repurchases, management changes or sales of assets or the entire company. If stockholders attempt to effect such changes or acquire control over us, responding to such actions would be costly, time-consuming and disruptive, which could adversely affect our results of operations, financial results and the value of our common stock. These factors could also make it more difficult for us to attract and retain qualified employees, executive officers and members of our board of directors.
Anti-takeover provisions in our charter documents and under Delaware law could make an acquisition of our company more difficult, limit attempts by our stockholders to replace or remove our current management and limit the market price of our common stock.
Provisions in our amended and restated certificate of incorporation and amended and restated bylaws may have the effect of delaying or preventing a change of control or changes in our management. Our amended and restated certificate of incorporation and amended and restated bylaws include provisions that:
• authorize our board of directors to issue, without further action by the stockholders, shares of undesignated preferred stock with terms, rights and preferences determined by our board of directors;
• require that any action to be taken by our stockholders be effected at a duly called annual or special meeting and not by written consent;
• specify that special meetings of our stockholders can be called only by our board of directors, the Chairman of our board of directors, or our Chief Executive Officer;
41

FOR
M 1
0-K
• lawsuits threatened or filed against us;
• actual or perceived security breaches or incidents; and
• other events or factors, including those resulting from war, incidents of terrorism or responses to these events.
In addition, the stock markets, and in particular the market on which our common stock is listed, have experienced extreme price and volume fluctuations that have affected and continue to affect the market prices of equity securities of many technology companies. Stock prices of many technology companies have fluctuated in a manner unrelated or disproportionate to the financial performance of those companies. In the past, following periods of market volatility, securities class action litigation and stockholder derivative litigation have often been instituted. In December 2020, a putative class action lawsuit was filed in the U.S. District Court for the Northern District of California against us, our CEO and our CFO alleging violations of the Securities Exchange Act of 1934, as amended (the “Exchange Act”), for allegedly making materially false and misleading statements regarding our financial guidance. On March 16, 2021, the Court appointed lead plaintiff and lead counsel in the case. In February and March 2021, two derivative lawsuits related to the securities class action were filed. These lawsuits could subject us to substantial costs, divert resources and the attention of management from our business and adversely affect our business, results of operations, financial condition and cash flows. If we were to become involved in additional litigation in the future, it also could subject us to substantial costs, divert resources and the attention of management from our business and adversely affect our business, results of operations, financial condition and cash flows.
Climate change may have a long-term impact on our business.
The long-term effects of climate change on the global economy and the technology industry in particular are unclear, however we recognize that there are inherent climate related risks wherever business is conducted. Our business operations are subject to interruption by natural disasters, flooding, fire, power shortages, pandemics such as the COVID-19 pandemic, terrorism, political unrest, telecommunications failure, vandalism, cyber-attacks, geopolitical instability, war, the effects of climate change and other events beyond our control. For example, our California corporate offices are located near major seismic faults, and have also historically experienced, and are projected to continue to experience, climate-related events including drought and water scarcity, warmer temperatures, wildfires and air quality impacts and power shut-offs associated with wildfire prevention. Although we maintain crisis management and disaster response plans, such events could make it difficult or impossible for us to deliver our services to our customers, could decrease demand for our services, and could cause us to incur substantial expense. Our insurance may not be sufficient to cover losses or additional expenses that we may sustain. Climate-related events, including the increasing frequency of extreme weather events and their impact on critical infrastructure in the United States and elsewhere, have the potential to disrupt our business, our third-party suppliers, and/or the business of our customers, and may cause us to experience higher attrition, losses and additional costs to maintain and resume operations.
We could be subject to additional tax liabilities.
We are subject to federal, state and local taxes in the United States and numerous foreign jurisdictions. Significant judgment is required in evaluating our tax positions and our worldwide provision for taxes as there are many activities and transactions for which the ultimate tax determination is uncertain. The relevant taxing authorities may disagree with our determinations as to the income and expenses attributable to specific jurisdictions. If such a disagreement were to occur, and our position were not sustained, we could be required to pay additional taxes, interest and penalties, which could result in one-time tax charges, higher effective tax rates, reduced cash flows and lower overall profitability of our operations. At any given time, we are subject to routine inquiries from taxing jurisdictions worldwide and are working to resolve these various routine questions and potential errors. Our financial statements reflect our best judgement of needed reserves to cover known contingencies, but there can be no assurances on the final outcome of any tax assessment. In addition, our tax obligations and effective tax rates could be adversely affected by changes in the relevant tax, accounting and other laws, regulations, principles and interpretations, including those relating to income tax nexus, by our earnings being lower than anticipated in jurisdictions where we have lower statutory rates and higher than anticipated in jurisdictions where we have higher statutory rates, by challenges to our intercompany relationships and transfer pricing arrangements, by changes in foreign currency exchange rates, or by changes in the valuation of our deferred tax assets and liabilities. Many countries and organizations such as the Organization for Economic Cooperation and Development are actively considering changes to existing tax laws or have proposed or enacted new tax laws that could increase our tax liabilities in countries where we do business.
Changes in accounting pronouncements and other financial and nonfinancial reporting standards.
40
Generally accepted accounting principles in the United States (“U.S. GAAP”) are subject to interpretation by the Financial Accounting Standards Board (“FASB”), the SEC, and other various bodies formed to promulgate and interpret appropriate accounting principles. We regularly monitor our compliance with applicable financial reporting standards and review new pronouncements and interpretations that are relevant to us. As a result of new standards, changes to existing standards and changes in their interpretation, we may be required to change our accounting policies, to alter our operational policies to implement new or enhance existing systems so that they reflect new or amended financial reporting standards, and to adjust our published financial statements. Such changes may have an adverse effect on our business, financial position and operating results, or cause an adverse deviation from our revenue and operating profit targets, which may negatively impact our financial results.
In addition, as we work to align with the recommendations of the Sustainability Accounting Standards Board (“SASB”), and our own ESG materiality assessment, we have expanded and, in the future, may continue to expand our disclosures in these areas. Our failure to report accurately or achieve progress on our metrics on a timely basis, or at all, could adversely affect our reputation, business, financial performance and growth.
The requirements of being a public company and a growing and increasingly complex organization may strain our resources, divert management’s attention and affect our ability to attract and retain executive management and qualified board members.
We are subject to the reporting requirements of the Exchange Act, the Sarbanes-Oxley Act, the Dodd-Frank Act, the listing requirements of The NASDAQ Stock Market and other applicable securities rules and regulations. Compliance with these rules and regulations has increased and may continue to increase our legal and financial compliance costs, made some activities more difficult, time-consuming or costly and increased and will continue to increase demand on our systems and resources.
In addition, changing laws, regulations, standards and practices relating to corporate governance and public disclosure are creating uncertainty for public companies, increasing legal and financial compliance costs and making some activities more time consuming. These laws, regulations, standards and practices are subject to varying interpretations, in many cases due to their lack of specificity, and, as a result, their application in practice may evolve over time as regulatory and governing bodies provide new guidance or as market practices develop. This could result in continuing uncertainty regarding compliance matters and higher costs necessitated by ongoing revisions to disclosure and governance practices.
From time to time, public companies are subject to campaigns by investors seeking to increase short-term stockholder value through actions such as financial restructuring, increased debt, special dividends, stock repurchases, management changes or sales of assets or the entire company. If stockholders attempt to effect such changes or acquire control over us, responding to such actions would be costly, time-consuming and disruptive, which could adversely affect our results of operations, financial results and the value of our common stock. These factors could also make it more difficult for us to attract and retain qualified employees, executive officers and members of our board of directors.
Anti-takeover provisions in our charter documents and under Delaware law could make an acquisition of our company more difficult, limit attempts by our stockholders to replace or remove our current management and limit the market price of our common stock.
Provisions in our amended and restated certificate of incorporation and amended and restated bylaws may have the effect of delaying or preventing a change of control or changes in our management. Our amended and restated certificate of incorporation and amended and restated bylaws include provisions that:
• authorize our board of directors to issue, without further action by the stockholders, shares of undesignated preferred stock with terms, rights and preferences determined by our board of directors;
• require that any action to be taken by our stockholders be effected at a duly called annual or special meeting and not by written consent;
• specify that special meetings of our stockholders can be called only by our board of directors, the Chairman of our board of directors, or our Chief Executive Officer;
41

• establish an advance notice procedure for stockholder proposals to be brought before an annual meeting, including proposed nominations of persons for election to our board of directors;
• establish that our board of directors is divided into three classes, Class I, Class II and Class III, with each class serving three-year staggered terms;
• prohibit cumulative voting in the election of directors;
• provide that our directors may be removed only for cause;
• provide that vacancies on our board of directors may be filled only by a majority of directors then in office, even though less than a quorum; and
• require the approval of our board of directors or the holders of a super majority of our outstanding shares of capital stock to amend our amended and restated bylaws and certain provisions of our amended and restated certificate of incorporation.
These provisions may frustrate or prevent any attempts by our stockholders to replace or remove our current management by making it more difficult for stockholders to replace members of our board of directors, which is responsible for appointing the members of our management. In addition, because we are incorporated in Delaware, we are governed by the provisions of Section 203 of the Delaware General Corporation Law, which generally prohibits a Delaware corporation from engaging in any of a broad range of business combinations with any “interested” stockholder for a period of three years following the date on which the stockholder became an “interested” stockholder.
Item 1B. Unresolved Staff Comments
None.
42
Item 2. Properties
Our corporate headquarters at 270 Brannan Street occupy approximately 182,000 square feet under an office lease wherein approximately 50% expires in February 2023 and the balance expires in February 2024. Additionally, we have an office lease for approximately 235,000 square feet located at 3098 Olsen Drive, San Jose, California that expires in August 2027 for our business operations, sales, support and product development. During the fiscal year ended January 31, 2019, we entered into an office lease for approximately 300,000 square feet located at 3060 Olsen Drive, San Jose, California. We lease smaller regional offices for our business operations, sales, support and some product development in various locations throughout the United States. Our foreign subsidiaries lease office space for their operations including local sales, support and some product development. While we believe our facilities are sufficient and suitable for our current operations, we are in the process of evaluating future office space needs and configurations to support our growing workforce post COVID-19.
Item 3. Legal Proceedings The information set forth under Legal Proceedings in Note 3 contained in the “Notes to Consolidated Financial
Statements” is incorporated herein by reference.
Item 4. Mine Safety Disclosures
Not applicable.
43

FOR
M 1
0-K
• establish an advance notice procedure for stockholder proposals to be brought before an annual meeting, including proposed nominations of persons for election to our board of directors;
• establish that our board of directors is divided into three classes, Class I, Class II and Class III, with each class serving three-year staggered terms;
• prohibit cumulative voting in the election of directors;
• provide that our directors may be removed only for cause;
• provide that vacancies on our board of directors may be filled only by a majority of directors then in office, even though less than a quorum; and
• require the approval of our board of directors or the holders of a super majority of our outstanding shares of capital stock to amend our amended and restated bylaws and certain provisions of our amended and restated certificate of incorporation.
These provisions may frustrate or prevent any attempts by our stockholders to replace or remove our current management by making it more difficult for stockholders to replace members of our board of directors, which is responsible for appointing the members of our management. In addition, because we are incorporated in Delaware, we are governed by the provisions of Section 203 of the Delaware General Corporation Law, which generally prohibits a Delaware corporation from engaging in any of a broad range of business combinations with any “interested” stockholder for a period of three years following the date on which the stockholder became an “interested” stockholder.
Item 1B. Unresolved Staff Comments
None.
42
Item 2. Properties
Our corporate headquarters at 270 Brannan Street occupy approximately 182,000 square feet under an office lease wherein approximately 50% expires in February 2023 and the balance expires in February 2024. Additionally, we have an office lease for approximately 235,000 square feet located at 3098 Olsen Drive, San Jose, California that expires in August 2027 for our business operations, sales, support and product development. During the fiscal year ended January 31, 2019, we entered into an office lease for approximately 300,000 square feet located at 3060 Olsen Drive, San Jose, California. We lease smaller regional offices for our business operations, sales, support and some product development in various locations throughout the United States. Our foreign subsidiaries lease office space for their operations including local sales, support and some product development. While we believe our facilities are sufficient and suitable for our current operations, we are in the process of evaluating future office space needs and configurations to support our growing workforce post COVID-19.
Item 3. Legal Proceedings The information set forth under Legal Proceedings in Note 3 contained in the “Notes to Consolidated Financial
Statements” is incorporated herein by reference.
Item 4. Mine Safety Disclosures
Not applicable.
43

PART II
Item 5. Market for Registrant’s Common Equity, Related Stockholder Matters and Issuer Purchases of Equity Securities
Common Stock
Our common stock, $0.001 par value, began trading on the NASDAQ Global Select Market on April 19, 2012, where its prices are quoted under the symbol “SPLK.” As of January 31, 2021, there were 59 holders of record of our common stock. Because many of our shares of common stock are held by brokers and other institutions on behalf of stockholders, we are unable to estimate the total number of beneficial holders represented by these record holders, but it is well in excess of the number of record holders.
Stock Performance Graph
This chart compares the cumulative total return on our common stock with that of the NASDAQ Composite index and the NASDAQ Computer index for each of the last five fiscal years ended January 31, 2021, assuming an initial investment of $100. The NASDAQ Computer index utilizes the same methods of presentation and assumptions for the total return calculation as does Splunk and the NASDAQ Composite index.
Period Ending
Inde
x V
alue
Splunk Inc. Comparison of Total Return Performance
Splunk Inc. NASDAQ Composite NASDAQ Computer
Jan 16 Jan 17 Jan 18 Jan 19 Jan 20 Jan 210
0.1
0.2
0.3
0.4
Company/Index 1/31/16 1/31/17 1/31/18 1/31/19 1/31/20 1/31/21
Splunk Inc. $ 100.00 $ 124.99 $ 199.55 $ 269.69 $ 335.41 $ 356.51 NASDAQ Composite $ 100.00 $ 123.23 $ 164.43 $ 163.31 $ 207.46 $ 298.92 NASDAQ Computer $ 100.00 $ 123.65 $ 174.81 $ 171.09 $ 246.18 $ 359.68
Item 6. Selected Financial Data
44
We have elected to early adopt the amendment to Item 301 of Regulation S-K and are omitting this disclosure in reliance thereon.
Item 7. Management’s Discussion and Analysis of Financial Condition and Results of Operations
The following discussion and analysis of our financial condition and results of operations should be read in conjunction with our consolidated financial statements and related notes appearing elsewhere in this Annual Report on Form 10-K. This discussion contains forward-looking statements based upon current expectations that involve risks and uncertainties. Our actual results may differ materially from those anticipated in these forward-looking statements as a result of various factors, including those set forth under “Risk Factors” included in Part I, Item 1A or in other parts of this report.
The following section generally discusses fiscal 2021 and 2020 items and year-to-year comparisons between fiscal 2021 and 2020. Discussions of fiscal 2019 items and year-to-year comparisons between fiscal 2020 and 2019 that are not included in this Form 10-K can be found in “Management’s Discussion and Analysis of Financial Condition and Results of Operations” in Part II, Item 7 of our Annual Report on Form 10-K for the fiscal year ended January 31, 2020, and are incorporated herein by reference.
Amounts reported in millions are rounded based on the amounts in thousands. As a result, the sum of the components reported in millions may not equal the total amount reported in millions due to rounding. In addition, percentages presented are calculated from the underlying numbers in thousands and may not add to their respective totals due to rounding.
Overview
Splunk provides innovative cloud and software offerings that deliver and operationalize insights from data generated by digital systems. This data is growing significantly as a direct result of the prevalence and importance of digital systems used by today’s organizations. Decades of investment in digital transformation have integrated the hardware and software that comprise digital systems into every aspect of how modern organizations operate. The data generated by these systems contains a comprehensive, real-time record of operations, interactions, and transactions that our offerings convert into insights that improve technology and business outcomes. Our solutions for Security, Information Technology (“IT”) Operations, and Observability empower users in technology roles, including application development, IT operations, and cyber security, to monitor and secure digital systems more quickly and efficiently. Business users leverage our offerings to gain visibility to their digital processes in order to deliver better experiences, improve decisions and drive better results in areas including supply chain, inbound and outbound logistics, manufacturing, sales, and service.
Our offerings provide visibility to our customers’ diverse technology infrastructure including systems deployed on the edge, on premises, and in private and public cloud environments, running software ranging from embedded through monolithic apps to cloud native ones. We also believe our offerings empower operational transformation, helping customers move from reactive, non-scalable and ineffective approaches to proactive, automated, and AI-assisted processes that drive better outcomes even as the scale and complexity of their infrastructures continue to grow.
The events of 2020 significantly increased the importance of being a digital, data-driven enterprise. The COVID-19 pandemic is exerting an enormous amount of pressure on organizations of all kinds to support new ways of working, to deliver better experiences and outcomes, and to enable entirely new offerings and business models. We believe that Splunk enables organizations to rise to these challenges by leveraging technology to achieve greater efficiency, agility, security, and drive a sustained competitive advantage.
We typically base our cloud services annual subscription fees on either the volume of data indexed per day including a fixed amount of data storage, or purchased infrastructure and data storage our customers require. We recognize the revenues associated with our cloud services ratably over the associated subscription term. For our software offerings, we typically base the license fees on either the estimated daily data indexing capacity or the compute power our customers require and we generally recognize the license fee portion of these arrangements upfront. As a result, the timing of when we enter into large license contracts may lead to fluctuations in our revenues and operating results because our expenses are largely fixed in the short-term.
45

FOR
M 1
0-K
PART II
Item 5. Market for Registrant’s Common Equity, Related Stockholder Matters and Issuer Purchases of Equity Securities
Common Stock
Our common stock, $0.001 par value, began trading on the NASDAQ Global Select Market on April 19, 2012, where its prices are quoted under the symbol “SPLK.” As of January 31, 2021, there were 59 holders of record of our common stock. Because many of our shares of common stock are held by brokers and other institutions on behalf of stockholders, we are unable to estimate the total number of beneficial holders represented by these record holders, but it is well in excess of the number of record holders.
Stock Performance Graph
This chart compares the cumulative total return on our common stock with that of the NASDAQ Composite index and the NASDAQ Computer index for each of the last five fiscal years ended January 31, 2021, assuming an initial investment of $100. The NASDAQ Computer index utilizes the same methods of presentation and assumptions for the total return calculation as does Splunk and the NASDAQ Composite index.
Period Ending
Inde
x V
alue
Splunk Inc. Comparison of Total Return Performance
Splunk Inc. NASDAQ Composite NASDAQ Computer
Jan 16 Jan 17 Jan 18 Jan 19 Jan 20 Jan 210
0.1
0.2
0.3
0.4
Company/Index 1/31/16 1/31/17 1/31/18 1/31/19 1/31/20 1/31/21
Splunk Inc. $ 100.00 $ 124.99 $ 199.55 $ 269.69 $ 335.41 $ 356.51 NASDAQ Composite $ 100.00 $ 123.23 $ 164.43 $ 163.31 $ 207.46 $ 298.92 NASDAQ Computer $ 100.00 $ 123.65 $ 174.81 $ 171.09 $ 246.18 $ 359.68
Item 6. Selected Financial Data
44
We have elected to early adopt the amendment to Item 301 of Regulation S-K and are omitting this disclosure in reliance thereon.
Item 7. Management’s Discussion and Analysis of Financial Condition and Results of Operations
The following discussion and analysis of our financial condition and results of operations should be read in conjunction with our consolidated financial statements and related notes appearing elsewhere in this Annual Report on Form 10-K. This discussion contains forward-looking statements based upon current expectations that involve risks and uncertainties. Our actual results may differ materially from those anticipated in these forward-looking statements as a result of various factors, including those set forth under “Risk Factors” included in Part I, Item 1A or in other parts of this report.
The following section generally discusses fiscal 2021 and 2020 items and year-to-year comparisons between fiscal 2021 and 2020. Discussions of fiscal 2019 items and year-to-year comparisons between fiscal 2020 and 2019 that are not included in this Form 10-K can be found in “Management’s Discussion and Analysis of Financial Condition and Results of Operations” in Part II, Item 7 of our Annual Report on Form 10-K for the fiscal year ended January 31, 2020, and are incorporated herein by reference.
Amounts reported in millions are rounded based on the amounts in thousands. As a result, the sum of the components reported in millions may not equal the total amount reported in millions due to rounding. In addition, percentages presented are calculated from the underlying numbers in thousands and may not add to their respective totals due to rounding.
Overview
Splunk provides innovative cloud and software offerings that deliver and operationalize insights from data generated by digital systems. This data is growing significantly as a direct result of the prevalence and importance of digital systems used by today’s organizations. Decades of investment in digital transformation have integrated the hardware and software that comprise digital systems into every aspect of how modern organizations operate. The data generated by these systems contains a comprehensive, real-time record of operations, interactions, and transactions that our offerings convert into insights that improve technology and business outcomes. Our solutions for Security, Information Technology (“IT”) Operations, and Observability empower users in technology roles, including application development, IT operations, and cyber security, to monitor and secure digital systems more quickly and efficiently. Business users leverage our offerings to gain visibility to their digital processes in order to deliver better experiences, improve decisions and drive better results in areas including supply chain, inbound and outbound logistics, manufacturing, sales, and service.
Our offerings provide visibility to our customers’ diverse technology infrastructure including systems deployed on the edge, on premises, and in private and public cloud environments, running software ranging from embedded through monolithic apps to cloud native ones. We also believe our offerings empower operational transformation, helping customers move from reactive, non-scalable and ineffective approaches to proactive, automated, and AI-assisted processes that drive better outcomes even as the scale and complexity of their infrastructures continue to grow.
The events of 2020 significantly increased the importance of being a digital, data-driven enterprise. The COVID-19 pandemic is exerting an enormous amount of pressure on organizations of all kinds to support new ways of working, to deliver better experiences and outcomes, and to enable entirely new offerings and business models. We believe that Splunk enables organizations to rise to these challenges by leveraging technology to achieve greater efficiency, agility, security, and drive a sustained competitive advantage.
We typically base our cloud services annual subscription fees on either the volume of data indexed per day including a fixed amount of data storage, or purchased infrastructure and data storage our customers require. We recognize the revenues associated with our cloud services ratably over the associated subscription term. For our software offerings, we typically base the license fees on either the estimated daily data indexing capacity or the compute power our customers require and we generally recognize the license fee portion of these arrangements upfront. As a result, the timing of when we enter into large license contracts may lead to fluctuations in our revenues and operating results because our expenses are largely fixed in the short-term.
45

Our revenue mix has shifted from sales of licenses to sales of cloud services and we expect it will continue to shift in favor of cloud services. Our transition to a predominantly cloud services delivery model has impacted, and it will continue to impact the timing of our recognition of revenue as an increasing percentage of our sales becomes recognized ratably, as well as impact our operating margins as cloud services become a larger percentage of our sales. Our shift to a subscription model has happened faster than we expected, and our ability to predict our revenue and margins in any particular period has been, and may continue to be, limited. We have also shifted from generally invoicing our multi-year contracts upfront to invoicing on an annual basis. Accordingly, we have seen the timing of our cash collections extend over a longer period of time with the transition to a subscription model than it has historically, and we expect this to negatively impact operating cash flows through at least fiscal 2022.
We intend to continue investing for long-term growth. We have invested and intend to continue to invest in product development to deliver additional features and performance enhancements, deployment models and solutions that can address new end markets. We expect to continue to expand our sales and marketing organizations to market and sell our software both in the United States and internationally.
We have utilized and expect to continue to utilize acquisitions to contribute to our long-term growth objectives. During fiscal 2021, we acquired companies that expand our observability capabilities, including companies that offer auto-instrumentation, real user monitoring, application performance monitoring, advanced synthetic monitoring, web optimization and network performance monitoring. Refer to Note 6 of our accompanying Notes to Consolidated Financial Statements included elsewhere in this Annual Report on Form 10-K for further information.
Impact of COVID-19 on our Business
In December 2019, COVID-19 was reported in China, in January 2020 the World Health Organization (“WHO”) declared it a Public Health Emergency of International Concern, and in March 2020 the WHO declared it a pandemic. This pandemic has had widespread, rapidly evolving, and unpredictable impacts on global economies, financial markets and business practices, and we anticipate governments and businesses will continue to take additional actions or extend existing actions to respond to the ongoing risks of the COVID-19 pandemic. The pandemic has impacted, and could further impact, our business and that of our customers as a result of quarantines, various local, state and federal government public health orders, and other restrictions. For example, we temporarily closed the majority of our global offices, required most of our employees to work remotely, implemented travel restrictions, and shifted certain of our customer-focused and corporate events to online-only experiences. Macroeconomic uncertainties resulting from the COVID-19 pandemic have also caused some of our customers to delay spending commitments, particularly for certain high-dollar and long-term contracts. The long-term impact of COVID-19 on our operational and financial performance will depend on certain developments, including the duration, spread, severity and potential recurrence of the virus. Our future performance will also depend on the impact of COVID-19 on our customers, partners, employee productivity and sales cycles, including as a result of travel restrictions. These potential developments are uncertain and cannot be predicted and as such, the extent to which COVID-19 will impact our business, operations, financial condition and results of operations over the long term is unknown. If we experience an increase in curtailed customer demand, reduced customer spend or contract duration, delayed collections, lengthened payment terms, lengthened sales cycles or competition due to changes in terms and conditions and pricing of our competitors’ products and services, our business, results of operations and overall financial performance in future periods could be materially adversely affected. Furthermore, due to our shift to a subscription model, the effect of COVID-19 may not be fully reflected in our results of operations and overall financial performance until future periods. For additional discussion of the potential impacts of the COVID-19 pandemic on our business, operating results and financial condition, refer to “Risk Factors” in Part I, Item 1A of this Annual Report on Form 10-K.
46
Key Business Metrics
We use certain key financial and operating metrics to evaluate our performance and monitor the growth of our recurring revenue as we continue to shift to a subscription model.
Annual Recurring Revenue
We use total annual recurring revenue (“Total ARR”) and cloud annual recurring revenue (“Cloud ARR”) to identify the annual recurring value of customer contracts at the end of a reporting period and to monitor the growth of our recurring business as we continue to shift to a subscription model. Total ARR represents the annualized revenue run-rate of active subscription, term license and maintenance contracts at the end of a reporting period. Cloud ARR represents the annualized revenue run-rate of active subscription contracts at the end of a reporting period. Each contract is annualized by dividing the contract value by the number of days in the contract term and then multiplying by 365. ARR should be viewed independently of revenue, and does not represent our revenue under U.S. GAAP on an annualized basis, as it is an operating metric that can be impacted by contract start and end dates and renewal rates. ARR is not intended to be a replacement or forecasts of revenue.
The following presents our Cloud ARR and Total ARR (in millions):
Cloud ARR
$442
$810
2020 2021
Total ARR
$1,680
$2,365
2020 2021
Number of Customers with Total ARR Greater than $1 Million
We monitor the total number of customers with Total ARR greater than $1 million at the end of a reporting period. An increase in this metric is an indicator of our ability to attract and scale with large enterprise customers who may have a more broad array of use cases that align with the Splunk Platform. The following presents our number of customers with Total ARR greater than $1 million:
Number of Customers withTotal ARR > $1 Million
355
510
2020 2021
47

FOR
M 1
0-K
Our revenue mix has shifted from sales of licenses to sales of cloud services and we expect it will continue to shift in favor of cloud services. Our transition to a predominantly cloud services delivery model has impacted, and it will continue to impact the timing of our recognition of revenue as an increasing percentage of our sales becomes recognized ratably, as well as impact our operating margins as cloud services become a larger percentage of our sales. Our shift to a subscription model has happened faster than we expected, and our ability to predict our revenue and margins in any particular period has been, and may continue to be, limited. We have also shifted from generally invoicing our multi-year contracts upfront to invoicing on an annual basis. Accordingly, we have seen the timing of our cash collections extend over a longer period of time with the transition to a subscription model than it has historically, and we expect this to negatively impact operating cash flows through at least fiscal 2022.
We intend to continue investing for long-term growth. We have invested and intend to continue to invest in product development to deliver additional features and performance enhancements, deployment models and solutions that can address new end markets. We expect to continue to expand our sales and marketing organizations to market and sell our software both in the United States and internationally.
We have utilized and expect to continue to utilize acquisitions to contribute to our long-term growth objectives. During fiscal 2021, we acquired companies that expand our observability capabilities, including companies that offer auto-instrumentation, real user monitoring, application performance monitoring, advanced synthetic monitoring, web optimization and network performance monitoring. Refer to Note 6 of our accompanying Notes to Consolidated Financial Statements included elsewhere in this Annual Report on Form 10-K for further information.
Impact of COVID-19 on our Business
In December 2019, COVID-19 was reported in China, in January 2020 the World Health Organization (“WHO”) declared it a Public Health Emergency of International Concern, and in March 2020 the WHO declared it a pandemic. This pandemic has had widespread, rapidly evolving, and unpredictable impacts on global economies, financial markets and business practices, and we anticipate governments and businesses will continue to take additional actions or extend existing actions to respond to the ongoing risks of the COVID-19 pandemic. The pandemic has impacted, and could further impact, our business and that of our customers as a result of quarantines, various local, state and federal government public health orders, and other restrictions. For example, we temporarily closed the majority of our global offices, required most of our employees to work remotely, implemented travel restrictions, and shifted certain of our customer-focused and corporate events to online-only experiences. Macroeconomic uncertainties resulting from the COVID-19 pandemic have also caused some of our customers to delay spending commitments, particularly for certain high-dollar and long-term contracts. The long-term impact of COVID-19 on our operational and financial performance will depend on certain developments, including the duration, spread, severity and potential recurrence of the virus. Our future performance will also depend on the impact of COVID-19 on our customers, partners, employee productivity and sales cycles, including as a result of travel restrictions. These potential developments are uncertain and cannot be predicted and as such, the extent to which COVID-19 will impact our business, operations, financial condition and results of operations over the long term is unknown. If we experience an increase in curtailed customer demand, reduced customer spend or contract duration, delayed collections, lengthened payment terms, lengthened sales cycles or competition due to changes in terms and conditions and pricing of our competitors’ products and services, our business, results of operations and overall financial performance in future periods could be materially adversely affected. Furthermore, due to our shift to a subscription model, the effect of COVID-19 may not be fully reflected in our results of operations and overall financial performance until future periods. For additional discussion of the potential impacts of the COVID-19 pandemic on our business, operating results and financial condition, refer to “Risk Factors” in Part I, Item 1A of this Annual Report on Form 10-K.
46
Key Business Metrics
We use certain key financial and operating metrics to evaluate our performance and monitor the growth of our recurring revenue as we continue to shift to a subscription model.
Annual Recurring Revenue
We use total annual recurring revenue (“Total ARR”) and cloud annual recurring revenue (“Cloud ARR”) to identify the annual recurring value of customer contracts at the end of a reporting period and to monitor the growth of our recurring business as we continue to shift to a subscription model. Total ARR represents the annualized revenue run-rate of active subscription, term license and maintenance contracts at the end of a reporting period. Cloud ARR represents the annualized revenue run-rate of active subscription contracts at the end of a reporting period. Each contract is annualized by dividing the contract value by the number of days in the contract term and then multiplying by 365. ARR should be viewed independently of revenue, and does not represent our revenue under U.S. GAAP on an annualized basis, as it is an operating metric that can be impacted by contract start and end dates and renewal rates. ARR is not intended to be a replacement or forecasts of revenue.
The following presents our Cloud ARR and Total ARR (in millions):
Cloud ARR
$442
$810
2020 2021
Total ARR
$1,680
$2,365
2020 2021
Number of Customers with Total ARR Greater than $1 Million
We monitor the total number of customers with Total ARR greater than $1 million at the end of a reporting period. An increase in this metric is an indicator of our ability to attract and scale with large enterprise customers who may have a more broad array of use cases that align with the Splunk Platform. The following presents our number of customers with Total ARR greater than $1 million:
Number of Customers withTotal ARR > $1 Million
355
510
2020 2021
47

Dollar-Based Net Retention Rate
We quantify our net expansion across existing cloud customers through our cloud dollar-based net retention rate (“Cloud DBNRR”). We calculate Cloud DBNRR by dividing the Total ARR from our cloud customer base at the end of a period (“Cloud Current Period ARR”) by the ARR of the same group of customers at the beginning of that 12-month period. Cloud Current Period ARR includes existing customer renewals and expansion, is net of existing customer contraction and churn, and excludes new customers. For the trailing 12-month Cloud DBNRR, we take the dollar-weighted average of the Cloud DBNRR over the trailing 12 months. The following presents our trailing 12-month Cloud DBNRR:
Trailing 12-MonthCloud DBNRR
133% 129%
2020 2021
Financial Summary(Dollars in millions)
Total Revenues$2,358.9 $2,229.4
2020 2021
GAAPOperating Loss
$(287.1)
$(780.2)
2020 2021
Non-GAAPOperating Income
(Loss) *$335.1
$(85.0)
2020 2021
Revenue FromCustomers LocatedOutside of the U.S.
29% 34%
2020 2021
GAAPNet Loss
$(336.7)
$(908.0)
2020 2021
Non-GAAPNet Income (Loss) *$296.6
$(87.1)
2020 2021
_________________________* Refer to Non-GAAP Financial Measures and Reconciliations below for further information.
48
Non-GAAP Financial Measures and Reconciliations
To supplement our consolidated financial statements, which are prepared and presented in accordance with generally accepted accounting principles in the United States (GAAP), we provide investors with the following non-GAAP financial measures: cloud services, cost of revenues, cloud services gross margin, cost of revenues, gross margin, research and development expense, sales and marketing expense, general and administrative expense, operating income (loss), operating margin, income tax provision (benefit), net income (loss), net income (loss) per share and free cash flow (collectively the “non-GAAP financial measures”). These non-GAAP financial measures exclude all or a combination of the following (as reflected in the following reconciliation tables): expenses related to stock-based compensation and related employer payroll tax, amortization of intangible assets, restructuring and facility exit charges, acquisition-related adjustments, capitalized software development costs, a legal settlement charge, non-cash interest expense related to convertible senior notes, a gain on extinguishment of convertible senior notes and a strategic investment impairment. The non-GAAP financial measures are also adjusted for our estimated tax rate on non-GAAP income (loss). To determine the estimated non-GAAP tax rate, we evaluate financial projections based on our non-GAAP results and the tax effect of those projections. The estimated non-GAAP tax rate takes into account many factors including our operating structure and tax positions. The non-GAAP tax rate applied for fiscal 2021 was 20%. The applicable fiscal 2020 tax rates are noted in the reconciliations. In addition, our non-GAAP financial measures include free cash flow, which represents operating cash flow less purchases of property and equipment. We consider free cash flow to be a liquidity measure that provides useful information to management and investors about the amount of cash generated or used by the business.
We exclude stock-based compensation expense because it is non-cash in nature and excluding this expense provides meaningful supplemental information regarding our operational performance and allows investors the ability to make more meaningful comparisons between our operating results and those of other companies. We exclude employer payroll tax expense related to employee stock plans in order for investors to see the full effect that excluding that stock-based compensation expense had on our operating results. These expenses are tied to the exercise or vesting of underlying equity awards and the price of our common stock at the time of vesting or exercise, which may vary from period to period independent of the operating performance of our business. We also exclude amortization of intangible assets, restructuring and facility exit charges, acquisition-related adjustments, capitalized software development costs, a legal settlement charge, non-cash interest expense related to convertible senior notes, a gain on extinguishment of convertible senior notes and a strategic investment impairment from our non-GAAP financial measures because these adjustments are considered by management to be outside of our core operating results.
There are limitations in using non-GAAP financial measures because the non-GAAP financial measures are not prepared in accordance with GAAP, may be different from non-GAAP financial measures used by our competitors and exclude expenses that may have a material impact upon our reported financial results. Further, stock-based compensation expense has been and will continue to be for the foreseeable future a significant recurring expense in our business and an important part of the compensation provided to our employees. The presentation of the non-GAAP financial measures is not intended to be considered in isolation or as a substitute for, or superior to, the financial information prepared and presented in accordance with GAAP. We use these non-GAAP financial measures for financial and operational decision-making purposes and as a means to evaluate period-to-period comparisons. We believe that these non-GAAP financial measures provide useful information about our operating results, enhance the overall understanding of past financial performance and future prospects and allow for greater transparency with respect to key metrics used by management in our financial and operational decision making. In addition, these non-GAAP financial measures facilitate comparisons to competitors’ operating results. The non-GAAP financial measures are meant to supplement and be viewed in conjunction with GAAP financial measures.
49

FOR
M 1
0-K
Dollar-Based Net Retention Rate
We quantify our net expansion across existing cloud customers through our cloud dollar-based net retention rate (“Cloud DBNRR”). We calculate Cloud DBNRR by dividing the Total ARR from our cloud customer base at the end of a period (“Cloud Current Period ARR”) by the ARR of the same group of customers at the beginning of that 12-month period. Cloud Current Period ARR includes existing customer renewals and expansion, is net of existing customer contraction and churn, and excludes new customers. For the trailing 12-month Cloud DBNRR, we take the dollar-weighted average of the Cloud DBNRR over the trailing 12 months. The following presents our trailing 12-month Cloud DBNRR:
Trailing 12-MonthCloud DBNRR
133% 129%
2020 2021
Financial Summary(Dollars in millions)
Total Revenues$2,358.9 $2,229.4
2020 2021
GAAPOperating Loss
$(287.1)
$(780.2)
2020 2021
Non-GAAPOperating Income
(Loss) *$335.1
$(85.0)
2020 2021
Revenue FromCustomers LocatedOutside of the U.S.
29% 34%
2020 2021
GAAPNet Loss
$(336.7)
$(908.0)
2020 2021
Non-GAAPNet Income (Loss) *$296.6
$(87.1)
2020 2021
_________________________* Refer to Non-GAAP Financial Measures and Reconciliations below for further information.
48
Non-GAAP Financial Measures and Reconciliations
To supplement our consolidated financial statements, which are prepared and presented in accordance with generally accepted accounting principles in the United States (GAAP), we provide investors with the following non-GAAP financial measures: cloud services, cost of revenues, cloud services gross margin, cost of revenues, gross margin, research and development expense, sales and marketing expense, general and administrative expense, operating income (loss), operating margin, income tax provision (benefit), net income (loss), net income (loss) per share and free cash flow (collectively the “non-GAAP financial measures”). These non-GAAP financial measures exclude all or a combination of the following (as reflected in the following reconciliation tables): expenses related to stock-based compensation and related employer payroll tax, amortization of intangible assets, restructuring and facility exit charges, acquisition-related adjustments, capitalized software development costs, a legal settlement charge, non-cash interest expense related to convertible senior notes, a gain on extinguishment of convertible senior notes and a strategic investment impairment. The non-GAAP financial measures are also adjusted for our estimated tax rate on non-GAAP income (loss). To determine the estimated non-GAAP tax rate, we evaluate financial projections based on our non-GAAP results and the tax effect of those projections. The estimated non-GAAP tax rate takes into account many factors including our operating structure and tax positions. The non-GAAP tax rate applied for fiscal 2021 was 20%. The applicable fiscal 2020 tax rates are noted in the reconciliations. In addition, our non-GAAP financial measures include free cash flow, which represents operating cash flow less purchases of property and equipment. We consider free cash flow to be a liquidity measure that provides useful information to management and investors about the amount of cash generated or used by the business.
We exclude stock-based compensation expense because it is non-cash in nature and excluding this expense provides meaningful supplemental information regarding our operational performance and allows investors the ability to make more meaningful comparisons between our operating results and those of other companies. We exclude employer payroll tax expense related to employee stock plans in order for investors to see the full effect that excluding that stock-based compensation expense had on our operating results. These expenses are tied to the exercise or vesting of underlying equity awards and the price of our common stock at the time of vesting or exercise, which may vary from period to period independent of the operating performance of our business. We also exclude amortization of intangible assets, restructuring and facility exit charges, acquisition-related adjustments, capitalized software development costs, a legal settlement charge, non-cash interest expense related to convertible senior notes, a gain on extinguishment of convertible senior notes and a strategic investment impairment from our non-GAAP financial measures because these adjustments are considered by management to be outside of our core operating results.
There are limitations in using non-GAAP financial measures because the non-GAAP financial measures are not prepared in accordance with GAAP, may be different from non-GAAP financial measures used by our competitors and exclude expenses that may have a material impact upon our reported financial results. Further, stock-based compensation expense has been and will continue to be for the foreseeable future a significant recurring expense in our business and an important part of the compensation provided to our employees. The presentation of the non-GAAP financial measures is not intended to be considered in isolation or as a substitute for, or superior to, the financial information prepared and presented in accordance with GAAP. We use these non-GAAP financial measures for financial and operational decision-making purposes and as a means to evaluate period-to-period comparisons. We believe that these non-GAAP financial measures provide useful information about our operating results, enhance the overall understanding of past financial performance and future prospects and allow for greater transparency with respect to key metrics used by management in our financial and operational decision making. In addition, these non-GAAP financial measures facilitate comparisons to competitors’ operating results. The non-GAAP financial measures are meant to supplement and be viewed in conjunction with GAAP financial measures.
49

The
follo
win
g ta
ble
reco
ncile
s our
net
cas
h us
ed in
ope
ratin
g ac
tiviti
es to
free
cas
h flo
w:
Fisc
al Y
ear
End
ed J
anua
ry 3
1,(I
n th
ousa
nds)
2021
2020
Net
cas
h us
ed in
ope
ratin
g ac
tiviti
es$
(190
,862
) $
(287
,636
) Le
ss p
urch
ases
of p
rope
rty a
nd e
quip
men
t(3
7,10
7)
(101
,119
) Fr
ee c
ash
flow
(non
-GA
AP)
$ (2
27,9
69)
$ (3
88,7
55)
Net
cas
h pr
ovid
ed b
y (u
sed
in) i
nves
ting
activ
ities
$ 79
7,19
0 $
(707
,981
) N
et c
ash
prov
ided
by
(use
d in
) fin
anci
ng a
ctiv
ities
$ 38
2,88
2 $
(100
,234
)
The
follo
win
g ta
ble
reco
ncile
s our
GA
AP
to n
on-G
AA
P fin
anci
al m
easu
res f
or th
e fis
cal y
ear e
nded
Janu
ary
31, 2
021:
(In
thou
sand
s, ex
cept
per
shar
e am
ount
s)G
AA
P
Stoc
k-ba
sed
com
pens
atio
n an
d re
late
d em
ploy
er
payr
oll t
ax
Am
ortiz
atio
n of
inta
ngib
le
asse
ts
Acq
uisi
tion-
rela
ted
adju
stm
ents
Res
truc
turi
ng
and
faci
lity
exit
char
ges
Cap
italiz
ed
soft
war
e de
velo
pmen
t co
sts
Non
-cas
h in
tere
st
expe
nse
rela
ted
to
conv
ertib
le
seni
or n
otes
Impa
irm
ent
of st
rate
gic
inve
stm
ent
Inco
me
tax
adju
stm
ent (4
)N
on-G
AA
PC
loud
serv
ices
cos
t of
reve
nues
$ 25
2,29
0 $
(11,
026)
$
(23,
169)
$
—
$ 28
$
—
$ —
$
—
$ —
$
218,
123
Clo
ud se
rvic
es g
ross
mar
gin
54.5
% 2.
0 %
4.1
% —
% —
% —
% —
% —
% —
% 60
.6 %
Cos
t of r
even
ues
547,
345
(58,
828)
(4
0,24
5)
—
(240
)(1
,188
)—
—
—
44
6,84
4 G
ross
mar
gin
75.4
% 2.
6 %
1.9
% —
% —
% 0.
1 %
— %
— %
— %
80.0
%R
esea
rch
and
deve
lopm
ent
791,
026
(278
,677
) (2
5)—
(5,8
56)
14,6
02
—
—
—
521,
070
Sale
s and
mar
ketin
g 1
,336
,056
(2
06,3
80)
(17,
745)
—
(1
,168
) —
—
—
—
1,
110,
763
Gen
eral
and
adm
inis
trativ
e33
5,14
4 (9
5,54
5)
—
(3,3
42)
(518
)—
—
—
—
235,
739
Ope
ratin
g lo
ss(7
80,1
86)
639,
430
58,0
15
3,34
2 7,
782
(13,
414)
—
—
—
(8
5,03
1)
Ope
ratin
g m
argi
n (3
5.0)
% 28
.7 %
2.7
% 0.
1 %
0.3
% (0
.6) %
— %
— %
— %
(3.8
) %In
com
e ta
x pr
ovis
ion
(ben
efit)
6,93
2 —
—
—
—
—
—
—
(2
8,71
1)
(21,
779)
N
et lo
ss$ (
907,
980)
$
639,
430
$ 58
,015
$
3,34
2 $
8,25
8 (2
)$
(13,
414)
$
92,0
24
(3)
$ 4,
500
$ 28
,711
$
(87,
114)
N
et lo
ss p
er sh
are
(1)
$ (5
.68)
$
4.00
$
0.35
$
0.02
$
0.05
$
(0.0
8)
$ 0.
58
$ 0.
03
$ 0.
18
$ (0
.55)
__
____
____
____
____
____
___
(1)
Cal
cula
ted
base
d on
159
,744
wei
ghte
d-av
erag
e sh
ares
of c
omm
on st
ock.
(2)
Incl
udes
a $
0.5
mill
ion
loss
on
disp
osal
of p
rope
rty, p
lant
and
equ
ipm
ent.
(3)
Incl
udes
non
-cas
h in
tere
st e
xpen
se o
f $99
.0 m
illio
n an
d a
$7.0
mill
ion
non-
recu
rrin
g ga
in o
n ex
tingu
ishm
ent o
f con
verti
ble
seni
or n
otes
.(4
) R
epre
sent
s the
inco
me
tax
adju
stm
ent u
sing
our
est
imat
ed n
on-G
AA
P ta
x ra
te o
f 20%
.
50
The
follo
win
g ta
ble
reco
ncile
s our
GA
AP
to n
on-G
AA
P fin
anci
al m
easu
res f
or th
e fis
cal y
ear e
nded
Janu
ary
31, 2
020:
(In
thou
sand
s, ex
cept
per
shar
e am
ount
s)G
AA
P
Stoc
k-ba
sed
com
pens
atio
n an
d re
late
d em
ploy
er
payr
oll t
ax
Am
ortiz
atio
n of
inta
ngib
le
asse
ts
Acq
uisi
tion-
rela
ted
adju
stm
ents
Res
truc
turi
ng
and
faci
lity
exit
char
ges
Cap
italiz
ed
soft
war
e de
velo
pmen
t co
sts
Leg
al
sett
lem
ent
char
ge
Non
-cas
h in
tere
st
expe
nse
rela
ted
to
conv
ertib
le
seni
or n
otes
Inco
me
tax
adju
stm
ent (2
)N
on-G
AA
P
Clo
ud se
rvic
es c
ost o
f rev
enue
s$
161,
510
$ (7
,465
) $
(7,8
22)
$ —
$
—
$ —
$
—
$ —
$
—
$ 14
6,22
3 C
loud
serv
ices
gro
ss m
argi
n 48
.3 %
2.4
% 2.
5 %
— %
— %
— %
— %
— %
— %
53.2
%C
ost o
f rev
enue
s42
9,78
8 (4
6,47
8)
(29,
516)
—
—
—
—
—
—
35
3,79
4 G
ross
mar
gin
81.8
% 1.
9 %
1.3
% —
% —
% —
% —
% —
% —
% 85
.0 %
Res
earc
h an
d de
velo
pmen
t61
9,80
0 (1
90,4
04)
(697
)(1
2)(5
,628
) 2,
589
—
—
—
425,
648
Sale
s and
mar
ketin
g 1
,263
,873
(2
23,8
12)
(8,3
24)
(172
)—
—
—
—
—
1,03
1,56
5 G
ener
al a
nd a
dmin
istra
tive
332,
602
(101
,939
) —
(7
,408
) (4
82)
—(1
0,00
0)
—
—
212,
773
Ope
ratin
g in
com
e (lo
ss)
(287
,137
) 56
2,63
3 38
,537
7,
592
6,11
0 (2
,589
) 10
,000
—
—
33
5,14
6 O
pera
ting
mar
gin
(12.
2) %
23.9
% 1.
6 %
0.3
% 0.
3 %
(0.1
) % 0.
4 %
— %
— %
14.2
%In
com
e ta
x pr
ovis
ion
5,01
7 —
—
—
—
—
—
—
69
,141
74
,158
N
et in
com
e (lo
ss)
$ (33
6,66
8)
$ 56
2,63
3 $
38,5
37
$ 7,
592
$ 6,
110
$ (2
,589
) $
10,0
00
$ 80
,157
$
(69,
141)
$
296,
631
Net
inco
me
(loss
) per
shar
e (1
)$
(2.2
2)
$ 1.
88
____
____
____
____
____
____
_(1
) G
AA
P ne
t los
s per
shar
e ca
lcul
ated
bas
ed o
n 15
1,94
9 w
eigh
ted-
aver
age
shar
es o
f com
mon
stoc
k. N
on-G
AA
P ne
t inc
ome
per s
hare
cal
cula
ted
base
d on
157
,815
dilu
ted
wei
ghte
d-av
erag
esh
ares
of c
omm
on st
ock,
whi
ch in
clud
es 5
,866
pot
entia
lly d
ilutiv
e sh
ares
rela
ted
to e
mpl
oyee
stoc
k aw
ards
. GA
AP
to n
on-G
AA
P ne
t inc
ome
(loss
) per
shar
e is
not
reco
ncile
d du
e to
the
diff
eren
ce in
the
num
ber o
f sha
res u
sed
to c
alcu
late
bas
ic a
nd d
ilute
d w
eigh
ted-
aver
age
shar
es o
f com
mon
stoc
k.(2
) R
epre
sent
s the
inco
me
tax
adju
stm
ent u
sing
our
est
imat
ed n
on-G
AA
P ta
x ra
te o
f 20%
.
51

FOR
M 1
0-K
The
follo
win
g ta
ble
reco
ncile
s our
net
cas
h us
ed in
ope
ratin
g ac
tiviti
es to
free
cas
h flo
w:
Fisc
al Y
ear
End
ed J
anua
ry 3
1,(I
n th
ousa
nds)
2021
2020
Net
cas
h us
ed in
ope
ratin
g ac
tiviti
es$
(190
,862
) $
(287
,636
) Le
ss p
urch
ases
of p
rope
rty a
nd e
quip
men
t(3
7,10
7)
(101
,119
) Fr
ee c
ash
flow
(non
-GA
AP)
$ (2
27,9
69)
$ (3
88,7
55)
Net
cas
h pr
ovid
ed b
y (u
sed
in) i
nves
ting
activ
ities
$ 79
7,19
0 $
(707
,981
) N
et c
ash
prov
ided
by
(use
d in
) fin
anci
ng a
ctiv
ities
$ 38
2,88
2 $
(100
,234
)
The
follo
win
g ta
ble
reco
ncile
s our
GA
AP
to n
on-G
AA
P fin
anci
al m
easu
res f
or th
e fis
cal y
ear e
nded
Janu
ary
31, 2
021:
(In
thou
sand
s, ex
cept
per
shar
e am
ount
s)G
AA
P
Stoc
k-ba
sed
com
pens
atio
n an
d re
late
d em
ploy
er
payr
oll t
ax
Am
ortiz
atio
n of
inta
ngib
le
asse
ts
Acq
uisi
tion-
rela
ted
adju
stm
ents
Res
truc
turi
ng
and
faci
lity
exit
char
ges
Cap
italiz
ed
soft
war
e de
velo
pmen
t co
sts
Non
-cas
h in
tere
st
expe
nse
rela
ted
to
conv
ertib
le
seni
or n
otes
Impa
irm
ent
of st
rate
gic
inve
stm
ent
Inco
me
tax
adju
stm
ent (4
)N
on-G
AA
PC
loud
serv
ices
cos
t of
reve
nues
$ 25
2,29
0 $
(11,
026)
$
(23,
169)
$
—
$ 28
$
—
$ —
$
—
$ —
$
218,
123
Clo
ud se
rvic
es g
ross
mar
gin
54.5
% 2.
0 %
4.1
% —
% —
% —
% —
% —
% —
% 60
.6 %
Cos
t of r
even
ues
547,
345
(58,
828)
(4
0,24
5)
—
(240
)(1
,188
)—
—
—
44
6,84
4 G
ross
mar
gin
75.4
% 2.
6 %
1.9
% —
% —
% 0.
1 %
— %
— %
— %
80.0
%R
esea
rch
and
deve
lopm
ent
791,
026
(278
,677
) (2
5)—
(5,8
56)
14,6
02
—
—
—
521,
070
Sale
s and
mar
ketin
g 1
,336
,056
(2
06,3
80)
(17,
745)
—
(1
,168
) —
—
—
—
1,
110,
763
Gen
eral
and
adm
inis
trativ
e33
5,14
4 (9
5,54
5)
—
(3,3
42)
(518
)—
—
—
—
235,
739
Ope
ratin
g lo
ss(7
80,1
86)
639,
430
58,0
15
3,34
2 7,
782
(13,
414)
—
—
—
(8
5,03
1)
Ope
ratin
g m
argi
n (3
5.0)
% 28
.7 %
2.7
% 0.
1 %
0.3
% (0
.6) %
— %
— %
— %
(3.8
) %In
com
e ta
x pr
ovis
ion
(ben
efit)
6,93
2 —
—
—
—
—
—
—
(2
8,71
1)
(21,
779)
N
et lo
ss$ (
907,
980)
$
639,
430
$ 58
,015
$
3,34
2 $
8,25
8 (2
)$
(13,
414)
$
92,0
24
(3)
$ 4,
500
$ 28
,711
$
(87,
114)
N
et lo
ss p
er sh
are
(1)
$ (5
.68)
$
4.00
$
0.35
$
0.02
$
0.05
$
(0.0
8)
$ 0.
58
$ 0.
03
$ 0.
18
$ (0
.55)
__
____
____
____
____
____
___
(1)
Cal
cula
ted
base
d on
159
,744
wei
ghte
d-av
erag
e sh
ares
of c
omm
on st
ock.
(2)
Incl
udes
a $
0.5
mill
ion
loss
on
disp
osal
of p
rope
rty, p
lant
and
equ
ipm
ent.
(3)
Incl
udes
non
-cas
h in
tere
st e
xpen
se o
f $99
.0 m
illio
n an
d a
$7.0
mill
ion
non-
recu
rrin
g ga
in o
n ex
tingu
ishm
ent o
f con
verti
ble
seni
or n
otes
.(4
) R
epre
sent
s the
inco
me
tax
adju
stm
ent u
sing
our
est
imat
ed n
on-G
AA
P ta
x ra
te o
f 20%
.
50
The
follo
win
g ta
ble
reco
ncile
s our
GA
AP
to n
on-G
AA
P fin
anci
al m
easu
res f
or th
e fis
cal y
ear e
nded
Janu
ary
31, 2
020:
(In
thou
sand
s, ex
cept
per
shar
e am
ount
s)G
AA
P
Stoc
k-ba
sed
com
pens
atio
n an
d re
late
d em
ploy
er
payr
oll t
ax
Am
ortiz
atio
n of
inta
ngib
le
asse
ts
Acq
uisi
tion-
rela
ted
adju
stm
ents
Res
truc
turi
ng
and
faci
lity
exit
char
ges
Cap
italiz
ed
soft
war
e de
velo
pmen
t co
sts
Leg
al
sett
lem
ent
char
ge
Non
-cas
h in
tere
st
expe
nse
rela
ted
to
conv
ertib
le
seni
or n
otes
Inco
me
tax
adju
stm
ent (2
)N
on-G
AA
P
Clo
ud se
rvic
es c
ost o
f rev
enue
s$
161,
510
$ (7
,465
) $
(7,8
22)
$ —
$
—
$ —
$
—
$ —
$
—
$ 14
6,22
3 C
loud
serv
ices
gro
ss m
argi
n 48
.3 %
2.4
% 2.
5 %
— %
— %
— %
— %
— %
— %
53.2
%C
ost o
f rev
enue
s42
9,78
8 (4
6,47
8)
(29,
516)
—
—
—
—
—
—
35
3,79
4 G
ross
mar
gin
81.8
% 1.
9 %
1.3
% —
% —
% —
% —
% —
% —
% 85
.0 %
Res
earc
h an
d de
velo
pmen
t61
9,80
0 (1
90,4
04)
(697
)(1
2)(5
,628
) 2,
589
—
—
—
425,
648
Sale
s and
mar
ketin
g 1
,263
,873
(2
23,8
12)
(8,3
24)
(172
)—
—
—
—
—
1,03
1,56
5 G
ener
al a
nd a
dmin
istra
tive
332,
602
(101
,939
) —
(7
,408
) (4
82)
—(1
0,00
0)
—
—
212,
773
Ope
ratin
g in
com
e (lo
ss)
(287
,137
) 56
2,63
3 38
,537
7,
592
6,11
0 (2
,589
) 10
,000
—
—
33
5,14
6 O
pera
ting
mar
gin
(12.
2) %
23.9
% 1.
6 %
0.3
% 0.
3 %
(0.1
) % 0.
4 %
— %
— %
14.2
%In
com
e ta
x pr
ovis
ion
5,01
7 —
—
—
—
—
—
—
69
,141
74
,158
N
et in
com
e (lo
ss)
$ (33
6,66
8)
$ 56
2,63
3 $
38,5
37
$ 7,
592
$ 6,
110
$ (2
,589
) $
10,0
00
$ 80
,157
$
(69,
141)
$
296,
631
Net
inco
me
(loss
) per
shar
e (1
)$
(2.2
2)
$ 1.
88
____
____
____
____
____
____
_(1
) G
AA
P ne
t los
s per
shar
e ca
lcul
ated
bas
ed o
n 15
1,94
9 w
eigh
ted-
aver
age
shar
es o
f com
mon
stoc
k. N
on-G
AA
P ne
t inc
ome
per s
hare
cal
cula
ted
base
d on
157
,815
dilu
ted
wei
ghte
d-av
erag
esh
ares
of c
omm
on st
ock,
whi
ch in
clud
es 5
,866
pot
entia
lly d
ilutiv
e sh
ares
rela
ted
to e
mpl
oyee
stoc
k aw
ards
. GA
AP
to n
on-G
AA
P ne
t inc
ome
(loss
) per
shar
e is
not
reco
ncile
d du
e to
the
diff
eren
ce in
the
num
ber o
f sha
res u
sed
to c
alcu
late
bas
ic a
nd d
ilute
d w
eigh
ted-
aver
age
shar
es o
f com
mon
stoc
k.(2
) R
epre
sent
s the
inco
me
tax
adju
stm
ent u
sing
our
est
imat
ed n
on-G
AA
P ta
x ra
te o
f 20%
.
51

Components of Operating Results
Revenues
License revenues. License revenues consist of revenues from term licenses, and to a much lesser extent perpetual licenses, under which we generally recognize the license fee portion of the arrangement upfront, assuming all revenue recognition criteria are satisfied. License revenues reflect the revenues recognized from sales of licenses to new customers and additional licenses to existing customers, including sales from the renewal of term licenses. In addition, seasonal trends that contribute to increased sales activity in the fourth fiscal quarter often result in lower sequential revenues in the first fiscal quarter, and we expect this trend to continue.
Cloud services revenues. Cloud services allow customers to use hosted software over the contract period without taking possession of the software. We recognize the revenues associated with our cloud services ratably, over the associated subscription term.
“Cloud services” revenues have been reclassified from “Maintenance and services” revenues on our consolidated statements of operations. We believe this presentation provides a more meaningful representation of the nature of our revenue. This reclassification had no impact on our previously reported total revenues.
Maintenance and services revenues. Maintenance and services revenues consist of revenues from maintenance agreements and professional services and training.
• Maintenance revenues. When a term license is purchased, maintenance is bundled with the license for the termof the license period. Typically, when purchasing a perpetual license, a customer also purchases one year ofmaintenance for which we charge a percentage of the license fee. Customers with maintenance agreements areentitled to receive support and unspecified upgrades and enhancements when and if they become available duringthe maintenance period. We recognize the revenues associated with maintenance agreements ratably, on a straight-line basis, over the associated maintenance period. Maintenance revenues as a percentage of total revenues were21.4% and 20.9% for fiscal 2021 and 2020, respectively.
• Professional services and training revenues. We have a professional services organization focused on helpingour customers deploy our software in highly complex operational environments and train their personnel. Trainingand professional services have stated billing rates per service hour or are provided on a subscription basis,accordingly, revenues are recognized as services are delivered or ratably over the subscription period. We haveexperienced continued growth in our professional services revenues primarily due to the deployment of oursoftware with some customers that have large, highly complex IT environments.
Cost of Revenues
Cost of license revenues. Cost of license revenues includes all direct costs to deliver our products, including salaries, benefits, stock-based compensation and related expenses such as employer taxes, allocated overhead for facilities and IT and amortization of acquired intangible assets. We recognize these expenses as they are incurred.
Cost of cloud services revenues. Cost of cloud services revenues includes salaries, benefits, stock-based compensation and related expenses such as employer taxes for our cloud services organization, allocated overhead for depreciation of equipment, facilities and IT, amortization of acquired intangible assets and third-party hosting fees. We recognize expenses related to our cloud services organizations as they are incurred.
Cost of maintenance and services revenues. Cost of maintenance and services revenues includes salaries, benefits, stock-based compensation and related expenses such as employer taxes for our maintenance and services organizations, third-party consulting services and allocated overhead for depreciation of equipment, facilities and IT. We recognize expenses related to our maintenance and services organizations as they are incurred.
Operating Expenses
52
Our operating expenses are classified into three categories: research and development, sales and marketing and general and administrative. For each category, the largest component is personnel costs, which include salaries, employee benefit costs, bonuses, commissions as applicable, stock-based compensation and related expenses such as employer taxes. Operating expenses also include allocated overhead costs for depreciation of equipment, facilities and IT. Allocated costs for facilities include costs for compensation of our facilities personnel, leasehold improvements and rent. Our allocated costs for IT include costs for compensation of our IT personnel, costs associated with our IT infrastructure and software subscriptions. Operating expenses are generally recognized as incurred.
Research and development. Research and development expenses primarily consist of personnel and facility-related costs attributable to our research and development personnel. We have devoted our product development efforts primarily to enhancing the functionality and expanding the capabilities of our software and services. We expect that our research and development expenses will continue to increase, in absolute dollars, as we increase our research and development headcount to further strengthen and enhance our software and services and invest in the development of our solutions and apps.
Sales and marketing. Sales and marketing expenses primarily consist of personnel and facility-related costs for our sales, marketing and business development personnel, commissions earned by our sales personnel, and the cost of marketing and business development programs, including advertising programs to promote our brand and awareness, demand generating activities and customer events. We expect that sales and marketing expenses will continue to increase, in absolute dollars, as we continue to hire additional personnel and invest in marketing programs.
General and administrative. General and administrative expenses primarily consist of personnel and facility-related costs for our executive, finance, legal, human resources and administrative personnel; our legal, accounting and other professional services fees; and other corporate expenses. We anticipate continuing to incur additional expenses due to growing our operations, including higher legal, corporate insurance and accounting-related expenses.
Interest and Other Income (Expense), Net
Interest and other income (expense), net consists primarily of interest expense related to our convertible senior notes, gain on extinguishment of convertible senior notes, a strategic investment impairment loss, foreign exchange gains and losses, interest income on our investments and cash and cash equivalents balances and changes in the fair value of forward exchange contracts.
Income Tax Provision (Benefit)
The income tax provision (benefit) consists of federal, state and foreign income taxes. We recognize deferred tax assets and liabilities for the expected tax consequences of temporary differences between the tax basis of assets and liabilities and their reported amounts using enacted tax rates in effect for the year in which we expect the differences to reverse. To the extent that we believe any amounts are not more-likely-than-not to be realized, we record a valuation allowance to reduce the deferred income tax assets. Because of our history of U.S. net operating losses, we have established a full valuation allowance against potential future benefits for U.S. deferred tax assets. We regularly assess the need for the valuation allowance on our deferred tax assets, and to the extent that we determine that an adjustment is needed, such adjustment will be recorded in the period that the determination is made.
Critical Accounting Policies and Estimates
We prepare our consolidated financial statements in accordance with generally accepted accounting principles in the United States (“U.S. GAAP”). The preparation of consolidated financial statements also requires us to make estimates and assumptions that affect the reported amounts of assets, liabilities, revenues, costs and expenses and related disclosures. We base our estimates on historical experience and on various other assumptions that we believe to be reasonable under the circumstances. Actual results could differ significantly from the estimates made by our management. To the extent that there are differences between our estimates and actual results, our future financial statement presentation, financial condition, results of operations and cash flows will be affected.
We believe that the assumptions and estimates associated with revenue recognition, deferred sales commissions and business combinations have the greatest potential impact on our consolidated financial statements. Therefore, we consider these to be our critical accounting policies and estimates. Accordingly, we believe these are the most critical to fully understand and evaluate our financial condition and results of operations.
53

FOR
M 1
0-K
Components of Operating Results
Revenues
License revenues. License revenues consist of revenues from term licenses, and to a much lesser extent perpetual licenses, under which we generally recognize the license fee portion of the arrangement upfront, assuming all revenue recognition criteria are satisfied. License revenues reflect the revenues recognized from sales of licenses to new customers and additional licenses to existing customers, including sales from the renewal of term licenses. In addition, seasonal trends that contribute to increased sales activity in the fourth fiscal quarter often result in lower sequential revenues in the first fiscal quarter, and we expect this trend to continue.
Cloud services revenues. Cloud services allow customers to use hosted software over the contract period without taking possession of the software. We recognize the revenues associated with our cloud services ratably, over the associated subscription term.
“Cloud services” revenues have been reclassified from “Maintenance and services” revenues on our consolidated statements of operations. We believe this presentation provides a more meaningful representation of the nature of our revenue. This reclassification had no impact on our previously reported total revenues.
Maintenance and services revenues. Maintenance and services revenues consist of revenues from maintenance agreements and professional services and training.
• Maintenance revenues. When a term license is purchased, maintenance is bundled with the license for the termof the license period. Typically, when purchasing a perpetual license, a customer also purchases one year ofmaintenance for which we charge a percentage of the license fee. Customers with maintenance agreements areentitled to receive support and unspecified upgrades and enhancements when and if they become available duringthe maintenance period. We recognize the revenues associated with maintenance agreements ratably, on a straight-line basis, over the associated maintenance period. Maintenance revenues as a percentage of total revenues were21.4% and 20.9% for fiscal 2021 and 2020, respectively.
• Professional services and training revenues. We have a professional services organization focused on helpingour customers deploy our software in highly complex operational environments and train their personnel. Trainingand professional services have stated billing rates per service hour or are provided on a subscription basis,accordingly, revenues are recognized as services are delivered or ratably over the subscription period. We haveexperienced continued growth in our professional services revenues primarily due to the deployment of oursoftware with some customers that have large, highly complex IT environments.
Cost of Revenues
Cost of license revenues. Cost of license revenues includes all direct costs to deliver our products, including salaries, benefits, stock-based compensation and related expenses such as employer taxes, allocated overhead for facilities and IT and amortization of acquired intangible assets. We recognize these expenses as they are incurred.
Cost of cloud services revenues. Cost of cloud services revenues includes salaries, benefits, stock-based compensation and related expenses such as employer taxes for our cloud services organization, allocated overhead for depreciation of equipment, facilities and IT, amortization of acquired intangible assets and third-party hosting fees. We recognize expenses related to our cloud services organizations as they are incurred.
Cost of maintenance and services revenues. Cost of maintenance and services revenues includes salaries, benefits, stock-based compensation and related expenses such as employer taxes for our maintenance and services organizations, third-party consulting services and allocated overhead for depreciation of equipment, facilities and IT. We recognize expenses related to our maintenance and services organizations as they are incurred.
Operating Expenses
52
Our operating expenses are classified into three categories: research and development, sales and marketing and general and administrative. For each category, the largest component is personnel costs, which include salaries, employee benefit costs, bonuses, commissions as applicable, stock-based compensation and related expenses such as employer taxes. Operating expenses also include allocated overhead costs for depreciation of equipment, facilities and IT. Allocated costs for facilities include costs for compensation of our facilities personnel, leasehold improvements and rent. Our allocated costs for IT include costs for compensation of our IT personnel, costs associated with our IT infrastructure and software subscriptions. Operating expenses are generally recognized as incurred.
Research and development. Research and development expenses primarily consist of personnel and facility-related costs attributable to our research and development personnel. We have devoted our product development efforts primarily to enhancing the functionality and expanding the capabilities of our software and services. We expect that our research and development expenses will continue to increase, in absolute dollars, as we increase our research and development headcount to further strengthen and enhance our software and services and invest in the development of our solutions and apps.
Sales and marketing. Sales and marketing expenses primarily consist of personnel and facility-related costs for our sales, marketing and business development personnel, commissions earned by our sales personnel, and the cost of marketing and business development programs, including advertising programs to promote our brand and awareness, demand generating activities and customer events. We expect that sales and marketing expenses will continue to increase, in absolute dollars, as we continue to hire additional personnel and invest in marketing programs.
General and administrative. General and administrative expenses primarily consist of personnel and facility-related costs for our executive, finance, legal, human resources and administrative personnel; our legal, accounting and other professional services fees; and other corporate expenses. We anticipate continuing to incur additional expenses due to growing our operations, including higher legal, corporate insurance and accounting-related expenses.
Interest and Other Income (Expense), Net
Interest and other income (expense), net consists primarily of interest expense related to our convertible senior notes, gain on extinguishment of convertible senior notes, a strategic investment impairment loss, foreign exchange gains and losses, interest income on our investments and cash and cash equivalents balances and changes in the fair value of forward exchange contracts.
Income Tax Provision (Benefit)
The income tax provision (benefit) consists of federal, state and foreign income taxes. We recognize deferred tax assets and liabilities for the expected tax consequences of temporary differences between the tax basis of assets and liabilities and their reported amounts using enacted tax rates in effect for the year in which we expect the differences to reverse. To the extent that we believe any amounts are not more-likely-than-not to be realized, we record a valuation allowance to reduce the deferred income tax assets. Because of our history of U.S. net operating losses, we have established a full valuation allowance against potential future benefits for U.S. deferred tax assets. We regularly assess the need for the valuation allowance on our deferred tax assets, and to the extent that we determine that an adjustment is needed, such adjustment will be recorded in the period that the determination is made.
Critical Accounting Policies and Estimates
We prepare our consolidated financial statements in accordance with generally accepted accounting principles in the United States (“U.S. GAAP”). The preparation of consolidated financial statements also requires us to make estimates and assumptions that affect the reported amounts of assets, liabilities, revenues, costs and expenses and related disclosures. We base our estimates on historical experience and on various other assumptions that we believe to be reasonable under the circumstances. Actual results could differ significantly from the estimates made by our management. To the extent that there are differences between our estimates and actual results, our future financial statement presentation, financial condition, results of operations and cash flows will be affected.
We believe that the assumptions and estimates associated with revenue recognition, deferred sales commissions and business combinations have the greatest potential impact on our consolidated financial statements. Therefore, we consider these to be our critical accounting policies and estimates. Accordingly, we believe these are the most critical to fully understand and evaluate our financial condition and results of operations.
53

Revenue Recognition
Our contracts with customers often contain multiple performance obligations. For these contracts, we account for individual performance obligations separately if they are distinct. We apply significant judgment in identifying and accounting for each performance obligation, as a result of evaluating the terms and conditions in contracts. The transaction price is allocated to the separate performance obligations on a relative standalone selling price (“SSP”) basis. We determine the SSP based on an observable standalone selling price when it is available, as well as other factors, including the price charged to customers, our discounting practices, and our overall pricing objectives, while maximizing observable inputs. In situations where pricing is highly variable, we estimate the SSP using the residual approach.
Deferred Sales Commissions
Sales commissions paid to our sales force and the related payroll taxes are considered incremental and recoverable costs of obtaining a contract with a customer. We generally amortize these costs over the remaining contractual term of our customer contracts, consistent with the pattern of revenue recognition of each performance obligation, for contracts in which the commissions paid on the initial and renewal contracts are commensurate. For certain contracts in which the commissions paid on the initial and renewal contracts are not commensurate, we amortize the commissions paid on the initial contract over an expected period of benefit, which we have determined to be approximately five years. We have determined the period of benefit by taking into consideration our customer contracts, the duration of our relationships with our customers and our technology. In capitalizing and amortizing deferred commissions, we have elected to apply a portfolio approach.
Business Combinations
We use our best estimates and assumptions to allocate the fair value of purchase consideration to the tangible and intangible assets acquired and liabilities assumed based on their estimated fair values. The excess of the fair value of purchase consideration over the fair values of these identifiable assets and liabilities is recorded as goodwill. We apply significant judgment in determining the fair value of the intangible assets acquired, which involves the use of significant estimates and assumptions with respect to revenue growth rates, royalty rate and technology migration curve. While we use our best estimates and judgments, our estimates are inherently uncertain and subject to refinement. During the measurement period, which may be up to one year from the acquisition date, we may record adjustments to the fair value of these tangible and intangible assets acquired and liabilities assumed, with the corresponding offset to goodwill. In addition, uncertain tax positions and tax-related valuation allowances are initially established in connection with a business combination as of the acquisition date. We continue to collect information and reevaluate these estimates and assumptions quarterly and record any adjustments to our preliminary estimates to goodwill provided that we are within the measurement period. Upon the conclusion of the final determination of the fair value of assets acquired or liabilities assumed during the measurement period, any subsequent adjustments are included in our consolidated statements of operations.
For further information on all of our significant accounting policies, refer to Note 1 of our accompanying Notes to Consolidated Financial Statements included elsewhere in this Annual Report on Form 10-K.
54
Results of Operations
The following table sets forth our results of operations for the periods presented and as a percentage of our total revenues for those periods. The period-to-period comparison of financial results is not necessarily indicative of financial results to be achieved in future periods.
Consolidated Statements of Operations Data
Fiscal Year Ended January 31,
(In thousands and as % of revenues) 2021 2020 2019
RevenuesLicense $ 971,378 43.6 % $ 1,373,367 58.2 % $ 1,030,277 57.1 %Cloud services 554,132 24.9 312,358 13.2 171,200 9.5 Maintenance and services 703,875 31.6 673,201 28.5 601,533 33.4
Total revenues 2,229,385 100.0 2,358,926 100.0 1,803,010 100.0 Cost of revenues
License (1) 20,864 2.1 24,116 1.8 22,527 2.2 Cloud services (1) 252,290 45.5 161,510 51.7 112,446 65.7 Maintenance and services (1) 274,191 39.0 244,162 36.3 209,703 34.9
Total cost of revenues 547,345 24.6 429,788 18.2 344,676 19.1 Gross profit 1,682,040 75.4 1,929,138 81.8 1,458,334 80.9 Operating expenses
Research and development 791,026 35.5 619,800 26.3 441,969 24.5 Sales and marketing 1,336,056 59.9 1,263,873 53.6 1,029,950 57.1 General and administrative 335,144 15.0 332,602 14.1 237,588 13.2
Total operating expenses 2,462,226 110.4 2,216,275 94.0 1,709,507 94.8 Operating loss (780,186) (35.0) (287,137) (12.2) (251,173) (13.9) Interest and other income (expense), net
Interest income 13,850 0.6 54,142 2.3 31,458 1.7 Interest expense (123,076) (5.5) (96,249) (4.1) (41,963) (2.3) Other income (expense), net (11,636) (0.5) (2,407) (0.1) (1,513) (0.1)
Total interest and other income (expense), net (120,862) (5.4) (44,514) (1.9) (12,018) (0.7)
Loss before income taxes (901,048) (40.4) (331,651) (14.1) (263,191) (14.6) Income tax provision 6,932 0.3 5,017 0.2 12,386 0.7 Net loss $ (907,980) (40.7) % $ (336,668) (14.3) % $ (275,577) (15.3) %
_________________________(1) Calculated as a percentage of the associated revenues.
55

FOR
M 1
0-K
Revenue Recognition
Our contracts with customers often contain multiple performance obligations. For these contracts, we account for individual performance obligations separately if they are distinct. We apply significant judgment in identifying and accounting for each performance obligation, as a result of evaluating the terms and conditions in contracts. The transaction price is allocated to the separate performance obligations on a relative standalone selling price (“SSP”) basis. We determine the SSP based on an observable standalone selling price when it is available, as well as other factors, including the price charged to customers, our discounting practices, and our overall pricing objectives, while maximizing observable inputs. In situations where pricing is highly variable, we estimate the SSP using the residual approach.
Deferred Sales Commissions
Sales commissions paid to our sales force and the related payroll taxes are considered incremental and recoverable costs of obtaining a contract with a customer. We generally amortize these costs over the remaining contractual term of our customer contracts, consistent with the pattern of revenue recognition of each performance obligation, for contracts in which the commissions paid on the initial and renewal contracts are commensurate. For certain contracts in which the commissions paid on the initial and renewal contracts are not commensurate, we amortize the commissions paid on the initial contract over an expected period of benefit, which we have determined to be approximately five years. We have determined the period of benefit by taking into consideration our customer contracts, the duration of our relationships with our customers and our technology. In capitalizing and amortizing deferred commissions, we have elected to apply a portfolio approach.
Business Combinations
We use our best estimates and assumptions to allocate the fair value of purchase consideration to the tangible and intangible assets acquired and liabilities assumed based on their estimated fair values. The excess of the fair value of purchase consideration over the fair values of these identifiable assets and liabilities is recorded as goodwill. We apply significant judgment in determining the fair value of the intangible assets acquired, which involves the use of significant estimates and assumptions with respect to revenue growth rates, royalty rate and technology migration curve. While we use our best estimates and judgments, our estimates are inherently uncertain and subject to refinement. During the measurement period, which may be up to one year from the acquisition date, we may record adjustments to the fair value of these tangible and intangible assets acquired and liabilities assumed, with the corresponding offset to goodwill. In addition, uncertain tax positions and tax-related valuation allowances are initially established in connection with a business combination as of the acquisition date. We continue to collect information and reevaluate these estimates and assumptions quarterly and record any adjustments to our preliminary estimates to goodwill provided that we are within the measurement period. Upon the conclusion of the final determination of the fair value of assets acquired or liabilities assumed during the measurement period, any subsequent adjustments are included in our consolidated statements of operations.
For further information on all of our significant accounting policies, refer to Note 1 of our accompanying Notes to Consolidated Financial Statements included elsewhere in this Annual Report on Form 10-K.
54
Results of Operations
The following table sets forth our results of operations for the periods presented and as a percentage of our total revenues for those periods. The period-to-period comparison of financial results is not necessarily indicative of financial results to be achieved in future periods.
Consolidated Statements of Operations Data
Fiscal Year Ended January 31,
(In thousands and as % of revenues) 2021 2020 2019
RevenuesLicense $ 971,378 43.6 % $ 1,373,367 58.2 % $ 1,030,277 57.1 %Cloud services 554,132 24.9 312,358 13.2 171,200 9.5 Maintenance and services 703,875 31.6 673,201 28.5 601,533 33.4
Total revenues 2,229,385 100.0 2,358,926 100.0 1,803,010 100.0 Cost of revenues
License (1) 20,864 2.1 24,116 1.8 22,527 2.2 Cloud services (1) 252,290 45.5 161,510 51.7 112,446 65.7 Maintenance and services (1) 274,191 39.0 244,162 36.3 209,703 34.9
Total cost of revenues 547,345 24.6 429,788 18.2 344,676 19.1 Gross profit 1,682,040 75.4 1,929,138 81.8 1,458,334 80.9 Operating expenses
Research and development 791,026 35.5 619,800 26.3 441,969 24.5 Sales and marketing 1,336,056 59.9 1,263,873 53.6 1,029,950 57.1 General and administrative 335,144 15.0 332,602 14.1 237,588 13.2
Total operating expenses 2,462,226 110.4 2,216,275 94.0 1,709,507 94.8 Operating loss (780,186) (35.0) (287,137) (12.2) (251,173) (13.9) Interest and other income (expense), net
Interest income 13,850 0.6 54,142 2.3 31,458 1.7 Interest expense (123,076) (5.5) (96,249) (4.1) (41,963) (2.3) Other income (expense), net (11,636) (0.5) (2,407) (0.1) (1,513) (0.1)
Total interest and other income (expense), net (120,862) (5.4) (44,514) (1.9) (12,018) (0.7)
Loss before income taxes (901,048) (40.4) (331,651) (14.1) (263,191) (14.6) Income tax provision 6,932 0.3 5,017 0.2 12,386 0.7 Net loss $ (907,980) (40.7) % $ (336,668) (14.3) % $ (275,577) (15.3) %
_________________________(1) Calculated as a percentage of the associated revenues.
55

Comparison of the Fiscal Years Ended January 31, 2021 and 2020
Revenues(Dollars in millions)
Total Revenues$2,358.9
$2,229.4
2020 2021
License
$1,373.4
$971.4
2020 2021
Cloud Services
$312.4$554.1
2020 2021
Maintenance and Services
$673.2 $703.9
2020 2021
License(% of Revenues)
58.2%43.6%
2020 2021
Cloud Services(% of Revenues)
13.2%
24.9%
2020 2021
Maintenance and Services(% of Revenues)
28.5% 31.6%
2020 2021
Fiscal 2021 - 2020Total revenues decreased $129.5 million, or (5.5)%, primarily due to the following:
- decrease of $402.0 million, or (29.3)%, in license revenues+ increase of $241.7 million, or 77.4%, in cloud services revenues+ increase of $30.7 million, or 4.6%, in maintenance and services revenues
56
Our transition to a subscription model has impacted, and it will continue to impact the timing of our recognition of revenue as an increasing percentage of our sales becomes recognized ratably. As a result, total revenues decreased primarily due to a decrease in license revenues from our ongoing subscription model transition. License revenues also decreased as a result of lower average term license contract duration. The decrease in license revenues was partially offset by an increase in cloud services revenues. Our customers are increasingly purchasing our Splunk Cloud service as it delivers the benefits of Splunk Enterprise, while eliminating the need to purchase, deploy and manage infrastructure. The increase in maintenance and services revenues was primarily due to an increase in professional services and training revenues, partially offset by a decrease in maintenance revenues.
57

FOR
M 1
0-K
Comparison of the Fiscal Years Ended January 31, 2021 and 2020
Revenues(Dollars in millions)
Total Revenues$2,358.9
$2,229.4
2020 2021
License
$1,373.4
$971.4
2020 2021
Cloud Services
$312.4$554.1
2020 2021
Maintenance and Services
$673.2 $703.9
2020 2021
License(% of Revenues)
58.2%43.6%
2020 2021
Cloud Services(% of Revenues)
13.2%
24.9%
2020 2021
Maintenance and Services(% of Revenues)
28.5% 31.6%
2020 2021
Fiscal 2021 - 2020Total revenues decreased $129.5 million, or (5.5)%, primarily due to the following:
- decrease of $402.0 million, or (29.3)%, in license revenues+ increase of $241.7 million, or 77.4%, in cloud services revenues+ increase of $30.7 million, or 4.6%, in maintenance and services revenues
56
Our transition to a subscription model has impacted, and it will continue to impact the timing of our recognition of revenue as an increasing percentage of our sales becomes recognized ratably. As a result, total revenues decreased primarily due to a decrease in license revenues from our ongoing subscription model transition. License revenues also decreased as a result of lower average term license contract duration. The decrease in license revenues was partially offset by an increase in cloud services revenues. Our customers are increasingly purchasing our Splunk Cloud service as it delivers the benefits of Splunk Enterprise, while eliminating the need to purchase, deploy and manage infrastructure. The increase in maintenance and services revenues was primarily due to an increase in professional services and training revenues, partially offset by a decrease in maintenance revenues.
57

Cost of Revenues and Gross Margin(Dollars in millions)
TotalCost of Revenues
$429.8
$547.3
2020 2021
TotalGross Margin
81.8% 75.4%
2020 2021
LicenseCost of Revenues
$24.1 $20.9
2020 2021
Cloud ServicesCost of Revenues
$161.5
$252.3
2020 2021
Maintenance and ServicesCost of Revenues
$244.2 $274.2
2020 2021
LicenseGross Margin
98.2% 97.9%
2020 2021
Cloud ServicesGross Margin
48.3% 54.5%
2020 2021
Maintenance and ServicesGross Margin
63.7% 61.0%
2020 2021
Fiscal 2021 - 2020Total cost of revenues increased $117.5 million or 27.3% primarily due to the increase in cloud services cost of revenues, as a result of our ongoing transition from a license to cloud subscription model.
Cloud services cost of revenues increased $90.8 million or 56.2%, primarily due to the following:
+ increase of $48.1 million in third-party hosting fees to support our cloud services+ increase of $17.5 million in salaries and benefits, including stock-based compensation expense as we increased headcount+ increase of $13.8 million in intangible asset amortization related to our acquisitions+ increase of $4.9 million in overhead expenses, primarily due to facility-related costs
58
Maintenance and services cost of revenues increased $30.0 million, or 12.3%, primarily due to the following:
+ increase of $27.2 million in salaries and benefits, including stock-based compensation expense as we increased headcount+ increase of $7.8 million in overhead expenses, primarily due to facility-related costs- decrease of $9.3 million in travel-related expenses as a result of the COVID-19 pandemic and related restrictions
Total gross margin decreased primarily due to a shift in the overall revenue mix in favor of cloud services, which have lower gross margins than our on-premises license business.
59

FOR
M 1
0-K
Cost of Revenues and Gross Margin(Dollars in millions)
TotalCost of Revenues
$429.8
$547.3
2020 2021
TotalGross Margin
81.8% 75.4%
2020 2021
LicenseCost of Revenues
$24.1 $20.9
2020 2021
Cloud ServicesCost of Revenues
$161.5
$252.3
2020 2021
Maintenance and ServicesCost of Revenues
$244.2 $274.2
2020 2021
LicenseGross Margin
98.2% 97.9%
2020 2021
Cloud ServicesGross Margin
48.3% 54.5%
2020 2021
Maintenance and ServicesGross Margin
63.7% 61.0%
2020 2021
Fiscal 2021 - 2020Total cost of revenues increased $117.5 million or 27.3% primarily due to the increase in cloud services cost of revenues, as a result of our ongoing transition from a license to cloud subscription model.
Cloud services cost of revenues increased $90.8 million or 56.2%, primarily due to the following:
+ increase of $48.1 million in third-party hosting fees to support our cloud services+ increase of $17.5 million in salaries and benefits, including stock-based compensation expense as we increased headcount+ increase of $13.8 million in intangible asset amortization related to our acquisitions+ increase of $4.9 million in overhead expenses, primarily due to facility-related costs
58
Maintenance and services cost of revenues increased $30.0 million, or 12.3%, primarily due to the following:
+ increase of $27.2 million in salaries and benefits, including stock-based compensation expense as we increased headcount+ increase of $7.8 million in overhead expenses, primarily due to facility-related costs- decrease of $9.3 million in travel-related expenses as a result of the COVID-19 pandemic and related restrictions
Total gross margin decreased primarily due to a shift in the overall revenue mix in favor of cloud services, which have lower gross margins than our on-premises license business.
59

Operating Expenses(Dollars in millions)
Research andDevelopment
$619.8$791.0
2020 2021
Sales andMarketing
$1,263.9 $1,336.1
2020 2021
General andAdministrative
$332.6 $335.1
2020 2021
Research &Development
(as % of Revenues)
26.3% 35.5%
2020 2021
Sales andMarketing
(as % of Revenues)
53.6% 59.9%
2020 2021
General andAdministrative
(as % of Revenues)
14.1% 15.0%
2020 2021
Total Operating Expenses
$2,216.3$2,462.2
2020 2021
Total Operating Expenses(as % of Revenues)
94.0%
110.4%
2020 2021
Research and Development Expense
Fiscal 2021 - 2020Research and development expense increased $171.2 million, or 27.6%, primarily due to the following:
+ increase of $149.1 million in salaries and benefits, which includes a $85.9 million increase in stock-based compensation expense primarily due to our acquisitions of SignalFx and Omnition
+ increase of $12.6 million in overhead expenses, primarily due to facility-related costs+ increase of $14.2 million in third-party hosting fees to support our product development efforts- decrease of $7.3 million in travel-related expenses and employee meals as a result of the COVID-19 pandemic
60
Sales and Marketing Expense
Fiscal 2021 - 2020Sales and marketing expense increased $72.2 million, or 5.7%, primarily due to the following:
+ increase of $87.3 million in salaries and benefits, which is net of a decrease in stock-based compensation expense due to an executive departure and the modification of our fiscal 2021 PSU awards
+ increase of $25.5 million in overhead expenses, primarily due to facility-related costs+ increase of $6.5 million in third-party hosting fees to support our sales and marketing efforts- decrease of $49.7 million in travel-related expenses as a result of the COVID-19 pandemic and related restrictions
General and Administrative Expense
Fiscal 2021 - 2020General and administrative expense increased $2.5 million, or 0.8%, primarily due to the following:
+ increase of $21.9 million in overhead expenses, primarily due to higher facility-related costs + increase of $1.6 million in salaries and benefits, which includes a decrease of $6.7 million in stock-based compensation
expense, primarily from the modification of our fiscal 2021 PSU awards- decrease of $7.9 million in third-party consulting services, primarily due to increased spending in fiscal 2020 on larger
acquisitions as compared to fiscal 2021- decrease of $4.9 million in travel-related expenses and employee meals as a result of the COVID-19 pandemic- decrease of $4.4 million in employment-related expenses as a result of the COVID-19 pandemic
61

FOR
M 1
0-K
Operating Expenses(Dollars in millions)
Research andDevelopment
$619.8$791.0
2020 2021
Sales andMarketing
$1,263.9 $1,336.1
2020 2021
General andAdministrative
$332.6 $335.1
2020 2021
Research &Development
(as % of Revenues)
26.3% 35.5%
2020 2021
Sales andMarketing
(as % of Revenues)
53.6% 59.9%
2020 2021
General andAdministrative
(as % of Revenues)
14.1% 15.0%
2020 2021
Total Operating Expenses
$2,216.3$2,462.2
2020 2021
Total Operating Expenses(as % of Revenues)
94.0%
110.4%
2020 2021
Research and Development Expense
Fiscal 2021 - 2020Research and development expense increased $171.2 million, or 27.6%, primarily due to the following:
+ increase of $149.1 million in salaries and benefits, which includes a $85.9 million increase in stock-based compensation expense primarily due to our acquisitions of SignalFx and Omnition
+ increase of $12.6 million in overhead expenses, primarily due to facility-related costs+ increase of $14.2 million in third-party hosting fees to support our product development efforts- decrease of $7.3 million in travel-related expenses and employee meals as a result of the COVID-19 pandemic
60
Sales and Marketing Expense
Fiscal 2021 - 2020Sales and marketing expense increased $72.2 million, or 5.7%, primarily due to the following:
+ increase of $87.3 million in salaries and benefits, which is net of a decrease in stock-based compensation expense due to an executive departure and the modification of our fiscal 2021 PSU awards
+ increase of $25.5 million in overhead expenses, primarily due to facility-related costs+ increase of $6.5 million in third-party hosting fees to support our sales and marketing efforts- decrease of $49.7 million in travel-related expenses as a result of the COVID-19 pandemic and related restrictions
General and Administrative Expense
Fiscal 2021 - 2020General and administrative expense increased $2.5 million, or 0.8%, primarily due to the following:
+ increase of $21.9 million in overhead expenses, primarily due to higher facility-related costs + increase of $1.6 million in salaries and benefits, which includes a decrease of $6.7 million in stock-based compensation
expense, primarily from the modification of our fiscal 2021 PSU awards- decrease of $7.9 million in third-party consulting services, primarily due to increased spending in fiscal 2020 on larger
acquisitions as compared to fiscal 2021- decrease of $4.9 million in travel-related expenses and employee meals as a result of the COVID-19 pandemic- decrease of $4.4 million in employment-related expenses as a result of the COVID-19 pandemic
61

Interest and Other Income (Expense), netFiscal Year Ended January 31,
(In thousands) 2021 2020
Interest and other income (expense), netInterest income $ 13,850 $ 54,142 Interest expense (123,076) (96,249) Other income (expense), net (11,636) (2,407)
Total interest and other income (expense), net $ (120,862) $ (44,514)
Fiscal 2021 - 2020Interest and other income (expense), net reflects a net increase in expense of $76.3 million, primarily due to the following:
+ a decrease in interest income from our investments, a large portion of which matured during fiscal 2021+ an increase in interest expense related to the issuance of convertible senior notes in June 2020+ an increase in foreign exchange transaction losses+ the impairment of a strategic investment during fiscal 2021- a gain on extinguishment of convertible senior notes
Income Tax ProvisionFiscal Year Ended January 31,
(In thousands) 2021 2020
Income tax provision $ 6,932 $ 5,017
Fiscal 2021 - 2020Income tax provision increased $1.9 million, primarily due to a decrease in tax benefit upon the release of valuation allowance as a result of our acquisitions.
62
Seasonality, Cyclicality and Quarterly Trends
Our quarterly results reflect seasonality in the sale of our offerings. Historically, a pattern of increased license sales in the fourth fiscal quarter as a result of industry buying patterns has positively impacted sales activity in that period, which can result in lower sequential revenue in the first fiscal quarter. We expect some of this seasonality to continue in fiscal 2022 and beyond as license sales activity continues, however we expect the impact of this seasonality to decrease over time as a higher percentage of our revenues come from cloud services. As we continue to expect seasonally higher bookings and billings in the fiscal fourth quarter, with more of our revenue being recognized ratably there will also be a seasonal impact on our remaining performance obligations and deferred revenue. Our gross margins and operating losses have been affected by these historical trends because the majority of our expenses are relatively fixed in the short term. The timing of revenues in relation to our expenses, much of which does not vary directly with revenues, has an impact on the cost of revenues, research and development expense, sales and marketing expense and general and administrative expense as a percentage of revenues in each fiscal quarter during the year. The majority of our expenses are personnel-related and include salaries, stock-based compensation, benefits and incentive-based compensation plan expenses. As a result, we have not experienced significant seasonal fluctuations in the timing of expenses from period to period. Although these seasonal factors are common in the technology industry, historical patterns should not be considered a reliable indicator of our future sales activity or performance.
Liquidity and Capital ResourcesFiscal Year Ended January 31,
(In thousands) 2021 2020
Cash and cash equivalents $ 1,771,064 $ 778,653 Investments, current 87,847 976,508 Investments, non-current 13,728 35,370
(In millions)
Cash Used inOperating Activities
$(287.6) $(190.9)
2020 2021
Cash Provided by (Used in)Investing Activities
$(708.0)
$797.2
2020 2021
Cash Provided by (Used in)Financing Activities
$(100.2)
$382.9
2020 2021
Our principal sources of liquidity are our cash and cash equivalents, investments and net accounts receivable. As of January 31, 2021, we had $1.87 billion of cash, cash equivalents and investments of which $227.4 million was held by foreign subsidiaries. We believe that these funds will be sufficient to meet our anticipated cash needs for at least the next 12 months.
We intend to continue to focus our capital expenditures in fiscal 2022 to support the growth in our operations, including acquisition-related activities. Our future capital requirements will depend on many factors including our growth rate, the timing and extent of spending to support development efforts, the expansion of sales and marketing activities, the introduction of new and enhanced software and services offerings, the investments in our office facilities and our systems infrastructure, the continuing market acceptance of our offerings and our planned investments, particularly in our product development efforts or acquisitions of complementary businesses, applications or technologies.
Beginning in fiscal 2020, we shifted from generally invoicing our multi-year contracts upfront to invoicing on an annual basis. Accordingly, we have seen the timing of our cash collections extend over a longer period of time than it has been historically, and expect this to negatively impact operating cash flows through at least fiscal 2022.
In June 2020, we issued $1.27 billion aggregate principal amount of 1.125% Convertible Senior Notes due 2027 (the “2027 Notes”), including the exercise in full by the initial purchasers of the 2027 Notes of their option to purchase an additional
63

FOR
M 1
0-K
Interest and Other Income (Expense), netFiscal Year Ended January 31,
(In thousands) 2021 2020
Interest and other income (expense), netInterest income $ 13,850 $ 54,142 Interest expense (123,076) (96,249) Other income (expense), net (11,636) (2,407)
Total interest and other income (expense), net $ (120,862) $ (44,514)
Fiscal 2021 - 2020Interest and other income (expense), net reflects a net increase in expense of $76.3 million, primarily due to the following:
+ a decrease in interest income from our investments, a large portion of which matured during fiscal 2021+ an increase in interest expense related to the issuance of convertible senior notes in June 2020+ an increase in foreign exchange transaction losses+ the impairment of a strategic investment during fiscal 2021- a gain on extinguishment of convertible senior notes
Income Tax ProvisionFiscal Year Ended January 31,
(In thousands) 2021 2020
Income tax provision $ 6,932 $ 5,017
Fiscal 2021 - 2020Income tax provision increased $1.9 million, primarily due to a decrease in tax benefit upon the release of valuation allowance as a result of our acquisitions.
62
Seasonality, Cyclicality and Quarterly Trends
Our quarterly results reflect seasonality in the sale of our offerings. Historically, a pattern of increased license sales in the fourth fiscal quarter as a result of industry buying patterns has positively impacted sales activity in that period, which can result in lower sequential revenue in the first fiscal quarter. We expect some of this seasonality to continue in fiscal 2022 and beyond as license sales activity continues, however we expect the impact of this seasonality to decrease over time as a higher percentage of our revenues come from cloud services. As we continue to expect seasonally higher bookings and billings in the fiscal fourth quarter, with more of our revenue being recognized ratably there will also be a seasonal impact on our remaining performance obligations and deferred revenue. Our gross margins and operating losses have been affected by these historical trends because the majority of our expenses are relatively fixed in the short term. The timing of revenues in relation to our expenses, much of which does not vary directly with revenues, has an impact on the cost of revenues, research and development expense, sales and marketing expense and general and administrative expense as a percentage of revenues in each fiscal quarter during the year. The majority of our expenses are personnel-related and include salaries, stock-based compensation, benefits and incentive-based compensation plan expenses. As a result, we have not experienced significant seasonal fluctuations in the timing of expenses from period to period. Although these seasonal factors are common in the technology industry, historical patterns should not be considered a reliable indicator of our future sales activity or performance.
Liquidity and Capital ResourcesFiscal Year Ended January 31,
(In thousands) 2021 2020
Cash and cash equivalents $ 1,771,064 $ 778,653 Investments, current 87,847 976,508 Investments, non-current 13,728 35,370
(In millions)
Cash Used inOperating Activities
$(287.6) $(190.9)
2020 2021
Cash Provided by (Used in)Investing Activities
$(708.0)
$797.2
2020 2021
Cash Provided by (Used in)Financing Activities
$(100.2)
$382.9
2020 2021
Our principal sources of liquidity are our cash and cash equivalents, investments and net accounts receivable. As of January 31, 2021, we had $1.87 billion of cash, cash equivalents and investments of which $227.4 million was held by foreign subsidiaries. We believe that these funds will be sufficient to meet our anticipated cash needs for at least the next 12 months.
We intend to continue to focus our capital expenditures in fiscal 2022 to support the growth in our operations, including acquisition-related activities. Our future capital requirements will depend on many factors including our growth rate, the timing and extent of spending to support development efforts, the expansion of sales and marketing activities, the introduction of new and enhanced software and services offerings, the investments in our office facilities and our systems infrastructure, the continuing market acceptance of our offerings and our planned investments, particularly in our product development efforts or acquisitions of complementary businesses, applications or technologies.
Beginning in fiscal 2020, we shifted from generally invoicing our multi-year contracts upfront to invoicing on an annual basis. Accordingly, we have seen the timing of our cash collections extend over a longer period of time than it has been historically, and expect this to negatively impact operating cash flows through at least fiscal 2022.
In June 2020, we issued $1.27 billion aggregate principal amount of 1.125% Convertible Senior Notes due 2027 (the “2027 Notes”), including the exercise in full by the initial purchasers of the 2027 Notes of their option to purchase an additional
63

$165.0 million principal amount of 2027 Notes. The 2027 Notes are general senior, unsecured obligations of Splunk. The total proceeds from the issuance of the 2027 Notes was $1.25 billion, net of initial purchaser discounts and other issuance costs. In connection with the issuance of the 2027 Notes, we entered into privately negotiated capped call transactions with certain counterparties (the “2027 Capped Calls”). We used approximately $137.4 million of the net proceeds from the offering of the 2027 Notes to pay the cost of the 2027 Capped Calls and $691.6 million to repurchase for cash approximately $488.3 million aggregate principal amount of our outstanding 2023 Notes. In September 2018, we issued $1.27 billion aggregate principal amount of 0.50% Convertible Senior Notes due 2023 (the “2023 Notes”) and $862.5 million aggregate principal amount of 1.125% Convertible Senior Notes due 2025 (the “2025 Notes”). In connection with the issuance of the 2023 Notes and the 2025 Notes, we entered into privately negotiated capped call transactions with certain counterparties (the “2023 and 2025 Capped Calls”). The premiums paid for the purchase of the 2023 and 2025 Capped Calls were $274.3 million. Refer to Note 7 “Convertible Senior Notes” of our accompanying Notes to Consolidated Financial Statements included elsewhere in this Annual Report on 10-K.
In the event that additional financing is required from outside sources, we may not be able to raise it on terms acceptable to us, if at all. If we are unable to raise additional capital when desired, our business, operating results and financial condition could be adversely affected.
Operating Activities
Operating activities consist of our net loss adjusted for certain non-cash items and changes in operating assets and liabilities during the year.
Fiscal 2021 - 2020Net cash used in operating activities was $190.9 million for the year ended January 31, 2021 compared to $287.6 million for the prior year. The decrease in net cash used in operating activities was primarily due to an increase in cash collections from customers, partially offset by higher cash expenditures during fiscal 2021 and the repurchase of convertible senior notes attributable to the accreted interest related to debt discount. The decrease in travel-related expenses during fiscal 2021 as a result of the COVID-19 pandemic and related restrictions also contributed to the decrease in net cash used in operating activities.
Investing Activities
Fiscal 2021 - 2020Net cash provided by investing activities was $797.2 million for the year ended January 31, 2021 compared to net cash used in investing activities of $708.0 million for the prior year. The change in net activity was primarily due to the following:
+ $908.7 million maturities of investments, net of purchases, in marketable debt securities in fiscal 2021 compared to $5.5 million in net purchases of investments in marketable debt securities in fiscal 2020
+ decrease of $538.5 million in cash purchase price paid, net of cash acquired, from our fiscal 2020 acquisitions of SignalFx and Omnition
+ decrease of $64.0 million in purchases of property and equipment due to higher leasehold improvement spend in fiscal 2020 related to new office space
Financing Activities
Fiscal 2021 - 2020Net cash provided by financing activities was $382.9 million for the year ended January 31, 2021 compared to net cash used in financing activities of $100.2 million for the prior year. The change in net activity was primarily due to the following:
+ issuance of $1.25 billion related to the issuance of the 2027 Notes, net of initial purchase discounts and issuance costs+ decrease of $23.4 million in taxes paid related to net share settlement of equity awards
The increase in net cash provided by financing activities was partially offset by the payment of approximately $668.9 million to repurchase for cash approximately $488.3 million aggregate principal amount of our outstanding 2023 Notes, as well as by the use of approximately $137.4 million of the net proceeds from the offering of the 2027 Notes to pay the cost of the 2027 Capped Calls.Contractual Obligations
64
Operating Lease Commitments and Contractual Obligations We lease our office spaces under non-cancelable leases. Refer to Note 4 “Leases” of our accompanying Notes to the
Consolidated Financial Statements included elsewhere in this Annual Report on Form 10-K for additional details related to our accounting for leases and related costs.
Purchase obligations are contractual obligations for purchase of goods or services and are defined as agreements that are enforceable and legally binding and that specify all significant terms, including: fixed or minimum quantities to be purchased; fixed, minimum, or variable price provisions; and the approximate timing of the transaction.
The following summarizes our convertible senior notes, operating lease commitments and significant purchase obligations as of January 31, 2021:
Payments Due by Period
(In thousands) Total Less Than 1year 1-3 years 3-5 years More Than 5
years
0.5% Convertible Senior Notes due 2023 (1) $ 788,310 $ 3,883 $ 7,766 $ 776,661 $ — 1.125% Convertible Senior Notes due 2025 (1) 911,016 9,703 19,406 19,406 862,501 1.125% Convertible Senior Notes due 2027 (1) 1,357,501 14,231 28,462 28,462 1,286,346 Operating lease commitments (2) 512,096 66,374 122,716 99,858 223,148 Purchase obligations (3) 417,503 148,560 264,682 2,757 1,504
Total $ 3,986,426 $ 242,751 $ 443,032 $ 927,144 $ 2,373,499 _________________________(1) Total future payments related to our Convertible Senior Notes due 2023 includes $776.7 million principal amount and future interest
payments of $11.6 million. Total future payments related to our Convertible Senior Notes due 2025 includes $862.5 million principal amount and future interest payments of $48.5 million. Total future payments related to our Convertible Senior Notes due 2027 includes $1.27 billion principal amount and future interest payments of $92.5 million. For more information on our convertible senior notes, refer to Note 7 “Convertible Senior Notes” of our accompanying Notes to the Consolidated Financial Statements included elsewhere in this Annual Report on Form 10-K.
(2) We have entered into sublease agreements for portions of our office space and the future rental income of $3.4 million from these agreements has been included as an offset to our future minimum rental payments.
(3) Purchase obligations relate primarily to IT and product infrastructure costs, enterprise subscription agreements, and sales and marketing costs.
Off-Balance Sheet Arrangements
During fiscal 2021, 2020 and 2019, we did not have any relationships with unconsolidated organizations or financial partnerships, such as structured finance or special purpose entities that have been established for the purpose of facilitating off-balance sheet arrangements or other contractually narrow or limited purposes.
Indemnification Arrangements
During the ordinary course of business, we may indemnify, hold harmless and agree to reimburse for losses suffered or incurred, our customers, vendors and each of their affiliates for certain intellectual property infringement and other claims by third parties with respect to our offerings, in connection with our commercial license arrangements or related to general business dealings with those parties.
As permitted under Delaware law, we have entered into indemnification agreements with our officers, directors, and certain employees, indemnifying them for certain events or occurrences while they serve as our officers or directors or those of our direct and indirect subsidiaries.
Claims and reimbursements under indemnification arrangements have not been material to our consolidated financial statements; therefore, there is no accrual of such amounts at January 31, 2021. We are unable to estimate the maximum potential impact of these indemnifications on our future results of operations.
Item 7A. Quantitative and Qualitative Disclosures about Market Risk
65

FOR
M 1
0-K
$165.0 million principal amount of 2027 Notes. The 2027 Notes are general senior, unsecured obligations of Splunk. The total proceeds from the issuance of the 2027 Notes was $1.25 billion, net of initial purchaser discounts and other issuance costs. In connection with the issuance of the 2027 Notes, we entered into privately negotiated capped call transactions with certain counterparties (the “2027 Capped Calls”). We used approximately $137.4 million of the net proceeds from the offering of the 2027 Notes to pay the cost of the 2027 Capped Calls and $691.6 million to repurchase for cash approximately $488.3 million aggregate principal amount of our outstanding 2023 Notes. In September 2018, we issued $1.27 billion aggregate principal amount of 0.50% Convertible Senior Notes due 2023 (the “2023 Notes”) and $862.5 million aggregate principal amount of 1.125% Convertible Senior Notes due 2025 (the “2025 Notes”). In connection with the issuance of the 2023 Notes and the 2025 Notes, we entered into privately negotiated capped call transactions with certain counterparties (the “2023 and 2025 Capped Calls”). The premiums paid for the purchase of the 2023 and 2025 Capped Calls were $274.3 million. Refer to Note 7 “Convertible Senior Notes” of our accompanying Notes to Consolidated Financial Statements included elsewhere in this Annual Report on 10-K.
In the event that additional financing is required from outside sources, we may not be able to raise it on terms acceptable to us, if at all. If we are unable to raise additional capital when desired, our business, operating results and financial condition could be adversely affected.
Operating Activities
Operating activities consist of our net loss adjusted for certain non-cash items and changes in operating assets and liabilities during the year.
Fiscal 2021 - 2020Net cash used in operating activities was $190.9 million for the year ended January 31, 2021 compared to $287.6 million for the prior year. The decrease in net cash used in operating activities was primarily due to an increase in cash collections from customers, partially offset by higher cash expenditures during fiscal 2021 and the repurchase of convertible senior notes attributable to the accreted interest related to debt discount. The decrease in travel-related expenses during fiscal 2021 as a result of the COVID-19 pandemic and related restrictions also contributed to the decrease in net cash used in operating activities.
Investing Activities
Fiscal 2021 - 2020Net cash provided by investing activities was $797.2 million for the year ended January 31, 2021 compared to net cash used in investing activities of $708.0 million for the prior year. The change in net activity was primarily due to the following:
+ $908.7 million maturities of investments, net of purchases, in marketable debt securities in fiscal 2021 compared to $5.5 million in net purchases of investments in marketable debt securities in fiscal 2020
+ decrease of $538.5 million in cash purchase price paid, net of cash acquired, from our fiscal 2020 acquisitions of SignalFx and Omnition
+ decrease of $64.0 million in purchases of property and equipment due to higher leasehold improvement spend in fiscal 2020 related to new office space
Financing Activities
Fiscal 2021 - 2020Net cash provided by financing activities was $382.9 million for the year ended January 31, 2021 compared to net cash used in financing activities of $100.2 million for the prior year. The change in net activity was primarily due to the following:
+ issuance of $1.25 billion related to the issuance of the 2027 Notes, net of initial purchase discounts and issuance costs+ decrease of $23.4 million in taxes paid related to net share settlement of equity awards
The increase in net cash provided by financing activities was partially offset by the payment of approximately $668.9 million to repurchase for cash approximately $488.3 million aggregate principal amount of our outstanding 2023 Notes, as well as by the use of approximately $137.4 million of the net proceeds from the offering of the 2027 Notes to pay the cost of the 2027 Capped Calls.Contractual Obligations
64
Operating Lease Commitments and Contractual Obligations We lease our office spaces under non-cancelable leases. Refer to Note 4 “Leases” of our accompanying Notes to the
Consolidated Financial Statements included elsewhere in this Annual Report on Form 10-K for additional details related to our accounting for leases and related costs.
Purchase obligations are contractual obligations for purchase of goods or services and are defined as agreements that are enforceable and legally binding and that specify all significant terms, including: fixed or minimum quantities to be purchased; fixed, minimum, or variable price provisions; and the approximate timing of the transaction.
The following summarizes our convertible senior notes, operating lease commitments and significant purchase obligations as of January 31, 2021:
Payments Due by Period
(In thousands) Total Less Than 1year 1-3 years 3-5 years More Than 5
years
0.5% Convertible Senior Notes due 2023 (1) $ 788,310 $ 3,883 $ 7,766 $ 776,661 $ — 1.125% Convertible Senior Notes due 2025 (1) 911,016 9,703 19,406 19,406 862,501 1.125% Convertible Senior Notes due 2027 (1) 1,357,501 14,231 28,462 28,462 1,286,346 Operating lease commitments (2) 512,096 66,374 122,716 99,858 223,148 Purchase obligations (3) 417,503 148,560 264,682 2,757 1,504
Total $ 3,986,426 $ 242,751 $ 443,032 $ 927,144 $ 2,373,499 _________________________(1) Total future payments related to our Convertible Senior Notes due 2023 includes $776.7 million principal amount and future interest
payments of $11.6 million. Total future payments related to our Convertible Senior Notes due 2025 includes $862.5 million principal amount and future interest payments of $48.5 million. Total future payments related to our Convertible Senior Notes due 2027 includes $1.27 billion principal amount and future interest payments of $92.5 million. For more information on our convertible senior notes, refer to Note 7 “Convertible Senior Notes” of our accompanying Notes to the Consolidated Financial Statements included elsewhere in this Annual Report on Form 10-K.
(2) We have entered into sublease agreements for portions of our office space and the future rental income of $3.4 million from these agreements has been included as an offset to our future minimum rental payments.
(3) Purchase obligations relate primarily to IT and product infrastructure costs, enterprise subscription agreements, and sales and marketing costs.
Off-Balance Sheet Arrangements
During fiscal 2021, 2020 and 2019, we did not have any relationships with unconsolidated organizations or financial partnerships, such as structured finance or special purpose entities that have been established for the purpose of facilitating off-balance sheet arrangements or other contractually narrow or limited purposes.
Indemnification Arrangements
During the ordinary course of business, we may indemnify, hold harmless and agree to reimburse for losses suffered or incurred, our customers, vendors and each of their affiliates for certain intellectual property infringement and other claims by third parties with respect to our offerings, in connection with our commercial license arrangements or related to general business dealings with those parties.
As permitted under Delaware law, we have entered into indemnification agreements with our officers, directors, and certain employees, indemnifying them for certain events or occurrences while they serve as our officers or directors or those of our direct and indirect subsidiaries.
Claims and reimbursements under indemnification arrangements have not been material to our consolidated financial statements; therefore, there is no accrual of such amounts at January 31, 2021. We are unable to estimate the maximum potential impact of these indemnifications on our future results of operations.
Item 7A. Quantitative and Qualitative Disclosures about Market Risk
65

Interest Rate Risk
We had cash and cash equivalents of $1.8 billion as of January 31, 2021. We hold our cash and cash equivalents for working capital purposes. Our cash and cash equivalents are held in cash deposits and money market funds. The primary objective of our investment activities is to preserve principal while maximizing yields without significantly increasing risk. This objective is accomplished by making diversified investments, consisting only of investment grade securities. During fiscal 2021 and 2020, the effect of a hypothetical 10% increase or decrease in overall interest rates would not have had a material impact on our operating results or the value of our available-for-sale debt securities.
In September 2018, we issued $2.13 billion aggregate principal amount of convertible senior notes in a private placement, which includes $1.27 billion aggregate principal amount of 0.50% Convertible Senior Notes due 2023 and $862.5 million aggregate principal amount of 1.125% Convertible Senior Notes due 2025 (together, the “Notes”). In June 2020, we issued $1.27 billion aggregate principal amount of 1.125% Convertible Senior Notes due 2027 (the “2027 Notes”), including the exercise in full by the initial purchasers of the 2027 Notes of their option to purchase an additional $165.0 million principal amount of 2027 Notes. The 2027 Notes are general senior, unsecured obligations of Splunk. As these instruments have a fixed annual interest rate, we have no financial or economic interest exposure associated with changes in interest rates. However, the fair value of fixed rate debt instruments fluctuates when interest rates change. Additionally, the fair value of either series of Notes can be affected when the market price of our common stock fluctuates. We carry the Notes at face value less unamortized discount on our balance sheet, and we present the fair value for required disclosure purposes only. Refer to Note 7 “Convertible Senior Notes” of our accompanying Notes to Consolidated Financial Statements included elsewhere in this Annual Report on 10-K.
Foreign Currency Exchange Risk
Our results of operations and cash flows are subject to fluctuations due to changes in foreign currency exchange rates. All of our revenues are generated in U.S. dollars. Our expenses are generally denominated in the currencies in which our operations are located, which is primarily in the United States and to a lesser extent in Europe and Asia. Our results of operations and cash flows are, therefore, subject to fluctuations due to changes in foreign currency exchange rates and may be adversely affected in the future due to changes in foreign exchange rates. We seek to minimize the impact of certain foreign currency fluctuations by hedging certain balance sheet exposures with foreign currency forward contracts. Any gain or loss from settling these contracts is offset by the loss or gain derived from the underlying balance sheet exposures. We do not enter into any hedging contracts for trading or speculative purposes. The effect of a hypothetical 10% change in foreign currency exchange rates applicable to our business would not have a material impact on our historical consolidated financial statements. As our international operations grow, we will continue to reassess our approach to manage our risk relating to fluctuations in currency rates. Inflation
We do not believe that inflation had a material effect on our business, financial condition or results of operations in the last three fiscal years. If our costs were to become subject to significant inflationary pressures, we may not be able to fully offset such higher costs through price increases. Our inability or failure to do so could harm our business, financial condition and results of operations.
Recent Accounting Pronouncements
For recent accounting pronouncements, refer to Note 1 of our accompanying Notes to Consolidated Financial Statements included elsewhere in this Annual Report on Form 10-K.
66
Item 8. Financial Statements and Supplementary Data
Splunk Inc.
Index to Consolidated Financial Statements
Page No.
Report of Independent Registered Public Accounting Firm 68
Consolidated Balance Sheets 70
Consolidated Statements of Operations 71
Consolidated Statements of Comprehensive Loss 72
Consolidated Statements of Cash Flows 73
Consolidated Statements of Stockholders’ Equity 75
Notes to Consolidated Financial Statements 77
67

FOR
M 1
0-K
Interest Rate Risk
We had cash and cash equivalents of $1.8 billion as of January 31, 2021. We hold our cash and cash equivalents for working capital purposes. Our cash and cash equivalents are held in cash deposits and money market funds. The primary objective of our investment activities is to preserve principal while maximizing yields without significantly increasing risk. This objective is accomplished by making diversified investments, consisting only of investment grade securities. During fiscal 2021 and 2020, the effect of a hypothetical 10% increase or decrease in overall interest rates would not have had a material impact on our operating results or the value of our available-for-sale debt securities.
In September 2018, we issued $2.13 billion aggregate principal amount of convertible senior notes in a private placement, which includes $1.27 billion aggregate principal amount of 0.50% Convertible Senior Notes due 2023 and $862.5 million aggregate principal amount of 1.125% Convertible Senior Notes due 2025 (together, the “Notes”). In June 2020, we issued $1.27 billion aggregate principal amount of 1.125% Convertible Senior Notes due 2027 (the “2027 Notes”), including the exercise in full by the initial purchasers of the 2027 Notes of their option to purchase an additional $165.0 million principal amount of 2027 Notes. The 2027 Notes are general senior, unsecured obligations of Splunk. As these instruments have a fixed annual interest rate, we have no financial or economic interest exposure associated with changes in interest rates. However, the fair value of fixed rate debt instruments fluctuates when interest rates change. Additionally, the fair value of either series of Notes can be affected when the market price of our common stock fluctuates. We carry the Notes at face value less unamortized discount on our balance sheet, and we present the fair value for required disclosure purposes only. Refer to Note 7 “Convertible Senior Notes” of our accompanying Notes to Consolidated Financial Statements included elsewhere in this Annual Report on 10-K.
Foreign Currency Exchange Risk
Our results of operations and cash flows are subject to fluctuations due to changes in foreign currency exchange rates. All of our revenues are generated in U.S. dollars. Our expenses are generally denominated in the currencies in which our operations are located, which is primarily in the United States and to a lesser extent in Europe and Asia. Our results of operations and cash flows are, therefore, subject to fluctuations due to changes in foreign currency exchange rates and may be adversely affected in the future due to changes in foreign exchange rates. We seek to minimize the impact of certain foreign currency fluctuations by hedging certain balance sheet exposures with foreign currency forward contracts. Any gain or loss from settling these contracts is offset by the loss or gain derived from the underlying balance sheet exposures. We do not enter into any hedging contracts for trading or speculative purposes. The effect of a hypothetical 10% change in foreign currency exchange rates applicable to our business would not have a material impact on our historical consolidated financial statements. As our international operations grow, we will continue to reassess our approach to manage our risk relating to fluctuations in currency rates. Inflation
We do not believe that inflation had a material effect on our business, financial condition or results of operations in the last three fiscal years. If our costs were to become subject to significant inflationary pressures, we may not be able to fully offset such higher costs through price increases. Our inability or failure to do so could harm our business, financial condition and results of operations.
Recent Accounting Pronouncements
For recent accounting pronouncements, refer to Note 1 of our accompanying Notes to Consolidated Financial Statements included elsewhere in this Annual Report on Form 10-K.
66
Item 8. Financial Statements and Supplementary Data
Splunk Inc.
Index to Consolidated Financial Statements
Page No.
Report of Independent Registered Public Accounting Firm 68
Consolidated Balance Sheets 70
Consolidated Statements of Operations 71
Consolidated Statements of Comprehensive Loss 72
Consolidated Statements of Cash Flows 73
Consolidated Statements of Stockholders’ Equity 75
Notes to Consolidated Financial Statements 77
67

Report of Independent Registered Public Accounting Firm
To the Board of Directors and Stockholders of Splunk Inc.
Opinions on the Financial Statements and Internal Control over Financial Reporting
We have audited the accompanying consolidated balance sheets of Splunk Inc. and its subsidiaries (the “Company”) as of January 31, 2021 and 2020, and the related consolidated statements of operations, of comprehensive loss, of stockholders’ equity and of cash flows for each of the three years in the period ended January 31, 2021, including the related notes (collectively referred to as the “consolidated financial statements”). We also have audited the Company's internal control over financial reporting as of January 31, 2021, based on criteria established in Internal Control - Integrated Framework (2013) issued by the Committee of Sponsoring Organizations of the Treadway Commission (COSO).
In our opinion, the consolidated financial statements referred to above present fairly, in all material respects, the financial position of the Company as of January 31, 2021 and 2020, and the results of its operations and its cash flows for each of the three years in the period ended January 31, 2021 in conformity with accounting principles generally accepted in the United States of America. Also in our opinion, the Company maintained, in all material respects, effective internal control over financial reporting as of January 31, 2021, based on criteria established in Internal Control - Integrated Framework (2013) issued by the COSO.
Change in Accounting Principle
As discussed in Note 1 to the consolidated financial statements, the Company changed the manner in which it accounts for leases as of February 1, 2019.
Basis for Opinions
The Company's management is responsible for these consolidated financial statements, for maintaining effective internal control over financial reporting, and for its assessment of the effectiveness of internal control over financial reporting, included in Management’s Annual Report on Internal Control over Financial Reporting appearing under Item 9A. Our responsibility is to express opinions on the Company’s consolidated financial statements and on the Company's internal control over financial reporting based on our audits. We are a public accounting firm registered with the Public Company Accounting Oversight Board (United States) (PCAOB) and are required to be independent with respect to the Company in accordance with the U.S. federal securities laws and the applicable rules and regulations of the Securities and Exchange Commission and the PCAOB.
We conducted our audits in accordance with the standards of the PCAOB. Those standards require that we plan and perform the audits to obtain reasonable assurance about whether the consolidated financial statements are free of material misstatement, whether due to error or fraud, and whether effective internal control over financial reporting was maintained in all material respects.
Our audits of the consolidated financial statements included performing procedures to assess the risks of material misstatement of the consolidated financial statements, whether due to error or fraud, and performing procedures that respond to those risks. Such procedures included examining, on a test basis, evidence regarding the amounts and disclosures in the consolidated financial statements. Our audits also included evaluating the accounting principles used and significant estimates made by management, as well as evaluating the overall presentation of the consolidated financial statements. Our audit of internal control over financial reporting included obtaining an understanding of internal control over financial reporting, assessing the risk that a material weakness exists, and testing and evaluating the design and operating effectiveness of internal control based on the assessed risk. Our audits also included performing such other procedures as we considered necessary in the circumstances. We believe that our audits provide a reasonable basis for our opinions.
Definition and Limitations of Internal Control over Financial Reporting
A company’s internal control over financial reporting is a process designed to provide reasonable assurance regarding the reliability of financial reporting and the preparation of financial statements for external purposes in accordance with generally accepted accounting principles. A company’s internal control over financial reporting includes those policies and procedures that (i) pertain to the maintenance of records that, in reasonable detail, accurately and fairly reflect the transactions and
68
dispositions of the assets of the company; (ii) provide reasonable assurance that transactions are recorded as necessary to permit preparation of financial statements in accordance with generally accepted accounting principles, and that receipts and expenditures of the company are being made only in accordance with authorizations of management and directors of the company; and (iii) provide reasonable assurance regarding prevention or timely detection of unauthorized acquisition, use, or disposition of the company’s assets that could have a material effect on the financial statements.
Because of its inherent limitations, internal control over financial reporting may not prevent or detect misstatements. Also, projections of any evaluation of effectiveness to future periods are subject to the risk that controls may become inadequate because of changes in conditions, or that the degree of compliance with the policies or procedures may deteriorate.
Critical Audit Matters
The critical audit matter communicated below is a matter arising from the current period audit of the consolidated financial statements that was communicated or required to be communicated to the audit committee and that (i) relates to accounts or disclosures that are material to the consolidated financial statements and (ii) involved our especially challenging, subjective, or complex judgments. The communication of critical audit matters does not alter in any way our opinion on the consolidated financial statements, taken as a whole, and we are not, by communicating the critical audit matter below, providing a separate opinion on the critical audit matter or on the accounts or disclosures to which it relates.
Revenue recognition - Identifying, Evaluating and Accounting for Terms and Conditions in Contracts with Customers
As described in Note 1 to the consolidated financial statements, the Company generates revenue in the form of software license and related maintenance fees, cloud services and other service fees. The Company’s contracts with customers often contain multiple performance obligations. Management accounts for individual performance obligations separately if they are distinct. Management applies significant judgment in identifying and accounting for each performance obligation as a result of evaluating the terms and conditions in contracts. As disclosed by management, the Company’s revenue was $2.2 billion for the fiscal year ended January 31, 2021.
The principal considerations for our determination that performing procedures relating to revenue recognition, specifically the identification, evaluation and accounting for terms and conditions in contracts with customers, is a critical audit matter are the significant judgment by management in identifying, evaluating and accounting for terms and conditions in contracts with customers. This in turn led to significant auditor judgment and effort in performing procedures and evaluating audit evidence related to whether terms and conditions in contracts were appropriately identified, evaluated and accounted for by management.
Addressing the matter involved performing procedures and evaluating audit evidence in connection with forming our overall opinion on the consolidated financial statements. These procedures included testing the effectiveness of controls relating to the revenue recognition process, including controls over the identification and evaluation of the contractual terms and conditions that impact the identification of performance obligations and determination of revenue recognition. These procedures also included, among others, (i) testing the completeness and accuracy of management’s identification and evaluation of the terms and conditions in contracts with customers by examining revenue arrangements on a test basis, and (ii) testing management’s process for identifying and evaluating the terms and conditions in contracts with customers, including management’s identification of the performance obligations and determination of the impact of those terms and conditions on revenue recognition.
/s/ PricewaterhouseCoopers LLPSan Jose, CaliforniaMarch 31, 2021
We have served as the Company’s auditor since 2010.
69

FOR
M 1
0-K
Report of Independent Registered Public Accounting Firm
To the Board of Directors and Stockholders of Splunk Inc.
Opinions on the Financial Statements and Internal Control over Financial Reporting
We have audited the accompanying consolidated balance sheets of Splunk Inc. and its subsidiaries (the “Company”) as of January 31, 2021 and 2020, and the related consolidated statements of operations, of comprehensive loss, of stockholders’ equity and of cash flows for each of the three years in the period ended January 31, 2021, including the related notes (collectively referred to as the “consolidated financial statements”). We also have audited the Company's internal control over financial reporting as of January 31, 2021, based on criteria established in Internal Control - Integrated Framework (2013) issued by the Committee of Sponsoring Organizations of the Treadway Commission (COSO).
In our opinion, the consolidated financial statements referred to above present fairly, in all material respects, the financial position of the Company as of January 31, 2021 and 2020, and the results of its operations and its cash flows for each of the three years in the period ended January 31, 2021 in conformity with accounting principles generally accepted in the United States of America. Also in our opinion, the Company maintained, in all material respects, effective internal control over financial reporting as of January 31, 2021, based on criteria established in Internal Control - Integrated Framework (2013) issued by the COSO.
Change in Accounting Principle
As discussed in Note 1 to the consolidated financial statements, the Company changed the manner in which it accounts for leases as of February 1, 2019.
Basis for Opinions
The Company's management is responsible for these consolidated financial statements, for maintaining effective internal control over financial reporting, and for its assessment of the effectiveness of internal control over financial reporting, included in Management’s Annual Report on Internal Control over Financial Reporting appearing under Item 9A. Our responsibility is to express opinions on the Company’s consolidated financial statements and on the Company's internal control over financial reporting based on our audits. We are a public accounting firm registered with the Public Company Accounting Oversight Board (United States) (PCAOB) and are required to be independent with respect to the Company in accordance with the U.S. federal securities laws and the applicable rules and regulations of the Securities and Exchange Commission and the PCAOB.
We conducted our audits in accordance with the standards of the PCAOB. Those standards require that we plan and perform the audits to obtain reasonable assurance about whether the consolidated financial statements are free of material misstatement, whether due to error or fraud, and whether effective internal control over financial reporting was maintained in all material respects.
Our audits of the consolidated financial statements included performing procedures to assess the risks of material misstatement of the consolidated financial statements, whether due to error or fraud, and performing procedures that respond to those risks. Such procedures included examining, on a test basis, evidence regarding the amounts and disclosures in the consolidated financial statements. Our audits also included evaluating the accounting principles used and significant estimates made by management, as well as evaluating the overall presentation of the consolidated financial statements. Our audit of internal control over financial reporting included obtaining an understanding of internal control over financial reporting, assessing the risk that a material weakness exists, and testing and evaluating the design and operating effectiveness of internal control based on the assessed risk. Our audits also included performing such other procedures as we considered necessary in the circumstances. We believe that our audits provide a reasonable basis for our opinions.
Definition and Limitations of Internal Control over Financial Reporting
A company’s internal control over financial reporting is a process designed to provide reasonable assurance regarding the reliability of financial reporting and the preparation of financial statements for external purposes in accordance with generally accepted accounting principles. A company’s internal control over financial reporting includes those policies and procedures that (i) pertain to the maintenance of records that, in reasonable detail, accurately and fairly reflect the transactions and
68
dispositions of the assets of the company; (ii) provide reasonable assurance that transactions are recorded as necessary to permit preparation of financial statements in accordance with generally accepted accounting principles, and that receipts and expenditures of the company are being made only in accordance with authorizations of management and directors of the company; and (iii) provide reasonable assurance regarding prevention or timely detection of unauthorized acquisition, use, or disposition of the company’s assets that could have a material effect on the financial statements.
Because of its inherent limitations, internal control over financial reporting may not prevent or detect misstatements. Also, projections of any evaluation of effectiveness to future periods are subject to the risk that controls may become inadequate because of changes in conditions, or that the degree of compliance with the policies or procedures may deteriorate.
Critical Audit Matters
The critical audit matter communicated below is a matter arising from the current period audit of the consolidated financial statements that was communicated or required to be communicated to the audit committee and that (i) relates to accounts or disclosures that are material to the consolidated financial statements and (ii) involved our especially challenging, subjective, or complex judgments. The communication of critical audit matters does not alter in any way our opinion on the consolidated financial statements, taken as a whole, and we are not, by communicating the critical audit matter below, providing a separate opinion on the critical audit matter or on the accounts or disclosures to which it relates.
Revenue recognition - Identifying, Evaluating and Accounting for Terms and Conditions in Contracts with Customers
As described in Note 1 to the consolidated financial statements, the Company generates revenue in the form of software license and related maintenance fees, cloud services and other service fees. The Company’s contracts with customers often contain multiple performance obligations. Management accounts for individual performance obligations separately if they are distinct. Management applies significant judgment in identifying and accounting for each performance obligation as a result of evaluating the terms and conditions in contracts. As disclosed by management, the Company’s revenue was $2.2 billion for the fiscal year ended January 31, 2021.
The principal considerations for our determination that performing procedures relating to revenue recognition, specifically the identification, evaluation and accounting for terms and conditions in contracts with customers, is a critical audit matter are the significant judgment by management in identifying, evaluating and accounting for terms and conditions in contracts with customers. This in turn led to significant auditor judgment and effort in performing procedures and evaluating audit evidence related to whether terms and conditions in contracts were appropriately identified, evaluated and accounted for by management.
Addressing the matter involved performing procedures and evaluating audit evidence in connection with forming our overall opinion on the consolidated financial statements. These procedures included testing the effectiveness of controls relating to the revenue recognition process, including controls over the identification and evaluation of the contractual terms and conditions that impact the identification of performance obligations and determination of revenue recognition. These procedures also included, among others, (i) testing the completeness and accuracy of management’s identification and evaluation of the terms and conditions in contracts with customers by examining revenue arrangements on a test basis, and (ii) testing management’s process for identifying and evaluating the terms and conditions in contracts with customers, including management’s identification of the performance obligations and determination of the impact of those terms and conditions on revenue recognition.
/s/ PricewaterhouseCoopers LLPSan Jose, CaliforniaMarch 31, 2021
We have served as the Company’s auditor since 2010.
69

(In thousands, except share and per share amounts) January 31, 2021 January 31, 2020Assets
Current assets
Cash and cash equivalents $ 1,771,064 $ 778,653 Investments, current 87,847 976,508 Accounts receivable, net 1,114,199 838,743 Prepaid expenses and other current assets 162,939 129,839 Deferred commissions, current 136,331 99,072
Total current assets 3,272,380 2,822,815 Investments, non-current 13,728 35,370 Accounts receivable, non-current 347,202 468,934 Operating lease right-of-use assets 356,296 267,086 Property and equipment, net 182,780 156,928 Intangible assets, net 206,153 238,415 Goodwill 1,334,888 1,292,840 Deferred commissions, non-current 69,637 88,990 Other assets 85,422 68,093
Total assets $ 5,868,486 $ 5,439,471 Liabilities and Stockholders’ Equity
Current liabilities
Accounts payable $ 9,319 $ 18,938 Accrued compensation 281,986 286,159 Accrued expenses and other liabilities 202,959 177,822 Deferred revenue, current 1,030,484 829,377
Total current liabilities 1,524,748 1,312,296 Convertible senior notes, net 2,302,635 1,714,630 Operating lease liabilities 330,970 235,631 Deferred revenue, non-current 110,418 176,832 Other liabilities, non-current 5,710 653
Total non-current liabilities 2,749,733 2,127,746 Total liabilities 4,274,481 3,440,042
Commitments and contingencies (Note 3 and 4)Stockholders’ equity
Preferred stock: $0.001 par value; 20,000,000 shares authorized; no shares issued or outstanding at January 31, 2021 and January 31, 2020 — — Common stock: $0.001 par value; 1,000,000,000 shares authorized; 163,147,139 shares issued and outstanding at January 31, 2021, and 157,787,548 shares issued and outstanding at January 31, 2020 163 157 Accumulated other comprehensive loss (592) (5,312) Additional paid-in capital 4,063,885 3,566,055 Accumulated deficit (2,469,451) (1,561,471)
Total stockholders’ equity 1,594,005 1,999,429 Total liabilities and stockholders’ equity $ 5,868,486 $ 5,439,471
The accompanying notes are an integral part of these consolidated financial statements.
Splunk Inc.CONSOLIDATED BALANCE SHEETS
70
Fiscal Year Ended January 31,(In thousands, except per share amounts) 2021 2020 2019Revenues
License $ 971,378 $ 1,373,367 $ 1,030,277 Cloud services 554,132 312,358 171,200 Maintenance and services 703,875 673,201 601,533
Total revenues 2,229,385 2,358,926 1,803,010 Cost of revenues (1)
License 20,864 24,116 22,527 Cloud services 252,290 161,510 112,446 Maintenance and services 274,191 244,162 209,703
Total cost of revenues 547,345 429,788 344,676 Gross profit 1,682,040 1,929,138 1,458,334 Operating expenses (1)
Research and development 791,026 619,800 441,969 Sales and marketing 1,336,056 1,263,873 1,029,950 General and administrative 335,144 332,602 237,588
Total operating expenses 2,462,226 2,216,275 1,709,507 Operating loss (780,186) (287,137) (251,173) Interest and other income (expense), net
Interest income 13,850 54,142 31,458 Interest expense (123,076) (96,249) (41,963) Other income (expense), net (11,636) (2,407) (1,513)
Total interest and other income (expense), net (120,862) (44,514) (12,018) Loss before income taxes (901,048) (331,651) (263,191) Income tax provision 6,932 5,017 12,386 Net loss $ (907,980) $ (336,668) $ (275,577)
Basic and diluted net loss per share $ (5.68) $ (2.22) $ (1.89)
Weighted-average shares used in computing basic and diluted net loss per share 159,744 151,949 145,707
_________________________(1) Amounts include stock-based compensation expense, as follows:
Cost of revenues $ 56,437 $ 44,399 $ 37,501 Research and development 271,120 185,262 137,171 Sales and marketing 198,346 216,276 190,422 General and administrative 92,752 99,487 76,836
The accompanying notes are an integral part of these consolidated financial statements.
Splunk Inc.CONSOLIDATED STATEMENTS OF OPERATIONS
71

FOR
M 1
0-K
(In thousands, except share and per share amounts) January 31, 2021 January 31, 2020Assets
Current assets
Cash and cash equivalents $ 1,771,064 $ 778,653 Investments, current 87,847 976,508 Accounts receivable, net 1,114,199 838,743 Prepaid expenses and other current assets 162,939 129,839 Deferred commissions, current 136,331 99,072
Total current assets 3,272,380 2,822,815 Investments, non-current 13,728 35,370 Accounts receivable, non-current 347,202 468,934 Operating lease right-of-use assets 356,296 267,086 Property and equipment, net 182,780 156,928 Intangible assets, net 206,153 238,415 Goodwill 1,334,888 1,292,840 Deferred commissions, non-current 69,637 88,990 Other assets 85,422 68,093
Total assets $ 5,868,486 $ 5,439,471 Liabilities and Stockholders’ Equity
Current liabilities
Accounts payable $ 9,319 $ 18,938 Accrued compensation 281,986 286,159 Accrued expenses and other liabilities 202,959 177,822 Deferred revenue, current 1,030,484 829,377
Total current liabilities 1,524,748 1,312,296 Convertible senior notes, net 2,302,635 1,714,630 Operating lease liabilities 330,970 235,631 Deferred revenue, non-current 110,418 176,832 Other liabilities, non-current 5,710 653
Total non-current liabilities 2,749,733 2,127,746 Total liabilities 4,274,481 3,440,042
Commitments and contingencies (Note 3 and 4)Stockholders’ equity
Preferred stock: $0.001 par value; 20,000,000 shares authorized; no shares issued or outstanding at January 31, 2021 and January 31, 2020 — — Common stock: $0.001 par value; 1,000,000,000 shares authorized; 163,147,139 shares issued and outstanding at January 31, 2021, and 157,787,548 shares issued and outstanding at January 31, 2020 163 157 Accumulated other comprehensive loss (592) (5,312) Additional paid-in capital 4,063,885 3,566,055 Accumulated deficit (2,469,451) (1,561,471)
Total stockholders’ equity 1,594,005 1,999,429 Total liabilities and stockholders’ equity $ 5,868,486 $ 5,439,471
The accompanying notes are an integral part of these consolidated financial statements.
Splunk Inc.CONSOLIDATED BALANCE SHEETS
70
Fiscal Year Ended January 31,(In thousands, except per share amounts) 2021 2020 2019Revenues
License $ 971,378 $ 1,373,367 $ 1,030,277 Cloud services 554,132 312,358 171,200 Maintenance and services 703,875 673,201 601,533
Total revenues 2,229,385 2,358,926 1,803,010 Cost of revenues (1)
License 20,864 24,116 22,527 Cloud services 252,290 161,510 112,446 Maintenance and services 274,191 244,162 209,703
Total cost of revenues 547,345 429,788 344,676 Gross profit 1,682,040 1,929,138 1,458,334 Operating expenses (1)
Research and development 791,026 619,800 441,969 Sales and marketing 1,336,056 1,263,873 1,029,950 General and administrative 335,144 332,602 237,588
Total operating expenses 2,462,226 2,216,275 1,709,507 Operating loss (780,186) (287,137) (251,173) Interest and other income (expense), net
Interest income 13,850 54,142 31,458 Interest expense (123,076) (96,249) (41,963) Other income (expense), net (11,636) (2,407) (1,513)
Total interest and other income (expense), net (120,862) (44,514) (12,018) Loss before income taxes (901,048) (331,651) (263,191) Income tax provision 6,932 5,017 12,386 Net loss $ (907,980) $ (336,668) $ (275,577)
Basic and diluted net loss per share $ (5.68) $ (2.22) $ (1.89)
Weighted-average shares used in computing basic and diluted net loss per share 159,744 151,949 145,707
_________________________(1) Amounts include stock-based compensation expense, as follows:
Cost of revenues $ 56,437 $ 44,399 $ 37,501 Research and development 271,120 185,262 137,171 Sales and marketing 198,346 216,276 190,422 General and administrative 92,752 99,487 76,836
The accompanying notes are an integral part of these consolidated financial statements.
Splunk Inc.CONSOLIDATED STATEMENTS OF OPERATIONS
71
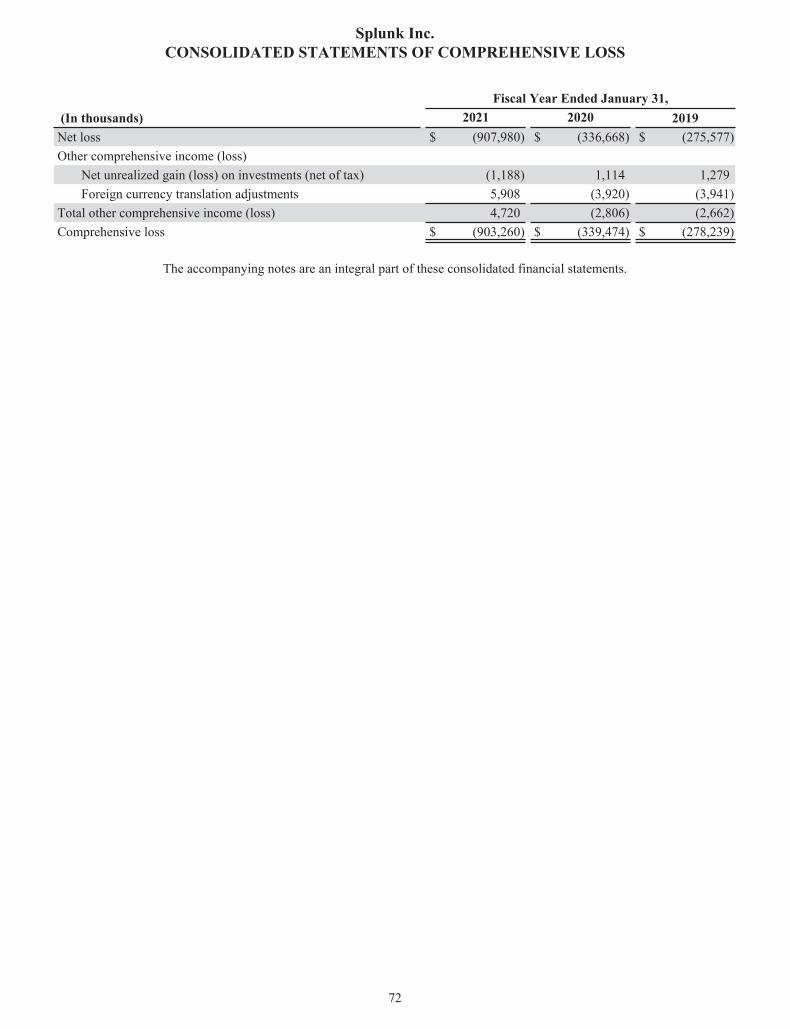
Fiscal Year Ended January 31, (In thousands) 2021 2020 2019Net loss $ (907,980) $ (336,668) $ (275,577) Other comprehensive income (loss)
Net unrealized gain (loss) on investments (net of tax) (1,188) 1,114 1,279 Foreign currency translation adjustments 5,908 (3,920) (3,941)
Total other comprehensive income (loss) 4,720 (2,806) (2,662) Comprehensive loss $ (903,260) $ (339,474) $ (278,239)
The accompanying notes are an integral part of these consolidated financial statements.
Splunk Inc.CONSOLIDATED STATEMENTS OF COMPREHENSIVE LOSS
72
Fiscal Year Ended January 31,(In thousands) 2021 2020 2019Cash flows from operating activities
Net loss $ (907,980) $ (336,668) $ (275,577) Adjustments to reconcile net loss to net cash provided by (used in) operating activities:
Depreciation and amortization 93,666 67,661 52,430 Amortization of deferred commissions 142,095 104,353 77,867 Amortization of investment premiums (accretion of discounts), net (667) (9,553) (4,743) Loss on strategic investment 4,500 — — Amortization of debt discount and issuance costs 98,977 80,156 28,019 Gain on extinguishment of convertible senior notes (6,952) — — Repurchase of convertible senior notes attributable to the accreted interest related to debt discount (22,149) — — Non-cash operating lease costs 25,410 1,198 — Stock-based compensation 618,655 545,424 441,930 Disposal of property and equipment 1,045 1,974 — Deferred income taxes (3,590) (6,120) (4,064) Changes in operating assets and liabilities, net of acquisitions:
Accounts receivable, net (153,724) (679,891) (220,940) Prepaid expenses and other assets (45,476) (69,575) 6,970 Deferred commissions (160,001) (149,426) (130,485) Accounts payable (9,082) (5,441) 9,240 Accrued compensation (3,805) 58,898 81,213 Accrued expenses and other liabilities 3,814 (10,392) 30,751 Deferred revenue 134,402 119,766 203,843
Net cash provided by (used in) operating activities (190,862) (287,636) 296,454 Cash flows from investing activities
Purchases of investments (87,135) (1,086,317) (1,109,852) Maturities of investments 995,878 1,080,812 754,138 Acquisitions, net of cash acquired (56,383) (594,870) (394,910) Purchases of property and equipment (37,107) (101,119) (23,160) Capitalized software development costs (14,602) (2,589) — Other investment activities (3,461) (3,898) (5,494)
Net cash provided by (used in) investing activities 797,190 (707,981) (779,278) Cash flows from financing activities
Proceeds from the exercise of stock options 3,473 3,543 1,953 Proceeds from employee stock purchase plan 79,949 60,383 46,342 Proceeds from the issuance of convertible senior notes, net of issuance costs 1,246,544 — 2,105,296 Purchase of capped calls (137,379) — (274,275) Partial repurchase of convertible senior notes (668,929) — — Taxes paid related to net share settlement of equity awards (140,776) (164,160) (63,369) Repayment of financing lease obligation — — (2,522)
Net cash provided by (used in) financing activities 382,882 (100,234) 1,813,425
Splunk Inc.CONSOLIDATED STATEMENTS OF CASH FLOWS
73

FOR
M 1
0-K
Fiscal Year Ended January 31, (In thousands) 2021 2020 2019Net loss $ (907,980) $ (336,668) $ (275,577) Other comprehensive income (loss)
Net unrealized gain (loss) on investments (net of tax) (1,188) 1,114 1,279 Foreign currency translation adjustments 5,908 (3,920) (3,941)
Total other comprehensive income (loss) 4,720 (2,806) (2,662) Comprehensive loss $ (903,260) $ (339,474) $ (278,239)
The accompanying notes are an integral part of these consolidated financial statements.
Splunk Inc.CONSOLIDATED STATEMENTS OF COMPREHENSIVE LOSS
72
Fiscal Year Ended January 31,(In thousands) 2021 2020 2019Cash flows from operating activities
Net loss $ (907,980) $ (336,668) $ (275,577) Adjustments to reconcile net loss to net cash provided by (used in) operating activities:
Depreciation and amortization 93,666 67,661 52,430 Amortization of deferred commissions 142,095 104,353 77,867 Amortization of investment premiums (accretion of discounts), net (667) (9,553) (4,743) Loss on strategic investment 4,500 — — Amortization of debt discount and issuance costs 98,977 80,156 28,019 Gain on extinguishment of convertible senior notes (6,952) — — Repurchase of convertible senior notes attributable to the accreted interest related to debt discount (22,149) — — Non-cash operating lease costs 25,410 1,198 — Stock-based compensation 618,655 545,424 441,930 Disposal of property and equipment 1,045 1,974 — Deferred income taxes (3,590) (6,120) (4,064) Changes in operating assets and liabilities, net of acquisitions:
Accounts receivable, net (153,724) (679,891) (220,940) Prepaid expenses and other assets (45,476) (69,575) 6,970 Deferred commissions (160,001) (149,426) (130,485) Accounts payable (9,082) (5,441) 9,240 Accrued compensation (3,805) 58,898 81,213 Accrued expenses and other liabilities 3,814 (10,392) 30,751 Deferred revenue 134,402 119,766 203,843
Net cash provided by (used in) operating activities (190,862) (287,636) 296,454 Cash flows from investing activities
Purchases of investments (87,135) (1,086,317) (1,109,852) Maturities of investments 995,878 1,080,812 754,138 Acquisitions, net of cash acquired (56,383) (594,870) (394,910) Purchases of property and equipment (37,107) (101,119) (23,160) Capitalized software development costs (14,602) (2,589) — Other investment activities (3,461) (3,898) (5,494)
Net cash provided by (used in) investing activities 797,190 (707,981) (779,278) Cash flows from financing activities
Proceeds from the exercise of stock options 3,473 3,543 1,953 Proceeds from employee stock purchase plan 79,949 60,383 46,342 Proceeds from the issuance of convertible senior notes, net of issuance costs 1,246,544 — 2,105,296 Purchase of capped calls (137,379) — (274,275) Partial repurchase of convertible senior notes (668,929) — — Taxes paid related to net share settlement of equity awards (140,776) (164,160) (63,369) Repayment of financing lease obligation — — (2,522)
Net cash provided by (used in) financing activities 382,882 (100,234) 1,813,425
Splunk Inc.CONSOLIDATED STATEMENTS OF CASH FLOWS
73

Effect of exchange rate changes on cash and cash equivalents 3,201 (1,661) (383) Net increase (decrease) in cash and cash equivalents 992,411 (1,097,512) 1,330,218 Cash and cash equivalents at beginning of period 778,653 1,876,165 545,947 Cash and cash equivalents at end of period $ 1,771,064 $ 778,653 $ 1,876,165
Supplemental disclosures
Cash paid for income taxes $ 9,760 $ 17,413 $ 6,639 Cash paid for interest 29,654 15,761 8,183 Non-cash investing and financing activitiesIncrease in accrued purchases of property and equipment 4,148 1,329 666 Equity consideration for acquisitions 7,254 364,275 — Vesting of early exercised options 203 784 —
The accompanying notes are an integral part of these consolidated financial statements.
Splunk Inc.CONSOLIDATED STATEMENTS OF CASH FLOWS
74
Common Stock
(In thousands, except share amounts) Shares Amount
Additional Paid-in Capital
Accumulated Other
Comprehensive Income (Loss)
Accumulated Deficit
Total Stockholders’
Equity
Balances at January 31, 2018 142,835,123 $ 143 $ 2,086,893 $ 156 $ (955,871) $ 1,131,321 Cumulative-effect adjustment from adoption of ASU 2016-16 — — (7) — (596) (603) Stock-based compensation — — 441,930 — — 441,930 Issuance of common stock upon exercise of options 267,226 — 1,951 — — 1,951 Vesting of restricted and performance stock units 4,583,333 4 — — — 4 Issuance of restricted stock awards 824,605 1 — — — 1 Fair value of replacement equity awards attributable to pre-acquisition service — — 15,776 — — 15,776 Taxes paid related to net share settlement of equity awards — — (62,590) — — (62,590) Issuance of common stock upon ESPP purchase 657,011 1 46,339 — — 46,340 Equity component of convertible senior notes, net — — 498,841 — — 498,841 Purchase of capped calls — — (274,275) — — (274,275) Unrealized gain from investments (net of tax) — — — 1,279 — 1,279 Net change in cumulative translation adjustments — — — (3,941) — (3,941) Net loss — — — — (275,577) (275,577) Balances at January 31, 2019 149,167,298 149 2,754,858 (2,506) (1,232,044) 1,520,457 Cumulative-effect adjustment from adoption of ASU 2016-02 — — — — 7,241 7,241 Stock-based compensation — — 545,424 — — 545,424 Capitalized software development costs — — 951 — — 951 Issuance of common stock upon exercise of options 329,155 — 3,543 — — 3,543 Vesting of restricted and performance stock units 4,003,765 4 — — — 4 Issuance of restricted stock awards 641,382 1 — — — 1 Issuance of common stock from acquisitions 2,948,471 3 344,569 — — 344,572 Fair value of replacement equity awards attributable to pre-acquisition service — — 19,703 — — 19,703 Vesting of early exercised options — — 784 — — 784 Taxes paid related to net share settlement of equity awards — — (164,160) — — (164,160) Issuance of common stock upon ESPP purchase 697,477 — 60,383 — — 60,383 Unrealized gain from investments (net of tax) — — — 1,114 — 1,114 Net change in cumulative translation adjustments — — — (3,920) — (3,920) Net loss — — — — (336,668) (336,668) Balances at January 31, 2020 157,787,548 157 3,566,055 (5,312) (1,561,471) 1,999,429 Stock-based compensation — — 618,655 — — 618,655 Capitalized software development costs — — 8,019 — — 8,019 Issuance of common stock upon exercise of options 352,910 — 3,472 — — 3,472 Vesting of restricted and performance stock units 4,252,183 5 — — — 5 Issuance of restricted stock awards 78,897 — — — — —
Issuance of common stock from acquisitions 31,521 — 4,941 — — 4,941 Fair value of replacement equity awards attributable to pre-acquisition service — — 2,313 — — 2,313
Vesting of early exercised options — — 203 — — 203 Taxes paid related to net share settlement of equity awards — — (140,776) — — (140,776) Issuance of common stock upon ESPP purchase 644,080 1 79,949 — — 79,950
Splunk Inc.CONSOLIDATED STATEMENTS OF STOCKHOLDERS' EQUITY
75

FOR
M 1
0-K
Effect of exchange rate changes on cash and cash equivalents 3,201 (1,661) (383) Net increase (decrease) in cash and cash equivalents 992,411 (1,097,512) 1,330,218 Cash and cash equivalents at beginning of period 778,653 1,876,165 545,947 Cash and cash equivalents at end of period $ 1,771,064 $ 778,653 $ 1,876,165
Supplemental disclosures
Cash paid for income taxes $ 9,760 $ 17,413 $ 6,639 Cash paid for interest 29,654 15,761 8,183 Non-cash investing and financing activitiesIncrease in accrued purchases of property and equipment 4,148 1,329 666 Equity consideration for acquisitions 7,254 364,275 — Vesting of early exercised options 203 784 —
The accompanying notes are an integral part of these consolidated financial statements.
Splunk Inc.CONSOLIDATED STATEMENTS OF CASH FLOWS
74
Common Stock
(In thousands, except share amounts) Shares Amount
Additional Paid-in Capital
Accumulated Other
Comprehensive Income (Loss)
Accumulated Deficit
Total Stockholders’
Equity
Balances at January 31, 2018 142,835,123 $ 143 $ 2,086,893 $ 156 $ (955,871) $ 1,131,321 Cumulative-effect adjustment from adoption of ASU 2016-16 — — (7) — (596) (603) Stock-based compensation — — 441,930 — — 441,930 Issuance of common stock upon exercise of options 267,226 — 1,951 — — 1,951 Vesting of restricted and performance stock units 4,583,333 4 — — — 4 Issuance of restricted stock awards 824,605 1 — — — 1 Fair value of replacement equity awards attributable to pre-acquisition service — — 15,776 — — 15,776 Taxes paid related to net share settlement of equity awards — — (62,590) — — (62,590) Issuance of common stock upon ESPP purchase 657,011 1 46,339 — — 46,340 Equity component of convertible senior notes, net — — 498,841 — — 498,841 Purchase of capped calls — — (274,275) — — (274,275) Unrealized gain from investments (net of tax) — — — 1,279 — 1,279 Net change in cumulative translation adjustments — — — (3,941) — (3,941) Net loss — — — — (275,577) (275,577) Balances at January 31, 2019 149,167,298 149 2,754,858 (2,506) (1,232,044) 1,520,457 Cumulative-effect adjustment from adoption of ASU 2016-02 — — — — 7,241 7,241 Stock-based compensation — — 545,424 — — 545,424 Capitalized software development costs — — 951 — — 951 Issuance of common stock upon exercise of options 329,155 — 3,543 — — 3,543 Vesting of restricted and performance stock units 4,003,765 4 — — — 4 Issuance of restricted stock awards 641,382 1 — — — 1 Issuance of common stock from acquisitions 2,948,471 3 344,569 — — 344,572 Fair value of replacement equity awards attributable to pre-acquisition service — — 19,703 — — 19,703 Vesting of early exercised options — — 784 — — 784 Taxes paid related to net share settlement of equity awards — — (164,160) — — (164,160) Issuance of common stock upon ESPP purchase 697,477 — 60,383 — — 60,383 Unrealized gain from investments (net of tax) — — — 1,114 — 1,114 Net change in cumulative translation adjustments — — — (3,920) — (3,920) Net loss — — — — (336,668) (336,668) Balances at January 31, 2020 157,787,548 157 3,566,055 (5,312) (1,561,471) 1,999,429 Stock-based compensation — — 618,655 — — 618,655 Capitalized software development costs — — 8,019 — — 8,019 Issuance of common stock upon exercise of options 352,910 — 3,472 — — 3,472 Vesting of restricted and performance stock units 4,252,183 5 — — — 5 Issuance of restricted stock awards 78,897 — — — — —
Issuance of common stock from acquisitions 31,521 — 4,941 — — 4,941 Fair value of replacement equity awards attributable to pre-acquisition service — — 2,313 — — 2,313
Vesting of early exercised options — — 203 — — 203 Taxes paid related to net share settlement of equity awards — — (140,776) — — (140,776) Issuance of common stock upon ESPP purchase 644,080 1 79,949 — — 79,950
Splunk Inc.CONSOLIDATED STATEMENTS OF STOCKHOLDERS' EQUITY
75

Equity component of convertible senior notes, net — — 342,062 — — 342,062 Purchase of capped calls — — (137,379) — — (137,379) Partial repurchase of convertible senior notes — — (283,629) — — (283,629) Unrealized loss from investments (net of tax) — — — (1,188) — (1,188) Net change in cumulative translation adjustments — — — 5,908 — 5,908 Net loss — — — — (907,980) (907,980) Balances at January 31, 2021 163,147,139 $ 163 $ 4,063,885 $ (592) $ (2,469,451) $ 1,594,005
The accompanying notes are an integral part of these consolidated financial statements.
Splunk Inc.CONSOLIDATED STATEMENTS OF STOCKHOLDERS' EQUITY
76
(1) Description of the Business and Significant Accounting Policies
Business
Splunk Inc. (“we,” “us,” “our”) provides innovative software and cloud solutions that deliver and operationalize insights from the data generated by digital systems. Data is produced by nearly every software application and electronic device across an organization and contains a real-time record of various activities, such as business transactions, customer and user behavior, and security threats. This data is growing significantly as a direct result of the prevalence and importance of digital systems used by today’s organizations. Our solutions help users remove barriers between insights derived from this data and actions organizations take to thrive in an era of unprecedented digital transformation. We were incorporated in California in October 2003 and reincorporated in Delaware in May 2006.
Fiscal Year
Our fiscal year ends on January 31. References to fiscal 2021, for example, refer to the fiscal year ended January 31, 2021.
Basis of Presentation
We prepared our consolidated financial statements in accordance with U.S. generally accepted accounting principles (“GAAP”). The accompanying consolidated financial statements include the accounts of Splunk Inc. and its direct and indirect wholly-owned subsidiaries. All intercompany balances and transactions have been eliminated upon consolidation.
Reclassifications
Certain reclassifications have been made to prior year balances in order to conform to the current period presentation. “Cloud services” revenues and cost of revenues have been reclassified from “Maintenance and services” revenues and cost of revenues on our consolidated statements of operations and “Non-cash operating lease costs” have been reclassified from “Accrued expenses and other liabilities” on our consolidated statements of cash flows. These reclassifications had no impact on our previously reported total revenues and net cash flows from operating, investing, or financing activities.
Use of Estimates
The preparation of financial statements in conformity with U.S. GAAP requires management to make estimates, judgments and assumptions that affect the reported amounts of assets and liabilities and disclosure of contingent assets and liabilities at the date of the financial statements and reported amounts of revenues and expenses during the reporting periods covered by the financial statements and accompanying notes. In particular, we make estimates with respect to the stand-alone selling price for each distinct performance obligation included in customer contracts with multiple performance obligations, uncollectible accounts receivable, the assessment of the useful life and recoverability of long-lived assets (property and equipment, goodwill and identified intangibles), the period of benefit for deferred commissions, stock-based compensation expense, the fair value of the liability component of the convertible debt, the fair value of assets acquired and liabilities assumed for business combinations, income taxes, the discount rate used for operating leases, and contingencies. Actual results could differ from those estimates.
COVID-19
The worldwide spread of COVID-19 has created significant global economic uncertainty and resulted in a global slowdown of economic activity which has decreased demand for a broad variety of goods and services, while also disrupting sales channels, marketing activities and general business operations for an unknown period, even after the disease is contained. At this point, the extent to which COVID-19 may impact our future financial condition or results of operations is uncertain, and as of the date of issuance of these consolidated financial statements, we are not aware of any specific event or circumstance that would require us to update our estimates, judgments or adjust the carrying value of our assets or liabilities. These estimates may change, as new events occur and additional information is obtained, and will be recognized in the consolidated financial statements as soon as they become known. Actual results could differ from those estimates and any such differences may be material to our consolidated financial statements.
NOTES TO CONSOLIDATED FINANCIAL STATEMENTS
77
FOR
M 1
0-K
Equity component of convertible senior notes, net — — 342,062 — — 342,062 Purchase of capped calls — — (137,379) — — (137,379) Partial repurchase of convertible senior notes — — (283,629) — — (283,629) Unrealized loss from investments (net of tax) — — — (1,188) — (1,188) Net change in cumulative translation adjustments — — — 5,908 — 5,908 Net loss — — — — (907,980) (907,980) Balances at January 31, 2021 163,147,139 $ 163 $ 4,063,885 $ (592) $ (2,469,451) $ 1,594,005
The accompanying notes are an integral part of these consolidated financial statements.
Splunk Inc.CONSOLIDATED STATEMENTS OF STOCKHOLDERS' EQUITY
76
(1) Description of the Business and Significant Accounting Policies
Business
Splunk Inc. (“we,” “us,” “our”) provides innovative software and cloud solutions that deliver and operationalize insights from the data generated by digital systems. Data is produced by nearly every software application and electronic device across an organization and contains a real-time record of various activities, such as business transactions, customer and user behavior, and security threats. This data is growing significantly as a direct result of the prevalence and importance of digital systems used by today’s organizations. Our solutions help users remove barriers between insights derived from this data and actions organizations take to thrive in an era of unprecedented digital transformation. We were incorporated in California in October 2003 and reincorporated in Delaware in May 2006.
Fiscal Year
Our fiscal year ends on January 31. References to fiscal 2021, for example, refer to the fiscal year ended January 31, 2021.
Basis of Presentation
We prepared our consolidated financial statements in accordance with U.S. generally accepted accounting principles (“GAAP”). The accompanying consolidated financial statements include the accounts of Splunk Inc. and its direct and indirect wholly-owned subsidiaries. All intercompany balances and transactions have been eliminated upon consolidation.
Reclassifications
Certain reclassifications have been made to prior year balances in order to conform to the current period presentation. “Cloud services” revenues and cost of revenues have been reclassified from “Maintenance and services” revenues and cost of revenues on our consolidated statements of operations and “Non-cash operating lease costs” have been reclassified from “Accrued expenses and other liabilities” on our consolidated statements of cash flows. These reclassifications had no impact on our previously reported total revenues and net cash flows from operating, investing, or financing activities.
Use of Estimates
The preparation of financial statements in conformity with U.S. GAAP requires management to make estimates, judgments and assumptions that affect the reported amounts of assets and liabilities and disclosure of contingent assets and liabilities at the date of the financial statements and reported amounts of revenues and expenses during the reporting periods covered by the financial statements and accompanying notes. In particular, we make estimates with respect to the stand-alone selling price for each distinct performance obligation included in customer contracts with multiple performance obligations, uncollectible accounts receivable, the assessment of the useful life and recoverability of long-lived assets (property and equipment, goodwill and identified intangibles), the period of benefit for deferred commissions, stock-based compensation expense, the fair value of the liability component of the convertible debt, the fair value of assets acquired and liabilities assumed for business combinations, income taxes, the discount rate used for operating leases, and contingencies. Actual results could differ from those estimates.
COVID-19
The worldwide spread of COVID-19 has created significant global economic uncertainty and resulted in a global slowdown of economic activity which has decreased demand for a broad variety of goods and services, while also disrupting sales channels, marketing activities and general business operations for an unknown period, even after the disease is contained. At this point, the extent to which COVID-19 may impact our future financial condition or results of operations is uncertain, and as of the date of issuance of these consolidated financial statements, we are not aware of any specific event or circumstance that would require us to update our estimates, judgments or adjust the carrying value of our assets or liabilities. These estimates may change, as new events occur and additional information is obtained, and will be recognized in the consolidated financial statements as soon as they become known. Actual results could differ from those estimates and any such differences may be material to our consolidated financial statements.
NOTES TO CONSOLIDATED FINANCIAL STATEMENTS
77

Segments
We operate our business as one operating segment: the development and marketing of software solutions that enable our customers to gain real-time business insights by harnessing the value of their data. Our chief operating decision maker is our Chief Executive Officer, who reviews financial information presented on a consolidated basis for purposes of making operating decisions, assessing financial performance and allocating resources.
Foreign Currency
The functional currency of our foreign subsidiaries is their respective local currency, with the exception of our United Kingdom and Singapore subsidiaries, for which the functional currency is the U.S. dollar. Translation adjustments arising from the use of differing exchange rates from period to period are included in “Accumulated other comprehensive income (loss)” within the consolidated statements of stockholders’ equity. Foreign currency transaction gains and losses are included in “Other income (expense), net” and were not material for each of the three years ended January 31, 2021. All assets and liabilities denominated in a foreign currency are translated into U.S. dollars at the exchange rate on the balance sheet date. Expenses are translated at the average exchange rate during the period. Equity transactions are translated using historical exchange rates.
Foreign Currency Contracts
We use foreign currency forward contracts as a part of our strategy to manage exposure related to foreign currency denominated monetary assets and liabilities. These contracts typically have maturities of one month. They are not designated as cash flow or fair value hedges under ASC Topic 815, Derivatives and Hedging. These contracts hedge assets and liabilities that are denominated in foreign currencies and are carried at fair value as either assets or liabilities on our consolidated balance sheets with changes in the fair value included in “Other income (expense), net” on our consolidated statements of operations.
Business Combinations
We use our best estimates and assumptions to allocate the fair value of purchase consideration to the tangible and intangible assets acquired and liabilities assumed based on their estimated fair values. The excess of the fair value of purchase consideration over the fair values of these identifiable assets and liabilities is recorded as goodwill. We apply significant judgment in determining the fair value of the intangible assets acquired, which involves the use of significant estimates and assumptions with respect to revenue growth rates, royalty rate and technology migration curve. While we use our best estimates and judgments, our estimates are inherently uncertain and subject to refinement. During the measurement period, which may be up to one year from the acquisition date, we may record adjustments to the fair value of these tangible and intangible assets acquired and liabilities assumed, with the corresponding offset to goodwill. In addition, uncertain tax positions and tax-related valuation allowances are initially established in connection with a business combination as of the acquisition date. We continue to collect information and reevaluate these estimates and assumptions quarterly and record any adjustments to our preliminary estimates to goodwill provided that we are within the measurement period. Upon the conclusion of the final determination of the fair value of assets acquired or liabilities assumed during the measurement period, any subsequent adjustments are included in our consolidated statements of operations.
Revenue Recognition
We generate revenues in the form of software license and related maintenance fees, cloud services and other service fees. Licenses for on-premises software (“software”) are either term or perpetual licenses and provide the customer with a right to use the software. When a term license is purchased, maintenance is bundled with the license for the term of the license period. Typically, when purchasing a perpetual license, a customer also purchases one year of maintenance for which we charge a percentage of the license fee. Cloud services are provided on a subscription basis and give our customers access to our cloud solutions, which include related customer support. Other services include training and professional services that are not integral to the functionality of the licenses or cloud services.
Our contracts with customers often contain multiple performance obligations, which may include a combination of software, related maintenance and support services, cloud services and professional services including training. We apply significant judgment in identifying and accounting for each performance obligation, as a result of evaluating the terms and conditions in contracts. For these contracts, we account for software, maintenance and support, cloud services and other
NOTES TO CONSOLIDATED FINANCIAL STATEMENTS
78
services as separate performance obligations as they are each distinct. Revenue is recognized when the performance obligations are satisfied. We satisfy our obligation and recognize revenue for software upon transfer of control of the software, which occurs at delivery of the license key to customers, or when the license term commences, if later. We satisfy our cloud service performance obligation over the associated contract term and recognize the associated revenue ratably over the term of the contract once access is provided to the customer, consistent with the pattern of benefit to the customer of such services. We satisfy our maintenance and support performance obligations and recognize revenue ratably over the maintenance and support term, consistent with the pattern of benefit to the customer of such services. Professional services and training are either provided on a time and material basis or over a contract term. We satisfy our professional services and training performance obligations and recognize the associated revenue as services are delivered. With respect to contracts that include customer acceptance provisions, we recognize revenue upon customer acceptance. Our policy is to record revenues net of any applicable sales, use or excise taxes.
Customers can purchase our products under different pricing options. Regardless of the pricing option selected, the consideration for our license and cloud contracts is fixed and does not result in variable consideration. The transaction price is allocated to the separate performance obligations on a relative standalone selling price (“SSP”) basis. We determine the SSP based on an observable standalone selling price when it is available, as well as other factors, including the price charged to customers, our discounting practices, and our overall pricing objectives, while maximizing observable inputs. In situations where pricing is highly variable, we estimate the SSP using the residual approach.
A receivable is recorded when we have an unconditional right to payment, either because we satisfied a performance obligation prior to receiving payment from the customer or we have a non-cancelable contract that has been invoiced in advance in accordance with our standard payment terms. Most of our multi-year software and cloud services contracts are invoiced annually. A receivable for multi-year cloud services is generally recorded upon invoicing. A receivable for multi-year software contracts is recorded upon delivery, whether or not invoiced, to the extent we have an unconditional right to receive payment in the future related to those licenses. The non-current portion of these receivables, primarily consisting of unbilled receivables from multi-year software contracts, is included in “Accounts receivable, non-current” on our consolidated balance sheets.
Payment terms and conditions vary by contract type, although our standard payment terms generally require payment within 30 to 60 days. In instances where the timing of revenue recognition differs from the timing of payment, we have determined our contracts do not generally include a significant financing component. The primary purpose of our invoicing terms is to provide customers with simplified and predictable ways of purchasing our products and services, not to receive financing from our customers or to provide customers with financing.
Deferred revenue is recorded when we invoice a contract or deliver a license prior to recognizing revenue. It is comprised of balances related to maintenance, cloud services, training and professional services invoiced at the beginning of each service period, as well as licenses that we delivered prior to the license term commencing.
Deferred Sales Commissions
Sales commissions paid to our sales force and the related payroll taxes are considered incremental and recoverable costs of obtaining a contract with a customer. These costs are capitalized and included in “Deferred commissions, current and non-current” on our consolidated balance sheets. We generally amortize these costs over the remaining contractual term of our customer contracts, consistent with the pattern of revenue recognition of each performance obligation, for contracts in which the commissions paid on the initial and renewal contracts are commensurate. For certain contracts in which the commissions paid on the initial and renewal contracts are not commensurate, we amortize the commissions paid on the initial contract over an expected period of benefit, which we have determined to be approximately five years. We have determined the period of benefit by taking into consideration our customer contracts, the duration of our relationships with our customers and our technology. In capitalizing and amortizing deferred commissions, we have elected to apply a portfolio approach. We include amortization of deferred commissions in “Sales and marketing” expense on our consolidated statements of operations. There were no impairments to deferred commissions for all periods presented. Commission expense was $223.6 million, $208.9 million and $174.0 million for fiscal 2021, 2020 and 2019, respectively.
Cash and Cash Equivalents
We consider all highly liquid instruments with original maturities of 90 days or less at the date of purchase to be cash equivalents. Cash and cash equivalents are recorded at cost, which approximates fair value. We do not hold or issue financial instruments for trading purposes.
NOTES TO CONSOLIDATED FINANCIAL STATEMENTS
79

FOR
M 1
0-K
Segments
We operate our business as one operating segment: the development and marketing of software solutions that enable our customers to gain real-time business insights by harnessing the value of their data. Our chief operating decision maker is our Chief Executive Officer, who reviews financial information presented on a consolidated basis for purposes of making operating decisions, assessing financial performance and allocating resources.
Foreign Currency
The functional currency of our foreign subsidiaries is their respective local currency, with the exception of our United Kingdom and Singapore subsidiaries, for which the functional currency is the U.S. dollar. Translation adjustments arising from the use of differing exchange rates from period to period are included in “Accumulated other comprehensive income (loss)” within the consolidated statements of stockholders’ equity. Foreign currency transaction gains and losses are included in “Other income (expense), net” and were not material for each of the three years ended January 31, 2021. All assets and liabilities denominated in a foreign currency are translated into U.S. dollars at the exchange rate on the balance sheet date. Expenses are translated at the average exchange rate during the period. Equity transactions are translated using historical exchange rates.
Foreign Currency Contracts
We use foreign currency forward contracts as a part of our strategy to manage exposure related to foreign currency denominated monetary assets and liabilities. These contracts typically have maturities of one month. They are not designated as cash flow or fair value hedges under ASC Topic 815, Derivatives and Hedging. These contracts hedge assets and liabilities that are denominated in foreign currencies and are carried at fair value as either assets or liabilities on our consolidated balance sheets with changes in the fair value included in “Other income (expense), net” on our consolidated statements of operations.
Business Combinations
We use our best estimates and assumptions to allocate the fair value of purchase consideration to the tangible and intangible assets acquired and liabilities assumed based on their estimated fair values. The excess of the fair value of purchase consideration over the fair values of these identifiable assets and liabilities is recorded as goodwill. We apply significant judgment in determining the fair value of the intangible assets acquired, which involves the use of significant estimates and assumptions with respect to revenue growth rates, royalty rate and technology migration curve. While we use our best estimates and judgments, our estimates are inherently uncertain and subject to refinement. During the measurement period, which may be up to one year from the acquisition date, we may record adjustments to the fair value of these tangible and intangible assets acquired and liabilities assumed, with the corresponding offset to goodwill. In addition, uncertain tax positions and tax-related valuation allowances are initially established in connection with a business combination as of the acquisition date. We continue to collect information and reevaluate these estimates and assumptions quarterly and record any adjustments to our preliminary estimates to goodwill provided that we are within the measurement period. Upon the conclusion of the final determination of the fair value of assets acquired or liabilities assumed during the measurement period, any subsequent adjustments are included in our consolidated statements of operations.
Revenue Recognition
We generate revenues in the form of software license and related maintenance fees, cloud services and other service fees. Licenses for on-premises software (“software”) are either term or perpetual licenses and provide the customer with a right to use the software. When a term license is purchased, maintenance is bundled with the license for the term of the license period. Typically, when purchasing a perpetual license, a customer also purchases one year of maintenance for which we charge a percentage of the license fee. Cloud services are provided on a subscription basis and give our customers access to our cloud solutions, which include related customer support. Other services include training and professional services that are not integral to the functionality of the licenses or cloud services.
Our contracts with customers often contain multiple performance obligations, which may include a combination of software, related maintenance and support services, cloud services and professional services including training. We apply significant judgment in identifying and accounting for each performance obligation, as a result of evaluating the terms and conditions in contracts. For these contracts, we account for software, maintenance and support, cloud services and other
NOTES TO CONSOLIDATED FINANCIAL STATEMENTS
78
services as separate performance obligations as they are each distinct. Revenue is recognized when the performance obligations are satisfied. We satisfy our obligation and recognize revenue for software upon transfer of control of the software, which occurs at delivery of the license key to customers, or when the license term commences, if later. We satisfy our cloud service performance obligation over the associated contract term and recognize the associated revenue ratably over the term of the contract once access is provided to the customer, consistent with the pattern of benefit to the customer of such services. We satisfy our maintenance and support performance obligations and recognize revenue ratably over the maintenance and support term, consistent with the pattern of benefit to the customer of such services. Professional services and training are either provided on a time and material basis or over a contract term. We satisfy our professional services and training performance obligations and recognize the associated revenue as services are delivered. With respect to contracts that include customer acceptance provisions, we recognize revenue upon customer acceptance. Our policy is to record revenues net of any applicable sales, use or excise taxes.
Customers can purchase our products under different pricing options. Regardless of the pricing option selected, the consideration for our license and cloud contracts is fixed and does not result in variable consideration. The transaction price is allocated to the separate performance obligations on a relative standalone selling price (“SSP”) basis. We determine the SSP based on an observable standalone selling price when it is available, as well as other factors, including the price charged to customers, our discounting practices, and our overall pricing objectives, while maximizing observable inputs. In situations where pricing is highly variable, we estimate the SSP using the residual approach.
A receivable is recorded when we have an unconditional right to payment, either because we satisfied a performance obligation prior to receiving payment from the customer or we have a non-cancelable contract that has been invoiced in advance in accordance with our standard payment terms. Most of our multi-year software and cloud services contracts are invoiced annually. A receivable for multi-year cloud services is generally recorded upon invoicing. A receivable for multi-year software contracts is recorded upon delivery, whether or not invoiced, to the extent we have an unconditional right to receive payment in the future related to those licenses. The non-current portion of these receivables, primarily consisting of unbilled receivables from multi-year software contracts, is included in “Accounts receivable, non-current” on our consolidated balance sheets.
Payment terms and conditions vary by contract type, although our standard payment terms generally require payment within 30 to 60 days. In instances where the timing of revenue recognition differs from the timing of payment, we have determined our contracts do not generally include a significant financing component. The primary purpose of our invoicing terms is to provide customers with simplified and predictable ways of purchasing our products and services, not to receive financing from our customers or to provide customers with financing.
Deferred revenue is recorded when we invoice a contract or deliver a license prior to recognizing revenue. It is comprised of balances related to maintenance, cloud services, training and professional services invoiced at the beginning of each service period, as well as licenses that we delivered prior to the license term commencing.
Deferred Sales Commissions
Sales commissions paid to our sales force and the related payroll taxes are considered incremental and recoverable costs of obtaining a contract with a customer. These costs are capitalized and included in “Deferred commissions, current and non-current” on our consolidated balance sheets. We generally amortize these costs over the remaining contractual term of our customer contracts, consistent with the pattern of revenue recognition of each performance obligation, for contracts in which the commissions paid on the initial and renewal contracts are commensurate. For certain contracts in which the commissions paid on the initial and renewal contracts are not commensurate, we amortize the commissions paid on the initial contract over an expected period of benefit, which we have determined to be approximately five years. We have determined the period of benefit by taking into consideration our customer contracts, the duration of our relationships with our customers and our technology. In capitalizing and amortizing deferred commissions, we have elected to apply a portfolio approach. We include amortization of deferred commissions in “Sales and marketing” expense on our consolidated statements of operations. There were no impairments to deferred commissions for all periods presented. Commission expense was $223.6 million, $208.9 million and $174.0 million for fiscal 2021, 2020 and 2019, respectively.
Cash and Cash Equivalents
We consider all highly liquid instruments with original maturities of 90 days or less at the date of purchase to be cash equivalents. Cash and cash equivalents are recorded at cost, which approximates fair value. We do not hold or issue financial instruments for trading purposes.
NOTES TO CONSOLIDATED FINANCIAL STATEMENTS
79

Investments
For our investments in marketable debt securities, we determine the appropriate classification at the time of purchase and reevaluate such determination at each balance sheet date. All securities are classified as available-for-sale and are carried at fair value. When the fair value of a security is below its amortized cost, the carrying value of the security will be reduced to its fair value if it is more likely than not that management is required to sell the impaired security before recovery of its amortized basis, or management has the intention to sell the security. If neither of these conditions are met, we determine whether the impairment is due to credit losses by comparing the present value of the expected cash flows of the security with its amortized cost basis. The amount of impairment recognized is limited to the excess of the amortized cost over the fair value of the security. An allowance for credit losses for the excess of amortized cost over the expected cash flows is recorded in “Other income (expense), net” on our consolidated statements of operations. Non-credit related impairment losses are reported as a separate component on our consolidated statements of comprehensive income (loss). The cost of securities sold is based on the specific-identification method. Interest on securities classified as available-for-sale is included in “Interest income” on our consolidated statements of operations.
Investments in entities where we have the ability to exercise significant influence, but not control, over the investee are accounted for using the equity method of accounting. Our results of operations will include, as a component of “Other income (expense), net,” our share of the net income or loss of the equity investments accounted for under the equity method of accounting. Those equity investments over which we do not have the ability to exercise significant influence and that do not have readily determinable fair values are accounted for at cost, less impairment and adjusted for subsequent observable price changes obtained from transactions for identical or similar investments issued by the same issuer. Changes in the basis of these investments will be recognized in “Other income (expense), net.”
Concentration of Risk
Financial instruments that potentially subject us to significant concentrations of credit risk consist principally of cash and cash equivalents, investments and accounts receivable. We maintain the majority of our cash balance with two financial institutions that management believes are high-credit, quality financial institutions and invest our cash equivalents in highly rated money market funds.
Our accounts receivable is subject to collection risk. Our gross accounts receivable is reduced for this risk by an allowance for doubtful accounts. This allowance is for estimated losses resulting from the inability of our customers to make required payments. It is an estimate and is regularly evaluated for adequacy by taking into consideration a combination of factors. We look at factors such as past collection experience, credit quality of the customer, age of the receivable balance, and current economic conditions. These factors are reviewed to determine whether an allowance for bad debts should be recorded to reduce the receivable balance to the amount believed to be collectible.
The following table presents the changes in the allowance for doubtful accounts:
Fiscal Year Ended January 31, (In thousands) 2021 2020 2019
Balance at beginning of period $ 1,003 $ 445 $ 467 Add: bad debt expense 3,533 1,062 — Less: write-offs, net of recoveries (106) (504) (22) Balance at end of period $ 4,430 $ 1,003 $ 445
Goodwill, Intangible Assets, Long-Lived Assets and Impairment Assessments
Goodwill and indefinite-lived intangible assets are carried at cost and are evaluated annually for impairment, or more frequently if circumstances exist that indicate that impairment may exist. When conducting our annual goodwill impairment assessment, we perform a quantitative evaluation of whether goodwill is impaired by comparing the fair value of our reporting unit to its carrying value. We consider the enterprise to be the reporting unit for this analysis. If the carrying amount of our reporting unit exceeds its fair value, we recognize an impairment loss in an amount equal to that excess, limited to the total amount of goodwill allocated to that reporting unit.
NOTES TO CONSOLIDATED FINANCIAL STATEMENTS
80
In-process research and development is initially capitalized at fair value as an intangible asset with an indefinite life and assessed for impairment thereafter. When in-process research and development projects are completed, the corresponding amount is reclassified as an amortizable intangible asset and is amortized over the asset’s estimated useful life.
Finite-lived intangible assets are amortized over their useful lives. Each period we evaluate the estimated remaining useful life of our finite-lived intangible assets and whether events or changes in circumstances warrant a revision to the remaining period of amortization. In addition, we evaluate the recoverability of our long-lived assets including intangible and tangible assets for impairment whenever events or changes in circumstances indicate that the carrying value of these assets may not be recoverable. Recoverability of these assets is measured by comparison of the carrying amount of each asset to the future undiscounted cash flows the asset is expected to generate. If the undiscounted cash flows used in the test for recoverability are less than the carrying amount of these assets, then the carrying amount of such assets is reduced to fair value.
Property and Equipment
Property and equipment are stated at cost net of accumulated depreciation and amortization. Depreciation is calculated using the straight-line method over the estimated useful lives of the assets ranging from generally three to five years. Leasehold improvements are amortized over the shorter of the estimated useful life or the remaining lease term. When assets are retired or disposed of, the cost and accumulated depreciation are removed from the accounts, and any resulting gains or losses are included on our consolidated statements of operations. Maintenance and repairs that do not improve or extend the lives of the respective assets are charged to expense in the period incurred.
The following table presents the estimated useful lives of our property and equipment:
Property and Equipment Useful Life
Computer equipment and software 3 yearsFurniture and fixtures 5 yearsLeasehold improvements Shorter of the useful life of the asset or the lease term
Capitalized Software Development and Implementation Costs
Capitalization of software development costs for software to be sold, leased, or otherwise marketed begins upon the establishment of technological feasibility, which is generally the completion of a working prototype that has been certified as having no critical bugs and is a release candidate. Amortization begins once the software is ready for its intended use, generally based on the pattern in which the economic benefits will be consumed. We did not capitalize any software development costs for fiscal 2021 and 2020 because the cost incurred and the time between technological feasibility and product release was insignificant. We had no amortization expense from capitalized purchased technology during fiscal 2021, 2020 or 2019.
We capitalize certain costs incurred in connection with the development of software (“development costs”) and the implementation of software and cloud computing services acquired for internal use (“implementation costs”). Costs incurred during the preliminary planning and evaluation stage of each project and during the post implementation operational stage are expensed as incurred. Costs incurred during the application development stage of each project are capitalized. We define the configuration and coding process as the application development stage. Capitalized development costs are included in “Property and equipment, net” on our consolidated balance sheets. The current portion of capitalized implementation costs are included in “Prepaid expenses and other current assets” and the non-current portion are included in “Other assets” on our consolidated balance sheets. We capitalized $20.3 million and $3.5 million of development costs in fiscal 2021 and 2020, respectively. We capitalized $22.1 million of implementation costs in fiscal 2021 and we did not capitalize any implementation costs in fiscal 2020. Development costs capitalized are amortized on a straight-line basis over their estimated useful life of 3 years and implementation costs capitalized are amortized on a straight-line basis over the term of the related software or cloud computing service arrangement. We recognized $1.5 million in amortization expense related to capitalized implementation and development costs during fiscal 2021 and no amortization expense was recognized during fiscal 2020 and 2019.
Leases
We determine if an arrangement contains a lease and the classification of that lease, if applicable, at the inception of a contract. We primarily lease our facilities under operating leases. Operating lease right-of-use assets and liabilities are recognized at the present value of the future lease payments at the lease commencement date. We calculate the operating lease
NOTES TO CONSOLIDATED FINANCIAL STATEMENTS
81

FOR
M 1
0-K
Investments
For our investments in marketable debt securities, we determine the appropriate classification at the time of purchase and reevaluate such determination at each balance sheet date. All securities are classified as available-for-sale and are carried at fair value. When the fair value of a security is below its amortized cost, the carrying value of the security will be reduced to its fair value if it is more likely than not that management is required to sell the impaired security before recovery of its amortized basis, or management has the intention to sell the security. If neither of these conditions are met, we determine whether the impairment is due to credit losses by comparing the present value of the expected cash flows of the security with its amortized cost basis. The amount of impairment recognized is limited to the excess of the amortized cost over the fair value of the security. An allowance for credit losses for the excess of amortized cost over the expected cash flows is recorded in “Other income (expense), net” on our consolidated statements of operations. Non-credit related impairment losses are reported as a separate component on our consolidated statements of comprehensive income (loss). The cost of securities sold is based on the specific-identification method. Interest on securities classified as available-for-sale is included in “Interest income” on our consolidated statements of operations.
Investments in entities where we have the ability to exercise significant influence, but not control, over the investee are accounted for using the equity method of accounting. Our results of operations will include, as a component of “Other income (expense), net,” our share of the net income or loss of the equity investments accounted for under the equity method of accounting. Those equity investments over which we do not have the ability to exercise significant influence and that do not have readily determinable fair values are accounted for at cost, less impairment and adjusted for subsequent observable price changes obtained from transactions for identical or similar investments issued by the same issuer. Changes in the basis of these investments will be recognized in “Other income (expense), net.”
Concentration of Risk
Financial instruments that potentially subject us to significant concentrations of credit risk consist principally of cash and cash equivalents, investments and accounts receivable. We maintain the majority of our cash balance with two financial institutions that management believes are high-credit, quality financial institutions and invest our cash equivalents in highly rated money market funds.
Our accounts receivable is subject to collection risk. Our gross accounts receivable is reduced for this risk by an allowance for doubtful accounts. This allowance is for estimated losses resulting from the inability of our customers to make required payments. It is an estimate and is regularly evaluated for adequacy by taking into consideration a combination of factors. We look at factors such as past collection experience, credit quality of the customer, age of the receivable balance, and current economic conditions. These factors are reviewed to determine whether an allowance for bad debts should be recorded to reduce the receivable balance to the amount believed to be collectible.
The following table presents the changes in the allowance for doubtful accounts:
Fiscal Year Ended January 31, (In thousands) 2021 2020 2019
Balance at beginning of period $ 1,003 $ 445 $ 467 Add: bad debt expense 3,533 1,062 — Less: write-offs, net of recoveries (106) (504) (22) Balance at end of period $ 4,430 $ 1,003 $ 445
Goodwill, Intangible Assets, Long-Lived Assets and Impairment Assessments
Goodwill and indefinite-lived intangible assets are carried at cost and are evaluated annually for impairment, or more frequently if circumstances exist that indicate that impairment may exist. When conducting our annual goodwill impairment assessment, we perform a quantitative evaluation of whether goodwill is impaired by comparing the fair value of our reporting unit to its carrying value. We consider the enterprise to be the reporting unit for this analysis. If the carrying amount of our reporting unit exceeds its fair value, we recognize an impairment loss in an amount equal to that excess, limited to the total amount of goodwill allocated to that reporting unit.
NOTES TO CONSOLIDATED FINANCIAL STATEMENTS
80
In-process research and development is initially capitalized at fair value as an intangible asset with an indefinite life and assessed for impairment thereafter. When in-process research and development projects are completed, the corresponding amount is reclassified as an amortizable intangible asset and is amortized over the asset’s estimated useful life.
Finite-lived intangible assets are amortized over their useful lives. Each period we evaluate the estimated remaining useful life of our finite-lived intangible assets and whether events or changes in circumstances warrant a revision to the remaining period of amortization. In addition, we evaluate the recoverability of our long-lived assets including intangible and tangible assets for impairment whenever events or changes in circumstances indicate that the carrying value of these assets may not be recoverable. Recoverability of these assets is measured by comparison of the carrying amount of each asset to the future undiscounted cash flows the asset is expected to generate. If the undiscounted cash flows used in the test for recoverability are less than the carrying amount of these assets, then the carrying amount of such assets is reduced to fair value.
Property and Equipment
Property and equipment are stated at cost net of accumulated depreciation and amortization. Depreciation is calculated using the straight-line method over the estimated useful lives of the assets ranging from generally three to five years. Leasehold improvements are amortized over the shorter of the estimated useful life or the remaining lease term. When assets are retired or disposed of, the cost and accumulated depreciation are removed from the accounts, and any resulting gains or losses are included on our consolidated statements of operations. Maintenance and repairs that do not improve or extend the lives of the respective assets are charged to expense in the period incurred.
The following table presents the estimated useful lives of our property and equipment:
Property and Equipment Useful Life
Computer equipment and software 3 yearsFurniture and fixtures 5 yearsLeasehold improvements Shorter of the useful life of the asset or the lease term
Capitalized Software Development and Implementation Costs
Capitalization of software development costs for software to be sold, leased, or otherwise marketed begins upon the establishment of technological feasibility, which is generally the completion of a working prototype that has been certified as having no critical bugs and is a release candidate. Amortization begins once the software is ready for its intended use, generally based on the pattern in which the economic benefits will be consumed. We did not capitalize any software development costs for fiscal 2021 and 2020 because the cost incurred and the time between technological feasibility and product release was insignificant. We had no amortization expense from capitalized purchased technology during fiscal 2021, 2020 or 2019.
We capitalize certain costs incurred in connection with the development of software (“development costs”) and the implementation of software and cloud computing services acquired for internal use (“implementation costs”). Costs incurred during the preliminary planning and evaluation stage of each project and during the post implementation operational stage are expensed as incurred. Costs incurred during the application development stage of each project are capitalized. We define the configuration and coding process as the application development stage. Capitalized development costs are included in “Property and equipment, net” on our consolidated balance sheets. The current portion of capitalized implementation costs are included in “Prepaid expenses and other current assets” and the non-current portion are included in “Other assets” on our consolidated balance sheets. We capitalized $20.3 million and $3.5 million of development costs in fiscal 2021 and 2020, respectively. We capitalized $22.1 million of implementation costs in fiscal 2021 and we did not capitalize any implementation costs in fiscal 2020. Development costs capitalized are amortized on a straight-line basis over their estimated useful life of 3 years and implementation costs capitalized are amortized on a straight-line basis over the term of the related software or cloud computing service arrangement. We recognized $1.5 million in amortization expense related to capitalized implementation and development costs during fiscal 2021 and no amortization expense was recognized during fiscal 2020 and 2019.
Leases
We determine if an arrangement contains a lease and the classification of that lease, if applicable, at the inception of a contract. We primarily lease our facilities under operating leases. Operating lease right-of-use assets and liabilities are recognized at the present value of the future lease payments at the lease commencement date. We calculate the operating lease
NOTES TO CONSOLIDATED FINANCIAL STATEMENTS
81

right-of-use assets based on the corresponding lease liability adjusted for (i) payments made at or before the commencement date, (ii) initial direct costs we incur and (iii) tenant incentives under the lease. We do not account for renewals or early terminations unless we are reasonably certain to exercise these options at commencement. Operating lease right-of-use assets are subject to evaluation for impairment or disposal on a basis consistent with other long-lived assets. Operating lease expense is recognized on a straight-line basis over the lease term. We account for lease and non-lease components as a single lease component for our operating leases. We do not include leases with terms of 12 months or less on our consolidated balance sheets.
As the implicit rate for our operating leases is generally not determinable, we use our incremental borrowing rate as our discount rate at the lease commencement date to determine the present value of lease payments. We determine the discount rate of our leases by considering various factors, such as our credit rating, interest rates of similar debt instruments of entities with comparable credit ratings, the lease term and the currency in which the lease is denominated. Our discount rate was determined using a portfolio approach.
Our operating lease assets are included in “Operating lease right-of-use assets” and the current and non-current portions of our operating lease liabilities are included in “Accrued expenses and other liabilities” and “Operating lease liabilities,” respectively, on our consolidated balance sheets. As of January 31, 2021, we had no finance leases. Refer to Note 4 “Leases” for details.
We adopted ASU No. 2016-02 (Topic 842), Leases as of February 1, 2019, using the cumulative-effect transition method recognized as of the date of initial application, as amended by ASU No. 2018-11.
Advertising Expense
We expense advertising costs as incurred. We incurred $36.8 million, $30.1 million and $17.3 million in advertising expenses for fiscal 2021, 2020 and 2019, respectively. Advertising costs are included in “Sales and marketing” expenses on our consolidated statements of operations.
Stock-Based Compensation
We recognize compensation expense for all share-based payment awards, including stock options, restricted stock units (“RSUs”), performance units (“PSUs”) and restricted stock awards (“RSAs”), based on the estimated fair value of the award on the grant date over the related vesting periods. The expense recorded is based on awards ultimately expected to vest and therefore is reduced by estimated forfeitures. Forfeitures are estimated at the time of grant and revised, if necessary, in subsequent periods if actual forfeitures differ from those estimates. We calculate the fair value of options using the Black-Scholes method and expense using the straight-line attribution approach.
The fair value of each option grant and stock purchase right granted under the Employee Stock Purchase Plan (“ESPP”) is estimated on the date of grant using the Black-Scholes option pricing model. We recognize stock-based compensation related to our ESPP on a straight-line basis over the offering period, which is twelve months. Stock-based compensation expense is recognized net of estimated forfeiture activity.
The determination of the grant date fair value of options using an option-pricing model is affected by assumptions regarding a number of other complex and subjective variables, which include our expected stock price volatility over the expected term of the options, stock option exercise and cancellation behaviors, risk-free interest rates and expected dividends. The expected term of the options is based on the average period the stock options are expected to remain outstanding calculated as the midpoint of the vesting terms and contractual expiration periods, as we do not have sufficient historical information to develop reasonable expectations about future exercise patterns and post-vesting employment termination behavior. The expected stock price volatility for our stock is determined by examining the historical volatility of our common stock. The risk-free interest rate is calculated using the average of the published interest rates United States Treasury zero-coupon issues with maturities that approximate the expected term. The dividend yield assumption is zero as we do not have any history of, nor plans to make, dividend payments.
The number of PSUs earned and eligible to vest is determined based on achievement of certain performance conditions and/or market conditions and the recipients’ continued service with us. For awards subject to service and performance conditions, the number of shares of our stock issued pursuant to the award can range from 0% to 200% of the target amount. For awards subject to service and performance conditions that also include market conditions, the number of shares of our stock
NOTES TO CONSOLIDATED FINANCIAL STATEMENTS
82
issued pursuant to the award can range from 0% to 300% of the target amount. Compensation expense for PSUs with performance conditions is measured using the fair value at the date of grant and recorded over the vesting period under the graded-vesting attribution method, and may be adjusted over the vesting period based on interim estimates of performance against pre-set objectives. We use a Monte Carlo option-pricing model to determine the fair value of PSUs with market conditions.
Income Taxes
Income taxes are accounted for under the asset and liability method in accordance with authoritative guidance for income taxes. Deferred tax assets and liabilities are recognized for the future tax consequences attributable to differences between the financial statement carrying amounts of existing assets and liabilities and their respective tax basis and operating loss and tax credit carryforwards. Deferred tax assets and liabilities are measured using enacted tax rates expected to apply to taxable income in the years in which those temporary differences are expected to be recovered or settled. The effect on deferred tax assets and liabilities of a change in tax rates is recognized in income in the period that includes the enactment date.
The guidance on accounting for uncertainty in income taxes requires us to identify, evaluate and measure all uncertain tax positions taken or to be taken on tax returns and to record liabilities for the amount of these positions that may not be sustained, or may only partially be sustained, upon examination by the relevant taxing authorities. Although we believe that our estimates and judgments were reasonable, actual results may differ from these estimates. All of these judgments are subject to review by the taxing authorities.
NOTES TO CONSOLIDATED FINANCIAL STATEMENTS
83

FOR
M 1
0-K
right-of-use assets based on the corresponding lease liability adjusted for (i) payments made at or before the commencement date, (ii) initial direct costs we incur and (iii) tenant incentives under the lease. We do not account for renewals or early terminations unless we are reasonably certain to exercise these options at commencement. Operating lease right-of-use assets are subject to evaluation for impairment or disposal on a basis consistent with other long-lived assets. Operating lease expense is recognized on a straight-line basis over the lease term. We account for lease and non-lease components as a single lease component for our operating leases. We do not include leases with terms of 12 months or less on our consolidated balance sheets.
As the implicit rate for our operating leases is generally not determinable, we use our incremental borrowing rate as our discount rate at the lease commencement date to determine the present value of lease payments. We determine the discount rate of our leases by considering various factors, such as our credit rating, interest rates of similar debt instruments of entities with comparable credit ratings, the lease term and the currency in which the lease is denominated. Our discount rate was determined using a portfolio approach.
Our operating lease assets are included in “Operating lease right-of-use assets” and the current and non-current portions of our operating lease liabilities are included in “Accrued expenses and other liabilities” and “Operating lease liabilities,” respectively, on our consolidated balance sheets. As of January 31, 2021, we had no finance leases. Refer to Note 4 “Leases” for details.
We adopted ASU No. 2016-02 (Topic 842), Leases as of February 1, 2019, using the cumulative-effect transition method recognized as of the date of initial application, as amended by ASU No. 2018-11.
Advertising Expense
We expense advertising costs as incurred. We incurred $36.8 million, $30.1 million and $17.3 million in advertising expenses for fiscal 2021, 2020 and 2019, respectively. Advertising costs are included in “Sales and marketing” expenses on our consolidated statements of operations.
Stock-Based Compensation
We recognize compensation expense for all share-based payment awards, including stock options, restricted stock units (“RSUs”), performance units (“PSUs”) and restricted stock awards (“RSAs”), based on the estimated fair value of the award on the grant date over the related vesting periods. The expense recorded is based on awards ultimately expected to vest and therefore is reduced by estimated forfeitures. Forfeitures are estimated at the time of grant and revised, if necessary, in subsequent periods if actual forfeitures differ from those estimates. We calculate the fair value of options using the Black-Scholes method and expense using the straight-line attribution approach.
The fair value of each option grant and stock purchase right granted under the Employee Stock Purchase Plan (“ESPP”) is estimated on the date of grant using the Black-Scholes option pricing model. We recognize stock-based compensation related to our ESPP on a straight-line basis over the offering period, which is twelve months. Stock-based compensation expense is recognized net of estimated forfeiture activity.
The determination of the grant date fair value of options using an option-pricing model is affected by assumptions regarding a number of other complex and subjective variables, which include our expected stock price volatility over the expected term of the options, stock option exercise and cancellation behaviors, risk-free interest rates and expected dividends. The expected term of the options is based on the average period the stock options are expected to remain outstanding calculated as the midpoint of the vesting terms and contractual expiration periods, as we do not have sufficient historical information to develop reasonable expectations about future exercise patterns and post-vesting employment termination behavior. The expected stock price volatility for our stock is determined by examining the historical volatility of our common stock. The risk-free interest rate is calculated using the average of the published interest rates United States Treasury zero-coupon issues with maturities that approximate the expected term. The dividend yield assumption is zero as we do not have any history of, nor plans to make, dividend payments.
The number of PSUs earned and eligible to vest is determined based on achievement of certain performance conditions and/or market conditions and the recipients’ continued service with us. For awards subject to service and performance conditions, the number of shares of our stock issued pursuant to the award can range from 0% to 200% of the target amount. For awards subject to service and performance conditions that also include market conditions, the number of shares of our stock
NOTES TO CONSOLIDATED FINANCIAL STATEMENTS
82
issued pursuant to the award can range from 0% to 300% of the target amount. Compensation expense for PSUs with performance conditions is measured using the fair value at the date of grant and recorded over the vesting period under the graded-vesting attribution method, and may be adjusted over the vesting period based on interim estimates of performance against pre-set objectives. We use a Monte Carlo option-pricing model to determine the fair value of PSUs with market conditions.
Income Taxes
Income taxes are accounted for under the asset and liability method in accordance with authoritative guidance for income taxes. Deferred tax assets and liabilities are recognized for the future tax consequences attributable to differences between the financial statement carrying amounts of existing assets and liabilities and their respective tax basis and operating loss and tax credit carryforwards. Deferred tax assets and liabilities are measured using enacted tax rates expected to apply to taxable income in the years in which those temporary differences are expected to be recovered or settled. The effect on deferred tax assets and liabilities of a change in tax rates is recognized in income in the period that includes the enactment date.
The guidance on accounting for uncertainty in income taxes requires us to identify, evaluate and measure all uncertain tax positions taken or to be taken on tax returns and to record liabilities for the amount of these positions that may not be sustained, or may only partially be sustained, upon examination by the relevant taxing authorities. Although we believe that our estimates and judgments were reasonable, actual results may differ from these estimates. All of these judgments are subject to review by the taxing authorities.
NOTES TO CONSOLIDATED FINANCIAL STATEMENTS
83

Recently Adopted Accounting Standards
Standard Description Effective Date Effect on the Consolidated Financial Statements (or Other Significant Matters)
Accounting Standards Update (“ASU”) No. 2019-12, Income Taxes (Topic 740), Simplifying the Accounting for Income Taxes
The amendments in this ASU simplify the accounting for incomes taxes by removing certain exceptions to the general principles in Topic 740 and clarifying and amending existing guidance to improve consistent application. Most amendments within this standard are required to be applied on a prospective basis, while certain amendments must be applied on a retrospective or modified retrospective basis.
We adopted this standard as of August 1, 2020.
The adoption of this new standard did not have a material impact on our consolidated financial statements.
ASU No. 2016-13 (Topic 326), Financial Instruments - Credit Losses
The amendments in this update require a financial asset (or a group of financial assets) measured at an amortized cost basis to be presented at the net amount expected to be collected. The new approach to estimating credit losses (referred to as the current expected credit losses model) applies to most financial assets measured at amortized cost and certain other instruments, including trade and other receivables, loans and available-for-sale securities.
We adopted this new standard as of February 1, 2020, using the modified prospective method recognized as of the date of initial application. Under this method, we are not required to restate or disclose the effects of applying Topic 326 for comparative periods.
The adoption of this new standard did not have a material impact on our consolidated financial statements.
Under the new standard, we assess credit losses on accounts receivable by taking into consideration past collection experience, credit quality of the customer, age of the receivable balance, current economic conditions, and forecasts that affect the collectability of the reported amount.
With respect to available-for-sale debt securities, when the fair value of a security is below its amortized cost, the amortized cost will be written down to its fair value if it is more likely than not that management is required to sell the impaired security before recovery of its amortized basis, or management has the intention to sell the security. If neither of these conditions are met, we determine whether the impairment is due to credit losses by comparing the present value of the expected cash flows of the security with its amortized cost basis. The amount of impairment recognized is limited to the excess of the amortized cost over the fair value of the security. An allowance for credit losses for the excess of amortized cost over the expected cash flows is recorded in Other income (expense), net on our consolidated statements of operations. Non-credit related impairment losses are reported as a separate component on our consolidated statements of comprehensive income (loss).
NOTES TO CONSOLIDATED FINANCIAL STATEMENTS
84
Recently Issued Accounting Pronouncements
Standard Description Effective Date Effect on the Consolidated Financial Statements (or Other Significant Matters)
ASU No. 2020-06, Debt - Debt with Conversion and Other Options (Subtopic 470-20) and Derivatives and Hedging - Contracts in Entity's Own Equity (Subtopic 815 - 40)
This ASU amends the guidance on convertible instruments and the derivatives scope exception for contracts in an entity's own equity, which reduces the number of accounting models for convertible debt instruments and convertible preferred stock. Convertible instruments will no longer have to be separated into debt and equity components. Convertible debt instruments will be reported as a single liability and convertible preferred stock will be reported as a single equity instrument. Similarly, the embedded conversion feature will no longer be amortized as interest expense over the life of the instrument. Instead, a convertible debt instrument will be accounted for wholly as debt unless 1) a convertible instrument contains features that require bifurcation as a derivative, or 2) a convertible debt instrument was issued at a substantive premium. Among other potential impacts, this ASU is expected to reduce reported interest expense, decrease reported net loss, and result in a reclassification of certain conversion feature balance sheet amounts from stockholder’s equity to liabilities as it relates to the convertible senior notes. This ASU also simplifies the diluted earnings per share calculations by requiring the use of the if-converted method and that the effect of potential share settlement be included in diluted earnings per share calculations.
First quarter of fiscal 2023. Early adoption is permitted beginning in fiscal 2022.
We are currently evaluating the impact of this standard on our consolidated financial statements.
NOTES TO CONSOLIDATED FINANCIAL STATEMENTS
85

FOR
M 1
0-K
Recently Adopted Accounting Standards
Standard Description Effective Date Effect on the Consolidated Financial Statements (or Other Significant Matters)
Accounting Standards Update (“ASU”) No. 2019-12, Income Taxes (Topic 740), Simplifying the Accounting for Income Taxes
The amendments in this ASU simplify the accounting for incomes taxes by removing certain exceptions to the general principles in Topic 740 and clarifying and amending existing guidance to improve consistent application. Most amendments within this standard are required to be applied on a prospective basis, while certain amendments must be applied on a retrospective or modified retrospective basis.
We adopted this standard as of August 1, 2020.
The adoption of this new standard did not have a material impact on our consolidated financial statements.
ASU No. 2016-13 (Topic 326), Financial Instruments - Credit Losses
The amendments in this update require a financial asset (or a group of financial assets) measured at an amortized cost basis to be presented at the net amount expected to be collected. The new approach to estimating credit losses (referred to as the current expected credit losses model) applies to most financial assets measured at amortized cost and certain other instruments, including trade and other receivables, loans and available-for-sale securities.
We adopted this new standard as of February 1, 2020, using the modified prospective method recognized as of the date of initial application. Under this method, we are not required to restate or disclose the effects of applying Topic 326 for comparative periods.
The adoption of this new standard did not have a material impact on our consolidated financial statements.
Under the new standard, we assess credit losses on accounts receivable by taking into consideration past collection experience, credit quality of the customer, age of the receivable balance, current economic conditions, and forecasts that affect the collectability of the reported amount.
With respect to available-for-sale debt securities, when the fair value of a security is below its amortized cost, the amortized cost will be written down to its fair value if it is more likely than not that management is required to sell the impaired security before recovery of its amortized basis, or management has the intention to sell the security. If neither of these conditions are met, we determine whether the impairment is due to credit losses by comparing the present value of the expected cash flows of the security with its amortized cost basis. The amount of impairment recognized is limited to the excess of the amortized cost over the fair value of the security. An allowance for credit losses for the excess of amortized cost over the expected cash flows is recorded in Other income (expense), net on our consolidated statements of operations. Non-credit related impairment losses are reported as a separate component on our consolidated statements of comprehensive income (loss).
NOTES TO CONSOLIDATED FINANCIAL STATEMENTS
84
Recently Issued Accounting Pronouncements
Standard Description Effective Date Effect on the Consolidated Financial Statements (or Other Significant Matters)
ASU No. 2020-06, Debt - Debt with Conversion and Other Options (Subtopic 470-20) and Derivatives and Hedging - Contracts in Entity's Own Equity (Subtopic 815 - 40)
This ASU amends the guidance on convertible instruments and the derivatives scope exception for contracts in an entity's own equity, which reduces the number of accounting models for convertible debt instruments and convertible preferred stock. Convertible instruments will no longer have to be separated into debt and equity components. Convertible debt instruments will be reported as a single liability and convertible preferred stock will be reported as a single equity instrument. Similarly, the embedded conversion feature will no longer be amortized as interest expense over the life of the instrument. Instead, a convertible debt instrument will be accounted for wholly as debt unless 1) a convertible instrument contains features that require bifurcation as a derivative, or 2) a convertible debt instrument was issued at a substantive premium. Among other potential impacts, this ASU is expected to reduce reported interest expense, decrease reported net loss, and result in a reclassification of certain conversion feature balance sheet amounts from stockholder’s equity to liabilities as it relates to the convertible senior notes. This ASU also simplifies the diluted earnings per share calculations by requiring the use of the if-converted method and that the effect of potential share settlement be included in diluted earnings per share calculations.
First quarter of fiscal 2023. Early adoption is permitted beginning in fiscal 2022.
We are currently evaluating the impact of this standard on our consolidated financial statements.
NOTES TO CONSOLIDATED FINANCIAL STATEMENTS
85

(2) Investments and Fair Value Measurements
The carrying amounts of certain of our financial instruments including cash equivalents, accounts receivable, accounts payable and accrued liabilities approximate fair value due to their short-term maturities.
Assets and liabilities recorded at fair value in the consolidated financial statements are categorized based upon the
level of judgment associated with the inputs used to measure their fair value. Hierarchical levels that are directly related to the amount of subjectivity associated with the inputs to the valuation of these assets or liabilities are as follows:
Level 1—Observable inputs, such as quoted prices in active markets for identical assets or liabilities. Level 2—Observable inputs other than Level 1 prices such as quoted prices for similar assets or liabilities, quoted
prices in markets that are not active, or other inputs that are observable or can be corroborated by observable market data for substantially the full term of the assets or liabilities.
Level 3—Unobservable inputs that are supported by little or no market activity and that are significant to the fair value
of the assets or liabilities. Assets and liabilities measured at fair value are classified in their entirety based on the lowest level of input that is
significant to the fair value measurement. Our assessment of the significance of a particular input to the fair value measurement in its entirety requires management to make judgments and consider factors specific to the asset or liability.
The following table sets forth the fair value of our financial assets that were measured on a recurring basis:
January 31,
2021 2020
(In thousands) Level 1 Level 2 Level 3 Total Level 1 Level 2 Level 3 TotalAssets:
Money market funds $ 933,058 $ — $ — $ 933,058 $ 138,999 $ — $ — $ 138,999 U.S. treasury securities — 75,068 — 75,068 — 875,180 — 875,180 Corporate bonds — 12,779 — 12,779 — 124,972 — 124,972 Commercial paper — — — — — 4,994 — 4,994 Other — — — — — — 2,000 2,000 Reported as:
Assets:
Cash and cash equivalents
$ 933,058
$ 147,034 Investments, current 87,847 976,508 Investments, non-current — 22,603
Total
$ 1,020,905
$ 1,146,145
Our investments in money market funds are measured at fair value on a recurring basis. These money market funds are actively traded and reported daily through a variety of sources. The fair value of the money market fund investments is classified as Level 1.
The following table presents our investments in available-for-sale debt securities as of January 31, 2021:
(In thousands) Amortized Cost Unrealized Gains Unrealized Losses Fair Value
Investments, current:U.S. treasury securities $ 75,032 $ 36 $ — $ 75,068 Corporate bonds 12,765 14 — 12,779
Total available-for-sale investments $ 87,797 $ 50 $ — $ 87,847
NOTES TO CONSOLIDATED FINANCIAL STATEMENTS
86
The following table presents our investments in available-for-sale debt securities as of January 31, 2020:
(In thousands) Amortized Cost Unrealized Gains Unrealized Losses Fair Value
Cash and cash equivalents:U.S. treasury securities $ 8,035 $ — $ — $ 8,035
Investments, current:U.S. treasury securities 866,578 590 (23) 867,145 Corporate bonds 103,848 521 — 104,369 Commercial paper 4,991 3 — 4,994
Investments, non-current:Corporate bonds 20,444 159 — 20,603
Total available-for-sale investments $ 1,003,896 $ 1,273 $ (23) $ 1,005,146
The following table presents the fair values and unrealized losses related to our investments in available-for-sale debt securities classified by length of time that the securities have been in a continuous unrealized loss position as of January 31, 2020:
Less than 12 Months 12 Months or Greater Total
(In thousands) Fair ValueUnrealized
Losses Fair ValueUnrealized
Losses Fair ValueUnrealized
Losses
U.S. treasury securities $ 129,149 $ (23) $ — $ — $ 129,149 $ (23)
As of January 31, 2021, we did not have any investments in available-for-sale debt securities in an unrealized loss position.
The contractual maturities of our investments as of January 31, 2021 are as follows (in thousands):
Due within one year $ 87,847 Total $ 87,847
Investments with maturities of less than 12 months from the balance sheet date are classified as current assets, which are available for use to fund current operations. Investments with maturities greater than 12 months from the balance sheet date are classified as long-term assets.
Convertible Senior Notes
Refer to Note 7 “Convertible Senior Notes” for details regarding the fair value of our convertible senior notes.
Equity Investments
Our equity investments are included in “Investments, non-current” on our consolidated balance sheets. The following table provides a summary of our equity investments:
January 31,(In thousands) 2021 2020
Equity investments without readily determinable fair values $ 10,244 $ 10,744 Equity investments under the equity method of accounting 3,484 2,023
Total $ 13,728 $ 12,767
As of January 31, 2021, we determined that one of our strategic investments was impaired. As a result, we recognized an impairment charge of $4.5 million in “Other income (expense), net” on our consolidated statements of operations. As of January 31, 2020, no strategic investments were impaired.
NOTES TO CONSOLIDATED FINANCIAL STATEMENTS
87

FOR
M 1
0-K
(2) Investments and Fair Value Measurements
The carrying amounts of certain of our financial instruments including cash equivalents, accounts receivable, accounts payable and accrued liabilities approximate fair value due to their short-term maturities.
Assets and liabilities recorded at fair value in the consolidated financial statements are categorized based upon the
level of judgment associated with the inputs used to measure their fair value. Hierarchical levels that are directly related to the amount of subjectivity associated with the inputs to the valuation of these assets or liabilities are as follows:
Level 1—Observable inputs, such as quoted prices in active markets for identical assets or liabilities. Level 2—Observable inputs other than Level 1 prices such as quoted prices for similar assets or liabilities, quoted
prices in markets that are not active, or other inputs that are observable or can be corroborated by observable market data for substantially the full term of the assets or liabilities.
Level 3—Unobservable inputs that are supported by little or no market activity and that are significant to the fair value
of the assets or liabilities. Assets and liabilities measured at fair value are classified in their entirety based on the lowest level of input that is
significant to the fair value measurement. Our assessment of the significance of a particular input to the fair value measurement in its entirety requires management to make judgments and consider factors specific to the asset or liability.
The following table sets forth the fair value of our financial assets that were measured on a recurring basis:
January 31,
2021 2020
(In thousands) Level 1 Level 2 Level 3 Total Level 1 Level 2 Level 3 TotalAssets:
Money market funds $ 933,058 $ — $ — $ 933,058 $ 138,999 $ — $ — $ 138,999 U.S. treasury securities — 75,068 — 75,068 — 875,180 — 875,180 Corporate bonds — 12,779 — 12,779 — 124,972 — 124,972 Commercial paper — — — — — 4,994 — 4,994 Other — — — — — — 2,000 2,000 Reported as:
Assets:
Cash and cash equivalents
$ 933,058
$ 147,034 Investments, current 87,847 976,508 Investments, non-current — 22,603
Total
$ 1,020,905
$ 1,146,145
Our investments in money market funds are measured at fair value on a recurring basis. These money market funds are actively traded and reported daily through a variety of sources. The fair value of the money market fund investments is classified as Level 1.
The following table presents our investments in available-for-sale debt securities as of January 31, 2021:
(In thousands) Amortized Cost Unrealized Gains Unrealized Losses Fair Value
Investments, current:U.S. treasury securities $ 75,032 $ 36 $ — $ 75,068 Corporate bonds 12,765 14 — 12,779
Total available-for-sale investments $ 87,797 $ 50 $ — $ 87,847
NOTES TO CONSOLIDATED FINANCIAL STATEMENTS
86
The following table presents our investments in available-for-sale debt securities as of January 31, 2020:
(In thousands) Amortized Cost Unrealized Gains Unrealized Losses Fair Value
Cash and cash equivalents:U.S. treasury securities $ 8,035 $ — $ — $ 8,035
Investments, current:U.S. treasury securities 866,578 590 (23) 867,145 Corporate bonds 103,848 521 — 104,369 Commercial paper 4,991 3 — 4,994
Investments, non-current:Corporate bonds 20,444 159 — 20,603
Total available-for-sale investments $ 1,003,896 $ 1,273 $ (23) $ 1,005,146
The following table presents the fair values and unrealized losses related to our investments in available-for-sale debt securities classified by length of time that the securities have been in a continuous unrealized loss position as of January 31, 2020:
Less than 12 Months 12 Months or Greater Total
(In thousands) Fair ValueUnrealized
Losses Fair ValueUnrealized
Losses Fair ValueUnrealized
Losses
U.S. treasury securities $ 129,149 $ (23) $ — $ — $ 129,149 $ (23)
As of January 31, 2021, we did not have any investments in available-for-sale debt securities in an unrealized loss position.
The contractual maturities of our investments as of January 31, 2021 are as follows (in thousands):
Due within one year $ 87,847 Total $ 87,847
Investments with maturities of less than 12 months from the balance sheet date are classified as current assets, which are available for use to fund current operations. Investments with maturities greater than 12 months from the balance sheet date are classified as long-term assets.
Convertible Senior Notes
Refer to Note 7 “Convertible Senior Notes” for details regarding the fair value of our convertible senior notes.
Equity Investments
Our equity investments are included in “Investments, non-current” on our consolidated balance sheets. The following table provides a summary of our equity investments:
January 31,(In thousands) 2021 2020
Equity investments without readily determinable fair values $ 10,244 $ 10,744 Equity investments under the equity method of accounting 3,484 2,023
Total $ 13,728 $ 12,767
As of January 31, 2021, we determined that one of our strategic investments was impaired. As a result, we recognized an impairment charge of $4.5 million in “Other income (expense), net” on our consolidated statements of operations. As of January 31, 2020, no strategic investments were impaired.
NOTES TO CONSOLIDATED FINANCIAL STATEMENTS
87

(3) Commitments and Contingencies
Legal Proceedings A putative class action lawsuit alleging violations of the federal securities laws was filed on December 4, 2020 in the
U.S. District Court for the Northern District of California against us, our CEO and our CFO. The lawsuit alleges violations of the Securities Exchange Act of 1934, as amended, for allegedly making materially false and misleading statements regarding our financial guidance. The complaint asserts a putative class period stemming from October 21, 2020 to December 2, 2020. The plaintiff seeks unspecified monetary damages and other relief.
A derivative lawsuit related to the securities class action was filed on February 15, 2021, in the U.S. District Court for the Northern District of California. The lawsuit names our CEO, our CFO, and many of our board members as defendants, and the company as a nominal defendant. The lawsuit alleges claims for breach of fiduciary duties, unjust enrichment, waste of corporate assets, abuse of control, and gross mismanagement against the defendants, and claims for contribution under Sections 10(b) and 21D of the Securities Exchange Act of 1934 against only our CEO and CFO. The plaintiff seeks unspecified monetary damages and other relief on behalf of Splunk. Another derivative lawsuit related to the securities class action was filed on March 1, 2021, in California Superior Court, San Francisco County. The lawsuit names our CEO, our CFO, and certain of our board members as defendants, and the company as a nominal defendant. The lawsuit alleges claims for breach of fiduciary duty and unjust enrichment. The plaintiff seeks unspecified monetary damages and other relief on behalf of Splunk.
We are also subject to certain routine legal and regulatory proceedings, as well as demands and claims that arise in the normal course of our business. We make a provision for a liability relating to legal matters when it is both probable that a liability has been incurred and the amount of the loss can be reasonably estimated. These provisions are reviewed at least quarterly and adjusted to reflect the impact of negotiations, estimated settlements, legal rulings, advice of legal counsel and other information and events pertaining to a particular matter. In our opinion, resolution of any pending claims (either individually or in the aggregate) is not expected to have a material adverse impact on our consolidated results of operations, cash flows or financial position, nor is it possible to provide an estimated amount of any such loss. However, depending on the nature and timing of any such dispute, an unfavorable resolution of a matter could materially affect our future financial position, results of operations or cash flows, or all, in a particular period.
Indemnification Arrangements
During the ordinary course of business, we may indemnify, hold harmless and agree to reimburse for losses suffered or
incurred, our customers, vendors, and each of their affiliates for certain intellectual property infringement and other claims by third parties with respect to our offerings, in connection with our commercial license arrangements or related to general business dealings with those parties.
As permitted under Delaware law, we have entered into indemnification agreements with our officers, directors and certain employees, indemnifying them for certain events or occurrences while they serve as our officers or directors or those of our direct and indirect subsidiaries.
Claims and reimbursements under indemnification arrangements have not been material to our consolidated financial
statements; therefore, there is no accrual of such amounts at January 31, 2021 or 2020. We are unable to estimate the maximum potential impact of these indemnifications on our future results of operations.
(4) Leases
We have operating leases for office space, used for our business operations and sales support, and data centers, used primarily for product development.
During fiscal 2021, operating lease costs were $82.5 million, excluding variable lease costs of $13.9 million. Operating lease costs also exclude short-term leases and sublease income which were immaterial during fiscal 2021. During fiscal 2020, operating lease costs were $49.6 million, excluding short-term leases, variable lease costs and sublease income, which were immaterial. Rent expense recognized prior to our adoption of Topic 842 was $26.2 million during fiscal 2019.
NOTES TO CONSOLIDATED FINANCIAL STATEMENTS
88
As of January 31, 2021, the weighted-average remaining lease term and discount rate related to our operating lease right-of-use assets and related lease liabilities were as follows:
January 31, 2021 2020
Weighted-average remaining lease term (in years) 8.4 8.0Weighted-average discount rate 6.0 % 6.0 %
As of January 31, 2021, the maturity of lease liabilities under our non-cancelable operating leases were as follows:
Fiscal Period (In thousands) Future Payments
Fiscal 2022 $ 66,374 Fiscal 2023 67,004 Fiscal 2024 55,712 Fiscal 2025 49,324 Fiscal 2026 50,534 Thereafter 223,148
Total lease payments 512,096 Less imputed interest (117,050)
Total current and non-current operating lease liabilities (1) $ 395,046 _________________________(1) The current portion of our operating lease liabilities is included in “Accrued expenses and other liabilities” on our consolidated balance
sheets.
As of January 31, 2021, we have entered into a lease, primarily for office space that has not yet commenced, with future lease payments of $8.3 million that are not reflected in the above. This lease will commence in fiscal 2022 with a non-cancelable lease term of 11 years.
Supplemental Disclosures
Fiscal Year Ended January 31,(In thousands) 2021 2020
Cash paid for operating lease liabilities $ 58,018 $ 51,929 Operating lease liabilities arising from obtaining right-of-use assets 148,721 90,320
NOTES TO CONSOLIDATED FINANCIAL STATEMENTS
89

FOR
M 1
0-K
(3) Commitments and Contingencies
Legal Proceedings A putative class action lawsuit alleging violations of the federal securities laws was filed on December 4, 2020 in the
U.S. District Court for the Northern District of California against us, our CEO and our CFO. The lawsuit alleges violations of the Securities Exchange Act of 1934, as amended, for allegedly making materially false and misleading statements regarding our financial guidance. The complaint asserts a putative class period stemming from October 21, 2020 to December 2, 2020. The plaintiff seeks unspecified monetary damages and other relief.
A derivative lawsuit related to the securities class action was filed on February 15, 2021, in the U.S. District Court for the Northern District of California. The lawsuit names our CEO, our CFO, and many of our board members as defendants, and the company as a nominal defendant. The lawsuit alleges claims for breach of fiduciary duties, unjust enrichment, waste of corporate assets, abuse of control, and gross mismanagement against the defendants, and claims for contribution under Sections 10(b) and 21D of the Securities Exchange Act of 1934 against only our CEO and CFO. The plaintiff seeks unspecified monetary damages and other relief on behalf of Splunk. Another derivative lawsuit related to the securities class action was filed on March 1, 2021, in California Superior Court, San Francisco County. The lawsuit names our CEO, our CFO, and certain of our board members as defendants, and the company as a nominal defendant. The lawsuit alleges claims for breach of fiduciary duty and unjust enrichment. The plaintiff seeks unspecified monetary damages and other relief on behalf of Splunk.
We are also subject to certain routine legal and regulatory proceedings, as well as demands and claims that arise in the normal course of our business. We make a provision for a liability relating to legal matters when it is both probable that a liability has been incurred and the amount of the loss can be reasonably estimated. These provisions are reviewed at least quarterly and adjusted to reflect the impact of negotiations, estimated settlements, legal rulings, advice of legal counsel and other information and events pertaining to a particular matter. In our opinion, resolution of any pending claims (either individually or in the aggregate) is not expected to have a material adverse impact on our consolidated results of operations, cash flows or financial position, nor is it possible to provide an estimated amount of any such loss. However, depending on the nature and timing of any such dispute, an unfavorable resolution of a matter could materially affect our future financial position, results of operations or cash flows, or all, in a particular period.
Indemnification Arrangements
During the ordinary course of business, we may indemnify, hold harmless and agree to reimburse for losses suffered or
incurred, our customers, vendors, and each of their affiliates for certain intellectual property infringement and other claims by third parties with respect to our offerings, in connection with our commercial license arrangements or related to general business dealings with those parties.
As permitted under Delaware law, we have entered into indemnification agreements with our officers, directors and certain employees, indemnifying them for certain events or occurrences while they serve as our officers or directors or those of our direct and indirect subsidiaries.
Claims and reimbursements under indemnification arrangements have not been material to our consolidated financial
statements; therefore, there is no accrual of such amounts at January 31, 2021 or 2020. We are unable to estimate the maximum potential impact of these indemnifications on our future results of operations.
(4) Leases
We have operating leases for office space, used for our business operations and sales support, and data centers, used primarily for product development.
During fiscal 2021, operating lease costs were $82.5 million, excluding variable lease costs of $13.9 million. Operating lease costs also exclude short-term leases and sublease income which were immaterial during fiscal 2021. During fiscal 2020, operating lease costs were $49.6 million, excluding short-term leases, variable lease costs and sublease income, which were immaterial. Rent expense recognized prior to our adoption of Topic 842 was $26.2 million during fiscal 2019.
NOTES TO CONSOLIDATED FINANCIAL STATEMENTS
88
As of January 31, 2021, the weighted-average remaining lease term and discount rate related to our operating lease right-of-use assets and related lease liabilities were as follows:
January 31, 2021 2020
Weighted-average remaining lease term (in years) 8.4 8.0Weighted-average discount rate 6.0 % 6.0 %
As of January 31, 2021, the maturity of lease liabilities under our non-cancelable operating leases were as follows:
Fiscal Period (In thousands) Future Payments
Fiscal 2022 $ 66,374 Fiscal 2023 67,004 Fiscal 2024 55,712 Fiscal 2025 49,324 Fiscal 2026 50,534 Thereafter 223,148
Total lease payments 512,096 Less imputed interest (117,050)
Total current and non-current operating lease liabilities (1) $ 395,046 _________________________(1) The current portion of our operating lease liabilities is included in “Accrued expenses and other liabilities” on our consolidated balance
sheets.
As of January 31, 2021, we have entered into a lease, primarily for office space that has not yet commenced, with future lease payments of $8.3 million that are not reflected in the above. This lease will commence in fiscal 2022 with a non-cancelable lease term of 11 years.
Supplemental Disclosures
Fiscal Year Ended January 31,(In thousands) 2021 2020
Cash paid for operating lease liabilities $ 58,018 $ 51,929 Operating lease liabilities arising from obtaining right-of-use assets 148,721 90,320
NOTES TO CONSOLIDATED FINANCIAL STATEMENTS
89

(5) Property and Equipment
Property and equipment are stated at cost, net of accumulated depreciation and amortization. These assets are depreciated and amortized using the straight-line method over their estimated useful lives. Property and equipment consisted of the following:
January 31,
(In thousands) 2021 2020
Computer equipment and software $ 70,628 $ 106,352 Furniture and fixtures 33,142 28,568 Leasehold and building improvements (1) 180,956 141,965 Capitalized software development costs (2) 23,795 3,540
Property and equipment, gross 308,521 280,425 Less: accumulated depreciation and amortization (125,741) (123,497)
Property and equipment, net $ 182,780 $ 156,928 _________________________(1) Includes costs related to assets not yet placed into service of $25.4 million and $46.5 million, as of January 31, 2021 and 2020,
respectively.(2) Includes costs related to projects still under development of $16.7 million and $3.5 million, as of January 31, 2021 and 2020,
respectively.
Depreciation and amortization expense of Property and equipment, net was $34.9 million, $29.0 million and $27.0 million for fiscal 2021, 2020 and 2019, respectively.
Geographic Information
The following table presents our long-lived assets, which consist of property and equipment, net of depreciation and amortization, and operating lease right-of-use assets by geographic region:
January 31, (In thousands) 2021 2020
United States $ 476,575 $ 362,586 International 62,501 61,428
Total long-lived assets $ 539,076 $ 424,014
Other than the United States, no country represented 10% or more of our total long-lived assets as of January 31, 2021 or 2020.
(6) Acquisitions, Goodwill and Intangible Assets
Fiscal 2021 Acquisitions
Rigor
On November 5, 2020, we acquired 100% of the voting equity interest of Rigor, Inc. (“Rigor”), a privately-held Delaware corporation that offers advanced synthetic monitoring and optimization tools. This acquisition has been accounted for as a business combination. The total consideration transferred for this acquisition, all of which was in cash, was $37.6 million. The purchase price was allocated as follows: $15.4 million to identified intangible assets, $0.9 million to net assets acquired and $1.8 million to net deferred tax liabilities, with the excess $23.1 million of the purchase price over the fair value of net tangible and intangible assets acquired recorded as goodwill, allocated to our single operating segment. Goodwill is primarily attributable to the value expected from the synergies of the combination, including combined selling opportunities with our products. This goodwill is not deductible for income tax purposes. The results of operations of Rigor, which are not material, have been included in our consolidated financial statements from the date of purchase.
NOTES TO CONSOLIDATED FINANCIAL STATEMENTS
90
The following table sets forth the components of identifiable intangible assets acquired and their estimated useful lives as of the date of acquisition:
(In thousands, except useful life) Fair Value Useful Life (in months)
Developed technology $ 10,700 36Customer relationships 4,500 36Other acquired intangible assets 200 12
Total intangible assets acquired $ 15,400
Other Acquisitions
During fiscal 2021, we acquired 100% of the voting equity interest of OÜ Plumbr (“Plumbr”) and Flowmill, Inc. (“Flowmill”) that specialize in application and network performance monitoring capabilities. The acquisitions have been accounted for as business combinations and were not material individually to our consolidated financial statements. The aggregate purchase price of $31.6 million consisted of $24.4 million paid in cash, $4.9 million for the fair value of shares of our common stock issued and $2.3 million in fair value of replacement equity awards attributable to pre-acquisition service. The purchase price was allocated as follows: $10.2 million to identifiable intangible assets, $2.9 million to net assets acquired and $0.5 million to net deferred tax liabilities, with the excess $19.0 million of the purchase price over the fair value of net assets acquired recorded as goodwill, allocated to our one operating segment. Goodwill is primarily attributable to the value expected from the synergies of the combination, including combined selling opportunities with our products. This goodwill is not deductible for income tax purposes. The identifiable intangible assets, which primarily consisted of developed technology, has an estimated useful life of 3 years. The results of operations of the acquisitions which are not material, have been included in our consolidated financial statements from the date of purchase.
Fiscal 2020 Acquisitions
SignalFx
On October 1, 2019, we acquired 100% of the voting equity interest of SignalFx, Inc. (“SignalFx”), a privately-held Delaware corporation that develops real-time monitoring solutions for cloud infrastructure, microservices and applications. This acquisition has been accounted for as a business combination. The total fair value of consideration transferred for this acquisition was $961.4 million, which consisted of $619.1 million in cash, $324.5 million for the fair value of 2,771,482 shares of our common stock issued and $17.8 million in fair value of replacement equity awards attributable to pre-acquisition service. The purchase price was allocated as follows: $173.7 million to identified intangible assets, $62.1 million to net assets acquired and $3.3 million to net deferred tax liabilities, with the excess $728.9 million of the purchase price over the fair value of net tangible and intangible assets acquired recorded as goodwill, allocated to our one operating segment. Goodwill is primarily attributable to the value expected from the synergies of the combination, including combined selling opportunities with our products. This goodwill is not deductible for income tax purposes. The results of operations of SignalFx have been included in our consolidated financial statements from the date of purchase.
Per the terms of the merger agreement with SignalFx, certain unvested stock options, restricted stock units and restricted stock awards held by SignalFx employees were canceled and exchanged for replacement equity awards under our 2012 Equity Incentive Plan. Additionally, certain shares of stock issued pursuant to share-based compensation awards held by key employees of SignalFx were canceled and exchanged for replacement equity awards consisting of unregistered restricted shares of our common stock subject to vesting. The portion of the fair value of the replacement equity awards associated with pre-acquisition service of SignalFx’s employees represented a component of the total purchase consideration, as discussed above. The remaining fair value of $104.7 million of these issued awards, which are subject to the recipients’ continued service with us and thus excluded from the purchase price, will be recognized ratably as stock-based compensation expense over the required service period.
NOTES TO CONSOLIDATED FINANCIAL STATEMENTS
91

FOR
M 1
0-K
(5) Property and Equipment
Property and equipment are stated at cost, net of accumulated depreciation and amortization. These assets are depreciated and amortized using the straight-line method over their estimated useful lives. Property and equipment consisted of the following:
January 31,
(In thousands) 2021 2020
Computer equipment and software $ 70,628 $ 106,352 Furniture and fixtures 33,142 28,568 Leasehold and building improvements (1) 180,956 141,965 Capitalized software development costs (2) 23,795 3,540
Property and equipment, gross 308,521 280,425 Less: accumulated depreciation and amortization (125,741) (123,497)
Property and equipment, net $ 182,780 $ 156,928 _________________________(1) Includes costs related to assets not yet placed into service of $25.4 million and $46.5 million, as of January 31, 2021 and 2020,
respectively.(2) Includes costs related to projects still under development of $16.7 million and $3.5 million, as of January 31, 2021 and 2020,
respectively.
Depreciation and amortization expense of Property and equipment, net was $34.9 million, $29.0 million and $27.0 million for fiscal 2021, 2020 and 2019, respectively.
Geographic Information
The following table presents our long-lived assets, which consist of property and equipment, net of depreciation and amortization, and operating lease right-of-use assets by geographic region:
January 31, (In thousands) 2021 2020
United States $ 476,575 $ 362,586 International 62,501 61,428
Total long-lived assets $ 539,076 $ 424,014
Other than the United States, no country represented 10% or more of our total long-lived assets as of January 31, 2021 or 2020.
(6) Acquisitions, Goodwill and Intangible Assets
Fiscal 2021 Acquisitions
Rigor
On November 5, 2020, we acquired 100% of the voting equity interest of Rigor, Inc. (“Rigor”), a privately-held Delaware corporation that offers advanced synthetic monitoring and optimization tools. This acquisition has been accounted for as a business combination. The total consideration transferred for this acquisition, all of which was in cash, was $37.6 million. The purchase price was allocated as follows: $15.4 million to identified intangible assets, $0.9 million to net assets acquired and $1.8 million to net deferred tax liabilities, with the excess $23.1 million of the purchase price over the fair value of net tangible and intangible assets acquired recorded as goodwill, allocated to our single operating segment. Goodwill is primarily attributable to the value expected from the synergies of the combination, including combined selling opportunities with our products. This goodwill is not deductible for income tax purposes. The results of operations of Rigor, which are not material, have been included in our consolidated financial statements from the date of purchase.
NOTES TO CONSOLIDATED FINANCIAL STATEMENTS
90
The following table sets forth the components of identifiable intangible assets acquired and their estimated useful lives as of the date of acquisition:
(In thousands, except useful life) Fair Value Useful Life (in months)
Developed technology $ 10,700 36Customer relationships 4,500 36Other acquired intangible assets 200 12
Total intangible assets acquired $ 15,400
Other Acquisitions
During fiscal 2021, we acquired 100% of the voting equity interest of OÜ Plumbr (“Plumbr”) and Flowmill, Inc. (“Flowmill”) that specialize in application and network performance monitoring capabilities. The acquisitions have been accounted for as business combinations and were not material individually to our consolidated financial statements. The aggregate purchase price of $31.6 million consisted of $24.4 million paid in cash, $4.9 million for the fair value of shares of our common stock issued and $2.3 million in fair value of replacement equity awards attributable to pre-acquisition service. The purchase price was allocated as follows: $10.2 million to identifiable intangible assets, $2.9 million to net assets acquired and $0.5 million to net deferred tax liabilities, with the excess $19.0 million of the purchase price over the fair value of net assets acquired recorded as goodwill, allocated to our one operating segment. Goodwill is primarily attributable to the value expected from the synergies of the combination, including combined selling opportunities with our products. This goodwill is not deductible for income tax purposes. The identifiable intangible assets, which primarily consisted of developed technology, has an estimated useful life of 3 years. The results of operations of the acquisitions which are not material, have been included in our consolidated financial statements from the date of purchase.
Fiscal 2020 Acquisitions
SignalFx
On October 1, 2019, we acquired 100% of the voting equity interest of SignalFx, Inc. (“SignalFx”), a privately-held Delaware corporation that develops real-time monitoring solutions for cloud infrastructure, microservices and applications. This acquisition has been accounted for as a business combination. The total fair value of consideration transferred for this acquisition was $961.4 million, which consisted of $619.1 million in cash, $324.5 million for the fair value of 2,771,482 shares of our common stock issued and $17.8 million in fair value of replacement equity awards attributable to pre-acquisition service. The purchase price was allocated as follows: $173.7 million to identified intangible assets, $62.1 million to net assets acquired and $3.3 million to net deferred tax liabilities, with the excess $728.9 million of the purchase price over the fair value of net tangible and intangible assets acquired recorded as goodwill, allocated to our one operating segment. Goodwill is primarily attributable to the value expected from the synergies of the combination, including combined selling opportunities with our products. This goodwill is not deductible for income tax purposes. The results of operations of SignalFx have been included in our consolidated financial statements from the date of purchase.
Per the terms of the merger agreement with SignalFx, certain unvested stock options, restricted stock units and restricted stock awards held by SignalFx employees were canceled and exchanged for replacement equity awards under our 2012 Equity Incentive Plan. Additionally, certain shares of stock issued pursuant to share-based compensation awards held by key employees of SignalFx were canceled and exchanged for replacement equity awards consisting of unregistered restricted shares of our common stock subject to vesting. The portion of the fair value of the replacement equity awards associated with pre-acquisition service of SignalFx’s employees represented a component of the total purchase consideration, as discussed above. The remaining fair value of $104.7 million of these issued awards, which are subject to the recipients’ continued service with us and thus excluded from the purchase price, will be recognized ratably as stock-based compensation expense over the required service period.
NOTES TO CONSOLIDATED FINANCIAL STATEMENTS
91

The following table sets forth the components of identifiable intangible assets acquired and their estimated useful lives as of the date of acquisition:
(In thousands, except useful life) Fair Value Useful Life (in months)
Developed technology $ 108,800 84Customer relationships 60,900 60Other acquired intangible assets 4,000 36
Total intangible assets acquired $ 173,700
We applied significant judgment in determining the fair value of the intangible assets acquired, which involved the use of significant estimates and assumptions with respect to revenue growth rates, royalty rate and technology migration curve.
Omnition
On September 13, 2019, we acquired 100% of the voting equity interest of Cloud Native Labs, Inc. (“Omnition”), a privately-held Delaware corporation that develops a platform for distributed tracing and application monitoring. This acquisition has been accounted for as a business combination. The total fair value of consideration transferred for this acquisition was $52.5 million, which consisted of $31.6 million in cash, $20.2 million for the fair value of 176,989 shares of our common stock issued and $0.7 million in fair value of replacement equity awards attributable to pre-acquisition service. The purchase price was allocated to $8.0 million of identified intangible assets, with the excess $44.5 million of the purchase price over the fair value of net tangible and intangible assets acquired recorded as goodwill, allocated to our one operating segment. Goodwill is primarily attributable to the value expected from the synergies of the combination, including combined selling opportunities with our products. This goodwill is not deductible for income tax purposes. The results of operations of Omnition which are not material, have been included in our consolidated financial statements from the date of purchase.
The following table sets forth the components of identifiable intangible assets acquired and their estimated useful lives as of the date of acquisition:
(In thousands, except useful life) Fair Value Useful Life (in months)
Developed technology $ 8,000 60Total intangible assets acquired $ 8,000
Streamlio
On November 1, 2019, we acquired 100% of the voting equity interest of Streamlio, Inc. (“Streamlio”), a privately-held Delaware corporation that specializes in designing and operating streaming data solutions. This acquisition has been accounted for as a business combination. The total fair value of consideration transferred for this acquisition was $19.8 million, which consisted of $18.7 million in cash and $1.1 million in fair value of replacement equity awards attributable to pre-acquisition service. The purchase price was allocated as follows: $3.6 million to identified intangible assets and $0.1 million to net assets acquired, with the excess $16.1 million of the purchase price over the fair value of net tangible and intangible assets acquired recorded as goodwill, allocated to our one operating segment. Goodwill is primarily attributable to the value expected from the synergies of the combination, including combined selling opportunities with our products. This goodwill is not deductible for income tax purposes. The results of operations of Streamlio have been included in our consolidated financial statements from the date of purchase.
The following table sets forth the components of identifiable intangible assets acquired and their estimated useful lives as of the date of acquisition:
(In thousands, except useful life) Fair Value Useful Life (in months)
Developed technology $ 3,600 36Total intangible assets acquired $ 3,600
NOTES TO CONSOLIDATED FINANCIAL STATEMENTS
92
Fiscal 2019 Acquisitions
Phantom
On April 6, 2018, we acquired 100% of the voting equity interest of Phantom Cyber Corporation (“Phantom”), a privately-held Delaware corporation that develops solutions for security orchestration, automation and response. This acquisition has been accounted for as a business combination. The total fair value of consideration transferred for this acquisition was $303.8 million, which consisted of $291.5 million in cash and $12.3 million in fair value of replacement equity awards attributable to pre-acquisition service. The purchase price was allocated as follows: $44.1 million to identified intangible assets, $10.5 million to net assets acquired, $3.3 million to net deferred tax liability, with the excess $252.5 million of the purchase price over the fair value of net tangible and intangible assets acquired recorded as goodwill, allocated to our one operating segment. Goodwill is primarily attributable to the value expected from the synergies of the combination, including combined selling opportunities with our products. This goodwill is not deductible for income tax purposes. The results of operations of Phantom, which are not material, have been included in our consolidated financial statements from the date of purchase. Additionally, we recognized $3.3 million of acquisition-related costs in “General and administrative” expense on our consolidated statements of operations.
The following table sets forth the components of identifiable intangible assets acquired and their estimated useful lives as of the date of acquisition:
(In thousands, except useful life) Fair Value Useful Life (in months)
Developed technology $ 34,400 84Customer relationships 9,700 60
Total intangible assets acquired $ 44,100
VictorOps
On June 22, 2018, we acquired 100% of the voting equity interest of VictorOps, Inc. (“VictorOps”), a privately-held Delaware corporation that develops incident management solutions for the IT and DevOps markets. This acquisition has been accounted for as a business combination. The total fair value of consideration transferred for this acquisition was $112.3 million, which consisted of $108.8 million in cash and $3.5 million in fair value of replacement equity awards attributable to pre-acquisition service. The purchase price was allocated as follows: $21.1 million to identified intangible assets, $1.7 million to net assets acquired, with the excess $89.5 million of the purchase price over the fair value of net tangible and intangible assets acquired recorded as goodwill, allocated to our one operating segment. Goodwill is primarily attributable to the value expected from the synergies of the combination, including combined selling opportunities with our products. This goodwill is not deductible for income tax purposes. The results of operations of VictorOps, which are not material, have been included in our consolidated financial statements from the date of purchase. Additionally, we recognized $2.7 million of acquisition-related costs in “General and administrative” expense on our consolidated statements of operations.
The following table sets forth the components of identifiable intangible assets acquired and their estimated useful lives as of the date of acquisition:
(In thousands, except useful life) Fair Value Useful Life (in months)
Developed technology $ 11,700 84Customer relationships 9,400 60
Total intangible assets acquired $ 21,100
Unaudited Pro Forma Financial Information
The following unaudited pro forma information presents the combined results of operations as if the acquisitions of SignalFx, Omnition, VictorOps and Phantom had been completed in the beginning of the applicable comparable prior annual reporting period. The unaudited pro forma results include adjustments primarily related to the following: (i) amortization associated with preliminary estimates for the acquired intangible assets; (ii) recognition of post-acquisition stock-based compensation; (iii) the effect of recording deferred revenue at fair value; (iv) elimination of historical interest expense related to
NOTES TO CONSOLIDATED FINANCIAL STATEMENTS
93

FOR
M 1
0-K
The following table sets forth the components of identifiable intangible assets acquired and their estimated useful lives as of the date of acquisition:
(In thousands, except useful life) Fair Value Useful Life (in months)
Developed technology $ 108,800 84Customer relationships 60,900 60Other acquired intangible assets 4,000 36
Total intangible assets acquired $ 173,700
We applied significant judgment in determining the fair value of the intangible assets acquired, which involved the use of significant estimates and assumptions with respect to revenue growth rates, royalty rate and technology migration curve.
Omnition
On September 13, 2019, we acquired 100% of the voting equity interest of Cloud Native Labs, Inc. (“Omnition”), a privately-held Delaware corporation that develops a platform for distributed tracing and application monitoring. This acquisition has been accounted for as a business combination. The total fair value of consideration transferred for this acquisition was $52.5 million, which consisted of $31.6 million in cash, $20.2 million for the fair value of 176,989 shares of our common stock issued and $0.7 million in fair value of replacement equity awards attributable to pre-acquisition service. The purchase price was allocated to $8.0 million of identified intangible assets, with the excess $44.5 million of the purchase price over the fair value of net tangible and intangible assets acquired recorded as goodwill, allocated to our one operating segment. Goodwill is primarily attributable to the value expected from the synergies of the combination, including combined selling opportunities with our products. This goodwill is not deductible for income tax purposes. The results of operations of Omnition which are not material, have been included in our consolidated financial statements from the date of purchase.
The following table sets forth the components of identifiable intangible assets acquired and their estimated useful lives as of the date of acquisition:
(In thousands, except useful life) Fair Value Useful Life (in months)
Developed technology $ 8,000 60Total intangible assets acquired $ 8,000
Streamlio
On November 1, 2019, we acquired 100% of the voting equity interest of Streamlio, Inc. (“Streamlio”), a privately-held Delaware corporation that specializes in designing and operating streaming data solutions. This acquisition has been accounted for as a business combination. The total fair value of consideration transferred for this acquisition was $19.8 million, which consisted of $18.7 million in cash and $1.1 million in fair value of replacement equity awards attributable to pre-acquisition service. The purchase price was allocated as follows: $3.6 million to identified intangible assets and $0.1 million to net assets acquired, with the excess $16.1 million of the purchase price over the fair value of net tangible and intangible assets acquired recorded as goodwill, allocated to our one operating segment. Goodwill is primarily attributable to the value expected from the synergies of the combination, including combined selling opportunities with our products. This goodwill is not deductible for income tax purposes. The results of operations of Streamlio have been included in our consolidated financial statements from the date of purchase.
The following table sets forth the components of identifiable intangible assets acquired and their estimated useful lives as of the date of acquisition:
(In thousands, except useful life) Fair Value Useful Life (in months)
Developed technology $ 3,600 36Total intangible assets acquired $ 3,600
NOTES TO CONSOLIDATED FINANCIAL STATEMENTS
92
Fiscal 2019 Acquisitions
Phantom
On April 6, 2018, we acquired 100% of the voting equity interest of Phantom Cyber Corporation (“Phantom”), a privately-held Delaware corporation that develops solutions for security orchestration, automation and response. This acquisition has been accounted for as a business combination. The total fair value of consideration transferred for this acquisition was $303.8 million, which consisted of $291.5 million in cash and $12.3 million in fair value of replacement equity awards attributable to pre-acquisition service. The purchase price was allocated as follows: $44.1 million to identified intangible assets, $10.5 million to net assets acquired, $3.3 million to net deferred tax liability, with the excess $252.5 million of the purchase price over the fair value of net tangible and intangible assets acquired recorded as goodwill, allocated to our one operating segment. Goodwill is primarily attributable to the value expected from the synergies of the combination, including combined selling opportunities with our products. This goodwill is not deductible for income tax purposes. The results of operations of Phantom, which are not material, have been included in our consolidated financial statements from the date of purchase. Additionally, we recognized $3.3 million of acquisition-related costs in “General and administrative” expense on our consolidated statements of operations.
The following table sets forth the components of identifiable intangible assets acquired and their estimated useful lives as of the date of acquisition:
(In thousands, except useful life) Fair Value Useful Life (in months)
Developed technology $ 34,400 84Customer relationships 9,700 60
Total intangible assets acquired $ 44,100
VictorOps
On June 22, 2018, we acquired 100% of the voting equity interest of VictorOps, Inc. (“VictorOps”), a privately-held Delaware corporation that develops incident management solutions for the IT and DevOps markets. This acquisition has been accounted for as a business combination. The total fair value of consideration transferred for this acquisition was $112.3 million, which consisted of $108.8 million in cash and $3.5 million in fair value of replacement equity awards attributable to pre-acquisition service. The purchase price was allocated as follows: $21.1 million to identified intangible assets, $1.7 million to net assets acquired, with the excess $89.5 million of the purchase price over the fair value of net tangible and intangible assets acquired recorded as goodwill, allocated to our one operating segment. Goodwill is primarily attributable to the value expected from the synergies of the combination, including combined selling opportunities with our products. This goodwill is not deductible for income tax purposes. The results of operations of VictorOps, which are not material, have been included in our consolidated financial statements from the date of purchase. Additionally, we recognized $2.7 million of acquisition-related costs in “General and administrative” expense on our consolidated statements of operations.
The following table sets forth the components of identifiable intangible assets acquired and their estimated useful lives as of the date of acquisition:
(In thousands, except useful life) Fair Value Useful Life (in months)
Developed technology $ 11,700 84Customer relationships 9,400 60
Total intangible assets acquired $ 21,100
Unaudited Pro Forma Financial Information
The following unaudited pro forma information presents the combined results of operations as if the acquisitions of SignalFx, Omnition, VictorOps and Phantom had been completed in the beginning of the applicable comparable prior annual reporting period. The unaudited pro forma results include adjustments primarily related to the following: (i) amortization associated with preliminary estimates for the acquired intangible assets; (ii) recognition of post-acquisition stock-based compensation; (iii) the effect of recording deferred revenue at fair value; (iv) elimination of historical interest expense related to
NOTES TO CONSOLIDATED FINANCIAL STATEMENTS
93

debt extinguished in the acquisition of SignalFx; (v) the inclusion of acquisition costs as of the earliest period presented; and (vi) the associated tax impact of the acquisitions and these unaudited pro forma adjustments.
The unaudited pro forma results do not reflect any cost saving synergies from operating efficiencies or the effect of the incremental costs incurred from integrating these companies. Accordingly, these unaudited pro forma results are presented for informational purposes only and are not necessarily indicative of what the actual results of operations of the combined company would have been if the acquisitions had occurred at the beginning of the period presented, nor are they indicative of future results of operations:
Fiscal Year Ended January 31,(In thousands) 2020 2019
Revenues $ 2,376,181 $ 1,822,576 Net loss $ (434,998) $ (421,198)
Goodwill
Goodwill balances are presented below:
Fiscal Year Ended January 31,(In thousands) 2021 2020
Beginning balance $ 1,292,840 $ 503,388 Goodwill acquired 42,048 789,452 Ending balance $ 1,334,888 $ 1,292,840
There were no impairments to goodwill during fiscal 2021 or during prior periods.
Intangible Assets
Intangible assets subject to amortization as of January 31, 2021 are as follows:
(In thousands, except useful life)Gross Carrying
AmountAccumulated Amortization
Net Carrying Amount
Weighted-Average
Remaining Useful Life(in months)
Developed technology $ 273,349 $ (127,072) $ 146,277 57Customer relationships 86,310 (28,778) 57,532 41Other acquired intangible assets 7,420 (5,076) 2,344 19
Total intangible assets subject to amortization $ 367,079 $ (160,926) $ 206,153
Intangible assets subject to amortization as of January 31, 2020 are as follows:
(In thousands, except useful life)Gross Carrying
AmountAccumulated Amortization
Net Carrying Amount
Weighted-Average
Remaining Useful Life(in months)
Developed technology $ 252,530 $ (87,112) $ 165,418 68Customer relationships 81,810 (12,403) 69,407 53Other acquired intangible assets 7,270 (3,680) 3,590 32
Total intangible assets subject to amortization $ 341,610 $ (103,195) $ 238,415
Amortization expense from acquired intangible assets was $57.7 million, $38.5 million and $25.2 million during fiscal 2021, 2020 and 2019, respectively.
NOTES TO CONSOLIDATED FINANCIAL STATEMENTS
94
The expected future amortization expense for acquired intangible assets as of January 31, 2021 is as follows:
Fiscal Period (In thousands)Expected
Amortization ExpenseFiscal 2022 $ 54,179 Fiscal 2023 49,964 Fiscal 2024 43,408 Fiscal 2025 31,182 Fiscal 2026 17,058 Thereafter 10,362
Total amortization expense $ 206,153
(7) Convertible Senior Notes
Convertible Senior Notes Due 2027 On June 5, 2020, we issued $1.27 billion aggregate principal amount of 1.125% Convertible Senior Notes due 2027
(the “2027 Notes”), including the exercise in full by the initial purchasers of the 2027 Notes of their option to purchase an additional $165.0 million principal amount of 2027 Notes. The 2027 Notes are general senior, unsecured obligations of Splunk. The total proceeds from the issuance of the 2027 Notes was $1.25 billion, net of initial purchaser discounts and other issuance costs.
The 2027 Notes will mature on June 15, 2027, unless earlier redeemed, repurchased or converted. The 2027 Notes will bear interest from June 5, 2020 at a rate of 1.125% per year, payable semiannually in arrears on June 15 and December 15 of each year, beginning on December 15, 2020.
The initial conversion rate for the 2027 Notes is 3.9164 shares of our common stock per $1,000 principal amount of the 2027 Notes, which is equivalent to an initial conversion price of approximately $255.34 per share of our common stock, subject to adjustment upon the occurrence of certain specified events. The initial conversion price of the 2027 Notes represents a premium of approximately 35.0% to the volume weighted average price of our common stock on the Nasdaq Global Select Market of approximately $189.14 per share on June 2, 2020, which was the date the pricing of the 2027 Notes was determined.
Convertible Senior Notes Due 2023 and 2025 In September 2018, we issued $1.27 billion aggregate principal amount of 0.50% Convertible Senior Notes due 2023
(the “2023 Notes”), including the exercise in full by the initial purchasers of the 2023 Notes of their option to purchase an additional $165.0 million principal amount of 2023 Notes, and $862.5 million aggregate principal amount of 1.125% Convertible Senior Notes due 2025 (the “2025 Notes”), including the exercise in full by the initial purchasers of the 2025 Notes of their option to purchase an additional $112.5 million principal amount of 2025 Notes. The 2023 Notes and the 2025 Notes are general senior, unsecured obligations of Splunk. The total proceeds from the issuance of the 2023 Notes and the 2025 Notes was $2.11 billion, net of initial purchaser discounts and other issuance costs.
The 2023 Notes will mature on September 15, 2023, and the 2025 Notes will mature on September 15, 2025, in each case unless earlier redeemed, repurchased or converted. The 2023 Notes bear interest from September 21, 2018 at a rate of 0.50% per year and the 2025 Notes bear interest from September 21, 2018 at a rate of 1.125% per year, in each case payable semiannually in arrears on March 15 and September 15 of each year, beginning on March 15, 2019.
The initial conversion rate for each of the 2023 Notes and 2025 Notes is 6.7433 shares of our common stock per $1,000 principal amount of each of the 2023 Notes and 2025 Notes, which is equivalent to an initial conversion price of approximately $148.30 per share of our common stock, subject to adjustment upon the occurrence of certain specified events. The initial conversion price of each of the 2023 Notes and 2025 Notes represents a premium of approximately 27.5% to the $116.31 per share closing price of our common stock on September 18, 2018, which was the date the pricing of the 2023 Notes and the 2025 Notes was determined.
NOTES TO CONSOLIDATED FINANCIAL STATEMENTS
95

FOR
M 1
0-K
debt extinguished in the acquisition of SignalFx; (v) the inclusion of acquisition costs as of the earliest period presented; and (vi) the associated tax impact of the acquisitions and these unaudited pro forma adjustments.
The unaudited pro forma results do not reflect any cost saving synergies from operating efficiencies or the effect of the incremental costs incurred from integrating these companies. Accordingly, these unaudited pro forma results are presented for informational purposes only and are not necessarily indicative of what the actual results of operations of the combined company would have been if the acquisitions had occurred at the beginning of the period presented, nor are they indicative of future results of operations:
Fiscal Year Ended January 31,(In thousands) 2020 2019
Revenues $ 2,376,181 $ 1,822,576 Net loss $ (434,998) $ (421,198)
Goodwill
Goodwill balances are presented below:
Fiscal Year Ended January 31,(In thousands) 2021 2020
Beginning balance $ 1,292,840 $ 503,388 Goodwill acquired 42,048 789,452 Ending balance $ 1,334,888 $ 1,292,840
There were no impairments to goodwill during fiscal 2021 or during prior periods.
Intangible Assets
Intangible assets subject to amortization as of January 31, 2021 are as follows:
(In thousands, except useful life)Gross Carrying
AmountAccumulated Amortization
Net Carrying Amount
Weighted-Average
Remaining Useful Life(in months)
Developed technology $ 273,349 $ (127,072) $ 146,277 57Customer relationships 86,310 (28,778) 57,532 41Other acquired intangible assets 7,420 (5,076) 2,344 19
Total intangible assets subject to amortization $ 367,079 $ (160,926) $ 206,153
Intangible assets subject to amortization as of January 31, 2020 are as follows:
(In thousands, except useful life)Gross Carrying
AmountAccumulated Amortization
Net Carrying Amount
Weighted-Average
Remaining Useful Life(in months)
Developed technology $ 252,530 $ (87,112) $ 165,418 68Customer relationships 81,810 (12,403) 69,407 53Other acquired intangible assets 7,270 (3,680) 3,590 32
Total intangible assets subject to amortization $ 341,610 $ (103,195) $ 238,415
Amortization expense from acquired intangible assets was $57.7 million, $38.5 million and $25.2 million during fiscal 2021, 2020 and 2019, respectively.
NOTES TO CONSOLIDATED FINANCIAL STATEMENTS
94
The expected future amortization expense for acquired intangible assets as of January 31, 2021 is as follows:
Fiscal Period (In thousands)Expected
Amortization ExpenseFiscal 2022 $ 54,179 Fiscal 2023 49,964 Fiscal 2024 43,408 Fiscal 2025 31,182 Fiscal 2026 17,058 Thereafter 10,362
Total amortization expense $ 206,153
(7) Convertible Senior Notes
Convertible Senior Notes Due 2027 On June 5, 2020, we issued $1.27 billion aggregate principal amount of 1.125% Convertible Senior Notes due 2027
(the “2027 Notes”), including the exercise in full by the initial purchasers of the 2027 Notes of their option to purchase an additional $165.0 million principal amount of 2027 Notes. The 2027 Notes are general senior, unsecured obligations of Splunk. The total proceeds from the issuance of the 2027 Notes was $1.25 billion, net of initial purchaser discounts and other issuance costs.
The 2027 Notes will mature on June 15, 2027, unless earlier redeemed, repurchased or converted. The 2027 Notes will bear interest from June 5, 2020 at a rate of 1.125% per year, payable semiannually in arrears on June 15 and December 15 of each year, beginning on December 15, 2020.
The initial conversion rate for the 2027 Notes is 3.9164 shares of our common stock per $1,000 principal amount of the 2027 Notes, which is equivalent to an initial conversion price of approximately $255.34 per share of our common stock, subject to adjustment upon the occurrence of certain specified events. The initial conversion price of the 2027 Notes represents a premium of approximately 35.0% to the volume weighted average price of our common stock on the Nasdaq Global Select Market of approximately $189.14 per share on June 2, 2020, which was the date the pricing of the 2027 Notes was determined.
Convertible Senior Notes Due 2023 and 2025 In September 2018, we issued $1.27 billion aggregate principal amount of 0.50% Convertible Senior Notes due 2023
(the “2023 Notes”), including the exercise in full by the initial purchasers of the 2023 Notes of their option to purchase an additional $165.0 million principal amount of 2023 Notes, and $862.5 million aggregate principal amount of 1.125% Convertible Senior Notes due 2025 (the “2025 Notes”), including the exercise in full by the initial purchasers of the 2025 Notes of their option to purchase an additional $112.5 million principal amount of 2025 Notes. The 2023 Notes and the 2025 Notes are general senior, unsecured obligations of Splunk. The total proceeds from the issuance of the 2023 Notes and the 2025 Notes was $2.11 billion, net of initial purchaser discounts and other issuance costs.
The 2023 Notes will mature on September 15, 2023, and the 2025 Notes will mature on September 15, 2025, in each case unless earlier redeemed, repurchased or converted. The 2023 Notes bear interest from September 21, 2018 at a rate of 0.50% per year and the 2025 Notes bear interest from September 21, 2018 at a rate of 1.125% per year, in each case payable semiannually in arrears on March 15 and September 15 of each year, beginning on March 15, 2019.
The initial conversion rate for each of the 2023 Notes and 2025 Notes is 6.7433 shares of our common stock per $1,000 principal amount of each of the 2023 Notes and 2025 Notes, which is equivalent to an initial conversion price of approximately $148.30 per share of our common stock, subject to adjustment upon the occurrence of certain specified events. The initial conversion price of each of the 2023 Notes and 2025 Notes represents a premium of approximately 27.5% to the $116.31 per share closing price of our common stock on September 18, 2018, which was the date the pricing of the 2023 Notes and the 2025 Notes was determined.
NOTES TO CONSOLIDATED FINANCIAL STATEMENTS
95

Other Terms of the Notes
The 2023 Notes, 2025 Notes and 2027 Notes (together the “Notes”) will be convertible at the option of the holders at any time prior to the close of business on the business day immediately preceding June 15, 2023, June 15, 2025 and December 15, 2026 for the 2023 Notes, 2025 Notes and 2027 Notes, respectively, only under the following circumstances:
• during any fiscal quarter commencing after the fiscal quarter ending on January 31, 2019 (and only during such fiscal quarter) for the 2023 Notes and the 2025 Notes and October 31, 2020 (and only during such fiscal quarter) for the 2027 Notes, if the last reported sale price of our common stock for at least 20 trading days (whether or not consecutive) during a period of 30 consecutive trading days ending on, and including, the last trading day of the immediately preceding fiscal quarter is greater than or equal to 130% of the conversion price for the relevant series of Notes on each applicable trading day;
• during the five business day period after any 10 consecutive trading day period (the “measurement period”) in which the trading price (as defined in the indenture governing the relevant series of Notes) per $1,000 principal amount of the relevant series of Notes for each trading day of the measurement period was less than 98% of the product of the last reported sale price of our common stock and the conversion rate for the relevant series of Notes on each such trading day;
• if we call the relevant series of Notes for redemption, at any time prior to the close of business on the scheduled trading day immediately preceding the redemption date; or
• upon the occurrence of specified corporate events as set forth in the relevant indenture.
On or after June 15, 2023, June 15, 2025 and December 15, 2026 for the 2023 Notes, 2025 Notes and 2027 Notes, respectively, until the close of business on the second scheduled trading day immediately preceding the relevant maturity date, holders of the relevant series of Notes may convert all or any portion of their Notes of such series, in multiples of $1,000 principal amount, regardless of the foregoing circumstances.
Upon conversion, we may satisfy our conversion obligation by paying and/or delivering, as the case may be, cash, shares of our common stock or a combination of cash and shares of our common stock, at our election, in the manner and subject to the terms and conditions provided in the relevant indenture. Upon any conversion of the Notes of a series, it is our current intent to settle the first $1,000 of conversion value of each $1,000 principal amount of such Notes in cash and the remaining conversion value, if any, in shares of common stock. If we undergo a fundamental change (as defined in the applicable indenture governing the relevant series of Notes), holders may require us to repurchase for cash all or any portion of their Notes of the relevant series at a fundamental change repurchase price equal to 100% of the principal amount of the relevant series of Notes to be repurchased, plus accrued and unpaid interest to, but excluding, the fundamental change repurchase date. In addition, following certain corporate events that occur prior to the relevant maturity date of a series of Notes or if we deliver a notice of redemption in respect of a series of Notes, we will, in certain circumstances, increase the conversion rate of the relevant series of Notes for a holder of such series who elects to convert its Notes of the applicable series in connection with such corporate event or notice of redemption, as the case may be. During the three months ended January 31, 2021, the conditions allowing holders of the Notes to convert were not met. The Notes are therefore not convertible and were classified as long-term debt on our consolidated balance sheet as of January 31, 2021.
We may not redeem the 2023 Notes, 2025 Notes and 2027 Notes prior to September 20, 2021, September 20, 2022 and June 20, 2024, respectively. We may redeem for cash all or any portion of the 2023 Notes, 2025 Notes and 2027 Notes, at our option, on or after September 20, 2021, September 20, 2022, and June 20, 2024, respectively, in each case if the last reported sale price of our common stock has been at least 130% of the conversion price for the relevant series of Notes then in effect for at least 20 trading days (whether or not consecutive) during any 30 consecutive trading day period (including the last trading day of such period) ending on, and including, the trading day immediately preceding the date on which we provide notice of redemption at a redemption price equal to 100% of the principal amount of the relevant series of Notes to be redeemed, plus accrued and unpaid interest to, but excluding, the relevant redemption date.
Partial Repurchase of the 2023 Notes
On June 5, 2020, we used a portion of the net proceeds from the issuance of the 2027 Notes to repurchase $488.3 million aggregate principal amount of the 2023 Notes (the “2023 Notes Partial Repurchase”), leaving $776.7 million aggregate principal outstanding on the 2023 Notes immediately after the 2023 Notes Partial Repurchase. The 2023 Notes Partial
NOTES TO CONSOLIDATED FINANCIAL STATEMENTS
96
Repurchase was not made pursuant to a redemption notice and constituted individually privately negotiated transactions. The holders of the repurchased 2023 Notes also invested in the 2027 Notes. For each holder, the 2023 Notes and the 2027 Notes exchanged were deemed to be substantially different as the present value of the cash flows under the terms of the 2027 Notes was at least 10% different from the present value of the remaining cash flows under the terms of the 2023 Notes and accordingly, the 2023 Notes Partial Repurchase was accounted for as a debt extinguishment. We used $691.6 million of the net proceeds from the issuance of the 2027 Notes to complete the 2023 Notes Partial Repurchase, of which $407.4 million and $283.6 million were allocated to the liability and equity components of the 2023 Notes, respectively, and $0.5 million was related to the payment of the interest accrued.
Accounting for the Notes
In accounting for the issuance of the Notes, we separated each series of the Notes into their respective liability and equity components. The carrying amounts of the liability components of the respective Notes were calculated by measuring the fair value of similar debt instruments that do not have an associated convertible feature. The carrying amounts of the equity components, representing the conversion option, were determined by deducting the fair value of the liability components from the par value of the respective Notes. This difference represents the debt discount that is amortized to interest expense over the respective terms of the relevant series of Notes using the effective interest rate method. The carrying amounts of the equity components representing the conversion options were $266.9 million, $237.2 million and $347.4 million for the 2023 Notes, the 2025 Notes and the 2027 Notes, respectively, which are recorded in additional paid-in capital and are not remeasured as long as they continue to meet the conditions for equity classification.
In accounting for the issuance costs related to the Notes, which includes initial purchaser discounts, we allocated the total amount incurred for the relevant series of the Notes to the liability and equity components based on the proportion of the proceeds allocated to the debt and equity components for that series. Issuance costs attributable to the liability component of the 2023 Notes, the 2025 Notes and the 2027 Notes were $10.4 million, $6.5 million and $14.2 million, respectively. The issuance costs allocated to the liability component are amortized to interest expense over the contractual terms of the 2023 Notes, the 2025 Notes and the 2027 Notes at an effective interest rate of 5.65%, 6.22% and 6.26%, respectively. Issuance costs attributable to the equity component of the 2023 Notes, the 2025 Notes and the 2027 Notes were $2.8 million, $2.5 million and $5.4 million, respectively, and are netted against the equity components representing the conversion option in additional paid-in capital.
The cash consideration of the 2023 Notes Partial Repurchase allocated to the liability component of the 2023 Notes was based on the fair value of the liability component of the 2023 Notes as of June 5, 2020 utilizing an effective discount rate of 6.25%. This rate was based on our estimated rate for a similar liability with the same maturity, but without the conversion option. To derive this effective discount rate, we observed the trading details of the 2023 Notes immediately prior to the repurchase date to determine the volatility of the 2023 Notes. We utilized the observed volatility to calculate the effective discount rate, which was adjusted to reflect the term of the remaining 2023 Notes. The cash consideration allocated to the equity component of the 2023 Notes was calculated by deducting the fair value of the liability component from the aggregate cash consideration and was recorded as a reduction to “Additional paid-in capital.” The gain on extinguishment was subsequently determined by comparing the allocated cash consideration with the carrying value of the liability component, which includes the proportionate amounts of unamortized debt discount and the remaining unamortized debt issuance costs.
The net carrying amount of the liability component of the 2023 Notes immediately prior to the repurchase was as follows:
June 5, 2020
(In thousands) 2023 Notes Total2023 Notes Partial
Repurchase
Principal $ 1,265,000 $ 488,339 Unamortized debt discount (184,336) (71,161) Unamortized debt issuance costs (7,194) (2,777)
Net carrying amount $ 1,073,470 $ 414,401
NOTES TO CONSOLIDATED FINANCIAL STATEMENTS
97
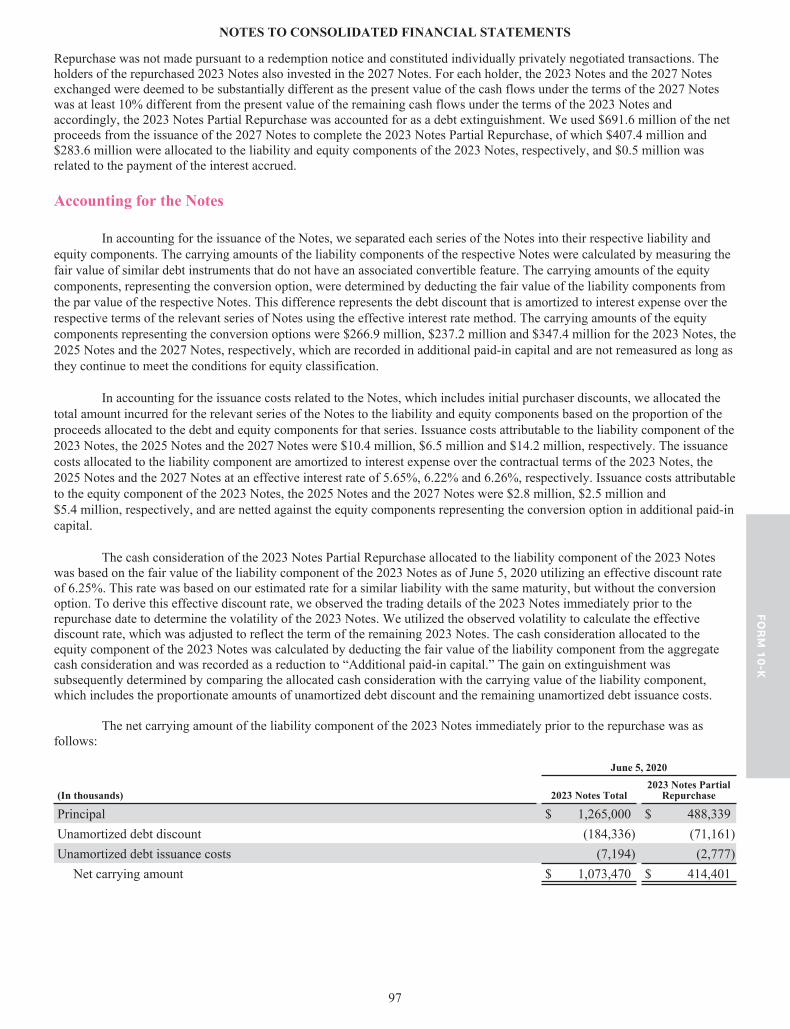
FOR
M 1
0-K
Other Terms of the Notes
The 2023 Notes, 2025 Notes and 2027 Notes (together the “Notes”) will be convertible at the option of the holders at any time prior to the close of business on the business day immediately preceding June 15, 2023, June 15, 2025 and December 15, 2026 for the 2023 Notes, 2025 Notes and 2027 Notes, respectively, only under the following circumstances:
• during any fiscal quarter commencing after the fiscal quarter ending on January 31, 2019 (and only during such fiscal quarter) for the 2023 Notes and the 2025 Notes and October 31, 2020 (and only during such fiscal quarter) for the 2027 Notes, if the last reported sale price of our common stock for at least 20 trading days (whether or not consecutive) during a period of 30 consecutive trading days ending on, and including, the last trading day of the immediately preceding fiscal quarter is greater than or equal to 130% of the conversion price for the relevant series of Notes on each applicable trading day;
• during the five business day period after any 10 consecutive trading day period (the “measurement period”) in which the trading price (as defined in the indenture governing the relevant series of Notes) per $1,000 principal amount of the relevant series of Notes for each trading day of the measurement period was less than 98% of the product of the last reported sale price of our common stock and the conversion rate for the relevant series of Notes on each such trading day;
• if we call the relevant series of Notes for redemption, at any time prior to the close of business on the scheduled trading day immediately preceding the redemption date; or
• upon the occurrence of specified corporate events as set forth in the relevant indenture.
On or after June 15, 2023, June 15, 2025 and December 15, 2026 for the 2023 Notes, 2025 Notes and 2027 Notes, respectively, until the close of business on the second scheduled trading day immediately preceding the relevant maturity date, holders of the relevant series of Notes may convert all or any portion of their Notes of such series, in multiples of $1,000 principal amount, regardless of the foregoing circumstances.
Upon conversion, we may satisfy our conversion obligation by paying and/or delivering, as the case may be, cash, shares of our common stock or a combination of cash and shares of our common stock, at our election, in the manner and subject to the terms and conditions provided in the relevant indenture. Upon any conversion of the Notes of a series, it is our current intent to settle the first $1,000 of conversion value of each $1,000 principal amount of such Notes in cash and the remaining conversion value, if any, in shares of common stock. If we undergo a fundamental change (as defined in the applicable indenture governing the relevant series of Notes), holders may require us to repurchase for cash all or any portion of their Notes of the relevant series at a fundamental change repurchase price equal to 100% of the principal amount of the relevant series of Notes to be repurchased, plus accrued and unpaid interest to, but excluding, the fundamental change repurchase date. In addition, following certain corporate events that occur prior to the relevant maturity date of a series of Notes or if we deliver a notice of redemption in respect of a series of Notes, we will, in certain circumstances, increase the conversion rate of the relevant series of Notes for a holder of such series who elects to convert its Notes of the applicable series in connection with such corporate event or notice of redemption, as the case may be. During the three months ended January 31, 2021, the conditions allowing holders of the Notes to convert were not met. The Notes are therefore not convertible and were classified as long-term debt on our consolidated balance sheet as of January 31, 2021.
We may not redeem the 2023 Notes, 2025 Notes and 2027 Notes prior to September 20, 2021, September 20, 2022 and June 20, 2024, respectively. We may redeem for cash all or any portion of the 2023 Notes, 2025 Notes and 2027 Notes, at our option, on or after September 20, 2021, September 20, 2022, and June 20, 2024, respectively, in each case if the last reported sale price of our common stock has been at least 130% of the conversion price for the relevant series of Notes then in effect for at least 20 trading days (whether or not consecutive) during any 30 consecutive trading day period (including the last trading day of such period) ending on, and including, the trading day immediately preceding the date on which we provide notice of redemption at a redemption price equal to 100% of the principal amount of the relevant series of Notes to be redeemed, plus accrued and unpaid interest to, but excluding, the relevant redemption date.
Partial Repurchase of the 2023 Notes
On June 5, 2020, we used a portion of the net proceeds from the issuance of the 2027 Notes to repurchase $488.3 million aggregate principal amount of the 2023 Notes (the “2023 Notes Partial Repurchase”), leaving $776.7 million aggregate principal outstanding on the 2023 Notes immediately after the 2023 Notes Partial Repurchase. The 2023 Notes Partial
NOTES TO CONSOLIDATED FINANCIAL STATEMENTS
96
Repurchase was not made pursuant to a redemption notice and constituted individually privately negotiated transactions. The holders of the repurchased 2023 Notes also invested in the 2027 Notes. For each holder, the 2023 Notes and the 2027 Notes exchanged were deemed to be substantially different as the present value of the cash flows under the terms of the 2027 Notes was at least 10% different from the present value of the remaining cash flows under the terms of the 2023 Notes and accordingly, the 2023 Notes Partial Repurchase was accounted for as a debt extinguishment. We used $691.6 million of the net proceeds from the issuance of the 2027 Notes to complete the 2023 Notes Partial Repurchase, of which $407.4 million and $283.6 million were allocated to the liability and equity components of the 2023 Notes, respectively, and $0.5 million was related to the payment of the interest accrued.
Accounting for the Notes
In accounting for the issuance of the Notes, we separated each series of the Notes into their respective liability and equity components. The carrying amounts of the liability components of the respective Notes were calculated by measuring the fair value of similar debt instruments that do not have an associated convertible feature. The carrying amounts of the equity components, representing the conversion option, were determined by deducting the fair value of the liability components from the par value of the respective Notes. This difference represents the debt discount that is amortized to interest expense over the respective terms of the relevant series of Notes using the effective interest rate method. The carrying amounts of the equity components representing the conversion options were $266.9 million, $237.2 million and $347.4 million for the 2023 Notes, the 2025 Notes and the 2027 Notes, respectively, which are recorded in additional paid-in capital and are not remeasured as long as they continue to meet the conditions for equity classification.
In accounting for the issuance costs related to the Notes, which includes initial purchaser discounts, we allocated the total amount incurred for the relevant series of the Notes to the liability and equity components based on the proportion of the proceeds allocated to the debt and equity components for that series. Issuance costs attributable to the liability component of the 2023 Notes, the 2025 Notes and the 2027 Notes were $10.4 million, $6.5 million and $14.2 million, respectively. The issuance costs allocated to the liability component are amortized to interest expense over the contractual terms of the 2023 Notes, the 2025 Notes and the 2027 Notes at an effective interest rate of 5.65%, 6.22% and 6.26%, respectively. Issuance costs attributable to the equity component of the 2023 Notes, the 2025 Notes and the 2027 Notes were $2.8 million, $2.5 million and $5.4 million, respectively, and are netted against the equity components representing the conversion option in additional paid-in capital.
The cash consideration of the 2023 Notes Partial Repurchase allocated to the liability component of the 2023 Notes was based on the fair value of the liability component of the 2023 Notes as of June 5, 2020 utilizing an effective discount rate of 6.25%. This rate was based on our estimated rate for a similar liability with the same maturity, but without the conversion option. To derive this effective discount rate, we observed the trading details of the 2023 Notes immediately prior to the repurchase date to determine the volatility of the 2023 Notes. We utilized the observed volatility to calculate the effective discount rate, which was adjusted to reflect the term of the remaining 2023 Notes. The cash consideration allocated to the equity component of the 2023 Notes was calculated by deducting the fair value of the liability component from the aggregate cash consideration and was recorded as a reduction to “Additional paid-in capital.” The gain on extinguishment was subsequently determined by comparing the allocated cash consideration with the carrying value of the liability component, which includes the proportionate amounts of unamortized debt discount and the remaining unamortized debt issuance costs.
The net carrying amount of the liability component of the 2023 Notes immediately prior to the repurchase was as follows:
June 5, 2020
(In thousands) 2023 Notes Total2023 Notes Partial
Repurchase
Principal $ 1,265,000 $ 488,339 Unamortized debt discount (184,336) (71,161) Unamortized debt issuance costs (7,194) (2,777)
Net carrying amount $ 1,073,470 $ 414,401
NOTES TO CONSOLIDATED FINANCIAL STATEMENTS
97

The 2023 Notes Partial Repurchase resulted in a gain on extinguishment of convertible senior notes, which is included in “Other income (expense), net” on our consolidated statements of operations, and was calculated as follows:
(In thousands)2023 Notes Partial
Repurchase
Net carrying amount of the liability component associated with the 2023 Notes Partial Repurchase $ 414,401 Less: Cash consideration allocated to the liability component (407,449)
Gain from the 2023 Notes Partial Repurchase $ 6,952
The net carrying amounts of the liability and equity components for each series of Notes as of January 31, 2021 was as follows:
(In thousands) 2023 Notes (1) 2025 Notes 2027 Notes
Liability component:Principal amount $ 776,661 $ 862,500 $ 1,265,000 Unamortized discount (91,717) (167,854) (320,695) Unamortized issuance costs (3,578) (4,619) (13,063)
Net carrying amount $ 681,366 $ 690,027 $ 931,242
Equity component, net of purchase discounts and issuance costs $ 264,129 $ 234,712 $ 342,062 _________________________(1) Reflects the impact of the 2023 Notes Partial Repurchase on June 5, 2020, as discussed below.
The following tables sets forth the interest expense related to each series of Notes:
Fiscal Year Ended January 31,(In thousands) 2021 2020
2023 Notes:Coupon interest expense $ 4,697 $ 6,324 Amortization of debt discount (conversion option) 38,215 48,767 Amortization of debt issuance costs 1,492 1,904
Total interest expense related to the 2023 Notes $ 44,404 $ 56,995
2025 Notes:Coupon interest expense $ 9,704 $ 9,704 Amortization of debt discount (conversion option) 30,615 28,697 Amortization of debt issuance costs 841 789
Total interest expense related to the 2025 Notes $ 41,160 $ 39,190
2027 Notes:Coupon interest expense $ 9,290 $ — Amortization of debt discount (conversion option) 26,724 — Amortization of debt issuance costs 1,089 —
Total interest expense related to the 2027 Notes $ 37,103 $ —
As of January 31, 2021, the total estimated fair values of the 2023 Notes, the 2025 Notes, and the 2027 Notes were approximately $1.02 billion, $1.14 billion and $1.33 billion, respectively. The fair value was determined based on the closing trading price per $100 of the respective series of Notes as of the last day of trading for the period. The fair value of the Notes is primarily affected by the trading price of our common stock and market interest rates. The fair value of the Notes is considered a Level 2 measurement as they are not actively traded.
Capped Calls
NOTES TO CONSOLIDATED FINANCIAL STATEMENTS
98
In connection with the issuance of the Notes, we entered into privately negotiated capped call transactions relating to each series of Notes with certain counterparties (the “Capped Calls”). The Capped Calls are expected to reduce potential dilution to our common stock upon conversion of the Notes of a given series and/or offset any cash payments that we are required to make in excess of the principal amount of converted Notes of such series, as the case may be, with such reduction and/or offset subject to a cap. The Capped Calls are subject to adjustment upon the occurrence of certain specified extraordinary events affecting us, including merger events, tender offers and announcement events. In addition, the Capped Calls are subject to certain specified additional disruption events that may give rise to a termination of the Capped Calls, including nationalization, insolvency or delisting, changes in law, failures to deliver, insolvency filings and hedging disruptions.
The following table sets forth other key terms and premiums paid for the Capped Calls related to each series of the Notes:
Capped Calls Entered into in
Connection with the Issuance of the 2023 and 2025 Notes
Capped Calls Entered into in
Connection with the Issuance of the 2027 Notes
Initial strike price, subject to certain adjustments $ 148.30 $ 255.34 Cap price, subject to certain adjustments $ 232.62 $ 378.28 Total premium paid (in thousands) $ 274,275 $ 137,379
For accounting purposes, the Capped Calls are separate transactions, and not part of the terms of any series of Notes. As the Capped Calls qualify for a scope exception from derivative accounting for instruments that are both indexed to the issuer’s own stock and classified in stockholders’ equity in its statement of financial position, the premium paid for the purchase of the Capped Calls has been recorded as a reduction to “Additional paid-in capital” and will not be remeasured.
(8) Stock Compensation Plans
Equity Incentive Plans In November 2003, our board adopted the 2003 Equity Incentive Plan (the “2003 Plan”). The 2003 Plan authorizes the
granting of common stock options and restricted stock awards to employees, directors and consultants. In January 2012, our board approved the 2012 Equity Incentive Plan (the “2012 Plan”), which became effective on
April 18, 2012. The 2012 Plan provides for the grant of incentive stock options, within the meaning of Section 422 of the Internal Revenue Code, to our employees and any parent and subsidiary corporations’ employees, and for the grant of nonstatutory stock options, restricted stock awards, restricted stock units, stock appreciation rights, performance units and performance shares to our employees, directors and consultants and any parent or subsidiary corporations’ employees and consultants. Upon the effectiveness of the 2012 plan, all shares that were reserved but not issued under the 2003 Plan became available for issuance under the 2012 Plan and no further shares will be granted pursuant to the 2003 Plan. Canceled or forfeited equity awards under the 2003 Plan will also become available for issuance under the 2012 Plan. The term of an incentive stock option may not exceed 10 years, except that with respect to any participant who owns more than 10% of the voting power of all classes or our outstanding stock, the term must not exceed 5 years. Options and RSUs generally vest over 4 years.
The 2012 plan provides for annual automatic increases on February 1 to the shares reserved for issuance. The automatic increase of the number of shares available for issuance under the 2012 Plan is equal to the lesser of 10 million shares, 5% of the outstanding shares of common stock as of the last day of our immediately preceding fiscal year or such other amount as our board may determine.
NOTES TO CONSOLIDATED FINANCIAL STATEMENTS
99

FOR
M 1
0-K
The 2023 Notes Partial Repurchase resulted in a gain on extinguishment of convertible senior notes, which is included in “Other income (expense), net” on our consolidated statements of operations, and was calculated as follows:
(In thousands)2023 Notes Partial
Repurchase
Net carrying amount of the liability component associated with the 2023 Notes Partial Repurchase $ 414,401 Less: Cash consideration allocated to the liability component (407,449)
Gain from the 2023 Notes Partial Repurchase $ 6,952
The net carrying amounts of the liability and equity components for each series of Notes as of January 31, 2021 was as follows:
(In thousands) 2023 Notes (1) 2025 Notes 2027 Notes
Liability component:Principal amount $ 776,661 $ 862,500 $ 1,265,000 Unamortized discount (91,717) (167,854) (320,695) Unamortized issuance costs (3,578) (4,619) (13,063)
Net carrying amount $ 681,366 $ 690,027 $ 931,242
Equity component, net of purchase discounts and issuance costs $ 264,129 $ 234,712 $ 342,062 _________________________(1) Reflects the impact of the 2023 Notes Partial Repurchase on June 5, 2020, as discussed below.
The following tables sets forth the interest expense related to each series of Notes:
Fiscal Year Ended January 31,(In thousands) 2021 2020
2023 Notes:Coupon interest expense $ 4,697 $ 6,324 Amortization of debt discount (conversion option) 38,215 48,767 Amortization of debt issuance costs 1,492 1,904
Total interest expense related to the 2023 Notes $ 44,404 $ 56,995
2025 Notes:Coupon interest expense $ 9,704 $ 9,704 Amortization of debt discount (conversion option) 30,615 28,697 Amortization of debt issuance costs 841 789
Total interest expense related to the 2025 Notes $ 41,160 $ 39,190
2027 Notes:Coupon interest expense $ 9,290 $ — Amortization of debt discount (conversion option) 26,724 — Amortization of debt issuance costs 1,089 —
Total interest expense related to the 2027 Notes $ 37,103 $ —
As of January 31, 2021, the total estimated fair values of the 2023 Notes, the 2025 Notes, and the 2027 Notes were approximately $1.02 billion, $1.14 billion and $1.33 billion, respectively. The fair value was determined based on the closing trading price per $100 of the respective series of Notes as of the last day of trading for the period. The fair value of the Notes is primarily affected by the trading price of our common stock and market interest rates. The fair value of the Notes is considered a Level 2 measurement as they are not actively traded.
Capped Calls
NOTES TO CONSOLIDATED FINANCIAL STATEMENTS
98
In connection with the issuance of the Notes, we entered into privately negotiated capped call transactions relating to each series of Notes with certain counterparties (the “Capped Calls”). The Capped Calls are expected to reduce potential dilution to our common stock upon conversion of the Notes of a given series and/or offset any cash payments that we are required to make in excess of the principal amount of converted Notes of such series, as the case may be, with such reduction and/or offset subject to a cap. The Capped Calls are subject to adjustment upon the occurrence of certain specified extraordinary events affecting us, including merger events, tender offers and announcement events. In addition, the Capped Calls are subject to certain specified additional disruption events that may give rise to a termination of the Capped Calls, including nationalization, insolvency or delisting, changes in law, failures to deliver, insolvency filings and hedging disruptions.
The following table sets forth other key terms and premiums paid for the Capped Calls related to each series of the Notes:
Capped Calls Entered into in
Connection with the Issuance of the 2023 and 2025 Notes
Capped Calls Entered into in
Connection with the Issuance of the 2027 Notes
Initial strike price, subject to certain adjustments $ 148.30 $ 255.34 Cap price, subject to certain adjustments $ 232.62 $ 378.28 Total premium paid (in thousands) $ 274,275 $ 137,379
For accounting purposes, the Capped Calls are separate transactions, and not part of the terms of any series of Notes. As the Capped Calls qualify for a scope exception from derivative accounting for instruments that are both indexed to the issuer’s own stock and classified in stockholders’ equity in its statement of financial position, the premium paid for the purchase of the Capped Calls has been recorded as a reduction to “Additional paid-in capital” and will not be remeasured.
(8) Stock Compensation Plans
Equity Incentive Plans In November 2003, our board adopted the 2003 Equity Incentive Plan (the “2003 Plan”). The 2003 Plan authorizes the
granting of common stock options and restricted stock awards to employees, directors and consultants. In January 2012, our board approved the 2012 Equity Incentive Plan (the “2012 Plan”), which became effective on
April 18, 2012. The 2012 Plan provides for the grant of incentive stock options, within the meaning of Section 422 of the Internal Revenue Code, to our employees and any parent and subsidiary corporations’ employees, and for the grant of nonstatutory stock options, restricted stock awards, restricted stock units, stock appreciation rights, performance units and performance shares to our employees, directors and consultants and any parent or subsidiary corporations’ employees and consultants. Upon the effectiveness of the 2012 plan, all shares that were reserved but not issued under the 2003 Plan became available for issuance under the 2012 Plan and no further shares will be granted pursuant to the 2003 Plan. Canceled or forfeited equity awards under the 2003 Plan will also become available for issuance under the 2012 Plan. The term of an incentive stock option may not exceed 10 years, except that with respect to any participant who owns more than 10% of the voting power of all classes or our outstanding stock, the term must not exceed 5 years. Options and RSUs generally vest over 4 years.
The 2012 plan provides for annual automatic increases on February 1 to the shares reserved for issuance. The automatic increase of the number of shares available for issuance under the 2012 Plan is equal to the lesser of 10 million shares, 5% of the outstanding shares of common stock as of the last day of our immediately preceding fiscal year or such other amount as our board may determine.
NOTES TO CONSOLIDATED FINANCIAL STATEMENTS
99

The following table summarizes the stock option, restricted stock unit (“RSU”) and performance unit (“PSU”) activity under our 2012 Equity Incentive Plan during the fiscal year ended January 31, 2021:
Options Outstanding
RSUs and PSUsOutstanding
Shares Availablefor Grant Shares
Weighted-AverageExercise
PricePer Share
Weighted-Average
RemainingContractual
Term
AggregateIntrinsicValue (1) Shares
(in years) (in thousands)
Balances as of January 31, 2020 19,328,502 823,541 $ 10.79 6.61 $ 118,978 13,141,650 Additional shares authorized 7,889,377 Options granted (2) (2,155) 2,155 22.30 Options exercised (352,910) 9.84 Options forfeited and expired 54,043 (54,043) 12.94 RSUs and PSUs granted (3) (5,146,232) 5,146,232 RSUs and PSUs vested (5,220,615) Shares withheld related to net share settlement of RSUs and PSUs 969,778 RSUs and PSUs forfeited and canceled 1,830,364 (1,830,364) Balances as of January 31, 2021 24,923,677 418,743 $ 11.37 5.85 $ 64,342 11,236,903 Vested and expected to vest 409,292 $ 11.37 5.80 $ 62,891 10,466,093 Exercisable as of January 31, 2021 191,203 $ 11.28 3.66 $ 29,398
_________________________(1) The intrinsic value is calculated as the difference between the exercise price of the underlying stock option award and the closing market
price of our common stock as of January 31, 2021.(2) All options granted during fiscal 2021 were equity awards assumed in connection with our acquisitions.(3) 101,449 RSUs were granted to new employees hired in connection with our fiscal 2021 acquisitions.
During a portion of fiscal 2021, upon each settlement date of our outstanding RSUs to current employees, RSUs were withheld to cover the required withholding tax, which was based on the value of the RSU on the settlement date as determined by the closing price of our common stock on the trading day of the applicable settlement date. The remaining shares were delivered to the recipient as shares of our common stock. The amount remitted to the tax authorities for the employees’ tax obligation was reflected as a financing activity on our consolidated statements of cash flows. These shares withheld by us as a result of the net settlement of RSUs were not considered issued and outstanding, thereby reducing our shares outstanding used to calculate earnings per share. These shares were returned to the reserves and are available for future issuance under our 2012 Equity Incentive Plan. During fiscal 2021 we also required that employees sell a portion of the shares that they receive upon the vesting of RSUs in order to cover any required withholding taxes.
During fiscal 2021, we granted 318,514 PSUs to certain executives under our 2012 Equity Incentive Plan, which includes both PSUs awarded but not yet earned, as well as PSUs earned and eligible to vest. The number of PSUs earned and eligible to vest will be determined after a one-year performance period, based on achievement of certain company financial performance measures and the recipient’s continued service with us. The number of shares of our stock to be received based on financial performance measures can range from 0% to 200% of the target amount. Compensation expense for PSUs with financial performance measures is measured using the fair value at the date of grant and recorded over the four-year vesting period under the graded-vesting attribution method, and may be adjusted over the vesting period based on interim estimates of performance against the pre-set objectives. Additionally, beginning in fiscal 2019, our PSUs granted contain an additional market performance measure that can increase the number of shares earned by up to an additional 50% of the shares received based on the financial performance measure.
On October 27, 2020, the Compensation Committee of our Board of Directors approved a modification to the performance thresholds of our fiscal 2021 PSU awards. We accounted for this change as a Type III modification under ASC 718 as the expectation of the achievement of certain performance conditions related to these awards changed from improbable to probable post-modification. As a result, we reversed $10.8 million of stock-based compensation expense previously recognized for these awards, during fiscal 2021. Post-modification stock-based compensation expense related to these awards
NOTES TO CONSOLIDATED FINANCIAL STATEMENTS
100
will be recognized based on the modification date fair value over their remaining service period, under the graded-vesting attribution method.
The following table presents unrecognized compensation cost related to stock options, RSUs, PSUs and restricted stock awards (“RSA”) as of January 31, 2021:
Unrecognized Compensation Cost
(in thousands)
Weighted-Average Remaining
Contractual Term(in years)
Stock options $ 22,278 1.6RSUs 1,256,861 2.8PSUs 56,663 1.1RSAs 46,026 2.0
Total unrecognized compensation cost $ 1,381,828
The following table summarizes our RSA activity during the fiscal year ended January 31, 2021:
Shares
Outstanding as of January 31, 2020 857,793 RSAs issued (1) 79,747 RSAs vested (450,740) RSAs forfeited and canceled (1,117) Outstanding as of January 31, 2021 485,683
_________________________(1) All RSAs issued during fiscal 2021 were equity awards assumed in connection with our acquisitions.
The aggregate intrinsic value of options exercised was $52.6 million, $43.7 million and $27.0 million for fiscal 2021, 2020 and 2019, respectively. The weighted-average grant date fair value of options granted was $134.26, $106.85 and $83.96 per share for fiscal 2021, 2020 and 2019, respectively.
The aggregate intrinsic value of RSUs vested was $771.3 million, $629.9 million and $537.7 million for fiscal 2021, 2020 and 2019, respectively. The weighted-average grant date fair value of RSUs granted was $161.64, $135.39 and $108.57 per share for fiscal 2021, 2020 and 2019, respectively.
The weighted-average grant date fair value of PSUs granted was $197.55, $166.57 and $86.55 per share for fiscal 2021, 2020 and 2019, respectively.
The weighted-average grant date fair value of RSAs issued was $175.98, $115.53 and $79.07 per share for fiscal 2021, 2020 and 2019, respectively.
Employee Stock Purchase Plan
Our 2012 Employee Stock Purchase Plan (the “ESPP”) allows eligible employees to purchase shares of our common stock at a discount through payroll deductions of up to 15% of their eligible compensation, at not less than 85% of the fair market value, as defined in the ESPP, subject to any plan limitations. The ESPP provides for consecutive 12-month offering periods, starting on the first trading day on or after June 15 and December 15 of each year. The ESPP provides for an automatic increase of the number of shares available for issuance under the ESPP equal to the least of 4 million shares, 2% of the outstanding shares of our common stock on the last day of the immediately preceding fiscal year, or such other amount as may be determined by our board of directors.
NOTES TO CONSOLIDATED FINANCIAL STATEMENTS
101

FOR
M 1
0-K
The following table summarizes the stock option, restricted stock unit (“RSU”) and performance unit (“PSU”) activity under our 2012 Equity Incentive Plan during the fiscal year ended January 31, 2021:
Options Outstanding
RSUs and PSUsOutstanding
Shares Availablefor Grant Shares
Weighted-AverageExercise
PricePer Share
Weighted-Average
RemainingContractual
Term
AggregateIntrinsicValue (1) Shares
(in years) (in thousands)
Balances as of January 31, 2020 19,328,502 823,541 $ 10.79 6.61 $ 118,978 13,141,650 Additional shares authorized 7,889,377 Options granted (2) (2,155) 2,155 22.30 Options exercised (352,910) 9.84 Options forfeited and expired 54,043 (54,043) 12.94 RSUs and PSUs granted (3) (5,146,232) 5,146,232 RSUs and PSUs vested (5,220,615) Shares withheld related to net share settlement of RSUs and PSUs 969,778 RSUs and PSUs forfeited and canceled 1,830,364 (1,830,364) Balances as of January 31, 2021 24,923,677 418,743 $ 11.37 5.85 $ 64,342 11,236,903 Vested and expected to vest 409,292 $ 11.37 5.80 $ 62,891 10,466,093 Exercisable as of January 31, 2021 191,203 $ 11.28 3.66 $ 29,398
_________________________(1) The intrinsic value is calculated as the difference between the exercise price of the underlying stock option award and the closing market
price of our common stock as of January 31, 2021.(2) All options granted during fiscal 2021 were equity awards assumed in connection with our acquisitions.(3) 101,449 RSUs were granted to new employees hired in connection with our fiscal 2021 acquisitions.
During a portion of fiscal 2021, upon each settlement date of our outstanding RSUs to current employees, RSUs were withheld to cover the required withholding tax, which was based on the value of the RSU on the settlement date as determined by the closing price of our common stock on the trading day of the applicable settlement date. The remaining shares were delivered to the recipient as shares of our common stock. The amount remitted to the tax authorities for the employees’ tax obligation was reflected as a financing activity on our consolidated statements of cash flows. These shares withheld by us as a result of the net settlement of RSUs were not considered issued and outstanding, thereby reducing our shares outstanding used to calculate earnings per share. These shares were returned to the reserves and are available for future issuance under our 2012 Equity Incentive Plan. During fiscal 2021 we also required that employees sell a portion of the shares that they receive upon the vesting of RSUs in order to cover any required withholding taxes.
During fiscal 2021, we granted 318,514 PSUs to certain executives under our 2012 Equity Incentive Plan, which includes both PSUs awarded but not yet earned, as well as PSUs earned and eligible to vest. The number of PSUs earned and eligible to vest will be determined after a one-year performance period, based on achievement of certain company financial performance measures and the recipient’s continued service with us. The number of shares of our stock to be received based on financial performance measures can range from 0% to 200% of the target amount. Compensation expense for PSUs with financial performance measures is measured using the fair value at the date of grant and recorded over the four-year vesting period under the graded-vesting attribution method, and may be adjusted over the vesting period based on interim estimates of performance against the pre-set objectives. Additionally, beginning in fiscal 2019, our PSUs granted contain an additional market performance measure that can increase the number of shares earned by up to an additional 50% of the shares received based on the financial performance measure.
On October 27, 2020, the Compensation Committee of our Board of Directors approved a modification to the performance thresholds of our fiscal 2021 PSU awards. We accounted for this change as a Type III modification under ASC 718 as the expectation of the achievement of certain performance conditions related to these awards changed from improbable to probable post-modification. As a result, we reversed $10.8 million of stock-based compensation expense previously recognized for these awards, during fiscal 2021. Post-modification stock-based compensation expense related to these awards
NOTES TO CONSOLIDATED FINANCIAL STATEMENTS
100
will be recognized based on the modification date fair value over their remaining service period, under the graded-vesting attribution method.
The following table presents unrecognized compensation cost related to stock options, RSUs, PSUs and restricted stock awards (“RSA”) as of January 31, 2021:
Unrecognized Compensation Cost
(in thousands)
Weighted-Average Remaining
Contractual Term(in years)
Stock options $ 22,278 1.6RSUs 1,256,861 2.8PSUs 56,663 1.1RSAs 46,026 2.0
Total unrecognized compensation cost $ 1,381,828
The following table summarizes our RSA activity during the fiscal year ended January 31, 2021:
Shares
Outstanding as of January 31, 2020 857,793 RSAs issued (1) 79,747 RSAs vested (450,740) RSAs forfeited and canceled (1,117) Outstanding as of January 31, 2021 485,683
_________________________(1) All RSAs issued during fiscal 2021 were equity awards assumed in connection with our acquisitions.
The aggregate intrinsic value of options exercised was $52.6 million, $43.7 million and $27.0 million for fiscal 2021, 2020 and 2019, respectively. The weighted-average grant date fair value of options granted was $134.26, $106.85 and $83.96 per share for fiscal 2021, 2020 and 2019, respectively.
The aggregate intrinsic value of RSUs vested was $771.3 million, $629.9 million and $537.7 million for fiscal 2021, 2020 and 2019, respectively. The weighted-average grant date fair value of RSUs granted was $161.64, $135.39 and $108.57 per share for fiscal 2021, 2020 and 2019, respectively.
The weighted-average grant date fair value of PSUs granted was $197.55, $166.57 and $86.55 per share for fiscal 2021, 2020 and 2019, respectively.
The weighted-average grant date fair value of RSAs issued was $175.98, $115.53 and $79.07 per share for fiscal 2021, 2020 and 2019, respectively.
Employee Stock Purchase Plan
Our 2012 Employee Stock Purchase Plan (the “ESPP”) allows eligible employees to purchase shares of our common stock at a discount through payroll deductions of up to 15% of their eligible compensation, at not less than 85% of the fair market value, as defined in the ESPP, subject to any plan limitations. The ESPP provides for consecutive 12-month offering periods, starting on the first trading day on or after June 15 and December 15 of each year. The ESPP provides for an automatic increase of the number of shares available for issuance under the ESPP equal to the least of 4 million shares, 2% of the outstanding shares of our common stock on the last day of the immediately preceding fiscal year, or such other amount as may be determined by our board of directors.
NOTES TO CONSOLIDATED FINANCIAL STATEMENTS
101

Stock-Based Compensation Expense
Stock-based compensation expense related to our stock-based awards and employee stock purchases was allocated as follows:
Fiscal Year Ended January 31,(In thousands) 2021 2020 2019
Cost of revenues $ 56,437 $ 44,399 $ 37,501 Research and development 271,120 185,262 137,171 Sales and marketing 198,346 216,276 190,422 General and administrative 92,752 99,487 76,836
Total stock-based compensation expense $ 618,655 $ 545,424 $ 441,930
We capitalized $8.0 million and $1.0 million of stock-based compensation for fiscal 2021 and 2020, respectively, related to our software development and implementation projects.
Valuation Assumptions
PSUs granted in fiscal 2021 and 2020 contain an additional market performance measure that can increase the number of shares earned. The following table summarizes the assumptions used in the Monte Carlo simulation model to determine the fair value of PSUs granted during the fiscal years ended January 31, 2021, 2020 and 2019:
Fiscal Year Ended January 31,2021 2020 2019
Expected volatility (1) 42.8 - 43.9% 37.9 - 40.2% 39.5 %Risk-free rate 0.2 - 0.6% 2.3 % 2.5 %Dividend yield — — — Expected term (in years) 3.4 - 4.0 4.0 4.0
_________________________(1) Equal weighting of Splunk historical and implied volatility.
The following table summarizes the assumptions used in the Black-Scholes method to determine the fair value of options granted during the fiscal years ended January 31, 2021, 2020 and 2019:
Fiscal Year Ended January 31,2021 2020 2019
Expected volatility 43.8 - 44.1% 38.5 - 42.8% 33.8 - 44.6%Risk-free rate 0.4 - 0.5% 1.5 - 1.8% 0.5 - 2.9%Dividend yield — — — Expected term (in years) 4.7 - 5.5 3.0 - 6.4 6.1
The following table summarizes the assumptions used in the Black-Scholes option-pricing model to determine the fair value of our common shares under the ESPP:
Fiscal Year Ended January 31,2021 2020 2019
Expected volatility 53.2 - 70.2% 37.4 - 46.6% 33.1 - 53.8%Risk-free rate 0.1 - 0.2% 1.6 - 2.0% 2.1 - 2.7%Dividend yield — — — Expected term (in years) 0.5 - 1.0 0.5 - 1.0 0.5 - 1.0
(9) Revenues, Accounts Receivable, Deferred Revenue and Remaining Performance Obligations
NOTES TO CONSOLIDATED FINANCIAL STATEMENTS
102
Disaggregation of Revenues
The following table presents disaggregated revenues by major product or service type:
Fiscal Year Ended January 31, (In thousands) 2021 2020 2019
RevenuesLicense $ 971,378 $ 1,373,367 $ 1,030,277 Cloud services 554,132 312,358 171,200 Maintenance, professional services and training 703,875 673,201 601,533
Total revenues $ 2,229,385 $ 2,358,926 $ 1,803,010
Revenues by geography are based on the shipping address of the customer. The following table presents our revenues by geographic region:
Fiscal Year Ended January 31, (In thousands) 2021 2020 2019
United States $ 1,467,260 $ 1,676,395 $ 1,274,361 International 762,125 682,531 528,649
Total revenues $ 2,229,385 $ 2,358,926 $ 1,803,010
Other than the United States, no other individual country exceeded 10% of total revenues during any of the periods presented.
The following table presents revenues by channel partners representing 10% or more of total revenues:
Fiscal Year Ended January 31, 2021 2020 2019
Channel Partner A 28 % 29 % 32 %Channel Partner B 13 % 19 % 18 %
The revenues from these channel partners are comprised of a number of customer transactions, none of which were individually greater than 10% of total revenues during fiscal 2021, 2020 or 2019.
Accounts Receivable
The following table presents total current and non-current accounts receivable by channel partners representing 10% or more of total current and non-current accounts receivable:
January 31, 2021 2020
Channel Partner A 26 % 27 %Channel Partner B 9 % 13 %
The COVID-19 pandemic and the recent economic downturn prompted us to perform additional credit reviews of our existing customers. After performing our additional reviews using a current expected credit loss model, we determined that, while there may be delays in certain of our collections, the risk of credit loss on our accounts receivable as of January 31, 2021 is low. As this is consistent with the results of our risk assessment prior to the adoption of the current expected credit loss model, no significant adjustments to our allowance for doubtful accounts were made.
Deferred Revenue
Revenues recognized from amounts included in deferred revenue as of January 31, 2020 and 2019 were $785.2 million and $633.2 million during fiscal 2021 and 2020, respectively.
NOTES TO CONSOLIDATED FINANCIAL STATEMENTS
103

FOR
M 1
0-K
Stock-Based Compensation Expense
Stock-based compensation expense related to our stock-based awards and employee stock purchases was allocated as follows:
Fiscal Year Ended January 31,(In thousands) 2021 2020 2019
Cost of revenues $ 56,437 $ 44,399 $ 37,501 Research and development 271,120 185,262 137,171 Sales and marketing 198,346 216,276 190,422 General and administrative 92,752 99,487 76,836
Total stock-based compensation expense $ 618,655 $ 545,424 $ 441,930
We capitalized $8.0 million and $1.0 million of stock-based compensation for fiscal 2021 and 2020, respectively, related to our software development and implementation projects.
Valuation Assumptions
PSUs granted in fiscal 2021 and 2020 contain an additional market performance measure that can increase the number of shares earned. The following table summarizes the assumptions used in the Monte Carlo simulation model to determine the fair value of PSUs granted during the fiscal years ended January 31, 2021, 2020 and 2019:
Fiscal Year Ended January 31,2021 2020 2019
Expected volatility (1) 42.8 - 43.9% 37.9 - 40.2% 39.5 %Risk-free rate 0.2 - 0.6% 2.3 % 2.5 %Dividend yield — — — Expected term (in years) 3.4 - 4.0 4.0 4.0
_________________________(1) Equal weighting of Splunk historical and implied volatility.
The following table summarizes the assumptions used in the Black-Scholes method to determine the fair value of options granted during the fiscal years ended January 31, 2021, 2020 and 2019:
Fiscal Year Ended January 31,2021 2020 2019
Expected volatility 43.8 - 44.1% 38.5 - 42.8% 33.8 - 44.6%Risk-free rate 0.4 - 0.5% 1.5 - 1.8% 0.5 - 2.9%Dividend yield — — — Expected term (in years) 4.7 - 5.5 3.0 - 6.4 6.1
The following table summarizes the assumptions used in the Black-Scholes option-pricing model to determine the fair value of our common shares under the ESPP:
Fiscal Year Ended January 31,2021 2020 2019
Expected volatility 53.2 - 70.2% 37.4 - 46.6% 33.1 - 53.8%Risk-free rate 0.1 - 0.2% 1.6 - 2.0% 2.1 - 2.7%Dividend yield — — — Expected term (in years) 0.5 - 1.0 0.5 - 1.0 0.5 - 1.0
(9) Revenues, Accounts Receivable, Deferred Revenue and Remaining Performance Obligations
NOTES TO CONSOLIDATED FINANCIAL STATEMENTS
102
Disaggregation of Revenues
The following table presents disaggregated revenues by major product or service type:
Fiscal Year Ended January 31, (In thousands) 2021 2020 2019
RevenuesLicense $ 971,378 $ 1,373,367 $ 1,030,277 Cloud services 554,132 312,358 171,200 Maintenance, professional services and training 703,875 673,201 601,533
Total revenues $ 2,229,385 $ 2,358,926 $ 1,803,010
Revenues by geography are based on the shipping address of the customer. The following table presents our revenues by geographic region:
Fiscal Year Ended January 31, (In thousands) 2021 2020 2019
United States $ 1,467,260 $ 1,676,395 $ 1,274,361 International 762,125 682,531 528,649
Total revenues $ 2,229,385 $ 2,358,926 $ 1,803,010
Other than the United States, no other individual country exceeded 10% of total revenues during any of the periods presented.
The following table presents revenues by channel partners representing 10% or more of total revenues:
Fiscal Year Ended January 31, 2021 2020 2019
Channel Partner A 28 % 29 % 32 %Channel Partner B 13 % 19 % 18 %
The revenues from these channel partners are comprised of a number of customer transactions, none of which were individually greater than 10% of total revenues during fiscal 2021, 2020 or 2019.
Accounts Receivable
The following table presents total current and non-current accounts receivable by channel partners representing 10% or more of total current and non-current accounts receivable:
January 31, 2021 2020
Channel Partner A 26 % 27 %Channel Partner B 9 % 13 %
The COVID-19 pandemic and the recent economic downturn prompted us to perform additional credit reviews of our existing customers. After performing our additional reviews using a current expected credit loss model, we determined that, while there may be delays in certain of our collections, the risk of credit loss on our accounts receivable as of January 31, 2021 is low. As this is consistent with the results of our risk assessment prior to the adoption of the current expected credit loss model, no significant adjustments to our allowance for doubtful accounts were made.
Deferred Revenue
Revenues recognized from amounts included in deferred revenue as of January 31, 2020 and 2019 were $785.2 million and $633.2 million during fiscal 2021 and 2020, respectively.
NOTES TO CONSOLIDATED FINANCIAL STATEMENTS
103

Remaining Performance Obligations
Revenue allocated to remaining performance obligations represents contracted revenue that has not yet been recognized, which includes deferred revenue and non-cancelable amounts that will be invoiced and excludes performance obligations that are subject to cancellation terms. Our remaining performance obligations were $1.99 billion as of January 31, 2021, of which we expect to recognize approximately 62% as revenue over the next 12 months and the remainder thereafter.
(10) Income Taxes
Loss before income taxes consists of the following:
Fiscal Year Ended January 31, (In thousands) 2021 2020 2019
United States $ (907,201) $ (363,053) $ (289,896) International 6,153 31,402 26,705
Total $ (901,048) $ (331,651) $ (263,191)
Income tax provision consists of the following:
Fiscal Year Ended January 31, (In thousands) 2021 2020 2019
Current tax provision:Federal $ 859 $ 316 $ 7,532 State 748 627 422 Foreign 8,915 10,194 8,496
Total current tax provision 10,522 11,137 16,450 Deferred tax benefit:
Federal (1,306) (2,124) (3,313) State (698) (2,213) — Foreign (1,586) (1,783) (751)
Total deferred tax benefit (3,590) (6,120) (4,064) Total tax provision $ 6,932 $ 5,017 $ 12,386
The reconciliation of federal statutory income tax rate to our effective income tax rate is as follows:
Fiscal Year Ended January 31, (In thousands) 2021 2020 2019
Expected benefit at U.S. federal statutory rate $ (189,220) $ (69,692) $ (55,270) State income taxes - net of federal benefit (32,659) (10,647) (8,904) Stock-based compensation (38,493) (23,306) (26,554) Research and development tax credits (60,811) (44,274) (32,819) Change in valuation allowance 321,321 146,765 122,614 Non-deductible expenses 2,560 5,814 4,767 Release of valuation allowance due to acquisitions (2,293) (4,337) (3,313) Base erosion anti-abuse tax 859 316 7,532 Non-U.S. tax rate differential 7,378 4,378 4,333 Other (1,710) — —
Total tax provision $ 6,932 $ 5,017 $ 12,386
NOTES TO CONSOLIDATED FINANCIAL STATEMENTS
104
Deferred tax assets and liabilities consist of the following:
Fiscal Year Ended January 31, (In thousands) 2021 2020
Deferred tax assets:Net operating loss carryforwards $ 694,261 $ 594,967 Accrued liabilities 26,816 12,934 Tax credit carryforwards 220,019 158,250 Stock-based compensation 28,262 33,245 Deferred revenue 23,666 37,932 Operating lease liabilities 87,610 67,233 Capitalized research & development costs 122,303 — Other 9,967 — Valuation allowance (925,844) (643,395)
Total deferred tax assets 287,060 261,166 Deferred tax liabilities:
Depreciation and amortization (48,228) (51,033) Operating lease right-of-use assets (79,100) (64,017) Deferred commissions (44,214) (45,882) Convertible senior notes (110,439) (96,465)
Total deferred tax liabilities (281,981) (257,397) Net deferred taxes 5,079 3,769 Recorded as:
Non-current deferred tax assets (1) 5,368 3,769 Non-current deferred tax liabilities (1) (289) —
Net deferred tax assets $ 5,079 $ 3,769 _________________________(1) Non-current deferred tax assets and non-current deferred tax liabilities are included in “Other assets” and “Other liabilities, non-current”,
respectively, on our consolidated balance sheets.
ASC Topic 740, Income Taxes, requires that the tax benefit of net operating losses, temporary differences and credit carryforwards be recorded as an asset to the extent that we assess that realization is more likely than not. Realization of the future tax benefits is dependent on our ability to generate sufficient taxable income within the carryforward period. Due to our history of U.S. operating losses, we believe the recognition of the deferred tax assets arising from the above-mentioned future tax benefits is currently not more likely than not to be realized and, accordingly, have provided a full valuation allowance against net U.S. deferred tax assets. The valuation allowance totaled $925.8 million and $643.4 million for fiscal 2021 and 2020, respectively. The valuation allowance on our net deferred tax assets increased by $282.4 million, $162.1 million and $12.3 million during fiscal 2021, 2020 and 2019, respectively.
If certain factors change, we may determine that there is sufficient positive evidence to support a reversal of, or decrease in, the valuation allowance. If we were to reverse all or some part of our valuation allowance, our consolidated financial statements in the period of reversal would likely reflect an increase in assets on our balance sheet and a corresponding tax benefit to our consolidated statements of operations in the amount of the reversal.
As of January 31, 2021, we had net operating loss carryforwards of $2.76 billion for federal income tax purposes, a portion of which will begin to expire in 2025 if unused. We had net operating loss carryforwards of $1.83 billion for state income tax purposes, which will begin to expire in the year 2023 if unused. We also had certain foreign net operating loss carryforwards of $18.1 million, which have an indefinite life.
As of January 31, 2021, we also had research and development tax credit carryforwards of $166.3 million for federal income tax purposes and $130.0 million for state income tax purposes. The federal research and development tax credits will begin to expire in 2026 if unused. State research and development tax credits carry forward indefinitely.
NOTES TO CONSOLIDATED FINANCIAL STATEMENTS
105

FOR
M 1
0-K
Remaining Performance Obligations
Revenue allocated to remaining performance obligations represents contracted revenue that has not yet been recognized, which includes deferred revenue and non-cancelable amounts that will be invoiced and excludes performance obligations that are subject to cancellation terms. Our remaining performance obligations were $1.99 billion as of January 31, 2021, of which we expect to recognize approximately 62% as revenue over the next 12 months and the remainder thereafter.
(10) Income Taxes
Loss before income taxes consists of the following:
Fiscal Year Ended January 31, (In thousands) 2021 2020 2019
United States $ (907,201) $ (363,053) $ (289,896) International 6,153 31,402 26,705
Total $ (901,048) $ (331,651) $ (263,191)
Income tax provision consists of the following:
Fiscal Year Ended January 31, (In thousands) 2021 2020 2019
Current tax provision:Federal $ 859 $ 316 $ 7,532 State 748 627 422 Foreign 8,915 10,194 8,496
Total current tax provision 10,522 11,137 16,450 Deferred tax benefit:
Federal (1,306) (2,124) (3,313) State (698) (2,213) — Foreign (1,586) (1,783) (751)
Total deferred tax benefit (3,590) (6,120) (4,064) Total tax provision $ 6,932 $ 5,017 $ 12,386
The reconciliation of federal statutory income tax rate to our effective income tax rate is as follows:
Fiscal Year Ended January 31, (In thousands) 2021 2020 2019
Expected benefit at U.S. federal statutory rate $ (189,220) $ (69,692) $ (55,270) State income taxes - net of federal benefit (32,659) (10,647) (8,904) Stock-based compensation (38,493) (23,306) (26,554) Research and development tax credits (60,811) (44,274) (32,819) Change in valuation allowance 321,321 146,765 122,614 Non-deductible expenses 2,560 5,814 4,767 Release of valuation allowance due to acquisitions (2,293) (4,337) (3,313) Base erosion anti-abuse tax 859 316 7,532 Non-U.S. tax rate differential 7,378 4,378 4,333 Other (1,710) — —
Total tax provision $ 6,932 $ 5,017 $ 12,386
NOTES TO CONSOLIDATED FINANCIAL STATEMENTS
104
Deferred tax assets and liabilities consist of the following:
Fiscal Year Ended January 31, (In thousands) 2021 2020
Deferred tax assets:Net operating loss carryforwards $ 694,261 $ 594,967 Accrued liabilities 26,816 12,934 Tax credit carryforwards 220,019 158,250 Stock-based compensation 28,262 33,245 Deferred revenue 23,666 37,932 Operating lease liabilities 87,610 67,233 Capitalized research & development costs 122,303 — Other 9,967 — Valuation allowance (925,844) (643,395)
Total deferred tax assets 287,060 261,166 Deferred tax liabilities:
Depreciation and amortization (48,228) (51,033) Operating lease right-of-use assets (79,100) (64,017) Deferred commissions (44,214) (45,882) Convertible senior notes (110,439) (96,465)
Total deferred tax liabilities (281,981) (257,397) Net deferred taxes 5,079 3,769 Recorded as:
Non-current deferred tax assets (1) 5,368 3,769 Non-current deferred tax liabilities (1) (289) —
Net deferred tax assets $ 5,079 $ 3,769 _________________________(1) Non-current deferred tax assets and non-current deferred tax liabilities are included in “Other assets” and “Other liabilities, non-current”,
respectively, on our consolidated balance sheets.
ASC Topic 740, Income Taxes, requires that the tax benefit of net operating losses, temporary differences and credit carryforwards be recorded as an asset to the extent that we assess that realization is more likely than not. Realization of the future tax benefits is dependent on our ability to generate sufficient taxable income within the carryforward period. Due to our history of U.S. operating losses, we believe the recognition of the deferred tax assets arising from the above-mentioned future tax benefits is currently not more likely than not to be realized and, accordingly, have provided a full valuation allowance against net U.S. deferred tax assets. The valuation allowance totaled $925.8 million and $643.4 million for fiscal 2021 and 2020, respectively. The valuation allowance on our net deferred tax assets increased by $282.4 million, $162.1 million and $12.3 million during fiscal 2021, 2020 and 2019, respectively.
If certain factors change, we may determine that there is sufficient positive evidence to support a reversal of, or decrease in, the valuation allowance. If we were to reverse all or some part of our valuation allowance, our consolidated financial statements in the period of reversal would likely reflect an increase in assets on our balance sheet and a corresponding tax benefit to our consolidated statements of operations in the amount of the reversal.
As of January 31, 2021, we had net operating loss carryforwards of $2.76 billion for federal income tax purposes, a portion of which will begin to expire in 2025 if unused. We had net operating loss carryforwards of $1.83 billion for state income tax purposes, which will begin to expire in the year 2023 if unused. We also had certain foreign net operating loss carryforwards of $18.1 million, which have an indefinite life.
As of January 31, 2021, we also had research and development tax credit carryforwards of $166.3 million for federal income tax purposes and $130.0 million for state income tax purposes. The federal research and development tax credits will begin to expire in 2026 if unused. State research and development tax credits carry forward indefinitely.
NOTES TO CONSOLIDATED FINANCIAL STATEMENTS
105

Because of certain prior period ownership changes, the utilization of a portion of our U.S. federal and state NOL and tax credit carryforwards may be limited.
As of January 31, 2021, we have an immaterial amount of earnings indefinitely reinvested outside of the U.S. We do not intend to repatriate these earnings and, accordingly, we do not provide for U.S. income taxes and foreign withholding tax on these earnings.
As of January 31, 2021, our unrecognized tax benefits were $60.7 million, of which $6.5 million would, if recognized, impact our effective tax rate. The remainder will not, if recognized, affect the effective income tax rate due to the valuation allowance that currently offsets deferred tax assets.
Unrecognized tax benefit balances are presented below:
Fiscal Year Ended January 31, (In thousands) 2021 2020 2019
Balance at beginning of year $ 39,774 $ 32,905 $ 31,802 Increase related to prior year tax positions 2,969 — — Decrease related to prior year tax positions (446) — (6,035) Increase related to current year tax positions 18,364 6,869 7,138 Balance at end of year $ 60,661 $ 39,774 $ 32,905
We are required to identify, evaluate and measure all uncertain tax positions taken or to be taken on tax returns and to record liabilities for the amount of these positions that may not be sustained, or may only partially be sustained, upon examination by the relevant taxing authorities.
We are subject to federal, state and local taxes in the United States and numerous foreign jurisdictions. Our federal tax returns for the years 2005 through the current period remain subject to examination.
The potential change in unrecognized tax benefits during the next 12 months is not expected to be material.
We accrue interest and penalties related to unrecognized tax benefits as a component of income tax expense. Accrued interest and penalties as of January 31, 2021 and 2020 were not material.
(11) Net Loss Per Share
Basic net loss per share is computed by dividing the net loss by the weighted-average number of shares of common stock outstanding during the period, less the weighted-average unvested common stock subject to repurchase or forfeiture. Diluted net loss per share is computed by giving effect to all potential shares of common stock, including convertible senior notes, stock options, RSUs, PSUs and RSAs to the extent dilutive.
The following table sets forth the computation of historical basic and diluted net loss per share:
Fiscal Year Ended January 31, (In thousands, except per share amounts) 2021 2020 2019Numerator:
Net loss $ (907,980) $ (336,668) $ (275,577) Denominator:
Weighted-average common shares outstanding 160,397 152,653 145,737 Less: Weighted-average unvested common shares subject to repurchase or forfeiture (653) (704) (30) Weighted-average shares used to compute net loss per share, basic and diluted 159,744 151,949 145,707
Net loss per share, basic and diluted $ (5.68) $ (2.22) $ (1.89)
NOTES TO CONSOLIDATED FINANCIAL STATEMENTS
106
Since we were in a net loss position for all periods presented, basic net loss per share is the same as diluted net loss per share for all periods as the inclusion of all potentially dilutive securities outstanding would have been anti-dilutive. Potentially dilutive securities that were not included in the diluted per share calculations because they would be anti-dilutive were as follows:
Fiscal Year Ended January 31,
(In thousands) 2021 2020 2019Shares subject to outstanding common stock options 419 824 409 Shares subject to outstanding RSUs, PSUs and RSAs 11,723 13,999 13,923 Employee stock purchase plan 641 548 554 Shares underlying the conversion spread in the convertible senior notes 1,871 — —
Total 14,654 15,371 14,886
As of January 31, 2021, the aggregate outstanding principal amount under the Notes is potentially convertible into 16.0 million shares of our common stock. Since we expect to settle the principal amount of our convertible senior notes in cash, we use the treasury stock method for calculating any potential dilutive effect on diluted net income per share, if applicable. As a result, only the amount by which the conversion value exceeds the aggregate principal amount of the Notes (the “conversion spread”) is considered in the diluted earnings per share calculation. The conversion spread has a potentially dilutive effect on diluted net income per share when the average market price of our common stock for a given period exceeds the initial conversion price of $148.30 per share for the 2023 Notes and the 2025 Notes, and $255.34 per share for the 2027 Notes.
During the three months ended January 31, 2021, the average market price of our common stock was $178.52, which exceeded the initial conversion price of the 2023 Notes and the 2025 Notes. Accordingly, we calculated the potentially dilutive effect of the conversion spread for the 2023 Notes and 2025 Notes, which is included in the table above. We excluded the potentially dilutive effect of the conversion spread for the 2027 Notes as the average market price of our common stock during the three months ended January 31, 2021 was less than the conversion price of the 2027 Notes.
In connection with the issuance of the Notes, we entered into Capped Calls, which were not included for purposes of calculating the number of diluted shares outstanding, as their effect would have been anti-dilutive.
Item 9. Changes in and Disagreements with Accountants on Accounting and Financial Disclosure
None.
Item 9A. Controls and Procedures Evaluation of Disclosure Controls and Procedures
Our management, with the participation of our Chief Executive Officer and our Chief Financial Officer, evaluated the effectiveness of our disclosure controls and procedures as of January 31, 2021. The term “disclosure controls and procedures,” as defined in Rules 13a-15(e) and 15d-15(e) under the Exchange Act, means controls and other procedures of a company that are designed to ensure that information required to be disclosed by a company in the reports that it files or submits under the Exchange Act is recorded, processed, summarized and reported, within the time periods specified in the SEC’s rules and forms. Disclosure controls and procedures include, without limitation, controls and procedures designed to ensure that information required to be disclosed by a company in the reports that it files or submits under the Exchange Act is accumulated and communicated to the company’s management, including its principal executive and principal financial officers, as appropriate to allow timely decisions regarding required disclosure. Based on the evaluation of our disclosure controls and procedures as of January 31, 2021, our Chief Executive Officer and Chief Financial Officer concluded that, as of such date, our disclosure controls and procedures were effective at the reasonable assurance level.
Management’s Annual Report on Internal Control Over Financial Reporting
NOTES TO CONSOLIDATED FINANCIAL STATEMENTS
107

FOR
M 1
0-K
Because of certain prior period ownership changes, the utilization of a portion of our U.S. federal and state NOL and tax credit carryforwards may be limited.
As of January 31, 2021, we have an immaterial amount of earnings indefinitely reinvested outside of the U.S. We do not intend to repatriate these earnings and, accordingly, we do not provide for U.S. income taxes and foreign withholding tax on these earnings.
As of January 31, 2021, our unrecognized tax benefits were $60.7 million, of which $6.5 million would, if recognized, impact our effective tax rate. The remainder will not, if recognized, affect the effective income tax rate due to the valuation allowance that currently offsets deferred tax assets.
Unrecognized tax benefit balances are presented below:
Fiscal Year Ended January 31, (In thousands) 2021 2020 2019
Balance at beginning of year $ 39,774 $ 32,905 $ 31,802 Increase related to prior year tax positions 2,969 — — Decrease related to prior year tax positions (446) — (6,035) Increase related to current year tax positions 18,364 6,869 7,138 Balance at end of year $ 60,661 $ 39,774 $ 32,905
We are required to identify, evaluate and measure all uncertain tax positions taken or to be taken on tax returns and to record liabilities for the amount of these positions that may not be sustained, or may only partially be sustained, upon examination by the relevant taxing authorities.
We are subject to federal, state and local taxes in the United States and numerous foreign jurisdictions. Our federal tax returns for the years 2005 through the current period remain subject to examination.
The potential change in unrecognized tax benefits during the next 12 months is not expected to be material.
We accrue interest and penalties related to unrecognized tax benefits as a component of income tax expense. Accrued interest and penalties as of January 31, 2021 and 2020 were not material.
(11) Net Loss Per Share
Basic net loss per share is computed by dividing the net loss by the weighted-average number of shares of common stock outstanding during the period, less the weighted-average unvested common stock subject to repurchase or forfeiture. Diluted net loss per share is computed by giving effect to all potential shares of common stock, including convertible senior notes, stock options, RSUs, PSUs and RSAs to the extent dilutive.
The following table sets forth the computation of historical basic and diluted net loss per share:
Fiscal Year Ended January 31, (In thousands, except per share amounts) 2021 2020 2019Numerator:
Net loss $ (907,980) $ (336,668) $ (275,577) Denominator:
Weighted-average common shares outstanding 160,397 152,653 145,737 Less: Weighted-average unvested common shares subject to repurchase or forfeiture (653) (704) (30) Weighted-average shares used to compute net loss per share, basic and diluted 159,744 151,949 145,707
Net loss per share, basic and diluted $ (5.68) $ (2.22) $ (1.89)
NOTES TO CONSOLIDATED FINANCIAL STATEMENTS
106
Since we were in a net loss position for all periods presented, basic net loss per share is the same as diluted net loss per share for all periods as the inclusion of all potentially dilutive securities outstanding would have been anti-dilutive. Potentially dilutive securities that were not included in the diluted per share calculations because they would be anti-dilutive were as follows:
Fiscal Year Ended January 31,
(In thousands) 2021 2020 2019Shares subject to outstanding common stock options 419 824 409 Shares subject to outstanding RSUs, PSUs and RSAs 11,723 13,999 13,923 Employee stock purchase plan 641 548 554 Shares underlying the conversion spread in the convertible senior notes 1,871 — —
Total 14,654 15,371 14,886
As of January 31, 2021, the aggregate outstanding principal amount under the Notes is potentially convertible into 16.0 million shares of our common stock. Since we expect to settle the principal amount of our convertible senior notes in cash, we use the treasury stock method for calculating any potential dilutive effect on diluted net income per share, if applicable. As a result, only the amount by which the conversion value exceeds the aggregate principal amount of the Notes (the “conversion spread”) is considered in the diluted earnings per share calculation. The conversion spread has a potentially dilutive effect on diluted net income per share when the average market price of our common stock for a given period exceeds the initial conversion price of $148.30 per share for the 2023 Notes and the 2025 Notes, and $255.34 per share for the 2027 Notes.
During the three months ended January 31, 2021, the average market price of our common stock was $178.52, which exceeded the initial conversion price of the 2023 Notes and the 2025 Notes. Accordingly, we calculated the potentially dilutive effect of the conversion spread for the 2023 Notes and 2025 Notes, which is included in the table above. We excluded the potentially dilutive effect of the conversion spread for the 2027 Notes as the average market price of our common stock during the three months ended January 31, 2021 was less than the conversion price of the 2027 Notes.
In connection with the issuance of the Notes, we entered into Capped Calls, which were not included for purposes of calculating the number of diluted shares outstanding, as their effect would have been anti-dilutive.
Item 9. Changes in and Disagreements with Accountants on Accounting and Financial Disclosure
None.
Item 9A. Controls and Procedures Evaluation of Disclosure Controls and Procedures
Our management, with the participation of our Chief Executive Officer and our Chief Financial Officer, evaluated the effectiveness of our disclosure controls and procedures as of January 31, 2021. The term “disclosure controls and procedures,” as defined in Rules 13a-15(e) and 15d-15(e) under the Exchange Act, means controls and other procedures of a company that are designed to ensure that information required to be disclosed by a company in the reports that it files or submits under the Exchange Act is recorded, processed, summarized and reported, within the time periods specified in the SEC’s rules and forms. Disclosure controls and procedures include, without limitation, controls and procedures designed to ensure that information required to be disclosed by a company in the reports that it files or submits under the Exchange Act is accumulated and communicated to the company’s management, including its principal executive and principal financial officers, as appropriate to allow timely decisions regarding required disclosure. Based on the evaluation of our disclosure controls and procedures as of January 31, 2021, our Chief Executive Officer and Chief Financial Officer concluded that, as of such date, our disclosure controls and procedures were effective at the reasonable assurance level.
Management’s Annual Report on Internal Control Over Financial Reporting
NOTES TO CONSOLIDATED FINANCIAL STATEMENTS
107

Our management is responsible for establishing and maintaining adequate internal control over financial reporting, as defined in Rule 13a-15(f) of the Exchange Act. Our management conducted an evaluation of the effectiveness of our internal control over financial reporting based on the criteria set forth in Internal Control—Integrated Framework issued by the Committee of Sponsoring Organizations of the Treadway Commission (2013 framework). Based on this evaluation, management concluded that our internal control over financial reporting was effective as of January 31, 2021.
The effectiveness of our internal control over financial reporting as of January 31, 2021 has been audited by PricewaterhouseCoopers LLP, an independent registered public accounting firm, as stated in their report which is included in Item 8 of this Annual Report on Form 10-K.
Changes in Internal Control over Financial Reporting
There was no change in our internal control over financial reporting identified in connection with the evaluation required by Rule 13a-15(d) and 15d-15(d) of the Exchange Act that occurred during the quarter ended January 31, 2021 that has materially affected, or is reasonably likely to materially affect, our internal control over financial reporting. Inherent Limitations on Effectiveness of Controls
Our management, including our Chief Executive Officer and Chief Financial Officer, believes that our disclosure controls and procedures and internal control over financial reporting are designed to provide reasonable assurance of achieving their objectives and are effective at the reasonable assurance level. However, our management does not expect that our disclosure controls and procedures or our internal control over financial reporting will prevent all errors and all fraud. A control system, no matter how well conceived and operated, can provide only reasonable, not absolute, assurance that the objectives of the control system are met. Further, the design of a control system must reflect the fact that there are resource constraints, and the benefits of controls must be considered relative to their costs. Because of the inherent limitations in all control systems, no evaluation of controls can provide absolute assurance that all control issues and instances of fraud, if any, have been detected. These inherent limitations include the realities that judgments in decision-making can be faulty, and that breakdowns can occur because of a simple error or mistake. Additionally, controls can be circumvented by the individual acts of some persons, by collusion of two or more people or by management override of the controls. The design of any system of controls also is based in part upon certain assumptions about the likelihood of future events, and there can be no assurance that any design will succeed in achieving its stated goals under all potential future conditions; over time, controls may become inadequate because of changes in conditions, or the degree of compliance with policies or procedures may deteriorate. Because of the inherent limitations in a cost-effective control system, misstatements due to error or fraud may occur and not be detected.
Item 9b. Other Information
None.
108
PART III
Item 10. Directors, Executive Officers and Corporate Governance
Executive Officers and Directors
Information responsive to this item is incorporated herein by reference to our definitive proxy statement with respect to our 2021 Annual Meeting of Stockholders to be filed with the SEC within 120 days after the end of the fiscal year covered by this annual report on Form 10-K (the “Proxy Statement”).
As part of our system of corporate governance, our board of directors has adopted a code of business conduct and ethics. The code applies to all of our employees, officers (including our principal executive officer, principal financial officer, principal accounting officer or controller, or persons performing similar functions), agents and representatives, including our independent directors and consultants, who are not employees of the Company, with regard to their Splunk-related activities. Our code of business conduct and ethics is available on our website at http://investors.splunk.com/corporate-governance. We will post on this section of our website any amendment to our code of business conduct and ethics, as well as any waivers of our code of business conduct and ethics, that are required to be disclosed by the rules of the SEC or the NASDAQ Stock Market.
Item 11. Executive Compensation
The information required by this Item is incorporated herein by reference to the sections entitled “Executive Compensation” and “Corporate Governance at Splunk – Non-Employee Director Compensation” in our Proxy Statement.
Item 12. Security Ownership of Certain Beneficial Owners and Management and Related Stockholder Matters
The information required by this Item is incorporated herein by reference to the sections entitled “Stock Ownership Information – Security Ownership of Certain Beneficial Owners and Management,” and “Executive Compensation –Compensation Tables – Equity Compensation Plan Information” in our Proxy Statement.
Item 13. Certain Relationships and Related Transactions, and Director Independence
The information required by this Item is incorporated herein by reference to the sections entitled “Corporate Governance at Splunk – Related Party and Other Transactions” and “Corporate Governance at Splunk – Director Independence” in our Proxy Statement.
Item 14. Principal Accountant Fees and Services
The information required by this Item is incorporated herein by reference to the sections entitled “Audit Committee Matters – Fees Paid to the Independent Registered Public Accounting Firm” and “Audit Committee Matters – Audit Committee Policy on Pre-Approval of Audit and Permissible Non-Audit Services of Independent Registered Public Accounting Firm” in our Proxy Statement.
109

FOR
M 1
0-K
Our management is responsible for establishing and maintaining adequate internal control over financial reporting, as defined in Rule 13a-15(f) of the Exchange Act. Our management conducted an evaluation of the effectiveness of our internal control over financial reporting based on the criteria set forth in Internal Control—Integrated Framework issued by the Committee of Sponsoring Organizations of the Treadway Commission (2013 framework). Based on this evaluation, management concluded that our internal control over financial reporting was effective as of January 31, 2021.
The effectiveness of our internal control over financial reporting as of January 31, 2021 has been audited by PricewaterhouseCoopers LLP, an independent registered public accounting firm, as stated in their report which is included in Item 8 of this Annual Report on Form 10-K.
Changes in Internal Control over Financial Reporting
There was no change in our internal control over financial reporting identified in connection with the evaluation required by Rule 13a-15(d) and 15d-15(d) of the Exchange Act that occurred during the quarter ended January 31, 2021 that has materially affected, or is reasonably likely to materially affect, our internal control over financial reporting. Inherent Limitations on Effectiveness of Controls
Our management, including our Chief Executive Officer and Chief Financial Officer, believes that our disclosure controls and procedures and internal control over financial reporting are designed to provide reasonable assurance of achieving their objectives and are effective at the reasonable assurance level. However, our management does not expect that our disclosure controls and procedures or our internal control over financial reporting will prevent all errors and all fraud. A control system, no matter how well conceived and operated, can provide only reasonable, not absolute, assurance that the objectives of the control system are met. Further, the design of a control system must reflect the fact that there are resource constraints, and the benefits of controls must be considered relative to their costs. Because of the inherent limitations in all control systems, no evaluation of controls can provide absolute assurance that all control issues and instances of fraud, if any, have been detected. These inherent limitations include the realities that judgments in decision-making can be faulty, and that breakdowns can occur because of a simple error or mistake. Additionally, controls can be circumvented by the individual acts of some persons, by collusion of two or more people or by management override of the controls. The design of any system of controls also is based in part upon certain assumptions about the likelihood of future events, and there can be no assurance that any design will succeed in achieving its stated goals under all potential future conditions; over time, controls may become inadequate because of changes in conditions, or the degree of compliance with policies or procedures may deteriorate. Because of the inherent limitations in a cost-effective control system, misstatements due to error or fraud may occur and not be detected.
Item 9b. Other Information
None.
108
PART III
Item 10. Directors, Executive Officers and Corporate Governance
Executive Officers and Directors
Information responsive to this item is incorporated herein by reference to our definitive proxy statement with respect to our 2021 Annual Meeting of Stockholders to be filed with the SEC within 120 days after the end of the fiscal year covered by this annual report on Form 10-K (the “Proxy Statement”).
As part of our system of corporate governance, our board of directors has adopted a code of business conduct and ethics. The code applies to all of our employees, officers (including our principal executive officer, principal financial officer, principal accounting officer or controller, or persons performing similar functions), agents and representatives, including our independent directors and consultants, who are not employees of the Company, with regard to their Splunk-related activities. Our code of business conduct and ethics is available on our website at http://investors.splunk.com/corporate-governance. We will post on this section of our website any amendment to our code of business conduct and ethics, as well as any waivers of our code of business conduct and ethics, that are required to be disclosed by the rules of the SEC or the NASDAQ Stock Market.
Item 11. Executive Compensation
The information required by this Item is incorporated herein by reference to the sections entitled “Executive Compensation” and “Corporate Governance at Splunk – Non-Employee Director Compensation” in our Proxy Statement.
Item 12. Security Ownership of Certain Beneficial Owners and Management and Related Stockholder Matters
The information required by this Item is incorporated herein by reference to the sections entitled “Stock Ownership Information – Security Ownership of Certain Beneficial Owners and Management,” and “Executive Compensation –Compensation Tables – Equity Compensation Plan Information” in our Proxy Statement.
Item 13. Certain Relationships and Related Transactions, and Director Independence
The information required by this Item is incorporated herein by reference to the sections entitled “Corporate Governance at Splunk – Related Party and Other Transactions” and “Corporate Governance at Splunk – Director Independence” in our Proxy Statement.
Item 14. Principal Accountant Fees and Services
The information required by this Item is incorporated herein by reference to the sections entitled “Audit Committee Matters – Fees Paid to the Independent Registered Public Accounting Firm” and “Audit Committee Matters – Audit Committee Policy on Pre-Approval of Audit and Permissible Non-Audit Services of Independent Registered Public Accounting Firm” in our Proxy Statement.
109

PART IV
Item 15. Exhibits and Financial Statement Schedules
Documents filed as part of this report are as follows:
1. Consolidated Financial Statements: Our Consolidated Financial Statements are listed in the “Index to Consolidated Financial Statements” Under Part II, Item 8 of this report.
2. Financial Statement Schedules: Financial statement schedules have been omitted because they are not applicable or the required information is shown in the Consolidated Financial Statements or Notes thereto.
3. Exhibits: The documents listed in the Exhibit Index of this report are incorporated by reference or are filed with this report, in each case as indicated therein (numbered in accordance with Item 601 of Regulation S-K).
Item 16. Form 10-K Summary
Not applicable.
110
EXHIBITINDEX
ExhibitNumber
Description
2.1*†
Agreement and Plan of Mergers among the Registrant, certain of its wholly owned subsidiaries, SignalFx, Inc. and Fortis Advisors LLC, as Securityholders’ agent, dated as of August 21, 2019 (incorporated by reference to Exhibit 2.1 filed with the Registrant’s Quarterly Report on Form 10-Q filed on December 4, 2019).
3.1Amended and Restated Certificate of Incorporation of the Registrant (incorporated by reference to Exhibit 3.1 filed with the Registrant’s Quarterly Report on Form 10-Q filed on June 13, 2012).
3.2Amended and Restated Bylaws of the Registrant (incorporated by reference to Exhibit 3.1 filed with the Registrant’s Current Report on Form 8-K filed on March 25, 2019).
4.1Specimen common stock certificate of the Registrant (incorporated by reference to Exhibit 4.1 filed with the Registrant’s Registration Statement on Form S-1 filed on April 6, 2012).
4.2
Indenture, dated as of September 21, 2018, by and between the Registrant and U.S. Bank National Association, as Trustee (incorporated by reference to Exhibit 4.1 filed with the Registrant’s Current Report on Form 8-K filed on September 21, 2018).
4.3
Form of Global Note, representing Splunk Inc.’s 0.50% Convertible Senior Notes due 2023 (incorporated by reference to Exhibit A to the Indenture filed as Exhibit 4.1 filed with the Registrant’s Current Report on Form 8-K filed on September 21, 2018).
4.4
Indenture, dated as of September 21, 2018, by and between the Registrant and U.S. Bank National Association, as Trustee (incorporated by reference to Exhibit 4.3 filed with the Registrant’s Current Report on Form 8-K filed on September 21, 2018).
4.5
Form of Global Note, representing Splunk Inc.’s 1.125% Convertible Senior Notes due 2025 (incorporated by reference to Exhibit A to the Indenture filed as Exhibit 4.3 filed with the Registrant’s Current Report on Form 8-K filed on September 21, 2018).
4.6
Indenture, dated as of June 5, 2020, by and between Splunk Inc. and U.S. Bank National Association, as Trustee (incorporated by reference to Exhibit 4.1 filed with the Registrant’s Current Report on Form 8-K filed on June 5, 2020).
4.7
Form of Global Note, representing Registrant’s 1.125% Convertible Senior Notes due 2027 (incorporated by reference to Exhibit A to the Indenture filed as Exhibit 4.1 filed with the Registrant’s Current Report on Form 8-K filed on June 5, 2020).
4.8Description of Common Stock (incorporated by reference to Exhibit 4.6 filed with the Registrant’s Annual Report on Form 10-K filed on March 26, 2020).
10.1#
Form of Indemnification Agreement between the Registrant and its directors and officers (incorporated by reference to Exhibit 10.1 filed with the Registrant’s Registration Statement on Form S-1 filed on January 12, 2012).
10.2#
2003 Equity Incentive Plan, as amended, and Forms of Stock Option Agreement under 2003 Equity Incentive Plan (incorporated by reference to Exhibit 10.2 filed with the Registrant’s Registration Statement on Form S-1 filed on January 12, 2012).
111

FOR
M 1
0-K
PART IV
Item 15. Exhibits and Financial Statement Schedules
Documents filed as part of this report are as follows:
1. Consolidated Financial Statements: Our Consolidated Financial Statements are listed in the “Index to Consolidated Financial Statements” Under Part II, Item 8 of this report.
2. Financial Statement Schedules: Financial statement schedules have been omitted because they are not applicable or the required information is shown in the Consolidated Financial Statements or Notes thereto.
3. Exhibits: The documents listed in the Exhibit Index of this report are incorporated by reference or are filed with this report, in each case as indicated therein (numbered in accordance with Item 601 of Regulation S-K).
Item 16. Form 10-K Summary
Not applicable.
110
EXHIBITINDEX
ExhibitNumber
Description
2.1*†
Agreement and Plan of Mergers among the Registrant, certain of its wholly owned subsidiaries, SignalFx, Inc. and Fortis Advisors LLC, as Securityholders’ agent, dated as of August 21, 2019 (incorporated by reference to Exhibit 2.1 filed with the Registrant’s Quarterly Report on Form 10-Q filed on December 4, 2019).
3.1Amended and Restated Certificate of Incorporation of the Registrant (incorporated by reference to Exhibit 3.1 filed with the Registrant’s Quarterly Report on Form 10-Q filed on June 13, 2012).
3.2Amended and Restated Bylaws of the Registrant (incorporated by reference to Exhibit 3.1 filed with the Registrant’s Current Report on Form 8-K filed on March 25, 2019).
4.1Specimen common stock certificate of the Registrant (incorporated by reference to Exhibit 4.1 filed with the Registrant’s Registration Statement on Form S-1 filed on April 6, 2012).
4.2
Indenture, dated as of September 21, 2018, by and between the Registrant and U.S. Bank National Association, as Trustee (incorporated by reference to Exhibit 4.1 filed with the Registrant’s Current Report on Form 8-K filed on September 21, 2018).
4.3
Form of Global Note, representing Splunk Inc.’s 0.50% Convertible Senior Notes due 2023 (incorporated by reference to Exhibit A to the Indenture filed as Exhibit 4.1 filed with the Registrant’s Current Report on Form 8-K filed on September 21, 2018).
4.4
Indenture, dated as of September 21, 2018, by and between the Registrant and U.S. Bank National Association, as Trustee (incorporated by reference to Exhibit 4.3 filed with the Registrant’s Current Report on Form 8-K filed on September 21, 2018).
4.5
Form of Global Note, representing Splunk Inc.’s 1.125% Convertible Senior Notes due 2025 (incorporated by reference to Exhibit A to the Indenture filed as Exhibit 4.3 filed with the Registrant’s Current Report on Form 8-K filed on September 21, 2018).
4.6
Indenture, dated as of June 5, 2020, by and between Splunk Inc. and U.S. Bank National Association, as Trustee (incorporated by reference to Exhibit 4.1 filed with the Registrant’s Current Report on Form 8-K filed on June 5, 2020).
4.7
Form of Global Note, representing Registrant’s 1.125% Convertible Senior Notes due 2027 (incorporated by reference to Exhibit A to the Indenture filed as Exhibit 4.1 filed with the Registrant’s Current Report on Form 8-K filed on June 5, 2020).
4.8Description of Common Stock (incorporated by reference to Exhibit 4.6 filed with the Registrant’s Annual Report on Form 10-K filed on March 26, 2020).
10.1#
Form of Indemnification Agreement between the Registrant and its directors and officers (incorporated by reference to Exhibit 10.1 filed with the Registrant’s Registration Statement on Form S-1 filed on January 12, 2012).
10.2#
2003 Equity Incentive Plan, as amended, and Forms of Stock Option Agreement under 2003 Equity Incentive Plan (incorporated by reference to Exhibit 10.2 filed with the Registrant’s Registration Statement on Form S-1 filed on January 12, 2012).
111

10.3#
2012 Equity Incentive Plan (incorporated by reference to Exhibit 10.3 filed with the Registrant’s Registration Statement on Form S-1 filed on April 6, 2012).
10.4#Amendment to 2012 Equity Incentive Plan, effective as of September 14, 2017 (incorporated by reference to Exhibit 10.1 filed with the Registrant’s Quarterly Report on Form 10-Q filed on December 6, 2017).
10.5#2012 Employee Stock Purchase Plan, as amended (incorporated by reference to Exhibit 10.5 filed with the Registrant’s Annual Report on Form 10-K filed on March 26, 2020).
10.6
Office Lease, dated as of April 29, 2014, between 270 Brannan Street, LLC and the Registrant (incorporated by reference to Exhibit 10.2 filed with the Registrant’s Quarterly Report on Form 10-Q filed on June 9, 2014).
10.7
First Amendment to Office Lease, dated as of March 1, 2018, between 270 Brannan Street, LLC and the Registrant (incorporated by reference to Exhibit 10.2 filed with the Registrant’s Quarterly Report on Form 10-Q filed on June 8, 2018).
10.8
Office Lease, dated as of August 24, 2015, between FRIT San Jose Town and Country Village, LLC and the Registrant (incorporated by reference to Exhibit 10.1 filed with the Registrant’s Quarterly Report on Form 10-Q filed on December 10, 2015).
10.9
First Amendment to Office Lease, dated as of May 23, 2016, between FRIT San Jose Town and Country Village, LLC and the Registrant (incorporated by reference to Exhibit 10.2 filed with the Registrant’s Quarterly Report on Form 10-Q filed on September 8, 2016).
10.10
Second Amendment to Office Lease, dated as of December 12, 2016, between FRIT San Jose Town and Country Village, LLC and the Registrant (incorporated by reference to Exhibit 10.12 filed with the Registrant’s Annual Report on Form 10-K filed on March 29, 2017).
10.11#
Employment Offer Letter between the Registrant and Doug Merritt, dated as of November 16, 2015 (incorporated by reference to Exhibit 10.21 filed with the Registrant’s Annual Report on Form 10-K filed on March 30, 2016).
10.12#
Amendment to Employment Offer Letter between the Registrant and Doug Merritt, dated as of June 4, 2019 (incorporated by reference to Exhibit 10.3 filed with the Registrant’s Quarterly Report on Form 10-Q filed on June 6, 2019).
10.13#
Employment Offer Letter between the Registrant and Susan St. Ledger, dated as of March 3, 2016 (incorporated by reference to Exhibit 10.1 filed with the Registrant’s Quarterly Report on Form 10-Q filed on June 9, 2016).
10.14#
Promotion Letter between the Registrant and Susan St. Ledger, dated as of October 3, 2017 (incorporated by reference to Exhibit 10.2 filed with the Registrant’s Quarterly Report on Form 10-Q filed on December 6, 2017).
10.15#
Amendment to Employment Offer Letter between the Registrant and Doug Merritt, dated as of May 7, 2020 (incorporated by reference to Exhibit 10.1 filed with the Registrant’s Quarterly Report on Form 10-Q filed on June 1, 2020).
10.16#
Amended and Restated Employment Offer Letter between the Registrant and Tim Tully, dated as of April 25, 2018 (incorporated by reference to Exhibit 10.1 filed with the Registrant’s Quarterly Report on Form 10-Q filed on June 8, 2018).
10.17#
Amended and Restated Employment Offer Letter between the Registrant and Scott Morgan, dated as of October 30, 2018 (incorporated by reference to Exhibit 10.1 filed with the Registrant’s Quarterly Report on Form 10-Q filed December 7, 2018).
112
10.18#
Employment Offer Letter between the Registrant and Jason Child, dated as of April 16, 2019 (incorporated by reference to Exhibit 10.2 filed with the Registrant’s Quarterly Report on Form 10-Q filed on June 6, 2019).
10.19#
Form of Amendment to Employment Offer Letter between the Registrant and certain of its executive officers (incorporated by reference to Exhibit 10.4 filed with the Registrant’s Quarterly Report on Form 10-Q filed on June 6, 2019).
10.20#Executive Bonus Plan (incorporated by reference to Exhibit 10.15 filed with the Registrant’s Registration Statement on Form S-1 filed on April 6, 2012).
10.21#Form of Stock Option Agreement under the 2012 Equity Incentive Plan (incorporated by reference to Exhibit 10.1 filed with the Registrant’s Current Report on Form 8-K filed on April 24, 2012).
10.22#Form of Restricted Stock Unit Agreement under the 2012 Equity Incentive Plan (incorporated by reference to Exhibit 10.2 filed with the Registrant’s Current Report on Form 8-K filed on April 24, 2012).
10.23#Form of Subscription Agreement under the 2012 Employee Stock Purchase Plan (incorporated by reference to Exhibit 10.3 filed with the Registrant’s Current Report on Form 8-K filed on April 24, 2012).
10.24#Form of Performance Unit Award Agreement under the 2012 Equity Incentive Plan (incorporated by reference to Exhibit 10.1 filed with the Registrant’s Quarterly Report on Form 10-Q filed on June 9, 2015).
10.25Form of Confirmation for Capped Call Transactions (incorporated by reference to Exhibit 10.1 filed with the Registrant’s Current Report on Form 8-K filed on September 21, 2018).
10.26Form of Confirmation for Capped Call Transactions (incorporated by reference to Exhibit 10.1 filed with the Registrant’s Current Report on Form 8-K filed on June 5, 2020).
21.1 List of subsidiaries of the Registrant.
23.1
Consent of PricewaterhouseCoopers LLP, Independent Registered Public Accounting Firm.
31.1
Certification of Principal Executive Officer Required Under Rule 13a-14(a) and 15d-14(a) of the Securities Exchange Act of 1934, as amended.
31.2
Certification of Principal Financial Officer Required Under Rule 13a-14(a) and 15d-14(a) of the Securities Exchange Act of 1934, as amended.
32.1
Certification of Principal Executive Officer and Principal Financial Officer Required Under Rule 13a-14(b) of the Securities Exchange Act of 1934, as amended, and 18 U.S.C. §1350.
101.INSInline XBRL Instance Document - the instance document does not appear in the Interactive Data File because its XBRL tags are embedded within the Inline XBRL document.
101.SCH Inline XBRL Taxonomy Schema Linkbase Document
101.CAL Inline XBRL Taxonomy Calculation Linkbase Document
101.DEF Inline XBRL Taxonomy Definition Linkbase Document
101.LAB Inline XBRL Taxonomy Labels Linkbase Document
101.PRE Inline XBRL Taxonomy Presentation Linkbase Document
104 Cover Page Interactive Data File (formatted as Inline XBRL and contained in Exhibit 101)
113

FOR
M 1
0-K
10.3#
2012 Equity Incentive Plan (incorporated by reference to Exhibit 10.3 filed with the Registrant’s Registration Statement on Form S-1 filed on April 6, 2012).
10.4#Amendment to 2012 Equity Incentive Plan, effective as of September 14, 2017 (incorporated by reference to Exhibit 10.1 filed with the Registrant’s Quarterly Report on Form 10-Q filed on December 6, 2017).
10.5#2012 Employee Stock Purchase Plan, as amended (incorporated by reference to Exhibit 10.5 filed with the Registrant’s Annual Report on Form 10-K filed on March 26, 2020).
10.6
Office Lease, dated as of April 29, 2014, between 270 Brannan Street, LLC and the Registrant (incorporated by reference to Exhibit 10.2 filed with the Registrant’s Quarterly Report on Form 10-Q filed on June 9, 2014).
10.7
First Amendment to Office Lease, dated as of March 1, 2018, between 270 Brannan Street, LLC and the Registrant (incorporated by reference to Exhibit 10.2 filed with the Registrant’s Quarterly Report on Form 10-Q filed on June 8, 2018).
10.8
Office Lease, dated as of August 24, 2015, between FRIT San Jose Town and Country Village, LLC and the Registrant (incorporated by reference to Exhibit 10.1 filed with the Registrant’s Quarterly Report on Form 10-Q filed on December 10, 2015).
10.9
First Amendment to Office Lease, dated as of May 23, 2016, between FRIT San Jose Town and Country Village, LLC and the Registrant (incorporated by reference to Exhibit 10.2 filed with the Registrant’s Quarterly Report on Form 10-Q filed on September 8, 2016).
10.10
Second Amendment to Office Lease, dated as of December 12, 2016, between FRIT San Jose Town and Country Village, LLC and the Registrant (incorporated by reference to Exhibit 10.12 filed with the Registrant’s Annual Report on Form 10-K filed on March 29, 2017).
10.11#
Employment Offer Letter between the Registrant and Doug Merritt, dated as of November 16, 2015 (incorporated by reference to Exhibit 10.21 filed with the Registrant’s Annual Report on Form 10-K filed on March 30, 2016).
10.12#
Amendment to Employment Offer Letter between the Registrant and Doug Merritt, dated as of June 4, 2019 (incorporated by reference to Exhibit 10.3 filed with the Registrant’s Quarterly Report on Form 10-Q filed on June 6, 2019).
10.13#
Employment Offer Letter between the Registrant and Susan St. Ledger, dated as of March 3, 2016 (incorporated by reference to Exhibit 10.1 filed with the Registrant’s Quarterly Report on Form 10-Q filed on June 9, 2016).
10.14#
Promotion Letter between the Registrant and Susan St. Ledger, dated as of October 3, 2017 (incorporated by reference to Exhibit 10.2 filed with the Registrant’s Quarterly Report on Form 10-Q filed on December 6, 2017).
10.15#
Amendment to Employment Offer Letter between the Registrant and Doug Merritt, dated as of May 7, 2020 (incorporated by reference to Exhibit 10.1 filed with the Registrant’s Quarterly Report on Form 10-Q filed on June 1, 2020).
10.16#
Amended and Restated Employment Offer Letter between the Registrant and Tim Tully, dated as of April 25, 2018 (incorporated by reference to Exhibit 10.1 filed with the Registrant’s Quarterly Report on Form 10-Q filed on June 8, 2018).
10.17#
Amended and Restated Employment Offer Letter between the Registrant and Scott Morgan, dated as of October 30, 2018 (incorporated by reference to Exhibit 10.1 filed with the Registrant’s Quarterly Report on Form 10-Q filed December 7, 2018).
112
10.18#
Employment Offer Letter between the Registrant and Jason Child, dated as of April 16, 2019 (incorporated by reference to Exhibit 10.2 filed with the Registrant’s Quarterly Report on Form 10-Q filed on June 6, 2019).
10.19#
Form of Amendment to Employment Offer Letter between the Registrant and certain of its executive officers (incorporated by reference to Exhibit 10.4 filed with the Registrant’s Quarterly Report on Form 10-Q filed on June 6, 2019).
10.20#Executive Bonus Plan (incorporated by reference to Exhibit 10.15 filed with the Registrant’s Registration Statement on Form S-1 filed on April 6, 2012).
10.21#Form of Stock Option Agreement under the 2012 Equity Incentive Plan (incorporated by reference to Exhibit 10.1 filed with the Registrant’s Current Report on Form 8-K filed on April 24, 2012).
10.22#Form of Restricted Stock Unit Agreement under the 2012 Equity Incentive Plan (incorporated by reference to Exhibit 10.2 filed with the Registrant’s Current Report on Form 8-K filed on April 24, 2012).
10.23#Form of Subscription Agreement under the 2012 Employee Stock Purchase Plan (incorporated by reference to Exhibit 10.3 filed with the Registrant’s Current Report on Form 8-K filed on April 24, 2012).
10.24#Form of Performance Unit Award Agreement under the 2012 Equity Incentive Plan (incorporated by reference to Exhibit 10.1 filed with the Registrant’s Quarterly Report on Form 10-Q filed on June 9, 2015).
10.25Form of Confirmation for Capped Call Transactions (incorporated by reference to Exhibit 10.1 filed with the Registrant’s Current Report on Form 8-K filed on September 21, 2018).
10.26Form of Confirmation for Capped Call Transactions (incorporated by reference to Exhibit 10.1 filed with the Registrant’s Current Report on Form 8-K filed on June 5, 2020).
21.1 List of subsidiaries of the Registrant.
23.1
Consent of PricewaterhouseCoopers LLP, Independent Registered Public Accounting Firm.
31.1
Certification of Principal Executive Officer Required Under Rule 13a-14(a) and 15d-14(a) of the Securities Exchange Act of 1934, as amended.
31.2
Certification of Principal Financial Officer Required Under Rule 13a-14(a) and 15d-14(a) of the Securities Exchange Act of 1934, as amended.
32.1
Certification of Principal Executive Officer and Principal Financial Officer Required Under Rule 13a-14(b) of the Securities Exchange Act of 1934, as amended, and 18 U.S.C. §1350.
101.INSInline XBRL Instance Document - the instance document does not appear in the Interactive Data File because its XBRL tags are embedded within the Inline XBRL document.
101.SCH Inline XBRL Taxonomy Schema Linkbase Document
101.CAL Inline XBRL Taxonomy Calculation Linkbase Document
101.DEF Inline XBRL Taxonomy Definition Linkbase Document
101.LAB Inline XBRL Taxonomy Labels Linkbase Document
101.PRE Inline XBRL Taxonomy Presentation Linkbase Document
104 Cover Page Interactive Data File (formatted as Inline XBRL and contained in Exhibit 101)
113

# Indicates management contract or compensatory plan.
*The schedules and other attachments to this exhibit have been omitted. The Registrant agrees to furnish a copy of any omitted schedules or attachments to the SEC upon request.
†
Certain portions of this exhibit have been omitted as the Registrant has determined (i) the omitted information is not material and (ii) the omitted information would likely cause harm to the Registrant if publicly disclosed.
114
SIGNATURES
Pursuant to the requirements of Section 13 or 15(d) of the Securities Exchange Act of 1934, the registrant has duly caused this report to be signed on its behalf by the undersigned, thereunto duly authorized, on March 31, 2021.
SPLUNK INC.
By: /s/ Douglas S. MerrittDouglas S. MerrittPresident and Chief Executive Officer
115

FOR
M 1
0-K
# Indicates management contract or compensatory plan.
*The schedules and other attachments to this exhibit have been omitted. The Registrant agrees to furnish a copy of any omitted schedules or attachments to the SEC upon request.
†
Certain portions of this exhibit have been omitted as the Registrant has determined (i) the omitted information is not material and (ii) the omitted information would likely cause harm to the Registrant if publicly disclosed.
114
SIGNATURES
Pursuant to the requirements of Section 13 or 15(d) of the Securities Exchange Act of 1934, the registrant has duly caused this report to be signed on its behalf by the undersigned, thereunto duly authorized, on March 31, 2021.
SPLUNK INC.
By: /s/ Douglas S. MerrittDouglas S. MerrittPresident and Chief Executive Officer
115

POWER OF ATTORNEY
KNOW ALL THESE PERSONS BY THESE PRESENTS, that each person whose signature appears below constitutes and appoints Douglas S. Merritt, Jason E. Child and Scott Morgan, and each of them, his or her attorneys-in-fact, each with full power of substitution, for him or her in any and all capacities, to sign any and all amendments to this Annual Report on Form 10-K, and to file the same, with exhibits thereto and other documents in connection therewith, with the Securities and Exchange Commission, hereby ratifying and confirming all that each said attorneys-in-fact or their substitute or substitutes, may do or cause to be done by virtue hereof.
Pursuant to the requirements of the Securities Exchange Act of 1934, this Annual Report on Form 10-K has been signed below by the following persons on behalf of the registrant and in the capacities and on the dates indicated.
116
Signature Title Date
/s/ Douglas S. MerrittPresident and Chief Executive Officer (Principal Executive Officer) March 31, 2021
Douglas S. Merritt
/s/ Jason E. ChildSenior Vice President and Chief Financial Officer (Principal Financial Officer) March 31, 2021
Jason E. Child
/s/ Timothy C. EmanuelsonChief Accounting Officer (Principal Accounting Officer) March 31, 2021
Timothy C. Emanuelson
/s/ Graham V. Smith Chairman and Director March 31, 2021Graham V. Smith
/s/ Sara J. Baack Director March 31, 2021Sara J. Baack
/s/ Mark T. Carges Director March 31, 2021Mark T. Carges
/s/ John G. Connors Director March 31, 2021John G. Connors
/s/ Patricia B. Morrison Director March 31, 2021Patricia B. Morrison
/s/ Stephen G. Newberry Director March 31, 2021Stephen G. Newberry
/s/ Elisa A. Steele Director March 31, 2021Elisa A. Steele
/s/ Sri Viswanath Director March 31, 2021Sri Viswanath
/s/ Sean Boyle Director March 31, 2021Sean Boyle
/s/ Dennis L. Via Director March 31, 2021Dennis L. Via
117

FOR
M 1
0-K
POWER OF ATTORNEY
KNOW ALL THESE PERSONS BY THESE PRESENTS, that each person whose signature appears below constitutes and appoints Douglas S. Merritt, Jason E. Child and Scott Morgan, and each of them, his or her attorneys-in-fact, each with full power of substitution, for him or her in any and all capacities, to sign any and all amendments to this Annual Report on Form 10-K, and to file the same, with exhibits thereto and other documents in connection therewith, with the Securities and Exchange Commission, hereby ratifying and confirming all that each said attorneys-in-fact or their substitute or substitutes, may do or cause to be done by virtue hereof.
Pursuant to the requirements of the Securities Exchange Act of 1934, this Annual Report on Form 10-K has been signed below by the following persons on behalf of the registrant and in the capacities and on the dates indicated.
116
Signature Title Date
/s/ Douglas S. MerrittPresident and Chief Executive Officer (Principal Executive Officer) March 31, 2021
Douglas S. Merritt
/s/ Jason E. ChildSenior Vice President and Chief Financial Officer (Principal Financial Officer) March 31, 2021
Jason E. Child
/s/ Timothy C. EmanuelsonChief Accounting Officer (Principal Accounting Officer) March 31, 2021
Timothy C. Emanuelson
/s/ Graham V. Smith Chairman and Director March 31, 2021Graham V. Smith
/s/ Sara J. Baack Director March 31, 2021Sara J. Baack
/s/ Mark T. Carges Director March 31, 2021Mark T. Carges
/s/ John G. Connors Director March 31, 2021John G. Connors
/s/ Patricia B. Morrison Director March 31, 2021Patricia B. Morrison
/s/ Stephen G. Newberry Director March 31, 2021Stephen G. Newberry
/s/ Elisa A. Steele Director March 31, 2021Elisa A. Steele
/s/ Sri Viswanath Director March 31, 2021Sri Viswanath
/s/ Sean Boyle Director March 31, 2021Sean Boyle
/s/ Dennis L. Via Director March 31, 2021Dennis L. Via
117

Copies of Splunk Inc.’s Annual Report, as well as other financial reports and news from Splunk Inc., may be read and downloaded from our website at http://investors.splunk.com. If you do not have online access, you may request printed materials by contacting Splunk Inc. Investor Relations at: 415.848.8476.
AuditorsPricewaterhouseCoopers LLPSan Jose, CA
Corporate CounselWilson Sonsini Goodrich & Rosati, Professional CorporationPalo Alto, CA
Stock Transfer Agent and Registrar of StockAST6201 15th Avenue Brooklyn, NY 11219Phone: 800.937.5449www.astfinancial.comEmail: [email protected]
Stock ListingSplunk Inc. common stock is traded on NASDAQ Global Select Market, listed under the symbol “SPLK”
Investor RelationsContact InformationSplunk Inc.3098 Olsen DriveSan Jose, CA 95128Email: [email protected]: 415.848.8476
Sara BaackChief Product Officer, Equinix
Sean BoyleCOO and CFO, Wildlife Studios Limited
Mark CargesFormer CTO, eBay
Doug MerrittPresident and Chief Executive Officer, Splunk
Patricia MorrisonFormer EVP, Customer Support Services, and CIO of Cardinal Health
Stephen NewberryFormer Chairman, Lam Research
Graham SmithIndependent Chair, Splunk
Elisa SteeleIndependent Board Member
Sri ViswanathCTO, Atlassian
General Dennis ViaEVP, Booz Allen Hamilton and Retired Four-Star U.S. Army General
Doug MerrittPresident and Chief Executive Officer
Teresa CarlsonPresident and Chief Growth Officer
Jason ChildSenior Vice President and Chief Financial Officer
Ammar MaraqaSenior Vice President, Chief Strategy Officer
Scott MorganSenior Vice President, Chief Legal Officer, Global Affairs and Secretary
Jeremy RishelSenior Vice President, Engineering
Kristen RobinsonSenior Vice President, Chief People Officer
John SabinoSenior Vice President, Chief Customer Officer
Sendur SellakumarSenior Vice President, Cloud and Chief Product Officer
Christian SmithSenior Vice President, Chief Revenue Officer
Tim TullySenior Vice President, Chief Technology Officer

Corporate Headquarters270 Brannan StreetSan Francisco, CA 94107Phone: +1 415.848.8400Fax: +1 415.358.5757splunk.com
Europe, Middle East and AfricaSplunk Services UK LimitedBrunel Building1 & 2 Canalside WalkLondon, W2 1DGUnited KingdomPhone: +44 0.20.3204.4300
Asia Pacific Splunk Services Hong Kong Limited思博服務香港有限公司Suites 2909-2913, 29/F, Tower 6The Gateway, Harbour City,Tsim Sha Tsui, KowloonHong KongPhone: +852 3975.4000
Splunk, Splunk>, Data-to-Everything, D2E and Turn Data Into Doing are trademarks and registeredtrademarks of Splunk Inc. in the United States and other countries. All other brand names, product names or trademarks belong to their respective owners. © 2021 Splunk Inc. All rights reserved.
Sp
lunk Inc. Annual R
eport and
Proxy S
tatement
FY21