Embed Size (px)
Citation preview


ISSN 1453 – 7303 “HIDRAULICA” (No. 2/2018) Magazine of Hydraulics, Pneumatics, Tribology, Ecology, Sensorics, Mechatronics
3
CONTENTS
EDITORIAL: ON Patience to Read Ph.D. Petrin DRUMEA
• Beam Sag Compensation in Single Column Heavy Duty Vertical Lathes Prof. PhD Eng. Dan PRODAN, Prof. PhD Eng. Anca BUCUREȘTEANU, Assoc. Prof. PhD Eng. Adrian MOTOMANCEA
6 - 13
• Algorithm for Optimal Design of Pressurized Toroidal LPG Fuel Tanks with Constant Section Described by Imposed Algebraic Plane Curves
Assoc. Prof. PhD. Eng.Ștefan ŢĂLU, Assoc. Prof. PhD. Eng.Mihai ŢĂLU
14-21
• A New Solution for Water Aeration PhD Student Eugen TĂMĂȘANU, PhD Student Mădălina ZAMFIR, Prof. Dr. Eng. Nicolae BĂRAN, PhD Student Rareș PĂUN, Lecturer Dr. Eng. Mihaela CONSTANTIN, Eng. Corina MOGA
22 - 28
• Design Details of a Turbine Model Used for Energy Conversion in Low Flow Rate Water Streams
Assistant professor Fănel Dorel ȘCHEAUA
29 - 32
• From Human-Environment Interaction to Environmental Informatics (II): the Sustainability evolution as requirement of Knowledge-based Society
PhD stud. Bogdan CIORUȚA, Assoc. Prof. Eng. Mirela COMAN, Stud. Alexandru LAURAN
33 - 42
• Analysis of Intelligent Control and Interface in Pressurized Liquid Injection Systems for Competitive Technical Solutions
PhD. Eng. Iosif FERENȚI, Prof. PhD Eng. Dan OPRUȚA, Lect. PhD. Eng. Doru-Laurean BĂLDEAN
43- 48
• The Optimal CAD Design of a 3D Hexagonal Toroid with Regular Hexagonal Cross-Section Used in Manufacturing of LPG Storage Tanks
Assoc. Prof. PhD. Eng.Mihai ŢĂLU, Assoc. Prof. PhD. Eng.Ștefan ŢĂLU
49 - 56
• A Point of View about Ecological Status of Maritime Lakes Prof. Dr. Eng. Mariana PANAITESCU, Prof. Dr. Eng. Fănel-Viorel PANAITESCU, Senior lecturer Dr. biologist Simona GHIȚĂ, Assist. Drd. Eng. Iulia-Alina ANTON
57 – 62

ISSN 1453 – 7303 “HIDRAULICA” (No. 2/2018) Magazine of Hydraulics, Pneumatics, Tribology, Ecology, Sensorics, Mechatronics
4
BOARD
DIRECTOR OF PUBLICATION
- PhD. Eng. Petrin DRUMEA - Hydraulics and Pneumatics Research Institute in Bucharest, Romania
EDITOR-IN-CHIEF
- PhD.Eng. Gabriela MATACHE - Hydraulics and Pneumatics Research Institute in Bucharest, Romania
EXECUTIVE EDITOR, GRAPHIC DESIGN & DTP
- Ana-Maria POPESCU - Hydraulics and Pneumatics Research Institute in Bucharest, Romania
EDITORIAL BOARD
PhD.Eng. Gabriela MATACHE - Hydraulics and Pneumatics Research Institute in Bucharest, Romania
Assoc. Prof. Adolfo SENATORE, PhD. – University of Salerno, Italy
PhD.Eng. Catalin DUMITRESCU - Hydraulics and Pneumatics Research Institute in Bucharest, Romania
Assoc. Prof. Andrei DRUMEA, PhD. – University Politehnica of Bucharest, Romania
PhD.Eng. Radu Iulian RADOI - Hydraulics and Pneumatics Research Institute in Bucharest, Romania
Assoc. Prof. Constantin RANEA, PhD. – University Politehnica of Bucharest; National Authority for Scientific Research and Innovation (ANCSI), Romania
Prof. Aurelian FATU, PhD. – Institute Pprime – University of Poitiers, France
PhD.Eng. Małgorzata MALEC – KOMAG Institute of Mining Technology in Gliwice, Poland
Prof. Mihai AVRAM, PhD. – University Politehnica of Bucharest, Romania Lect. Ioan-Lucian MARCU, PhD. – Technical University of Cluj-Napoca, Romania
COMMITTEE OF REVIEWERS
PhD.Eng. Corneliu CRISTESCU – Hydraulics and Pneumatics Research Institute in Bucharest, Romania
Assoc. Prof. Pavel MACH, PhD. – Czech Technical University in Prague, Czech Republic
Prof. Ilare BORDEASU, PhD. – Politehnica University of Timisoara, Romania
Prof. Valeriu DULGHERU, PhD. – Technical University of Moldova, Chisinau, Republic of Moldova
Assist. Prof. Krzysztof KĘDZIA, PhD. – Wroclaw University of Technology, Poland
Prof. Dan OPRUTA, PhD. – Technical University of Cluj-Napoca, Romania
PhD.Eng. Teodor Costinel POPESCU - Hydraulics and Pneumatics Research Institute in Bucharest, Romania
PhD.Eng. Marian BLEJAN - Hydraulics and Pneumatics Research Institute in Bucharest, Romania
Ph.D. Amir ROSTAMI – Georgia Institute of Technology, USA
Prof. Adrian CIOCANEA, PhD. – University Politehnica of Bucharest, Romania
Prof. Carmen-Anca SAFTA, PhD. - University Politehnica of Bucharest, Romania
Assoc. Prof. Mirela Ana COMAN, PhD. – Technical University of Cluj-Napoca, North University Center of Baia Mare, Romania
Prof. Ion PIRNA, PhD. – The National Institute of Research and Development for Machines and Installations Designed to Agriculture and Food Industry - INMA Bucharest, Romania
Assoc. Prof. Constantin CHIRITA, PhD. – “Gheorghe Asachi” Technical University of Iasi, Romania
Published by: Hydraulics and Pneumatics Research Institute, Bucharest-Romania Address: 14 Cuţitul de Argint, district 4, Bucharest, 040558, Romania Phone: +40 21 336 39 91; Fax: +40 21 337 30 40; e-Mail: [email protected]; Web: www.ihp.ro with support from: National Professional Association of Hydraulics and Pneumatics in Romania - FLUIDAS e-Mail: [email protected]; Web: www.fluidas.ro
HIDRAULICA Magazine is indexed by international databases
ISSN 1453 – 7303; ISSN – L 1453 – 7303

ISSN 1453 – 7303 “HIDRAULICA” (No. 2/2018) Magazine of Hydraulics, Pneumatics, Tribology, Ecology, Sensorics, Mechatronics
5
EDITORIAL
ON Patience to Read
Everyone is talking in public places and media about the acute
lack of interest in reading, especially about the tendency to get
informed through ‘ready-made ideas’. Usually, the finger is
pointed at young people who are said that no longer want to
read the materials thoroughly but catchup summaries from
someone else who has read those materials and, many times,
is not interested in presenting the real content.
Ph.D.Eng. Petrin DRUMEA
MANAGING EDITOR
That is what happened to me, too, with a group of young people in which I have great
confidence and which I do not suspect, not for a moment, of wicked intentions. We had a
discussion about upgrading an activity (the organizing of a scientific event) of interest to
our team and I noticed that many of their proposals proved that they have not read the
history of the event in question, as they kept presenting ideas that have been tested over
time and produced unconvincing results as possible innovations. Knowing the very good
quality of this group of young people, I asked myself about the reason for this situation,
which actually is not unique.
The first idea that came to my mind was that the possible fault lies with the guys who
taught them at school (and especially accepted the fact) that there is no need to read a
book, it is enough to get a summary of it from somewhere on the Internet, and ‘swallow’
that summary ‘without chewing’ it.
The second idea was that the Internet has become nowadays the only source of
information, and there is no checking of the information found by other sources.
The third idea was that people are taught from a tender age (the school age) that one can
be ‘self-sufficient’ if one can get money with no effort and as an almost unlettered person,
especially since television and newspapers give a lot of such examples every day.
After a more serious analysis, I have come to the conclusion that it is hard to convince
someone to love reading and thus to get a serious self-education, even a serious technical
self-education, as long as too many of those who occupy one’s time, either as teachers or
as managers, prove that there is a great difference between theory and daily practice.
I'm beginning to think I have addressed a difficult topic, which I do not quite master, and
which may cause me some inconvenience with people I really care about. So, I’d better
stop here, and, in the end, I wish that the topic of this editorial not to be a real one but a
wrong impression of mine.
Wishing you all good health,
Petrin Drumea

ISSN 1453 – 7303 “HIDRAULICA” (No. 2/2018) Magazine of Hydraulics, Pneumatics, Tribology, Ecology, Sensorics, Mechatronics
6
Beam Sag Compensation in Single Column Heavy Duty Vertical Lathes
Prof. PhD Eng. Dan PRODAN1, Prof. PhD Eng. Anca BUCUREȘTEANU1, Assoc. Prof. PhD Eng. Adrian MOTOMANCEA1
1 University POLITEHNICA of Bucharest, [email protected], [email protected], [email protected]
Abstract: This paper shows some of the theoretical and experimental research activities carried out by the authors during the remanufacturing of a heavy duty vertical lathe. The research focused on the diminution of the beam sag (deflection) when the vertical lathe has only one column. The paper presents some of the mathematical models and calculations used for this purpose but also the experimental results along with mechanical-hydraulic solutions enabling the compensation of the deflection caused by the cross-rail own weight but also by the weight of the saddle and rail head in different positions.
Keywords: Heavy duty vertical lathe, beam sag compensation, hydraulic systems for compensation
1. Influence of cross-rail deflection on the accuracy of single column heavy duty vertical lathes
The heavy duty vertical lathes are machine tools meant for the machining of the surfaces by turning, milling and drilling operations, usually in the case of the cylindrical blanks in which the ratio of height and diameter ranges from 0.5 to 0.9 [1, 2]. The structure of such a machine-tool is shown schematically in Figure 1.
Fig. 1. Vertical lathe with 10000 mm table
The notations used in Figure 1 are the following ones: 1 - bed, 2 - table, 3 - guideways of the under-column saddle, 4 - under-column saddle, 5 - column, 6 - crossrail, 7 - slide and ram assembly (rail head), X, Z, C - CNC axes of the machine, P - plane defining the table surface (horizontal), G - weight of the rail head, n - rotational speed of table 2, m - cross-rail weight distributed along its length, L - cross-rail length, x - current position of the rail head on the cross-rail. The main kinematic chain, completed by table 2, is assembled on the bed 1 of the machine. The table rotates at speed n in plane P (axis C). The under-column saddle 4 operates on the guideways 3 which are also placed on the bed. The column 5 is clamped on this saddle and together they can perform positioning movements, depending on the diameter of the blank. The cross-rail 6 executes a positioning movement too, this time depending on the height of the blank.

ISSN 1453 – 7303 “HIDRAULICA” (No. 2/2018) Magazine of Hydraulics, Pneumatics, Tribology, Ecology, Sensorics, Mechatronics
7
We consider that it has the weight of value m distributed along the length L. The rail head 7 has the weight G and can travel horizontally (X axis), but it also contains a ram that makes the movements vertically - Z axis. The current position of the rail head is determined by the size x. The basic geometrical conditions required for the execution of specific machining operations can come down to: - perpendicularity of X and Z directions (axes); - parallelism of X axis with plane P. The two geometrical conditions entail also the perpendicularity condition of Z axis on plane P. Because of the weight G and the distributed weight m, the cross-rail curves and leads to the appearance of the sag f(x) and the angle φ(x), depending on the position x of the rail head, as shown in Figure 2.
Fig. 2. Block diagram of the vertical lathe
This figure uses the same notations as in the previous figure, plus the following notations: f(x) - cross-rail deflection (sag) depending on the variable x, φ(x) - angle of inclination of the cross-rail related to the horizontal due to weight G and load m.
2. Compensation of the errors entailed by the cross-rail deflection
It is impossible to eliminate totally the errors entailed by cross-rail deflection. There are different methods to reduce these errors. Some of the most frequently used ones are shown below: – Machining of the guideways that ensure the parallelism with the plane P under a suitable angle
for deflection compensation. – Compensation of the deflections by means of CNC equipment [3]. – Initial sloping of the cross-rail on column guideways with a certain angle. – Compensation of cross-rail deflection by stressing it with a hydraulic cylinder. This paper presents the fourth solution. Usually, one or several of the solutions mentioned above can be applied to this type of machines. Figure 3 shows the operating principle of the discharge by means of hydraulic cylinders. In Figure 3, besides the elements defined in Figures 1 and 2, it is also noted: p(x)- supply pressure, T - tank of the hydraulic unit, F(x) - developed force parallel to X axis. On the cross-rail 6 there is a hydraulic cylinder supplied with oil at p(x) pressure on the active surface. The cylinder draws the cross-rail extension 9 by means of the rod 10. Cross-rail extension has the height a. The bending moment related to the point O, created by the weight G with the arm x and the distributed weight m with the arm L is compensated by the moment given by the force F(x) having the arm a. For a null resultant moment it is possible to take into consideration:
𝐹(𝑥)𝑎 = 𝐺𝑥 +𝑚𝐿2
2 (1)

ISSN 1453 – 7303 “HIDRAULICA” (No. 2/2018) Magazine of Hydraulics, Pneumatics, Tribology, Ecology, Sensorics, Mechatronics
8
Fig. 3. Beam sag compensation by means of a hydraulic unit
The relation (1) helps to determine the value of the force F(x) depending on the rail head position (size x). The necessary pressure too is an x function and has the expression below:
𝑝(𝑥) =𝐹(𝑥)
𝜋(𝐷2−𝑑2)
4
(2)
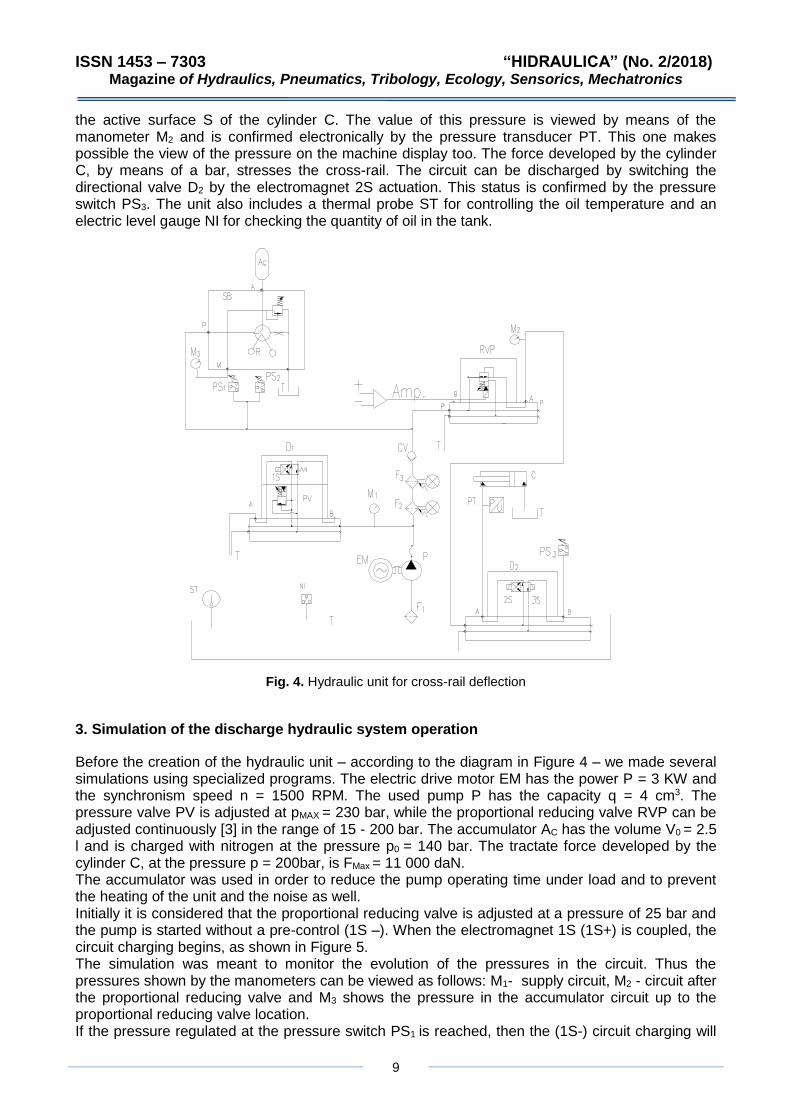
The numerical control equipment allows measuring the size x in real time; this size determines the amount of pressure required for the compensation. The pressure is adjusted by means of a proportional reducing valve [3, 4]. Even if this size is continuously measured, in practice it is sent towards the hydraulic equipment as discrete signals with an imposed pitch (100 mm usually). Therefore, the cylinder supply pressure increases as the size x increases. For such a drive it is recommended to use the proportional type hydraulic devices. The method is effective and solves also the X and Z axes perpendicularity issue. This method is also applied in the case of the horizontal boring and milling machines (HBMs) [4, 5]. The major disadvantage of the method is the price of the necessary hydraulic devices. A hydraulic unit as shown in Figure 4 was built in order to compensate the deflection of the cross-rail by stressing it. Notations used in Figure 4: P - pump, EM - electric motor for pump actuation, F1, F2, F3 - filters, M1, M2, M3 - manometers, PV - pressure valve, D1, D2 - directional valves, PS1, PS2, PS3 - pressure switches, RVP - proportional reducing valve, C - cylinder, PT - pressure transducer, Ac - accumulator, SB - safety block, R - valve for accumulator discharge, Amp. - Electronic amplifier, 1S, 2S, 3S - electromagnets, ST - thermal probe, NI - level gauge. The pump P, driven by the electric motor EM, sucks the oil from the tank T through the suction filter F1. The filtration required by such units (3-5 μm) is performed by the filters F2 and F3. The maximum operating pressure of the unit is adjusted by means of the pressure valve PV and can be read on the manometer M1. The hydraulic unit includes – after the check valve CV - a circuit which contains the accumulator Ac [6] assembled on the safety block SB. The accumulator is charged up to the pressure adjusted by the pressure switch PS1 and is discharged up to the pressure adjusted by the pressure switch PS2. The discharge of the accumulator at the tank is made by actuating the valve R. The accumulator is coupled to the charging circuit by commanding the electromagnet 1S from the directional valve D1. The pressure in the accumulator circuit can be viewed any time by means of the manometer M3. The proportional reducing valve RVP is supplied from the accumulator circuit. This valve is controlled by the machine equipment so that the adjusted pressure increases in the same time with the increase of size x. The control signal originates from the position transducer of X axis from where it is sent to the amplifier block Amp. When the directional valve D2 is set on the position shown in the figure above, after the actuation of the electromagnet 3S the oil with the pressure adjusted by the proportional reducing valve is sent to
ISSN 1453 – 7303 “HIDRAULICA” (No. 2/2018) Magazine of Hydraulics, Pneumatics, Tribology, Ecology, Sensorics, Mechatronics
9
the active surface S of the cylinder C. The value of this pressure is viewed by means of the manometer M2 and is confirmed electronically by the pressure transducer PT. This one makes possible the view of the pressure on the machine display too. The force developed by the cylinder C, by means of a bar, stresses the cross-rail. The circuit can be discharged by switching the directional valve D2 by the electromagnet 2S actuation. This status is confirmed by the pressure switch PS3. The unit also includes a thermal probe ST for controlling the oil temperature and an electric level gauge NI for checking the quantity of oil in the tank.
Fig. 4. Hydraulic unit for cross-rail deflection
3. Simulation of the discharge hydraulic system operation
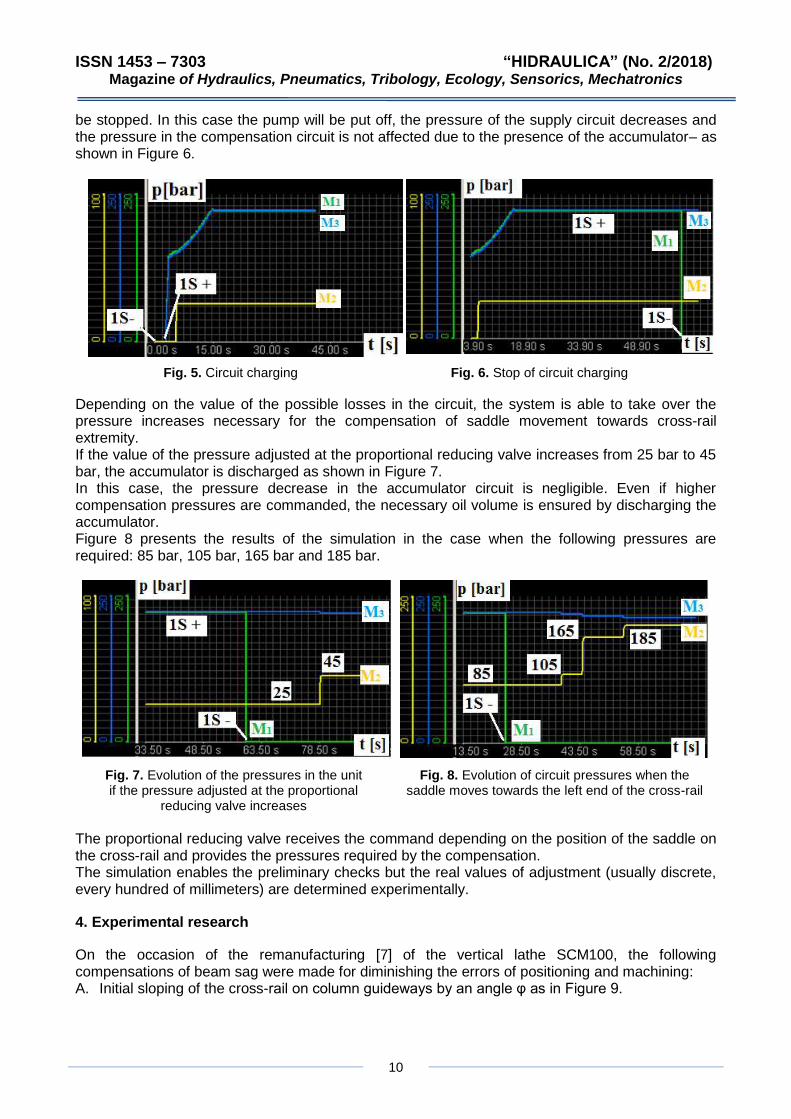
Before the creation of the hydraulic unit – according to the diagram in Figure 4 – we made several simulations using specialized programs. The electric drive motor EM has the power P = 3 KW and the synchronism speed n = 1500 RPM. The used pump P has the capacity q = 4 cm3. The pressure valve PV is adjusted at pMAX = 230 bar, while the proportional reducing valve RVP can be adjusted continuously [3] in the range of 15 - 200 bar. The accumulator AC has the volume V0 = 2.5 l and is charged with nitrogen at the pressure p0 = 140 bar. The tractate force developed by the cylinder C, at the pressure p = 200bar, is FMax = 11 000 daN. The accumulator was used in order to reduce the pump operating time under load and to prevent the heating of the unit and the noise as well. Initially it is considered that the proportional reducing valve is adjusted at a pressure of 25 bar and the pump is started without a pre-control (1S –). When the electromagnet 1S (1S+) is coupled, the circuit charging begins, as shown in Figure 5. The simulation was meant to monitor the evolution of the pressures in the circuit. Thus the pressures shown by the manometers can be viewed as follows: M1- supply circuit, M2 - circuit after the proportional reducing valve and M3 shows the pressure in the accumulator circuit up to the proportional reducing valve location. If the pressure regulated at the pressure switch PS1 is reached, then the (1S-) circuit charging will
ISSN 1453 – 7303 “HIDRAULICA” (No. 2/2018) Magazine of Hydraulics, Pneumatics, Tribology, Ecology, Sensorics, Mechatronics
10
be stopped. In this case the pump will be put off, the pressure of the supply circuit decreases and the pressure in the compensation circuit is not affected due to the presence of the accumulator– as shown in Figure 6.
Fig. 5. Circuit charging Fig. 6. Stop of circuit charging
Depending on the value of the possible losses in the circuit, the system is able to take over the pressure increases necessary for the compensation of saddle movement towards cross-rail extremity. If the value of the pressure adjusted at the proportional reducing valve increases from 25 bar to 45 bar, the accumulator is discharged as shown in Figure 7. In this case, the pressure decrease in the accumulator circuit is negligible. Even if higher compensation pressures are commanded, the necessary oil volume is ensured by discharging the accumulator. Figure 8 presents the results of the simulation in the case when the following pressures are required: 85 bar, 105 bar, 165 bar and 185 bar.
Fig. 7. Evolution of the pressures in the unit if the pressure adjusted at the proportional
reducing valve increases
Fig. 8. Evolution of circuit pressures when the saddle moves towards the left end of the cross-rail
The proportional reducing valve receives the command depending on the position of the saddle on the cross-rail and provides the pressures required by the compensation. The simulation enables the preliminary checks but the real values of adjustment (usually discrete, every hundred of millimeters) are determined experimentally.
4. Experimental research
On the occasion of the remanufacturing [7] of the vertical lathe SCM100, the following compensations of beam sag were made for diminishing the errors of positioning and machining: A. Initial sloping of the cross-rail on column guideways by an angle φ as in Figure 9.

ISSN 1453 – 7303 “HIDRAULICA” (No. 2/2018) Magazine of Hydraulics, Pneumatics, Tribology, Ecology, Sensorics, Mechatronics
11
Fig. 9. Compensation of errors by assembling the cross-rail in an angle φ related to the vertical
Notations used in Figure 9: L - cross-rail length, G - weight of the rail head, m - cross-rail distributed weight, X, Z - work axes, x - position of the rail head on X axis, B - guiding width of the cross-rail on the column, f - sag (linear deflection), φ - angle in which the assembling is made, d - size of closing gibs. The other notations are the same as the notations used in the previous figures. If an angle φ is imposed (calculated or experimentally determined), the closing gibs of the guideways of the cross-rail 6 on the column 5 will be so machined to ensure the achievement of the size d as in the figure. The value of the size d is determined by means of the relation:
𝑑 = 𝐵𝑓
𝐿 (3)
Keeping the same notations as above, Figure 10 presents the zones of the front guideways (GF) and back guideways (GB) of the cross-rail where special closing gibs were assembled. Their angle (φ) is determined experimentally. Closing gibs with φ = 0 will be assembled in the first phase. In these conditions, the sag at the extremity of the cross-rail will be measured in different positions of the rail-head.
Fig. 10. Front guideways (GF) and back quideways (GB) of the cross-rail on the column that are adjusted by means of the closing gibs
B. Compensation of the deflection of the cross-rail by stressing it with the help of a hydraulic cylinder
The real hydraulic unit is shown in Figure 11 which uses the same notations as Figure 4. The volume of the tank is 100 l. The accumulator keeps the pressure in circuit enough time after its charging and thus enables even the stop of the electromotor EM. This operation mode (START/STOP) prevents the excessive heating of the unit [6].

ISSN 1453 – 7303 “HIDRAULICA” (No. 2/2018) Magazine of Hydraulics, Pneumatics, Tribology, Ecology, Sensorics, Mechatronics
12
Fig. 11. Real hydraulic unit
Notations in Figure 11 are the same as the ones used in the previous figures. This hydraulic unit can operate at a maximum pressure of 250 bar with proportional regulation in the range 0-210 bar. The active segment of the cylinder C is the one that determines (in this case) the value of the stressing force F. In conclusion, we can say that the compensation of the errors caused by the cross-rail deflection in this machine was performed in several steps: - After grinding the guideways of the column cross-rail (perpendicular to the reference plane P)
and the guideways of the cross-rail on which operates the saddle of the rail head parallel to the plane P (X axis), we made the assembling. In the absence of the rail head, measurements were performed to determine the necessary size at the closing gibs.
- After assembling the rail head on its saddle, there were determined – by several attempts – the necessary pressures for beam sag compensation with a pitch of 100 mm on X axis. In this case, it was also measured the perpendicularity between the plane P and the axis Z.
- After finishing the building of the remanufactured machine and after making the correction mentioned above, one has checked the geometrical accuracy conditions. The values recommended by norms are the values for two-columns vertical lathes (machines in which the cross-rail deflection is more reduced thanks to their construction) [4, 7]. Some of these values are mentioned in Table 1.
Table 1: The values of the measurement
Measurement name Value obtained /value recommended [mm/m]
Table flatness (plane P) 0.04/0.04
Horizontality of compensated cross-rail 0.05/0.04
Straightness of railhead travel (X axis) 0.04/0.04
Parallelism of X axis and plane P 0.05/0.04
Straightness of ram vertical travel (Z axis) related to table axis (plane P)
0.03/0.03
Parallelism of Z axis and table axis (perpendicular to plane P)
0.04/0.03
The table above shows that - thanks to the corrections made - the accuracy of the single column machine is not considerably smaller than the accuracy of the two-columns machines.
5. Conclusions
The heavy duty machine tools are machines suitable for the remanufacturing process. Their overall size, complexity and price justify the investments required by the remanufacturing. New and modern solutions can be applied on the occasion of the remanufacturing, solutions that did not exist or were not applied during the initial manufacture. In the case of the remanufactured heavy duty vertical lathe, intended for the machining of the work pieces up to 100 t by turning, milling, drilling etc. operations, the remanufacturing represented a variant to be preferred to the purchase

ISSN 1453 – 7303 “HIDRAULICA” (No. 2/2018) Magazine of Hydraulics, Pneumatics, Tribology, Ecology, Sensorics, Mechatronics
13
of a brand new machine. The remanufacture aimed also at improving the machining and positioning accuracy, including the interpolation accuracy. Theoretical research and real measurements were made to this extent. Finally, there were chosen the possible solutions to be actually applied: initial assembling of the cross-rail so that the X axis remains parallel to plane P through deflection; compensation of the deflection of the cross-rail by stressing it with the help of a special hydraulic unit; entry of compensations in the control equipment, with a certain pitch on X axis. Taking into consideration the complexity of the construction and the specific difficulties involved by the assembly of such machine, the values obtained through mathematical models were corrected on the basis of experimental measurements.
References
[1] Joshi, P. H. Machine tools handbook. New Delhi, McGraw-Hill Publishing House, 2007. [2] Perovic, Bozina. Machine tools handbook/Handbuch Werkzeug-Maschinen. Munchen, Carl Hanser
Verlag, 2006. [3] *** Catalogues and leaflets GE FANUC, SIEMENS, BOSCH REXROTH. [4] Prodan, Dan. Heavy machine tools. Mechanical and Hydraulic Systems/Maşini-unelte grele. Sisteme
mecanice si hidraulice. Bucharest, Printech Publishing House, 2010. [5] Prodan, Dan, Adrian Ghionea and George Constantin. "Hydraulic system for quill deflection
compensation in AFP 180 type machine." Paper presented at International Conference of Scientific Communications "Modern Technologies Quality, Restructuration", Chişinău, Republic of Moldova, Section 6: 145-150, ISBN 9975-9875-2, ISBN 9975-9875-4-1, May 18-21, 2005.
[6] Bucuresteanu, Anca. Pneumatic Hydraulic Accumulators. Use and Modeling/Acumulatoare pneumohidraulice. Utilizare si modelare. Bucharest, Printech Publishing House, 2001.
[7] Prodan, Dan and Sorin Marinescu. Remanufacturing and Modeling of Machine Tools. Hydraulic Systems/Refabricarea şi modelarea maşinilor-unelte. Sisteme hidraulice. Bucharest, Technical Publishing House, 2005.

ISSN 1453 – 7303 “HIDRAULICA” (No. 2/2018) Magazine of Hydraulics, Pneumatics, Tribology, Ecology, Sensorics, Mechatronics
14
Algorithm for Optimal Design of Pressurized Toroidal LPG Fuel Tanks with Constant Section Described by Imposed Algebraic Plane Curves
Assoc. Prof. PhD. Eng. Ștefan ŢĂLU1, Assoc. Prof. PhD. Eng. Mihai ŢĂLU2,*
1Technical University of Cluj-Napoca, The Directorate of Research, Development and Innovation Management (DMCDI), Constantin Daicoviciu Street, no. 15, Cluj-Napoca, 400020, Cluj county, Romania. E-mail: [email protected]
2 University of Craiova, Faculty of Mechanics, Department of Applied Mechanics and Civil Engineering, Calea București Street, no. 107, 200512 Craiova, Dolj county, Romania. Corresponding author* e-mail: [email protected]
Abstract: The purpose of this study is to provide a tested, validated, and documented algorithm for optimal design of pressurized toroidal LPG fuel tanks with constant section described by imposed algebraic plane curves. Computer aided investigations are carried out using three-dimensional models and can offer high benefits for the design of toroidal LPG fuel tanks used in automotive industry.
Keywords: Automotive industry, algorithm, industrial engineering design, optimization methods, pressurized toroidal LPG fuel tank
1. Introduction
During the past few decades the global auto industry has experienced some major structural changes in research and development, macro-economic structural conditions, global production networks, global climate change and global financial crisis [1-7]. The storage fuel tanks used in the automotive industry are made from aluminum alloys or various types of steel for safely storing fuel: compressed natural gas (CNG) or liquefied petroleum gas (LPG) [8-14]. The computer-aided design, construction, installation, testing and monitoring requirements of the storage fuel tanks are bounded and regulated by a comprehensive list of requirements documented in various codes and national and international standards [15-19]. The multi-objective optimization techniques of the fuel tanks are based on effective strategies and flexible tools of integrated design processes and efficient data management for decision based multidisciplinary design [1, 15-19]. Computer-aided design (both standardized and modular) of the fuel tanks involves a deeper insight of geometrical elements considering the supershapes design variables [20, 21], specific structural parameters [8-14], geometrical conditions [15], design constraints [2-7], computer tools [22-27], numerical computational methods [28-30], visualization techniques [31-37], and measurement methods [38, 39]. In order to improve the construction requirements, performance tests, comfort, safety and vehicle durability the pressurized toroidal LPG fuel tanks are located in different vehicle places especially designed by the vehicle's manufacturer (as shown in fig. 1).
Fig. 1. Different locations of the pressurized toroidal LPG fuel tanks

ISSN 1453 – 7303 “HIDRAULICA” (No. 2/2018) Magazine of Hydraulics, Pneumatics, Tribology, Ecology, Sensorics, Mechatronics
15
In this research, a simple and efficient algorithm for optimal design of pressurized toroidal LPG fuel tanks with constant section described by imposed algebraic plane curves is proposed.
2. Design methodology
In our study, an optimization algorithm of the pressurized toroidal LPG fuel tank model that can reduce final product mass, while improving storage efficiencies is proposed. The algorithm has two parts: A) in the first part is proposed a class of toroidal surfaces with cross-section optimized in terms of shape (without knowing their thickness); B) in the second part is determined the optimized dimensions of the toroidal cover resulting from the mechanical resistance conditions according to the combinations of stresses encountered in exploitation or mechanical requirements imposed by homologation tests.
2.1 The generation of the optimized class of geometric shapes for the cross-section
The steps in this stage are as follows: A1. The determination of the maximum dimensions of the cylinder (in which the tor is inserted), based on design constraints allocated to the fuel tank on the vehicle. It is determined: the radius R and the height H of the cylinder (as shown in fig. 2).
Fig. 2. The geometrical model of cylinder in which the tor is inserted
A2. The specification of the required algebraic plane curve and the mathematical equations used to generate the cross-section, and in the cases of families of curves one of the particular forms is indicated. As an example for a series of polynomial algebraic curves closed by degrees: 2, 4, 5, 6, 8 and 12, the parametric spatial modeling of the toroidal surface is shown together with the corresponding mathematical equation used to generate the cross-section (as shown in fig. 3).
a) b) c)

ISSN 1453 – 7303 “HIDRAULICA” (No. 2/2018) Magazine of Hydraulics, Pneumatics, Tribology, Ecology, Sensorics, Mechatronics
16
d) e) f)
g) h) i)
j) k) l)
m) n) p) Fig. 3. Generation of the toroidal surface from a series of polynomial algebraic curves closed by degrees: 2,
4, 5, 6, 8 and 12

ISSN 1453 – 7303 “HIDRAULICA” (No. 2/2018) Magazine of Hydraulics, Pneumatics, Tribology, Ecology, Sensorics, Mechatronics
17
A3. The determination of: a) the cross-sectional symmetry axis of the toroidal surface; b) the maximum rectangular field in which the apparatus is mounted; c) the maximum rectangular range in which the closed mathematical curve describe the cross-section. It is determined: a) the maximum dimensions of the D i max range occupied by the inner cylinder (Ri and Hi max); b) the maximum dimensions of the De max outer range, characterized by the external radius Re and the height He max, in which the cross-section of the torus must be enclosed, described by the mathematical equation of the imposed algebraic curve (as shown in fig. 4).
Fig. 4. The geometrical model of toroidal surface with the maximum dimensions of the D i max and De max
A4. The setting of a range of angular values of the section orientation generated by the mathematical curve, relative to the rectangular outer domain, De max. As a result, by rotation of the
cross-section around the center of mass with the angular values: 1, 2, .., k, which may be arbitrarily chosen, there are obtained a series of constructive variants of the toroidal surface, based on the same mathematical equation which describes the cross-section (as shown in fig. 5).
Fig. 5. Constructive variants of the section with the angular values: 1, 2, .., k, arbitrarily chosen
A5. The determination of the new size dimensions: Hk, Lk, of the section rotated with the angle k (as shown in fig. 6).
Fig. 6. Constructive variant of the section with the angular value k
A6. The determination of the optimal dimensions of the geometric section rotated with the k angle (obtained from the condition of a maximum enclosed area in the curve by a centroid scaling so that the curve is included in the rectangular domain De max) checking the conditions:
L k scaled = Lmax and /or Hk scaled = Hmax. (1) It is obtained the mathematical equation describing the curve that shapes the cross-section of the
toroidal surface which has a maximum volume for a required angle k.
ISSN 1453 – 7303 “HIDRAULICA” (No. 2/2018) Magazine of Hydraulics, Pneumatics, Tribology, Ecology, Sensorics, Mechatronics
18
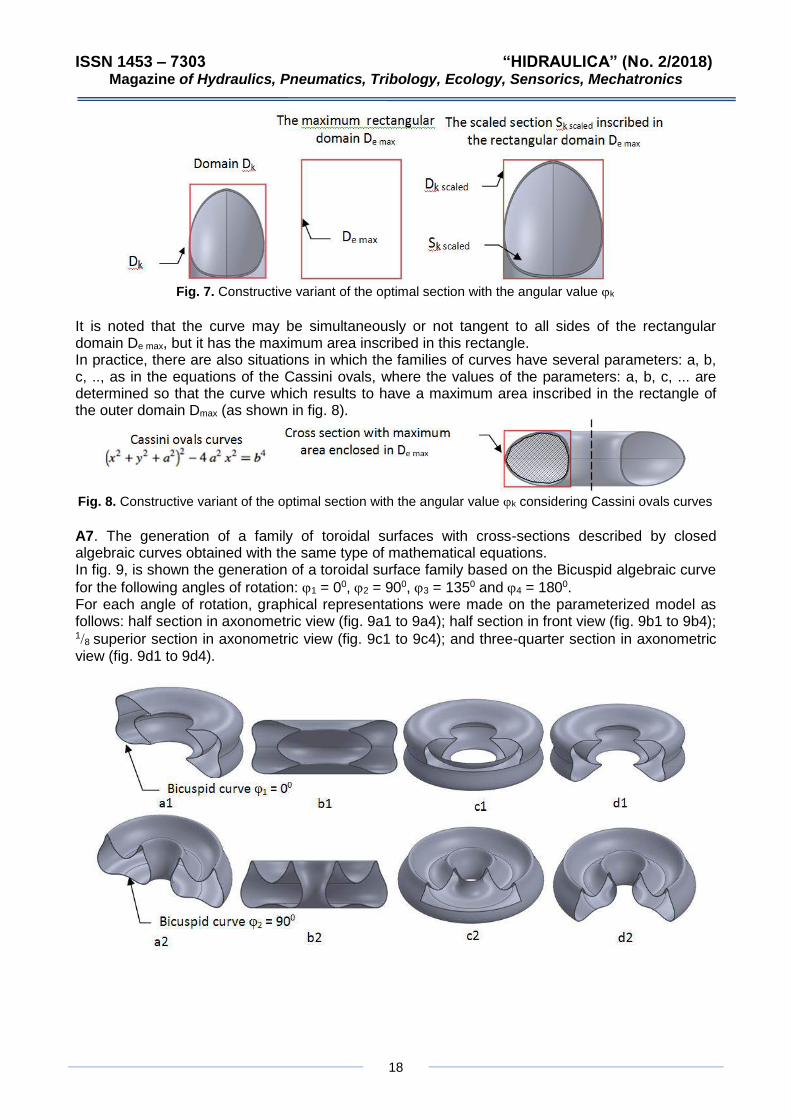
Fig. 7. Constructive variant of the optimal section with the angular value k
It is noted that the curve may be simultaneously or not tangent to all sides of the rectangular domain De max, but it has the maximum area inscribed in this rectangle. In practice, there are also situations in which the families of curves have several parameters: a, b, c, .., as in the equations of the Cassini ovals, where the values of the parameters: a, b, c, ... are determined so that the curve which results to have a maximum area inscribed in the rectangle of the outer domain Dmax (as shown in fig. 8).
Fig. 8. Constructive variant of the optimal section with the angular value k considering Cassini ovals curves
A7. The generation of a family of toroidal surfaces with cross-sections described by closed algebraic curves obtained with the same type of mathematical equations. In fig. 9, is shown the generation of a toroidal surface family based on the Bicuspid algebraic curve
for the following angles of rotation: 1 = 00, 2 = 900, 3 = 1350 and 4 = 1800. For each angle of rotation, graphical representations were made on the parameterized model as follows: half section in axonometric view (fig. 9a1 to 9a4); half section in front view (fig. 9b1 to 9b4); 18 superior section in axonometric view (fig. 9c1 to 9c4); and three-quarter section in axonometric view (fig. 9d1 to 9d4).

ISSN 1453 – 7303 “HIDRAULICA” (No. 2/2018) Magazine of Hydraulics, Pneumatics, Tribology, Ecology, Sensorics, Mechatronics
19
Fig. 9. The generation of a toroidal surface family based on the Bicuspid algebraic curve (for the following
angles of rotation: 1 = 00, 2 = 900, 3 = 1350 and 4 = 1800) in different graphical representations
A8. The selection form of the generated family of toroidal surfaces from the variants whose section shows the maximum enclosed area in the curve.
2.2 The determination of the optimized dimensions of the toroidal cover
The steps in this stage are as follows: B1. The calculation of the toroidal cover optimized dimensions from the condition of resistance to simple or combined mechanical stresses, based on the following design process: - The initial design data are: the maximum static hydraulic pressure; the working temperature between the limits Tmin to Tmax; the exploitation time of tank; the corrosion velocity of material. - The toroidal surface is parametrically computed according § 2.1 subchapter. - To reduce the computational time, the 3D parametric model is chosen based on the constructive symmetry of the toroidal surface (½, ¼ or 1/8 of the initial model), taking into account some constructive features of the fuel tank which are related to the fixation elements, piping, filling or drain connections, etc. - The selection of the execution material for all the tank elements. - The loads are applied to the parameterized model structure such as: tank's own weight, fuel weight, inertia forces (resulting from the acceleration or deceleration processes of the vehicle), force given by compression or decompression of the fuel, the temperature variation of the environment or fuel, unequal pressure distributions exerted on the interior walls of the tank as a result of the flowing or emptying process, symmetrical loading/unloading cycles used for fatigue calculation, the equipment and devices weight supported by the tank, impact forces at crash tests or ballistic tests, non-linear variation laws of temperature for the fire resistance test, increasing variation laws of burst test pressures, laws for periodic or random vibration generation sources, concentration forces and moments, mass distributions, various tank forces on the surface structure of multilayer membranes, etc. - The geometrical constraints are specified accordingly and it is generated the 3D mesh that approximates the geometric domain of the 3D model. - For structure optimal dimensioning, the following variables are computed: element thicknesses, connection rays, linear and angular dimensions (considered as discrete, within a specified range or continuous values). - The structure constraints are considered as: a) constraints of geometrical parameters and mechanical properties resulting from the simulation calculation such as stresses, linear or angular displacements, vibration frequencies, temperatures, safety factors, etc., relative to the admissible values; b) constraints of mass properties related to: volume, mass, area, coordinates of the mass center, etc.; c) dimensional constraints; d) economic constraints as: materials costs, total cost of manufacturing. All these computed constraints may be smaller or equal than a specified value or into prescribed limits.

ISSN 1453 – 7303 “HIDRAULICA” (No. 2/2018) Magazine of Hydraulics, Pneumatics, Tribology, Ecology, Sensorics, Mechatronics
20
- The objective optimization function is written and the aim is to find a solution which optimizes the objective function value subject. There are generated various computational scenarios that combine multiple solicitation variants and after determination of the optimal values is chosen the fuel tank geometry. B2. The choice of the technological variant based on the low-cost option.
3. Conclusions
In this study, a simple and efficient algorithm for optimal design of pressurized toroidal LPG fuel tanks with constant section described by imposed algebraic plane curves was proposed. The high benefits of using this algorithm are: facilitating and simplifying the design process; reducing time to create optimal structures and reducing risk, offering predictable performance and improving reliability of the data. This algorithm can also be extended for the generation of cross-sectional toroidal surfaces described by other types of closed non-linear plane curves that would be considered as design objectives in the future studies. Conflict of Interest: The authors declare that they have no conflict of interest.
References
[1] Hirz, Mario, Wilhelm Dietrich, Anton Gfrerrer and Johan Lang, Integrated Computer-Aided Design in Automotive Development, Springer-Verlag Berlin Heidelberg, 2013. DOI: 10.1007/978-3-642-11940-8.
[2] Ghiţă, C. Mirela, Anton C. Micu, Mihai Ţălu and Ştefan Ţălu. “3D modelling of a gas tank with reversed end up covers for automotive industry.“, Annals of Faculty of Engineering Hunedoara - International Journal of Engineering, Hunedoara, Romania, Tome XI, Fascicule 3 (2013): 195-200.
[3] Ghiţă, C. Mirela, Anton C. Micu, Mihai Ţălu, Ştefan Ţălu and Ema I. Adam. “Computer-Aided Design of a classical cylinder gas tank for the automotive industry.“ Annals of Faculty of Engineering Hunedoara - International Journal of Engineering, Hunedoara, Romania, Tome XI, Fascicule 4 (2013): 59-64.
[4] Ghiţă, C. Mirela, Anton C. Micu, Mihai Ţălu and Ştefan Ţălu. “3D modelling of a shrink fitted concave ended cylindrical tank for automotive industry.“ Acta Technica Corviniensis – Bulletin of Engineering, Hunedoara, Romania, Tome VI, Fascicule 4 (2013): 87-92.
[5] Ghiţă, C. Mirela, Anton C. Micu, Mihai Ţălu and Ştefan Ţălu. “Shape optimization of vehicle's methane gas tank.“ Annals of Faculty of Engineering Hunedoara - International Journal of Engineering, Hunedoara, Romania, Tome X, Fascicule 3 (2012): 259-266.
[6] Ghiţă, C. Mirela, Anton C. Micu, Mihai Ţălu and Ştefan Ţălu. “Shape optimization of a thoroidal methane gas tank for automotive industry.” Annals of Faculty of Engineering Hunedoara - International Journal of Engineering, Hunedoara, Romania, Tome X, Fascicule 3 (2012): 295-297.
[7] Ghiţă, C. Mirela, Ştefan C. Ghiță, Ştefan Ţălu and Simona Rotaru, “Optimal design of cylindrical rings used for the shrinkage of vehicle tanks for compressed natural gas.“ Annals of Faculty of Engineering Hunedoara - International Journal of Engineering, Hunedoara, Tome XII, Fascicule 3 (2014): 243-250.
[8] Bică, Marin, Mihai Ţălu and Ştefan Ţălu. “Optimal shapes of the cylindrical pressurized fuel tanks.” Magazine of Hydraulics, Pneumatics, Tribology, Ecology, Sensorics, Mechatronics (HIDRAULICA), no. 4 (December 2017): 6-17.
[9] Ţălu, Ştefan and Mihai Ţălu. "The influence of deviation from circularity on the stress of a pressurized fuel cylindrical tank." Magazine of Hydraulics, Pneumatics, Tribology, Ecology, Sensorics, Mechatronics (HIDRAULICA), no. 4 (December 2017): 34-45.
[10 Vintilă, Daniela, Mihai Ţălu and Ştefan Ţălu. “The CAD analyses of a torospheric head cover of a pressurized cylindrical fuel tank after the crash test.” Magazine of Hydraulics, Pneumatics, Tribology, Ecology, Sensorics, Mechatronics (HIDRAULICA), no. 4 (December 2017): 57-66.
[11] Ţălu, Mihai. "The influence of the corrosion and temperature on the Von Mises stress in the lateral cover of a pressurized fuel tank." Magazine of Hydraulics, Pneumatics, Tribology, Ecology, Sensorics, Mechatronics (HIDRAULICA), no. 4 (December 2017): 89-97.
[12] Ţălu, Mihai and Ştefan Ţălu. "Analysis of temperature resistance of pressurized cylindrical fuel tanks." Magazine of Hydraulics, Pneumatics, Tribology, Ecology, Sensorics, Mechatronics (HIDRAULICA), no. 1 (March 2018): 6-15.
[13] Ţălu, Mihai and Ştefan Ţălu. "Design and optimization of pressurized toroidal LPG fuel tanks with variable section." Magazine of Hydraulics, Pneumatics, Tribology, Ecology, Sensorics, Mechatronics (HIDRAULICA), no. 1 (March 2018): 32-41.

ISSN 1453 – 7303 “HIDRAULICA” (No. 2/2018) Magazine of Hydraulics, Pneumatics, Tribology, Ecology, Sensorics, Mechatronics
21
[14] Ţălu, Mihai and Ştefan Ţălu. "The optimal CAD design of a 3D hexagonal toroid with regular hexagonal cross-section used in manufacturing of LPG storage tanks." Magazine of Hydraulics, Pneumatics, Tribology, Ecology, Sensorics, Mechatronics (HIDRAULICA), no. 2 (June 2018): 49-56.
[15] *** Certification tests of LPG and CNG. Accessed January 10, 2018. http://vzlutest.cz/en/certification-tests-of-lpg-and-cng-c3.html.
[16] Kișioglu, Yasin. “Burst tests and volume expansions of vehicle toroidal LPG fuel tanks.” Turkish J. Eng. Env., vol. 33 (2009): 117-125. DOI: 10.3906/muh-0905-2.
[17] Kartal, Fuat and Yasin Kișioglu. “Fatigue performance evaluations of vehicle toroidal liquefied petroleum gas fuel tanks.” J. Pressure Vessel Technol, vol. 139, issue 4 (2017): 041402. DOI: 10.1115/1.4035976.
[18] Ziółkowska, Monika and Dorota Wardzińska. "Corrosiveness of fuels during storage processes", published by IntechOpen. Accessed January 10, 2018. http://dx.doi.org/10.5772/59803.
[19] Khobragade, Rashmi and Vinod Hiwase. “Design, and analysis of pressure vessel with hemispherical and flat circular end.” International Journal of Engineering Science and Computing, vol. 7, no. 5 (2017): 12458-12469.
[20] Ţălu, Ştefan and Mihai Ţălu. “Constructive CAD variants of toroidal LPG fuel tanks used in automotive Industry.“ Advances in Intelligent Systems Research, vol. 159 (2018): 27-30. DOI: 10.2991/mmsa-18.2018.7.
[21] Ţălu, Ştefan and Mihai Ţălu. “CAD generating of 3D supershapes in different coordinate systems.“ Annals of Faculty of Engineering Hunedoara - International Journal of Engineering, Hunedoara, Romania, Tome VIII, Fascicule 3 (2010): 215-219.
[22] Ţălu, Ştefan and Mihai Ţălu. “A CAD study on generating of 2D supershapes in different coordinate systems.“ Annals of Faculty of Engineering Hunedoara - International Journal of Engineering, Hunedoara, Romania, Tome VIII, Fascicule 3 (2010): 201-203.
[23] Ţălu, Ştefan. Limbajul de programare AutoLISP. Teorie şi aplicaţii. (AutoLISP programming language. Theory and applications). Cluj-Napoca, Risoprint Publishing house, 2001.
[24] Ţălu, Ştefan. Grafică tehnică asistată de calculator. (Computer assisted technical graphics). Cluj-Napoca, Victor Melenti Publishing house, 2001.
[25] Ţălu, Ştefan. Reprezentări grafice asistate de calculator. (Computer assisted graphical representations). Cluj-Napoca, Osama Publishing house, 2001.
[26] Ţălu, Ştefan. AutoCAD 2005. Cluj-Napoca, Risoprint Publishing house, 2005. [27] Ţălu, Ştefan and Mihai Ţălu. AutoCAD 2006. Proiectare tridimensională. (AutoCAD 2006. Three-
dimensional designing). Cluj-Napoca, MEGA Publishing house, 2007. [28] Ţălu, Ştefan. AutoCAD 2017. Cluj-Napoca, Napoca Star Publishing house, 2017. [29] Țălu, Mihai. Calculul pierderilor de presiune distribuite în conducte hidraulice. (Calculation of distributed
pressure loss in hydraulic pipelines). Craiova, Universitaria Publishing house, 2016. [30] Ţălu, Mihai. Mecanica fluidelor. Curgeri laminare monodimensionale. (Fluid mechanics. The
monodimensional laminar flow). Craiova, Universitaria Publishing house, 2016. [31] Țălu, Mihai. Pierderi de presiune hidraulică în conducte tehnice cu secțiune inelară. Calcul numeric și
analiză C.F.D. (Hydraulic pressure loss in technical piping with annular section. Numerical calculation and C.F.D.), Craiova, Universitaria Publishing house, 2016.
[32] Ţălu, Ştefan. Geometrie descriptivă. (Descriptive geometry), Cluj-Napoca, Risoprint Publishing house, 2010. [33] Florescu-Gligore, Adrian, Magdalena Orban and Ştefan Ţălu. Cotarea în proiectarea constructivă şi
tehnologică. (Dimensioning in technological and constructive engineering graphics). Cluj-Napoca, Lithography of The Technical University of Cluj-Napoca, 1998.
[34] Florescu-Gligore, Adrian, Ştefan Ţălu and Dan Noveanu. Reprezentarea şi vizualizarea formelor geometrice în desenul industrial. (Representation and visualization of geometric shapes in industrial drawing). Cluj-Napoca, U. T. Pres Publishing house, 2006.
[35] Racocea, Cristina and Ştefan Ţălu. Reprezentarea formelor geometrice tehnice în axonometrie. (The axonometric representation of technical geometric shapes). Cluj-Napoca, Napoca Star Publishing house, 2011.
[36] Ţălu, Ştefan and Cristina Racocea. Reprezentări axonometrice cu aplicaţii în tehnică. (Axonometric representations with applications in technique). Cluj-Napoca, MEGA Publishing house, 2007.
[37] Bîrleanu, Corina and Ştefan Ţălu. Organe de maşini. Proiectare şi reprezentare grafică asistată de calculator. (Machine elements. Designing and computer assisted graphical representations). Cluj-Napoca, Victor Melenti Publishing house, 2001.
[38] Niţulescu, Theodor and Ştefan Ţălu. Aplicaţii ale geometriei descriptive şi graficii asistate de calculator în desenul industrial. (Applications of descriptive geometry and computer aided design in engineering graphics). Cluj-Napoca, Risoprint Publishing house, 2001.
[39] Ţălu, Ştefan. Micro and nanoscale characterization of three dimensional surfaces. Basics and applications. Napoca Star Publishing House, Cluj-Napoca, Romania, 2015.

ISSN 1453 – 7303 “HIDRAULICA” (No. 2/2018) Magazine of Hydraulics, Pneumatics, Tribology, Ecology, Sensorics, Mechatronics
22
A New Solution for Water Aeration
PhD Student Eugen TĂMĂȘANU1, PhD Student Mădălina ZAMFIR1, Prof. Dr. Eng. Nicolae BĂRAN1, PhD Student Rareș PĂUN1,
Lecturer Dr. Eng. Mihaela CONSTANTIN1, Eng. Corina MOGA2
1 Politehnica University of Bucharest, [email protected]
2 DFR Systems SRL, Bucharest, [email protected]
Abstract: The paper presents a new solution of water aeration, namely: the introduction of compressed air into the water transport pipes. This eliminates those reservoirs, pumps, decanters, ponds, etc., which pursue the intervention in the case of the construction of a water treatment plant. To measure the dissolved oxygen concentration in water, a non-invasive method is displayed.
Keywords: Water aeration, fine bubble generator.
1. Introduction
The issue of reducing water pollution is topical and requires minimum energy consumption. Between mechanical and pneumatic aeration, the most favourable is pneumatic aeration, which can be achieved by: •the use of porous diffusers built of ceramic, plastic or elastic materials; • installation of pipes with orifices Ø 1-3 mm on the tank base; • the construction of fine bubble generators with orifices of Ø <1mm. By aerating the water, it is intended to increase the dissolved oxygen content in water, which favours a more acceptable existence of the living beings in the water. Aeration of polluted water can be carried out in tanks where water can be immobile or moving at a reduced speed. This paper proposes a solution for the aeration of waters, namely: the introduction of compressed air into the waste water pipes. For vertical pipes, the solution has the following advantages: - the investment expenses needed for the construction of aeration tanks are reduced; - the expenses for the operation of the water aeration system are reduced; - a rigorous control of the parameters that determine the quality of the water to be aerated is ensured. The equipment used for water oxygenation is based on the phenomenon of dispersing a gas (air, pure oxygen, ozone) in the water. The purpose of this equipment is to produce gas bubbles as small as possible in accordance with the requirements of the process. According to the size of the gas bubbles that are dispersed in the water mass, they are classified into the following categories (Fig.1).
Fig. 1. Classification of gas bubbles according to their diameter (Ø) I - the area where the gas bubbles can be observed under the microscope;
II - the area where the gas bubbles can be observed with difficulty; III - the area where the gas bubbles can be observed with the naked eye.

ISSN 1453 – 7303 “HIDRAULICA” (No. 2/2018) Magazine of Hydraulics, Pneumatics, Tribology, Ecology, Sensorics, Mechatronics
23
The current trends, evaluated from the diversity of the economic agent’s offers and presented in the literature, consist of identifying the solutions of decreasing the diameter of the gas bubbles (oxygen, air) to increase the gas - liquid contact surface within the volume of water subjected to the oxygenation process. The various current technologies aim to reduce the energy consumption allocated to achieving the highest possible mass transfer of oxygen to the water [3] [4].
2. The equation of oxygen transfer speed to water
The equation which defines the transfer speed of the O2 from air to water is [4][5]:
( )3
1L s
dC kgak C C
d m s
= −
(1)
Where: /dC d – the transfer speed of dissolved oxygen in water;
akL – volumetric mass transfer coefficient [s-1]; Cs – mass concentration of oxygen in water at saturation [kg/m3]; C – current mass concentration of oxygen in water [kg/m3]. The term ”akL” includes [4][5]: a – interphase contact specific surface:
2
3
A ma
V m
=
(2)
A – gas bubbles area [m2] V – biphasic system volume (air plus water) [m2] kL– the coefficient of mass transfer [kg/m3] Equation (1) indicates the modification of oxygen concentration over time, as a result of molecular diffusion of O2 from the area with high concentration to the area with low O2 concentration. From equation (1) it is noted that to increase the transfer speed of the O2 to water, the following are required: I. the increase of kL and Cs II. the decrease of C0 The conditions I and II are given in Table 1. Table 1: Solutions for increasing /dC d
No. The purpose Theoretical solution Practical solution
1 The increase of a
The decrease of the gas bubble diameter
The decrease of the F.B.G. orifices diameter
2 The increase of kL
The turbulence enhancement
- FBG rotation - Using mobile FBG
3 The increase of CS
The increase of the O2 concentration into the water
Introduction of air, oxygen, O3 into water
4 The decrease of C0
Minimum C0 values depending on the nature of the microorganisms existing into water
- Decrease of the initial water temperature - Introducing substances into water that reduce the value of C0
From the above, it is noted that the value of "a" increases if the diameter of the bubble (db) decreases; as a result, in practice, the aim is to obtain bubbles of the smallest diameter.

ISSN 1453 – 7303 “HIDRAULICA” (No. 2/2018) Magazine of Hydraulics, Pneumatics, Tribology, Ecology, Sensorics, Mechatronics
24
3. The analysis of the proposed solution
From Table 1, it is intended to achieve point 3 by introducing an air stream into the water transport pipe. This process increases the dissolved oxygen concentration in water which leads to a more favourable existence of the living beings in the water. Water aeration is applied in water treatment plants, in ponds, pools, etc. These facilities require large space and investment, high maintenance and exploitation costs. A simpler and cheaper solution for water aeration is proposed, namely: the injection of compressed air into waste water transport pipes to the emissary. As a result, the oxygen concentration in the water will increase; there is an interphase mass transfer. The proposed solution can be applied because modern methods for measuring the dissolved oxygen content in water have been invented and developed. Thus, a plastic or glass tube is mounted along the water pipe line and a sensor is used to facilitate the measurement of dissolved oxygen content in water.
The water flow rate 2H Om kg / s flowing through a pipe and having a dissolved O2 concentration in
section 1-1 equal to C0 is specified (Fig.2).
Fig. 2. Computing notes a - water transport pipe; b - transparent glass or plexiglass tube; c - compressed air distribution system
Between sections 1-1 and 4-4, the water stream increases its mass with:
( )0 [ / ]in sV C C kg s = − (3)
Where:V - the volumetric water flow rate [m3 / s].
In section 4-4, a mass flow rate is obtained:
]/[1144 skgmmm•
−
•
−
•
+=

ISSN 1453 – 7303 “HIDRAULICA” (No. 2/2018) Magazine of Hydraulics, Pneumatics, Tribology, Ecology, Sensorics, Mechatronics
25
Prior to section 2-2, an air flow rate is injected to increase the dissolved oxygen concentration from C0 to CS. After a distance x (section 2-2 => 3-3), it is considered that all air has been injected so that the dissolved oxygen concentration in the water increases from C0 to Cs [mg / dm3]. In Section
4-4 downstream of 3 - 3 the value of Cs (function of2H Ot ) is measured.
From the previous researches [6] [7] [8] for a running time (τ) of the aeration system, C0 = 5.45 mg/dm3 to Cs = 9.2 mg/dm3. The volume of the aerated water is V = 0.125 m3
H2O and the amount of
the injected air in water isairV = 600 dm3 / h = 0.6 m3 / h.
If this process is simulated through a process flowing water and air, the following are obtained: • For water:
smV
V OH /1001736.036002
125.0 332
−•
=
==
The water speed2H Ow = 0.8 m / s and the pipe diameter are selected [4] [6].
2
2 30.785 0.5 /H OV d m s =
320.01736 10
0.0525 10 52.50.785 0.8
d mm−
−= = =
• For air
The air flow rate:
V air = 600 dm3 / h = 0.6 m3 / h =0.6
3600 m3 / s = 0.166 • 10-3 m3 / s
So 2
air airV A w 0,785d w= =
airw = 0.5 m / s is chosen and 0.6
3600= 20.785d 0.5 results.
0.6 0.6d 0.000424 0.0206m
3600 0.785 0.5 1413= = = =
dair = 2 cm = 20.6 mm
4. Presentation of the constructive solutions of the fine bubbles generators
Regarding the aeration of the water circulated through the pipes, different constructive solutions can be conceived (Fig.3). In figure (a), water penetrates into the tube (1) and through the pipes of height h, reaches the orifices (2); the compressed air enters a cylindrical chamber (4) and flows into the water through the orifices (3). The water and air jets circulate upwardly over the distance "l" from C0 to Cs. In figure b the air penetrates into the cylinder (2) and enters into the water through the orifices (3); water flows upwardly into the space between the tube (1) and the lateral area of the cylinder (2). After the distance "l", the dissolved oxygen concentration in water increases from C0 to Cs.

ISSN 1453 – 7303 “HIDRAULICA” (No. 2/2018) Magazine of Hydraulics, Pneumatics, Tribology, Ecology, Sensorics, Mechatronics
26
Fig. 3. Constructive solutions for the FBG a) FBG with air dispersion through orifices placed on a circular plate; 1 - transparent plexiglass tube;
2 - orifices through which water passes; 3 - orifices through which compressed air passes. b) FBG with air dispersion through orifices located on the side surface of a cylinder; 1 - transparent
plexiglass tube; 2 - cylinder with orifices; 3 - orifices through which compressed air passes.
5. Non-invasive method of measuring the dissolved oxygen concentration in water
The current variety of applications, industrial or laboratory, requiring real-time monitoring of fluids variation in oxygen, has led to the development of several measurement methods. Non-invasive measurement of dissolved oxygen concentration is the most recent method used in the food and beverage industry. The determinations are accurate and can be done by means of a sensor applied to a transparent surface (glass or transparent plastic) (Fig.4). The principle of the measuring devices is the one of oxo-luminescence [9], [10].
Fig. 4. Non-invasive device for measuring dissolved oxygen concentration
Figure 4 shows how to use a non-invasive device for measuring the concentration of dissolved oxygen in water passing through a pipe [11]. The main features of this device are: it uses a non-invasive, non-destructive method; applicability in gaseous or liquid media; long life of sensors without complicated calibration or maintenance operations; usable in industrial or laboratory environments; easy to use, portable and versatile; accurately determine the dissolved oxygen content in water.

ISSN 1453 – 7303 “HIDRAULICA” (No. 2/2018) Magazine of Hydraulics, Pneumatics, Tribology, Ecology, Sensorics, Mechatronics
27
6. Installations for the aeration of water transported through pipes
Water transport through pipes is carried out by horizontal or vertical pipes.
6.1. Aeration of water through horizontal pipes
In this case (Fig.5) there are two problems: a) In the mixing chamber, air bubbles will rise to the top of the chamber, resulting in an inefficient mix between air and water. b) Measurement of the dissolved oxygen concentration in water can only be carried out in the water tank (12) by means of the probe (13) of the oxygen meter.
T PP
1
2
3
4 56
7
8
5
3
3
9
10 11
12
13
14
315
Fig. 5. Scheme of the water aeration system when the water is transport by horizontal pipes 1 - water supply connection; 2 - water tank, 3 - regulating valves; 4 - digital temperature measuring device;
5 - digital pressure manometer; 6 - rotating volumetric pump with two profiled rotors; 7 - three-phase electric motor; 8 - panel with electrical devices for regulating the pump speed; 9 - compressed air supply pipe; 10 - fine bubbles generator; 11 - air-water mixing chamber; 12 - tank with aerated water; 13 - oxygen
concentration measurement probe; 14 - overflow; 15 - supply line for the consumer aerated water
6.2 Aeration of water through vertical pipes
Fig. 6. Scheme of the water aeration system when the water is transport by vertical pipes 1 - water supply connection; 2 - water tank, 3 - regulating valves; 4 - digital temperature measuring devices; 5 - digital pressure manometer; 6 - rotating volumetric pump with two profiled rotors; 7 - three-phase electric
motor; 8 - panel with electrical devices for regulating the pump speed; 9 - compressed air supply pipe; 10 - fine bubbles generator

ISSN 1453 – 7303 “HIDRAULICA” (No. 2/2018) Magazine of Hydraulics, Pneumatics, Tribology, Ecology, Sensorics, Mechatronics
28
Figure 6 shows that air bubbles emitted by FBG move vertically with the water stream; so, after a certain distance, concentration increases from C0 to Cs.
7. Conclusions
1. It is intended to aerate the water by injecting compressed air into pipes carrying polluted water. 2. With this constructive solution, those aeration pools of hundreds of m2 disappear, thus reducing the investment in the field of water pollution; 3. The operating costs of the water treatment plant are reduced in the sense that a single technician is required to supervise the two C0 and Cs probes in Figure 2; 4. If the water has suspensions, its circulation will be from top to down in counter-pressure with the compressed air. This issue will be solved in future papers; 5. The solution presented in the paper eliminates many maintenance and operating costs that are nowadays in operation.
Acknowledgments
This work was supported by a grant of the Romanian National Authority for Scientific Research and Innovation, CCCDI – UEFISCDI, project number Manunet – MNET17/ENER2307 – CEBIOTREAT, within PNCDI III.
References
[1] www.nanobubbles.com/nanobubbles-12/. [2] www.1.isbu.ac.uk/water/nanobubble.html. [3] Antonescu, Simona, Georgeta Ionașcu, and Adina Pîrcălăboiu. Micromechanical structures technology.
Bucharest, Technical Publishing House,1995. [4] Oprina, Gabriela, Irina Pincovschi, and Gheorghe Băran. Hidro-Gas-dynamic aeration systems equipped
with bubbles generators. Bucharest, Politehnica Press Publishing House, 2009. [5] Chansonn, Hubert. "Air-Water Interface Area in Self-Aerated Flows." Water Res, IAWPRC, 28, no. 4: 923-
929 (ISSN 0043-1354). [6] Pătulea, Alexandru. "Influence of functional parameters and fine bubble generator architecture on
aeration plants efficiency." PhD Thesis, University Politehnica of Bucharest, 2012. [7] Oprina, Gabriela. "Contributions to the Hydro-Gas-dynamic porous diffusers." PhD Thesis, University
Politehnica of Bucharest, 2007. [8] Mateescu, Gabriela. "Hidro-Gas-dynamic of fine bubbles generators." PhD Thesis, University Politehnica
of Bucharest, 2011; [9] Pincovschi, Irina. "Hydrodynamics gas-liquid disperse systems". PhD Thesis, University Politehnica of
Bucharest, 1999. [10] Mitchell, Thomas. "Luminescence based Measurement of Dissolved Oxygen in Natural Waters".
Whitepaper. http://www.ott.com/en-us/products/download/ldo-white-paper/, 2006. [11] http://www.nomacorc.com/enology/nomasense-o2-9300.

ISSN 1453 – 7303 “HIDRAULICA” (No. 2/2018) Magazine of Hydraulics, Pneumatics, Tribology, Ecology, Sensorics, Mechatronics
29
Design Details of a Turbine Model Used for Energy Conversion in Low Flow Rate Water Streams
Assistant professor Fănel Dorel ȘCHEAUA1
1 "Dunărea de Jos" University of Galați, [email protected]
Abstract: The potential of water flows has been used since ancient times. Today more than ever, the water streams are used for energy production. Depending on the three essential parameters of water flow represented by flow velocity, flow rate and level difference, the optimal design solutions for choosing the turbine type used to generate energy in a hydroelectric power plant are usually adopted. Over time, special turbine models have been built that have been fitted with hydro-electric power plants such as the Pelton, Francis or Kaplan turbines. The Pelton turbine model was built for use on water courses with a low flow rate but with a considerable difference level. A three-dimensional model for the Pelton turbine was built and analyzed in terms of operation in this work. The results obtained from the analysis are presented as values for the flow velocity and pressure of the water in the considered fluid area.
Keywords: Hydro power plant, PELTON turbine, fluid flow, three-dimensional modeling, CFD
1. Introduction
The construction of some hydroelectric power plants along the rivers is considered a solution to be used in order to obtain energy over a long period of time, leaving aside the disadvantages of local damage to the flora and fauna habitat. However, the advantages represented by the amount of energy that is produced have made the difference in favor of the continuous construction of energy units along the rivers, whose energy potential is under-exploited at present. With the continuous increase in energy requirements, the methods of obtaining electricity have to be taken into account using the water flow rate of the rivers with enough flow rates to operate the turbine of an energy system, in this case the Pelton model turbine.
2. Theoretical aspects and operation principle
The overall model of the power system based on the rivers water flow consists of a turbine with cups (Pelton turbine model), which has the possibility to rotate around its own axle on the basis of the pressing force exercised by the water stream to which it is exposed. The operating principle of the turbines can be described as being related to the mechanical energy transformation of the fluid in rotation motion at the turbine shaft. 00 To ensure the operation, a level difference is needed between which the water has the possibility to flow. The static level difference for the turbine model, measured between the water level upstream and downstream, is given by: 0
st am avZ Z Z= −
(1)
The net difference level at the turbine that can provide a net loss of water is obtained by the expression: 0
st rZ Z z z= − + 0 (2)
where:
rz - total hydraulic load losses;
z 0 - the restoration fall.

ISSN 1453 – 7303 “HIDRAULICA” (No. 2/2018) Magazine of Hydraulics, Pneumatics, Tribology, Ecology, Sensorics, Mechatronics
30
The value of z 0 is dependent on the type of turbine connection to the water flow and the turbine
operating mode. The relation defining the power value at the turbine shaft can be written as: 0
a aT
Q ZN kW
=
102 (3)
where:
a - the water specific weight;
aQ- water flow rate crossing the turbine enclosure;
Z - the net water loss;
- yield. The turbine with cups (Pelton model) is the most common turbine type used in hydro power plants for the production of hydraulic force based on the water flow. The principle of operation is presented schematically in figure 1.
Fig. 1. Turbine assembly schematic representation
It is a model that uses an injector nozzle to which water is drawn through a pressure pipe. The injector is provided with an adjusting needle through which the nozzle opening and water flow can be modified by simply axial displacement of the needle. On the turbine rotor are mounted the cups, which ensure the successive take-off of the water from the injector and its transport to the exhaust area. The positioning of the turbine shaft can be both horizontal and vertical. Water injectors acting to direct water onto cups can be one or more (up to 6 injectors). The turbine model can also have one or two rotors with cups. It should be noted that the Pelton turbine rotor rotates freely, being positioned outside the flooded area (no drowning). The Pelton turbine model is usually located above the maximum downstream water level, which means a reduction in the level difference (fall) with the required value for the installation.
3. Turbine assembly model
A three-dimensional model for the turbine rotor (Pelton) was built using the Solid Edge V20 program. It is a double-rotor model with an outside diameter of 5 m, (figure 2).

ISSN 1453 – 7303 “HIDRAULICA” (No. 2/2018) Magazine of Hydraulics, Pneumatics, Tribology, Ecology, Sensorics, Mechatronics
31
a) turbine double rotor b) enclosure model
Fig. 2. Turbine enclosure assembly model
The turbine model includes a number of cups (Pelton model) being by design a solution for converting the water flow rate energy into mechanical rotation energy at the turbine shaft. The water flow is metered through the injectors which action is to direct of the water flow directly onto the cups so that an impulsive force is formed in the normal direction which acts successively on the cups ensuring the initial movement and a continuous rotation of the turbine. A considerable amount of energy based on water strength is thus obtained.
4. CFD analysis for turbine model
Based on the turbine virtual model a water flow analysis was carried out on the enclosure containing the turbine. By the performed analysis are presented the results describing the water flow regime when is declared a value for the water velocity at the enclosure inlet for the analyzed fluid region. The analysis is carried out using the ANSYS CFX Academic program. The fluid region is using water as the working fluid, with a flow velocity of 1 m/s at the inlet, which causes a forced rotation movement on the turbine shaft by the direct action of water on the turbine cups. The water inlet was declared on the rectangular area built on the fluid area containing the turbine rotor, having the input area on one side and the exit area opposite. Figure 3 shows the analysis main domains containing the turbine double rotor assembly model and the enclosure flow region.
a) Fluid region b) Immersed solid (turbine)
Fig. 3. Flow analysis main domains
The meshing network was made with triangular shape elements, having 334725 nodes and 1612461 elements. The results are presented in terms of the pressure and fluid velocity, (figure 4).

ISSN 1453 – 7303 “HIDRAULICA” (No. 2/2018) Magazine of Hydraulics, Pneumatics, Tribology, Ecology, Sensorics, Mechatronics
32
a) pressure values b) total pressure values
c) water velocity values
Fig. 4. The flow analysis obtained result values
The results indicate specific values calculated for the flow parameters as flow velocity and pressure, on the main analysis domains represented by the fluid region and the turbine with cups considered as immersed solid. The calculated specific values are presented for the fluid domain containing 34.59 cubic meters of water. The turbine pressure range is between 128754 and 219337 Pa, the inlet section area is 2.93 m2, while the mass flow rate is 2935.72 kg/s. On the inlet, the minimum value of the total pressure is 157308 Pa. The water flow velocity values range from 16-33 m/s for the case when the turbine double rotor has a rotational velocity of 1 revolution per second.
5. Conclusions
Pelton turbine model is one of the most used in hydroelectric power plants due to the advantages it offers. These relate to the low water flow rates required by these turbines, but considerable level differences necessary for optimal operation. A three-dimensional turbine model with double rotor was designed and analyzed in terms of water flow inside the enclosure in order to highlight the specific pressure and flow velocity values. The results are presented in static and total pressure limits but also in the fluid velocity on the turbine's rotor action zone.
References
[1] Axinti, Adrian Sorin and Fănel Dorel Șcheaua. Introduction to industrial hydraulics/Introducere în hidraulica industrială. ISBN 978-606-696-032-8. Galati, Galati University Press, 2015.
[2] Axinti, Gavril and Adrian Sorin Axinti. Fluid Power Systems /Acţionări hidraulice şi pneumatice, Vol I-V. Chişinău, Tehnica-Info Publishing House, 2008-2012.
[3] Kiselev, P. G. Guidelines for hydraulic calculations/Îndreptar pentru calcule hidraulice. București, Technical Publishing House, 1988.
[4] http://www.learnengineering.org/2013/08/pelton-turbine-wheel-hydraulic-turbine.html. [5] https://www.ge.com/renewableenergy/hydro-power/large-hydropower-solutions/hydro-turbines/pelton-
turbine. [6] http://www.asce.org/project/pelton-impulse-water-wheel/.

ISSN 1453 – 7303 “HIDRAULICA” (No. 2/2018) Magazine of Hydraulics, Pneumatics, Tribology, Ecology, Sensorics, Mechatronics
33
From Human-Environment Interaction to Environmental Informatics (II): the Sustainability evolution as requirement of Knowledge-based Society
PhD stud. Bogdan CIORUȚA1, Assoc. Prof. Eng. Mirela COMAN2, Stud. Alexandru LAURAN2
1Technical University of Cluj-Napoca - North University Centre of Baia Mare, Office of Information and Communication, 62A Victor Babeș str., 430083, Baia Mare; [email protected] 2Technical University of Cluj-Napoca - North University Centre of Baia Mare, Faculty of Engineering, 62A
Victor Babeș str., 430083, Baia Mare; [email protected] | [email protected]
Abstract: The idea of sustainable development is without doubt the most used phrase, with reference to environment in the last half century. Sustainable development has been defined in many ways, but the most frequently quoted definition is from Our Common Future, also known as the Brundtland Report. Sustainable development - the development that meets the needs of the present without compromising the ability of future generations to meet their own needs - has continued to evolve as that of protecting the world’s resources while it's true agenda is to control the world’s resources. Environmentally sustainable economic growth refers to economic development that meets the needs of all actors involved without leaving future generations with fewer natural resources than those we enjoy today. The purpose of this paper is to focus on the durable form of contemporary development as a stable relationship between human activities and the natural world, which does not diminish the prospects for future generations to enjoy a quality of life at least as good as our own. The idea of green economic growth, synonym to the prevalent concept of ‘Sustainable Development’, is not new, many cultures over the course of human history have recognized the need for harmony between the environment, society and economy.
Keywords: Sustainability, knowledge-based society, circles of sustainability, sustainable communities
1. Introduction
The idea, and the concept itself, of sustainable development - as the latest over-time consecrated version of sustainability - is, by far and without doubt, the most used phrase, with reference to environment, and not only, in the last half century. The concept of sustainable development (SD) has been defined in many ways, but the most frequently quoted definition is taken from Our Common Future, known as the Brundtland Report, released by The United Nations in 1987 [1]. Sustainable development - the development that meets the needs of the present without compromising the ability of future generations to meet their own needs [2] - has continued to evolve as that of protecting the world’s resources while it's true agenda is to control the world’s resources. Environmentally sustainable growth - as part in the three pillars of the sustainability pyramid concept (Fig. 1) - refers to economic development that meets the needs of actors involved without leaving future generations with fewer natural resources than those we enjoy today.
Fig. 1. The three pillars of the sustainability concept: social-environmental-economic
The purpose of this paper is to focus on the contemporary sustainable development as a stable relationship between human activities and the natural world, which does not diminish the prospects for future generations to enjoy a quality of life at least as good as our own.

ISSN 1453 – 7303 “HIDRAULICA” (No. 2/2018) Magazine of Hydraulics, Pneumatics, Tribology, Ecology, Sensorics, Mechatronics
34
2. From environment protection initiatives to sustainability
2.1 Environmental protection initiatives
Although from a practical point of view, the voluntary concern for nature protection has accompanied man since ancient times, sporadically appearing after the 1st millennium BC, the concept of protection the environment remains the fruit of modern society (Fig. 2) - being outlined in agreement with science evolution, which underpins the progress of the communities [3, 4]. In addition, the idea of green economic growth, synonym to the prevalent concept of ‘Sustainable Development’, is not new, many cultures, over the course of human history, in particular after “the environment” gained its place in the public international and national agenda, have recognized the need for harmony between the environment, society and economy [5].
Fig. 2. The timeline of the environmental conservation concept
Protecting the environment is essential to the quality of life of present and future generations in all kind of industrialized societies or communities [6]; the current challenge is to combine environmental protection with continuous economic growth in a sustainable manner. In the field of environmental protection, there are a large number of organizations that conserve, analyze and monitor the environment in different ways (Fig. 3), all of which can be both global and regional, as well as national and/or local.
Fig. 3. The main issues specific to environmental protection initiatives
The United Nations Environment Program (UNEP) - was established immediately after the United Nations Conference on Human Environment held in Stockholm in 1972. UNEP is mandated to coordinate the integration of environmental protection policies across the other sectors, in order to ensure sustainable development - an aspect that remained in the attention of the next international events (Fig. 4).

ISSN 1453 – 7303 “HIDRAULICA” (No. 2/2018) Magazine of Hydraulics, Pneumatics, Tribology, Ecology, Sensorics, Mechatronics
35
Fig. 4. The main international conferences regarding the environment protection
The UNEP mandate has been permanently strengthened, currently acting to implement the decisions taken at the highest political level at the United Nations Conference on Environment and Development held in Rio de Janeiro in 1992 at the World Summit on Sustainable Development held in Johannesburg, 2002 and the Rio+20 Summit.
Fig. 5. The global environmental summits [3]
Sustainable development in terms of international events (Fig. 5) is defined by a number of issues, including among others [8, 9]:
• compatibility between the anthropic environment and the natural environment;
• equal opportunities between generations that coexist and succeed in time and space;
• putting ecological security at the forefront instead of maximizing profits;
• the compatibility of the national development strategies with the requirements of extending the interdependencies in a geo-economic and ecological plan;
• ensuring overall welfare with a focus on the quality of sustainable economic growth;
• organic integration between natural and human capital within a global category that redefines its economic and social goals and extends its time and space horizon;
• moving to a new strategy where the objectives of economic and social development are subordinated both to man's development and environmental recovery.
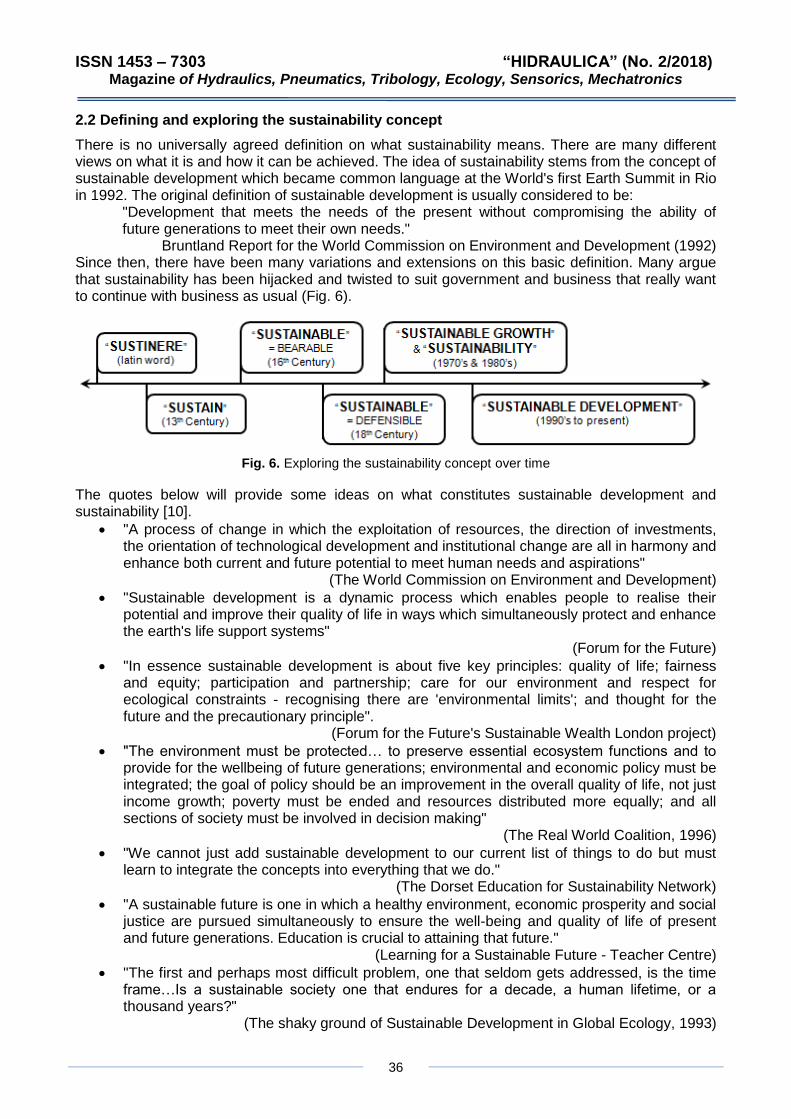
ISSN 1453 – 7303 “HIDRAULICA” (No. 2/2018) Magazine of Hydraulics, Pneumatics, Tribology, Ecology, Sensorics, Mechatronics
36
2.2 Defining and exploring the sustainability concept
There is no universally agreed definition on what sustainability means. There are many different views on what it is and how it can be achieved. The idea of sustainability stems from the concept of sustainable development which became common language at the World's first Earth Summit in Rio in 1992. The original definition of sustainable development is usually considered to be:
"Development that meets the needs of the present without compromising the ability of future generations to meet their own needs."
Bruntland Report for the World Commission on Environment and Development (1992) Since then, there have been many variations and extensions on this basic definition. Many argue that sustainability has been hijacked and twisted to suit government and business that really want to continue with business as usual (Fig. 6).
Fig. 6. Exploring the sustainability concept over time
The quotes below will provide some ideas on what constitutes sustainable development and sustainability [10].
• "A process of change in which the exploitation of resources, the direction of investments, the orientation of technological development and institutional change are all in harmony and enhance both current and future potential to meet human needs and aspirations"
(The World Commission on Environment and Development)
• "Sustainable development is a dynamic process which enables people to realise their potential and improve their quality of life in ways which simultaneously protect and enhance the earth's life support systems"
(Forum for the Future)
• "In essence sustainable development is about five key principles: quality of life; fairness and equity; participation and partnership; care for our environment and respect for ecological constraints - recognising there are 'environmental limits'; and thought for the future and the precautionary principle".
(Forum for the Future's Sustainable Wealth London project)
• "The environment must be protected… to preserve essential ecosystem functions and to provide for the wellbeing of future generations; environmental and economic policy must be integrated; the goal of policy should be an improvement in the overall quality of life, not just income growth; poverty must be ended and resources distributed more equally; and all sections of society must be involved in decision making"
(The Real World Coalition, 1996)
• "We cannot just add sustainable development to our current list of things to do but must learn to integrate the concepts into everything that we do."
(The Dorset Education for Sustainability Network)
• "A sustainable future is one in which a healthy environment, economic prosperity and social justice are pursued simultaneously to ensure the well-being and quality of life of present and future generations. Education is crucial to attaining that future."
(Learning for a Sustainable Future - Teacher Centre)
• "The first and perhaps most difficult problem, one that seldom gets addressed, is the time frame…Is a sustainable society one that endures for a decade, a human lifetime, or a thousand years?"
(The shaky ground of Sustainable Development in Global Ecology, 1993)

ISSN 1453 – 7303 “HIDRAULICA” (No. 2/2018) Magazine of Hydraulics, Pneumatics, Tribology, Ecology, Sensorics, Mechatronics
37
Sustainability is a set of conditions and trends (path, direction) in a given system that can continue indefinitely, and sustainable development is a strategic process of continuous change (tools) - having different meaning (Fig. 7) - in the direction of sustainability.
Fig. 7. Sustainability having different meaning to different people
Sustainability has different meaning to different people:
• engineer perspective: "…the process of designing or operating systems such that they use energy and resources sustainably, i.e., at a rate that does not compromise the natural environment, or the ability of future generations to meet their own needs";
• architect perspective: "…architecture that seeks to minimize the negative environmental impact of buildings by efficiency and moderation in the use of materials, energy, and development space";
• economist perspective: "…The use of various strategies for employing existing resources optimally so that that a responsible and beneficial balance can be achieved over the longer term";
• farmer perspective: "…the farming act using principles of ecology, the study of relationships between organisms and their environment…as "an integrated system of plant and animal production practices having a site-specific application that will last over the long term".
Sustainability concepts include among others:
• long-term balance between economic, social and environmental goals (look ahead 20-50 years, understand the connections);
• limits to natural, social, and built systems (live off the interest of community capital, don’t degrade or use it up);
• inter- and intra- generational equity (share with future generations and current inhabitants, local sustainability in harmony with global sustainability rather than at expense of others).
As well, the main directions for action, detailed by sector and time horizon, on sustainable development in the context of the knowledge society, are [8, 9]:
• the rational correlation of development objectives, including investment programs in an inter-sectoral and regional profile, with the potential and capacity to support natural capital;
• accelerated modernization of education and training systems, public health and social services, taking into account demographic developments and their impact;
• generalized use of the best available economically and environmentally-friendly technologies in investment decisions, and firm introduction of the eco-efficiency criteria in all production and service activities;
• ensuring food safety and security without compromising the requirements for maintaining soil fertility, preserving biodiversity and protecting the environment;
• meeting the international standards of life quality;
• anticipating the effects of climate change and developing both long-term adaptation solutions and inter-sector contingency plans, including portfolios of alternative solutions to crisis situations generated by natural or anthropogenic phenomena;
• protecting and capitalizing on the cultural and natural heritage by revitalization in modernity of traditional ways of living, especially in mountain and wetlands.
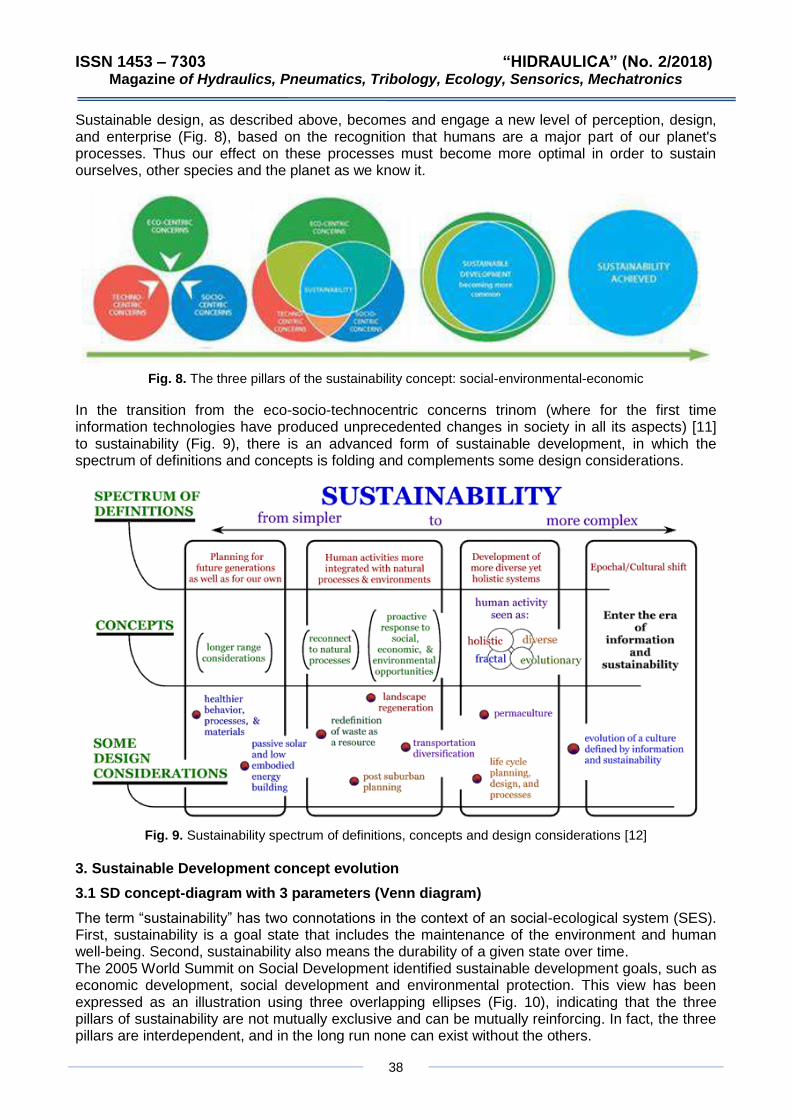
ISSN 1453 – 7303 “HIDRAULICA” (No. 2/2018) Magazine of Hydraulics, Pneumatics, Tribology, Ecology, Sensorics, Mechatronics
38
Sustainable design, as described above, becomes and engage a new level of perception, design, and enterprise (Fig. 8), based on the recognition that humans are a major part of our planet's processes. Thus our effect on these processes must become more optimal in order to sustain ourselves, other species and the planet as we know it.
Fig. 8. The three pillars of the sustainability concept: social-environmental-economic
In the transition from the eco-socio-technocentric concerns trinom (where for the first time information technologies have produced unprecedented changes in society in all its aspects) [11] to sustainability (Fig. 9), there is an advanced form of sustainable development, in which the spectrum of definitions and concepts is folding and complements some design considerations.
Fig. 9. Sustainability spectrum of definitions, concepts and design considerations [12]
3. Sustainable Development concept evolution
3.1 SD concept-diagram with 3 parameters (Venn diagram)
The term “sustainability” has two connotations in the context of an social-ecological system (SES). First, sustainability is a goal state that includes the maintenance of the environment and human well-being. Second, sustainability also means the durability of a given state over time. The 2005 World Summit on Social Development identified sustainable development goals, such as economic development, social development and environmental protection. This view has been expressed as an illustration using three overlapping ellipses (Fig. 10), indicating that the three pillars of sustainability are not mutually exclusive and can be mutually reinforcing. In fact, the three pillars are interdependent, and in the long run none can exist without the others.

ISSN 1453 – 7303 “HIDRAULICA” (No. 2/2018) Magazine of Hydraulics, Pneumatics, Tribology, Ecology, Sensorics, Mechatronics
39
a) b)
Fig. 10. Examples of the SD concept-diagram with 3 parameters: a) “Mickey Mouse” model; b) Shallow model - separate yet connected systems
Remaining at the sustainable development concept-diagram with 3 parameters, we discover, in the vast literature of the environment protection, a series of models (Fig. 11) of which we mention the following, as being the most relevant and frequently used in defining the principles of the current society development.
a) b) c) d)
e) f)
Fig. 11. Examples of the SD concept-diagram with 3 parameters (Shallow or overlapping circles models): a) Venn diagram model; b) overlapping circles model; c) nested-dependencies model; d) “bullseye” model;
e) nested-dependencies model; f) the sustainable performance wheel model
3.2 SD concept-diagram with 4 parameters (circles of sustainability)
More recently, using a systematic domain model that responds to the debates over the last decade, the Circles of Sustainability approach (Fig. 12) distinguished four domains of economic, ecological, political and cultural sustainability; this in accord with the United Nations, UNESCO, and in particular the Agenda 21 for culture which specifies culture as the fourth domain of communities sustainable development.

ISSN 1453 – 7303 “HIDRAULICA” (No. 2/2018) Magazine of Hydraulics, Pneumatics, Tribology, Ecology, Sensorics, Mechatronics
40
Fig. 12. Examples of the SD concept-diagram with 4 parameters - circles of sustainability [13]
3.3 SD concept-diagram with 5 or more parameters (sustainable communities)
Fig. 13. Examples of the SD concept-diagram with 5 parameters [14, 15]
The transition from a community developed by sustainable principles (via circles of sustainability approach) to a community designed and cultivated, from the very beginning, as a sustainable one, involves the appearance and consideration of at least one new element - governance (Fig. 13). Considering all the models so far, we managed to synthesize and compare the considered approaches, the results of the comparative study being exposed in Table 1.

ISSN 1453 – 7303 “HIDRAULICA” (No. 2/2018) Magazine of Hydraulics, Pneumatics, Tribology, Ecology, Sensorics, Mechatronics
41
Table 1: Observations regarding the sustainability concept representation
No. Sustainability by Sustainable
linkage Observations
representation content / description
1 SD concept-diagram
with 3 parameters
Venn diagram model weak link models that establish an
incipient connection, only among the essential
elements
overlapping circles model weak link
nested-dependencies model weak link
“bullseye” model weak link
2 SD concept-diagram
with 4 parameters Circles of Sustainability
approach weak to
medium link
patterns that establish an incipient relationship, but they also look at the
community
3 SD concept-diagram
with 5 or more parameters
Sustainable Communities approach
medium to strong link
patterns that establish a strong link, they have in mind the community and
its specificity
In line with the observations mentioned in the table above, an eminently new model for sustainable development can be defined, with reference to 5 aspects of the contemporary world - closely related to the main global goals for sustainable development - that require a particular attention (Fig. 14), namely: a sociable, a clean, a productive, a resilient and a thriving world.
Fig. 14. Sustainable Development in connection with the main global goals of Knowledge-based Society
This latest model - which can be adapted to the demands of knowledge-based society and environmental informatics - is, by far, the one that best defines the concept of sustainable development, being equally capable of encompassing the main international preoccupations with reference to the community and its sustainable development.

ISSN 1453 – 7303 “HIDRAULICA” (No. 2/2018) Magazine of Hydraulics, Pneumatics, Tribology, Ecology, Sensorics, Mechatronics
42
4. Conclusions
The concept of sustainable development had as its starting point the global ecological crisis of 1929-1933 and later developed through the incorporation of all economic and social spheres, and now sustainable development is the new path of humanity. Sustainable development has been conceived as a solution to the ecological crisis caused by intensive industrial resource exploitation and the continuous degradation of the environment, and primarily seeks to preserve the quality of the environment. Sustainable development promotes the concept of reconciling economic and social progress without jeopardizing the natural balance of the planet. The idea underlying this concept is to ensure a better quality of life for all the inhabitants of the planet, both for the current generation and for future generations. In the context of Knowledge-based Society, sustainable development brings in the forefront a new set of values that will guide the future model of economic and social progress, values that focus on man and his current and future needs, the natural environment - protecting and preserving it, and mitigating the current deterioration of ecosystems.
References
[1] Platonova, Yulia. "Is the Concept of Sustainable Development a Contemporary Ideology? ". Proceedings of FIKUSZ ’13 Symposium for Young Researchers, 2013: 55-66.
[2] ***, Report of the World Commission on Environment and Development: Our Common Future www.un-documents.net/our-common-future.pdf.
[3] Coman, Mirela, and Bogdan Cioruţa. "Environmental Information Systems as a possible solution for strategic development of local and regional communities", Conferinţa Internaţională „Aerul şi Apa - componente ale mediului”, 22-23 martie 2013, Cluj-Napoca, Editura Presa Universitară Clujeană, 2013: 516-523.
[4] Cioruţa, Bogdan, Mirela Coman, and Vlad Mateșan. "Environmental Information Systems: solutions and emerging challenges for modern strategic development of Romanian local communities", International Conference "Scientific Research and Education in the Air Force" (AFASES®), 23-25 May 2013, Braşov, 2013: 372-375.
[5] Cioruța, Bogdan, Mirela Coman, Andrei-Alin Cioruța, and Alexandru Lauran. "From Human-Environment Interaction to Environmental Informatics (I): Theoretical and Practical Implications of Knowledge-based Computing", Magazine of Hydraulics, Pneumatics, Tribology, Ecology, Sensorics, Mechatronics (Hidraulica®), no. 1, 2018: 71-82.
[6] Cioruța, Bogdan, and Mirela Coman. "Environmental Informatics - solutions and emerging challenges in environmental protection", International Conference „Environmental Legislation, Safety Engineering and Disaster Management” (ELSEDIMA®), 25-27 October 2012, Cluj-Napoca, in Studia Universitatis Babeș-Bolyai AMBIENTUM, vol. 57, no 2, 2012: 17-30.
[7] ***, iesgeneralstudies.com/environmental-conservation-global (last access - April, 2018). [8] ***, www.anpm.ro/dezvoltare-durabila (last access - May, 2018). [9] ***, www.mmediu.ro/beta/domenii/dezvoltare-durabila (last access - May, 2018). [10] ***, www.globalfootprints.org/sustainability (last access - May, 2018). [11] Cioruța, Bogdan, Mirela Coman, and Andrei-Alin Cioruța. "Studying Environmental Problematics and
Hazards with help of Informatics Applications", International Conference "Scientific Research and Education in the Air Force" (AFASES®), 22-24 May 2014, Braşov, 2014: 289-292.
[12] Muntean, Larisa, and Bogdan Cioruța. From affordable eco-buildings to sustainable cities (I): current experiences and future perspectives, Scientific Bulletin of North University Center of Baia Mare, Series D, Mining, Mineral Processing, Non-ferrous Metallurgy, Geology and Environmental Engineering, Baia Mare, volume XXX, no. 2, 2016: 143-152.
[13] ***, www.circlesofsustainability.org (last access - May, 2018). [14] ***, fatunetwork.net/sustainable-development-bottom-approach (last access - May, 2018). [15] ***, joslyninstitute.org/resources/the-five-domains-of-sustainability (last access - May, 2018).

ISSN 1453 – 7303 “HIDRAULICA” (No. 2/2018) Magazine of Hydraulics, Pneumatics, Tribology, Ecology, Sensorics, Mechatronics
43
Analysis of Intelligent Control and Interface in Pressurized Liquid Injection Systems for Competitive Technical Solutions
PhD. Eng. Iosif FERENȚI1, Prof. PhD Eng. Dan OPRUȚA2, Lect. PhD. Eng. Doru-Laurean BĂLDEAN2,*
1 Intercars, Department of Automotive Engineering, Corneliu Coposu Street, Nr: 167A, Cluj-Napoca, 400228, Cluj county, România. e-mail: [email protected]
2 Technical University of Cluj-Napoca, Department of Automotive Engineering and Transports, Muncii Blvd, no. 103-105, Cluj-Napoca, 400641, Cluj county, Romania. Corresponding author* e-mail: [email protected]
Abstract: In this scientific paper, am approach based on Engine Digital Scanning (EDS) was applied in order to underline the performances of more than ten engine speed regimes on the same rally car, but with various intake manifold pressures, fuel injection duties and ignition advances. A specific study of trend lines and parameter variation was developed to highlight internal combustion engine’s (ICE) operational indicators and to define the optimal regime with increased intake pressure, improved combustion and lower pollution influencing conditions. Manifold pressure dictates the base condition for air-fuel mixture formation and for lambda value before engine intake process in the case of port fuel injection (PFI). Fuel injection duty expresses the operational sequence time in relation with a base parameter in the engine working process. Ignition advance is adapted to the hydraulic-fuel charge, as well as engine load and speed so it is analysed.
Keywords: Automotive, diagnosis, hydraulic, fuel injection system
1. Introduction
In the last forty years, the port fuel injection systems have been developed and optimised for different types of applications in automotive and industrial sectors, but in order to maintain performances and to increase power output when lowering masses and inertia it has to be further studied and digitally controlled. Potential of injection system development is yet to be explored and materialized due to the spectrum of recent achievements in hydraulic control and Computational Fluid Dynamics – CFD [1-5]. Digital or intelligent control in fluid systems in both general technical applications and industrialized units has a beneficial impact on efficiency and performance adaption accuracy. Electronic control of power-train operation creates an opportunity for developing engine-working protocols for better performances in specific regimes [4-9]. Some developments of new features in the context of studying port fuel injection aimed to improve powertrain performances and fuel economy, to simplify engine auxiliary systems are mandatory for increasing efficiency and for lowering pollution [5]. The challenge for researchers and CFD specialists is to formulate an optimal tuned up digital map. This endeavour is based on a rigorous analysis with mathematical and graphical apparatus that leads to the improvement of software aided engineering process control of motor-sport fuel supply systems, especially in the whole track follow-up of a rally competition with some specific constraints due to the extreme speeds, inertia and mechanical stress. The fuel supply systems with port fuel injection are structured from three significant parts: which comprise a sensors group, electronic control module and an actuators group of elements. In the computer aided testing and evaluation of the fuel supply systems: specific system parameters, structural variables, digital tools and decision mapping indicators [5-8] are implemented to validate the optimal electronic controlled map model for specific engine-regime scenario. The main objective of the present paper is to outline the correlation in the fluid control and the electronic or digital mapping in order to track the trend-line for features of the electronic control module. Specific targets of the research are as follows: analyse of fuel injector duty, intake fluid pressure in manifold, ECU auxiliary duty and ignition advance versus engine speed.

ISSN 1453 – 7303 “HIDRAULICA” (No. 2/2018) Magazine of Hydraulics, Pneumatics, Tribology, Ecology, Sensorics, Mechatronics
44
2. Research methodology
In order to conduct the research (on electronic or digital control of the fluid intake and hydraulic performances of the injection system adapted to the rally powertrain of the Mitsubishi Evo that has been studied) there were previously installed some hardware components and software features, which facilitate the method of, analyse by experimental measurement and testing as well as trend-line interpretation. The track of the signals and the methodological pathway of the input/output parameters is shown in a simplified schematic of the vehicle’s power-train (figure 1). The actuator group of elements (injectors and spark plugs) is controlled by the electronic control unit/module (ECU/ECM), which takes data from input devices, process all the acquired information and then make a decision in order to perform/actuate a specific task in the field of hydraulics or fluid dynamics, when opening the injectors and fuel pressure regulator.
Fig. 1. Structural assembly of control system for hydraulic and mechanical parts in the vehicle’s powertrain
The research methodology (figure 1) following the sequences of the documentation and practical tests on the rally vehicle leads to final valid results after a certain number of repetitions or applications of this cycle.
Fig. 2. Structural assembly of control system for hydraulic and mechanical parts in the vehicle’s powertrain

ISSN 1453 – 7303 “HIDRAULICA” (No. 2/2018) Magazine of Hydraulics, Pneumatics, Tribology, Ecology, Sensorics, Mechatronics
45
2.1 The study at specific temperature value for engine and air intake
The engine is wormed up and ready for measurements when starting the practical measures in experimental testing (figure 3). The indicator/pointer on the graph is placed at 24:14:50 minutes from start.
Fig. 3. Graphic capture from ECM with engine speed variation and engine’s fluid temperatures
Parameter readings and data acquisition are targeted also toward the inspection of manifold pressure, throttle position, fuel injection duty and ignition advance angle.
Fig. 4. Graphic capture from ECM with manifold pressure and ignition advance angle before BTDC
2.2 The study of mathematical models
The significant aspect that is analyzed and highlighted for comprehensive approach consists in fuel injection duty correlated to engine’s speed, as a percent of total mass of fuel injected when vehicle is full loaded and driven with maximum speed, as it is expressed by formula (1):
22.3x102.2F 3
id += , [%] (1)
The other important aspect, which has to be pointed out for this scientific approach of the specific control in rally engine, is ignition advance related to fuel injection duty, as it is given by formula (2):
43.7x45.3Fid −= , [°BTDC]. (2)

ISSN 1453 – 7303 “HIDRAULICA” (No. 2/2018) Magazine of Hydraulics, Pneumatics, Tribology, Ecology, Sensorics, Mechatronics
46
3. Research results
The studied engine is warmed up and ready for measurements when starting the practical measures in experimental testing (figure 5). Digital indicator on the graph is located at 24:14:50 minutes from start, but the data acquisition goes on through entire track.
Fig. 5. Results of computer aided testing and measurements regarding fuel injection duty, air pressure in the intake manifold
y = 0.0082x + 2.9159R² = 0.838
13
15
17
19
1000 1200 1400 1600 1800 2000
Ign
itio
n a
dv
an
ce, [°
BT
DC
]
Engine speed, [rpm]
y = 0.0022x + 3.2246R² = 0.7581
6
6.5
7
7.5
1000 1200 1400 1600 1800 2000
Fu
el In
j. D
uty
, [%
]
Engine speed, [rpm]
y = -0.0125x + 63.762R² = 0.4785
40
42
44
46
48
1000 1200 1400 1600 1800 2000
Au
x 3
Du
ty E
CU
, [%
]
Engine speed, [rpm]
y = -0.0067x + 101.36R² = 0.4437
87
88
89
90
91
92
1000 1200 1400 1600 1800 2000
Man
ifo
ld P
ressu
re, [k
Pa]
Engine speed, [rpm]
y = -0.2354x + 28.162R² = 0.8514
6.4
6.7
7
7.3
7.6
87 88 89 90 91 92
Fu
el In
j. D
uty
, [%
]
Manifold Pressure, [kPa]
y = -0.7729x + 86.182R² = 0.757
14
16
18
20
87 88 89 90 91 92Ign
itio
n a
dv
an
ce, [°
BT
DC
]
Manifold Pressure, [kPa]
y = -2.9148x + 63.421R² = 0.1728
40
41
42
43
44
45
46
47
48
6.4 6.6 6.8 7 7.2 7.4 7.6
Au
x 3
Du
ty E
CU
, [%
]
Fuel Inj. Duty, [%]
y = 3.4495x - 7.4313R² = 0.9813
14
16
18
20
6.4 6.6 6.8 7 7.2 7.4 7.6
Ign
itio
n a
dv
an
ce, [°
BT
DC
]
Fuel Inj. Duty, [%]

ISSN 1453 – 7303 “HIDRAULICA” (No. 2/2018) Magazine of Hydraulics, Pneumatics, Tribology, Ecology, Sensorics, Mechatronics
47
The experimental measuring tests were developed on a Mitsubishi Lancer with technical details that are given in the table 1. Table 1: Engine technical details
Parameter Actual Value Unit of measurement
Model Production Duration March 2005 – January 2007 & 2008 year
Body and chassis - Platform CT9A -
Powertrain - Engine 2.0 L 4G63T I4 Turbocharged -
Powertrain - Transmission 6-speed manual gears
Wheelbase 2625 mm
Length 4490 mm
Width 1770 mm
Height 1450 mm
Weight 1350 kg
After considering the measurements and trend-lines of the recorded values some observations and conclusions are drawn.
4. Conclusions
In this technical paper, were studied the performances of multiple hydraulic or fluid lines, electrical and digital controlled, and process features in fuel supply and mixture ignition management in relation with the engine speed, injection duty, spark advance angle and intake manifold pressure.
The highest ignition advance (at 18°BTDC) was found for the 88.9 kPa manifold pressure of the intake air with 7.4% fuel injection duty, while the lowest spark ignition advance was found for the 6.5% fuel injection duty with 91.75 kPa intake air manifold pressure.
The highest manifold pressure (at 91.8 kPa) was found for the 1480 rpm and 15°BTDC ignition advance, while the lowest intake air manifold pressure was found for the highest ignition advance.
The lowest fuel injection duty was found for the 14.9°BTDC ignition advance angle, while the maximum fuel injection duty was found for the operating regime with 18°BTDC ignition advance. This research study has performed an elaboration of the testing and measurement procedure correlated with the fuel system with variable parameters applied in automotive sector on the rally cars. Computer aided testing and evaluation was realized to predict the trend-line of fluid dynamics and ignition advance behaviour of fuel injection system, corresponding to different operation scenarios, in order to improve the overall systemic performance for a feasible strategy within a prescribed context.
A new possible strategy to improve the port fuel injection systems for performance regimes in rally powertrains can be developed through the application of an adapted solution for optimized correlation between ignition advance angle and manifold intake pressure and charge instead of the conventional mapping. A digital tuning of the engine’s electronic management module in fuel supply maps is beneficial in order to a better definition of quantities sprayed on the intake port. It leads to an improved mixture quality and thus to a better combustion process if properly adapted with spark ignition advance during each operational cycle.
The experimental results revealed that the optimal economical and best performance regime (situated for this specific case at 16°BTDC ignition advance angle) provides a lower fuel quantity sprayed on the intake port and higher heat release ratio than the 18°BTDC regime, and thus leads to better average working performance and an alternative to run in time conditioned situations. Defining of the optimal working model with the minimum number of experimental tests and

ISSN 1453 – 7303 “HIDRAULICA” (No. 2/2018) Magazine of Hydraulics, Pneumatics, Tribology, Ecology, Sensorics, Mechatronics
48
measurements through the tracing of evolution equations, trend-lines and the adapted value would also be known as engine electronic control module tuning objectives with the future researches. Financial disclaimer: The authors have no financial or ownership benefits in any systems or components specified. Competition interests: The paper’s authors declare that they have no considerable inherent economic, professional or personal profits that could have determined the outputs or trend-lines of the analyze presented in this paper.
References
[1] Basshuysen, R. van. Gasoline Engine with Direct Injection. Processes, Systems, Development, Potential. Wiesbaden, Vieweg+Teubner, GWV Fachverlage GmbH, 2009.
[2] Băldean, Doru, Nicolae Vlad Burnete, Dan Moldovanu, Ferenc Gaspar, Adela-Ioana Borzan, and Mihai-Aurel Crișan. “Experimental Research Regarding the Possibility of Biofuel Fumigation Supply Method on a Single Cylinder Compression Ignited Engine.” Paper presented at the 12th International Congress of Automotive and Transport Engineering CONAT-2016, Brasov, Romania, October 26-29, 2016.
[3] Bățaga, N., et al. Internal combustion engines/Motoare cu ardere internă, ISBN 973-30-4922-0. București, Didactic and Pedagogical Publishing House, 1995, pp. 182÷189.
[4] Cordoş, N., et al. Automobiles.Construction.Wear.Evaluation/Automobile.Construcţie.Uzare.Evaluare. Cluj-Napoca, Todesco Publishing House, 2000.
[5] Ferenți, Iosif and Doru-Laurean Băldean. Artificial intelligence implemented in rally vehicles pentru increasing energetic efficiency in competitions/Inteligența artificială implementată în autovehicule de raliuri pentru creșterea eficienței energetice în competiții, May 29, 2018. Accessed June 3, 2018. https://stiintasiinginerie.ro/34-18-inteligenta-artificiala-implementata-in-autovehicule-de-raliuri-pentru-cresterea-eficientei-energetice-in-competitii/.
[6] Ferenți, Iosif and Doru-Laurean Băldean. The analyze of specific parameters for spark ignited engine operational cycle depending on altitude/Analiza mărimilor specifice ciclului funcțional al unui motor cu aprindere prin scânteie în raport cu altitudinea, January 31, 2015. Accessed June 3, 2018. http://stiintasiinginerie.ro/26-46-analiza-marimilor-specifice-ciclului-functional-al-unui-motor-cu-aprindere-prin-scanteie-in-raport-cu-altitudinea/.
[7] Ferenți, I., Adela-Ioana Borzan, D.-L. Băldean, and Ioan-Aurel Cherecheș. Analizing a thermal management solution of engine as embedded technology in rally vehicles/Analiza unei soluții de management termic al motorului ca tehnologie integrată în autovehiculul de raliu, May 3, 2017. Accessed June 3, 2018. https://stiintasiinginerie.ro/31-58-analiza-unei-solutii-de-management-termic-al-motorului-ca-tehnologie-integrata-in-autovehiculul-de-raliu/.
[8] Toader, G.-V., Cherecheș A.-I., Kocsis L.-B., Gaspar F. and Adela-Ioana Borzan. Contributions to the experimental research of injection fuel supply system from 3.0i engine of BMW X5 road vehicles/ Contribuții la cercetarea experimentală a parametrilor sistemului de alimentare prin injecție de la motorul 3.0i al automobilului BMW X5, May 4, 2017. Accessed June 5, 2018. https://stiintasiinginerie.ro/31-70-contributii-la-cercetarea-experimentala-a-parametrilor-sistemului-de-alimentare-prin-injectie-de-la-motorul-3-0i-al-automobilului-bmw-x5/.
[9] ***. Mitsubishi Lancer Evolution, May 4, 2017. Accessed June 5, 2018. https://stiintasiinginerie.ro/31-70-contributii-la-cercetarea-experimentala-a-parametrilor-sistemului-de-alimentare-prin-injectie-de-la-motorul-3-0i-al-automobilului-bmw-x5/.

ISSN 1453 – 7303 “HIDRAULICA” (No. 2/2018) Magazine of Hydraulics, Pneumatics, Tribology, Ecology, Sensorics, Mechatronics
49
The Optimal CAD Design of a 3D Hexagonal Toroid with Regular Hexagonal Cross-Section Used in Manufacturing of LPG Storage Tanks
Assoc. Prof. PhD. Eng. Mihai ŢĂLU1, Assoc. Prof. PhD. Eng. Ștefan ŢĂLU2,*
1 University of Craiova, Faculty of Mechanics, Department of Applied Mechanics and Civil Engineering, Calea București Street, no. 107, 200512 Craiova, Dolj county, Romania. E-mail: [email protected]
2 Technical University of Cluj-Napoca, The Directorate of Research, Development and Innovation Management (DMCDI), Constantin Daicoviciu Street, no. 15, Cluj-Napoca, 400020, Cluj county, Romania. Corresponding author* e-mail: [email protected]
Abstract: The objective in this paper is to optimal CAD design of a 3D hexagonal toroid with regular hexagonal cross-section used in manufacturing of LPG storage tanks used in automotive industry based on the finite element analysis (FEA) approaches. A design strategy to define specific key performance indicators according to manufacturing objectives was developed to determine the optimal form of the 3D hexagonal toroidal LPG fuel tank with lower values of the stress state and linear deformation. Numerical simulations are carried out using a 3D model done in the AutoCAD Autodesk 2017 software, which was imported for analysis to SolidWorks 2017 software. The results will allow the improvement of design strategies of toroidal LPG fuel tanks, which create the relationships between work items and product components in the proposed 3D CAD objects.
Keywords: Automotive industry, industrial engineering design, optimization methods, 3D hexagonal toroidal LPG fuel tank
1. Introduction
The developing of new manufacturing strategies is a complex task due to many factors (expensive equipment, expensive tests, and safety constraints) that imply virtual computer aided engineering tools in developing innovative ways in 3D CAD modelling of prototypes of storage fuel tanks used in automotive industry [1-6]. During the last few decades in manufacturing of storage fuel tanks in automotive industry various models were proposed with a wide range of adaptations in response to changing productivity, prices, and the materials use [7-13]. The most companies apply a differentiated approach in 3D CAD design and manufacturing process for new models, based on storage fuel tanks weight to satisfy the demands of the competitive market [14-19]. In order to ensure high degree of stability and safety in recent 3D models, stress analysis using both computational and experimental approaches, including finite element modeling and the design and execution of custom mechanical tests were carried out to satisfy the general structural design and certification rules [20-24]. The automotive industry has implemented improvements in the design procedure of the storage fuel tanks that involves reduce project risk, gain better control of model variants, reduce testing time and cost, effectively use data from tests and also to get better products in terms of structure, service life and durability [25-35]. The results of the optimization process provide a new insight into the behavior of the non-linear aspects of storage fuel tanks with complex geometries and gain better control on various model variants, while improving storage efficiencies with a high structural performance [36-44]. In our research, a finite element analysis was made to a 3D hexagonal toroid with regular hexagonal cross-section used for LPG storage tanks in the automotive industry to meet safety standards considering the particular geometry and the structure parameters.
2. Design methodology
In our study, optimal design of a 3D hexagonal toroid with regular hexagonal cross-section in order to reduce stress non-uniformity is performed.

ISSN 1453 – 7303 “HIDRAULICA” (No. 2/2018) Magazine of Hydraulics, Pneumatics, Tribology, Ecology, Sensorics, Mechatronics
50
2.1 Basic geometry of the parametric 3D model
Let’s consider the parametric 3D model generated by revolving of a closed generating curve CG (a hexagon with rounded corners) along a closed guiding curve CD (a hexagon with rounded corners) as shown in figure 1.
Fig. 1. The axonometric representation of the parametric 3D solid model
These parametric 3D models have two symmetry planes: one horizontal and one vertical, to define the locations of important geometrical features, as shown in figure 2.
Fig. 2. a) and b) The orthogonal views with the symmetry planes of 3D solid model
The following parameters were applied as input parameters to the 3D parametric model (figure 3): a) a closed generating curve CG (a hexagon with a side value L = 175 mm, with rounded corners, radius R = 50 mm), and b) the guiding curve CD (a hexagon with a side value L = 430 mm, with rounded corners, radius R = 180 mm).
2.2 Numerical analysis of the parametric 3D model
Based on the physical model, the modeling was done in the AutoCAD Autodesk 2017 software [45] and the numerical analysis was performed with SolidWorks 2017 software [46] with the Static, Thermal and Design Study modules. The design data used were: ▪ the tank material is AISI 4340 steel; ▪ the maximum hydraulic test pressure: pmax = 30 bar, applied on surface S1; ▪ the working temperature between the limits: T = -30 0C up to T = 60 0C, applied on surface S2; ▪ supporting surfaces located on the inferior side (applied on surface S3); ▪ the duration of the tank exploitation: na = 16 years; ▪ the corrosion rate of the material: vc = 0.07 mm/years.
The generating curve CG a)
d) e)
b) c)
The guiding curve CD
a) b)
The vertical symmetry plane
The horizontal symmetry plane

ISSN 1453 – 7303 “HIDRAULICA” (No. 2/2018) Magazine of Hydraulics, Pneumatics, Tribology, Ecology, Sensorics, Mechatronics
51
c) A
B C
e)
The applied optimization function is intended to achieve a minimum mass. For the numerical computations were applied and specified the loads and restrictions to the parametric 3D model (fig. 3).
Fig. 3. Different isometric views of the parametric 3D model with the corresponding loads and restrictions
Numerical calculations were performed for: a mesh standard type, solid mesh with high quality, automatic transition, Jacobian in 16 points, maximum element size 20 mm, tolerance 1 mm, number of nodes 101959, number of elements 51617, maximum aspect ratio 31.89, number of degrees freedom 302958.
In numerical analysis the restriction of constraint was that the value of Von Mises effort rez a =
710 N/mm2 (a – the admissible value of the traction stress of the material). Applying the proposed optimization procedure, the obtained values are: the thickness s = 7.35 mm
for T = -30 0C with the stress value of the rez. max= 707.585 N/mm2 and a linear deformation value umax = 1.551 mm. Distributions of the state of stress (fig. 4, a-d) and of linear deformations (fig. 4, e-h) are graphically represented in fig. 4.
b)
S2
S3 a)
S1
a)
d)
D
E
F
G
H
J
b)
f)

ISSN 1453 – 7303 “HIDRAULICA” (No. 2/2018) Magazine of Hydraulics, Pneumatics, Tribology, Ecology, Sensorics, Mechatronics
52
Fig. 4. The distributions of the state of stress and of linear deformations of the parametric 3D model: a, b, e, f) non-sectioned model; c, d, g, h) half-section model
It can be noted that the highest values of efforts in the 3D model occur in the connection zones: A, B, C, .., H (fig. 4). The state of maximum deformation appears on the surfaces (J and I) (fig. 4). The formula for calculating the thickness is the following:
sreal = sopt + vc∙ na + abs(Ai) + sa (1) where: - vc, corrosion rate of the cover, vc = 0.07 mm/years; - na, number of years of exploitation, na = 16 years; - Ai, the lower deviation of the laminate sheet, Ai = - 0.6 mm, for s = 2…5 mm;
- sa = 0.1 s = 0.735 mm, thinning of the sheet caused by the head cover embossing. Finally, the minimum thickness of the sheet laminate is determined as: sreal min = 7.35 + 0.07 ∙ 16 + abs(-0.6) + 0.1 ∙ 7.35 = 9.805 mm (2) A laminate sheet of AISI 4340 steel with a thickness of s = 10 +0.25
-0.6 mm is chosen for analysis. The numerical values of state of stress and linear deformation distribution are given in Table 1, for
na = 16 years which corresponds to a minimal cover thickness s 7.55 mm.
Table 1: The Von Mises stress and linear deformation of geometrical 3D solid model
The graph and law of variation of the Von Mises stress as a function of temperature are given in figure 5.
Fig. 5. The graph of Von Mises stress variation as a function of temperature
Distributions of the state of stress for different temperatures: a1 & b1) T = -30 0C, a2 & b2) T = 0 0C, a3 & b3) T = 30 0C and a4 & b4) T = 60 0C) are shown in figure 6.
T 0C -30 0C -20 0C -10 0C 0 0C 10 0C 20 0C 30 0C 40 0C 50 0C 60 0C
N/mm2 681.0 648.67 616.55 584.72 562.44 543.82 525.73 508.09 526.84 549.96
u mm 1.423 1.424 1.425 1.427 1.428 1.430 1.432 1.433 1.435 1.437
g) h)
I

ISSN 1453 – 7303 “HIDRAULICA” (No. 2/2018) Magazine of Hydraulics, Pneumatics, Tribology, Ecology, Sensorics, Mechatronics
53
Fig. 6. Distributions of the state of stress for different temperatures: a1 & b1) T = -30 0C, a2 & b2) T = 0 0C, a3 & b3) T = 30 0C and a4 & b4) T = 60 0C.
The graph and law of variation of the resulting linear deformations as a function of temperature are given in figure 7.
Fig. 7. The graph of the resulting linear deformations variation as a function of temperature
a1)
b1)
A2)
a2)
b2)
a3)
b3)
b4)
a4)
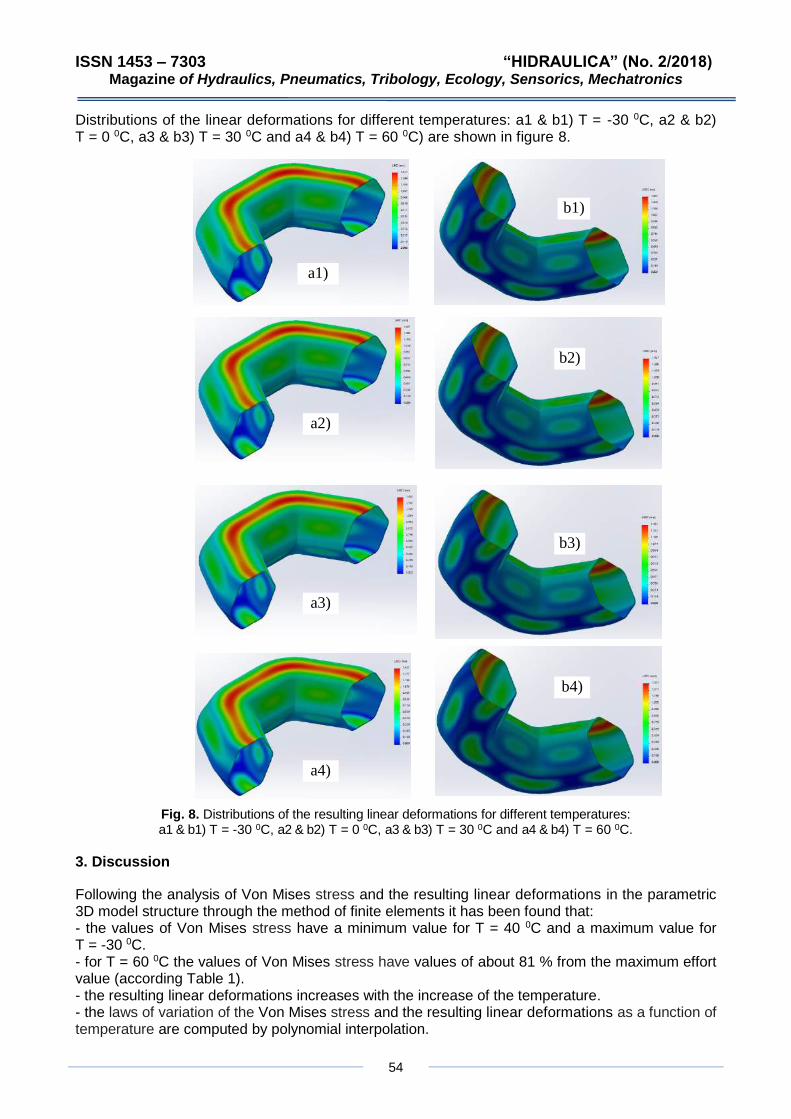
ISSN 1453 – 7303 “HIDRAULICA” (No. 2/2018) Magazine of Hydraulics, Pneumatics, Tribology, Ecology, Sensorics, Mechatronics
54
Distributions of the linear deformations for different temperatures: a1 & b1) T = -30 0C, a2 & b2) T = 0 0C, a3 & b3) T = 30 0C and a4 & b4) T = 60 0C) are shown in figure 8.
Fig. 8. Distributions of the resulting linear deformations for different temperatures: a1 & b1) T = -30 0C, a2 & b2) T = 0 0C, a3 & b3) T = 30 0C and a4 & b4) T = 60 0C.
3. Discussion
Following the analysis of Von Mises stress and the resulting linear deformations in the parametric 3D model structure through the method of finite elements it has been found that: - the values of Von Mises stress have a minimum value for T = 40 0C and a maximum value for T = -30 0C. - for T = 60 0C the values of Von Mises stress have values of about 81 % from the maximum effort value (according Table 1). - the resulting linear deformations increases with the increase of the temperature. - the laws of variation of the Von Mises stress and the resulting linear deformations as a function of temperature are computed by polynomial interpolation.
a1)
b1)
a2)
b2)
a3)
b4)
b3)
a4)

ISSN 1453 – 7303 “HIDRAULICA” (No. 2/2018) Magazine of Hydraulics, Pneumatics, Tribology, Ecology, Sensorics, Mechatronics
55
4. Conclusions
The proposed 3D parametric modelling method allows designers in making optimal design choices of the geometric variants of the 3D hexagonal toroids with regular hexagonal cross-section used for LPG storage tanks in the automotive industry for a feasible solution within a prescribed tolerance. Conflict of Interest: The authors declare that they have no conflict of interest.
References
[1] Ghiţă, C. Mirela, Anton C. Micu, Mihai Ţălu, Ştefan Ţălu and Ema I. Adam. “Computer-Aided Design of a classical cylinder gas tank for the automotive industry.“ Annals of Faculty of Engineering Hunedoara - International Journal of Engineering, Hunedoara, Romania, Tome XI, Fascicule 4 (2013): 59-64.
[2] Ghiţă, C. Mirela, Anton C. Micu, Mihai Ţălu and Ştefan Ţălu. “Shape optimization of vehicle's methane gas tank.“ Annals of Faculty of Engineering Hunedoara - International Journal of Engineering, Hunedoara, Romania, Tome X, Fascicule 3 (2012): 259-266.
[3] Ghiţă, C. Mirela, Ştefan C. Ghiță, Ştefan Ţălu and Simona Rotaru, “Optimal design of cylindrical rings used for the shrinkage of vehicle tanks for compressed natural gas.“ Annals of Faculty of Engineering Hunedoara - International Journal of Engineering, Hunedoara, Tome XII, Fascicule 3 (2014): 243-250.
[4] Ghiţă, C. Mirela, Anton C. Micu, Mihai Ţălu and Ştefan Ţălu. “3D modelling of a shrink fitted concave ended cylindrical tank for automotive industry.“ Acta Technica Corviniensis – Bulletin of Engineering, Hunedoara, Romania, Tome VI, Fascicule 4 (2013): 87-92.
[5] Ghiţă, C. Mirela, Anton C. Micu, Mihai Ţălu and Ştefan Ţălu. “3D modelling of a gas tank with reversed end up covers for automotive industry.“, Annals of Faculty of Engineering Hunedoara - International Journal of Engineering, Hunedoara, Romania, Tome XI, Fascicule 3 (2013): 195-200.
[6] Ghiţă, C. Mirela, Anton C. Micu, Mihai Ţălu and Ştefan Ţălu. “Shape optimization of a thoroidal methane gas tank for automotive industry.” Annals of Faculty of Engineering Hunedoara - International Journal of Engineering, Hunedoara, Romania, Tome X, Fascicule 3 (2012): 295-297.
[7] Bică, Marin, Mihai Ţălu and Ştefan Ţălu. “Optimal shapes of the cylindrical pressurized fuel tanks.” Magazine of Hydraulics, Pneumatics, Tribology, Ecology, Sensorics, Mechatronics (HIDRAULICA), no. 4 (December 2017): 6-17.
[8] Ţălu, Ştefan and Mihai Ţălu. "The influence of deviation from circularity on the stress of a pressurized fuel cylindrical tank." Magazine of Hydraulics, Pneumatics, Tribology, Ecology, Sensorics, Mechatronics (HIDRAULICA), no. 4 (December 2017): 34-45.
[9] Vintilă, Daniela, Mihai Ţălu and Ştefan Ţălu. “The CAD analyses of a torospheric head cover of a pressurized cylindrical fuel tank after the crash test.” Magazine of Hydraulics, Pneumatics, Tribology, Ecology, Sensorics, Mechatronics (HIDRAULICA), no. 4 (December 2017): 57-66.
[10] Ţălu, Mihai. "The influence of the corrosion and temperature on the Von Mises stress in the lateral cover of a pressurized fuel tank." Magazine of Hydraulics, Pneumatics, Tribology, Ecology, Sensorics, Mechatronics (HIDRAULICA), no. 4 (December 2017): 89-97.
[11] Ţălu, Mihai and Ştefan Ţălu. "Analysis of temperature resistance of pressurized cylindrical fuel tanks." Magazine of Hydraulics, Pneumatics, Tribology, Ecology, Sensorics, Mechatronics (HIDRAULICA), no. 1 (March 2018): 6-15.
[12] Ţălu, Ştefan and Mihai Ţălu. "Algorithm for optimal design of pressurized toroidal LPG fuel tanks with constant section described by imposed algebraic plane curves." Magazine of Hydraulics, Pneumatics, Tribology, Ecology, Sensorics, Mechatronics (HIDRAULICA), no. 2 (June 2018): 14-21.
[13] Ţălu, Mihai and Ştefan Ţălu. "Design and optimization of pressurized toroidal LPG fuel tanks with variable section." Magazine of Hydraulics, Pneumatics, Tribology, Ecology, Sensorics, Mechatronics (HIDRAULICA), no. 1 (March 2018): 32-41.
[14] Zhang, Yao. PhD thesis: Vibration based damage assessment of type 1 compressed natural gas cylinder. Nanyang Technological University, School of Civil and Environmental Engineering, 2015.
[15] Veličković, Vladan. “Stress and Strain States in the Material of the Stressed Toroidal Container for Liquefied Petroleum Gas.” Scientific Technical Review, vol. LVII, no. 3-4 (2007): 94-105.
[16] Huijian, Zhan. Master thesis: Static and Dynamic Analysis of Toroidal LPG Tanks, University of Ottawa, Canada, 2008.
[17] Nishalin, Govender. Master thesis: A parametric investigation into the membrane stresses of hydrostatically loaded circular and elliptic toroidal shells, University of Cape Town, 2014.
[18] Pandey, Atul, Mahendra Singh, Nikhalesh Soni and Mr. Padmakar Pachorkar. “Process layout on advance CNG cylinder manufacturing.“ IJAIEM, vol. 3, issue 12 (2014): 113-116.
[19] Mayyas Ahmad, Ala Qattawi, Mohammed Omar and Dongri Shan, “Design for sustainability in automotive industry: A comprehensive review.” Renew Sust Energ Rev, vol. 16, issue 4 (2012): 1845-1862.
ISSN 1453 – 7303 “HIDRAULICA” (No. 2/2018) Magazine of Hydraulics, Pneumatics, Tribology, Ecology, Sensorics, Mechatronics
56
[20] *** Certification tests of LPG and CNG. Accessed May 10, 2017. http://vzlutest.cz/en/certification-tests-of-lpg-and-cng-c3.html.
[21] Kartal, Fuat and Yasin Kișioglu. “Fatigue performance evaluations of vehicle toroidal liquefied petroleum gas fuel tanks.” J. Pressure Vessel Technol, vol. 139, issue 4 (2017): 041402. DOI: 10.1115/1.4035976.
[22] Ţălu, Ştefan and Mihai Ţălu. “Constructive CAD variants of toroidal LPG fuel tanks used in automotive Industry.“ Advances in Intelligent Systems Research, vol. 159 (2018): 27-30. DOI: 10.2991/mmsa-18.2018.7.
[23] Ţălu, Ştefan and Mihai Ţălu. “The Influence of corrosion on the vibration modes of a pressurized fuel tank used in automotive industry.“ DEStech Transactions on Materials Science and Engineering, (2018): 1-6. DOI: 10.12783/dtmse/icmsa2018/20560.
[24] Ţălu, Mihai and Ştefan Ţălu. “Optimal engineering design of a pressurized paralepipedic fuel tank.“ Annals of Faculty of Engineering Hunedoara - International Journal of Engineering, Hunedoara, Romania, Tome XVI, Fascicule 2 (2018): 193-200.
[25] Ţălu, Ştefan and Mihai Ţălu. “CAD generating of 3D supershapes in different coordinate systems.“ Annals of Faculty of Engineering Hunedoara - International Journal of Engineering, Hunedoara, Romania, Tome VIII, Fascicule 3 (2010): 215-219.
[26] Ţălu, Ştefan and Mihai Ţălu. “A CAD study on generating of 2D supershapes in different coordinate systems.“ Annals of Faculty of Engineering Hunedoara - International Journal of Engineering, Hunedoara, Romania, Tome VIII, Fascicule 3 (2010): 201-203.
[27] Ţălu, Ştefan. Limbajul de programare AutoLISP. Teorie şi aplicaţii. (AutoLISP programming language. Theory and applications). Cluj-Napoca, Risoprint Publishing house, 2001.
[28] Ţălu, Ştefan. Grafică tehnică asistată de calculator. (Computer assisted technical graphics). Cluj-Napoca, Victor Melenti Publishing house, 2001.
[29] Ţălu, Ştefan. Reprezentări grafice asistate de calculator. (Computer assisted graphical representations). Cluj-Napoca, Osama Publishing house, 2001.
[30] Ţălu, Ştefan. AutoCAD 2005. Cluj-Napoca, Risoprint Publishing house, 2005. [31] Ţălu, Ştefan and Mihai Ţălu. AutoCAD 2006. Proiectare tridimensională. (AutoCAD 2006. Three-
dimensional designing). Cluj-Napoca, MEGA Publishing house, 2007. [32] Ţălu, Ştefan. AutoCAD 2017. Cluj-Napoca, Napoca Star Publishing house, 2017. [33] Țălu, Mihai. Calculul pierderilor de presiune distribuite în conducte hidraulice. (Calculation of distributed
pressure loss in hydraulic pipelines). Craiova, Universitaria Publishing house, 2016. [34] Ţălu, Mihai. Mecanica fluidelor. Curgeri laminare monodimensionale. (Fluid mechanics. The
monodimensional laminar flow). Craiova, Universitaria Publishing house, 2016. [35] Țălu, Mihai. Pierderi de presiune hidraulică în conducte tehnice cu secțiune inelară. Calcul numeric și
analiză C.F.D. (Hydraulic pressure loss in technical piping with annular section. Numerical calculation and C.F.D.), Craiova, Universitaria Publishing house, 2016.
[36] Ţălu, Ştefan. Geometrie descriptivă. (Descriptive geometry), Cluj-Napoca, Risoprint Publishing house, 2010. [37] Valencia, Garcia. Geometría descriptiva, paso a paso. Primera edición, Bogotá, Colombia, D.C, editorial
Ecoe Ediciones, 2009. [38] Florescu-Gligore, Adrian, Magdalena Orban and Ştefan Ţălu. Cotarea în proiectarea constructivă şi
tehnologică. (Dimensioning in technological and constructive engineering graphics). Cluj-Napoca, Lithography of The Technical University of Cluj-Napoca, 1998.
[39] Florescu-Gligore, Adrian, Ştefan Ţălu and Dan Noveanu. Reprezentarea şi vizualizarea formelor geometrice în desenul industrial. (Representation and visualization of geometric shapes in industrial drawing). Cluj-Napoca, U. T. Pres Publishing house, 2006.
[40] Racocea, Cristina and Ştefan Ţălu. Reprezentarea formelor geometrice tehnice în axonometrie. (The axonometric representation of technical geometric shapes). Cluj-Napoca, Napoca Star Publishing house, 2011.
[41] Ţălu, Ştefan and Cristina Racocea. Reprezentări axonometrice cu aplicaţii în tehnică. (Axonometric representations with applications in technique). Cluj-Napoca, MEGA Publishing house, 2007.
[42] Niţulescu, Theodor and Ştefan Ţălu. Aplicaţii ale geometriei descriptive şi graficii asistate de calculator în desenul industrial. (Applications of descriptive geometry and computer aided design in engineering graphics). Cluj-Napoca, Risoprint Publishing house, 2001.
[43] Bîrleanu, Corina and Ştefan Ţălu. Organe de maşini. Proiectare şi reprezentare grafică asistată de calculator. (Machine elements. Designing and computer assisted graphical representations). Cluj-Napoca, Victor Melenti Publishing house, 2001.
[44] Ţălu, Ştefan. Micro and nanoscale characterization of three dimensional surfaces. Basics and applications. Napoca Star Publishing House, Cluj-Napoca, Romania, 2015.
[45] *** Autodesk AutoCAD 2017 software. [46] *** SolidWorks 2017 software.

ISSN 1453 – 7303 “HIDRAULICA” (No. 2/2018) Magazine of Hydraulics, Pneumatics, Tribology, Ecology, Sensorics, Mechatronics
57
A Point of View about Ecological Status of Maritime Lakes
Prof. Dr. Eng. Mariana PANAITESCU1, Prof. Dr. Eng. Fănel-Viorel PANAITESCU2, Senior lecturer Dr. biologist Simona GHIȚĂ3, Assist. Drd. Eng. Iulia-Alina ANTON4
1 Constanta Maritime University, [email protected]
2 [email protected], [email protected],4 [email protected]
Abstract: The lake Techirghiol comprises three distinct areas from a topographical, physical-chemical and biological point of view (hypersaline area of spa interest, majority as surface, intermediate area –buffer-, freshwater area) separated between them through protective dikes. Research: the period of observation was chosen May–June at the limit of the two seasons, spring and summer. Physical-chemical and electrochemical analyses were performed on water and sediment samples. Results: during the period of observations the three areas manifested differently. In the first two, the values of salinity were not altered, and in the hypersaline area they decreased by 20–25%. The hydro chemical analyses included the evaluation of dissolved O2 content and biogenic substances. The dynamics of these parameters evolved differently. Balanced distribution was the result of normal biological activities; excessive accumulations were due to internal ecological de-adjustments or some external contributions to the system.
Keywords: Marine lake, status, biodiversity, salinity analysis, evaluation, dynamics, spa area, season.
1. Introduction
A classification of the existing lakes in Romania can be detailed thus [1]: 1. mountain lakes (in volcanic craters, in glacial circuses, in karstic depressions, natural dam, artificial dam); 2. meadow lakes; 3. relic lakes; 4. heliothermal lakes; 5. havens (river limans, marine limans); 6. lakes in the Danube Delta. In the present paper we will analyze the ecological status of the maritime lakes, namely the status of Techirghiol Lake (Figure 1) [2].
Fig. 1. Techirghiol Lake-satellite view [2]
1.1 The characteristics of Techirghiol Lake
The Techirghiol Liman and Lake Techirghiol (or Tekirghiol, Turkish Tekirgöl, meaning "Lake Tekir") is located on the edge of the spa town Eforie Nord on the Black Sea shore, 12 km away from the port of Constanţa, Romania. It is a river-marine liman [1] with an area of 10.68 km², separated from the sea through a lido, and it has a maximum depth of 9.75 m. By the small intake of freshwater, the water of the Liman increased its concentration of salts, at about 95 g/L. This phenomenon allowed the formation of a layer of sludge with therapeutic qualities [2]. The limans are specific to the Black Sea. In the communist Romania the term of liman for this ensemble was considered

ISSN 1453 – 7303 “HIDRAULICA” (No. 2/2018) Magazine of Hydraulics, Pneumatics, Tribology, Ecology, Sensorics, Mechatronics
58
obsolete by some commentators who did not knew the geographic terminology well, so that instead of the term liman the word lake is improperly used [3], [4]. A river-maritime liman had phases connecting the basin with the sea... when it was a marine bay. The waters of the lake, once disconnected from the sea by forming a cordon of coastal sands (about 200 m wide), became naturally hypersaline, as a result of strong evaporation in the sub-arid climate, which led to the decrease of the lacustrine water level and increase of the salt concentration at a higher level than in marine waters. There is no way to exclude marine water penetration through the deep sand. The level of the lake fluctuates both annually and on a multiannual basis; at measurements of 1909, the water level of the lake was at-1.5 m from the sea level; it decreased to-1.64 in 1953, and currently it has increased near the sea level, perhaps as a result of a less arid-semiarid climate or periods when agricultural irrigation increased the quantities of water introduced into the lake capture basin [5]. Salinity measured in 1893 showed 71.392 g/l, in 1924 it was of 106.896 g/l and in 1969 it was of 81.485 g/l, while in the 1990sit reached a level below 60 g/L, which shows synergistic effects of natural fluctuations and human interference. Currently, the waters of Lake Techirghiol are divided into 3 separate entities by the dikes built in 1983 and 1989, so there is a large area with saline water (52-55 grams of salt per litre) situated near the sea to the east, an intermediate brackish water area (6-8 g/l), and a sweetened water area (1-2.3 g/l), located at the "tail of the Lake"; the western area has swamps and palustral vegetation characteristic of sweet waters. The sweetening of the waters leads to the change of the fauna structure, especially the reduction of ratio of the species of invertebrates adapted to hypersaline waters [5]. Lake Techirghiol [6] has a maximum depth of 9.75 m, average depth of 3.6 m and the volume of water is 41.8 million m3; the maximum length of the lake is 7.75 km, the maximum width is 4.4 km, and the area of the river basin from which its waters are collected is 185.5 km. The biodiversity of the lake is very interesting. In samples collected between 2004-2009 from the lake waters 109 phytoplankton taxa were identified, much of these algae belonging to diatoms, but also Clorophyte, Dinophyte, Euglenae and Crisophyte, Xantophyte... were identified and 14 species of Cyanobacteria planktonic. Macrophytes algae are mainly represented by the species Cladophora vagabunda, but Cladophora crystalline and Cladophora fracta are also present. There are known from here 14 species of Protozoa, 93 species of Rotiphera, 1 species of Copepod and 4 species of Diphtere. Artemia salina is a brachiopod crustacean of 5-10 mm, adapted to life in hypersaline waters. Rivulogammarus pulex is an amphipod relict crustacean, and the gasteropode Pseudamnicola Codreanu is also a regional endemic relict, characteristic of Dobrogea coastal areas. The vegetation near the shores resembles that of marine salt soils, halophile species being present here, such as: Salicornia europaea, Artemisia santonica, Suedamaritima, Sueda salsa, Atriplextatarica, Atriplex oblongifolia, Bassia sedoides, Bassia hirsuta, Acorellus pannonicus, Aster tripolium pannonicus, Hordeum geniculatum, Juncus gerardi, Spergularia media, etc. [7].
Fig. 2.Coracias garrulus; Gulls-Larus melanocephalus; Ajuga chamaepitys Legal protection is provided by Government Decision no 1266/2000. Lake Techirghiol was declared a Ramsar Site on October 20, 2011, with the number 1,610. Techirghiol Lake is also a Natura 2000 Site, based on the European Union Bird Directive, with the ROSPA0061 code. 150 species of birds are known here, of which various species are present at different times of the year (Figure 2). The area of the site is 3,035.3 hectares, between altitudes of 0 and 80 m, the area concerned being part of both the Pontic biogeographic region and the steppe region. According to

ISSN 1453 – 7303 “HIDRAULICA” (No. 2/2018) Magazine of Hydraulics, Pneumatics, Tribology, Ecology, Sensorics, Mechatronics
59
the standard form document of the site, Lake Techirghiol is important for the overwintering of 7,000 red-breasted geese (Branta ruficollis), 40 specimens of whooper swan (Cygnus cygnus), 34 great egrets (Ardea alba), 1 specimen of merlin (Falco columbarius), 1 specimen of peregrine falcon (Falco peregrinus), 3 specimens of arctic loon (Gavia arctica), 1,800 smews (Mergus albellus), 800 white-headed ducks (Oxyura leucocephala), 800 pygmy cormorants (Phalacrocorax pygmeus), etc. Of the species that nest here, it is worth mentioning the 30 pairs of black-winged stilt (Himantopus himantopus), 10-12 pairs of little bittern (Ixobrychus minutus), etc. During the bird visitation period, the site is used, among others, by 20 specimens of Kentish plover (Charadrius alexandrinus), 1,300 white storks (Ciconia ciconia), 600 black-headed gulls (Larus melanocephalus), 5,200 little gulls (Larus minutus), 100-120 great white pelicans (Pelecanus onocrotalus), 100 ruffs (Philomachus pugnax), 20 specimens of little tern (Sterna albifrons) [7], [8].
2. Material and methods
The period of observation was chosen to be May –June at the limit of the two seasons, spring and summer. Physical-chemical and electrochemical analyses were performed on water and sediment samples.
2.1. Data of water samples analyses and graphical interpretations
The hydro chemical characterization of the water samples from Lake Techirghiol, May–June, (mean values) is presented as follows (Figure 3, Figure 4, Figure 5, Figure 6, Figure 7) [1]:
Fig. 3. Salinity variation Fig. 4. Phosphates variation
Fig. 5. Organic substances variation Fig. 6. Ammonia nitrogen variation
Fig. 7. Total nitrogen variation
Finally, the values of salinity were not altered and in the hypersaline area they decreased by 20–25%; the total content of salts (in the current situation expressed in NaCl ‰) was continuously decreasing; thus, in the same period of the year salinity was between 59.0 –64.0 ‰.

ISSN 1453 – 7303 “HIDRAULICA” (No. 2/2018) Magazine of Hydraulics, Pneumatics, Tribology, Ecology, Sensorics, Mechatronics
60
Hydrochemical analyses included the evaluation of dissolved O2 content and biogenic substances (Figure 8, Figure 9, Figure 10).
Fig. 8. Proteins variation
The dissolved O2 content, a defining parameter in assessing the status of aquatic ecosystems, showed in the particular situation of Lake Techirghiol a state of hemostasis. The dependence on the different biological and hydro chemical support of the three zones was highlighted in the detergent values in the samples and the limits of their variation 10.7 –13.1 mg/m3 for the Dulcicola area; 8.8 –11.3 mg/m3 for Buffer zone and 6.4 –7.5 mg/m3 for hypersaline area. The increase of the oxygen concentration for the May-June observation interval was common to the three zones, and the value exceeded the annual averages from previous observations. The concentration of phosphorus, whose origin was predominantly exogenous of the system (Figure 8), was much higher in the hypersaline area during the period of May, with a tendency to decrease in June. At the same time, in the other areas the tendency was increased to much higher values, although the constant values were lower in May; the observation represents an argument of the different behaviors and influences manifested in the divisions of the Techirghiol Lake ecosystem.
Fig. 9. Carbohydrates and Lipids variations
Fig. 10. Organic substances variations
The association of organic substance growth has led to the hypothesis of an additional contribution of biological origin located within the system range (Figure 10).

ISSN 1453 – 7303 “HIDRAULICA” (No. 2/2018) Magazine of Hydraulics, Pneumatics, Tribology, Ecology, Sensorics, Mechatronics
61
2.2. Data for sediments samples analyses and graphical interpretations
Sediments were generally deposits of substances from the water mass but also generated by the mineral and organic loads through the water-sediment interface. The dry substance and mineral residue (on zones 81.6, 88.3, 91.2, respectively) evolved upward from the sweet water zone to the hypersaline one, but the mineral components presented zonal particularities (Figure 11, a; b; c) [9].
a
b
c
Fig. 11. Chemical characterization of sediments during May-June period
The final analysis requires the establishment of a regime protected by law or reserve, which can lead to the relocation of the Techirghiol Lake area [1].
3. Conclusions
The presence of various forms of nitrogen compounds linked to salts and the dynamics of concentrations related to origin – the mineralization of organic substance – provided complementary information on the system. In the hypersaline area the nitrogen compounds were balanced but decreased between the two observation intervals May-June; all this on a source drop-down fund – the content of organic substance, which suggests the transformation of the organic substance dissolved in other components – primarily biochemical. In the other two areas, the buffer one and the sweetened water one, the diminishing of the specified values was different, both presenting a trend of decreasing. Compared to the buffer zone the transformation processes in N-NH4
+ were less intense in the sweetened water area for the same period of observation due to the specific conditions of each area. The association to increase the content of organic substance has led to the assumption of an additional contribution of biological origin situated within the system range. Reporting to previous data showed a sense of growth which, in fact, was in continuation of the previously manifested tendency. The space-temporal distribution of the dissolved organic substance and its components was correlated with the state of the ecosystem due to their important role in the energy transfer
ISSN 1453 – 7303 “HIDRAULICA” (No. 2/2018) Magazine of Hydraulics, Pneumatics, Tribology, Ecology, Sensorics, Mechatronics
62
and resulted in the following conclusion: the balanced distribution was the result of normal biological activities; excessive accumulations were due to internal ecological disturbances or external contributions produced to the system. Sediments were generally deposits of substances from the water mass but also generated by mineral and organic loads through the water-sediment interface. The dry substance and mineral residue (on zones 81.6, 88.3 and respectively 91.2%d.s.) evolved upwards from the sweet water area to hypersaline area, but the mineral components presented regional peculiarities. All these situations emphasized the existence of biological processes and, consequently, biochemicals that were dynamically developed and varied within the system of the Techirghiol Lake. The general interpretation and analysis of the data suggest the installation of a state of hemostasis resulting from the system not adjusting to the new conditions. This requires the establishment of a regime protected by law or reserve, which can lead to the relocation of the Techirghiol Lake area.
References
[1] Panaitescu, Mariana, Fanel-Viorel Panaitescu, Simona Ghita and Iulia-Alina Anton. “Evaluation of hydrochemical and biological status in Lake Techirghiol”. Paper published in Book of Abstract at the 6th
International Conference Modtech 2018, Constanta, Romania, June 13-16, 2018. [2] NASA World Wind Landsat. August 17, 2009. Accessed May 2018,
https://ro.wikipedia.org/wiki/Lacul_Techirghiol#/media/File:Lacul_Techirghiol.png. [3] ***The Encyclopedia Dictionary /Dicționarul Enciclopedic, vol. IV. Bucharest, Romanian Academy of
Socialist Republic of Romania, 1966. [4] Gâștescu, Petre, and Vasile Sencu. The Kingdom of Limans/Împărăția limanelor. Bucharest, Meridiane
Publishing House, 1968. [5] Lengyel, Peter. ”Lacul Techirghiol”, November 3, 2011. Accessed May 28, 2018.
https://peterlengyel.wordpress.com/2011/11/03/lacul-techirghiol/. [6] Gâștescu, Petre. The lakes in Romania – regional limnology. Bucharest, Publishing House of Academy,
1971. [7] Gheorghievici, Liana Manuela. “The Contribution of the Micro- and Macrophytes to the Genesis of the
Therapeutic Mud from Lake Techirghiol, Romania.” Paper presented at the BALWOIS 2010, Ohrid, Republic of Macedonia, May 25-29, 2010.
[8] Tuculescu, Ion. Biodynamics of Techirghiol Lake. Biocenoses and the genesis of sludge /Biodinamica lacului Techirghiol. Biocenozele si geneza nămolului. Bucharest, Academy Publishing House, 1965.
[9] Panaitescu, Mariana, Olga Surdu, and Ioana Oncioiu. “Experimental study and statistical calculus of efficiency of Techirghiol Lake mud.” Paper published at the 3rd International Conference on Environmental and Geological Science and Engineering, Constanta, Romania, September 3-5, 2010.