Embed Size (px)
Citation preview

Atmosphere Monitoring
Copernicus EU
Copernicus EU www.copernicus.eu
Copernicus EU
COPERNICUS ATMOSPHERE MONITORING SERVICEPRODUCTS
Johannes Flemming (ECMWF)
Copernicus
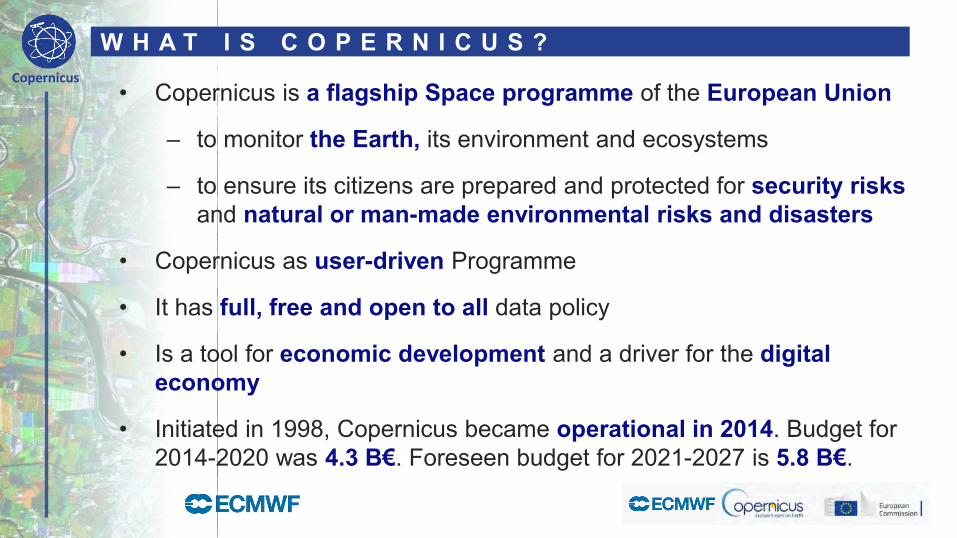
W H A T I S C O P E R N I C U S ?
• Copernicus is a flagship Space programme of the European Union
– to monitor the Earth, its environment and ecosystems
– to ensure its citizens are prepared and protected for security risksand natural or man-made environmental risks and disasters
• Copernicus as user-driven Programme
• It has full, free and open to all data policy
• Is a tool for economic development and a driver for the digital economy
• Initiated in 1998, Copernicus became operational in 2014. Budget for 2014-2020 was 4.3 B€. Foreseen budget for 2021-2027 is 5.8 B€.

Copernicus
THE COPERNICUS SENTINELSKey Features
SENTINEL-1: 4-40m resolution, 3 day revisit at equator
Polar-orbiting, all-weather, day-and-night radar imaging
S1A and 1B in orbit
SENTINEL-2: 10-60m resolution, 5 days revisit time
S2A and 2B in orbit
Polar-orbiting, multispectral optical, high-resolution imaging
SENTINEL-3: 300-1200m resolution, <2 days revisit
S3A and S3B in orbit
Optical and altimeter mission monitoring sea and land parameters
SENTINEL-4: 8km resolution, 60 min revisit time
1st Launch 2022
Payload for atmosphere chemistry monitoring on MTG-S
SENTINEL-5p: 7-68km resolution, 1 day revisit
S5P in orbitMission to reduce data gaps between ENVISAT, and Sentinel 5
SENTINEL-5: 7.5-50km resolution, 1 day revisit
1st Launch 2023
Payload for atmosphere chemistry monitoring on MetOp 2ndGen
SENTINEL-6: 10 day revisit time
1st Launch 2020
Radar altimeter to measure sea-surface height globally
Copernicus
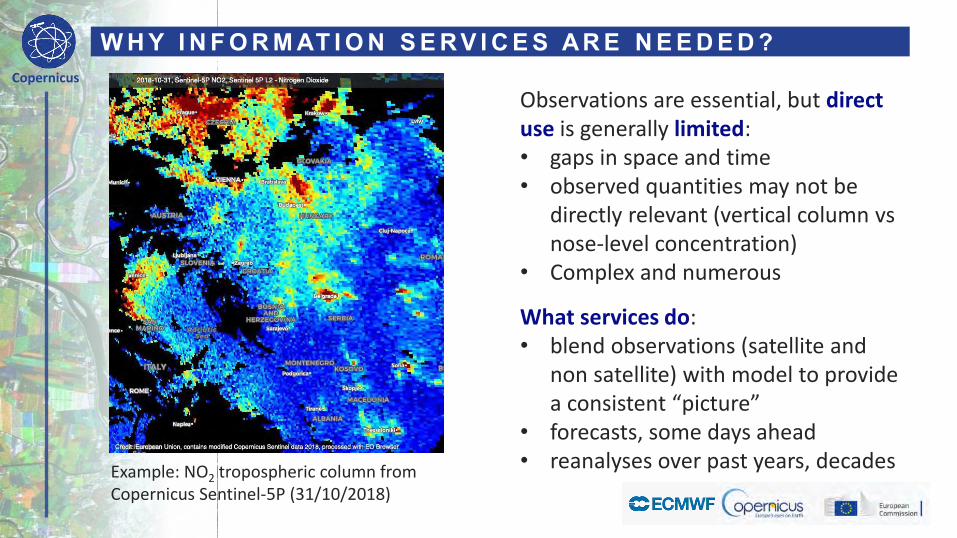
W H Y I N F O R M AT I O N S E R V I C E S AR E N E E D E D ?
Example: NO2 tropospheric column from Copernicus Sentinel-5P (31/10/2018)
Observations are essential, but direct use is generally limited:• gaps in space and time• observed quantities may not be
directly relevant (vertical column vs nose-level concentration)
• Complex and numerous
What services do:• blend observations (satellite and
non satellite) with model to provide a consistent “picture”
• forecasts, some days ahead• reanalyses over past years, decades

AtmosphereMonitoring
C O P E R N I C U S : E U R O P E ’ S E Y E S O N E AR T H
CAMS aerosol forecasts initialized on 13 October 2017. Storm Ophelia transported a mixture of smoke, dust and sea salt aerosol across Europe leading to the sun appearing red and to yellow skies.

6 C O P E R N I C U S T H E M AT I C S E R V I C E S
AtmosphereMonitoring
OMIAURASO2
GOME-2 Metop-B
GOME-2 Metop-A
OMIAURA
GOME-2 Metop-A
GOME-2 Metop-B
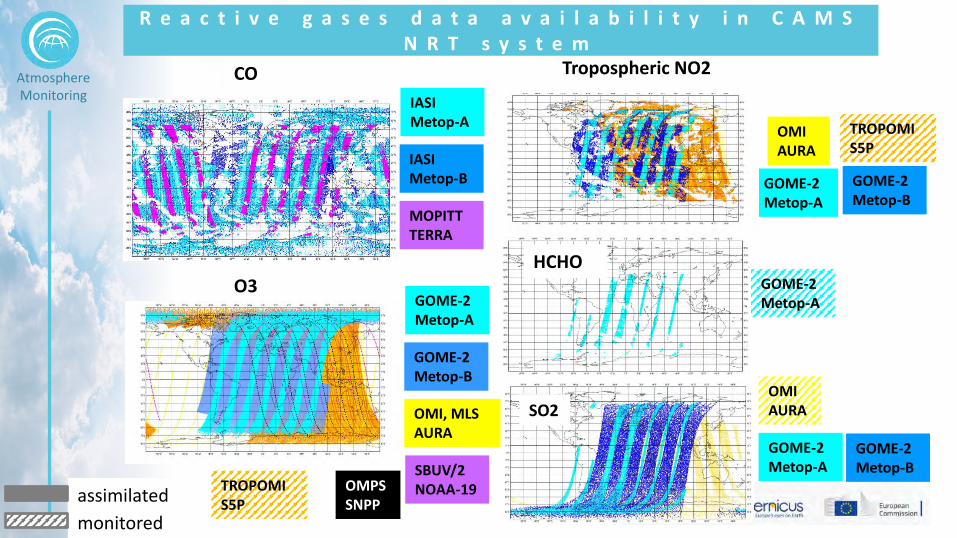
Tropospheric NO2
R e a c t i v e g a s e s d a t a a v a i l a b i l i t y i n C A M S N R T s y s t e m
IASI Metop-A
IASI Metop-B
MOPITT TERRA
CO
O3GOME-2 Metop-A
OMI, MLSAURA
SBUV/2 NOAA-19
monitored
assimilated
GOME-2 Metop-B
OMPS SNPP
HCHOGOME-2 Metop-A
TROPOMIS5P
TROPOMIS5P

AtmosphereMonitoring
A s s i m i l a t i o n o f C O o b s e r v a t i o n s i n a g l o b a l m o d e l
MOPITT CO (NASA/NCAR)IASI CO (LATMOS/ULB)
Carbon Monoxide (CO) is a tracer of combustion sources

AtmosphereMonitoring
M o t i v a t i o n f o r c o m b i n i n g o b s e r v a t i o n s w i t h m o d e l s
• We need an efficient means of combining the information from ~20,000 observations with a
global model at ~40 km horizontal resolution.
• Data assimilation is the process of merging observations with a model in a statistically consistent
manner.
• We want to minimize a cost function (J) that evaluates the model background (Jb) and
observations (Jo).
analysis
forecast
averaging kernel
observationobservation
operator
AtmosphereMonitoring
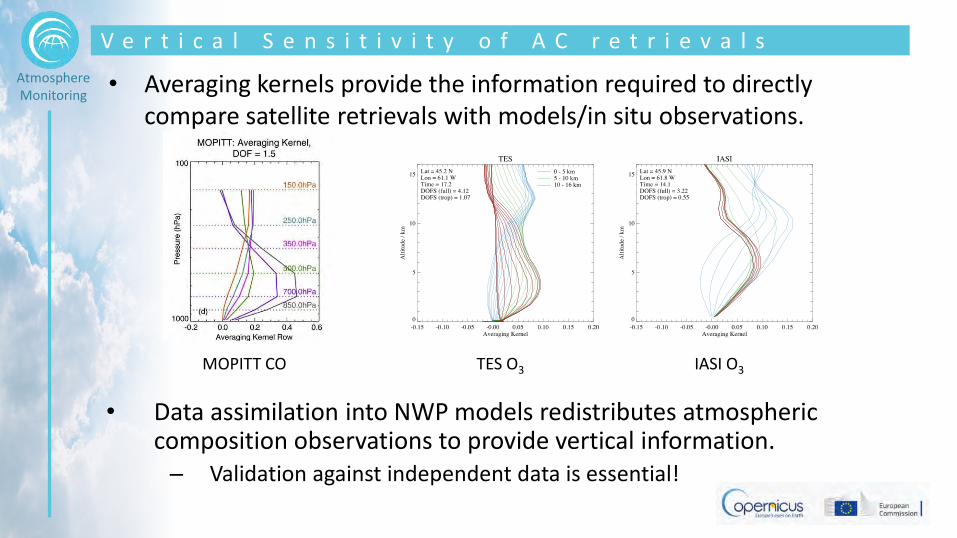
• Averaging kernels provide the information required to directly compare satellite retrievals with models/in situ observations.
V e r t i c a l S e n s i t i v i t y o f A C r e t r i e v a l s
MOPITT CO TES O3 IASI O3
• Data assimilation into NWP models redistributes atmospheric composition observations to provide vertical information.
– Validation against independent data is essential!

AtmosphereMonitoring
CAMS SERVICE CHAIN
Space Agencies In-situ observations
National scale
15
C A M S S Y S E M O V E R V I E W
ECMWF/IFS
7+2 regional CTMs
AtmosphereMonitoring
Solar radiation and UV index
Ozone layer
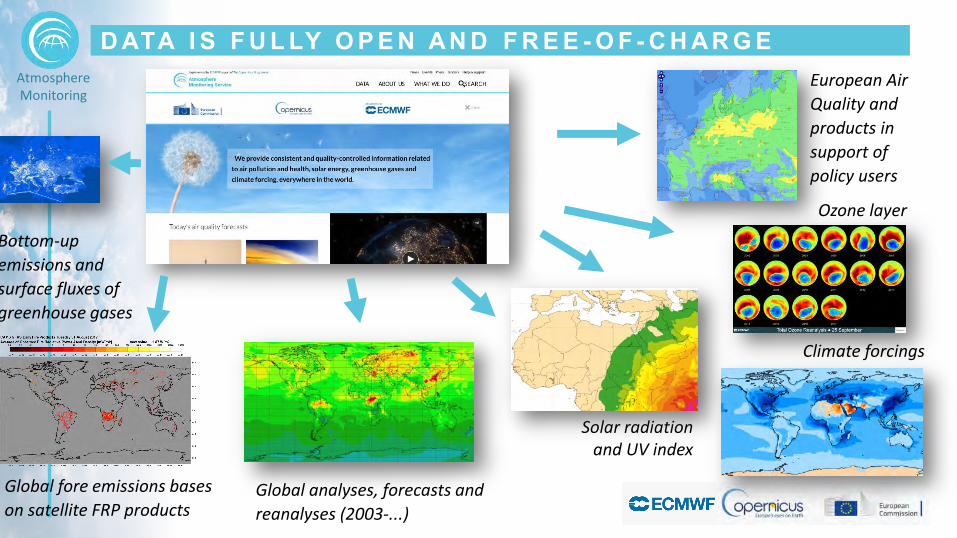
Bottom-up
emissions and
surface fluxes of
greenhouse gases
Global analyses, forecasts and
reanalyses (2003-...)
NO2European Air
Quality and
products in
support of
policy users
Climate forcings
atmosphere.copernicus.euD ATA I S F U L LY O P E N AN D F R E E - O F - C H AR G E
Global fore emissions bases
on satellite FRP products

AtmosphereMonitoring
atmosphere.copernicus.eu
UV index
Ozone layer
Global analyses, forecasts and
reanalyses (2003-...)
NO2

AtmosphereMonitoring
• Real-time analyses and D+5 forecasts at ~40km resolution
• Reanalysis 2003-… at ~80km resolution
• Dedicated forecasts (e.g., field campaign support, special events)
G L O B A L P R O D U C T S
AtmosphereMonitoring
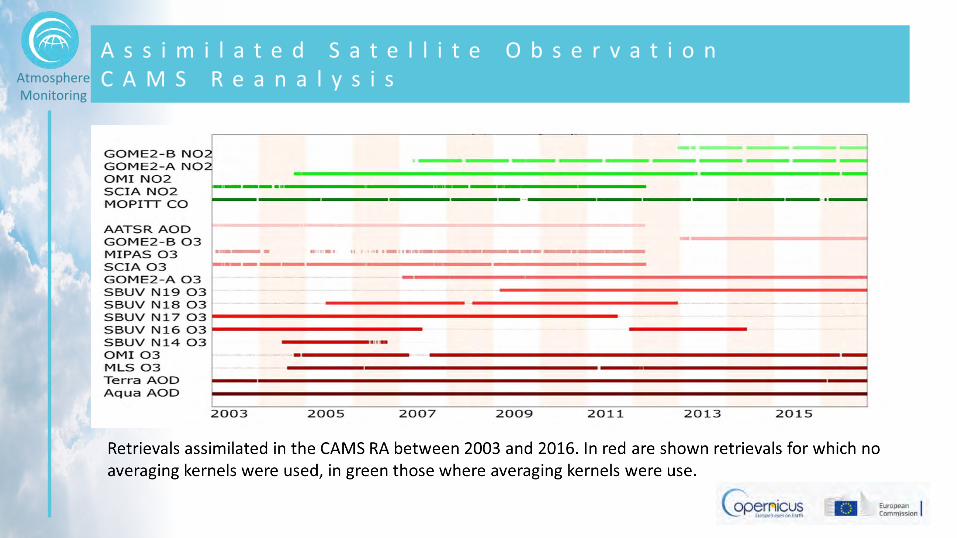
A s s i m i l a t e d S a t e l l i t e O b s e r v a t i o n C A M S R e a n a l y s i s
AtmosphereMonitoring
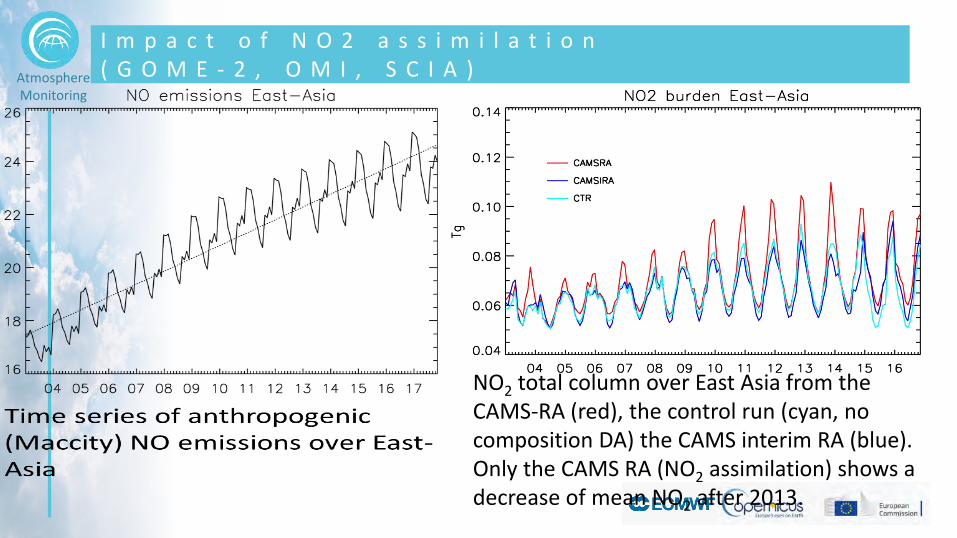
I m p a c t o f N O 2 a s s i m i l a t i o n ( G O M E - 2 , O M I , S C I A )
NO2 total column over East Asia from the CAMS-RA (red), the control run (cyan, no composition DA) the CAMS interim RA (blue). Only the CAMS RA (NO2 assimilation) shows a decrease of mean NO2 after 2013.

AtmosphereMonitoring
C A M S i n t e r i m r e a n a l y s i sT r e n d s a n d s i g n i f i c a n c e ( 2 0 0 3 - 2 0 1 6 )
Robust linear trend % Classic linear trend %Classic linear trend & significance 95%
CAMSiRA(MOPITT + GFAS + MACCITY)
CR(MACCITY+GFAS)
• Trends in the CR (emissions) are less pronounced than in CAMSiRA (emissions & MOPITT). • Global CO trends are about -1%/year in 2003-2016 period• Negative trends mainly over North-America, Europe and South-America

AtmosphereMonitoring
C O s u r f a c e m e a n a n d t r e n d
Trend (2003-2015) MeanFlemming et. al, 2017
AtmosphereMonitoring
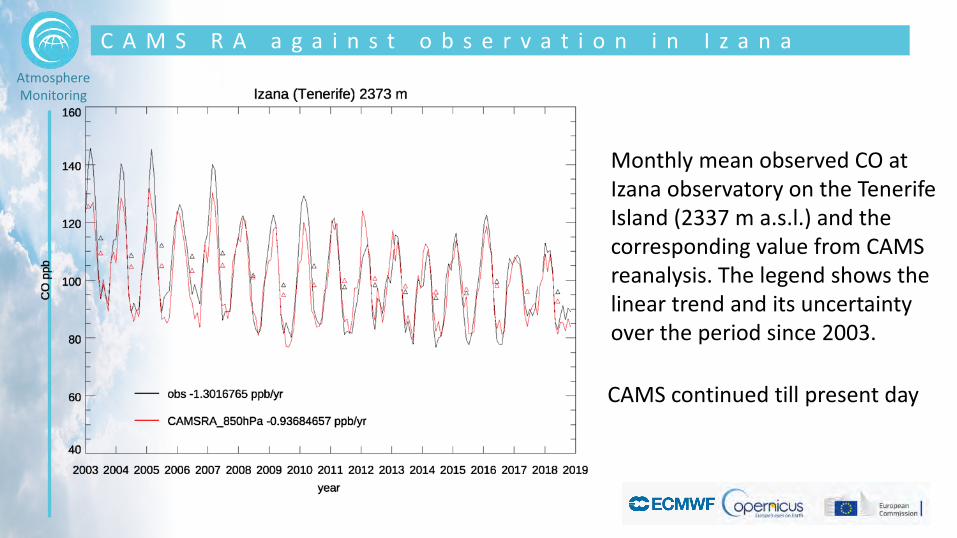
C A M S R A a g a i n s t o b s e r v a t i o n i n I z a n a
Monthly mean observed CO at Izana observatory on the Tenerife Island (2337 m a.s.l.) and the corresponding value from CAMS reanalysis. The legend shows the linear trend and its uncertainty over the period since 2003.
CAMS continued till present day

AtmosphereMonitoring
atmosphere.copernicus.eu
NO2European Air
Quality and
products in
support of
policy users

AtmosphereMonitoring
Individual operational AQ models
C AM S E U R O P E AN A I R Q U AL I T Y P O R T F O L I OBased on a multi-model approach (same boundary conditions, same emissions, same meteo, assimilation of 1000+ surface observations for key species)
DEHM (AARHUS University)
GEM-AQ (IEP)
MINNI (ENEA)
MONARCH (BSC)
Operational AQ ensemble(incl. spread/uncertainty)
• Once daily D+4 forecasts
• Regulatory pollutants and pollens
• Annual reanalyses
• ~ 10km resolutionhttp://regional.atmosphere.copernicus.eu
(Presentation by M. Sofiev)

AtmosphereMonitoring
NO2

AtmosphereMonitoring
H I G H Q U AL I T Y P R O D U C T S AT T H E S C AL E O F E U R O P EO
zon
eN
O2

AtmosphereMonitoring
P R O D U C T S I N S U P P O R T O F P O L I C Y U S E R S
http://policy.atmosphere.copernicus.eu/CAMS_ACT.html
CAMS_ACT : O3, PM10 (PM2.5 coming)
Assess the effect of emission reductions on daily forecasts

AtmosphereMonitoring
P R O D U C T S I N S U P P O R T O F P O L I C Y U S E R S
http://policy.atmosphere.copernicus.eu/DailySourceAllocation.html
Experimental: local vs imported, geographical origin, chemical speciation

AtmosphereMonitoring
atmosphere.copernicus.eu
Bottom-up
emissions and
surface fluxes of
greenhouse gases
NO2
Climate forcings
Solar radiation
Global fore emissions bases
on satellite FRP products

AtmosphereMonitoring
Greenhouse gas fluxes (CO2, CH4, N2O)
Solar radiation
Climate forcings
S U P P L E M E N T A R Y P R O D U C T S

AtmosphereMonitoring
• Fire emissions
• Global anthropogenic emissions
• Regional anthropogenic emissions
• Natural emissions
C AM S E M I S S I O N P R O D U C T S
(Presentation by J. Keunen)
AtmosphereMonitoring
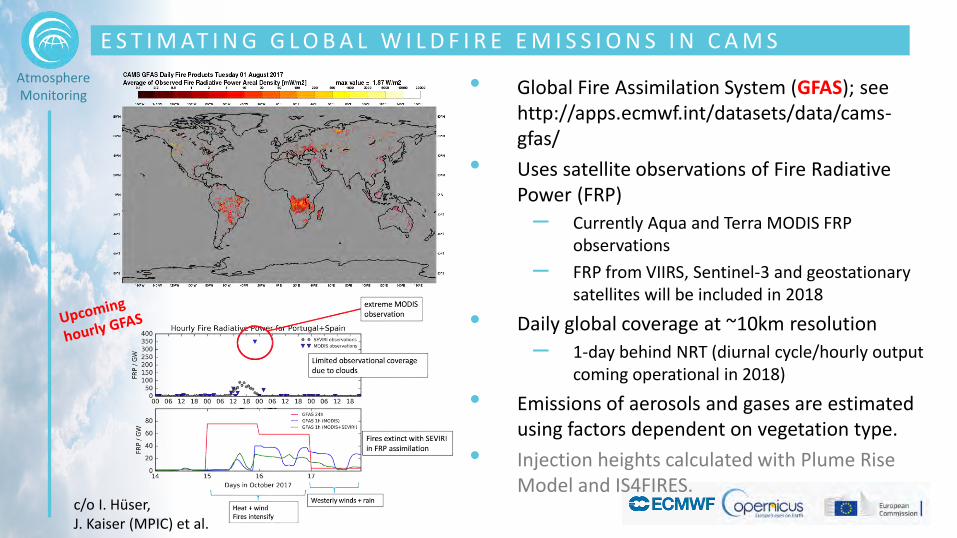
E S T I M AT I N G G L O B A L W I L D F I R E E M I S S I O N S I N C A M S
• Global Fire Assimilation System (GFAS); see http://apps.ecmwf.int/datasets/data/cams-gfas/
• Uses satellite observations of Fire Radiative Power (FRP)
– Currently Aqua and Terra MODIS FRP observations
– FRP from VIIRS, Sentinel-3 and geostationary satellites will be included in 2018
• Daily global coverage at ~10km resolution
– 1-day behind NRT (diurnal cycle/hourly output coming operational in 2018)
• Emissions of aerosols and gases are estimated using factors dependent on vegetation type.
• Injection heights calculated with Plume Rise Model and IS4FIRES.
c/o I. Hüser,J. Kaiser (MPIC) et al.

AtmosphereMonitoring
M o n i t o r i n g A rc t i c w i l d f i re s d u r i n g s u m m e r 2 0 1 9
• Daily total wildfire emissions were well above the 2003-2018 average throughout the summer north of the Arctic Circle
• Many wildfires concentrated in the Sakha Republic, Russia with other fire activity in Alaska, Yukon Territory and Greenland
• Total estimated equivalent CO2 of ~170 megatonnes

AtmosphereMonitoring
M o n i t o r i n g A m a zo n f i re s i n A u g u s t 2 0 1 9
• Above average daily fire activity during first 2 weeks of August across the main states of the Brazilian Amazon (also in Bolivia and Paraguay) with smoke predicted by CAMS across much of southern Brazil
• Below average (2003-2018) daily activity through second half of August shows annual total (to 8 September) is not particularly high compared to previous years in GFAS dataset.

AtmosphereMonitoring
D O C U M E N TAT I O N & Q U AL I T Y C O N T R O L
CAMS provides detailed information about how its products are produced and what the quality is

AtmosphereMonitoring
I M P R O V M E N T S o f G L O B A L C A M S F o r e c a s t
Carbon monoxideSentinel-5p observations (top) vs CAMS model (bottom)
Borsdorff et al., JRL, 2018
Aerosol skill score
Ozone skill score
Antje Inness, ECMWF
Michael Schulz, MetNo

AtmosphereMonitoring
Solar radiation and UV index
Ozone layer
Bottom-up
emissions and
surface fluxes of
greenhouse gases
Global analyses, forecasts and
reanalyses (2003-...)
NO2European Air
Quality and
products in
support of
policy users
Climate forcings
atmosphere.copernicus.euD ATA I S F U L LY O P E N AN D F R E E - O F - C H AR G E
Global fore emissions bases
on satellite FRP products

AtmosphereMonitoring
G L O B A L C A M S P R O D U C T S f o r A Q i n A f r i c a
• 2x 5 day global CAMS Forecast (aerosol & chemistry)
– 40 x 40 km, 137 levels, lowest level extent 20 m
• Global CAMS re-analysis (aerosol & chemistry)
– 80 x 80 km, 60 levels, lowest level extent 20 m
– 2003 – 2018, 2019 ( 1 month delay)
• GFAS fire emissions for (0.1 degree) for many species
• CAMS_GLOB anthropogenic, biogenic and natural emission
Boundary Conditions
EmissionInput

AtmosphereMonitoring
S u m m a r y
• TROPOMI/Sentinel-5P are monitored by CAMS
• O3 data have been operationally assimilated since Dec 2018
• Assimilation tests with NO2, CO and SO2 are under way
• Monitoring plots on: atmosphere.copernicus.eu/charts/cams_monitoring/
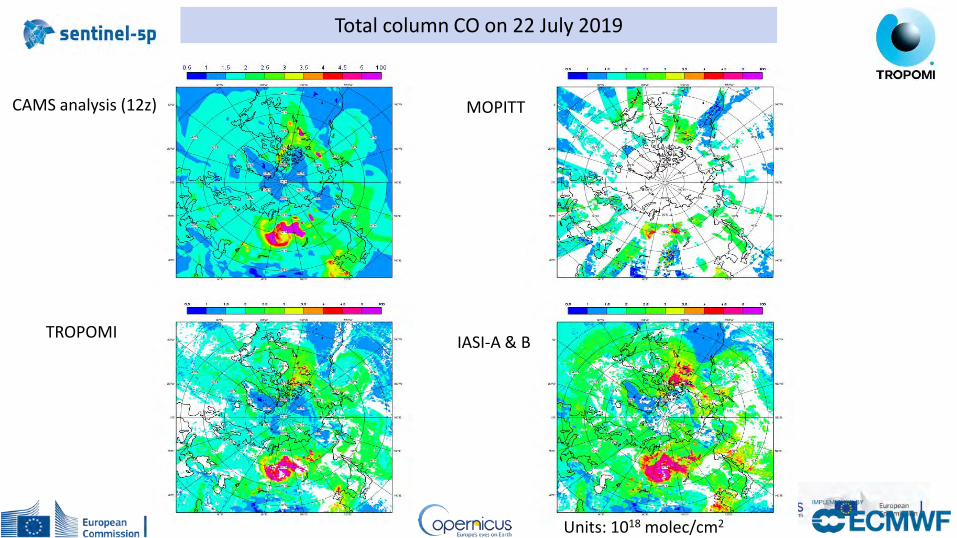
Total column CO on 22 July 2019
Units: 1018 molec/cm2
TROPOMI
CAMS analysis (12z)
IASI-A & B
MOPITT

Total column CO on 25 July 2019
Units: 1018 molec/cm2
TROPOMI
CAMS analysis (12z)
IASI-A & B
MOPITT
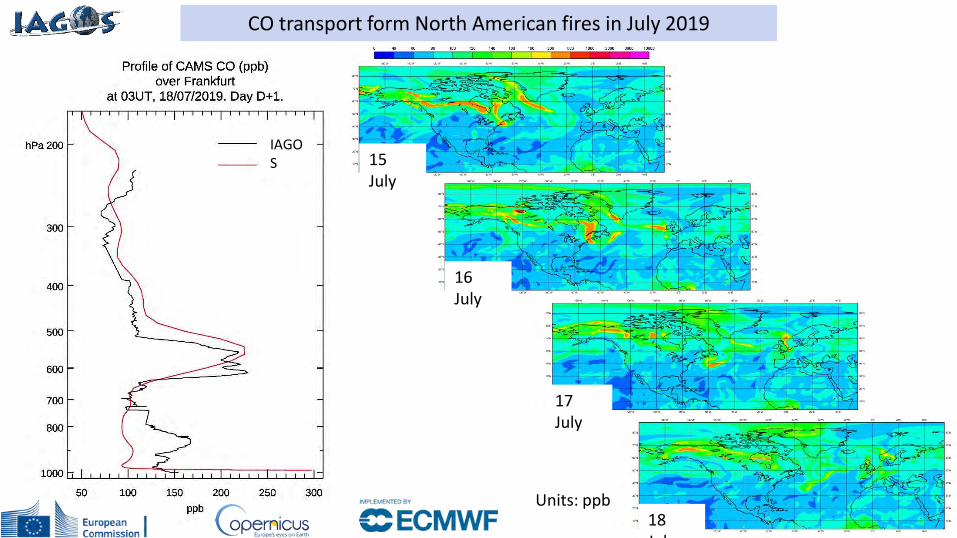
CO transport form North American fires in July 2019
Units: ppb
15 July
18 July
17 July
16 July
IAGOS

AtmosphereMonitoring
C AM S : B I G D ATA F O R L O C AL AP P L I C AT I O N S
CAMS expert
Expert user
Downstream applications
CAMS provides big data with the corresponding technical and scientific expertise to support expert users.In doing so, we allow the CAMS information to reach millions of users in and outside Europe.