Embed Size (px)
DESCRIPTION
Control Valves-Ball Type-Selection Performance & Accuracy-Rayhill
Citation preview

Control Valves
Ball type –Selection,
Performance and
Accuracy
By Kyle Rayhill
May 21, 2015

Agenda
• Valve characteristics
- Inherent and installed
• Process characteristics
- Defined and undefined processes
- Gain
• Control loops and process variability
• Ball type control valves
• Noise and cavitation

Control Valve The foundation of reliable flow control
• The foundation of reliable, long-lasting flow
control is the control valve
- not just the valve itself, but also the
actuator, positioner and linkages between
the components
• Well engineered valve design
- minimized friction and backlash between
components
- avoid cavitation and reduce noise
- minimize fugitive emission
- not prone to impurities
- can handle process changes
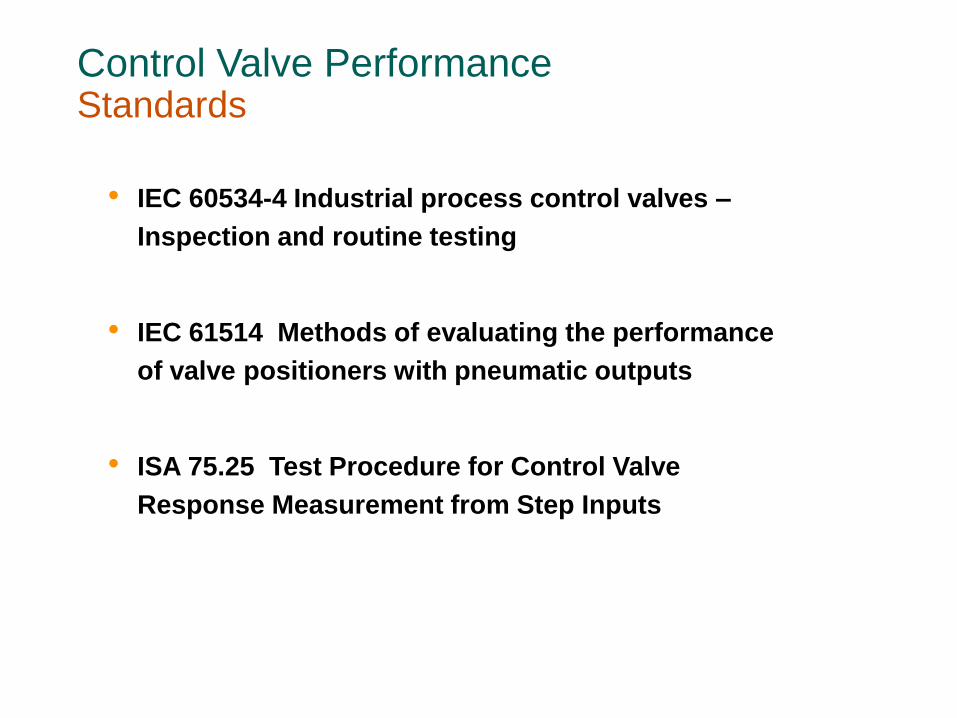
Control Valve Performance Standards
• IEC 60534-4 Industrial process control valves –
Inspection and routine testing
• IEC 61514 Methods of evaluating the performance
of valve positioners with pneumatic outputs
• ISA 75.25 Test Procedure for Control Valve
Response Measurement from Step Inputs

Characteristics of Valve VALVE INHERENT CHARACTERISTICS
• LINEAR:
- Flow increases linearly with valve travel.
• QUICK OPENING:
- Flow increases substantially within the first
30% of valve travel.
• EQUAL PERCENTAGE:
- Equal changes in travel produce equal
percent changes in flow. Flow increases
substantially within the last 30% of valve
travel.
Flow Characteristics
Relative Travel (h)
Rela
tive
Flo
w C
oe
ffic
ient (Q
)
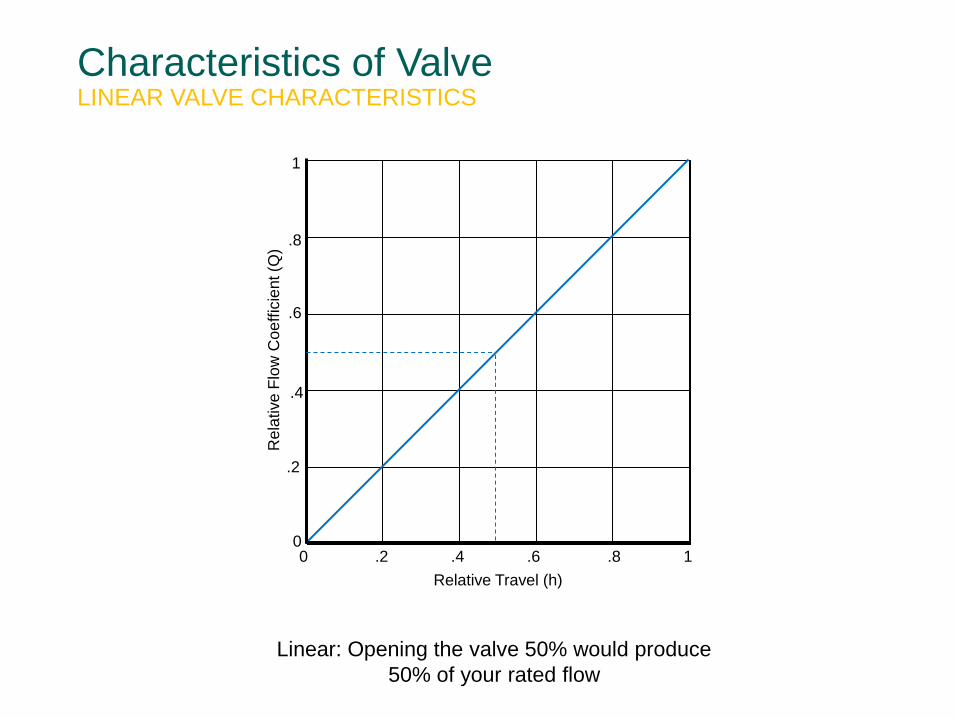
Characteristics of Valve LINEAR VALVE CHARACTERISTICS
Linear: Opening the valve 50% would produce
50% of your rated flow
1
Rela
tive
Flo
w C
oe
ffic
ient (Q
)
Relative Travel (h)
0 .2 .4 .6 .8 1 0
.2
.4
.6
.8
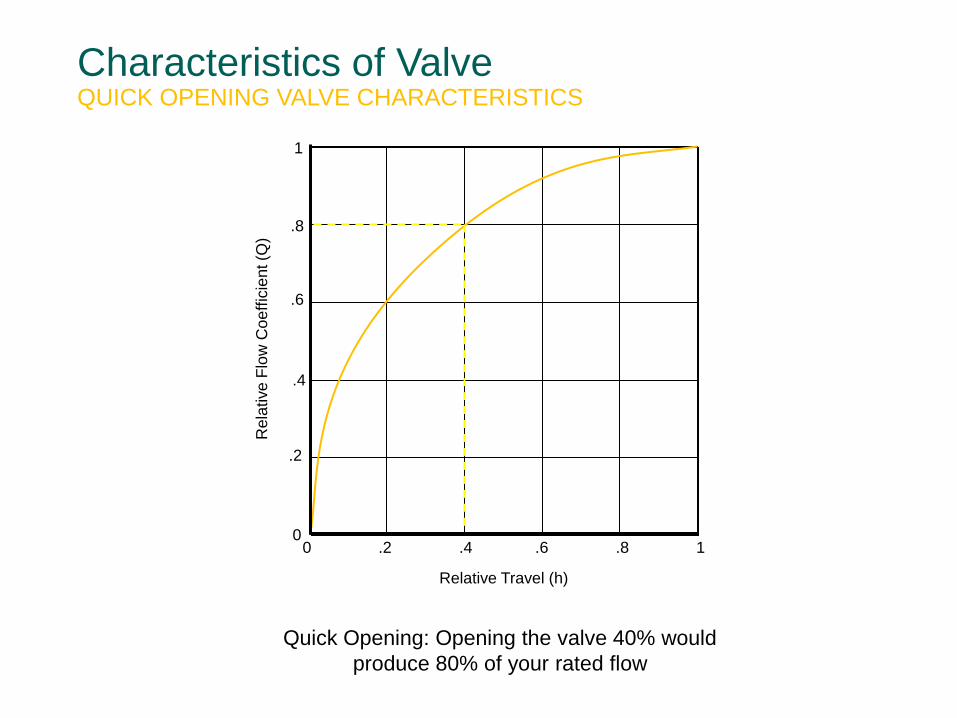
Characteristics of Valve QUICK OPENING VALVE CHARACTERISTICS
Re
lative
Flo
w C
oe
ffic
ient (Q
)
Relative Travel (h)
0 .2 .4 .6 .8 1 0
.2
.4
.6
.8
1
Quick Opening: Opening the valve 40% would
produce 80% of your rated flow

Characteristics of Valve and Process EQUAL PERCENTAGE VALVE CHARACTERISTICS
Equal Percentage: Opening the valve 70%
would produce 40% of your rated flow
Rela
tive
Flo
w C
oe
ffic
ient (Q
)
Relative Travel (h)
0 .2 .4 .6 .8 1
0
.2
.4
.6
.8

Characteristics of Valve EQUAL PERCENTAGE VALVE CHARACTERISTICS
In the table below we have an example of what the flow conditions would look like in
an equal percentage flow characteristic.
% Open 10% 20% 30% 40% 50% 60% 70% 80% 90% 100%
Flow (GPM) 1 1.50 2.25 3.38 5.06 7.59 11.39 17.09 25.63 38.44
In this specific example, every time the valve opens 10%, the flow increases by 50%
0
5
10
15
20
25
30
35
40
10% 20% 30% 40% 50% 60% 70% 80% 90% 100%
If we were to plot the values in the table above, they
would look like the chart to the right.
Equal percentage characteristic is designed to linearize
the installed flow characteristic in normal control valve applications, where the available ∆P to the control valve
decreases with the opening of the valve. This is the case
with the majority of control valve applications.
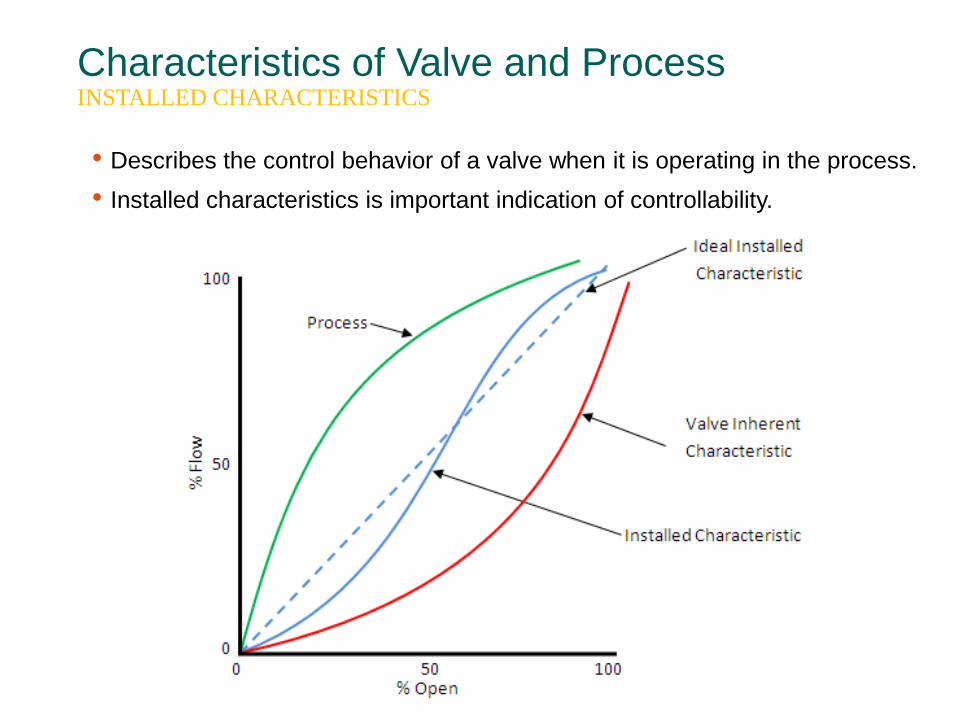
Characteristics of Valve and Process INSTALLED CHARACTERISTICS
• Describes the control behavior of a valve when it is operating in the process.
• Installed characteristics is important indication of controllability.
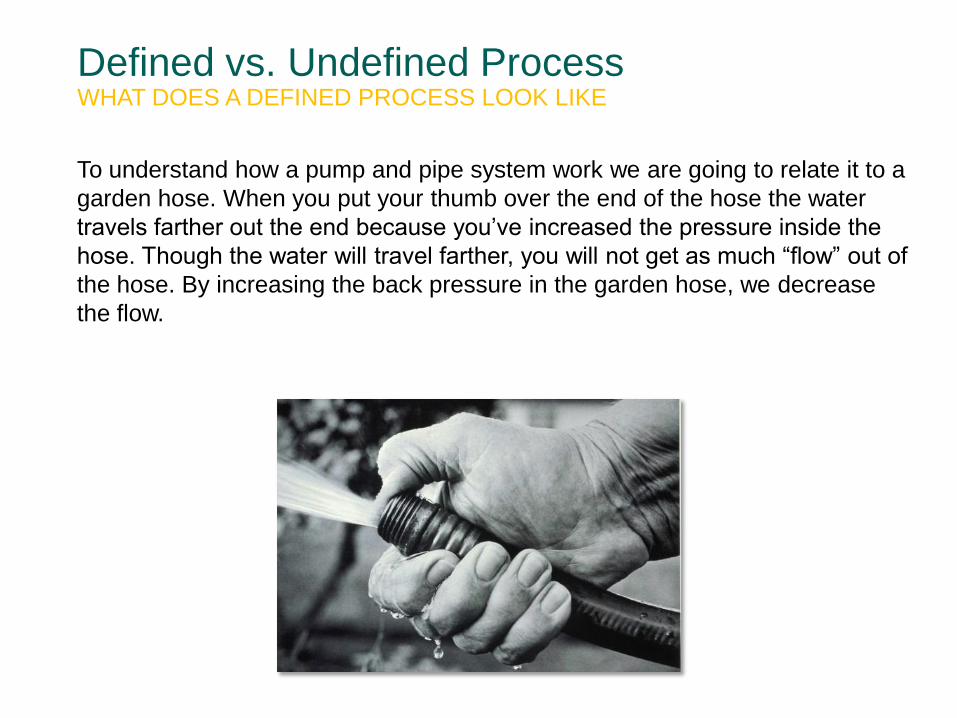
To understand how a pump and pipe system work we are going to relate it to a
garden hose. When you put your thumb over the end of the hose the water
travels farther out the end because you’ve increased the pressure inside the
hose. Though the water will travel farther, you will not get as much “flow” out of
the hose. By increasing the back pressure in the garden hose, we decrease
the flow.
Defined vs. Undefined Process WHAT DOES A DEFINED PROCESS LOOK LIKE
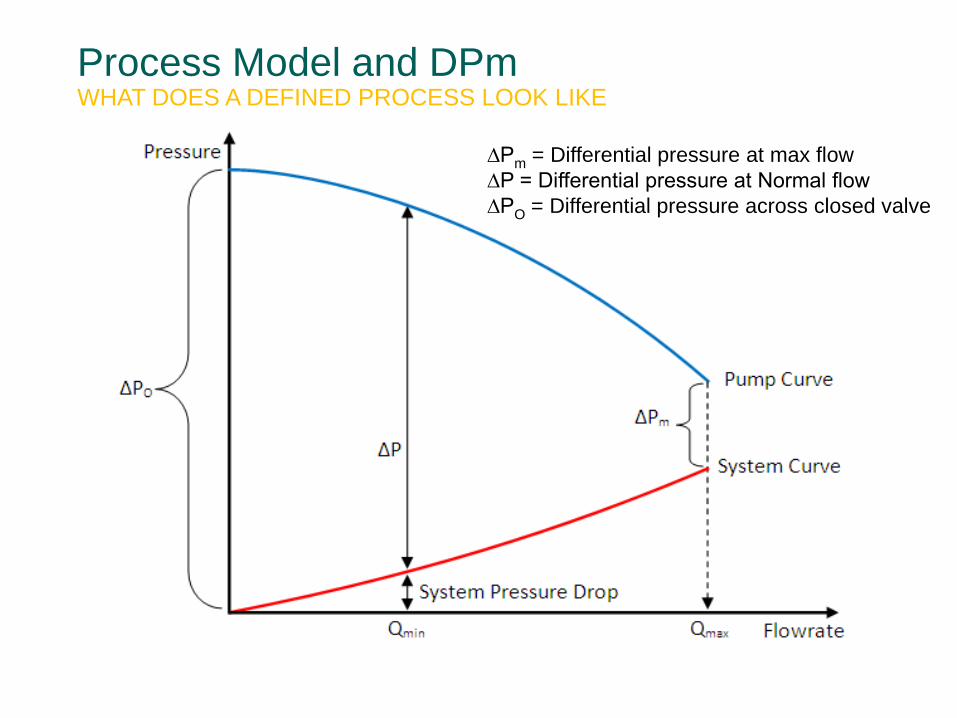
Process Model and DPm WHAT DOES A DEFINED PROCESS LOOK LIKE
∆Pm = Differential pressure at max flow
∆P = Differential pressure at Normal flow
∆PO = Differential pressure across closed valve

• In order to calculate the installed characteristics of a valve we must first have
a model of how the process behaves. If two flow conditions are provided,
sizing programs can calculate how the process will behave (process model).
If only one flow condition is given, we use a process pressure ratio factor
DPm to estimate a process model
Process Model and DPm WHAT DOES A DEFINED PROCESS LOOK LIKE
∆Pm = Differential pressure at max flow
∆PO = Differential pressure across closed valve

Pressure
source
50 psig
330’ 1.5” pipe
P
0
psig
Characteristics of Process
Flow
(gpm)
Pipe
Loss
(psi)
10 1
20 4
30 9
40 16
50 25
60 36
• When a fluid is travelling through a pipe system,
the piping itself will cause a pressure loss.
• Loss is caused by factors such as friction, the
length of the pipe, smoothness of the inside of the
pipe, viscosity of the media, etc.
• Fluid dynamics tells us that the pressure loss in
the pipe is proportional to the change in flow
squared.
Characteristics of Process
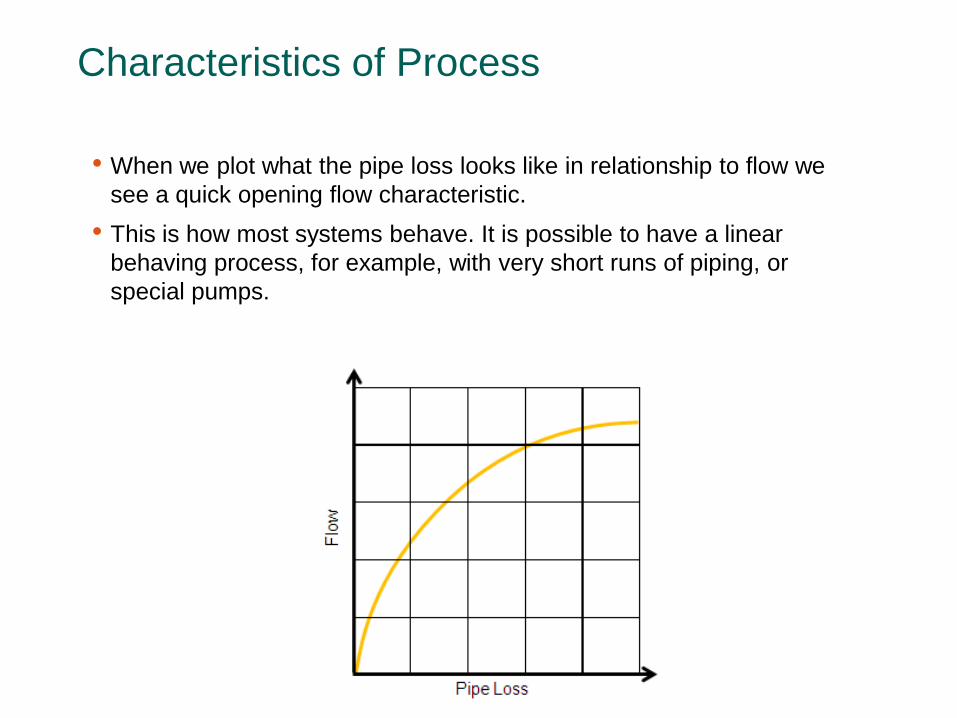
• When we plot what the pipe loss looks like in relationship to flow we
see a quick opening flow characteristic.
• This is how most systems behave. It is possible to have a linear
behaving process, for example, with very short runs of piping, or
special pumps.
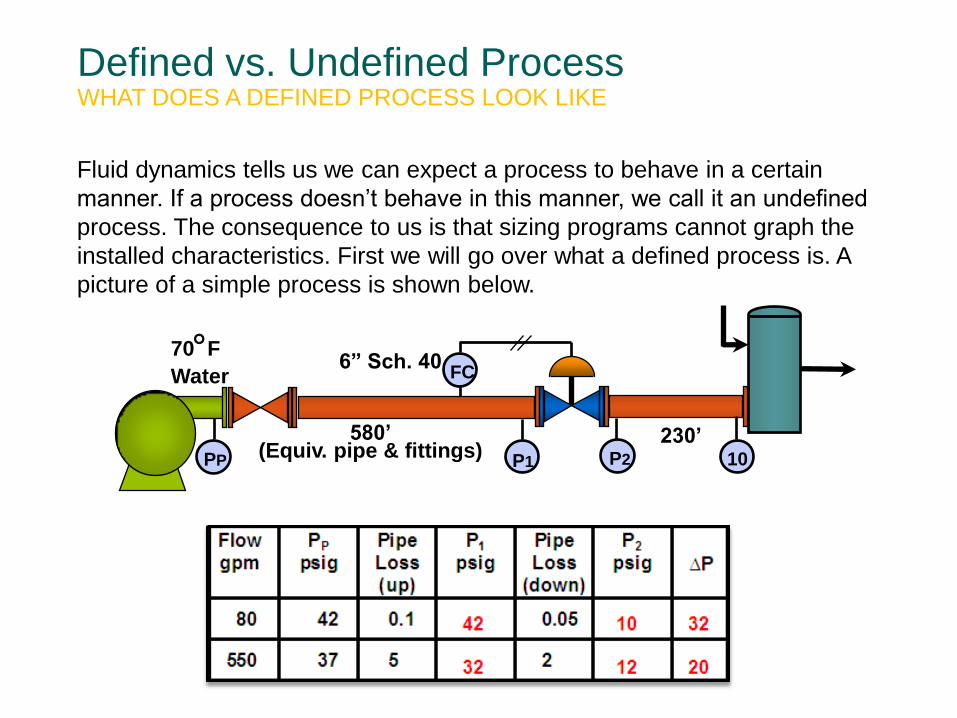
Fluid dynamics tells us we can expect a process to behave in a certain
manner. If a process doesn’t behave in this manner, we call it an undefined
process. The consequence to us is that sizing programs cannot graph the
installed characteristics. First we will go over what a defined process is. A
picture of a simple process is shown below.
6” Sch. 40
580’ (Equiv. pipe & fittings)
230’
70F
Water
10 P2 P1 PP
FC
Defined vs. Undefined Process WHAT DOES A DEFINED PROCESS LOOK LIKE
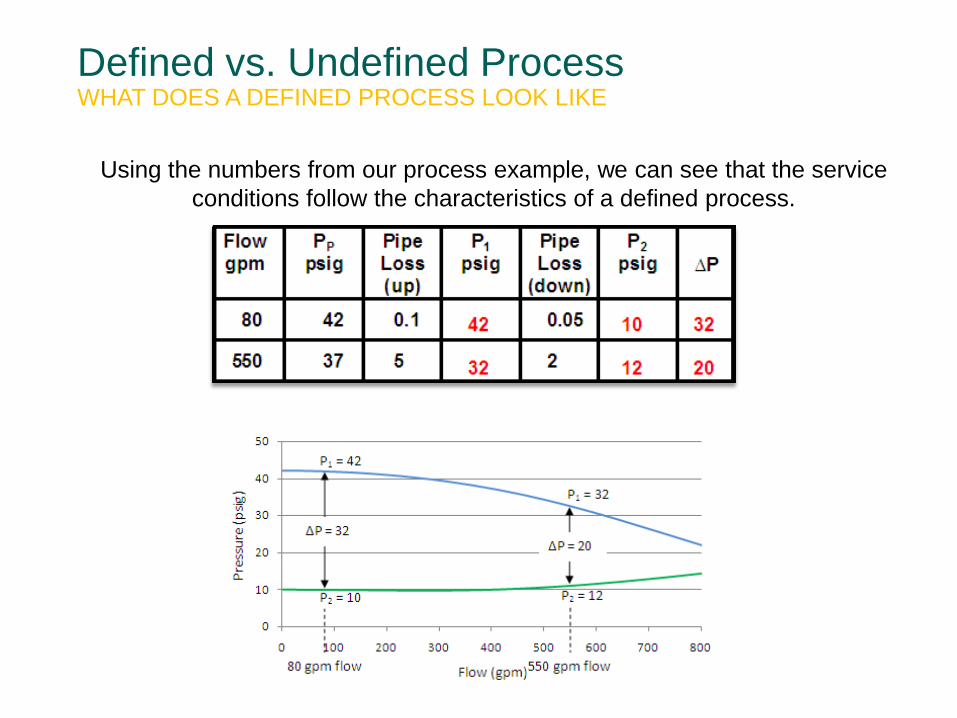
Using the numbers from our process example, we can see that the service
conditions follow the characteristics of a defined process.
Defined vs. Undefined Process WHAT DOES A DEFINED PROCESS LOOK LIKE

Pre
ss
ure
Undefined Process Models
Flow
Pre
ssu
re
Defined Process Models
P1
P2
Flow
P1
P2
Process Models
q
Installed Gain
1.0
2.0
3.0
4.0
Relative Travel, h Gain = q / h = SLOPE
Installed Characteristic
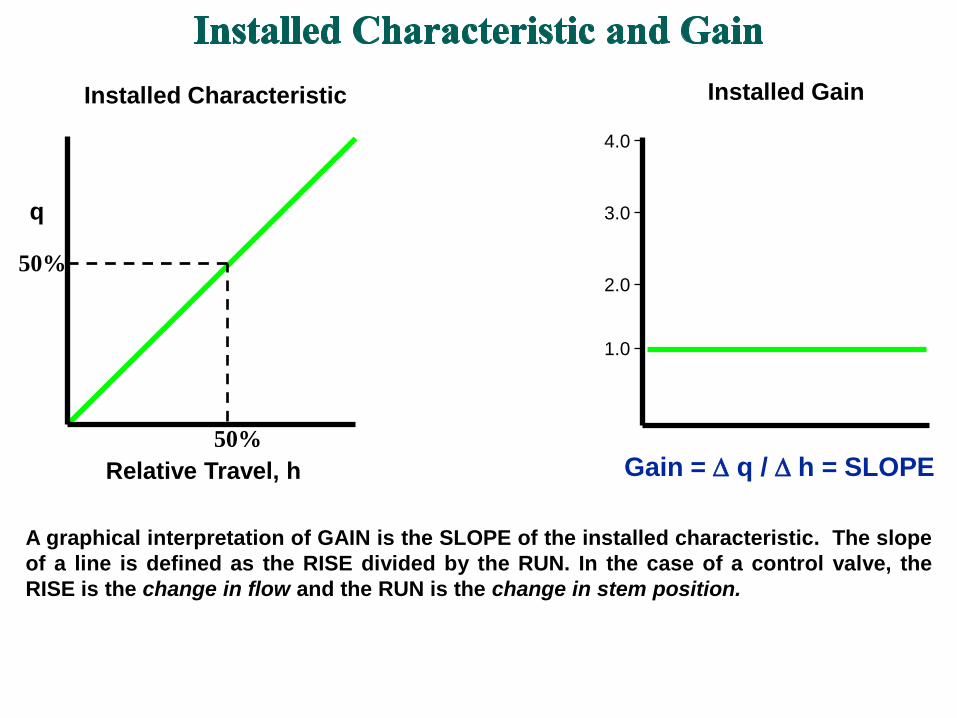
A graphical interpretation of GAIN is the SLOPE of the installed characteristic. The slope
of a line is defined as the RISE divided by the RUN. In the case of a control valve, the
RISE is the change in flow and the RUN is the change in stem position.
50%
50%
40%
Inst
all
ed G
ain
1.0
2.0
3.0
4.0
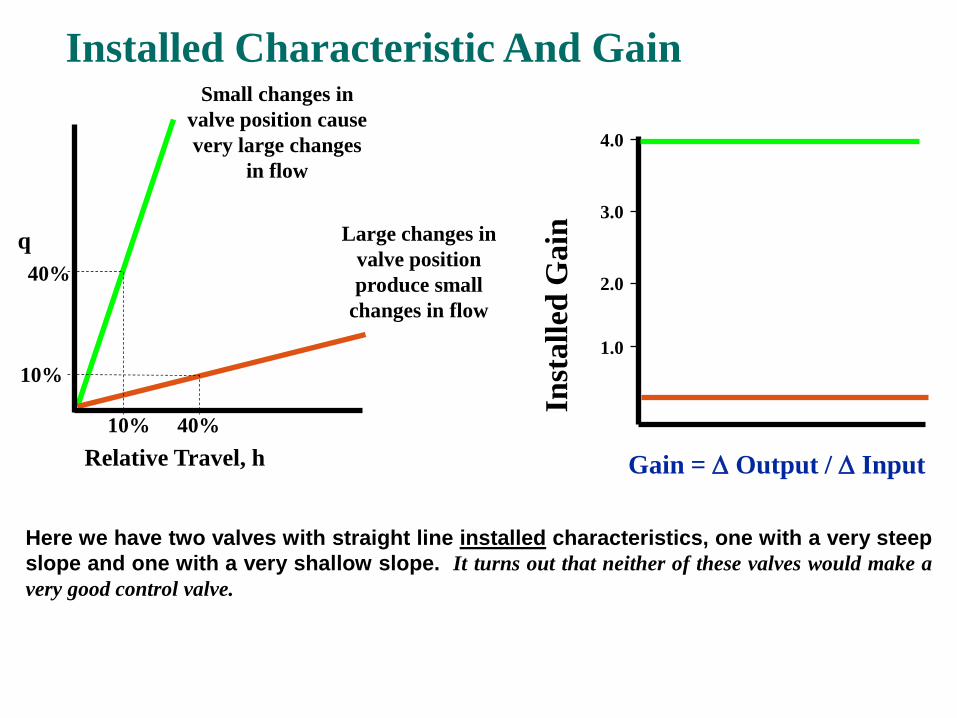
Installed Characteristic And Gain
Relative Travel, h
q
40%
10%
Gain = Output / Input
Here we have two valves with straight line installed characteristics, one with a very steep
slope and one with a very shallow slope. It turns out that neither of these valves would make a
very good control valve.
Large changes in
valve position
produce small
changes in flow
Small changes in
valve position cause
very large changes
in flow
10%

Ins
tall
ed
Gain
3.0
2.0
4.0
1.0
q max q min
Within the specified control range:
1. Gain 0.5
2. Gain 3.0
3. Gain (max) / Gain (min) 2.0
4. As constant as possible
5. As close to 1.0 as possible
This is why it’s
so important to
have at least 2
flow conditions
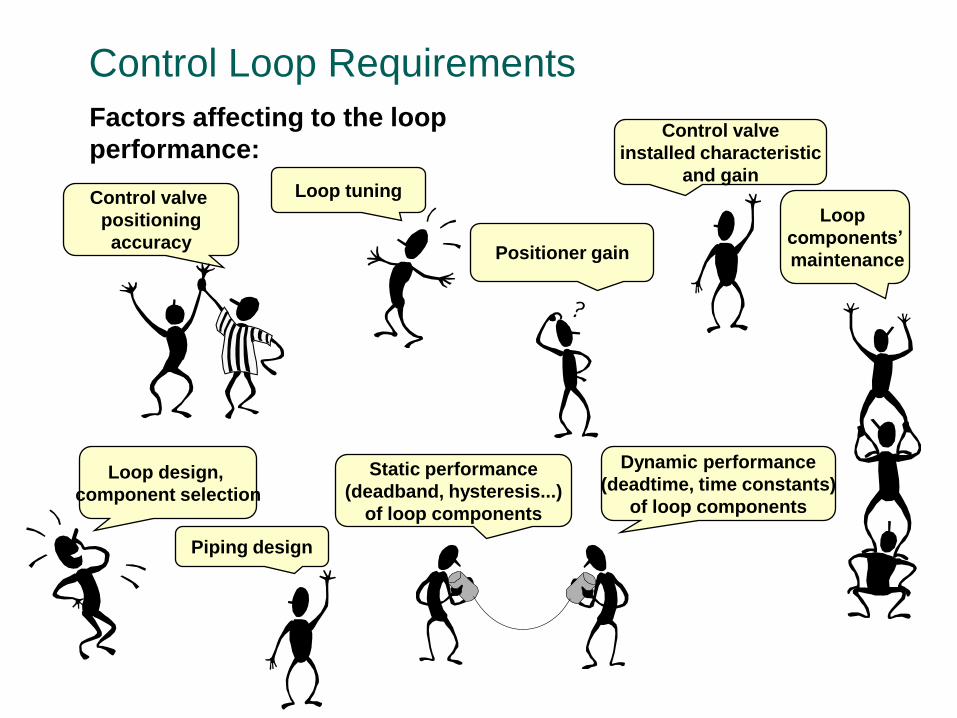
Control Loop Requirements
Static performance
(deadband, hysteresis...)
of loop components
Control valve
installed characteristic
and gain
Loop design,
component selection
Positioner gain
Dynamic performance
(deadtime, time constants)
of loop components
Control valve
positioning
accuracy
Loop
components’
maintenance
Loop tuning
Factors affecting to the loop
performance:
Piping design
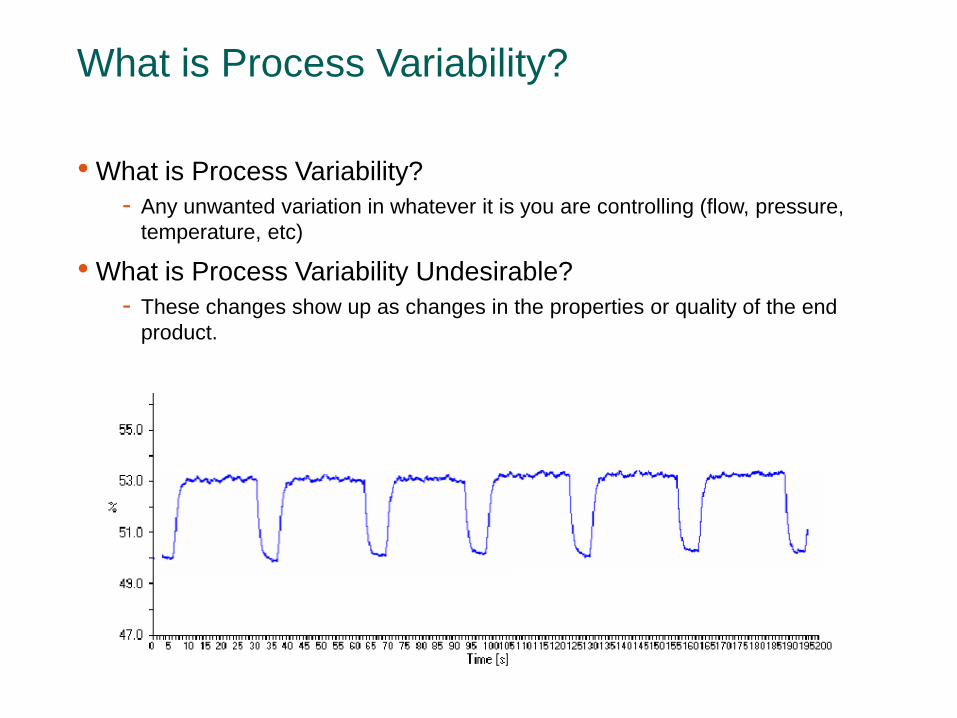
What is Process Variability?
• What is Process Variability?
- Any unwanted variation in whatever it is you are controlling (flow, pressure,
temperature, etc)
• What is Process Variability Undesirable?
- These changes show up as changes in the properties or quality of the end
product.

Low Process Variability is Important
High variability in process control is expensive:
$ Energy usage
$ Feedstock costs
$ Scrap costs
$ Product quality
$ Lost production
$ Waste handling cost
$ Lower efficiency of the Process
$ High variability in one loop can cause problems in other loops,
if the fist loop output is used as input in another. “Loops are
Dancing Together”
Reduction is achieved by:
Correct selection of Valve, Actuator and Instrumentation

Ball type control valves Full Bore vs. reduced bore
• Full Bore
- Internal diameter of flow path is equivalent to the
attached piping. A 6” full bore valve would have
the same internal diameter as a 6” pipe.
- Also referred to as “Full Port” or “Line Size”
• Reduced Bore
- Internal diameter of flow path is less than that of
the attached piping. The internal parts (ball,seat
etc..) are typically one valve size smaller. A 6”
reduced bore valve might have 4” internals.
- Also referred to as “Standard Bore” or “Standard
Port”
Reduced Bore
Full Bore
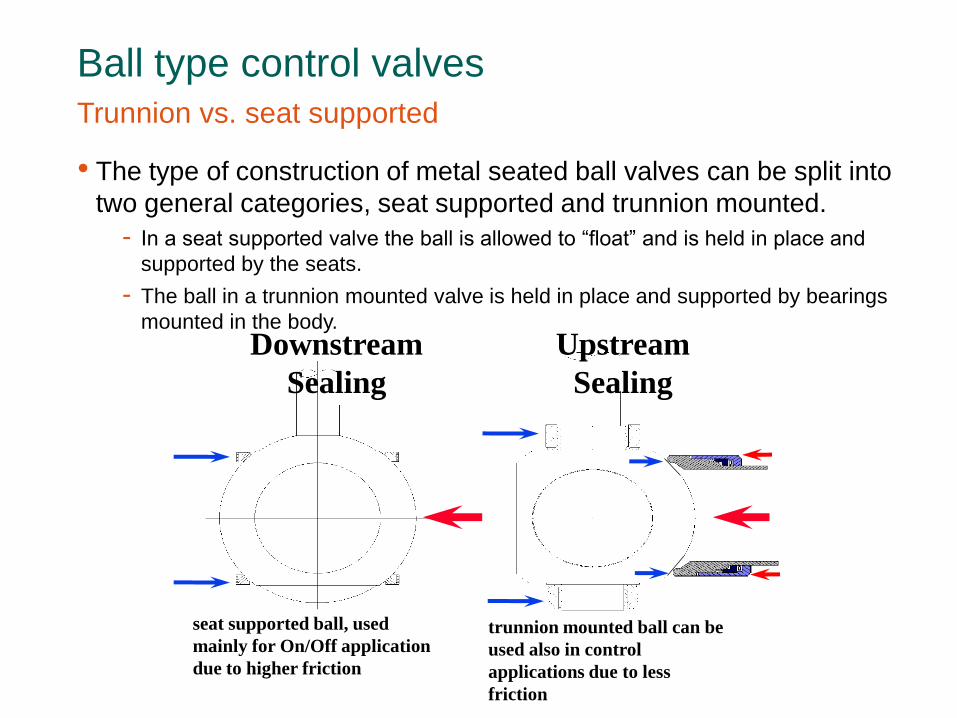
Ball type control valves Trunnion vs. seat supported
• The type of construction of metal seated ball valves can be split into
two general categories, seat supported and trunnion mounted.
- In a seat supported valve the ball is allowed to “float” and is held in place and
supported by the seats.
- The ball in a trunnion mounted valve is held in place and supported by bearings
mounted in the body.
seat supported ball, used
mainly for On/Off application
due to higher friction
trunnion mounted ball can be
used also in control
applications due to less
friction
Downstream
Sealing
Upstream
Sealing

Ball type control valves
• Seat supported ball valve
- Full and reduced bore
- Higher torque requirements
• Poor control performance (stiction)
- High Cv capabilities
- Tightest shutoff
• Trunnion ball valve
- Full and reduced bore
- High Cv capabilities
- Lower torque requirements then seat
supported
- Tight shutoff
• Segmented ball valve
- Trunnion
- Reduced bore
- Special trims
- Control valve shutoff (ANSI Class IV)

Valve Noise Generation
Sudden compression and expansion at vena contractaSevere turbulence
Turbulence generates sound waves
Cavitation noise
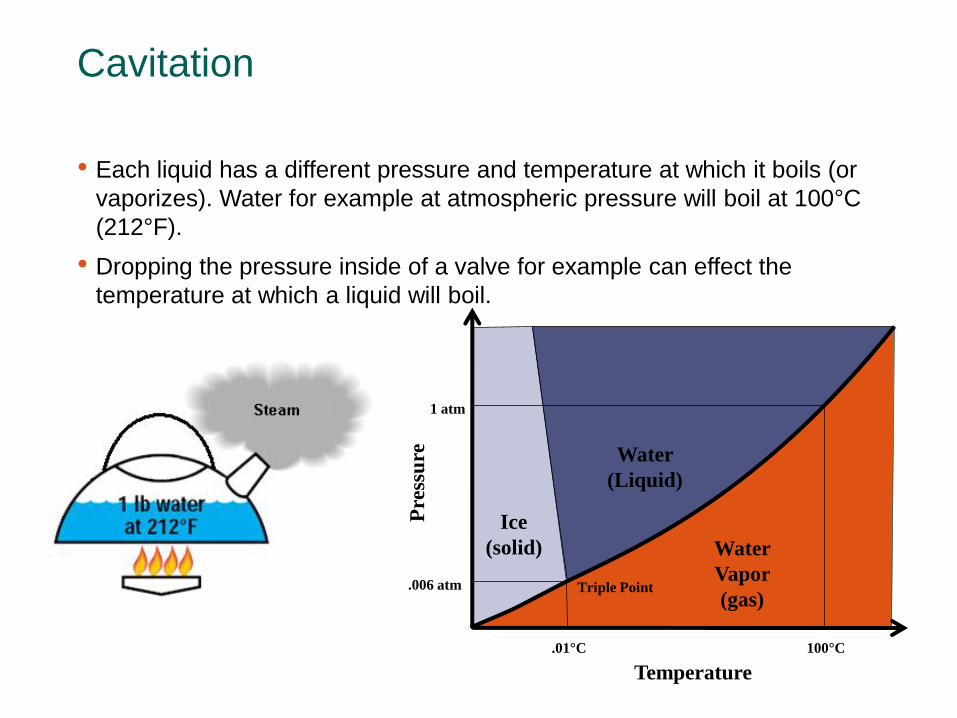
• Each liquid has a different pressure and temperature at which it boils (or
vaporizes). Water for example at atmospheric pressure will boil at 100°C
(212°F).
• Dropping the pressure inside of a valve for example can effect the
temperature at which a liquid will boil.
Cavitation
Water
(Liquid)
Water
Vapor
(gas)
Ice
(solid)
.006 atm
.01°C
1 atm
100°C
Temperature
Pre
ssu
re
Triple Point

Cavitation
Pressure
Velocity
Vapor Pressure
Because of the law of conservation of energy, when the velocity of the liquid
increases through the valve, the pressure must decrease
P1 P2 PVC
A valve is represented as a simple orifice plate to represent a
restriction in the flow path

Cavitation
Cavitation occurs when the pressure inside the valve drops below the vapor
pressure of the liquid, allowing the liquid to turn into a gas.
P1 P2 PVC
Pressure
Velocity
Vapor Pressure
P1
P2
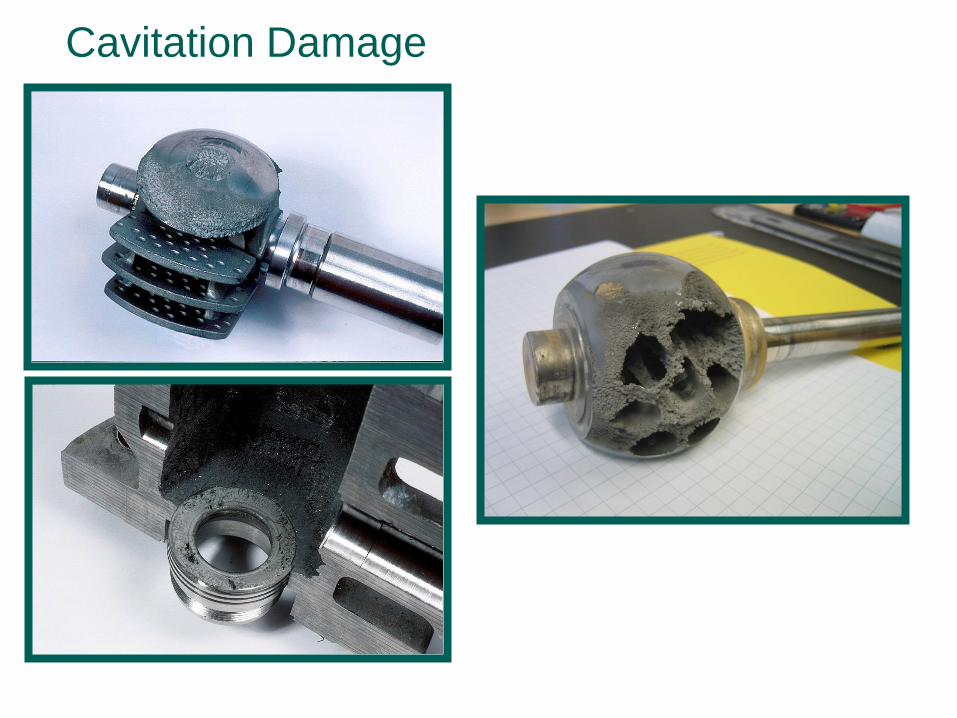
Cavitation Damage
0.4
0.5
0.6
0.7
0.8
0.9
1
0 10 20 30 40 50 60 70 80 90 100
Percent Open
Re
co
ve
ry F
ac
tor,
FL
Globe
Ecc. Plug
Ball
H.P. Butterfly
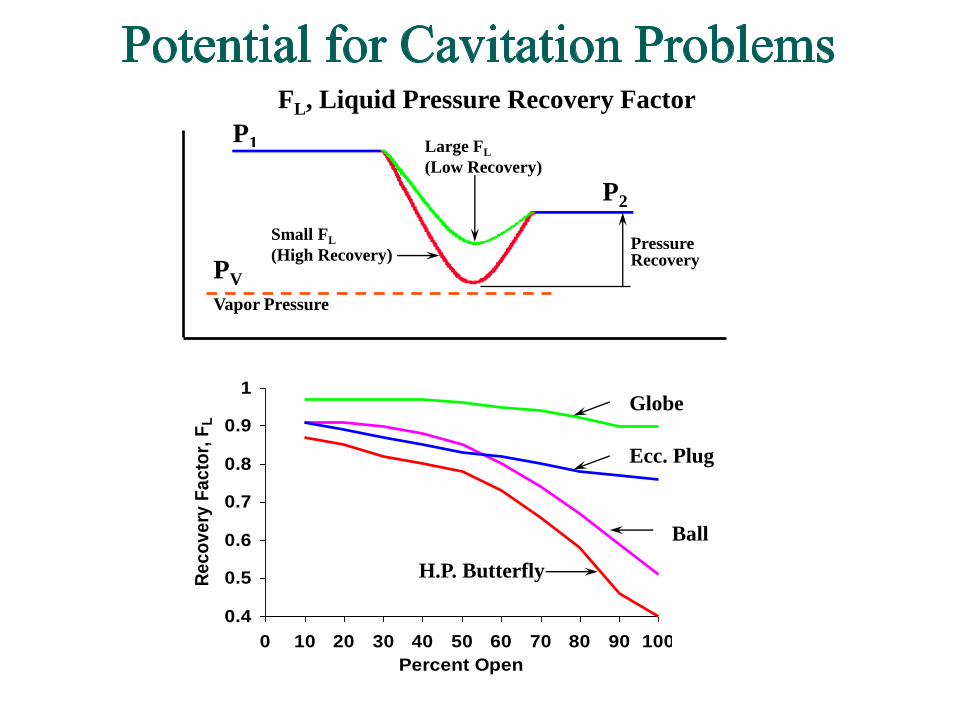
P1
P2
PV
Vapor Pressure
Pressure Recovery
Large FL
(Low Recovery)
Small FL
(High Recovery)
FL, Liquid Pressure Recovery Factor
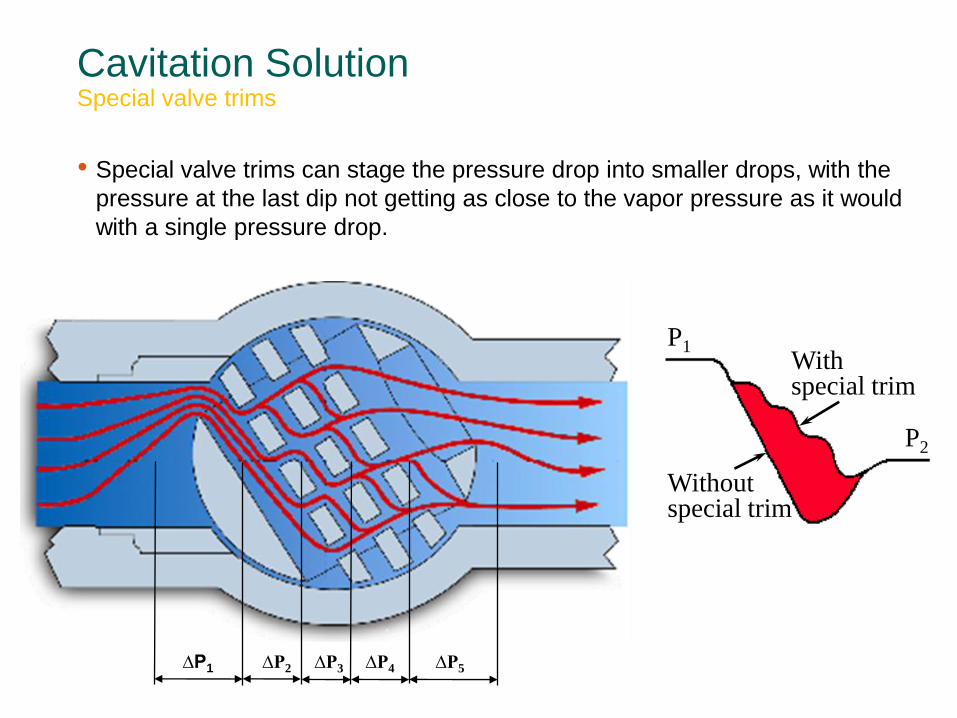
• Special valve trims can stage the pressure drop into smaller drops, with the
pressure at the last dip not getting as close to the vapor pressure as it would
with a single pressure drop.
P2
With Q - Trim
Cavitation Solution Special valve trims
∆P1 ∆P2 ∆P3 ∆P4 ∆P5
P1
P2
Without special trim
With special trim
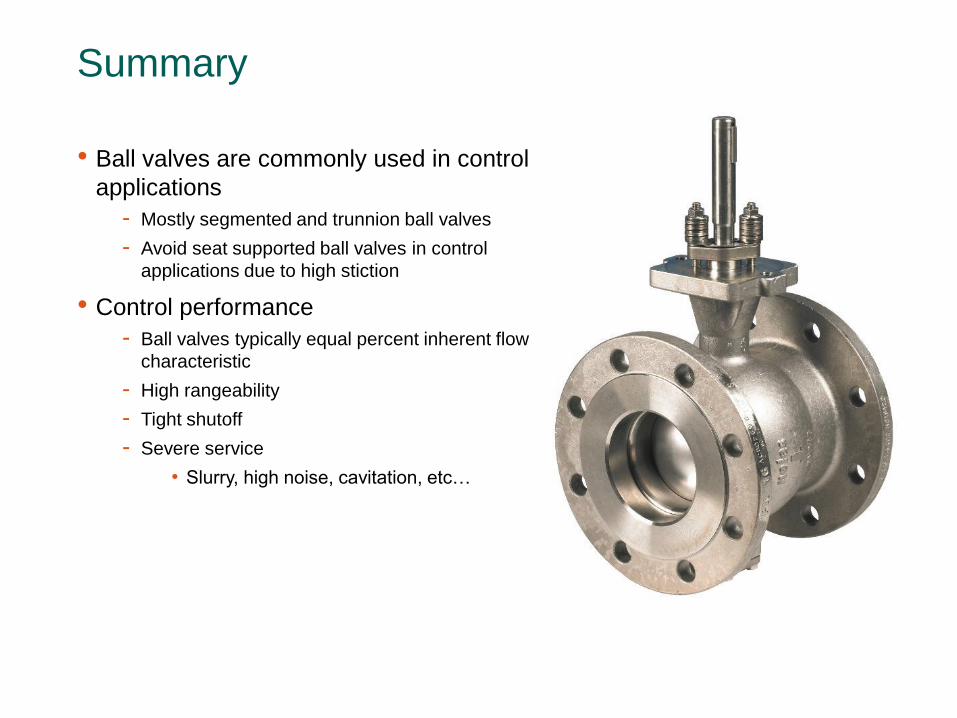
Summary
• Ball valves are commonly used in control
applications
- Mostly segmented and trunnion ball valves
- Avoid seat supported ball valves in control
applications due to high stiction
• Control performance
- Ball valves typically equal percent inherent flow
characteristic
- High rangeability
- Tight shutoff
- Severe service
• Slurry, high noise, cavitation, etc…
Questions?
• Contact
Kyle Rayhill
Director, Global Oil & Gas Business Line
Metso Automation
(508) 852 - 0215 ext. 6124