Embed Size (px)
Citation preview
Contribution of the Film & Television Industry to the Economies of Oregon and
the Portland Metropolitan Area
Northwest Economic Research Center
An Economic Impact Analysis for the Oregon
Governor’s Office of Film and Television
www.pdx.edu/nerc
College of Urban & Public Affairs

Northwest Economic Research Center P a g e | 2
Northwest Economic Research Center
Portland State University
College of Urban & Public Affairs
PO BOX 751
Portland, OR 97207-0751
503-725-8167
www.pdx.edu/nerc
College of Urban & Public Affairs

Acknowledgements
Contribution of the Film & Television Industry to the Economies of Oregon and the Portland Metropolitan Area An Economic Impact Analysis for the Oregon Governor’s Office of Film and Television The following report was researched and written by the Northwest Economic Research Center (NERC) at the request of the Oregon Governor’s Office of Film and Television (OR Film) and the Portland Development Commission (PDC). The mission of OR Film is to promote the development of the film, video, and multimedia industry in Oregon and to enhance the industry’s revenues, profile, and reputation within Oregon and among the industry internationally. OR Film set up interviews, provided data, and a wealth of background knowledge. Vince Porter, Executive Director of OR Film, and his staff were integral to the success of the project. PDC strives to create one of the world’s most desirable and equitable cities by investing in job creation, innovation, and economic opportunity throughout Portland. Shelley Midthun, the Mayor’s Film and Video Liaison, provided feedback and direction for the report. NERC is based at Portland State University in the College of Urban and Public Affairs. The Center focuses on economic research that supports public-policy decision-making, and relates to issues important to Oregon and the Portland Metropolitan Area. NERC serves the public, nonprofit, and private sector community with high quality, unbiased, and credible economic analysis. The Director of NERC is Tom Potiowsky, who also serves as the Chair of the Department of Economics at Portland State University. The report was researched and written by Jeff Renfro, Senior Economist, with support from Jenny Liu, Assistant Director. Research support was provided by Hudson Munoz and Toby Sytsma, NERC Research Interns. The report was formatted by Mauryn Quintero, Administrative Assistant.
Northwest Economic Research Center P a g e | 4
Table of Contents
Executive Summary ................................................................................ 5
Technical Background ............................................................................ 8
Industry Description ............................................................................. 11
Incentive Program ................................................................................. 15
Economic Impact ................................................................................. 17
Portland Metro Impacts................................................................ 23
Tax Revenue and Incentive Impact ....................................................... 26
Related Industries ..................................................................................... 29
Conclusion............................................................................................. 32

Northwest Economic Research Center P a g e | 5
Executive Summary
0
1000
2000
3000
4000
5000
Jobs
Film and VideoProduction
Television andBroadcasting
Competition among states for the limited number of large-scale film and television productions is fierce. Production companies choose shooting locations based on a broad range of factors that relate to keeping costs down while capturing the tone and feel envisioned by the production’s creators. Many states have adopted incentive programs to attract productions and the large amount of outside spending that accompany them. The funds of a successful incentive program are multiplied after entering the economy when productions hire local workers and purchase local goods and services. Because of the potential returns to these programs, states are motivated to offer generous incentive packages. It is important to study the effects of these programs to ensure that the returns justify the expenditures.
The Northwest Economic Research Center (NERC) was commissioned by The Governor’s Office of Film and Television (OR Film) and the Portland Development Commission (PDC) to quantify the economic impact of the film and television industry and study the impacts of production incentive programs in Oregon and the Portland Metropolitan Area. Because the industry is made up of established companies, freelancers, and out-of-state productions, NERC used data from a variety of sources to find the employment and wages of the film and video production, television and cable broadcasting, and out-of-state production segments.
NERC found that the industry has rebounded from its decline in the mid-2000s, and has already recovered from mild job losses during and after the 2008 recession.
The Oregon data masks the strong growth in the Portland Metropolitan Area. Aside from a low growth/small loss period during the worst of the 2008 recession, film and video production jobs and wages have increased.
Oregon Film and Video Production, Television and Broadcasting Jobs
Northwest Economic Research Center P a g e | 6
0
500
1000
1500
2000
2500
3000
3500
4000
Jobs
Film and Video
Television andBroadcasting
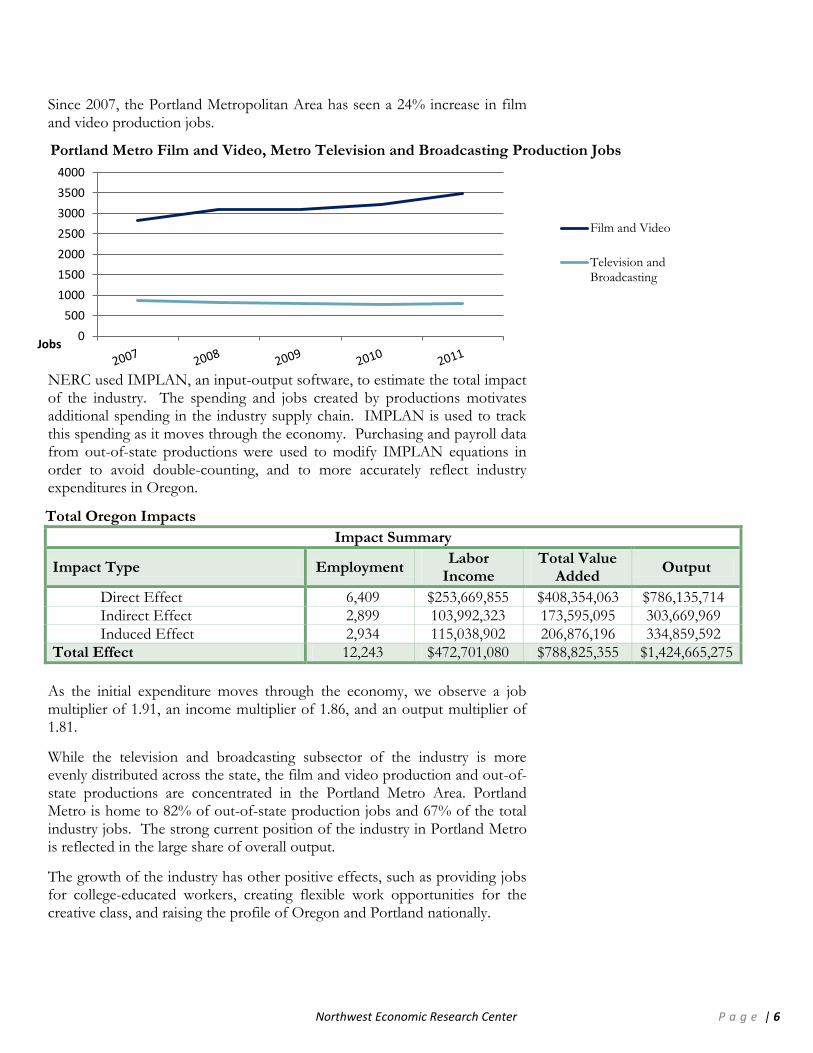
Since 2007, the Portland Metropolitan Area has seen a 24% increase in film and video production jobs.
NERC used IMPLAN, an input-output software, to estimate the total impact of the industry. The spending and jobs created by productions motivates additional spending in the industry supply chain. IMPLAN is used to track this spending as it moves through the economy. Purchasing and payroll data from out-of-state productions were used to modify IMPLAN equations in order to avoid double-counting, and to more accurately reflect industry expenditures in Oregon.
As the initial expenditure moves through the economy, we observe a job multiplier of 1.91, an income multiplier of 1.86, and an output multiplier of 1.81.
While the television and broadcasting subsector of the industry is more evenly distributed across the state, the film and video production and out-of-state productions are concentrated in the Portland Metro Area. Portland Metro is home to 82% of out-of-state production jobs and 67% of the total industry jobs. The strong current position of the industry in Portland Metro is reflected in the large share of overall output.
The growth of the industry has other positive effects, such as providing jobs for college-educated workers, creating flexible work opportunities for the creative class, and raising the profile of Oregon and Portland nationally.
Portland Metro Film and Video, Metro Television and Broadcasting Production Jobs
Total Oregon Impacts
Impact Summary
Impact Type Employment Labor
Income Total Value
Added Output
Direct Effect 6,409 $253,669,855 $408,354,063 $786,135,714
Indirect Effect 2,899 103,992,323 173,595,095 303,669,969
Induced Effect 2,934 115,038,902 206,876,196 334,859,592
Total Effect 12,243 $472,701,080 $788,825,355 $1,424,665,275
Northwest Economic Research Center P a g e | 7
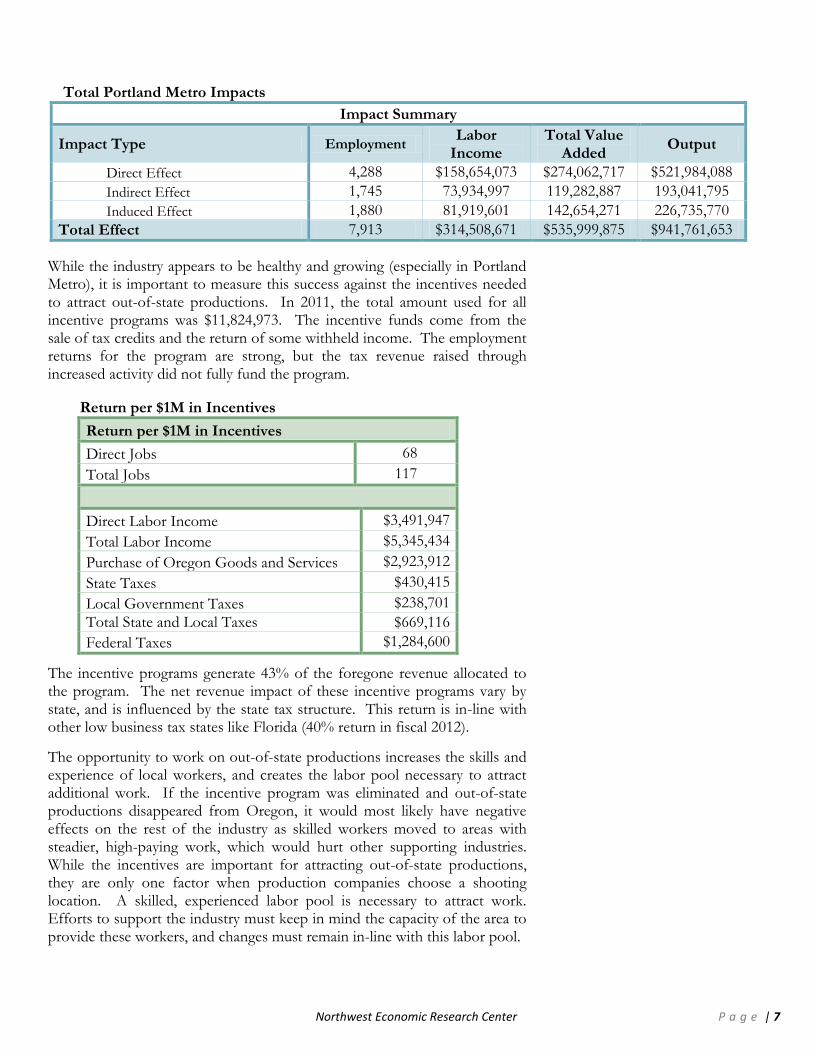
Total Portland Metro Impacts
Impact Summary
Impact Type Employment Labor
Income Total Value
Added Output
Direct Effect 4,288 $158,654,073 $274,062,717 $521,984,088
Indirect Effect 1,745 73,934,997 119,282,887 193,041,795
Induced Effect 1,880 81,919,601 142,654,271 226,735,770
Total Effect 7,913 $314,508,671 $535,999,875 $941,761,653
While the industry appears to be healthy and growing (especially in Portland Metro), it is important to measure this success against the incentives needed to attract out-of-state productions. In 2011, the total amount used for all incentive programs was $11,824,973. The incentive funds come from the sale of tax credits and the return of some withheld income. The employment returns for the program are strong, but the tax revenue raised through increased activity did not fully fund the program.
The incentive programs generate 43% of the foregone revenue allocated to the program. The net revenue impact of these incentive programs vary by state, and is influenced by the state tax structure. This return is in-line with other low business tax states like Florida (40% return in fiscal 2012).
The opportunity to work on out-of-state productions increases the skills and experience of local workers, and creates the labor pool necessary to attract additional work. If the incentive program was eliminated and out-of-state productions disappeared from Oregon, it would most likely have negative effects on the rest of the industry as skilled workers moved to areas with steadier, high-paying work, which would hurt other supporting industries. While the incentives are important for attracting out-of-state productions, they are only one factor when production companies choose a shooting location. A skilled, experienced labor pool is necessary to attract work. Efforts to support the industry must keep in mind the capacity of the area to provide these workers, and changes must remain in-line with this labor pool.
Return per $1M in Incentives
Return per $1M in Incentives
Direct Jobs 68
Total Jobs 117
Direct Labor Income $3,491,947
Total Labor Income $5,345,434
Purchase of Oregon Goods and Services $2,923,912
State Taxes $430,415
Local Government Taxes $238,701
Total State and Local Taxes $669,116
Federal Taxes $1,284,600
Northwest Economic Research Center P a g e | 8
Technical Background
The primary data sources for this report were the Quarterly Census of Employment and Wages for Oregon (QCEW), the Oregon Employment Department, U.S. Census Bureau, Bureau of Labor Statistics (BLS), and the Oregon Governor’s Office of Film and Television (OR Film). The industry is made up of a mix of established firms with covered employees and freelancers who are hired for specific productions. These different employment types make any one data source incomplete. In order to capture the full impact of the industry, 2011 QCEW employment estimates for Oregon and the Portland Metropolitan Area were combined with non-employer statistics from the Census Bureau. At the time of this writing, non-employer statistics are updated through 2009. This data was used to estimate 2011 values. Fortunately, much of the employment and wage change in the industry has followed a distinct pattern: a major drop in the early 2000s after the removal of tax incentives for out-of-state production, followed by a sharp increase when the credits were reinstated, and a leveling off during the recession starting in 2008. Most of the non-employer estimates were created by projecting this same pattern into 2011. Based on the growth seen in the industry during the last few years, we feel that our assumption of modest growth amongst freelancers is conservative, and does not have a large effect on the study’s conclusions.
The economic impact of the industry is focused on firms and freelancers whose primary work is the production of film and television programming. This means other industries that occasionally engage in programming production (i.e. an occasional promotional video) or industries that are closely connected to the film and television industry are not included. In order to capture these connections, and the impact of local production expertise in other fields, NERC used Occupational and Employment Statistics from BLS. These measures categorize people by job type, rather than industry. To illustrate, an administrative assistant at Laika would be included in the QCEW as an employee of the film industry, but would not show up in the BLS data. These connections are discussed in greater detail in the related industries section (pg. 29) of this report.
One issue that we faced in the data collection process was the relatively large number of film and video distribution employees that were not geographically classified within Oregon. In 2007 and before, this represented a small part of the overall industry, but by 2011 the proportion had grown to close to 20% of all employees. If we analyze only the geographically assigned employees, we see growth in Oregon, but a large drop-off in employment in
Northwest Economic Research Center P a g e | 9
Portland at the start of the 2008 recession with little recovery by 2011. This runs counter to the experience of those in the industry who observe most of the growth occurring in Portland. NERC worked with the Oregon Department of Employment and OR Film to allocate these workers to an appropriate geographic area. We decided to place 90% in the Portland Metropolitan Area. Because workers can fall into the geographically unclassified for a variety of reasons, it is impossible to say with certainty how many work in Portland, but this allocation is aligned with the opinions of industry and data experts.
In addition to these publicly available data sources, NERC was given expenditure data provided to OR Film by the production companies seeking rebates. The data is reported in the format used by each company’s accounting firm, and expenditure categories are not standardized. NERC classified reported expenditures by type and geographic location, and used this data to quantify the contribution made to the industry by these out-of-state production companies in order to avoid double counting. This data was also instrumental in customizing the industry production functions for the input-output analysis, which will be covered in more detail in the Economic Impact section. Using information on expenditure locations and employee addresses, NERC was able to exclude spending that occurred outside of Oregon. The analysis on wages includes 30% of payroll for out-of-state residents, as well as per diem payments. It is assumed that out-of-state residents will spend some money in Oregon (per diem is used as a proxy), but that most of their earnings will return to their home state. We chose to include a portion of out-of-state payroll (30%) in the analysis because of the nature of Oregon’s out-of-state productions. For major films and television shows, staff that is relocated spends 6-10 months in Oregon. We turned to research from the energy sector to arrive at an estimate of wages spent by long-term visiting workers. Although we think the inclusion of these wages is theoretically correct, this additional spending was small and had a minimal impact on the economic impact results.
The QCEW is derived from quarterly contribution reports, which employers are required to submit. This reporting does not cover self-employed workers, business proprietors, and other categories not relevant to this industry. The data is released with a two-quarter lag. At the time of the writing of this report, the 2011 job and wage estimates were still preliminary. It is possible that the numbers will be adjusted up or down at a future date.
The Census Bureau’s nonemployer statistics are drawn from annual and quarterly business income tax returns. The IRS receives the returns, and the Census Bureau filters and organizes the data to populate its Business Register. The Census Bureau removes firms that are subsidiaries of larger companies, or companies set up for investment purposes and as such, do not function as independent firms.

Northwest Economic Research Center P a g e | 10
The BLS Occupational Employment Statistics are estimated using a 1.2 million establishment sample, collected over the course of three years. Every six months, BLS collects mail surveys from approximately 1/6 of their sample. These occupations are cross-referenced with NAICS designations.
OR Film makes the final decision on the total rebate that each production company will receive. Production companies submit documentation of covered purchases of goods and services, and eligible payroll expenses. OR Film staff sort this data and decide if all of the submitted costs are in fact eligible for rebate, and settles on the final rebate amount. For the larger productions, purchasing data covered every dollar spent. If a production assistant purchased sandwiches at a local deli one afternoon, it was reflected in the reporting.
Northwest Economic Research Center P a g e | 11
Industry Description
Previous reports on the impact of the film and television production in Oregon split the industry into three categories: out-of-state film and video production, indigenous film and video production, and television and cable broadcasting. We find this categorization to be useful and this report uses the same designations.
Out-of-State Film and Video Production: This category is made up mainly of production activity undertaken by companies based outside of Oregon. In 2011, the out-of-state productions were the television shows Grimm, Leverage, and Portlandia, the feature film Gone, the small-budget film Legit, and a small portion of Laika’s work1.
Indigenous Film and Video Production: Firms that fall into this category are based in Oregon, and film or video production is their primary activity. The primary NAICS code used for this category was the 5121 Motion Picture and Video Industries code2, with sub-segments removed. Non-employer statistics were used to capture the number of freelance workers in this industry segment, but companies that only occasionally engage in film production activity were not included.
Television and Cable Broadcasting: This category uses the 515 Broadcasting (except internet) NAICS code, with the radio-related segments removed. Non-employer statistics represented a much smaller proportion of the data, but were still included. The bulk of this category is made up of local television stations producing original content for broadcast.
1 Laika is based in Oregon and spends a significant amount on local purchases and payroll for employees subject to Oregon withholding. Laika and OR Film work together to find a rebate amount that incentivizes production, while leaving rebate dollars for other large production companies. As a result, Laika only submits a portion of their payroll data for review. The rebates allow for additional activity that would otherwise not occur. It would be impossible to arrive at an exact number for the lost output in this counterfactual scenario. This report takes the submitted payroll expenditures as a proxy for the additional output. This additional output is included in the estimates of the out-of-state production, which is assumed to be motivated by the tax rebates.
2 The 5121 code includes distribution, exhibition, and theaters which were all removed from the dataset.

Northwest Economic Research Center P a g e | 12
0
500
1000
1500
2000
2500
3000
3500
4000
4500
5000
Jobs
Content produced exclusively for internet broadcast will most likely end up representing a larger portion of the industry at some point in the future. This content, if produced by a company primarily involved in the television and film industry, will be represented in the data, but firms that produce exclusively for the internet are not. At this point, employment and wage data for these firms are already classified in the above categories, or fall into NAICS codes related to web design or programming. Because the industry is still in its very early stages, the uncaptured impact should be small but future installments of this report may need to take internet broadcasting into account.
Historical Trends During the early 2000s, a recession combined with a suspension of production incentives led to a decline in the total employment and wages in the industry. A strong recovery followed the restoration of the incentives in the mid-2000s. Although the most recent recession resulted in severe negative economic impacts nationally and in Oregon, the negative impact on the TV and film industry was limited. As Figure 1 shows, the decline from peak to trough in the film and video production segment was about half of what it was in the recession of the early 2000s. The recovery was also faster. By 2011, the jobs and wages are just short of their 2008 levels.
Year Total Jobs Total Wages
(in thousands)
2001 4,024 $79,828
2002 3,931 $76,173
2003 3,544 $70,862
2004 3,389 $73,217
2005 3,701 $86,875
2006 4,166 $104,377
2007 4,369 $123,471
2008 4,588 $145,482
2009 4,216 $114,308
2010 4,213 $114,791
2011 4,542 $142,354
Figure 1: Oregon Film and Video Production Jobs
Northwest Economic Research Center P a g e | 13
0
500
1000
1500
2000
2500
Jobs
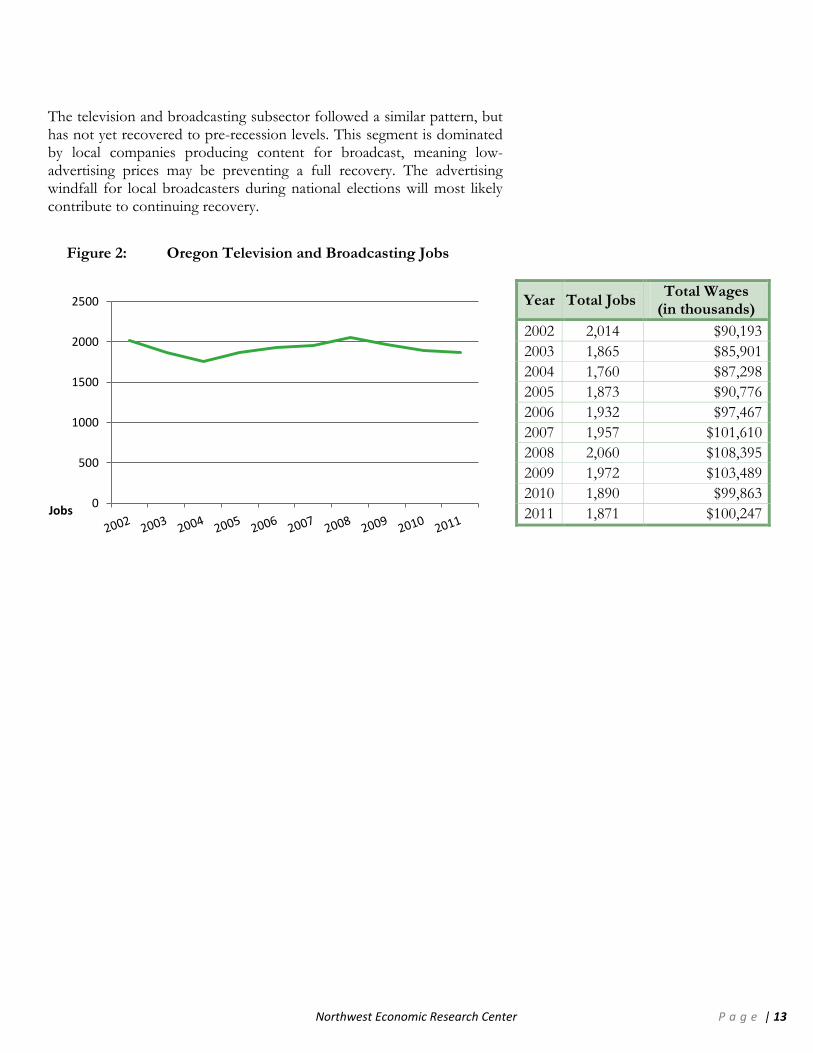
The television and broadcasting subsector followed a similar pattern, but has not yet recovered to pre-recession levels. This segment is dominated by local companies producing content for broadcast, meaning low-advertising prices may be preventing a full recovery. The advertising windfall for local broadcasters during national elections will most likely contribute to continuing recovery.
Year Total Jobs Total Wages
(in thousands)
2002 2,014 $90,193
2003 1,865 $85,901
2004 1,760 $87,298
2005 1,873 $90,776
2006 1,932 $97,467
2007 1,957 $101,610
2008 2,060 $108,395
2009 1,972 $103,489
2010 1,890 $99,863
2011 1,871 $100,247
Figure 2: Oregon Television and Broadcasting Jobs
Northwest Economic Research Center P a g e | 14
0
500
1000
1500
2000
2500
3000
3500
4000
Jobs
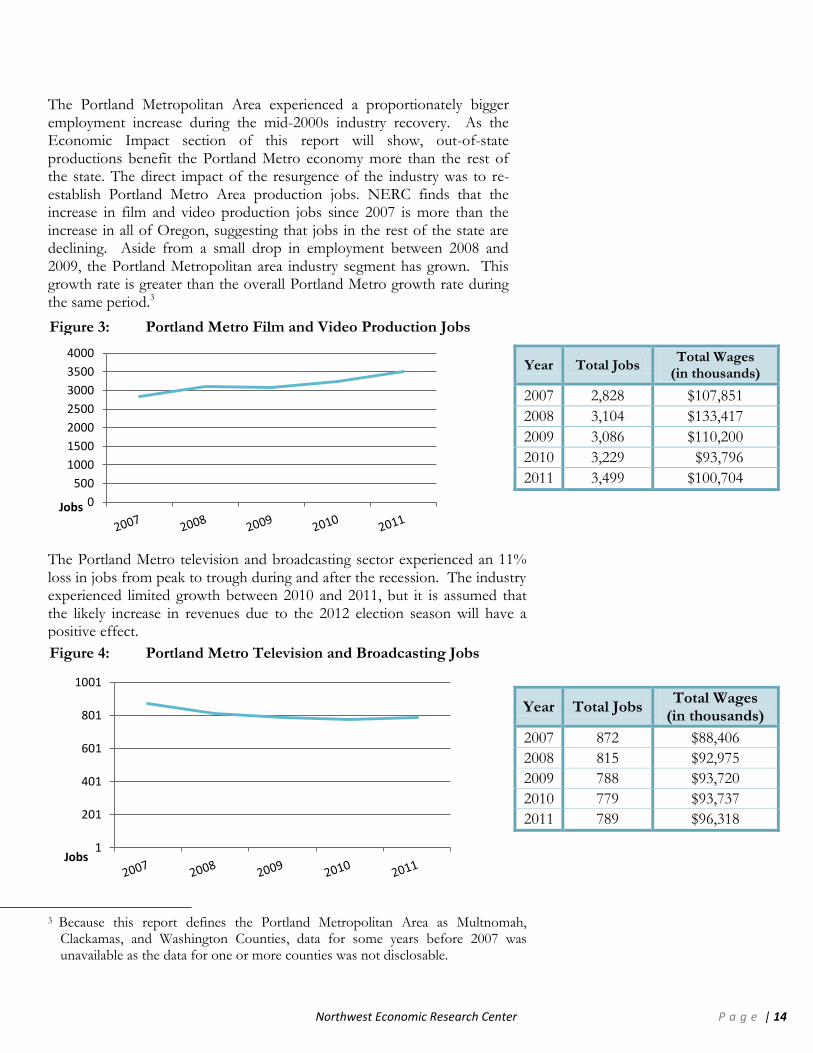
The Portland Metropolitan Area experienced a proportionately bigger employment increase during the mid-2000s industry recovery. As the Economic Impact section of this report will show, out-of-state productions benefit the Portland Metro economy more than the rest of the state. The direct impact of the resurgence of the industry was to re-establish Portland Metro Area production jobs. NERC finds that the increase in film and video production jobs since 2007 is more than the increase in all of Oregon, suggesting that jobs in the rest of the state are declining. Aside from a small drop in employment between 2008 and 2009, the Portland Metropolitan area industry segment has grown. This growth rate is greater than the overall Portland Metro growth rate during the same period.3
The Portland Metro television and broadcasting sector experienced an 11% loss in jobs from peak to trough during and after the recession. The industry experienced limited growth between 2010 and 2011, but it is assumed that the likely increase in revenues due to the 2012 election season will have a positive effect.
3 Because this report defines the Portland Metropolitan Area as Multnomah,
Clackamas, and Washington Counties, data for some years before 2007 was unavailable as the data for one or more counties was not disclosable.
1
201
401
601
801
1001
Jobs
Year Total Jobs Total Wages
(in thousands)
2007 2,828 $107,851
2008 3,104 $133,417
2009 3,086 $110,200
2010 3,229 $93,796
2011 3,499 $100,704
Figure 3: Portland Metro Film and Video Production Jobs
Figure 4: Portland Metro Television and Broadcasting Jobs
Year Total Jobs Total Wages
(in thousands)
2007 872 $88,406
2008 815 $92,975
2009 788 $93,720
2010 779 $93,737
2011 789 $96,318

Northwest Economic Research Center P a g e | 15
Incentive Program
The State of Oregon offers three main incentive programs for film and television productions- The Oregon Production Investment Fund (OPIF), the Greenlight Oregon Labor Rebate (Greenlight), and the Indigenous Oregon Production Investment Fund (iOPIF).
Productions that spend at least $750,000 in Oregon on a feature or series are eligible for OPIF rebates. Firms can claim rebates for 20% of goods and services purchased from Oregon vendors and 10% of wages paid for work done in Oregon.
Greenlight is available to firms spending more than $1 million in Oregon. Firms that qualify for the rebate have an amount corresponding to 6.2% of payroll subject to Oregon withholding set aside, which is then returned through the rebate. Because set aside funds for Greenlight come from withholdings, there is no explicit cap4.
iOPIF: Production companies that spend between $75,000 and $750,000 on one feature or series in Oregon, and have Oregon residents making up 80% of their crew can receive the same 20% rebate on goods and services and 10% rebate on payroll as the large OPIF program.
4 Greenlight can be combined with OPIF for to create a total rebate of 16.2% on qualifying payroll
Rebate Fund Procurement
OPIF funds are raised through the sale
of tax credits. For the 2011 credits,
funders paid $0.95 for $1 in tax credits.
These funds are then disbursed as
rebates on qualifying expenses to
production companies. The gap
between the price paid and the credits
received by funders amounts to a
leakage in the process. The fund is
currently capped at $6 million per year.
Because the funds are raised during the
fiscal year (July-June) and this study
focuses on the 2011 calendar year, the
actual OPIF rebate was greater than
the $6 million. For this study
$10,158,439 is used as the 2011 OPIF
expenditure. Although not all of these
rebates had been paid out by the end
of 2011, these funds were all associated
with and committed to work that took
place in 2011. The leakage created by
the raising of funds in 2011 was
$507,921. In 2012, the state switched
to an auction style sale of tax credits.
The price paid was $0.978 for $1 in tax
credits. The leakage on the $6 million
in rebates sold was $132,163, a
significant improvement on the 2011
leakage factor.
Northwest Economic Research Center P a g e | 16
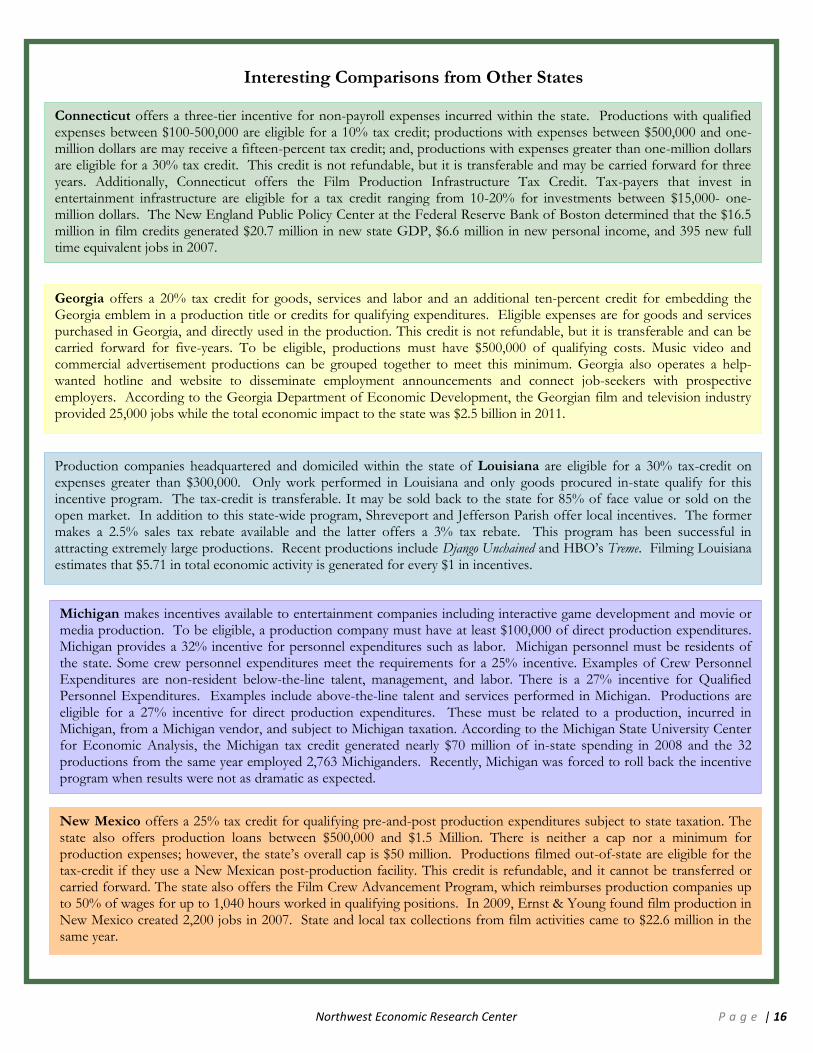
Interesting Comparisons from Other States
Connecticut offers a three-tier incentive for non-payroll expenses incurred within the state. Productions with qualified expenses between $100-500,000 are eligible for a 10% tax credit; productions with expenses between $500,000 and one-million dollars are may receive a fifteen-percent tax credit; and, productions with expenses greater than one-million dollars are eligible for a 30% tax credit. This credit is not refundable, but it is transferable and may be carried forward for three years. Additionally, Connecticut offers the Film Production Infrastructure Tax Credit. Tax-payers that invest in entertainment infrastructure are eligible for a tax credit ranging from 10-20% for investments between $15,000- one-million dollars. The New England Public Policy Center at the Federal Reserve Bank of Boston determined that the $16.5 million in film credits generated $20.7 million in new state GDP, $6.6 million in new personal income, and 395 new full time equivalent jobs in 2007.
Georgia offers a 20% tax credit for goods, services and labor and an additional ten-percent credit for embedding the Georgia emblem in a production title or credits for qualifying expenditures. Eligible expenses are for goods and services purchased in Georgia, and directly used in the production. This credit is not refundable, but it is transferable and can be carried forward for five-years. To be eligible, productions must have $500,000 of qualifying costs. Music video and commercial advertisement productions can be grouped together to meet this minimum. Georgia also operates a help-wanted hotline and website to disseminate employment announcements and connect job-seekers with prospective employers. According to the Georgia Department of Economic Development, the Georgian film and television industry provided 25,000 jobs while the total economic impact to the state was $2.5 billion in 2011.
Production companies headquartered and domiciled within the state of Louisiana are eligible for a 30% tax-credit on expenses greater than $300,000. Only work performed in Louisiana and only goods procured in-state qualify for this incentive program. The tax-credit is transferable. It may be sold back to the state for 85% of face value or sold on the open market. In addition to this state-wide program, Shreveport and Jefferson Parish offer local incentives. The former makes a 2.5% sales tax rebate available and the latter offers a 3% tax rebate. This program has been successful in attracting extremely large productions. Recent productions include Django Unchained and HBO’s Treme. Filming Louisiana estimates that $5.71 in total economic activity is generated for every $1 in incentives.
Michigan makes incentives available to entertainment companies including interactive game development and movie or media production. To be eligible, a production company must have at least $100,000 of direct production expenditures. Michigan provides a 32% incentive for personnel expenditures such as labor. Michigan personnel must be residents of the state. Some crew personnel expenditures meet the requirements for a 25% incentive. Examples of Crew Personnel Expenditures are non-resident below-the-line talent, management, and labor. There is a 27% incentive for Qualified Personnel Expenditures. Examples include above-the-line talent and services performed in Michigan. Productions are eligible for a 27% incentive for direct production expenditures. These must be related to a production, incurred in Michigan, from a Michigan vendor, and subject to Michigan taxation. According to the Michigan State University Center for Economic Analysis, the Michigan tax credit generated nearly $70 million of in-state spending in 2008 and the 32 productions from the same year employed 2,763 Michiganders. Recently, Michigan was forced to roll back the incentive program when results were not as dramatic as expected.
New Mexico offers a 25% tax credit for qualifying pre-and-post production expenditures subject to state taxation. The state also offers production loans between $500,000 and $1.5 Million. There is neither a cap nor a minimum for production expenses; however, the state’s overall cap is $50 million. Productions filmed out-of-state are eligible for the tax-credit if they use a New Mexican post-production facility. This credit is refundable, and it cannot be transferred or carried forward. The state also offers the Film Crew Advancement Program, which reimburses production companies up to 50% of wages for up to 1,040 hours worked in qualifying positions. In 2009, Ernst & Young found film production in New Mexico created 2,200 jobs in 2007. State and local tax collections from film activities came to $22.6 million in the same year.

Northwest Economic Research Center P a g e | 17
Economic Impact
In order to capture the full economic impact of the film and television industry we used IMPLAN, an input-output software that simulates changes to the economy. This analysis was implemented using two IMPLAN models, one covering Oregon and the other the Portland Metropolitan Area (Clackamas, Multnomah, and Washington counties).
IMPLAN models are constructed using Social Accounting Matrices (SAM) based on spending and purchasing data from the Bureau of Economic Analysis (BEA) supplemented by data from other publicly available sources. SAMs are constructed that reflect the actual industry interactions in a region, and include government activities that are not traditionally reflected in this type of economic analysis.
SAMs create a map showing how money and resources flow through the economy. In a simulation, new economic activity is assumed to occur in an industry or group of industries. Based on past spending and purchasing activity, IMPLAN simulates the purchasing and spending necessary for this new economic activity to occur. IMPLAN tracks this new economic activity as it works its way through the economy. Also included in SAMs are household and government behavior. In addition to following purchasing and spending through the private sector, IMPLAN also estimates the impact of changes in disposable income and tax revenue.
A production function is constructed for each industry, reflecting its connections to other industries. Economic changes or events are propagated through this process as new economic activity motivates additional economic activity in other parts of the supply chain, and through changes in spending habits.
The detail of the data provided to NERC, allowed us to customize the production function for the film and television industry to better reflect activity in Oregon. This was particularly important for the out-of-state production modeling. If an industry does not exist in an economic study area, IMPLAN assumes that resources going toward those industries leak out of the model. In this case, supporting parts of the film and television industry do exist in Oregon but those services are not utilized by the out-of-state production companies. Those production companies use the same legal and marketing services that they would use in any part of the country. Because of this, not all parts of the industry actually come to Oregon. It was
Northwest Economic Research Center P a g e | 18
important to remove or alter these supporting services in the production function to build in leakage, in order to avoid overestimating these impacts.
A key distinction in this type of analysis is the difference between economic impacts and economic contributions. This report includes both:
Economic impact analysis assumes that the economic impact being studied is new, and represents activity above and beyond what is normal in the zone being modeled. In this case, out-of-state film and television production is considered an economic impact because we assume that without the rebate incentives, these productions would not take place. Additionally, the funding for these productions tends to come from outside of Oregon. The assumption is that this exogenous spending enters the Oregon economy and creates spending and jobs that would not otherwise exist.
Economic contribution analysis relaxes these assumptions. In this case, indigenous film and video production and television and cable broadcasting are considered economic contributions. These industries have a measurable impact on the economy, but we cannot claim that this activity would disappear if the industry was not here. If the local film and television industry did not exist in Oregon, the resources currently devoted to the industry could very well be used to expand other industries. To further contrast this with impact analysis, out-of-state production attracts additional funding and creates activity that would not otherwise exist, while the local industry represents resource use as it exists but not as it necessarily has to be.

Northwest Economic Research Center P a g e | 19
IMPLAN breaks out analysis results into three types: direct, indirect, and induced.
Direct Impacts: These are defined by the modeler, and placed in the appropriate industry. They are not subject to multipliers. In this case, purchasing, employment, and wage data were collected from the sources described above and placed into the appropriate industry.
Indirect Impacts: These impacts are estimated based on national purchasing and sales data that model the interactions between industries. This category reflects the economic activity necessary to support the new economic activity in the direct impacts by other firms in the supply chain.
Induced Impacts: These impacts are created by the change in wages and employee compensation. Employees change purchasing decisions based on changes in income and wealth.
Oregon Impacts NERC estimates that the economic activity from the industry creates 5,834 jobs, on top of the 6,409 jobs created directly for a total impact of 12,243 jobs. The industry generates gross economic activity of over $1.4 billion dollars and provides $471 million in total employee compensation. These estimates include the impact of the small amount of additional spending due to out-of-state workers.
IMPLAN Impacts
The impact summary results are given
in terms of employment, labor
income, total value added, and output:
Employment represents the number
of annual, 1.0 FTE jobs. These job
estimates are derived from industry
wage averages.
Labor Income is made up of total
employee compensation (wages and
benefits) as well as proprietor income.
Proprietor income is profits earned by
self-employed individuals.
Total Value Added is made up of
labor income, property type income,
and indirect business taxes collected
on behalf of local government. This
measure is comparable to familiar net
measurements of output like gross
domestic product.
Output is a gross measure of
production. It includes the value of
both intermediate and final goods.
Because of this, some double counting
will occur. Output is presented as a
gross measure because IMPLAN is
capable of analyzing custom economic
zones. Producers may be creating
goods that would be considered
intermediate from the perspective of
the greater national economy, but may
leave the custom economic zone,
making them a local final good.
Table 1: Total Oregon Impacts (All segments)
Impact Summary
Impact Type
Employment Labor
Income Total Value
Added Output
Direct Effect 6,409 $253,669,855 $408,354,063 $786,135,714 Indirect Effect 2,899 103,992,323 173,595,095 303,669,969 Induced Effect 2,934 115,038,902 206,876,196 334,859,592 Total Effect 12,243 $472,701,080 $788,825,355 $1,424,665,275
Northwest Economic Research Center P a g e | 20
Film industry employees tend to work non-traditional hours. A standard work day while in production lasts 12-14 hours. Because of this, some workers in the industry are able to earn a year’s salary and benefits in as little as six months. In order to create estimates that are comparable to other Oregon industries, the employment numbers in this report are reported in terms of 1.0 FTE. As an example, a person who works for six months and earns a year’s worth of wages would count as 1.0 FTE in this report. If that same person worked an additional three months at the same pace, it would count as 1.5 FTE even though this is one person working one job.
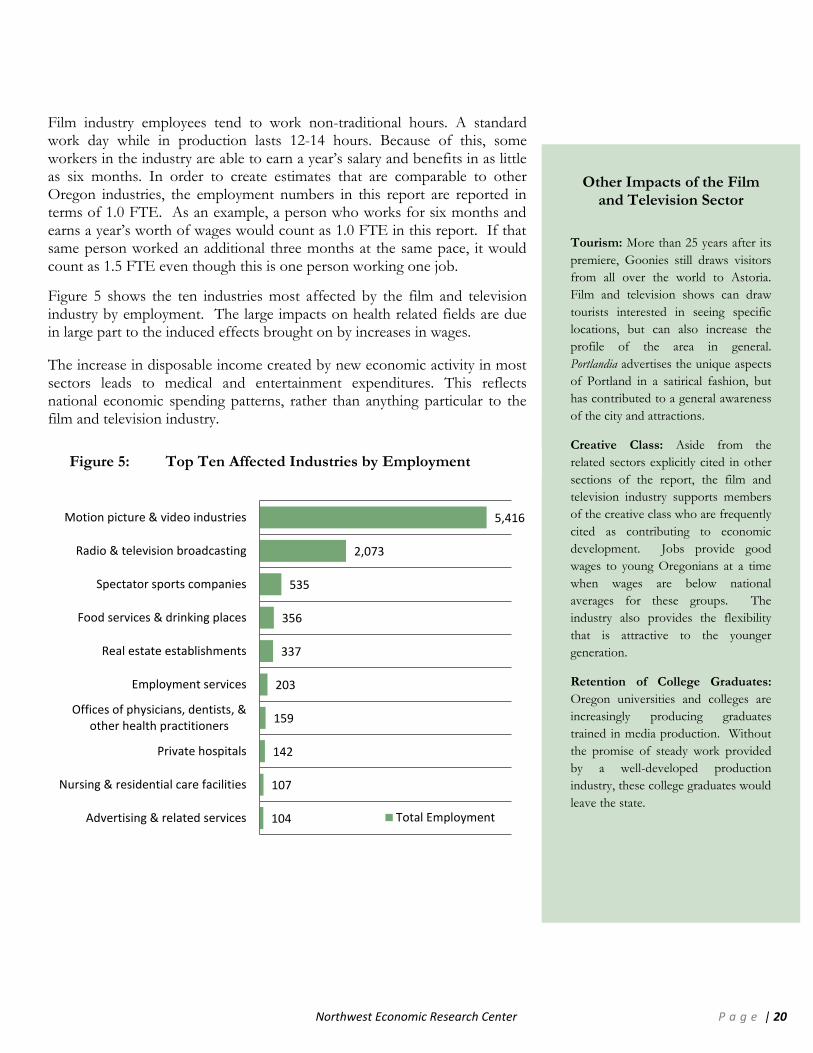
Figure 5 shows the ten industries most affected by the film and television industry by employment. The large impacts on health related fields are due in large part to the induced effects brought on by increases in wages.
The increase in disposable income created by new economic activity in most sectors leads to medical and entertainment expenditures. This reflects national economic spending patterns, rather than anything particular to the film and television industry.
5,416
2,073
535
356
337
203
159
142
107
104
Motion picture & video industries
Radio & television broadcasting
Spectator sports companies
Food services & drinking places
Real estate establishments
Employment services
Offices of physicians, dentists, &other health practitioners
Private hospitals
Nursing & residential care facilities
Advertising & related services Total Employment
Other Impacts of the Film and Television Sector
Tourism: More than 25 years after its
premiere, Goonies still draws visitors
from all over the world to Astoria.
Film and television shows can draw
tourists interested in seeing specific
locations, but can also increase the
profile of the area in general.
Portlandia advertises the unique aspects
of Portland in a satirical fashion, but
has contributed to a general awareness
of the city and attractions.
Creative Class: Aside from the
related sectors explicitly cited in other
sections of the report, the film and
television industry supports members
of the creative class who are frequently
cited as contributing to economic
development. Jobs provide good
wages to young Oregonians at a time
when wages are below national
averages for these groups. The
industry also provides the flexibility
that is attractive to the younger
generation.
Retention of College Graduates:
Oregon universities and colleges are
increasingly producing graduates
trained in media production. Without
the promise of steady work provided
by a well-developed production
industry, these college graduates would
leave the state.
Figure 5: Top Ten Affected Industries by Employment
Northwest Economic Research Center P a g e | 21
The industry has a large impact on both the real estate and rental sector, and the employment services sector. This is due to the one-off nature of many productions. Each new project requires new shooting locations, as well as the creation of a new crew. The scientific and technical services category includes high-skill workers and covers a broad range of activities.
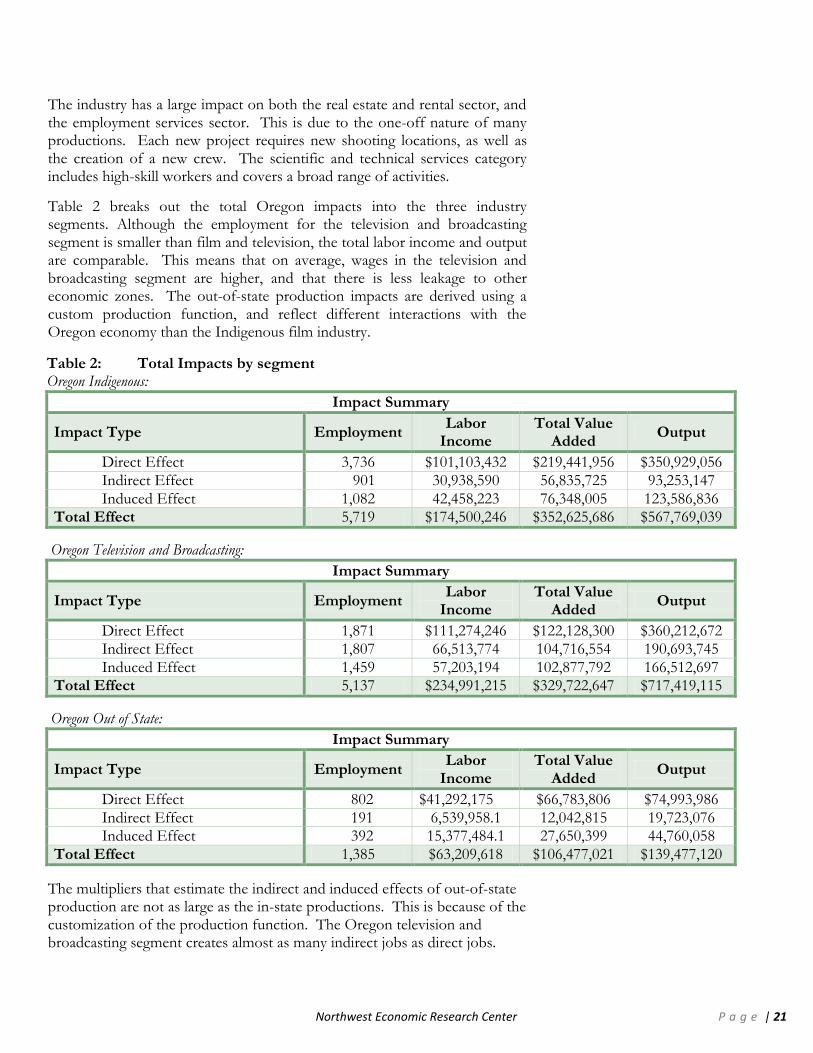
Table 2 breaks out the total Oregon impacts into the three industry segments. Although the employment for the television and broadcasting segment is smaller than film and television, the total labor income and output are comparable. This means that on average, wages in the television and broadcasting segment are higher, and that there is less leakage to other economic zones. The out-of-state production impacts are derived using a custom production function, and reflect different interactions with the Oregon economy than the Indigenous film industry.
The multipliers that estimate the indirect and induced effects of out-of-state production are not as large as the in-state productions. This is because of the customization of the production function. The Oregon television and broadcasting segment creates almost as many indirect jobs as direct jobs.
Table 2: Total Impacts by segment Oregon Indigenous:
Impact Summary
Impact Type Employment Labor
Income Total Value
Added Output
Direct Effect 3,736 $101,103,432 $219,441,956 $350,929,056
Indirect Effect 901 30,938,590 56,835,725 93,253,147
Induced Effect 1,082 42,458,223 76,348,005 123,586,836 Total Effect 5,719 $174,500,246 $352,625,686 $567,769,039
Oregon Television and Broadcasting:
Impact Summary
Impact Type Employment Labor
Income Total Value
Added Output
Direct Effect 1,871 $111,274,246 $122,128,300 $360,212,672 Indirect Effect 1,807 66,513,774 104,716,554 190,693,745
Induced Effect 1,459 57,203,194 102,877,792 166,512,697 Total Effect 5,137 $234,991,215 $329,722,647 $717,419,115
Oregon Out of State:
Impact Summary
Impact Type Employment Labor
Income Total Value
Added Output
Direct Effect 802 $41,292,175 $66,783,806 $74,993,986
Indirect Effect 191 6,539,958.1 12,042,815 19,723,076 Induced Effect 392 15,377,484.1 27,650,399 44,760,058
Total Effect 1,385 $63,209,618 $106,477,021 $139,477,120
Northwest Economic Research Center P a g e | 22
Because this industry is spread more evenly throughout the state, there is less opportunity for one firm to provide services to a large number of production companies. More services are procured in the same region as the production.
Multipliers reflect the additional economic activity motivated by an expansion in an industry. To calculate this number, the sum of the indirect and induced measures is divided by the direct measures of activity. These multipliers are smaller than in previous studies of the industry. This could reflect differences in methodology, or could be evidence of broken industry linkages caused by the recent recession. Following recessions, some jobs and local industries do not return during the recovery. Even when the base industry returns to normal, if supporting capacity has disappeared, the overall effect of the base industry will be reduced as it purchases supporting services outside of the state. Even with the robust performance of the film and television industry during the recession, other sources of revenue for related industries may have been reduced. Without further research, it is difficult to completely explain the decrease in multipliers.
Job Multiplier: 1.91 For every additional job created in the Oregon film and television industry, an additional 0.91 jobs are created in supporting sectors. In 2011, the 6,409 jobs in the industry led to an additional 5,834 jobs.
Labor Income Multiplier: 1.86 For every additional dollar in labor income created in the Oregon film and television industry an additional $0.87 was created in supporting industries. In 2001, the $253,669,855 in the industry led to an additional $219,031,225 in additional labor income.
Output Multiplier: 1.81 For every additional dollar in output created in the Oregon film and television industry, an additional $0.81 of output was created in supporting industries. In 2011, the $786,135,714 in output directly created by the industry led to an additional $638,529,561 in output.
Northwest Economic Research Center P a g e | 23
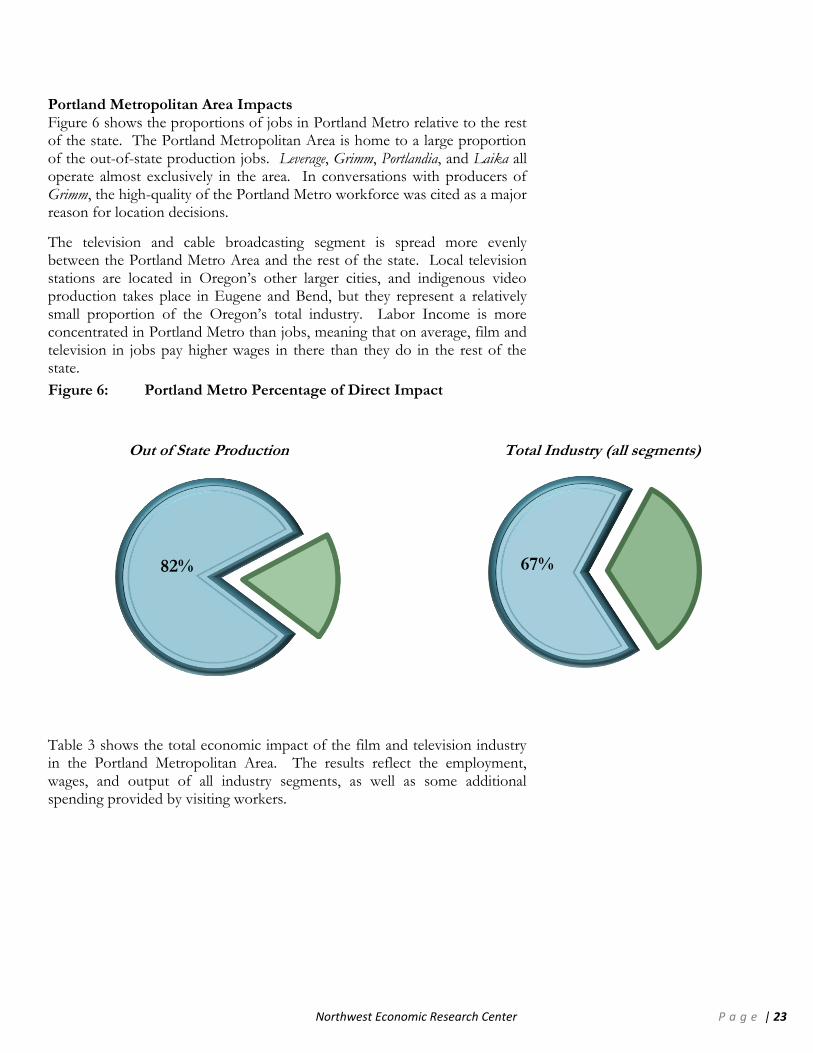
82% 67%
Portland Metropolitan Area Impacts Figure 6 shows the proportions of jobs in Portland Metro relative to the rest of the state. The Portland Metropolitan Area is home to a large proportion of the out-of-state production jobs. Leverage, Grimm, Portlandia, and Laika all operate almost exclusively in the area. In conversations with producers of Grimm, the high-quality of the Portland Metro workforce was cited as a major reason for location decisions.
The television and cable broadcasting segment is spread more evenly between the Portland Metro Area and the rest of the state. Local television stations are located in Oregon’s other larger cities, and indigenous video production takes place in Eugene and Bend, but they represent a relatively small proportion of the Oregon’s total industry. Labor Income is more concentrated in Portland Metro than jobs, meaning that on average, film and television in jobs pay higher wages in there than they do in the rest of the state.
Table 3 shows the total economic impact of the film and television industry in the Portland Metropolitan Area. The results reflect the employment, wages, and output of all industry segments, as well as some additional spending provided by visiting workers.
Figure 6: Portland Metro Percentage of Direct Impact
Out of State Production Total Industry (all segments)

Northwest Economic Research Center P a g e | 24
Table 3: Total Portland Metro Impacts (All Segments)
Impact Summary
Impact Type Employment Labor Income Total Value
Added Output
Direct Effect 4,288 $158,654,073 $274,062,717 $521,984,088 Indirect Effect 1,745 73,934,997 119,282,887 193,041,795
Induced Effect 1,880 81,919,601 142,654,271 226,735,770 Total Effect 7,913 $314,508,671 $535,999,875 $941,761,653
4,130
873
249
242
224
130
99
83
66
65
Motion picture and video industries
Radio and television broadcasting
Spectator sports companies
Real estate establishments
Food services and drinking places
Employment services
Offices of physicians, dentists, and otherhealth practitioners
Private hospitals
Nondepository credit intermediation andrelated activities
Nursing and residential care facilities Total Employment
Figure 7 shows the ten industries most affected by the film and television industry by employment. The industries that benefit most from expansions in the television and film industry are similar to those in the Oregon impacts section.
NERC estimates that the film and television industry directly generates 4,288 jobs and has a total impact of 7,913 jobs. The total gross economic output of the industry is $941,761,653 and creates $314,508,671 in total employee compensation.
Figure 7: Top Ten Effected Industries by Employment

Northwest Economic Research Center P a g e | 25
Table 4: Total Portland Metro Impacts by Segment Portland Metro Indigenous Impacts
Impact Summary
Impact Type Employment Labor
Income Total Value
Added Output
Direct Effect 2,841 $63,898,993 $153,888,211 $286,416,160 Indirect Effect 739 28,756,328 50,857,578 79,989,433
Induced Effect 748 32,621,534 56,805,284 90,288,627
Total Effect 4,328 $125,276,857 $261,551,073 $456,694,220
Portland Metro Television and Broadcasting
Impact Summary
Impact Type Employment Labor
Income Total Value
Added Output
Direct Effect 789 $63,375,240 $67,952,391 $169,231,488 Indirect Effect 834 38,518,455 56,646,257 94,526,123
Induced Effect 824 35,912,012 62,540,174 99,398,142 Total Effect 2,447 $137,805,708 $187,138,823 $363,155,753
Portland Metro Out of State
Impact Summary
Impact Type Employment Labor
Income Total Value
Added Output
Direct Effect 658 $31,379,839 $52,222,114 $66,336,440
Indirect Effect 171 6,660,212 11,779,051 18,526,239 Induced Effect 307 13,386,054 23,308,812 37,049,000
Total Effect 1,136 $51,426,105 $87,309,977 $121,911,679
Table 4 breaks out the total Oregon impacts by the three industry segments. As shown above, out of state production represents a large proportion of the Portland-based industry. The data also suggests that the Portland Metro film and video production jobs pay higher wages. Aside from the larger budgets of out of state productions, the experience and skill required to work on a network, cable, or major film set is higher. The Grimm producers stated that even experienced workers need to be trained to adapt to the speed and quality required for major productions.
Northwest Economic Research Center P a g e | 26
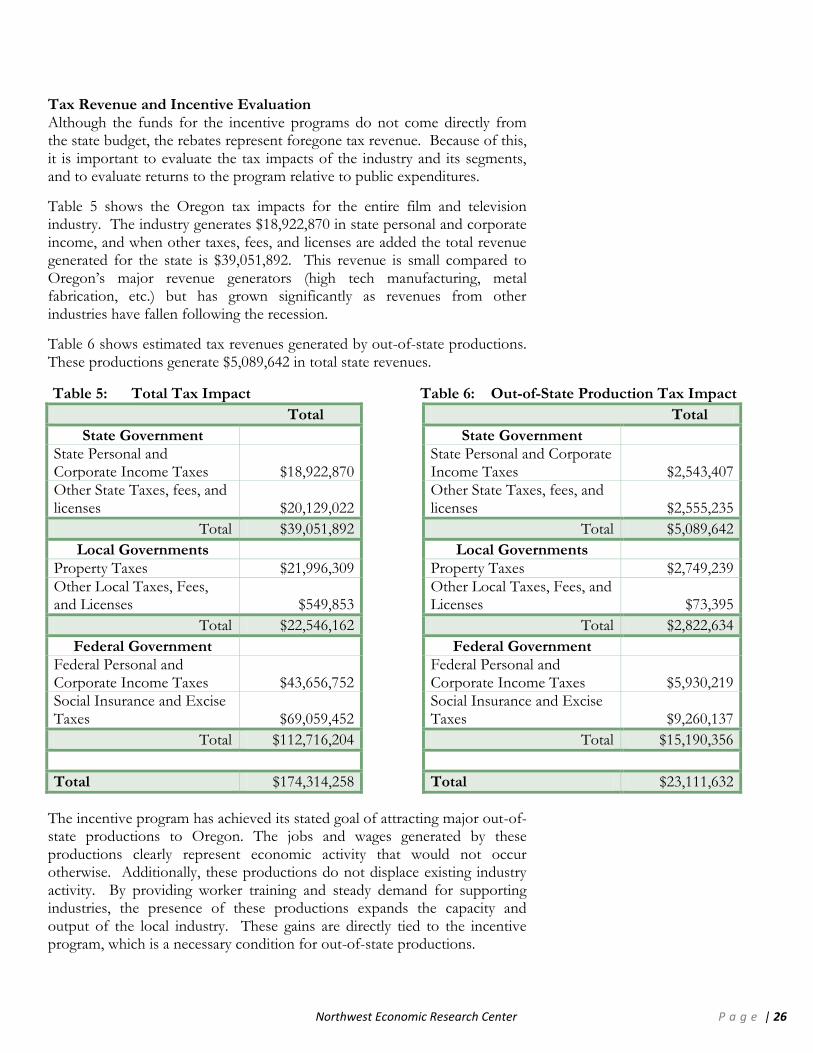
Tax Revenue and Incentive Evaluation Although the funds for the incentive programs do not come directly from the state budget, the rebates represent foregone tax revenue. Because of this, it is important to evaluate the tax impacts of the industry and its segments, and to evaluate returns to the program relative to public expenditures.
Table 5 shows the Oregon tax impacts for the entire film and television industry. The industry generates $18,922,870 in state personal and corporate income, and when other taxes, fees, and licenses are added the total revenue generated for the state is $39,051,892. This revenue is small compared to Oregon’s major revenue generators (high tech manufacturing, metal fabrication, etc.) but has grown significantly as revenues from other industries have fallen following the recession.
Table 6 shows estimated tax revenues generated by out-of-state productions. These productions generate $5,089,642 in total state revenues.
The incentive program has achieved its stated goal of attracting major out-of-state productions to Oregon. The jobs and wages generated by these productions clearly represent economic activity that would not occur otherwise. Additionally, these productions do not displace existing industry activity. By providing worker training and steady demand for supporting industries, the presence of these productions expands the capacity and output of the local industry. These gains are directly tied to the incentive program, which is a necessary condition for out-of-state productions.
Table 5: Total Tax Impact
Total
State Government State Personal and Corporate Income Taxes $18,922,870 Other State Taxes, fees, and licenses $20,129,022
Total $39,051,892
Local Governments
Property Taxes $21,996,309
Other Local Taxes, Fees, and Licenses $549,853
Total $22,546,162
Federal Government Federal Personal and Corporate Income Taxes $43,656,752 Social Insurance and Excise Taxes $69,059,452
Total $112,716,204
Total $174,314,258
Table 6: Out-of-State Production Tax Impact
Total
State Government State Personal and Corporate Income Taxes $2,543,407 Other State Taxes, fees, and licenses $2,555,235
Total $5,089,642
Local Governments
Property Taxes $2,749,239
Other Local Taxes, Fees, and Licenses $73,395
Total $2,822,634
Federal Government Federal Personal and Corporate Income Taxes $5,930,219 Social Insurance and Excise Taxes $9,260,137
Total $15,190,356
Total $23,111,632
Northwest Economic Research Center P a g e | 27
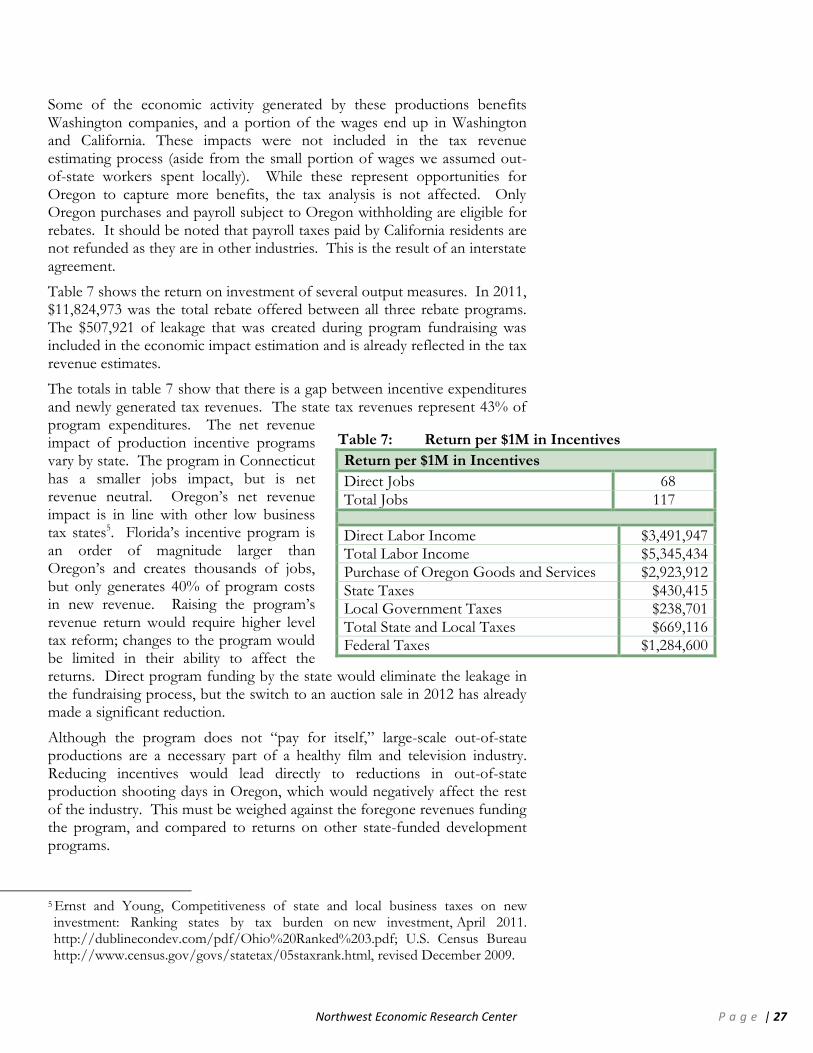
Table 7: Return per $1M in Incentives
Return per $1M in Incentives
Direct Jobs 68
Total Jobs 117
Direct Labor Income $3,491,947 Total Labor Income $5,345,434
Purchase of Oregon Goods and Services $2,923,912
State Taxes $430,415 Local Government Taxes $238,701
Total State and Local Taxes $669,116 Federal Taxes $1,284,600
Some of the economic activity generated by these productions benefits Washington companies, and a portion of the wages end up in Washington and California. These impacts were not included in the tax revenue estimating process (aside from the small portion of wages we assumed out-of-state workers spent locally). While these represent opportunities for Oregon to capture more benefits, the tax analysis is not affected. Only Oregon purchases and payroll subject to Oregon withholding are eligible for rebates. It should be noted that payroll taxes paid by California residents are not refunded as they are in other industries. This is the result of an interstate agreement.
Table 7 shows the return on investment of several output measures. In 2011, $11,824,973 was the total rebate offered between all three rebate programs. The $507,921 of leakage that was created during program fundraising was included in the economic impact estimation and is already reflected in the tax revenue estimates.
The totals in table 7 show that there is a gap between incentive expenditures and newly generated tax revenues. The state tax revenues represent 43% of program expenditures. The net revenue impact of production incentive programs vary by state. The program in Connecticut has a smaller jobs impact, but is net revenue neutral. Oregon’s net revenue impact is in line with other low business tax states5. Florida’s incentive program is an order of magnitude larger than Oregon’s and creates thousands of jobs, but only generates 40% of program costs in new revenue. Raising the program’s revenue return would require higher level tax reform; changes to the program would be limited in their ability to affect the returns. Direct program funding by the state would eliminate the leakage in the fundraising process, but the switch to an auction sale in 2012 has already made a significant reduction.
Although the program does not “pay for itself,” large-scale out-of-state productions are a necessary part of a healthy film and television industry. Reducing incentives would lead directly to reductions in out-of-state production shooting days in Oregon, which would negatively affect the rest of the industry. This must be weighed against the foregone revenues funding the program, and compared to returns on other state-funded development programs.
5 Ernst and Young, Competitiveness of state and local business taxes on new investment: Ranking states by tax burden on new investment, April 2011. http://dublinecondev.com/pdf/Ohio%20Ranked%203.pdf; U.S. Census Bureau http://www.census.gov/govs/statetax/05staxrank.html, revised December 2009.
Northwest Economic Research Center P a g e | 28
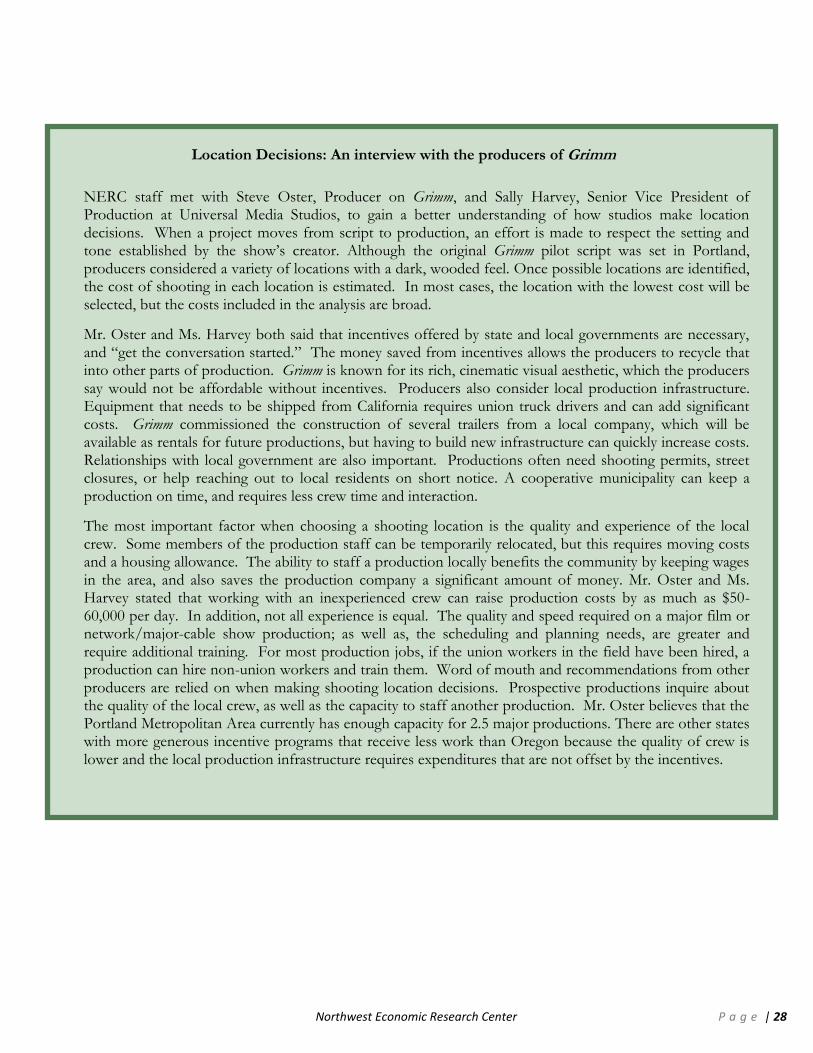
Location Decisions: An interview with the producers of Grimm
NERC staff met with Steve Oster, Producer on Grimm, and Sally Harvey, Senior Vice President of Production at Universal Media Studios, to gain a better understanding of how studios make location decisions. When a project moves from script to production, an effort is made to respect the setting and tone established by the show’s creator. Although the original Grimm pilot script was set in Portland, producers considered a variety of locations with a dark, wooded feel. Once possible locations are identified, the cost of shooting in each location is estimated. In most cases, the location with the lowest cost will be selected, but the costs included in the analysis are broad.
Mr. Oster and Ms. Harvey both said that incentives offered by state and local governments are necessary, and “get the conversation started.” The money saved from incentives allows the producers to recycle that into other parts of production. Grimm is known for its rich, cinematic visual aesthetic, which the producers say would not be affordable without incentives. Producers also consider local production infrastructure. Equipment that needs to be shipped from California requires union truck drivers and can add significant costs. Grimm commissioned the construction of several trailers from a local company, which will be available as rentals for future productions, but having to build new infrastructure can quickly increase costs. Relationships with local government are also important. Productions often need shooting permits, street closures, or help reaching out to local residents on short notice. A cooperative municipality can keep a production on time, and requires less crew time and interaction.
The most important factor when choosing a shooting location is the quality and experience of the local crew. Some members of the production staff can be temporarily relocated, but this requires moving costs and a housing allowance. The ability to staff a production locally benefits the community by keeping wages in the area, and also saves the production company a significant amount of money. Mr. Oster and Ms. Harvey stated that working with an inexperienced crew can raise production costs by as much as $50-60,000 per day. In addition, not all experience is equal. The quality and speed required on a major film or network/major-cable show production; as well as, the scheduling and planning needs, are greater and require additional training. For most production jobs, if the union workers in the field have been hired, a production can hire non-union workers and train them. Word of mouth and recommendations from other producers are relied on when making shooting location decisions. Prospective productions inquire about the quality of the local crew, as well as the capacity to staff another production. Mr. Oster believes that the Portland Metropolitan Area currently has enough capacity for 2.5 major productions. There are other states with more generous incentive programs that receive less work than Oregon because the quality of crew is lower and the local production infrastructure requires expenditures that are not offset by the incentives.
Northwest Economic Research Center P a g e | 29
Related Industries
This report has used a narrow definition of the film and television industry in Oregon, but there are many related industries that rely on these productions for significant portions of their business. The Economic Impact Section estimated the effect on other closely linked industries. The following is a closer look at the relationship between the film and television industry and employment and wages in other key industries.
Independent Artist, Writers, and Performers The film and television industry relies on a large group of writers and performers that produce and deliver content, but are not permanently affiliated with any one production company. Those who are not able to make enough money with a regularly occurring, long-term job will be involved in multiple projects during the course of a year. These jobs may fall outside of the industry. These outside work opportunities keep skilled workers in Oregon between productions, anchoring the labor pool.
Performing Arts Companies Performing arts companies include a broad range of performance types including live theater, dance, and musical performances. As opposed to independent artists, writers, and performers, this industry offers steadier, long-term employment. While the industries are not directly connected, there is overlap between the technical skills needed in each field. Set designers and constructors and sound recorders are two examples of skilled workers that could move between these industries. Employment data shows a strong correlation between the industries. This is most likely due to the similar spot occupied by different entertainment activities in people’s budgets. During times of economic hardship, entertainment expenditures are reduced, which affects both industries.
Agents and Managers Agents and managers provide key support services to members of the industry. An expansion of the film and television industry in Oregon should lead directly to increased demand for representation services. Since 2004, this industry has experienced major growth and did better during the recession than even the film and television industry. The agents and managers numbers include representatives for professional athletes and other public figures.
Northwest Economic Research Center P a g e | 30
Table 8: Digital Artists and Animators
Year Employment Mean Wages
Location Quotient
2010 360 $63,180 1.8
2011 430 $61,210 2.0
Commercial and Industrial Machinery Rental No large-scale sound stages or production facilities exist in Oregon. This means that productions require equipment to be transported to the shooting location, often by a rental company. Grimm producers cited the high cost of shipping equipment from Los Angeles as a deterrent to locating a production in an area without the necessary equipment and infrastructure. Production companies prefer to rent equipment from local sources as a cost-saving measure. Because of this, significant economic activity is created in this sector. This industry is notoriously volatile and is subject to changes in the overall business cycle. While the film and television industry contributes to this, it is most likely due to broader economic conditions. Machine rental is most likely acts as an excellent leading economic indicator.
Digital Animation California, Florida, Louisiana, and Utah have all identified digital animation as a potential growth industry and have actively recruited digital animation companies and supported training programs. Digital Animation is closely associated with the video game industry, which has experienced significant growth in the last decade and faired relatively well during the recent recession. There is also crossover between digital animation and the growing mobile applications development industry.
This industry is relatively new, and not yet fully captured by one NAICS code. Digital animators are lumped in with software developers. The BLS Occupational Employment Statistics publish data on Multimedia Artists and Animators. Oregon jobs in this area are heavily concentrated in the Portland Metropolitan Area. There is a small group of professionals that fall into this category in the Eugene-Springfield Metropolitan Area (70 in 2011), but the location quotient (2.25) is higher than Portland Metro. Location Quotient = MSA Employment in Industry
MSA Total Employment US Employment in Industry
US Total Employment Additionally the mean wage for animators in Eugene-Springfield is $60,060 which is only slightly less than Portland Metro’s 2011 mean wage ($61,210). Data reporting in this category changed in 2010 so the historical record is limited. Table 8 shows occupation data for the Portland Metro Area.
Northwest Economic Research Center P a g e | 31
A location quotient of 2.0 in the Portland Metropolitan Area reflects an occupational concentration twice the national average.
Portland and Eugene have a head start on the rest of the country in this field. In order to maintain this advantage, the industry must be able to supply steady, high-wage jobs to young developers. Other states are using public money to incentivize the location of new animation companies, and have supported the creation of animation programs at public universities. Because the industry is so young, little research has been done on the long-term benefits created by the digital animation industry. The relatively small amount of private investment capital in Oregon means that public or quasi-public bodies may need to support new endeavors. While this industry is still relatively small, public development companies should track its growth and investigate methods for providing support services.
Northwest Economic Research Center P a g e | 32
Conclusion
Our analysis reveals a film and television industry that is growing, despite continued, broad economic weakness in Oregon. The employment and wage gains in Oregon are concentrated in the Portland Metropolitan Area, which has experienced 13% growth in employment in the film and video distribution subsector since 2009. These gains are motivated in part by the out-of-state productions that come to Oregon because of tax incentives and the experienced labor pool. This growth further establishes the industry, by continuing to offer chances for employment to a mobile pool of skilled workers. If production activity falls below a certain threshold, workers will leave for places with a more stable labor market. This will hurt the industry in the present, and inhibit future recovery. Oregon and the Portland Metropolitan Area were able to not only maintain but grow the industry, meaning the skilled workforce is retained and capable of responding to opportunities as the broader economy continues to recover.
The incentive programs have been successful in creating jobs, but have not generated enough tax revenue to offset the costs. The return to state revenues from these programs is in line with states with incentive programs and low tax burdens. Increasing the tax revenue returns from the program would likely require large-scale tax reform, and cannot be completely fixed by adjusting the program itself. The revenue leakage created by the raising of program funds was shrunk in 2012 by converting the sale of tax breaks to an auction format. This leakage could be eliminated by direct state funding of the program.
OR Film keeps a list of productions that have inquired about shooting in Oregon, but have broken off discussion when incentive funds were no longer available. An expansion of the program could incentivize more out-of-state production in Oregon as long as the other factors considered by production companies were able to expand at the same rate. NERC heard from the producers of Grimm that hiring and training inexperienced workers adds significant costs to production. Having to transport equipment and staff to a shooting location is also a major disincentive. OR Film tracks local companies that have stepped in to satisfy production needs locally from lighting to greenery to trailer manufacture. An expansion of the incentive program would need to proceed at a rate that allows local capacity to expand proportionately. If an incentive increase is phased in too quickly, a higher proportion of the new jobs will go to out-of-state workers and demand for goods and services that cannot be satisfied locally will lead to outside purchases.
Northwest Economic Research Center P a g e | 33
When considering the job creation motivated by the incentives, it is important to remember that working on a major film or network/major cable television show provides high-level training. Oregon workers with experience on a major production bring those skills to the local market, and also provide the necessary human capital for future productions.
Expanding the incentive programs to attract more out-of-state productions would create more jobs and further support a growing industry. Any potential expansion should be phased in slowly in order to allow supporting industries in Oregon scale up, and the foregone state revenues dedicated to funding the program should be compared to other potential expenditures. Equally important is a commitment to the program in the long term. Out-of-State productions will not come to Oregon without incentives. The collapse of the industry in the mid-2000s shows that these productions can disappear with little prior warning. Local supporting industries that become reliant on out-of-state productions will need some assurance that state support for the industry will continue before scaling up.