Embed Size (px)
Citation preview

HAL Id: tel-02064593https://tel.archives-ouvertes.fr/tel-02064593
Submitted on 16 May 2019
HAL is a multi-disciplinary open accessarchive for the deposit and dissemination of sci-entific research documents, whether they are pub-lished or not. The documents may come fromteaching and research institutions in France orabroad, or from public or private research centers.
L’archive ouverte pluridisciplinaire HAL, estdestinée au dépôt et à la diffusion de documentsscientifiques de niveau recherche, publiés ou non,émanant des établissements d’enseignement et derecherche français ou étrangers, des laboratoirespublics ou privés.
Contribution à la parole augmentée : production etsurdité
Denis Beautemps
To cite this version:Denis Beautemps. Contribution à la parole augmentée : production et surdité. Sciences del’information et de la communication. Université de Grenoble, 2015. �tel-02064593�

1
UNIVERSITE DE GRENOBLE
THESE
Pour obtenir le grade de
HABILITATION A DIRIGER DES RECHERCHES
DE L’UNIVERSITE DE GRENOBLE
Spécialité : Signal, Image, Parole, Télécom
Arrêté ministériel : 7 août 2006
Soutenue le 1er Avril 2015 par
Denis Beautemps
Contribution à la parole augmentée : production et surdité
Jury :
Madame Jacqueline Leybaert, Président du Jury, Professeur, Université Libre de Bruxelles
Madame Martine Adda-Decker, Rapporteur, Directeur de Recherche au CNRS
Monsieur Christophe d’Alessandro, Rapporteur, Directeur de Recherche au CNRS
Monsieur Gang Feng, Rapporteur, Professeur des Universités, Grenoble-INP
Monsieur Sébastien Schmerber, Examinateur, Professeur des Universités-Praticien Hospitalier,
CHU de Grenoble
Madame Régine André-Obrecht, Examinateur, Professeur des Universités, Université de
Toulouse III

2

3
Table des matières
Liste des abréviations…………………………………………………………………………..5
INTRODUCTION ...................................................................................................................... 7
Chapitre I - Etude de la production du Cued Speech ............................................................... 11
Introduction .............................................................................................................................. 11
I.1 Résultats sur la coordination oro-bracho-faciale ................................................................ 13
I.2 Perception de l’anticipation de la main ............................................................................... 18
I.3 Bilan .................................................................................................................................... 19
Chapitre II - Transcodage entre espaces visuel et audio pour le Cued Speech ........................ 21
II.1 Contexte du projet TELMA de Téléphonie à l’usage des malentendants ......................... 22
II. 2 Reconnaissance du Cued Speech ...................................................................................... 24
II.2.1 Méthodes de fusion ......................................................................................................... 24
II.2.2. Résultats par application de la méthode de fusion ID ................................................... 25
II.2.3. Résultats par application de la méthode de fusion IS .................................................... 26
II.3. Conversion audio vers le Cued Speech : mapping des espaces ........................................ 27
Chapitre III – Parole, surdité et audition réhabilitée ................................................................ 37
Introduction .............................................................................................................................. 37
III.1 Contexte du projet PLASMODY ..................................................................................... 37
III.2 Etude des aspects physique en production de parole ....................................................... 38
III.2.1- Etude du comportement des cordes vocales ................................................................ 39
III.2.2- Etude de l’effet du mouvement des parois du conduit vocal ....................................... 42
III.3 Close shadowing et collaboration audiovisuelle .............................................................. 44
III.4 Relations perceptuo-motrices et implants cochléaires ..................................................... 45
Chapitre IV : Projet de recherche - Adaptabilité en parole, variabilité et plasticité ................ 47
A. Articulation labiale complétée : du mapping à la reconnaissance ....................................... 49
B. Implant cochléaire et fonctionnalités audio-visuelles.......................................................... 52
C. Rhébotique : de la syllabe au discours ................................................................................. 53
C.1. Méthodologie .................................................................................................................... 55
C.2. Axe 1 - Empathie, adhésion, interaction en discours ....................................................... 55
C.3. Axe 2- Intelligibilité, multimodalité et complémentarité en parole ................................. 56
CONCLUSION ........................................................................................................................ 59
Références bibliographiques .................................................................................................... 63
Annexe : 7 publications significatives ..................................................................................... 67

4

5
Liste des abréviations
ACP Analyse en Composantes Principales
ALLSHCS Pôle de recherche « Art, Lettres, Langues, Sciences Humaines Cognitives et
Sociales »
ATER Attaché Temporaire d’Enseignement et de Recherche
ATR Advanced Telecommunications Research Institute International
ATT Axe transversal transformant
BQR Bonus Qualité Recherche de l’INPG
BEDEI Banc Expérimental Dédié à l’Enregistrement In vivo
CAC Conseil Académique
CerCo Centre de Recherche Cerveau & Cognition
CHU Centre Hospitalier Universitaire
CODIR Conseil des Directeurs d’unité
COMUE Communauté d’Universités et Etablissements, site Grenoblois
CR Chargé de Recherche
CRISSP Cognitive Robotics, Interaction & Speech Processing
CS Cued Speech
DCT Discrete Cosine Transform
DEA Diplôme d’Etude Approfondie
DPC Département Parole-Cognition
DR Directeur de Recherche
EDISCE École doctorale Ingénierie pour la santé la Cognition et l'Environnement
EGG Electo GlottoGraphe
EEATS Ecole doctorale « Electronique, Electrotechnique, Automatique, Traitement du
Signal »
EM Algorithme Expectation-Maximization
ENSE3 Ecole d'ingénieurs en énergie eau et environnement
ENSERG Ecole Nationale Supérieure d'Electronique et de Radioélectricité de Grenoble
EVA Evaluation Vocale Assistée
GIPSA-lab Laboratoire Grenoble, Image, Parole, Signal, Automatique
GMM Gaussian Mixture Model
HMM Hidden Markov Model
ICP Institut de la Communication Parlée
ID Modèle de fusion à Identification Directe
IE Ingénieur d’Etude
IR Ingénieur de Recherche
IS Modèle de fusion à Identification Séparée
INA Institut National de l’Audiovisuel
INS2I CNRS - Institut des Sciences de l’Information et de leurs interactions
INSHS CNRS - Institut des Sciences Humaines et Sociales
INSIS CNRS - Institut des Sciences de l’Ingénierie et des Systèmes
IUT Institut Universitaire de Technologie
K-MEANS Algorithme k-means ou k-moyennes
LaBRI Laboratoire Bordelais de Recherche en Informatique
LIG Laboratoire d’Informatique de Grenoble
LIMSI Laboratoire d’Informatique pour la Mécanique et les Sciences de l’Ingénieur

6
LLSH Ecole Doctorale « Langues Littératures et Sciences Humaines »
LPC Langue Française Parlée Complétée
LPNC Laboratoire de Psychologie et NeuroCognition
LSP Line Spectral Pairs
LTCI Laboratoire Traitement et Communication de l’Information
MAGIC Machines parlantes, Gestes oro-faciaux, Interaction Face-à-face,
Communication augmentée
MCF Maître de Conférences
MFCC Mel frequency Cepstral Coefficients
MPACIF Equipe Machines Parlantes, Communication, Interaction Face-à-Face
MSTIC Pôle de recherche « Mathématiques, Sciences et technologies de l'information et
de la communication »
ORL Oto-Rhino-Laryngologie
PFE Projet de Fin d’Etude
PHELMA Ecole nationale supérieure de PHysique, ELectronique, Matériaux
PUPH Professeur des Universités Praticien Hospitalier
ROI Region of Interest
RARE Rhétorique de l’Antiquité à la Révolution
MD Modèle de fusion par recodage dans la Modalité Dominante
RM Modèle de fusion par Recodage Moteur
RD Recodage dans la Modalité Dominante
SDV Sciences de la Vie
SPI Sciences pour l’Ingénieur
STIC Les Sciences et Technologies de l'Information et de la Communication
UJF Université Joseph Fourier
UGA Université Grenoble-Alpes

7
INTRODUCTION
Mon cadre de recherche est le domaine de la communication parlée augmentée. La
communication augmentée consiste à enrichir les signaux de la communication afin d’améliorer
leur robustesse en condition de communication adverse, de s’adapter aux capacités de
communication, ou au style de communication des interlocuteurs par exemple (confidentialité,
situation face à face,…). Ce programme s’est appuyé sur des travaux théoriques et applicatifs
innovants dans le domaine de l’analyse/modélisation des productions multimodales de l’activité
langagière et de leur perception à partir d’enregistrement de corpus articulatoires, audio et
visuels.
Citons tout d’abord l’analyse/modélisation statistique qui appliquée à la géométrie 2D du
conduit vocal permet de capturer les traces non visibles ou partiellement visibles de l’activité
motrice portée par les articulateurs de la parole (lèvres, langue, vélum par exemple) et réalise
le lien (l’interface) avec l’activité labiale et les caractéristiques acoustiques associées. Les
résultats ont fait l’objet d’une publication à la revue internationale avec comité de lecture
Journal of The Acoustical Society of America en 2001 (Beautemps et al., 2001, voir aussi
Figure-1).
Figure-1 : Système d’acquisition de données articulatoires à gauche et analyse de l’explication de la
variance à droite. Illustrations issues en partie de Beautemps et al., 2001 et de Sacher et al., 2008.
Cette approche a permis d’alimenter un volet de travaux en modélisation oro-faciale 3D
dans le cadre de l’activité sur les « têtes parlantes virtuelles et la synthèse audiovisuelle de la
parole » et à la modélisation de la collaboration bracho – faciale (Figure-1) telle qu’elle apparaît
naturellement dans la « Langue Française Parlée Complétée » (version en langue Française du
Cued Speech, système de mouvements codés de la main en appoint du mouvement des lèvres)
dans la communication avec les personnes sourdes (projet RNRT ARTUS, cadre télévisuel -

8
chaîne ARTE-, projet TELMA de téléphonie à l’usage des malentendants - ANR, dont France
Telecom division R&D a été partenaire ainsi que le CHU de Grenoble pour le lien avec les
personnes sourdes).
Les résultats en modélisation ont permis des avancées novatrices dans le domaine de la
synthèse audio-visuelle de la parole avec l’intégration d’une nouvelle modalité, le geste codeur,
en reconnaissance labiale ainsi qu’en mapping entre espaces audio et visuels. Ils ont fait l’objet
de six contributions dans les revues prestigieuses du domaine (Journal of the Acoustical Society
of America, Speech Communication, IEEE Signal Processing Letters) et d’une contribution qui
a été soumise récemment auprès de la revue internationale Computer Speech and Language.
Les travaux en multimodalité ont permis l’ouverture d’un nouveau volet de recherche sur
la parole en situation de surdité profonde remédiée par l’implant cochléaire (projet ANR /
PLASMODY). Les premiers résultats en perception viennent de faire l’objet d’une publication
à la revue en ligne internationale avec comité de lecture Frontiers in Psychology. Les travaux
en production font quant à eux l’objet d’une autre publication soumise à la revue internationale
avec comité de lecture Journal of the Acoustical Society of America.
Les travaux dans ces différents volets ont pu être fructueux grâce au concours de trois thèses
soutenues que j’ai encadrées principalement et de deux thèses actuellement en cours, de
plusieurs projets contractualisés localement (BQR), auprès de la région Rhône-Alpes, au CNRS
ou à l’ANR et d’une alliance pluri-disciplinaire alliant domaines d’expertise en traitement du
Signal, Sciences Cognitives, Sciences du Langage et en Physique pour les Sciences de
l’Ingénieur. Enfin, ces travaux n’auraient pu être menés sans le recours aux plateformes
expérimentales de l’Institut de la Communication Parlée puis celles de GIPSA-lab pour
l’enregistrement des corpus et les diverses expérimentations.
La suite du document est divisé en quatre chapitres présentant chacun une synthèse de mes
travaux de recherche avec renvoi à des publications dans des revues ou conférences
internationales avec comité de lecture du domaine (en annexe). Le premier chapitre est dédié à
l’étude de la production du Cued Speech dans sa version en langue Française (code LPC), au
centre de la thèse de Virginie Attina. Le second chapitre a trait au transcodage audio-visuel
pour le Cued Speech qui regroupe les travaux en reconnaissance visuelle au cœur de la thèse de
Noureddine Aboutabit et du projet ANR TELMA ainsi que les travaux sur le mapping audio-
visuel au cœur de la thèse de Zuheng Ming. Enfin un troisième chapitre est dédié à la production
et perception de la parole dans le cadre de la surdité et de l’audition réhabilitée qui sont l’objet
de deux thèses en cours de Lucie Scarbel et de Louis Delebecque dans le contexte du projet

9
ANR PLASMODY et du projet Région Rhône-Alpes Cibles 2011. Enfin le dernier chapitre
présente des enjeux de prospective dans le cadre de mon projet de recherche.

10
11
Chapitre I - Etude de la production du Cued Speech
Introduction
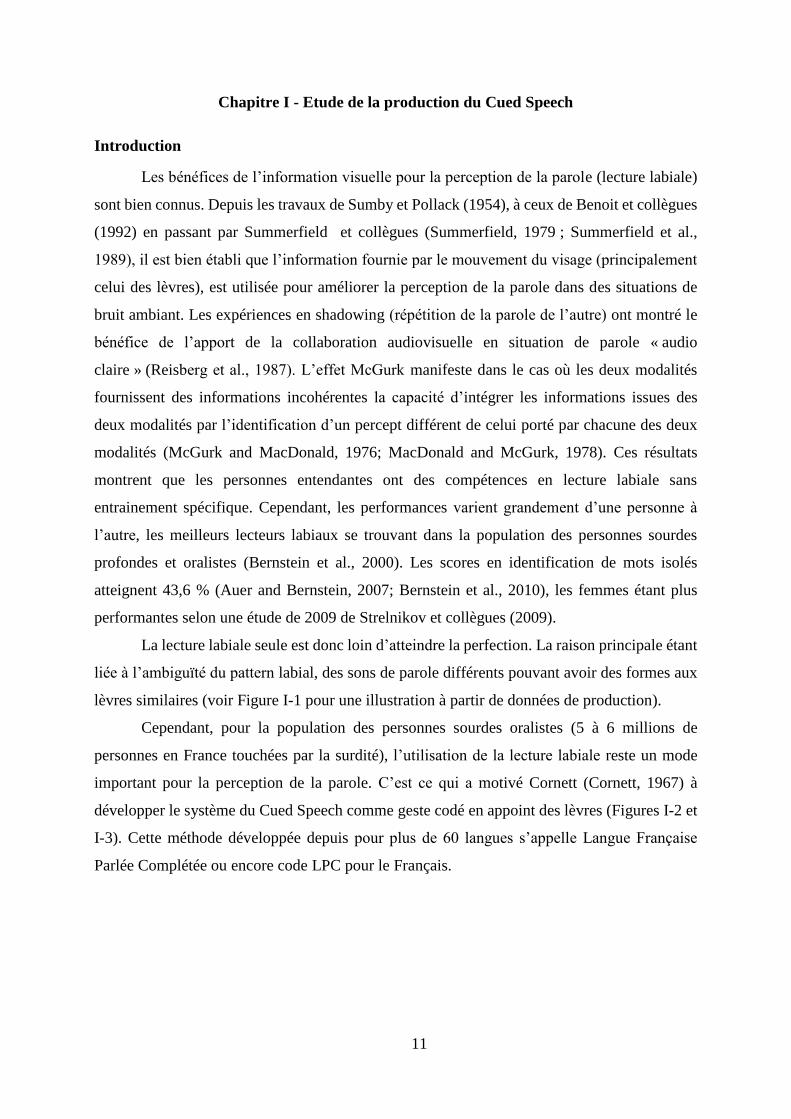
Les bénéfices de l’information visuelle pour la perception de la parole (lecture labiale)
sont bien connus. Depuis les travaux de Sumby et Pollack (1954), à ceux de Benoit et collègues
(1992) en passant par Summerfield et collègues (Summerfield, 1979 ; Summerfield et al.,
1989), il est bien établi que l’information fournie par le mouvement du visage (principalement
celui des lèvres), est utilisée pour améliorer la perception de la parole dans des situations de
bruit ambiant. Les expériences en shadowing (répétition de la parole de l’autre) ont montré le
bénéfice de l’apport de la collaboration audiovisuelle en situation de parole « audio
claire » (Reisberg et al., 1987). L’effet McGurk manifeste dans le cas où les deux modalités
fournissent des informations incohérentes la capacité d’intégrer les informations issues des
deux modalités par l’identification d’un percept différent de celui porté par chacune des deux
modalités (McGurk and MacDonald, 1976; MacDonald and McGurk, 1978). Ces résultats
montrent que les personnes entendantes ont des compétences en lecture labiale sans
entrainement spécifique. Cependant, les performances varient grandement d’une personne à
l’autre, les meilleurs lecteurs labiaux se trouvant dans la population des personnes sourdes
profondes et oralistes (Bernstein et al., 2000). Les scores en identification de mots isolés
atteignent 43,6 % (Auer and Bernstein, 2007; Bernstein et al., 2010), les femmes étant plus
performantes selon une étude de 2009 de Strelnikov et collègues (2009).
La lecture labiale seule est donc loin d’atteindre la perfection. La raison principale étant
liée à l’ambiguïté du pattern labial, des sons de parole différents pouvant avoir des formes aux
lèvres similaires (voir Figure I-1 pour une illustration à partir de données de production).
Cependant, pour la population des personnes sourdes oralistes (5 à 6 millions de
personnes en France touchées par la surdité), l’utilisation de la lecture labiale reste un mode
important pour la perception de la parole. C’est ce qui a motivé Cornett (Cornett, 1967) à
développer le système du Cued Speech comme geste codé en appoint des lèvres (Figures I-2 et
I-3). Cette méthode développée depuis pour plus de 60 langues s’appelle Langue Française
Parlée Complétée ou encore code LPC pour le Français.

12
Figure I-1 : Dendrogramme des distances entre 1167 réalisations de voyelles du Français
produites par une locutrice calculées à partir des paramètres extraits du contour interne des lèvres
(étirement, ouverture, aire interolabiale). En se fixant un seuil à 4, on peut distinguer sur cette figure
trois groupes de voyelles (visèmes) pour le Français à l’intérieur desquels les formes aux lèvres sont
similaires: le groupe v1 [ø] des voyelles fermées et arrondies aux lèvres, le groupe v2
ã] des voyelles arrondies aux lèvres et mi-ouvertes, le groupe v3 ] des voyelles
non arrondies et ouvertes aux lèvres. A noter que l’appartenance de la voyelle [] au groupe v3 est
vraisemblablement due à une opposition réduite avec ] (voir Carton F., 1974 ; Durand et al., 2009).
Figure issue de la thèse de Noureddine Aboutabit (2007).
Dans le système du Cued Speech la main présentant une configuration particulière vue de
dos (parmi 8 pour le Français) pour indiquer la consonne vient pointer du doigt une position
précise (parmi 5 pour le Français) sur le visage, à côté ou à la base du cou pour spécifier la
voyelle. Chaque configuration, respectivement position de la main est utilisée pour un groupe
de consonnes respectivement voyelles, correspondant à des phonèmes facilement
discriminables aux lèvres. Inversement, des phonèmes ayant des formes aux lèvres similaires
(les sosies labiaux) correspondent en Cued Speech à des configurations de main différentes s’il
s’agit de consonnes ou des positions différentes s’il s’agit de voyelles. D’une certaine manière,
c’est la vue conjointe de la main et des lèvres qui permet la perception d’un phonème, chacune
de ces deux composantes portant une partie complémentaire de l’information. Ce système
particulièrement efficace permet la perception complète de la parole et pour les enfants sourds
l’utilisant depuis le plus jeune âge, des représentations complètes du système phonologique,

13
l’acquisition du langage avec des compétences en lecture et écriture comparables à des enfants
entendants (Leybaert et al., 2000).
Un grand nombre de travaux ont eu trait à l’efficacité du Cued Speech en perception mais
peu ont traité de la production, de son organisation, en particulier la coarticulation des
différentes composantes du Cued Speech.
Comment un système artificiel datant de 1967 pourrait-il encore avoir de l’intérêt dans les
années 2000 ? A part l’efficacité du Cued Speech pour l’acquisition d’un autre système artificiel
comme la lecture, il a été l’opportunité d’étudier la coordination main-lèvres au niveau
syllabique. Enfin, avec le développement grandissant des implants cochléaires, cette méthode
facilite d’une certaine manière l’accès à la modalité auditive (Leybaert & Lassasso, 2010) ce
qui renouvelle son intérêt.
Figure I-2 : Système LPC. Figure issue de
Beautemps et al., 2012
Figure I-3 :
Distribution des paramètres labiaux pour les voyelles
dans le cas où l’information manuelle LPC est donnée
(ici « side position »). La classification des voyelles est
alors possible. Données de la thèse de Noureddine
Aboutabit (2007).
I.1 Résultats sur la coordination oro-bracho-faciale
Nous présentons les travaux sur la coordination temporelle main-lèvres en relation avec
des indices de la production audio afin d’établir la nature de la structure syllabique en Cued
Speech en référence à la co-articulation de la parole. La production du code LPC n’avait jamais
été étudiée et nous l’avons fait par une technique de suivi des mouvements labiaux et de main
(Figure I-4) de quatre codeuses professionnelles à partir de l’enregistrement vidéo de séquences
de parole avec LPC. Les figures I-5 et I-6 sont des exemples de signaux extraits des images
vidéo par traitement d’image permettant de caractériser les différents déplacements.

14
Figure I-4 : Image d’une séquence extraite de l’enregistrement vidéo d’une codeuse portant un gant de
données pour capturer la flexion des segments de doigts sur lequel des pastilles de couleur sont utilisées
afin de faciliter l’extraction de leurs coordonnées par traitement d’images (utilisation d’artifice de
maquillage des lèvres pour les mêmes raisons). Les axes en rouge définissent le repère des coordonnées.
Figure issue de Attina et al., 2004.
Figure I-5. De haut en bas: Déplacements horizontal x (cm) et vertical y (cm) de la main définis à partir
de la pastille placée sur le dos (une augmentation de x indique un mouvement vers le côté droit du visage
du sujet, une augmentation de y indique un mouvement vers le bas du visage) ; l’aire intero-labiale (cm2)
et le signal audio correspondant pour une séquence [puppu]. Pour la main, M1 et M3, instants de début
de déplacement, M3 et M4 instants d’atteinte de la position cible. Pour les lèvres, L1, instant de début
d’ouverture et L2 instant d’atteinte du climax dans la voyelle. Pour le signal audio, A1 repère le début
du silence acoustique. Figure issue de Beautemps et al., 2012.

15
Figure I-6. De haut en bas: Déplacements horizontal x (cm) et vertical y (cm) de la main définis à partir
de la pastille placée sur le dos (une augmentation de x indique un mouvement vers le côté droit du visage
du sujet, une augmentation de y indique un mouvement vers le bas du visage) ; donnée brute montrant
la flexion du pouce issue du capteur du gant de données situé sur l’articulation du pouce et le signal
audio correspondant pour une séquence [mabuma]. Pour le pouce, D1 est l’instant de début du
mouvement de flexion et D2 la fin. Figure issue de Beautemps et al., 2012.
La figure I-5 montre un mouvement de main qui se caractérise par une phase de
transition entre M1 et M2 suivie d’une phase de tenue en position cible entre M2 et M3 et un
déploiement de la clé digitale de configuration de la main entre D1 et D2 (Figure I-6). Le
décours temporel de l’aire intero-labiale indique par sa valeur nulle une fermeture aux lèvres
durant la production de la consonne [p] puis une détente en L1 suivie d’une phase d’ouverture
atteignant son maximum en L2 dans le cas de la voyelle [a].
La Figure I-7 résume l’ensemble des résultats de co-production des différentes
composantes que son main, doigts, lèvres et son de parole impliquées dans la production de
parole avec LPC. Cette figure indique ainsi que dans une succession de syllabes de type
Voyelle-Consonne-Voyelle, la mise en forme de la clé digitale de la consonne se superpose au
geste de transition de main en direction de sa cible pour la voyelle finale. Le geste de formation
de la clé digitale dure en moyenne 171 ms et termine son déploiement en tout début de
consonne. La main commence son déplacement vers la cible correspondant à la voyelle finale
alors que la cible aux lèvres de la première voyelle est tout juste atteinte, et 205 à 239 ms avant

16
le début de la réalisation sonore de la consonne pour arriver à sa position 33 à 37 ms après le
début de cette consonne, et bien avant que la voyelle soit visible aux lèvres (de 172 à 256 ms).
Figure I-7 : Schéma montrant la coordination temporelle main-lèvre-son du code LPC ou Cued Speech
en Langue Française. Figure issue de Attina et al., 2004.
Le résultat majeur est que le geste de la main – contre toute attente – précède le geste des
lèvres d’environ 200 ms. Cette anticipation donne un rôle inattendu à la parole visible : celui
de venir désambiguïser le geste manuel, conçu au départ pour désambiguïser la parole. Des
règles de phasages entre main, lèvre et son de parole ont été déduites de ces résultats et utilisées
pour réaliser le premier prototype de synthèse du LPC à partir du texte dont l’utilisation ne
nécessite aucune phase d’entrainement par les utilisateurs (Attina et al., 2004).
Nous poursuivons actuellement ces travaux par l’étude de la robustesse de ce phasage à
partir de l’analyse de l’effet de focus sur la syllabe en utilisant les signaux issus d’un
enregistrement en optotrak 3D d’un sujet codeur en LPC (Figures I-8 et I-9). Les résultats non
encore publiés confirment le schéma de phasage et montrent l’allongement de la phase de tenue
de la main en cas de focus sur la syllabe (Figure I-10, voir tracés (b) et (c)) en lien avec
l’augmentation de la durée correspondante de la réalisation audio, renforçant au passage
l’hypothèse de l’ancrage du geste codeur sur la parole.

17
Figue I-8 : Dans la chambre anéchoïque de la
plateforme BEDEI de GIPSA-lab, sujet équipé
des diodes à émission Infra rouges du système
optotrak.
Figue I-9 : Séquence [sojuso] en condition normale de
production puis avec focus sur la syllabe cible [ju]. De
haut en bas le signal audio, les coordonnées X, Y et Z
de la diode située sur la lèvre inférieure.
Figue I-10 : Séquence [sojuso] avec geste codeur en Cued Speech (i) en haut tracé de la première
composante principale sur les coordonnées X,Y, Z d’une des diodes du dos de la main, (ii) en bas tracé
de la vitesse et de la vitesse filtrée pour la condition normale (à gauche (a) et (b)) et la condition de focus
(à droite (c) et (d)). On peut ainsi observer une tenue plus longue de la syllabe intermédiaire [ju] dans le
cas de la condition « focus » qui s’étend entre la coordonnée 60 et 90 en abscisse, unité d’échantillon à
la fréquence de 120 Hz (tracé (c)).
0 1 2 3 4 5 6 7 8 9-1
0
1
temps, en seconde
sig
nal audio
séquence : "so ju so" normale puis avec focus sur "ju"
0 1 2 3 4 5 6 7 8 9180
200
220
X,
en m
m
Lèvre inférieure
0 1 2 3 4 5 6 7 8 9170
175
180
185
Y,
en m
m
0 1 2 3 4 5 6 7 8 9-2940
-2930
-2920
Z,
en m
m
temps, en seconde

18
I.2 Perception de l’anticipation de la main
Nous venons de discuter comment le geste de main peut anticiper celui des lèvres. Nous
avons mené une expérience de perception pour étudier si cette avance est exploitée par les
personnes sourdes utilisant le LPC. L’organisation du « phasage » des composantes du LPC
observé en production nous a conduit à penser que pour la perception, l’information de main
disponible tout d’abord permet de prédire un ensemble réduit de deux ou trois voyelles puis la
sélection d’une seule parmi ces possibilités une fois l’information de voyelle visible aux lèvres.
Cette hypothèse a été testée à partir d’une expérience perceptive de dévoilement progressif de
la réalisation d’une syllabe CV. A partir d’enregistrements vidéo de séquences
« mutumaCVma » dans lesquelles la consonne pouvait être parmi [p, k, d, v] et la voyelle parmi
ø], le test consistait à identifier la consonne et la voyelle à partir du déroulement de la
vidéo jusqu’à un des six points de troncature choisi aléatoirement (voir Figure I-11 pour la
définition des points de troncature).
Figure I-11 : Exemple de points de troncature classés de 1 à 6 en allant de haut en bas et de gauche à
droite. Le premier point correspond au début du mouvement de la main, le 2nd au début de la mise en
forme de la clé digitale pour la consonne, au point 3 la main commence son déplacement, au point 4 la
clé est déployée et indique la position cible sur le visage qui est atteinte au point 5 alors que la consonne
est visible aux lèvres, enfin le point 6 où la voyelle est visible aux lèvres. Figure issue de la thèse de
Virginie Attina (2005).

19
Figure I-12 : Scores moyen pour les 16 sujets d’identification de la consonne, la voyelle, la consonne
classée selon son niveau de labialité, la voyelle classée selon son arrondissement, la clé et la position
manuelle obtenus aux différents points de troncature de séquences « mutumaCVma ». Figure issue de
la thèse de Virginie Attina (2005).
La Figure I-12 montre un saut à 85 % - 90 % au point de troncature 4 (où la clé digitale
est visible, la main indiquant la position cible de la voyelle, la consonne commençant à être
formée aux lèvres) pour l’identification de la clé respectivement la position de main, niveaux
qui ne seront atteints qu’au point de troncature 5 pour la consonne et point de troncature 6 pour
la voyelle une fois que l’information des lèvres aura été visible. Ces résultats montrent donc
que quand l’information de main est disponible en avance des lèvres, celle-ci est bien perçue et
exploitée par les sujets sourds utilisant le Cued Speech (voir le DEA de Florence Bouaouni et
la thèse de Virginie Attina, 2005).
I.3 Bilan
La coordination observée entre main, lèvres et son confirme selon nous, le principe d’une
avance de la main sur la réalisation sonore, programmée empiriquement par Duchnowski et
collègues (2000) dans leur système automatique d’affichage du Cued Speech. Cependant,
l’ampleur de ce comportement anticipatoire peut varier en fonction du locuteur, du débit de
parole, et d’autres paramètres de niveau segmental ou supra-segmental.
De l’ensemble de nos résultats, il ressort une vision chamboulée de la fonction du Cued
Speech (Beautemps et al., 2012). Dans le langage commun, le Cued Speech est considéré
comme un augment venant en appoint des lèvres. De l’étude de nos données, un schéma général
autre semble cependant se dessiner dans l’organisation temporelle lors de la production de

20
syllabes CV. La main atteint sa cible désignant la voyelle au début de la syllabe CV et la quitte
pour se déplacer vers la position correspondant à la syllabe suivante avant même que la cible
de la voyelle ait été atteinte aux lèvres. Cette anticipation de la main sur les lèvres est de plus
exploitée en perception.
Il semble donc que dans le Cued Speech, le contrôle de la production contraigne
l’organisation temporelle de la main et des lèvres. Ainsi le contrôle des contacts (ou cibles)
vocaliques manuels va se trouver en phase avec celui des contacts consonantiques visibles
(occlusions ou constrictions labiales). Ce phasage est assez précis pour que, quelles que soient
les variations de la durée de production de la syllabe CV, l’aboutissement de la détente du
système main-bras se produise dans la phase de tenue de l’attaque consonantique. Notre
hypothèse est que le système de Cornett a été recodé en termes neuralement compatibles pour
le contrôle des gestes des voyelles et des consonnes dans le LPC et la parole.
L’anticipation de la main sur les lèvres est importante à prendre en compte dans les systèmes
de synthèse de la parole intégrant le code LPC comme nous l’avons fait dans notre prototype,
et de façon plus large dans les traitements automatiques et les questions d’intégration
perceptive.
Comme je le précisais dans la partie introductive du mémoire, les résultats sur la production
ont pu être observés grâce à un banc expérimental précieux alliant vidéo (son et image) et gant
de données (système de capture du mouvement des doigts à l’aide de capteurs sensibles aux
flexions et placés dans un gant au niveau des articulations des main-segments de doigts et entre
segments de doigts). L’ajout du système de gant de données dans le banc expérimental audio-
visuel initial a nécessité une solution de synchronisation de l’ensemble.
Le gant de données a été acquis dans le contexte d’une collaboration en enseignement avec
l’atelier de réalité virtuelle de la filière ENSERG devenue PHELMA de Grenoble-INP, pour
lequel j’ai conçu un TP (allant de l’idée du sujet à sa conception en passant par le choix du
matériel et la rédaction d’un document de type « poly » destiné aux étudiants, expliquant des
éléments théoriques en analyse de données, ACP et classification gaussienne).
Contexte contractuel : projets « Jeune Equipe » du CNRS, programme « Cognitique » du
ministère ;
Liste des intervenants : Denis Beautemps (CR), Marie-Agnès Cathiard (MCF), Virginie Attina
(DEA puis Doctorat), Matthias Odisio (Doctorant), Florence Bouaouni (DEA), Pablo Sacher
(DEA), Coriandre Vilain (IR), Christophe Savariaux (IR), Sara Hamdouchi (PFE), Edwin
Corolleur (Stage d’étude d’ingénieur 2A, ENSE3), Simon Rousseau (Stage d’étude d’ingénieur
2A, PHELMA).

21
Chapitre II - Transcodage entre espaces visuel et audio pour le Cued Speech
Introduction
Le défi adressé par cet axe de recherche est d’estimer un ensemble de signaux
multimodaux à partir d’autres signaux collectés sur la production de parole produite par un sujet
pour un interlocuteur. Cette opération de transcodage vise à permettre/améliorer la
communication parlée entre ces deux interlocuteurs allant jusqu’à un transcodage inter-
modalité, appelé aussi substitution sensorielle. Elle permet de compenser divers déficits
moteurs du locuteur (laryngectomie, etc.), perceptifs (surdité, etc.) de l’interlocuteur, de
s’adapter aux dispositifs de capture ou de restitution des signaux disponibles ainsi que les
conditions environnementales (rapport signal sur bruit, etc.), les conditions de production
(parole chuchotée voire articulation silencieuse, etc.) ou de perception (position/distance au
haut-parleur, etc.) voire de transmission des signaux (exploitation de la redondance
multimodale pour compression, etc.).
Deux sources de connaissance peuvent contribuer à ce transcodage : (a) la connaissance
a priori des corrélations entre les diverses signatures – activités neuronales et neuro-
musculaires, mouvements articulatoires, paramètres aérodynamiques, géométrie du conduit
vocal, déformations faciales et structure acoustique du son - de l’activité vocale ; (b) la
connaissance a priori des contraintes phonétiques, phonologiques et linguistiques de la langue
parlée.
Des outils puissants permettent de modéliser ces connaissances et de les associer de
manière optimale avec les signaux disponibles à l’entrée et désirés à la sortie. Sur un axe
ordonnant les méthodes suivant leur indépendance à la langue utilisée, on trouve aux deux
extrémités :
Les méthodes utilisant un pivot phonétique, combinant reconnaissance et synthèse de
parole pour assurer le respect d’organisation phonologique du langage parlé. Notons
que les opérations de reconnaissance et de synthèse peuvent ici faire appel à des
techniques de modélisation très différentes. Ainsi si les modèles phonétiques à base de
Chaînes de Markov Cachés (HMM) constituent la base de la plupart des systèmes de
reconnaissance, la synthèse par concaténation d’unités multi-représentées et de
longueur variable reste très populaire. Notons cependant la montée en puissance de la
synthèse par modèles de trajectoires basés HMM permettant plus de symétrie voire un
apprentissage conjoint des modèles de reconnaissance et de synthèse.

22
Les méthodes capturant les corrélations des signaux de manière directe sans pivot
phonétique par techniques de mapping. Ces techniques capturent les corrélations entre
trames de signaux en entrée et en sortie par quantification vectorielle ou par mélange de
Gaussiennes GMM.
La dichotomie entre ces méthodes est de plus en plus floue car il semble intéressant de
combiner les deux types d’approche permettant de gagner en robustesse et précision.
Deux projets sur le Cued Speech se sont inscrits dans cet axe : (1) Le transcodage de la
Langue Française Parlée complétée (code LPC) en parole audio: l’enjeu est ici le décodage
phonétique des mouvements faciaux articulés silencieusement et accompagnés par des gestes
de main par des méthodes de reconnaissance automatique. Le projet ANR/TELMA est articulé
autour d’une telle technologie dont l’objectif est de permettre à un sourd et un bien-entendant
de converser par visiophonie assistée par ordinateur ; (2) Le transcodage de parole audio en
parole visuelle complétée par le code LPC : l’enjeu est ici d’inférer les mouvements des lèvres
et de la main permettant d’expliquer au mieux la séquence audio observée. Le problème
générique est l’inversion visuo-acoustique par des approches stochastiques opérant directement
à partir de données de type articulatoires collectées sur des sujets.
II.1 Contexte du projet TELMA de Téléphonie à l’usage des malentendants
Le téléphone pour les sourds, une idée qui peut surprendre, est l'objectif du projet qui se
propose de poser les bases d'une interface à l'usage des malentendants, utilisant la modalité
visuelle pour permettre de communiquer avec les utilisateurs entendants utilisant la modalité
audio. Pour contribuer au besoin de multimodalité, le projet s’est fixé de développer des briques
autour des techniques du débruitage audiovisuel, et du transcodage entre parole acoustique et
lecture labiale augmentée de la Langue Française Parlée Complétée. Les études sont axées sur
les techniques de débruitage audiovisuelles et sur l’analyse et l’animation faciale centrées sur
la lecture labiale et la LPC. Il s'agit pour la dimension LPC de réaliser un système automatique
de traduction lecture labiale+LPC vers parole acoustique et inversement sachant que le vecteur
qui transporte l'information dans le réseau téléphonique reste le son.
Le projet Telma s’est fixé l’objectif de développer les briques technologiques
nécessaires à la mise en œuvre des fonctionnalités visées et de les intégrer dans un
démonstrateur. Dans ce cadre, objectifs sont multiples (voir Figure II-1) :
- L'exploitation de la modalité visuelle dans le débruitage dans des conditions de
communication réalistes ;

23
- La reconstruction d'une chaîne phonétique par reconnaissance du LPC ;
- Le contrôle de la synthèse visuelle avec LPC à partir du son de parole.
a)
b)
c)
Figure II-1 : Les 3 fonctionnalités de TELMA
Partenaires GIPSA-lab et ICP (16): Denis Beautemps, Laurent Girin, Noureddine Aboutabit, Gérard Bailly, Marie-
Agnès Cathiard, Frédéric Elisei, Panikos Heracleous, Bertrand Rivet, Pablo Sacher, Christophe Savariaux,
Coriandre Vilain, Alice Caplier, Vincent Girondel, Christian Jutten, Stéphane Mancini, Sébastien Stillitano.
Partenaire LIG (3): Laurent Besacier, Jean-François Sérignat, Viet-Bac Le.
Partenaire Orange/France Telecom (8): Gaspard Breton, Thomas Burger, Denis Chêne, Danièle Pelé, Pascal Perret,
Mélody Tribout, Sylvie Vidal, Oxana Govokhina.
Partenaire LTCI (2): Yves Mathieu, Zahir Larabi.
Partenaire CHU-ORL (12): Sébastien Schmerber, Martine Marthouret, Clémentine Huriez, Myriam Douibi,
Aurélie Chevallier, Nicolas Deffois, Laurie Fabbri, Juliette Huriez, Louis Magnin, Richard Nomballais, Godefroy
Vannier, Nadège Clauss

24
II. 2 Reconnaissance du Cued Speech
La reconnaissance du Cued Speech est composée d’un module de caractérisation de
l’information visuelle de la main et des lèvres vue de face et d’un module de fusion de ces deux
composantes (Figure II-2). Dans le contexte TELMA, cette partie a trait à la fonctionnalité
illustrée par la Figure II-1 (b). Il s’agissait d’un axe de recherche totalement innovant, aucun
travail n’existant antérieurement. Nous avons d’emblée choisi de marquer l’information
visuelle pertinente pour le code LPC dans les enregistrements vidéo afin de faciliter l’extraction
des composantes manuelles et labiales et ainsi consacrer nos efforts sur la modélisation de la
fusion, véritable enjeu de ce travail.
Les modèles de fusion classiquement utilisés en reconnaissance audiovisuelle de la
parole (voir par exemple la taxinomie de leur classification sur une échelle allant de fusion
précoce à fusion tardive selon Schwartz et al., 1998 ou leur classement selon une typologie en
fusion de données vs. fusion de décisions chez Potamianos, 2012) ont été appliqués à la fusion
des deux composantes visuelles main et lèvres du code LPC.
Figure II-2 : Schéma de principe de la chaîne de reconnaissance du code LPC et de la conversion en son
de parole dans le cas de la modélisation par HMM. (1) Phase d’apprentissage ; (2) Phase de test.
II.2.1 Méthodes de fusion
Le modèle à recodage moteur (RM) renvoie à un encodage dans un espace articulatoire.
Dans cet espace, les voyelles sont caractérisées par la forme globale du conduit vocal, définie
par la position de la mandibule, l’ouverture aux lèvres et la position de la langue à l’intérieur
du tractus. Dans la fusion audio-visuelle, la position de la langue, qui est le seul articulateur qui
ne soit pas toujours visible, peut-être inférée à partir du contenu spectral du son de parole dans
le cas des voyelles. En Cued Speech, la position de main qui est prévue pour coder plusieurs
voyelles prédit donc plusieurs formes de conduit vocal dont un seul sera cohérent avec la
composante labiale. Un module de comparaison des formes de lèvres peut permettre de
sélectionner la forme du conduit vocal qui devra ensuite être soumise à un classifieur afin de

25
terminer la phase de reconnaissance. Cette approche nécessite d’avoir des données articulatoires
en nombre suffisant sous forme de dictionnaires de conduits vocaux par exemple pour le
locuteur considéré ou un modèle articulatoire adapté au locuteur.
Dans le modèle à recodage dans la modalité dominante (RD), une des modalités est
considérée comme la modalité principale et la seconde réalise une prédiction dans l’espace
principal. En audiovisuel, la composante audio est la modalité principale car elle porte toute
l’information. La forme des lèvres peut prédire des formes de spectres dans le domaine audio.
En Cued Speech, aucune des deux composantes (main et lèvre) ne portent l’information
phonétique complète sans ambiguïté. Il n’y a donc pas de modalité dominante évidente. De plus
ces deux composantes sont complémentaires et peu de corrélation sont donc attendues entre
leurs paramètres. Ces deux raisons ont fait que nous avons écarté le modèle RD.
II.2.2. Résultats par application de la méthode de fusion ID
Pour la méthode par Identification Directe (ID), les paramètres des deux modalités (ici
les coordonnées des pastilles de main et de doigt ainsi que les paramètres labiaux d’aperture,
d’étirement et d’aire du contour interne des lèvres) sont concaténés dans un même vecteur ou
une même matrice avant application d’un classifieur de type HMM par exemple (Figure II-2).
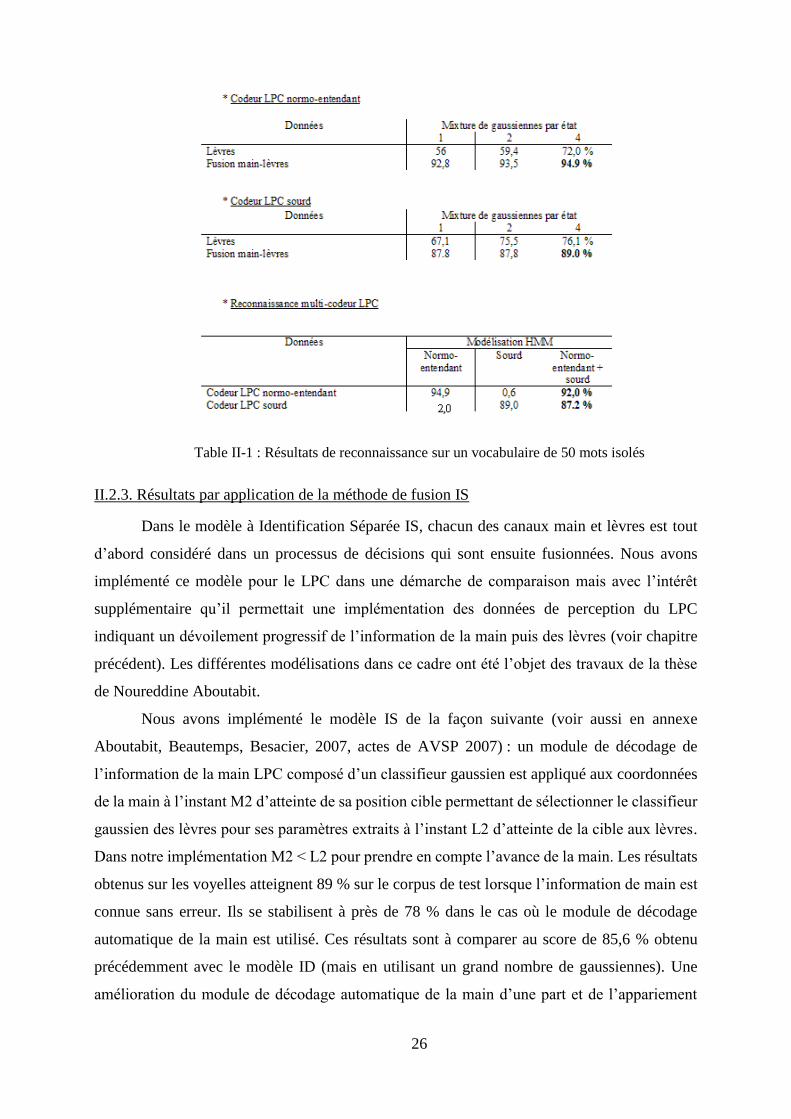
Cette modélisation appliquée à des sujets entendants et sourds a permis d’atteindre (voir Table
II-1) des taux de reconnaissance de 87,6 % pour les voyelles, de 89 % à 94,9 % pour le cas de
mots isolés, à comparer au score maximum de 76,1 % dans le cas des lèvres seules (« lip-
reading »). La modélisation HMM étendue à la reconnaissance multi-locuteur LPC, a permis
d’obtenir des résultats entre 87 et 92%, montrant ainsi la capacité à modéliser la variabilité inter
sujets en LPC et ouvrant des perspectives prometteuses pour la reconnaissance indépendante
du locuteur (Voir en annexe, Heracleous, Beautemps, Aboutabit, 2010).
26
Table II-1 : Résultats de reconnaissance sur un vocabulaire de 50 mots isolés
II.2.3. Résultats par application de la méthode de fusion IS
Dans le modèle à Identification Séparée IS, chacun des canaux main et lèvres est tout
d’abord considéré dans un processus de décisions qui sont ensuite fusionnées. Nous avons
implémenté ce modèle pour le LPC dans une démarche de comparaison mais avec l’intérêt
supplémentaire qu’il permettait une implémentation des données de perception du LPC
indiquant un dévoilement progressif de l’information de la main puis des lèvres (voir chapitre
précédent). Les différentes modélisations dans ce cadre ont été l’objet des travaux de la thèse
de Noureddine Aboutabit.
Nous avons implémenté le modèle IS de la façon suivante (voir aussi en annexe
Aboutabit, Beautemps, Besacier, 2007, actes de AVSP 2007) : un module de décodage de
l’information de la main LPC composé d’un classifieur gaussien est appliqué aux coordonnées
de la main à l’instant M2 d’atteinte de sa position cible permettant de sélectionner le classifieur
gaussien des lèvres pour ses paramètres extraits à l’instant L2 d’atteinte de la cible aux lèvres.
Dans notre implémentation M2 < L2 pour prendre en compte l’avance de la main. Les résultats
obtenus sur les voyelles atteignent 89 % sur le corpus de test lorsque l’information de main est
connue sans erreur. Ils se stabilisent à près de 78 % dans le cas où le module de décodage
automatique de la main est utilisé. Ces résultats sont à comparer au score de 85,6 % obtenu
précédemment avec le modèle ID (mais en utilisant un grand nombre de gaussiennes). Une
amélioration du module de décodage automatique de la main d’une part et de l’appariement

27
main-lèvre (instants M2 et L2) devraient permettre d’améliorer ces résultats qui restent malgré
tout encourageants.
Figure II-3 : Reconnaissance progressive au cours du dévoilement progressif de l’information. En bas,
décours temporel des paramètres de lèvre (aperture, étirement, aire du contour interne des lèvres). En
superposition décodage de la main (couleur magenta), et instants L2 (croix bleues claires) de fusion des
décisions main-lèvre.
II.3. Conversion audio vers le Cued Speech : mapping des espaces
L’objectif visé dans cette partie a été d’étudier les méthodes de mapping des paramètres
acoustiques du son de parole vers les paramètres visuels (labiaux et Cued Speech) en utilisant
un bas niveau d’interfaçage de type signal et donc sans le recours à la reconnaissance
automatique de la parole. Dans le contexte du projet TELMA, cette partie renvoie à la
fonctionnalité de la figure II-1 (c). L’introduction de la composante manuelle du Cued Speech
dans ce programme constitue une véritable originalité de ce travail avec des retombées claires
pour les systèmes de communication utilisant le geste associé à la parole ou non, tels que le
Cued Speech mais aussi des gestes de pointage ou la Langue des Signes.
Nous avons abordé ce programme en traitant le cas des voyelles orales du Français avec
le mapping des paramètres spectraux du son de parole vers les paramètres caractéristiques de
la géométrie des lèvres vues de face et des paramètres de position de la main codant le Cued
Speech sur le visage. Le mapping a consisté ici à déterminer les coefficients d’une combinaison
linéaire reliant les paramètres de l’espace acoustique (les prédicteurs) aux paramètres de
l’espace visuel (lèvres et Cued Speech) en minimisant l’erreur au sens des moindres carrés entre
le résultat de la prédiction et les valeurs des paramètres visuels.

28
Nous avons comparé les méthodes en régression linéaire multiple et à mixture de
gaussiennes GMM. L’introduction de l’outil GMM a pu se faire grâce à une discussion très
fructueuse avec mon collègue Thomas Hueber, chercheur dans la même équipe que moi. Il avait
en effet dans sa thèse utilisé cette méthode pour l’inversion de la relation articulatori-
acoustique.
La difficulté supplémentaire dans le cas du Cued Speech était que d’une part les
paramètres de position de main sont discontinus et d’autre part qu’il n’y a pas de causalité entre
la réalisation acoustique et la position cible de la main sur le visage. En restant dans le contexte
du « mapping », nous pouvons préciser qu’il s’agit d’une opération d’appariement (ici entre
paramètres spectraux et LPC). Ainsi, les bons résultats obtenus dans l’application de ces outils
sont d’autant plus intéressants, tant sur les aspects de l’objectif visé que sur l’augmentation de
la connaissance des outils de modélisation, notamment leur comportement dans ces situations.
Les travaux dans ce cadre ont été au cœur de la thèse de Zuheng Ming. Les méthodes
linéaires et en GMM ont donné toutes deux de bons résultats pour la prédiction des paramètres
labiaux (Figures II-4, II-5 et II-6). Pour les paramètres de main, étant donné la forte non linéarité
avec les paramètres spectraux, seule l’approche GMM a permis d’obtenir des résultats
satisfaisants en terme de réplication des données. La modélisation la plus optimale a été obtenue
lorsque les trois gaussiennes pour les lèvres ont été distribuées dans l’espace spectral en
fonction de leur caractéristique labiale (les visèmes, voir figure I-1). De même pour les
paramètres de position du Cued Speech, les cinq gaussiennes ont été distribuées dans l’espace
spectral en fonction de la répartition des voyelles dans les cinq groupes de voyelle du LPC
(Figure II-4). Ces résultats n’ont pas été améliorés par les traitements automatiques à base
d’algorithmes K-means, EM et d’augmentation du nombre de gaussiennes.

29
0 1 2 3 4 5 6 7 8 9 10 11 12 13 14 15 160
0.1
0.2
0.3
0.4
0.5
0.6
0.7
0.8
0.9
1
Predictors
Resid
ua
l V
ari
an
ce
A Residual Variance
P-fmt2
P-fmt4
P-MFCC
P-LSP
P-MFCC-LSP
0 1 2 3 4 5 6 7 8 9 10 11 12 13 14 15 160
0.1
0.2
0.3
0.4
0.5
0.6
0.7
0.8
0.9
1
Predictors
Resid
ua
l V
ari
an
ce
B Residual Variance
P-fmt2
P-fmt4
P-MFCC
P-LSP
P-MFCC-LSP

30
Figure II-4 – Modélisation linéaire. Variance résiduelle de la prédiction des paramètres labiaux, de haut
en bas respectivement A (étirement aux lèvres), B (aperture aux lèvres) et S (aire du contour interne des
lèvres), exprimés chacun relativement à leur variance totale, en fonction du nombre de prédicteurs (leurs
composantes principales) et pour chaque ensemble de prédicteurs : 2, 4 formants (fmt), MFCC, LSP et
l’ensemble de MFCC-LSP. Figure issue de Ming, Beautemps, Feng, 2013, contexte de la thèse de
Zuheng Ming.
0 1 2 3 4 5 6 7 8 9 10 11 12 13 14 15 160
0.1
0.2
0.3
0.4
0.5
0.6
0.7
0.8
0.9
1
Predictors
Resid
ua
l V
ari
an
ce
S Residual Variance
P-fmt2
P-fmt4
P-MFCC
P-LSP
P-MFCC-LSP
0 2 4 6 8 10 12 14 160
0.1
0.2
0.3
0.4
0.5
0.6
0.7
0.8
0.9
1
Resid
ua
l V
ari
an
ce
A Mapping Residual Variance
Prediction by spectral parameters

31
Figure II-5 – Modélisation GMM. De haut en bas, variance résiduelle des paramètres labiaux exprimés
chacun relativement à leur variance totale, en fonction de la dimension de l’espace spectral. Figure issue
de Ming, Beautemps, Feng, 2013, contexte de la thèse de Zuheng Ming.
0 2 4 6 8 10 12 14 160
0.1
0.2
0.3
0.4
0.5
0.6
0.7
0.8
0.9
1
Resid
ua
l V
ari
an
ce
B Mapping Residual Variance
Prediction by spectral parameters
0 2 4 6 8 10 12 14 160
0.1
0.2
0.3
0.4
0.5
0.6
0.7
0.8
0.9
1
Resid
ua
l V
ari
an
ce
S Mapping Residual Variance
Prediction by spectral parameters

32
Figure II-6 – Estimation du paramètre d’aperture B sur un corpus de test de 671 voyelles. En rouge,
valeurs réelles ; En vert, estimation utilisant la modélisation par GMM ; En bleu, estimation utilisant la
modélisation linéaire. Figure issue de la thèse de Zuheng Ming.
0 2 4 6 8 10 12 14 160
0.1
0.2
0.3
0.4
0.5
0.6
0.7
0.8
0.9
1
Resid
ua
l V
ari
an
ce
Hand X Mapping Residual Variance
Prediction by spectral parameters
0 2 4 6 8 10 12 14 160
0.1
0.2
0.3
0.4
0.5
0.6
0.7
0.8
0.9
1
Resid
ua
l V
ari
an
ce
Hand y Mapping Residual Variance
Prediction by spectral parameters

33
Figure II-7 – Modélisation GMM. De haut en bas, variance résiduelle des paramètres de main exprimés
chacun relativement à leur variance totale, en fonction de la dimension de l’espace spectral. Figure issue
de Ming, Beautemps, Feng, 2013, contexte de la thèse de Zuheng Ming.
Figure II-8 – Estimation des coordonnées X et Y utilisant la modélisation par GMM. En rouge, données
d’origine, en vert valeurs estimées. Figure issue de la thèse de Zuheng Ming.
L’ensemble de ces résultats en modélisation GMM a été étendu après la thèse de Zuheng
Ming : les trois gaussiennes placées dans l’espace spectral en fonction du regroupement des
voyelles dans les trois visèmes (voir Figure I-1 pour la définition des visèmes) ont été utilisées
dans la prédiction de la transformation à base de DCT de toute la région d’intérêt des lèvres
avec là aussi de bons scores de réplication (voir Figures II-9, II-10, contexte du projet d’étude
PHELMA de Louis Gallet). Ces derniers résultats ne sont pas encore publiés.
Figure II-9 : Composante Y du codage YUV de la ROI des lèvres. Colonne de gauche, ROI (101x101
pixels) originales de la voyelle [u] en haut et de la voyelle [Ɔ] en bas ; colonne de droite, résultats de
reconstruction des ROI correspondantes par un mapping GMM (3 gaussiennes à 16 dimensions placées
dans l’espace spectral) des paramètres spectraux sur une transformation à base de DCT puis application
de la DCT inverse pour revenir à la composante Y. La racine carrée de l’erreur quadratique moyenne
sur un corpus de 700 images entre prédictions et données est de 11,3 en niveau de gris codé sur 8 bits,
ce qui correspond à une erreur moyenne de 9,3 %.

34
Figure II-10 : Résultat du mapping GMM (3 gaussiennes) pour la ROI des lèvres et pour la position
cible de la main du LPC (qui définit ici les coordonnées x-y de l’extrémité du majeur) avec 5
gaussiennes. A gauche cas d’un [a], à droite, cas d’un [i]. Le reste du visage est identique dans les deux
cas.
Enfin, un autre résultat important a été obtenu en traitement d’image de la région d’intérêt
des lèvres où nous avons pu mettre en évidence la forte relation linéaire entre paramètres
d’apparence et paramètres de forme des lèvres (Figures II-11 et II-12 ; voir aussi Ming,
Beautemps, Feng, 2010). Nos résultats soulignent un lien entre ces deux approches. Des
modélisations linéaires et en GMM de ces relations ont ainsi pu être développées et évaluées.
Ces résultats pourront permettre de s’affranchir de l’utilisation d’artifices (bleu sur les lèvres)
pour les sujets enregistrés, dans le cas d’apprentissages possibles pour les modèles de
prédiction. Enfin les approches en « apparence » et en « forme » son classiquement présentées
en miroir l’une de l’autre dans la littérature (Potamianos et al., 2003 ; Potamianos et al., 2012),
et nos résultats montrent le pont qui peut exister au travers de cette dichotomie.

35
Figure II-11 – Estimation du paramètre d’aperture B sur un corpus de test de 671 voyelles. En rouge,
valeurs réelles ; En bleu, estimation linéaire à partir des 20 composantes principales de l’ACP sur les
100 coefficients DCT sélectionnés (voir Figure II-13). Figure issue de la thèse de Zuheng Ming.
Figure II-12 – A gauche image (101x101) de la transformation en DCT à deux dimensions d’une ROI
des lèvres. A droite, zoom sur les basses fréquences avec le masque de sélection triangulaire de sélection
des 100 coefficients DCTs. Code couleur : Du plus sombre au plus clair les valeurs DCTs des plus
élevées aux plus faibles. Figure issue de la thèse de Zuheng Ming.
Listes des intervenants : Denis Beautemps (CR), Gang Feng (PR), Noureddine Aboutabit
(doctorant), Zuheng Ming (doctorant), Panikos Heracleous (Post-doc), Oxana Govokhina (post-
doc), Jeanne Clarke (DEA), Louis Gallet (Stage d’ingénieur 2A, PHELMA), Thomas Burger
(DEA) ;

36

37
Chapitre III – Parole, surdité et audition réhabilitée
Introduction
Ce thème vise à étudier et modéliser la production de parole et les processus de co-
perception et production dans le contexte de la surdité.
Nous avons traité cette thématique à partir de trois actions principales sur un axe avec à
une de ses extrémités la production sans retour auditif et à l’autre extrémité une situation de
collaboration de la perception auditive voire audiovisuelle dans la production dans le cas de
l’audition réhabilitée par l’implant cochléaire.
La première action traite de la production de parole liée à la physique. Nous avons voulu
séparer les aspects liés au contrôle et le domaine de la surdité nous a paru intéressant à ce point
de vue avec la limitation des effets de feedback auditif. Cette action n’est clairement pas ma
dominante. J’y apparais par le contexte de la surdité et l’intérêt d’accompagner ce travail dans
le cadre d’une co-direction de thèse avec Xavier Pelorson, dans le contexte de l’ANR
PLASMODY et le projet Région « Cible » dans lesquels ces travaux se situent et dont je suis
un des porteurs ou le porteur principal. La seconde action a consisté à introduire un nouveau
champ expérimental en « shadowing » dans l’étude de la dimension visuelle de la parole, action
réalisée dans le contexte du DEA d’Yvon Leborgne en 2002 que j’ai co-encadré avec Marie-
Agnès Cathiard. La dernière action a trait à l’étude des relations sensori-motrices en surdité
remédiée par l’implant cochléaire. Cette dernière action ne correspond pas non plus à la
dominante de mon travail. Mais j’y apparais par l’apport d’une expérience sur le paradigme en
close-shadowing et l’idée de l’application de ce paradigme à la surdité réhabilitée par l’implant
cochléaire avec la proposition d’une expérience de co-perception et production intégrant ce
paradigme ainsi que la dimension multimodale audio-visuelle dans le contexte d’une co-
direction de thèse et du projet ANR PLASMODY.
III.1 Contexte du projet PLASMODY
L'objectif principal du projet est de mieux comprendre la perception et la production de la
parole avant et après l'implantation cochléaire. Un accent particulier est mis sur le rôle des
interactions multisensorielles et les substitutions intermodale pour l'accès à l'oralité chez les
patients sourds implantés cochléaires. Sur le plan scientifique le projet PlasMody sous l’angle
de la réhabilitation auditive est une opportunité d’étudier et questionner les mécanismes
d’interactions multisensorielles qui jouent un rôle fondamental dans la compréhension de la

38
parole. Du point de vue clinique, nos études sur la récupération auditive fourniront des
informations importantes pour suggérer des pistes en rééducation orthophonique et en
technologies assistives.
Dans ce cadre de compensation multimodale, un premier objectif de PlasMody est de
comprendre comment les personnes implantées cochléaires exploitent la vision et la combinent
efficacement avec l’audition au travers du « filtrage » opéré par l’implant de données aussi
complexes que la parole normale, comprenant le niveau segmental et l’information prosodique
du contenu linguistique, ainsi que l’identité du locuteur et son état émotionnel.
L’hypothèse est que la synergie entre vision et audition lors de la récupération post-
implantation agit comme une boucle de rétroaction positive conduisant à une augmentation de
la performance de la modalité auditive. De même, en lien avec la théorie motrice de la
perception de la parole, PlasMody permet d’évaluer si les interactions sensori-motrices
améliorent les processus de co-perception et production de la parole après implantation
cochléaire. PlasMody est multidisciplinaire dans plusieurs aspects de son architecture, elle
englobe la physique, la cognition et les technologies assistives de communication avec l'objectif
commun de comprendre les mécanismes de substitutions et de compensations induits par la
perte de l’audition et permettre aux patients sourds implantés cochléaires d’accéder à la
communication orale.
Partenaire GIPSA-lab: Denis Beautemps (CR), Marc Sato (CR), Jean-Luc Schwartz (DR), Xavier Pelorson (DR),
Anne Vilain (MCF), Louis Delebecque (Doctorant), Lucie Scarbel (Doctorant).
Partenaire LPNC: Olivier Pascalis (DR).
Partenaire CerCO: Pascal Barone (DR) et Olivier Deguine (PUPH).
III.2 Etude des aspects physique en production de parole
Cette partie vise à étudier et modéliser les phénomènes liés à la physique dans la
production de parole. En effet, beaucoup de travaux ont été menés sur la production sous l’angle
articulatoire et acoustique, mais peu se sont concentrés sur les aspects physiques. Le paradigme
de surdité profonde sans retour auditif s’est trouvé être bien adapté pour observer ces aspects
en évitant toute perturbation d’un contrôle involontaire induit par le feedback auditif.
L’étude physique implique une description précise du comportement des cordes vocales
et des parois à l’avant du conduit vocal, du débit à la constriction et des interactions de ces
différentes composantes. L’objectif visé est de modéliser les phénomènes physiques plutôt que
les effets qui en résultent, de façon à limiter les paramètres de contrôle en simulation numérique.
L’ensemble de ces travaux est au cœur de la thèse en cours de Louis Delebecque. J’aborderai
donc cette partie par des illustrations de la démarche de ce travail dont certains des résultats

39
sont en voie de publication (soumission actuelle à la revue internationale avec comité de lecture
Journal of the Acoustical Society of America).
La démarche consiste à l’enregistrement de données aérodynamiques et acoustiques sur
des sujets permettant d’émettre des hypothèses sur les comportements observés au regard des
modèles théoriques. Ces hypothèses ainsi que la pertinence des modèles théoriques sont ensuite
évaluée avec des mesures obtenues sur des maquettes qui sont des répliques simplifiées du
système phonatoire humain (Figure III-1). Enfin des simulations numériques sont réalisées et
les résultats comparés aux données mesurées sur les participants.
Figure III-1 : (a) : image photo de la maquette du système phonatoire, (b) : diagramme du système
phonatoire composé (1) : d’un compresseur, (2) d’un réservoir de pression, (3) : d’une maquette des
cordes vocales, (4) : d’un tube rigide en plexiglass (qui peut être remplacé par un tube en latex), (5) :
d’une maquette en métal des lèvres et (6) : moteur et capteurs de déplacement des lèvres. Figure extraite
de l’article Delebecque et al. soumis à la revue Journal of the Acoustical Society of America.
III.2.1- Etude du comportement des cordes vocales
Dans ce cadre expérimental un travail sur les cordes vocales est en cours avec l’analyse
de la production d’un sujet sourd post-lingual privé de retour auditif. Les données
aérodynamiques, acoustiques et EGG ont été enregistrées par le système EVA (Giovanni et al.,
2006) auquel était adjoint un EGG (Figure III-2).

40
Figure III-2 : EGG couplé au système de mesure aérodynamique et acoustique EVA.
Image issue de la page Web de la plateforme BEDEI de GIPSA-lab.
Ce système a permis de faire ressortir pour le sujet sourd dans le cas de la production
d’une voyelle [u] tenue avec une forte intensité, une valeur très élevée du F0 (entre 500 et 550
Hz) suivie d’une brusque diminution (à 400 Hz) (Figure III-3) liée à une baisse de la pression
acoustique et associée à un changement de mécanisme laryngé comme l’indique les signaux de
l’EGG (Figure III-4). Ces observations suggèrent que la pression sous glottique permettant une
forte intensité génère un mécanisme de vibration engendrant un F0 élevé. En fin de tenue, à
partir de 0,7s, la pression acoustique baisse suggérant une baisse de la pression sous glottique
avec pour conséquence un changement de mécanisme de régime vibratoire engendrant une
chute du F0. Ces hypothèses restent à être validées sur maquette. Enfin il est à noter que le F0
n’est corrigée ni à la hausse ni à la baisse ce qui aurait pu se réaliser par un contrôle particulier
des cordes vocales par feedback auditif, ce qui n’a pas été le cas. Cette observation confirme
l’intérêt de l’utilisation du paradigme de surdité pour mettre en évidence les phénomènes de
liés à la physique dans le comportement des cordes vocales.

41
Figure III-3 : Mesures pour la voyelle [u] produite avec une forte intensité par le sujet sourd. (a) : Signal
de pression acoustique Pa. (b) : Spectrogramme calculé sur les fenêtres de 10 ms. (c) : Fréquence
fondamentale F0 extrait du signal Pa. Les traits pointillés verticaux désignent les agrandissements des
signaux EGG présentés en figure III-4.

42
Figure III-4 : Signaux EGG (a, b) et leur première dérivée (c, d) mesurés pour la voyelle [u] produite
avec une forte intensité par le sujet sourd, avant (a, c) et après (b, d) le saut de fréquence fondamentale
observée.
III.2.2- Etude de l’effet du mouvement des parois du conduit vocal
Cet ensemble expérimental a permis une autre étude sur l’effet du mouvement des parois
du conduit vocal sur la production de séquences Voyelle-plosive bilabiale-Voyelle. La pression
intra-orale, mesurée par le système EVA, présente une dissymétrie du profil (Figure III-5c)
entre la phase d’occlusion (intervalle [0,15s ; 0,2s]) et la phase de détente aux lèvres (intervalle
[0,4s ; 0,45s]). L’augmentation plus lente de la pression intra-orale se superpose à la phase
d’extinction acoustique de la voyelle (intervalle [0,15s ; 0,2s], Figure III-5b). L’hypothèse
proposée dans ce cadre est que la hausse plus lente de la pression intra-orale observée à
l’occlusion comparée à la chute à l’ouverture des lèvres pouvait s’expliquer par une simple
expansion des joues lors de l’occlusion responsable dans le même temps du maintien de
l’oscillation des cordes vocales jusqu’à son arrêt avec l’atteinte de l’expansion limite.
L’hypothèse sur l’effet de l’expansion des joues a été validée in vitro sur maquette en comparant
les mesures avec tube rigide et tube en latex (Figure III-6) et in vivo sur des sujets contraignants
avec les mains le mouvement des joues (Figure III-7). On observe ainsi après la fermeture aux
lèvres une augmentation rapide de la pression intra-orale aussi bien dans le cas du tube rigide
que dans le cas des joues dont le mouvement est empêché. Inversement, on observe une pente
plus lente de l’augmentation de la pression intra-orale aussi bien dans le cas du tube en latex
que dans le cas d’un mouvement laissé libre des joues.
L’effet de l’expansion des joues a été simulé numériquement par un système masse-
ressort. Rappelons-le, l’objectif visé est de modéliser les phénomènes physiques de façon à
limiter les paramètres de contrôle en simulation numérique. La finalité est d’améliorer le
réalisme de la simulation du point de vue de son comportement physique et de pouvoir prévoir
l’évolution des paramètres physiques qui régissent la production de parole. À notre
connaissance, avant que ne débute ce travail dans le contexte de la thèse de Louis Delebecque,
l’expansion de la cavité buccale, n’était pas pris en compte dans les modèles physiques de
production de parole.
Des simulations ont donc été réalisées pour des séquences [apa]. La figure III-8b fait
apparaître la persistance d’un voisement 50 ms après la fermeture complète des lèvres dans le
[p] ce qui n’est pas possible dans le cas de la simulation d’un conduit vocal rigide. L’amplitude
de l’oscillation mesurée par la dérivée du débit glottique décroit progressivement. Ces résultats
de simulation rendent compte des données enregistrées sur l’humain (voir Figure III-5).

43
Figure III-5 : Mesures à partir de la production d’une séquence [apa], (a) : paramètres de lèvres
(étirement A et aperture B) extraits d’un enregistrement vidéo, (b) : pression acoustique Pa mesurée à
50 cm des lèvres, (c) : pression intra-orale IOP. Figure extraite de l’article Delebecque et al. soumis à la
revue Journal of the Acoustical Society of America.

44
Figure III-6 : Résultats expérimentaux pour l’expansion du tube en latex. (a) : aperture hl aux lèvres
dans le cas des configurations rigides et latex du tube. (b) : pression expérimentale P1 mesurée pour les
deux configurations. (c) : variation du volume du tube en latex. Figure extraite de l’article Delebecque
et al. soumis à la revue Journal of the Acoustical Society of America.
Figure III-7 : Pressions intra-orale mesurées sur une fenêtre de 200 ms autour de l’instant de fermeture
aux lèvres pour une séquence [apa] avec deux conditions de production: normale (N) et contrainte (C)
pour laquelle le sujet applique ses paumes de mains au niveau des joues pour limiter son mouvement.
Figure extraite de Delebecque et et al. (2012).
Figure III-8 : (a) Paramètres d’étirement et d’aperture aux lèvres ; (b) Dérivée du débit glottique simulé ;
(c) Pression intra-orale simulée (trait vert) et mesurée sur la maquette (trait pointillé rouge). Figure
extraite de l’article Delebecque et al. soumis à la revue Journal of the Acoustical Society of America.
III.3 Close shadowing et collaboration audiovisuelle
Le shadowing consiste en la répétition de la parole produite par le locuteur au fur et à
mesure qu’elle est perçue. Lorsque cette répétition consiste à suivre en ligne la parole de l’autre
en la répétant aussi vite que possible au fur et à mesure qu’elle est perçue, on parle alors de
« close shadowing » ou « shadowing rapproché ». Ce paradigme nous semble particulièrement

45
adapté pour comprendre les processus cognitifs en jeu dans le monitoring de sa propre
production linguistique par rapport au monitoring de la parole de l’autre. Ces processus de self-
monitoring et de monitoring de l’autre semblent particulièrement impliqués en situation
d’apprentissage des langues et de remédiation auditive au cours duquel l’apprenant doit gérer,
probablement de manière très imbriquée, à la fois le monitoring du tuteur et son propre
monitoring. Enfin ce paradigme a l’avantage de tester les traitements cognitifs en perception et
production simultanées en restant dans le domaine du comportemental, beaucoup plus
accessibles que l’IRMf ou d’autres méthodes d’imagerie cérébrale.
Dans le contexte de la multimodalité, la question de la collaboration audiovisuelle en
situation de répétition s’est posée naturellement. Le paradigme en « close shadowing » utilisé
pour tester la fonction audiovisuelle a de plus l’intérêt de travailler avec des signaux audio
« propres » contrairement aux plans expérimentaux classiques utilisant la dégradation de
l’information de la composante audio par du bruit. Une étude de Reisberg et al. (1987), testant
l’intelligibilité de parole en langue étrangère, a montré un avantage dans la précision de la
réponse d’une présentation audiovisuelle du message par rapport à une présentation seulement
auditive. De notre côté, nous avons pu observer un effet positif de la présentation de stimuli
audiovisuels (caractérisés par des gestes consonantiques) sur les temps de réaction des sujets
avec un gain de 13,4 % à 14,6 % (DEA d’Yvon Le Borgne en 2002, voir aussi Beautemps et
al., 2003).
III.4 Relations perceptuo-motrices et implants cochléaires
Si les études sur la perception post-implantation sont légion, celles sur la production de
parole sont plus rares, et plus rares encore celles sur les liens entre perception et production,
dont on considère de plus en plus qu’ils structurent toute la communication. C’est l’enjeu du
travail de thèse en cours de Lucie Scarbel qui vise à étudier la relation perceptuo-motrice chez
les sujets sourds porteurs d’un implant cochléaire en réhabilitation de l’audition. Dans ce cadre,
trois expériences ont été élaborées avec pour objectif d’observer dans quelles mesures ces
interactions entre systèmes sensoriels et moteur s’établissent chez des patients sourds post-
linguaux après implantation cochléaire et, notamment, de déterminer la possible implication du
système moteur lors de tâches de perception et de production de la parole à différents stades
postopératoires.
La première expérience est une tâche de catégorisation rapide de consones à partir d’une
expérience en « close shadowing » visant à répondre le plus rapidement à des stimuli
syllabiques (Figure III-9).

46
Figure III-9 : Schéma illustrant l’expérience en close-shadowing à partir de la présentation de stimuli
audio-visuels. Réponse orale et réponse clavier pour la comparaison des processus de traitement. Figure
issue de Scarbel et al., 2014.
La seconde expérience comporte une tâche de production et une tâche de perception des
voyelles orales du français et vise à mettre en évidence des idiosyncrasies couplées entre
perception et production. Enfin, la troisième expérience a pour but de déterminer les capacités
d’imitation volontaire et de convergence phonétique chez ces patients. Les résultats sur une
population de sujets entendants en « close-shadowing » de consonnes montrent la capacité des
sujets à répondre rapidement et à exploiter l’information visuelle lorsqu’elle est disponible pour
améliorer les délais de réponse (voir publication de Scarbel et al., 2014 à la revue internationale
avec comité de lecture « Frontiers in Psychology »), plus rapidement en réponse orale qu’en
réponse manuelle, suggérant une prédiction motrice dans le cas de la réponse orale pour les
deux conditions de présentation des stimuli, c’est-à-dire en audio et audio-visuelle.
Les tous premiers résultats chez des sujets sourds montrent des performances similaires
en close shadowing avec signaux audio «propres » à celles des sujets entendants en close-
shadowing mais avec signaux audio bruités avec dans la condition audiovisuelle à la fois des
temps de répétition plus courts et une meilleure précision en catégorisation. Ces résultats
semblent compatibles avec l’hypothèse motrice d’un traitement de la réponse orale au niveau
de la commande motrice.
Contexte contractuel : projet Région Rhône-Alpes CIBLE, projet ANR PLASMODY ;
Listes des intervenants : Denis Beautemps (CR), Xavier Pelorson (DR), Jean-Luc Schwartz
(DR), Marc Sato (CR), Lucie Scarbel (Doctorant), Louis Delebecque (Doctorant), Xavier Laval
(IE), Christophe Savariaux (IR), Yvon Leborgne (DEA), Balbine Maillou (DEA);

47
Chapitre IV : Projet de recherche - Adaptabilité en parole, variabilité et plasticité
Introduction
Mon programme de recherche est un projet en production de parole par ses aspects
variabilité et plasticité. Je souhaite le mener à la lumière de questionnements en surdité et
oralité, d’analyses des relations entre modalités et de modélisation fonctionnelle dans le
contexte du traitement automatique de la parole.
En effet, les handicaps auditifs et la surdité sont un problème d’une importance
croissante dans nos sociétés touchées par le vieillissement, au point d’apparaître comme un
problème aigu de santé publique, et un enjeu socio-économique majeur. De nos jours, on estime
en France de 5 à 6 millions les personnes malentendantes ou sourdes profondes ou devenues
sourdes. Pour la population des personnes devenues sourdes progressivement, la lecture labiale
appelée communément lecture sur les lèvres est devenue au fur et à mesure de la perte en
capacités auditives la modalité principale pour percevoir la parole, tout comme pour la
population des enfants nés sourds profonds. La lecture labiale est en effet une compétence
naturelle que possède tout à chacun, avec cependant une grande variabilité d’une personne à
l’autre, les lecteurs labiaux les plus performants se trouvant parmi la population des personnes
sourdes. Cependant les meilleurs scores en perception de mots atteignent seulement 43,6 %
comme cela est rapporté par la littérature (Auer & Bernstein, 2007 ; Bernstein et al., 2010) du
fait de l’existence de sosies labiaux (des phonèmes différents pouvant avoir des formes labiales
très similaires). Sans connaissance du contexte sémantique ou d’informations complémentaires
auditives, codées gestuellement, ou de texte, il peut être difficile de percevoir la parole
confortablement.
Plus largement, dans le domaine du traitement automatique de la parole dans sa
dimension visuelle, des problématiques se posent en termes de segmentation de séquences
d’unités de parole, de repérage des régions d’intérêt, de définition de leurs paramètres
descripteurs, de fusion et/ou de classification de paramètres. Ces problématiques font l’objet
d’un premier axe de recherche intitulé «Articulation labiale complétée : du mapping à la
reconnaissance ».
Durant les trois dernières décades, des progrès très significatifs ont été faits sur les
techniques d’implantation cochléaire, permettant aux sourds profonds de récupérer des
capacités auditives très significatives. Néanmoins ces progrès restent tributaires des stratégies
de rééducation et limités par l'inévitable réduction de l'information acoustique transmise par

48
l'implant, et par la plus ou moins longue déprivation d'information auditive vécue par les
individus. Parallèlement, nos anciens souffrent de plus en plus de mauvaise audition, et les
appareillages les assistent très imparfaitement. Dans ce contexte de réhabilitation, quelle place
pour la modalité visuelle ? En particulier en situation de bruit ambiant, quel apport dans les
traitements réalisés par l’implant ? Ces questionnements sont l’objet d’un second axe de
recherche intitulé «Implant cochléaire et fonctionnalités audio-visuelles».
Dans un cercle plus large de recherches sur la variété des moyens de la communication,
de nouvelles collaborations sont en cours de développement autour du thème de la parole hyper-
hypo articulée, visant à mieux comprendre comment les locuteurs adaptent leur clarté de
production en fonction du niveau d’information nécessaire à leur auditeur pour percevoir le
message et de la recherche d’adhésion dans le discours codé. C’est ici une approche de type
analyse de corpus qui sera utilisée, avec des corpus constitués de matériaux audio-visuels et/ou
issus de systèmes à capture du mouvement existants ou à enregistrer pour différents types de
production et d’interaction, de tests perceptifs d’évaluation, d’étiquetage de données,
d’extractions de paramètres quantitatifs ou qualitatifs et de leurs analyses. Cette partie fait
l’objet d’un troisième axe de recherche intitulé « Rhébotique : de la syllabe au discours» qui est
extrait d’un projet soumis au dernier appel AGIR-PEPS de l’université, dont je suis
l’instigateur, le rédacteur principal et le porteur.
L’ensemble de ce programme de recherche s’inscrit dans la politique de recherche du
laboratoire GIPSA-lab. Il est une contribution aux enjeux de prospectives du DPC (voir Figure-
IV-1) que j’ai eu le plaisir d’animer en Octobre/Novembre 2014 en tant que responsable du
département. En particulier, le projet contribue aux actions «Parole, langage et relations sensori-
motrices » pour sa dimension multimodale et les problématiques d’apprentissage automatique,
« Troubles de la parole, voix et langage » pour les intérêts sur les déficiences sensori-motrices
et les questions de plasticité liés à la surdité et à l’hyper/hypo et à des « nouveaux paradigmes
expérimentaux » par ses plans expérimentaux originaux.

49
Figure-IV-1 : Enjeux de prospective au sein du DPC de GIPSA-lab
Les enjeux de prospective en parole s’inscrivent dans le contexte local Grenoblois de l’Université-Grenoble-
Alpes en construction au moment de la rédaction de ce manuscrit (UGA : regroupement des trois universités
fusionnées de Grenoble avec Grenoble-INP et le CEA,…). Il vise à se développer principalement au sein de
deux des six pôles du site, les pôles MSTIC et ALLSHCS ainsi que sur deux axes transversaux transformant
« Santé, Cognition et leurs interfaces » et « Humanités & Numérique ». Il se nourrit de quatre grands domaines
disciplinaires relevant des STIC par l’analyse/synthèse et le traitement automatique du signal de parole, des
SHS par une compétence importante en « Sciences du Langage », des SPI pour son expertise en aéro-acoustique,
mécanique des fluides et biomécanique, et des SDV par son ouverture sur les sciences-cognitives et la
physiologie. Cette alliance entre disciplines, données de terrain, de laboratoire, et modèles est rare et unique en
France dans un contexte de laboratoire très majoritairement INS2I. Elle est très bien identifiée à l’échelon
national, non seulement par l’Institut INS2I du CNRS mais aussi par l’INSHS et l’INSIS. Elle a déjà porté de
nombreux fruits en permettant de contractualiser non seulement auprès de l’ANR mais aussi récemment au
niveau de l’Europe ce qui n’était pas le cas dans le contrat quinquennal précédent.
A. Articulation labiale complétée : du mapping à la reconnaissance
Le contexte de cet axe est l’analyse/synthèse audio-visuelle en parole dans un cadre
vidéo (Figure-IV-2). L’objectif est d’explorer et modéliser les relations entre les espaces audio
et visuels de la parole. Nous nous placerons sur une échelle allant de bas niveaux d’interfaçage
« signal » pour le mapping entre paramètres audio et visuels à des interfaces nécessitant des
traitements de haut niveau en reconnaissance automatique pour le décodage phonétique en
passant par le niveau combinant mapping et classification.

50
Figure-IV-2 : deux systèmes d’analyse / synthèse en
parole avec LPC (version Française du Cued Speech)
pilotés en haut par l’audio et en bas par l’image. Dans les
deux situations, deux méthodes sont possibles : l’une
utilisant la reconnaissance automatique, l’autre le
mapping.
Ce programme, s’appuiera sur de grands corpus audio-visuels complets (phonèmes,
syllabes, mots, phrases) intégrant composantes gestuelles porteuse d’informations linguistique
relevant de différents niveaux (phonétique pour le Cued Speech, lexical, sémantique voire
pragmatique pour les gestes co-verbaux). Ils seront produits oralement par plusieurs sujets
enregistrés en vidéo.
Les paramètres considérés sont ceux porteurs des traces langagières. Typiquement,
l’espace audio peut être défini par des paramètres issus des composantes spectrales du signal
acoustique. L’espace visuel peut être décrit par des paramètres extraits de la région d’intérêt
des lèvres et caractéristiques de l’articulation labiale (paramètres de formes ou d’apparence :
nous avons pu montrer que certains des paramètres caractéristiques de ces deux approches sont
en relation linéaire) complétés par des paramètres de la région d’intérêt de gestes manuels
codant ou co-verbaux porteurs d’information linguistique et éventuellement de paramètres
supplémentaires issus d’autres régions d’intérêt intervenant dans l’interaction.
A partir de ces données, un premier volet de travaux d’ampleur en traitement d’image
sera mené. Il s’agira de traiter des problématiques de segmentation de séquences d’images et
d’objets (visage, les régions d’intérêt ROI labiales, de main, …) à l’intérieur des images ainsi
que leur mise en correspondance entre images pour prendre en compte des situations de
désynchronisation. Des méthodes par apprentissage, des outils de reconnaissance d’objets
utilisés en Traitement d’Image et en vision par ordinateur de façon plus générale pourront être
éprouvés pour le repérage des ROI et le suivi d’objets. Ils pourront être couplés à des méthodes
de traitement des collisions d’objets comme celles rencontrées en Cued Speech avec la main et
le visage. Les paramètres de description au sens de l’information contenue dans les ROI seront
étudiés en fonction de leur dimensionnalité et de leur robustesse aux conditions
d’enregistrement (éclairage, situation ou non de face à face,…).
Les résultats de ce premier volet pourront alimenter deux autres volets de recherche. Le
premier se concentrera sur la modélisation du mapping image vers audio et inversement audio
vers vidéo. Les résultats obtenus précédemment dans le cas des voyelles (Figue-3) pourront
servir de fondement à une extension aux autres unités de parole. Les méthodes de mapping

51
seront étudiées. Elles pourront s’appuyer sur des méthodes d’apprentissage automatique avec
les outils de Machine Learning et de logique floue.
Figure-IV-3 : Mapping Audio-Visuel.
Analyse/synthèse appliquée à la main et aux lèvres pour le cas des voyelles.
Le dernier volet aura pour objectif le décodage phonétique à partir de la reconnaissance
de l’articulation labiale y compris complétée dans le contexte de la conversion du visuel vers
l’audio. Ce programme répond à des questions en reconnaissance labiale, domaine qui connait
un regain d’intérêt, non seulement sur le plan scientifique mais aussi dans le contexte socio-
économique en réhabilitation mais aussi en surveillance. Ainsi les derniers systèmes en
reconnaissance labiale permettent d’atteindre 76 % (travaux récents du professeur Ahmad
Hassanat de l’Université de Mu’tah en Jordanie), performances comparables que nous avions
de notre côté déjà atteints dès 2010. Vous noterez que ce résultat dépasse déjà largement les
performances rencontrées chez les meilleurs lecteurs labiaux. Les performances supérieures à
76% peuvent être obtenues en rajoutant des traitements supplémentaires pouvant faire appel à
des modèles de langage (qui modélisent le contexte linguistique mais qui limitent la
généralisation) ou par le moyen de traitements supplémentaires qui intègrent des informations
linguistiques complémentaires comme celles issues des gestes du Cued Speech par exemple.

52
Nous avons ainsi pu atteindre des performances de 94,9% avec le Cued Speech sur un
vocabulaire de mots isolés (Heracleous, P., Beautemps, D. & Aboutabit, N., 2010),
performances comparables aux résultats en reconnaissance automatique à partir du seul son de
parole. Il s’agira donc dans ce contexte d’étendre nos travaux précédents aux autres unités de
parole. En particulier, les méthodes de fusion de paramètres seront étudiés. Les approches en
fusion directe de paramètres, ou en fusion de décisions ou encore hybrides, selon le classement
proposé par Potamianos et al., (2012) pourront être évalués.
Enfin, dans cet axe, l’ensemble des paramètres audio manipulés sont compatibles avec
ceux utilisés en synthèse audio incrémentale. Les résultats de cet axe pourront donc
naturellement s’ancrer sur les problématiques incrémentales.
B. Implant cochléaire et fonctionnalités audio-visuelles
L’implant cochléaire est un appareillage composé d’une partie externe contenant un
microphone qui capte le son, un processeur qui code l’information spectrale en signaux
numériques, une antenne magnétique en charge de transmettre les signaux numériques à la
partie interne, le récepteur qui est la partie interne de l’appareillage, composé d’un ensemble
d’électrodes posées sur la cochlée et dont la fonction est de stimuler les terminaisons nerveuses.
Le processus d’audition avec un implant cochléaire diffère du processus d’audition
naturel. Dans le cas de l’audition naturelle, les vibrations sonores sont transmises aux cellules
ciliées à l’intérieur de la cochlée. Un implant cochléaire utilise une impulsion électrique via les
électrodes pour stimuler plus précisément les cellules du ganglion spiral. Les cellules du
ganglion spiral sont situées dans une zone différente de la cochlée et reliées aux cellules ciliées.
La plupart des cellules du ganglion spiral se trouve dans une zone précise, la « zone auditive ».
C’est dans cette zone que la réponse à la stimulation électrique générée par l’implant cochléaire
est la plus forte. La zone auditive n’est pas très étendue dans la cochlée. Le concept consiste
donc à fournir une stimulation électrique aux cellules du ganglion spiral situées dans la zone
auditive pour obtenir des performances auditives optimales et réduire la profondeur d’insertion
afin de minimiser les risques liés à la stimulation apicale ou les traumatismes liés à l’insertion.
L'implant cochléaire est indiqué aux personnes ayant une surdité sévère ou totale et aux
personnes devenues sourdes. Enfin, c'est une chirurgie envisagée lorsque les appareils auditifs
classiques ne permettent pas d'amélioration, notamment quand la perte auditive est
principalement due à la transmission.

53
Dans le contexte de situation de parole avec bruit ou plus largement avec des sons
complexes (sources multiples, sons apériodiques,…), les performances de l’implant sont très
dégradées. Une étude récente avec le test FrMatrix (Jansen et al., 2012) en bruit adaptatif menée
au CHU sur des implants équipées des plus récentes technologies indique un écart de 6dB en
rapport signal sur bruit dans les performances (pour les meilleures) comparées à celles de sujets
entendants (communication personnelle du Professeur Sébastien Schmerber, PUPH, chirurgien
au service ORL du CHU de Grenoble). Cet écart de 6 dB en défaveur de l’implant est
considérable pour la perception de la parole. Il reste donc une marge de progression qui renvoie
à des enjeux de recherche en traitement automatique. Ils se déclinent en termes (i) de
localisation de la source de parole, (ii) de stratégie de codage –la dynamique disponible n’étant
que de 30 dB-, (iii) de réglages du gain des électrodes (iv) de mesure de la charge cognitive.
L’apport de la dimension visuelle est à étudier. En effet, à notre connaissance aucun
système n’intègre l’information visuelle qui permettrait pourtant des améliorations dans les
solutions de localisation et de débruitage, en particulier dans les cas d’implant mono-oral. Pour
le très jeune enfant, où tout est à apprendre, un implant augmenté de fonctionnalités visuelles
permettrait à la fois de rehausser l’audio lorsque celui-ci fixerait son interlocuteur en face à face
et renforcerait son intérêt pour les mouvements des lèvres de son interlocuteur.
C. Rhébotique : de la syllabe au discours
Le projet Rhébotique porte sur la parole multimodale à travers une approche très
originale, aussi bien par l’objet de la recherche que par la collaboration entre deux équipes
apparemment très éloignées mais unies par l’intérêt pour la production orale. Le mot-valise
Rhébotique marie en effet une dimension Rhétorique (équipe RARE) et un horizon en robotique
humanoïde (GIPSA-lab).
Le point de départ de la réflexion et du rapprochement a été l’intérêt commun des deux
unités de recherche pour la production de la voix et de la parole en situation de discours
institutionnelle et de parole travaillée. Une thèse sur cette problématique vient d’être soutenue
au sein de GIPSA-lab, sur la perception du charisme en politique (thèse de R. Signorello, 2014,
qui a donné lieu à un article dans Le Monde).
Pour l’équipe RARE, voici comment Francis Goyet Professeur à l’Université Stendhal
décrit le contexte de l’implication dans le projet : « Pour RARE (Rhétorique de l’Antiquité à la
Révolution), l’objectif est de tester un certain nombre d’hypothèses : corrélation entre effet de
saillance vocale et moments d’amplification, au sens rhétorique de ce mot ; importance du
moment d’un discours pour définir le type de ton utilisé ; variation continuelle du ton. L’intérêt

54
pour la voix et les gestes est ainsi l’aboutissement d’une réflexion sur la composition
d’ensemble des discours, grâce à un corpus ancien qui montre comment les professeurs de
rhétorique analysaient précisément et pas à pas un discours donné (réel ou fictif). RARE a ainsi
développé une expertise très opératoire en termes de codes rhétoriques, anciens mais aussi
modernes».
Pour GIPSA-lab, l’objectif est d’explorer les relations voix-gestes-parole dans le
contexte de la variabilité de la parole générée par l’hyper-hypo articulation. La théorie hyper-
hypo de Lindblom (1990) selon laquelle les locuteurs adaptent leur clarté de production en
fonction du niveau d’information nécessaire pour que l’auditeur perçoive le message
confortablement, a donné lieu à nombre de travaux, mais qui n’ont eu trait qu’au monitoring
audio de la parole.
Peu de travaux se sont intéressés aux autres modalités de la parole : la modalité visuelle,
le geste codeur et/ou co-verbal, les aspects liés à la voix. Le GIPSA-lab a déjà des travaux sur
les corrélats visuels (M. Dohen), les gestes co-verbaux (thèse de B. Roustan, 2012), les travaux
sur l’articulation labiale (Beautemps et al., 1999) ou la parole Lombard (Garnier et al., 2010).
Enfin, pas ou peu de travaux se sont intéressés aux inter-relations entre l’ensemble de ces
modalités dans le contexte hyper/hypo.
Le projet vise donc à étendre le cadre théorique de Lindblom aux composantes
multimodales de la parole en traitant l’hyper/hypo à partir de deux objectifs de communication
qui constituent une véritable originalité du projet: l’intelligibilité optimale du signal produit et
la recherche d’adhésion dans le discours codé (de la rhétorique en situation institutionnelle au
code switching en contexte bilingue). « Codé », parce qu’il est sujet à des conventions sociales,
des règles d’acceptabilité ou de connivence, et donc à des phénomènes de convergence ou au
contraire de divergence dans l’interaction.
Il s’agit en résumé d’un projet pluridisciplinaire sur un objet d’étude en parole
adaptative qui se situe à l’interface STIC/SHS. Le projet est composé d’actions conjointes
d’anthropologie linguistique et de linguistique de terrain, de rhétorique dans les productions de
parole instituées (discours officiels, professionnels, artistiques) dans le cadre SHS en lien avec
les disciplines expérimentales du domaine de la parole et du traitement du signal dans le cadre
STIC. L’alliance des deux unités dans ce projet est donc une opportunité d’une extension à la
multimodalité avec un éclairage nouveau issu du croisement des disciplines SHS et STIC.
Enfin, je tiens à préciser que la rédaction de ce projet est le fruit de plusieurs discussions avec
Francis Goyet et Christine Noille de l’équipe RARE, Professeurs en Rhétorique à l’Université
Stendhal, et de collègues du laboratoire GIPSA-lab, que je citerai en particulier, et dans l’ordre

55
alphabétique, Elisabetta Carpitelli, Maëva Garnier, Giovanni Depau, Marion Dohen, Nathalie
Henrich, Jean-Luc Schwartz, Nathalie Vallée et Coriandre Vilain entre autres collègues.
C.1. Méthodologie
La méthode utilisée dans ce projet s’appuie sur l’analyse de corpus constitués de
matériaux audio-visuels et/ou issus de systèmes à capture du mouvement existants ou à
enregistrer pour différents types de production et d’interaction, de tests perceptifs d’évaluation,
d’étiquetage de données, d’extractions de paramètres quantitatifs ou qualitatifs et de leurs
analyses. Les paramètres qui caractérisent ces productions relèvent du niveau segmental à
l’échelle de la syllabe ou du syntagme et de niveau supra-segmental à l’échelle du discours,
auxquels s’ajoutent des paramètres caractéristiques de l’effort vocal, de la réalisation
acoustique, de l’articulation labiale, des paramètres décrivant le geste codé ou le geste co-
verbal. Ce projet est un projet de données de production de parole et d’analyse de traits. Le
programme scientifique s’organise autour d’un premier axe sur « l’empathie, l’adhésion,
l’interaction en discours » et d’un second axe intitulé « intelligibilité, multimodalité et
complémentarité en parole » qui partageront des méthodes, outils et des questionnements. Dans
la suite, à toute fin de compréhension des enjeux de ce projet, je présente une version
synthétique de l’axe 1 sous forme de deux actions principales que j’ai proposées à la lumière
des discussions menées mais qui ne seront pas au centre de mon travail même si j’apporterai
mon expertise sur la constitution de corpus et les aspects d’analyse du signal (extraction
automatique et analyse de paramètres segmentaux et supra-segmentaux). Je détaillerai par
contre davantage le second axe, plus au cœur de ma prospective personnelle.
C.2. Axe 1 - Empathie, adhésion, interaction en discours
Dans cette partie, nous traiterons des corpus où l’adhésion et/ou l’empathie est/sont
recherchée(s) dans le discours en contexte d’interaction sociale.
Nous concrétiserons le travail dans cet axe par deux types de travaux s’appuyant sur
l'analyse vidéo : i) de discours préparés tels que des discours écrits pour l’oral et pertinents du
point de vue de l’archéologie des codes rhétoriques et dont on dispose de l’enregistrement vidéo
dans les ressources de l’INA et ii) de discours spontanés en bilinguisme utilisant le code
switching en contexte d’interaction sociale (voir par exemple Depau, 2012). Les analyses en
rhétoriques seront croisées par l’analyse de la production orale constituée de l’étiquetage des
différentes séquences, l’extraction de paramètres typiques de la production de la parole et de la
voix (pitch, formants, durées des pauses, unités de parole –leurs durées, leur frontières, …),

56
l’étude de leurs alignements en relation avec les choix lexicaux, les dimensions sémantique et
syntaxique, et les tours de parole le cas échéant. De plus l’adhésion pourra être évaluée par des
tests perceptifs sur une population cible avec l’aide de questionnaires et l’apport de la
multimodalité pourra être évalué en comparant les résultats obtenus en mode audio seul et en
mode audio-visuel.
Les résultats de ces analyses permettront de préciser les hypothèses et d’en déduire un
corpus à enregistrer en multimodalité dans le cadre de l’axe 2.
C.3. Axe 2- Intelligibilité, multimodalité et complémentarité en parole
Dans cette partie, on se situera sur une dimension allant du style de production « tout
audio et pas de visuel » (cas de la confidentialité et/ou du ventriloquisme) au style de
« purement visuel sans audio ». Des corpus audio-visuels seront enregistrés pour les différents
styles de parole considérés, dans le cadre d’un continuum sur la dimension audio-visuelle. Ils
pourront être induits au travers d’une interaction contrôlée avec l’aide d’un paradigme en
« Magicien d’Oz », de focus contrastif ou de code switching se contraposant à une situation de
non focalisation ou de neutralisation de l’effet d’alternance. En particulier on induira différents
degrés d’effort vocal et différentes intensités de parole. D’autre part, les résultats de l’axe 1
permettront de travailler sur un corpus de discours restitué oralement et enregistré en
multimodalité, ce qui constituera une seconde action de l’axe 2.
Les sujets seront enregistrés dans une chambre anéchoïque en vidéo (son + image)
couplé à un système d’électroglottographie (EGG), et d’un système optotrak de capture du
mouvement (Figue-IV-4). Les lèvres des sujets seront maquillées en bleu afin de faciliter
l’extraction automatique de leur contour à partir de l’enregistrement vidéo. Un système EGG
pourra être posé sur la peau du coup pour enregistrer l’activité des cordes vocale. Des diodes
optotrak seront placées sur les articulations des membres supérieurs, le dos de la main et
l’extrémité des doigts et permettront de suivre en 3 dimensions les gestes brachiaux-manuels.
Une diode sera placée sur le front afin d’enregistrer par ce même système les mouvements de
tête. Enfin ces systèmes de capture et de vidéo seront synchronisés afin d’assurer la cohérence
des mesures. Ce système complet est une originalité et constituera un des résultats en
expérimentation du projet.

57
Figue-IV-4
Dans la chambre anéchoïque de la
plateforme BEDEI de GIPSA-lab,
sujet équipé des diodes à émission
Infra rouges du système optotrak
Figue-IV-5
Séquence [sojuso] en condition normale de
production puis avec focus sur la syllabe cible
[ju]. De haut en bas le signal audio, les
coordonnées X, Y et Z de la diode située sur la
lèvre inférieure.
Figue-IV-6
Séquence [sojuso] avec geste
codeur en Cued Speech (i) en haut
tracé de la première composante
principale d’une des diodes du dos
de la main, (ii) en bas tracé de la
vitesse et de la vitesse filtrée pour la
condition normale (à gauche) et la
condition de focus (à droite). On
peut ainsi observer une tenue plus
longue de la syllabe intermédiaire
[ju].
A partir des paramètres extraits des composantes multimodales (paramètres audio –
intensité, fréquence fondamentale, …–, paramètres extraits de la région d’intérêt des lèvres,
coordonnées 3D, paramètres laryngés d’effort vocal,…), les décours temporels (les signaux)
et/ou leurs éventuelles combinaisons pourront être analysés (voir sur la Figue-IV-5 un exemple
en production de parole Cued Speech de signaux issus du système optotrak et en Figue-IV-6 un
exemple de combinaisons en composantes principales). Il pourra être identifié des patrons en
situation de parole normale (issus de l’analyse). Nous explorerons comment ceux-ci résistent
ou se renforcent en situations de parole hyper-hypo. Les collaborations mises en jeu au travers
des relations temporelles entre paramètres seront analysées ainsi que les stratégies de
compensation développées en situation d’effacement d’une des composantes multimodales. En
plus de ces questionnements, une attention particulière sera apportée à la question de la syllabe
et du phénomène de re-syllabification qui peut être mis en œuvre dans ce contexte. Enfin ces
analyses seront croisées avec celles issues de l’archéologie des codes rhétoriques et plus
précisément en rhétorique de l’amplification et de l’atténuation (Macé, 2014).
La population étudiée sera composée de participants n’ayant pas de pathologie de la
parole et de la voix. Cette population sera complétée par l’étude de cas particuliers : les
ventriloques, pour lesquels la production de parole doit être non visible ; la parole produite par
des personnes aveugles de naissance, qui utilisent moins l’articulation labiale dans leur
production que les personnes voyantes et les personnes sourdes de naissance et oralistes qui
utilisent la modalité labiale comme modalité principale en parole. Ces populations qui
produisent naturellement la parole perturbée seront comparées avec la population de
participants dont la production est contrainte.
0 1 2 3 4 5 6 7 8 9-1
0
1
temps, en seconde
sig
nal audio
séquence : "so ju so" normale puis avec focus sur "ju"
0 1 2 3 4 5 6 7 8 9180
200
220
X,
en m
m
Lèvre inférieure
0 1 2 3 4 5 6 7 8 9170
175
180
185
Y,
en m
m
0 1 2 3 4 5 6 7 8 9-2940
-2930
-2920
Z,
en m
m
temps, en seconde

58
Les résultats du projet pourront s’évaluer en termes de nouvelles données multimodales
numériques mises à disposition de la communauté scientifique, nouveaux systèmes
expérimentaux et nouveaux paradigmes. Des publications dans les conférences et dans les
journaux phares des domaines concernés ainsi que l’organisation d’une journée d’études sont
aussi des attendus du projet. Ce projet pluri-disciplinaire sur la thématique interdisciplinaire en
parole devrait permettre en plus de capitaliser de nouvelles données en adaptabilité, d’obtenir
des avancées et des éclairages nouveaux en retour sur les différents domaines disciplinaires du
consortium. Enfin ce projet possède des enjeux en technologie des systèmes de parole, plus
particulièrement en synthèse multimodale de la parole et robotique humanoïde, avec
l’alimentation de ces systèmes en connaissances supplémentaires en adaptabilité.
59
CONCLUSION
Cet exercice m’a permis de rassembler et d’ordonner les travaux que j’ai pu diriger
(thèses, stages de recherches, projets contractualisés) dans le contexte de ma recherche et
présenter des éléments de prospective. Le bilan est décliné en trois chapitres qui présentent des
problématiques en parole augmentée dans l’ordre de la chronologie de leur réflexion. Tout
d’abord c’est l’étude de la production du code LPC, un augment manuel des lèvres, qui a
constitué une contribution inédite dans le domaine du Cued Speech. Elle a ainsi permis de
comprendre comment le geste accompagne la parole en mettant en évidence une avance
moyenne de l’ordre de 200 ms du geste LPC sur celui des lèvres, avance exploitée par les
personnes sourdes dans leur perception de la parole. Les résultats sur la coordination main-
lèvres ont permis d’alimenter le premier système de synthèse audiovisuelle de parole augmenté
de code LPC intégrant des données de production. De nouveaux champs de recherche en
perception se sont nourris de ce travail pionnier en production.
La fusion de l’information de main et celle disponible aux lèvres, tenant compte de leur
décalage temporel, a été un des enjeux principaux dans les traitements automatiques de la
reconnaissance labiale augmentée par le code LPC. Les meilleurs scores obtenus à partir de ces
informations purement visuelles rivalisent ceux de la reconnaissance audio de la parole. L’étude
du mapping entre paramètres audio et paramètres visuels caractéristiques du mouvement des
lèvres et de main a fait ressortir la possibilité avec la modélisation par GMM de prédire la région
d’intérêt des lèvres et la position à atteindre par la main sur le côté du visage avec de bons
scores de réplication. Cet ensemble de travaux a permis d’alimenter le projet TELMA labellisé
par l’ANR et visant une interface de conversion automatique entre son de parole et parole avec
LPC. Ils sont aussi source d’enjeux de prospective en traitements automatiques visant à
généraliser les approches à des unités de parole plus complexes et à des conditions de
production moins contraintes.
L’ensemble des résultats sur la production du Cued Speech a permis d’éclairer comment
ce système est ancré sur la parole. Ce système purement visuel avait été conçu pour compléter
l’information issue de la lecture labiale et permettre aux personnes sourdes oralistes une
perception complète de la parole. Ce système d’une certaine manière renvoie à l’audition, ce
qui est d’autant plus intéressant avec les développements récents de l’implant cochléaire et la
réhabilitation de l’audition qu’il permet, même si elle n’est pas parfaite. L’implant cochléaire
et la lecture labiale peuvent en quelque sorte être aussi considérés comme complémentaires, et
nous avons pu en effet mettre en évidence qu’une collaboration audiovisuelle pouvait être

60
exploitée efficacement en co-perception et production de la parole. Là aussi des enjeux de
perspective tant en traitements automatique qu’en perception s’ouvrent.
Enfin, la problématique de la surdité a permis d’utiliser la surdité profonde comme
paradigme intéressant afin d’étudier la production sonore de parole sous les aspects physique.
En effet, elle permet d’éviter tout contrôle lié au feedback auditif.
Ce projet en parole augmentée et adaptative apporte des contributions significatives aux
domaines du traitement automatique de la parole, de la production et de la perception dans les
dimensions audio et visuelles. Il se réalise grâce à une alliance entre disciplines allant de la
physique pour les sciences de l’ingénieur à la socio-linguistique voire la rhétorique en passant
par le traitement du signal et la phonétique grâce à des compétences relevant des SHS, STIC et
SPI que j’ai pu regrouper dans des projets communs de thèse, de contrats passés ou à venir.
Enfin, la rédaction de cette habilitation a nécessité que je prenne un temps de retrait et
de solitude pour mener à bien l’approfondissement de ma réflexion. Cela a été clairement une
solitude choisie pour cet exercice. Mais puisqu’il s’agit d’un état dans lequel le chercheur que
je suis a pu être amené à se trouver et risque encore d’y être confronté, que ce soit le « simple »
ressenti dans le cas de la sensation d’être dans une impasse ou de solitude subie comme celle
du responsable face à une situation difficile, source de souffrance, ou encore lorsqu’il s’agit de
la solitude acceptée voire recherchée comme un moyen de la réflexion, source de créativité et
de dépassement personnel, je souhaite vous partager quelques citations philosophiques et les
conclusions que j’en ai tirées.
Ainsi, "La solitude offre à l'Homme intellectuellement haut placé un double avantage : le
premier, d'être avec soi-même, et le second de ne pas être avec les autres". Cette citation du
philosophe allemand Schopenhauer exprime l'idée selon laquelle la solitude permettrait une
réflexion sur soi-même. Cependant "l'homme seul est quelque chose d'imparfait; il faut qu'il
trouve un second pour être heureux". A travers cette citation, Pascal soutient que l'on ne peut
vivre heureux dans la solitude et que l'Homme a besoin d'autrui pour atteindre le bonheur en
renvoyant à la société.
Solitude et société devraient donc composer et se succéder selon la conception de Sénèque.
Mais c’est justement cette solitude qui s’installe lorsqu’on réalise le fossé qui peut exister entre
certains enjeux scientifiques et les réalités des situations de terrain que nous pouvons croiser
chaque jour. Car il n’est pas toujours facile de trouver la matérialité du trait d’union entre le
monde de la pensée et celui de l’action. Et à ce paradoxe s’ajoute celui de l’homme moderne
qui par son exigence de liberté et d’autonomie appartient à une société individualiste alors qu’il
éprouve pourtant dans le même temps le besoin de créer et de maintenir des liens sociaux

61
comme en témoigne Jean-François Mattei dans son discours de clôture de la journée dédiée à
la solitude en 2013 organisée par la Fondation Croix-Rouge Française. Mon engagement
depuis longtemps dans ce mouvement humanitaire concrétise pour moi ce trait d’union. Il me
permet de toucher des enjeux de société, avec au centre la personne dans son corps, son esprit
et dans toute sa dimension sociale, d’être à la fois dans le concret des actions qui peuvent
apporter des solutions rapidement aux situations rencontrées ce qui en retour me permet de
relativiser les soucis, qui dans un autre contexte pourraient être caractérisés comme exagérés,
tout en alimentant mon travail de recherche en intérêts de société.

62

63
Références bibliographiques
Aboutabit, N., 2007. Reconnaissance de la Langue Française Parlée Complétée. Manuscrit de
thèse, Université de Grenoble.
Attina, V., 2005. La Langue française Parlée Complétée : production et perception. Phd
dissertation. Institut National Polytechnique de Grenoble, Grenoble, France.
Attina, V., Beautemps, D., Cathiard, M.A., Odisio, M., 2004. A pilot study of temporal
organization in Cued Speech production of French syllables: rules for Cued Speech synthesizer.
Speech Communication 44, 197-214.
Auer, E.T. Bernstein, L.E., 2007. Enhanced Visual Speech Perception in Individuals With
Early-Onset Hearing Impairment. Journal of Speech, Language, and Hearing Research, Vol.50,
pp. 1157-1165.
Beautemps D., Borel P., Manolios S., 1999. Hyper-articulated Speech: Auditory and Visual
intelligibility. In Proceedings of the 6th European international conference EUROSPEECH,
Budapest, Hungary, 5-9 September, 1999.
Beautemps, D., Badin, P. & Bailly, G., 2001. “Linear degrees of freedom in speech production:
Analysis of cineradio and labio-films data for a reference subject, and articulatory-acoustic
modelling”. Journal of the Acoustical Society of America, 109, 5, 2165 – 2180.
Beautemps, D., Cathiard, M. A. & Leborgne Y., 2003. Benefit of audiovisual presentation in
close shadowing task. In Proceedings of ICPHS conference, Barcellona, Spain.
Beautemps, D., Cathiard, M. A., Attina, V., Savariaux, C., 2012. Temporal organisation of
Cued Speech Production. In Audiovisual Speech Processing, G. Bailly, P. Perrier & E.
Vatikiotis-Bateson (Eds), pp. 104-120.
Benoit, C., Lallouache, T., Mohamadi, T., Abry, C., 1992. A set of French visemes for visual
speech synthesis. In: Bailly, G., Benoit, C. (Eds.), Talking Machines: Theories, Models and
Designs. Elsevier Science Publishers, Amsterdam, pp. 485-504.
Bernstein, L.E., Demorest, M.E., Tucker, P.E., 2000. Speech perception without hearing.
Perception & Psychophysics 62(2), 233-252.
Bernstein, L.E., Auer, E.T., Jr, & Jiang, J., 2010. "Lipreading, the lexicon, and Cued Speech",
in C. la Sasso, J. Leybaert, K. Crain (Eds.), Cued Speech for the Natural Acquisition of English,
Reading, and Academic Achievement. Oxford University Press.
Carton, F., 1974. Introduction à la phonétique du Français. Collection "Etudes", Série de
Langue française dirigée par Jean Batany. Bordas, Paris/ Bruxelles/ Montréal.
Cornett, R., 1967. Cued Speech. American Annals of the Deaf 112, 3-13.
Duchnowski, P., Lum, D., Krause, J., Sexton, M., Bratakos, M., and Braida, L. D., 2000.
Development of speechreading supplements based on automatic speech recognition. IEEE
Transactions on Biomedical Engineering, 47 (4):487–496.
Depau G. (2012), Italien et sarde dans l’espace urbain de Cagliari : plurilinguisme et contexte

64
d’interaction. CoReLa – Cognition Représentation Langage, HS11 « Cotexte, contexte,
situation » [on line : ttp://corela.edel.univ-poitiers.fr].
Durand, J., B. Laks & C. Lyche (eds.)(2009). Phonologie, variation et accents du français. Paris:
Hermès.
Garnier, M., Henrich, Dubois, D. (2010). Influence of Sound Immersion and Communicative
Interaction on the Lombard Effect, Journal of Speech, Language, and Hearing Research,
American Speech-Language-Hearing Association, 2010, 53 (3), p. 588-608.
Giovanni A., Yu P., Révis J., Guarella MD., Teston B., Ouaknine M. (2006). "Analyse objective
des dysphonies avec l'appareillage EVA. Etat des lieux.", Revue Oto-Rhino-Laryngologie
Française, 90, p3 183-192.
Heracleous, P., Beautemps, D., Aboutabit, N., 2010. Cued Speech automatic recognition in
normal-hearing and deaf subjects. Speech Communication 52(6): 504-512.
Jansen S., Luts H., Wagener K.C., Kollmeier B., Del Rio M., Dauman R., James C., Fraysse
B., Vormes E., Frachet B., Wouters J., & Van Wieringen A. (2012). Comparison of three types
of French speech-in-noise tests: A multi-center study. Int J Audiol, 51 (3), 164-73.
Leybaert, J., 2000. Phonology acquired through the eyes and spelling in deaf children. Journal
of Experimental Child Psychology 75, 291-318.
Leybaert J, LaSasso CJ., 2010. Cued speech for enhancing speech perception and first language
development of children with cochlear implants.Trends Amplif. 2010;14(2):96-112.
Lindblom, B. (1990). Explaining phonetic variation: A sketch of the H & H theory, In W. J.
Hardcastle & A. Marchal: "Speech Production and, 403-439, Kluwer Academic Publishers,
Dordrecht.
McGurk and John MacDonald, 1976. "Hearing lips and seeing voices", Nature 264, 746-748.
MacDonald, J., McGurk, H., 1978. Visual influences on speech perception processes.
Perception and Psychophysics 24, 253-257.
Macé, S. (dir.) (2014). Dossier « Sur l’amplification ». Exercices de rhétorique, n. 4, décembre
2014.
Potamianos, G., Neti, C, Gravier, G., Garg, A. and Senior, A.W, 2003. Recent advances in the
automatic recognition of audiovisual speech,” in Proceedings of the IEEE, vol. 91, Issue 9, pp.
1306–1326.
Potamianos, G., Neti, C., Luettin, J., and Matthews I. (2012). Audiovisual automatic speech
recognition. In G. Bailly, P. Perrier, E. Vatikiotis-Bateson (Eds), Audiovisual Speech
Processing, pp. 193-247.
Reisberg, D., Mclean, J., Goldfield, A., 1987. Easy to hear but hard to understand: a lipreading
advantage with intact auditory stimuli. In: Dodd, R., Campbell, R. (Eds.), Hearing by Eye : The
Psychology of Lipreading. Lawrence Erlbaum Associates Ltd, Hillside, NJ, pp. 97-113.
Roustan, B. (2012). Etude de la coordination gestes manuels/parole dans le cadre de la
désignation. Manuscrit de thèse, Université de Grenoble.

65
Scarbel, L., Beautemps, D., Schwartz J.-L., and Marc Sato, 2014. The shadow of a doubt?
Evidence for perceptuo-motor linkage during auditory and audiovisual close-shadowing.
Schwartz, J., Robert-Ribès, J., Escudier, P., 1998. Ten years after Summerfield: A taxonomy
of models for audio-visual fusion in speech perception. In: Campbell, R., Dodd, B. (Eds.),
Hearing by Eye II: Advances in the Psychology of Speechreading and Auditory-Visual Speech.
Psychology Press, Hove, UK, pp. 85-108.
Signorello, R. (2014). La voix charismatique : aspects psychologiques et caractéristiques
acoustiques. Manuscrit de thèse, Université de Grenoble.
Strelnikov, K., Rouger, J., Lagleyrec, S., Frayssec, B., Deguine, O., Barone, P., 2009;
Improvement in speech-reading ability by auditory training: Evidence from gender differences
in normally hearing, deaf and cochlear implanted subjects. Neuropsychologia 47, 972–979.
Sumby, W.H., Pollack, I. (1954). Visual contribution to speech intelligibility in noise. Journal
of the Acoustical Society of America 26 (2), 212-215.
Summerfield, Q., 1979. Use of visual information of phonetic perception. Phonetica 36, 314-
331.
Summerfield, A., 1987. Some preliminaries to a comprehensive account of audio-visual speech
perception. In: Dodd, R., Campbell, R. (Eds.), Hearing by Eye: The Psychology of Lipreading.
Lawrence Erlbaum Associates Ltd., Hove, UK, pp. 3-51.

66

67
Annexe : 7 publications significatives
Beautemps, D., Badin, P. & Bailly, G., 2001. “Linear degrees of freedom in speech production:
Analysis of cineradio and labio-films data for a reference subject, and articulatory-acoustic
modelling”. Journal of the Acoustical Society of America, 109, 5, 2165 – 2180.
Beautemps, D., Cathiard, M. A., & Leborgne, Y., 2003. Benefit of audiovisual presentation in
close shadowing task. In Proceedings of ICPHS conference, Barcellona, Spain.
Aboutabit, N., Beautemps, D. & Besacier, L., 2007. Automatic identification of vowels in the
Cued Speech context. In Proceedings of the International Conference on Auditory-Visual
Speech Processing (AVSP), 2007.
Heracleous, P., Beautemps, D., Aboutabit, N., 2010. Cued Speech automatic recognition in
normal-hearing and deaf subjects. Speech Communication 52(6): 504-512.
Beautemps, D., Cathiard, M. A., Attina, V., Savariaux, C., 2012. Temporal organisation of
Cued Speech Production. In Audiovisual Speech Processing, G. Bailly, P. Perrier & E.
Vatikiotis-Bateson (Eds), pp. 104-120.
Ming, Z., Beautemps, D., Feng, G., 2013. GMM Mapping Of Visual Features of Cued Speech
From Speech Spectral Features. In Proceedings of the International Conference on Auditory-
Visual Speech Processing (AVSP), 2013.
Lucie Scarbel, Denis Beautemps, Jean-Luc Schwartz, S. Schmerber, Marc Sato.
(2014). L'ombre d'un doute ? Interactions perceptivo-motrices lors de taches de close-
shadowing auditive et audio-visuelles. Journées d'Etudes sur la Parole (JEP 2014), June 2014,
Le Mans, France.

68

Beautemps, D., Badin, P. & Bailly, G., 2001. “Linear degrees of freedom in speech production:
Analysis of cineradio and labio-films data for a reference subject, and articulatory-acoustic
modelling”. Journal of the Acoustical Society of America, 109, 5, 2165 – 2180.


Redist
Linear degrees of freedom in speech production: Analysis ofcineradio- and labio-film data and articulatory-acoustic modeling
Denis Beautemps,a) Pierre Badin,b) and Gerard Baillyc)
Institut de la Communication Parle´e, UMR CNRS 5009, INPG–UniversiteStendhal, 46, Av. Fe´lix Viallet,F-38031 Grenoble Cedex 1, France
~Received 15 August 1999; accepted for publication 8 February 2001!
The following contribution addresses several issues concerning speech degrees of freedom inFrench oral vowels, stop, and fricative consonants based on an analysis of tongue and lip shapesextracted from cineradio- and labio-films. The midsagittal tongue shapes have been submitted to alinear decomposition where some of the loading factors were selected such as jaw and larynxposition while four other components were derived from principal component analysis~PCA!. Forthe lips, in addition to the more traditional protrusion and opening components, a supplementarycomponent was extracted to explain the upward movement of both the upper and lower lips in@v#production. A linear articulatory model was developed; the six tongue degrees of freedom were usedas the articulatory control parameters of the midsagittal tongue contours and explained 96% of thetongue data variance. These control parameters were also used to specify the frontal lip widthdimension derived from the labio-film front views. Finally, this model was complemented by aconversion model going from the midsagittal to the area function, based on a fitting of themidsagittal distances and the formant frequencies for both vowels and consonants. ©2001Acoustical Society of America.@DOI: 10.1121/1.1361090#
PACS numbers: 43.70.Bk@AL #
hane-
s
is
s
omartehanonla-n
t
bann
sks.vingnsti-torsram-
of
in-
gi-
not,on
ryinty
d to
hisicalon-
un-cana
ti-
apeeid-
d
I. INTRODUCTION
‘‘Speech is rather a set of movements made audible ta set of sounds produced by movement,’’ posited Stetso1928 ~p. 29!. This statement could be more properly rphrased as ‘‘Speech can be regarded as theaudibleandvis-ible signals resulting from articulatory movement,’’ astated, for instance, in thespeech roboticsapproach fosteredin the collaborative European projectSpeech Maps~Abryet al., 1994!. In this framework, the speech apparatusviewed as aplant driven by a controller so as to recruitarticulators and coordinate their movements, which havemultaneous acoustic and visual consequences.
The concept of plant and controller implies the notiona relatively small number ofindependent degrees of freedofor the articulatory plant, i.e., the specification, for eachticulator, of a limited set of movements that can be execuindependently of each other by the articulator. As empsized by Kelsoet al. ~1986!, however, the speech productioapparatus is made of a large number of neuromuscular cponents that offer a potentially huge dimensionality awhich must be functionally coupled in order to produce retively simple gestures@this view forms the basis of the concept of coordinative structures in speech, cf. Fowler aSaltzman~1993!#. Maeda~1991! refers to a similar concepin terms of ‘‘elementary articulators.’’
One independent degree of freedommay be more pre-cisely defined for a given speech articulator as one variathat can completely control a specific variation of shapeposition of this articulator, and that is statistically indepe
a!Electronic mail: [email protected]!Electronic mail: [email protected]!Electronic mail: [email protected]
2165 J. Acoust. Soc. Am. 109 (5), Pt. 1, May 2001 0001-4966/2001/1
ribution subject to ASA license or copyright; see http://acousticalsociety.org
nin
i-
f
-d-
m-d-
d
led-
dent of the other degrees of freedom over a set of taThese degrees of freedom can be determined by obserthe correlations between the various parameters that cotute the accurate geometrical description of the articulashapes and positions, and retaining only independent paeters. These correlations stem from mainly three levelsimplicit or explicit constraints:~1! physical continuity of thearticulators~the tongue cannot have a jigsaw shape forstance!; ~2! biomechanical constraints~the range of possiblearticulators shapes and positions is limited by the physiolocal properties of the bony structures and of the muscles!; and~3! the nature of the task in relation with control~chewinginvolves lateral translations of the jaw, but speech doesand thus jaw has different degrees of freedom dependingthe task observed!. The correlations observed on articulatomeasurements thus cannot always be ascribed with certato either biomechanical constraints or to strategies relatethe task. For instance, Hoole and Kroos~1998! observed thatlarynx height and lip protrusion are inversely correlated: tcorrelation obviously cannot be explained by biomechanlinks between lips and larynx, but should be ascribed to ctrol strategies related to the speech task. It thus appearsderstandable that determining which properties of speechbe attributed to the plant and which to the controller isrecurrent issue in speech motor control~cf., e.g., Perkell,1991; Scully, 1991; Abryet al., 1994!.
It has long been known that midsagittal profiles constute a privileged representation of speech articulation~cf.,e.g., Boe¨ et al., 1995, for a review on vowel representations!.Indeed, for most phonemes, the complete vocal tract shcan be fairly well inferred from the midsagittal plane, thmost notable exception being lateral sounds. Moreover, msagittal profiles allow linking of vocal tract articulation an
216509(5)/2165/16/$18.00 © 2001 Acoustical Society of America
/content/terms. Download to IP: 152.77.24.10 On: Mon, 05 Jan 2015 16:28:58

binge
ototh
lac
f
a-e
e
arc
thd
sula
oratic;
oecryon
neus-
ensogucoottalact
mte
lhetao
reta
this
rob-y-
ofrree-
be-la-
fully
ehe
ce.cmli-
idhis
re-tedgeera.
sec-ro-
ct’s
di-alityta,
rmitt of
jectfforlledtedtionnsre
at
Redist
the resulting acoustics. Articulatory models can thereforeviewed as one of the most efficient means of manipulatvocal tract shapes, and midsagittal profiles as a privileinterface betweenmotor controlon the one hand andacous-tic and visualmodules of the speech production systemthe other hand. Developing and evaluating such articulamodels finally constitutes a good means for identifyingdegrees of freedom of speech articulators.
Among the large number of studies devoted to articutory modeling since the seventies, two main approachesbe identified:functional articulatory modeling, where the po-sition and shape of articulators are algebraic functions osmall number of articulatory parameters, and explicitbiome-chanical modeling, where the position and shape of articultors are computed from physical simulations of the forcgenerated by muscles and of their consequences on thticulators.
In linear articulatory models, the relations betweenticulator positions and shapes and the control parameterseither be defined in geometrical terms, in which casedegrees of freedom of the articulatory plant are decideapriori and fitted to the dataa posteriori~cf., e.g., Coker andFujimura, 1966; Liljencrants, 1971; Mermelstein, 1973!, orbased on articulatory data measured on one or severaljects, in which case the degrees of freedom of the pemerge from the data ~cf., e.g., Lindblom andSundberg, 1971; Maeda, 1990; Starket al., 1996!.
The general approach of biomechanical articulatmodels consists in modeling muscular forces and articulstructure by means of methods inspired from mechananalysis and numerical simulation~cf., e.g., Perkell, 1974Wilhelms-Tricarico, 1995; Laboissie`re et al., 1996; Payanand Perrier, 1997!. These models present the advantagebeing physical models with intrinsic dynamics, although nessarily extremely simplified, but their control remains vecomplex, in particular due to the high number of degreesfreedom represented by each individual muscle commaSanguinetiet al.’s ~1998! work constitutes a good illustratioof this. They fitted, with their model, the articulator shapand positions measured from the x-ray database alreadyby Maeda~1990! and determined, by optimization, the commands of the 17 muscles involved in their model. They idtified then, by linear component analysis applied in thecalled l-space corresponding to the biomechanical toncontrol parameter space, the synergies between thesemands, and showed that six independent components caccount for most of the data variance of the midsagitongue shape. These first six components are closely reto the degrees of freedom that could be extracted direfrom the original x-ray contours~Maeda, 1990!. It thus ap-pears that, from the point of view of the degrees of freedosuch complex biomechanical models are not a prerequisithe accurate description of static speech articulation.
Rather than developinga priori complex biomechanicamodels with degrees of freedom in large excess and treducing this high dimensionality based on articulatory dawe have adopted a dual approach in the present work. Mprecisely, our objectives were to determine the linear degof freedom of one subject’s articulators in the midsagit
2166 J. Acoust. Soc. Am., Vol. 109, No. 5, Pt. 1, May 2001
ribution subject to ASA license or copyright; see http://acousticalsociety.org
egd
nrye
-an
a
sar-
-ane
b-nt
yoral
f-
fd.
sed
--em-
uldl
tedly
,to
n,reesl
plane, and to build anarticulatory-acoustic plantthat couldbe considered a faithful and coherent representation ofsubject’s articulatory and acoustic capabilities.
The present paper describes our approach to this plem: ~1! design of the corpus and collection of articulatoracoustic data for one subject,~2! analysis of the data andextraction of the independent linear degrees of freedomthe articulators, and~3! the development of a lineaarticulatory-acoustic model based on these degrees of fdom.
II. ARTICULATORY AND ACOUSTIC DATAACQUISITION METHODOLOGY
A. The experimental setup: Synchronized cineradio-and labio-film
Cineradiography was chosen as the best compromisetween good spatial and temporal resolutions for the articutory data. This technique, which has been used successfor speech studies at the Strasbourg Phonetic Institute~cf.,e.g., Bothorelet al., 1986!, was used in synchrony with thvideo labiometric method developed at ICP by Lallouac~1990! ~cf. also Badinet al. 1994a!. The recordings wereperformed at the Strasbourg Schiltigheim Hospital, FranThe subject’s head was positioned at a distance of 50from the x-ray emitter and 20 cm from the radiance ampfier. An aluminum filter was placed in the lip region to avooverexposure of the lips, thus improving the contrasts in tregion ~cf. Bothorel et al., 1986!. The vocal tract imagesproduced by the radiance amplifier were captured andcorded by a 35-mm film camera. The subject’s lips, painin blue to allow the lip contours to be extracted by an imaprocessing procedure, were recorded using a video camBoth cameras were operating at a rate of 50 frames perond. The speech signal, captured by a directional micphone placed at a distance of 10 cm from the subjemouth, was synchronously recorded.
B. The subject
The choice of the set of subjects always poses alemma: a single subject study surely reduces the generof the work but allows us to gather rich and detailed dawhereas a study with a larger panel of subjects may peus to draw some general conclusions but limits the extenthe data that can be practically acquired and processed.
Under the auspices of the European collaborative proSpeech Maps, Abry et al. ~1994! aimed to gather a variety oconverging and complementary articulatory/acoustic dataone subject uttering the same speech material in a contromanner in different experimental setups. This policy resulin a large set of data of potential use in speech producmodeling, such as vocal tract acoustic transfer functio~Djeradi et al., 1991!, acoustic and aerodynamic pressuand flow in the tract~Stromberget al., 1994; Badinet al.,1995; Shadle and Scully, 1995!, electropalatography dat~Badinet al., 1994b!, and more recently 3D MRI vocal tracimages~Badinet al., 1998, 2000! and video face data~Badin
2166Beautemps et al.: Degrees of freedom in speech production
/content/terms. Download to IP: 152.77.24.10 On: Mon, 05 Jan 2015 16:28:58

heor
josandeov
atate
ntg
selifhettaevemcfreoxsitre
cloft
si
wo
urseseactum,hean
id
thatt of
thenim-an-
ksnot
od-y-
-ana-ati-
hetureors
ry
Redist
et al., 2000!. As the present study was conducted in tframework of this project, the same subject was therefchosen as areferencesubject.
C. The corpus
As mentioned in the previous section, one of the maaims of the present study was to determine the degreefreedom of a subject’s articulators for speech, excludingother nonspeech movements. Attaining this goal would ially require recording a large corpus of speech material ctaining all possible combinations of phonemes. This is obously not practical in general, and particularly inappropriin the case of cineradiography, due to health hazards relto this method. The corpus was thus designed to includmany combinations of Vowel Consonant Vowel~VCV! se-quences as possible in a very limited amount of time.
The voiced French plosive and fricative consonaC5@vzcbdg# were chosen in six vocalic contexts involvinthe four French extreme vowels V5@aiuy#:aCa, aCi, aCu,iCi, iCu, iCy. It was assumed that the voiceless cognatethese consonants correspond approximately to the samticulation. The presence of voicing was expected to simpthe tracking of formants during fricative consonants. TFrench@l# was excluded because of the impossibility of gting information on the lateral channels from midsagitx-ray pictures. Nasals were also excluded because vmovements do not directly influence other articulators moment~although nasal vowels in French seems to imply soadditional tongue backing compared to other vowels,e.g., Zerling, 1984!, and will thus be studied in the neafuture. Finally the French@r# was also not included becausit was not hypothesized to require extra degrees of freedfor the midsagittal profile. The extreme vowels were epected to represent the most extreme vocalic articulationFrench. Moreover, the fricative items were interspersed w@p#’s in order to allow the estimation of subglottal pressuduring the fricatives as the intraoral pressure during thesure of @p# ~Demolin et al., 1997!. In addition, a series oconnected vowels@a}eiyuoÖ# was recorded in order to tesformant/cavity affiliation hypotheses~Bailly, 1993!. Finally,the corpus duration could be reduced to about 24.5 s ofnal ~actually leading to 1222 pictures!, with the followingdistribution of phonemes: 30@ai#, 12 @u#, 6 @y#, 6 @vzcbdg#,18 @p#. Table I presents the complete corpus.
D. Processing of the x-ray and video images
For each picture, the sagittal contours were first draby hand from a projection of the picture onto a piece
TABLE I. Corpus used for the cineradiographic recordings.
@a}eiyuoÖ#
@pavapavipavupivipivupivy#@pazapazipazupizipizupizy#@pacapacipacupicipicupicy#
@abaabiabuibiibuiby#@adaadiaduidiiduidy#@agaagiaguigiiguigy#
2167 J. Acoust. Soc. Am., Vol. 109, No. 5, Pt. 1, May 2001
ribution subject to ASA license or copyright; see http://acousticalsociety.org
e
rofy-
n-i-eedas
s
ofar-ye-llar-e.,
m-inh
-
g-
nf
paper, digitized by a scanner, and finally 11 subcontowere hand-edited by means of an interactive software. Thsubcontours correspond to different articulators or vocal trregions: the upper and lower lips, the hard palate, the velthe different components of the pharynx, the larynx, ttongue, the jaw, and the hyoid bone. Figure 1 presentsexample of the resulting midsagittal contour. Note that rigstructures~hard palate, jaw, hyoid bone! were not drawnagain for each image, but were given reference contoursbest fitted most of the shapes observed on the whole seimages; for these structures, the operator’s task wasonly to optimally position the reference shapes for eachage by roto-translation. This procedure presented four advtages:~1! the operator’s task was made easier and faster;~2!it reduced the noise due to manual drawing;~3! it avoidedthe difficulty of precisely determining reference landmarsuch as incisor edges from images where the contrast isalways very high;~4! it offered the possibility of determiningin a straightforward manner the positions of these rigid bies in the midsagittal plane~see the discussion on jaw analsis below!.
Concerning the lips, the blue of the video front lip images was converted into absolute black by means of anlogue Kroma-key, and the inner contour was then automcally determined by simple adapted thresholding~cf.Lallouache, 1990, or Badinet al., 1994a, for more details!.
E. Articulatory measurements
Before going into some details, it is useful to specify tmidsagittal coordinate system attached to the skull strucand used in this study. The lower edge of the upper incisis given arbitraryx/y coordinates~5,10! in cm. Thex-axis ispositive in theposterior direction of the head~toward theback!, and negative in theanterior direction ~toward thenose!; they-axis is positive in thesuperiordirection~towardthe brain!, and negative in theinferior direction ~toward the
FIG. 1. Example of manually drawnVT contours and associated articulatomeasures: upper lip protrusionProTop, lower lip protrusionProBot, upperlip elevationLipTop, jaw heightJawHei, jaw advancementJawAdv, tonguetip advancementTngAdv, tongue tip heightTngTip, tongue floor heightTng-Flo, tongue bottomTngBot, height of the larynx topLarTop, height of thelarynx bottomLarHei, x/y coordinates of the hyoid boneXHyoid,YHyoid.
2167Beautemps et al.: Degrees of freedom in speech production
/content/terms. Download to IP: 152.77.24.10 On: Mon, 05 Jan 2015 16:28:58

eo
rs
t
-ps
lip
ripelasffi0
th
bsdem
aanydnxtis
en
f tornttstoeorse
n
ttta
c
c-byyr in-twoys-or-blerti-
hehethehisinggbye
rstithittalled-ray
ted.mens.d
hetheob-
es ofansomy-d toing
ofeenee-n intherked
Redist
feet!. Finally, it happens that the direction of themaxillaryocclusal plane~defined as the plane ‘‘given by the tips of thcentral incisors and at least two other maxillary teethopposite sides of the mouth,’’ Westbury, 1994!, is oriented atan angle of 4.6° from they50 axis.
The values of a number of geometrical parameters~seeFig. 1! have been determined from the midsagittal contouupper ProTop and lowerProBot lip protrusions, upper lipelevation LipTop, jaw height JawHei, jaw advancemenJawAdv, tongue tip advancementTngAdvand heightTngTip,tongue floor heightTngFlo, tongue bottomTngBot, height ofthe larynx topLarTopand bottomLarHei, x/y coordinates ofthe hyoid boneXHyoid, YHyoid. In addition, three parameters were extracted from the video front views of the lilip height B, lip width A, and the intra-labial lip areaS.
Note that the distance between the upper and lowercan be determined either from the midsagittal profileLipHeior from the front viewB: as expected, the two measures avery close to each other,B being less accurate when the lopening is close to zero, particularly for the rounded vow@uy#, due to the fact that the subject’s upper lip tends to mthe intra-labial orifice in such cases. The correlation coecient between the measures is 0.99, while the rms error iscm.
The articulators are expected to follow relatively smootrajectories due to their long time responses~cf., e.g., the jawcharacteristic resonance frequency of 5–6 Hz mentionedSorokin et al., 1980!. Deviations of geometric measurefrom their smooth trajectories revealed that the noise adby the whole chain of acquisition was in the range of 1-mpeak-to-peak.
F. Midsagittal contours
A semi-polar grid has been used to describe the midsittal contours, as has traditionally been done since HeinzStevens~1965! or Maeda~1979!. However, as proposed bGabioud~1994!, two parts of this grid have been made ajustable in order to follow the movements of the lary~gridlines 1 to 6, line 1 being the lowest one near the glot!and the movement of the tongue tip~in fact, the tongueblade, defined as the linguistic classcoronal articulation;grid lines 24 to 28!. This grid presents a double advantag~1! the number of intersection points between the grid athe tongue contour is constant, whatever the extension otongue tip or of the larynx, which is a crucial feature ffurther statistical analysis:~2! the fact that the measuremegrid follows tongue tip movements implies that all the poinin the vicinity of the tongue tip present a behavior closethat of flesh-points, i.e., points mechanically attached to thtongue surface, which is more than just a descriptiontongue shape~this is useful when recovering tongue contoufrom flesh-points coordinates measured by electromagnarticulometry; see Badinet al., 1997!. Finally, a third part ofthe grid has been introduced to describe the alveolar decavity with adjustable grid lines~grid lines 29 to 33! equallyspaced between the tongue tip and the lower edge ofupper incisor. The inner and outer vocal tract midsagicontours intersect thus the grid lines at 2333 points; eachcontour can thus be represented by the 33-element ve
2168 J. Acoust. Soc. Am., Vol. 109, No. 5, Pt. 1, May 2001
ribution subject to ASA license or copyright; see http://acousticalsociety.org
n
:
:
s
e
sk-.1
y
d
g-d
-
:dhe
f
tic
tal
hel
tor
~referred to asInt andExt! of the abscissa of these intersetion points along the grid lines. Note that, as mentionedWestbury~1994!, the dimensionality of the articulators machange depending on the coordinate system used. Fostance, a point running on a fixed circle appears to havelinearly independent degrees of freedom in a Cartesian stem, but only one single degree of freedom in a polar codinate system. The choice of the dynamically adjustasemi-polar grid system seems a good solution to avoid aficial overdimensionality.
The velum is terminated in the midsagittal plane by tuvula. It can be in contact with the upper surface of ttongue, however, without creating a real constriction invocal tract, since air remains free to flow on each side. Tfact has been approximately taken into account by makthe velum artificially thinner by a factor linearly increasinfrom 0 at its extremity to about 40% at its base, andshifting the result so as to align its posterior wall with thpharyngeal wall.
G. Formants
The speech signal was digitized at 16 kHz, and the fifour formant values were estimated using LPC analysis wa 20-ms window centered on the times where the midsagviews were acquired, leading to formant trajectories sampat 50 Hz. Because of the background noise due to the xemitter, the signal-to-noise ratio was rather poor~about 25dB!, and thus some of the formants had to be hand-ediThis was done in reference to another version of the sacorpus recorded by the subject in good recording conditioThe F1/F2 and F1/F3 spaces for the pooled vowels anconsonants are shown in Fig. 2.
III. ANALYSIS OF THE INDEPENDENT LINEARDEGREES OF FREEDOM OF THE MIDSAGITTALCONTOURS
A. Principles
1. Identifying degrees of freedom
As mentioned in Sec. I, the approach taken in tpresent study to determine the degrees of freedom ofvarious speech articulators is based on articulatory datatained from onesubjectproducing a givencorpusin a givenlanguage.
In general, speech articulators possess excess degrefreedom, i.e., a given articulation can be achieved by meof different combinations of the available degrees of freedof the articulators~cf. bite-block experiments performed bLindblom et al., 1979!. Control strategies finally aim at recruiting these degrees of freedom when they are needeattain given articulatory/acoustic/visual goals, and leavthem free to anticipate other goals whenever possible~this isone basic principle ofcoarticulation!. In the present datadriven approach, the problem is to decide the repartitionthe variance of the measured articulatory variables betwthe different variables associated with the degrees of frdom. The present work rests on a common consideratiospeech motor control modeling: what is explained bybiomechanics of the speech plant does not need to be wo
2168Beautemps et al.: Degrees of freedom in speech production
/content/terms. Download to IP: 152.77.24.10 On: Mon, 05 Jan 2015 16:28:58

thr
apth
dct’,leti
ththa-
ntd
ofd bypo-edd
ra-g
ual
t ofub-ext
orsval-the
earCA
si-o-ni-entthem-ina-
a-r toari-ticu-
u-ob-enense itionthe
nyis,s
entsion
ee.thely
dy,
Redist
out by the controller~Abry et al., 1994; Perrieret al., 1996,2000!. In other words, any correlation observed betweenarticulatory variables should be used to reduce the numbedegrees of freedom of the articulators. However, thisproach must be carefully balanced by another criterion,biomechanical likelihood. For instance, if larynx height anlip protrusion are inversely correlated due to the subjearticulatory control strategy~cf., e.g., Hoole and Kroos1998!, two separate degrees of freedom should neverthebe considered, even at the price of some residual correlabetween the corresponding parameters.
2. Linear component analysis
Another important assumption in the present work islinearity of the analysis and of the associated model:shape data vectorsDT are decomposed into linear combintions of a set of basic shape vectorsBV weighted by loadingfactorsLF, in addition to their averageneutral shapeDT:
DT5DT1LF•BV.
Each loading factorLFi corresponds to an independelinear component, if its cross correlation with the other loa
FIG. 2. MeasuredF2/F1 ~top! andF3/F1 ~bottom! formant spaces~in Hz!for the vowels and consonants pooled.
2169 J. Acoust. Soc. Am., Vol. 109, No. 5, Pt. 1, May 2001
ribution subject to ASA license or copyright; see http://acousticalsociety.org
eof-e
s
sson
ee
-
ings is zero over the corpus of data. The dimensionalitythe articulators’ shapes and positions can thus be exploreclassical linear analysis techniques such as principal comnent analysis~PCA! and linear regression analysis, as carriout by Maeda~1990, 1991!, whose approach largely inspirethe present work.
Maeda’s approach to this decomposition was to itetively determine each linear component in the followinway: ~1! the loading factorLFi is determined from the dataas described below;~2! the associated basis shape vectorBViis determined by the linear regression of the current residdata for the whole corpus overLFi; ~3! the correspondingcontribution of the component is computed as the producthe loadings by the basis shape vector, and is finally stracted from the current residue in order to provide the nresidue for determining the next component.
For some of the linear components, the loading factwere arbitrarily chosen as the centered and normalizedues of specific geometric measurements extracted fromcontours, such as jaw or larynx height. For the other lincomponents, loading factors were derived by standard Papplied to specific regions of the tongue contour.
Note that the solution of this type of linear decompotion is not unique in general: PCA delivers optimal compnents explaining the maximum data variance with a mimum number of components, but Maeda’s linear componanalysis allows a certain room of maneuver to controlnature and repartition of the variance explained by the coponents~for instance to make them more interpretableterms of control!, at the cost of a suboptimal variance explnation.
In this rest of this section, the various geometric mesures are studied using statistical linear analysis in ordedetermine the correlations between these articulatory vables and to determine the degrees of freedom of the arlatory plant.
B. Jaw
The tongue is naturally identified as an important articlator in speech production, and its midsagittal contours,tained from x-ray profile views of the vocal tract, have bethe focus of most modeling efforts. The jaw has long berecognized as one of the main speech articulators, becaucarries both the tongue and the lips. Its specific contributto tongue shape has been clearly identified and related tophonetic features of vowels~Lindblom and Sundberg, 1971!.The dimensionality of jaw motion has been studied by maresearchers~cf., e.g., Westbury, 1988; Edwards and Harr1990; Ostryet al., 1997!. The jaw, a rigid body, possessesix geometrical degrees of freedom~three rotations and thretranslations!; however, it appears that for speech, movemeare mostly restricted to the midsagittal plane if the rotataround the jaw axis is neglected~cf., e.g., Ostryet al., 1997!,which reduces the degrees of freedom of the jaw to thrFrom simple geometrical considerations, it is clear thatposition of the jaw as a rigid body in a plane is uniquedefined by one rotation~defined here asJawRot! and by thetwo x/y translations of a reference point attached to the bochosen as the upper edge of the lower incisors~defined here
2169Beautemps et al.: Degrees of freedom in speech production
/content/terms. Download to IP: 152.77.24.10 On: Mon, 05 Jan 2015 16:28:58

le
—
bia5
ttit
g
afrethbwxiivethth
jaumo
e
it
-n be
thetend
aent
ject,ther
entreeenaltednguere-
fs
n,
the
ureey to
esy,
he
thrf the-
Redist
as JawHei and JawAdv; see Fig. 1!. Figure 3 displays theresulting distribution of lower incisor position for the whocorpus.
PCA was applied to the centered—but nonnormalizedjaw position dataJawAdvandJawHei. The first componentexplains 97.0% of theJawAdvand JawHei data variance.The overwhelming importance of this component couldpredicted intuitively from the fact that the standard devtions of JawAdvand JawHei are, respectively, about 0.07and 0.419 cm.
The jaw height componentJH corresponding to the firsdegree of freedom of the jaw data was thus defined asJawHeivariable centered on its mean and normalized bystandard deviation. A second component, correspondinjaw advance,JA was defined as the residue ofJawAdvcen-tered and normalized once the linear contribution ofJH wasremoved. It can be concluded that for the present subjectcorpus, the jaw possesses two independent degrees ofdom in the midsagittal plane, although the second componwould have a rather limited influence on the tongue andlips, as will be discussed further. The jaw was observed tomost retracted for labio-dentals: indeed this retraction allothe lower incisors and the upper lip to get in contact. Mamum jaw protrusion was observed for the coronal fricat@z#: this facilitates the creation of a constriction betweenanterior region of the tongue blade and the front region ofalveolar ridge.
C. Tongue
The tongue shape is defined by the vectorInt of theabscissa of its intersections with the grid lines. Since thecarries the tongue, the contribution of its movements shofirst be subtracted from tongue movements to maintain sobiomechanical likelihood. However, due to the complexitythe muscular links between tongue and jaw~cf., e.g., San-guineti et al., 1998!, it is very difficult to separate tongumovements induced by jaw movements from those dueactive actions of tongue muscles themselves. In a studyvolving three subjects~including the subject of the presen
FIG. 3. Dispersion of the lower incisor upper edge superimposed oncontours of the hard palate and of the jaw.
2170 J. Acoust. Soc. Am., Vol. 109, No. 5, Pt. 1, May 2001
ribution subject to ASA license or copyright; see http://acousticalsociety.org
e-
hesto
ndee-ntees-
ee
wlde
f
ton-
study!, Bailly et al. ~1998! showed that the slope of the regression line that links jaw height and tongue abscissa casubstantially greater than unity~by almost 100%!. Thismeans that tongue movements are apparently larger thanassociated jaw movements, indicating that the subjectsto actively move both jaw and tongue in synergy. In suchcase, the passive tongue movement due to jaw movemneeds to be determined. However, for the present subthis synergy was rather weak compared to that of the osubjects~regression slopes lower than 1.15!, and did notneed to be taken into account: theJH parameter was directlyconsidered as the first linear loading factor for each elemof Int, and the corresponding prediction coefficients weobtained as the coefficients of the linear regression betwInt andJH computed over all the items. Finally, the residuvectorInt_JH, computed as the difference between predicand measured values, for all the items, represents the toshape from which the contribution of the jaw has beenmoved.
The variance of the originalInt data and the variance othe Int_JH residual data can be examined in Fig. 4 in termof standard deviation~i.e., as the square root of the variance!,as a function of grid line number. Table II gives, in additiothe global percentage of the totalInt data variance explainedby JH ~numerical column 1!.
The influence of the second jaw parameterJA upontongue contours will be addressed later in this section.
The next step of the analysis consisted of extractingdegrees of freedom of the residual vectorInt_JH. Gabioud~1994! showed that PCA applied to the whole tongue contoled to poor modeling of the tongue tip, even using thrcomponents. It was thus decided to apply PCA separatelthe tongue body~gridline 7 to 24! and to the tongue tip~lines24 to 28!.
A first PCA procedure was thus applied to the residuof the 18 points considered for the tongue bodInt_JH~7:24!. The first two components were retained. T
eFIG. 4. Standard deviation~in cm! against gridline number for the innecontour of the vocal tract for the successive residues when the effect oparameters are removed one by one~Raw data: solid line; data after suppression of the contribution ofJH ‘‘ s,’’ then of TB ‘‘ 1,’’ then of TD ‘‘ 3,’’and finally ofTT ‘‘ * ’’ !.
2170Beautemps et al.: Degrees of freedom in speech production
/content/terms. Download to IP: 152.77.24.10 On: Mon, 05 Jan 2015 16:28:58

geth
Thheom
edn
ncta
e
--
t,ic
b
ab
da,
e-
r
on
rs
vari-y.
pe.ementsorss
ent
ofhf
on-rrorlatedof
ofely
ridline
urs
tndin
Redist
corresponding principal axes are characterized by the eivectors associated with the highest two eigenvalues ofcross-correlation matrix computed from these residues.projections of the centered and normalized residues on ttwo principal axes give the values of the two associated cponents:tongue bodycomponentTB, and tongue dorsumcomponentTD, which describe, respectively, thefront–backand flattening–arching movements of the tongue~see alsothe nomograms in Fig. 8!. These components were then usas predictors for the whole tongue contour. Table II presea summary of the proportion of the total tongue data variaexplained by each component, while Fig. 4 shows the deof the variance of the residues.
The tongue tip was found to possess two independdegrees of freedom@its coordinates, measured asTngAdvandTngTip1 ~see Fig. 1! are plotted in Fig. 5#: indeed, the resi-dues ofTngAdvandTngTip, after subtraction of the contributions ofJH, TB, andTD ~determined by the linear regression of TngAdvand TngTip for the whole corpus overJH,TB, and TD! are clearly not correlated. A first componenmore generally dedicated to the representation of the apregion of the tongue, was then extracted: thetongue tipcom-ponentTT is defined as the first component determinedthe PCA of the residues of the tongue tip region~lines 24 to28!, from which the contributions ofJH, TB, andTD havebeen removed. Its effects can be observed in Fig. 4 and TII.
The tonge advanceparameterTA was defined as thecentered and normalized residue of the measured tonguevanceTngAdvfrom which the contributions ofJH, TB, TD,andTT were subtracted. Since it was, as expected, founhave a negligible predictive power on the tongue abscisswas not used as a loading factor forInt, but just to controlthe longitudinal extension of the grid in the front mouth rgion.
In order to test the influence of theJA parameter upontongue contours, two experiments were carried out: in a pcedure similar to that applied toJH, JA was used as thesecond imposed loading factor for the tongue analysis inexperiment, and as the loading factor imposed afterJH, TB,TD, and TT in the other experiment. It was found thatJAexplained only 1.3% of the tongue data variance in the fi
TABLE II. Summary of data variance explanation for the tongue contoColumn Design indicates how the factor was extracted. First columnVarshows the ratio of data variance explained by the factor for the caseinfluence of jaw movements is taken into account by one parameter oThe second and third columnsVar show the ratio of data variance explainewhen jaw is taken into account by two factors, the second factor beimposed at two different stages of the analysis.
Param. Design Var. Var. Var.
JH Jaw height 52.2% 52.2% 52.2%JA Jaw advance 1.4%TB PCA/tongue body 28.8% 28.6% 28.8%TD PCA/tongue body 11.4% 10.4% 11.4%TT PCA/tongue tip 3.6% 3.6% 3.6%JA Jaw advance 0.2%
Total 96.0% 96.1% 96.1%
2171 J. Acoust. Soc. Am., Vol. 109, No. 5, Pt. 1, May 2001
ribution subject to ASA license or copyright; see http://acousticalsociety.org
n-eese-
tse
ils
nt
al
y
le
ad-
toit
o-
e
t
case~see Table II, numericalVar column 2!, and 0.2% in thesecond case~numericalVar column 3!. A comparison of theassociated nomograms in Fig. 6 suggests that the dataance explained byJA in the first case is actually explained bthe other componentsTB, TD, and TT, in the second caseThis hypothesis is also supported by results in Table II~andby a more detailed analysis of tongue shape data!. JA wastherefore not used as a control parameter of tongue sha
In summary, the tongue contours in the grid line systpossess four degrees of freedom, controlled by componJH, TB, TD, and TT. These four components account f96% of the tongue variance data, which is only 1.5% lethan the variance explained by the first four independcomponents~but with no direct articulatory interpretation! ofa principal component analysis. The standard deviationthe residual error~normally distributed around zero on eacgridline! reaches a maximum of 0.15 cm in the vicinity othe pharynx and of 0.1 cm at the tongue tip. The rms recstruction error for the tongue, i.e., the root mean square ebetween the measured tongue data and the data calcuwith the linear decomposition, amounts to a global value0.09 cm, while reaching maxima of 0.15 cm in the vicinitythe pharynx and of 0.1 cm at the tongue tip. The relativpoor modeling of the tongue tip extremity~which results in
FIG. 5. Plot of theTngAdv/TngTipcoordinates of the tongue tip~note thatthese are expressed in the rotated coordinate system attached to the gfor the front part of the vocal tract; see Fig. 1!. Phonemes /Ö/, /c/, /}/ arereferred to by symbols X, Z, and E, respectively.
FIG. 6. Articulatory nomograms forJA. Left: case whereJA is the secondloading factor in the analysis; right: case whereJA is the fifth loading factorafter JH, TB, TD, andTT.
.
hely.
g
2171Beautemps et al.: Degrees of freedom in speech production
/content/terms. Download to IP: 152.77.24.10 On: Mon, 05 Jan 2015 16:28:58

oid
Redist
TABLE III. Correlation coefficients of some articulatory measurements. Absolute values higher than 0.6 are in bold face.
JawHei JawAdv LipHei LipTop ProTop ProBot TngTip TngAdv TngFlo TngBot LarHei XHyoid YHy
JawHei 1.000JawAdv 20.226 1.000LipHei 0.641 20.039 1.000LipTop 20.448 0.127 0.176 1.000ProTop 20.463 0.148 20.443 0.060 1.000ProBot À0.608 0.062 20.673 0.024 0.912 1.000TngTip À0.734 0.207 20.325 0.375 0.027 0.150 1.000TngAdv 0.412 20.108 0.366 20.242 20.568 20.571 0.142 1.000TngFlo À0.593 0.053 20.290 0.219 20.083 0.056 0.877 0.454 1.000TngBot 20.038 20.109 20.347 20.325 0.352 0.411 20.219 20.205 20.160 1.000LarHei 20.358 20.068 À0.550 20.136 0.574 0.664 0.005 20.380 20.008 0.797 1.000XHyoid 0.733 20.128 0.544 20.259 20.416 20.533 20.556 0.288 20.469 20.169 20.421 1.000YHyoid 0.355 0.100 0.522 0.099 20.460 20.572 20.047 0.351 20.033 20.815 À0.859 0.574 1.000
thisroth
i-o
o
is
natlle
-o
i-ura-ueana
l-
rento
in
talits
ntso-
edIn-nxtegy
mal-
i-xe
jaw
only minor acoustical effect! is mainly due to measuremeninaccuracies related to the difficulty of precisely defining ttongue tip extremity. A supplementary articulatory contparameter could be extracted to more precisely controlpharyngeal region as implied in the6Advanced TongueRoot languages~cf., e.g., Tiede, 1996!.
Recall finally that the grid system is controlled, in addtion, by two parameters, i.e.,TA, and a parameter related tLarHei that will be defined in Sec. III E.
D. Lips
A PCA analysis revealed that 98.4% of the variancethe lip measuresLipHei, LipTop, ProTop, andProBotcan beexplained by three independent components, in additionthe natural contribution of jaw height to lip shape. Thisexpected, as lip protrusionsProBot andProTopare stronglycorrelated~cf. Table III!. Note also that in another study othe same subject, where the lip shape was more accurdescribed as a three-dimensional mesh of points controby the 3-D coordinates of 30 control points~Reveret andBenoı&t, 1998!, Badin et al. ~2000! also found that three degrees of freedom were sufficient to describe the positionthe lips on a corpus of 34 sustained articulations~Frenchvowels and consonants!, in addition to theJH contribution~the JA contribution explained only 1% of the lip data varance!. These degrees of freedom are related to three gestlip protrusion/rounding, lip closure, and a sort of simultneous vertical movement of both lips as needed for the sject to realize labio-dentals. In order to simplify the modand its relations to simple articulatory measurementsacoustic interpretations of the lip horn, we decided to useequivalent set of components:~1! a component related toLipHei, taken into account byLH, the centered and normaized residue ofLipHei after removing theJH contribution;~2! a component related toProTop, LP, the centered andnormalized value of the residue ofProTop after removingthe JH contribution; and~3! a component related to a mevertical, roughly synchronous, movement of both upper alower lips relative to upper incisors lower edge, taken inaccount by thelip vertical positionparameterLV, the cen-tered and normalized residue ofLipTop after removingJH,LH, andLP contributions. Note that this approach resultsa slight correlation betweenLP and LV. Note also that the
2172 J. Acoust. Soc. Am., Vol. 109, No. 5, Pt. 1, May 2001
ribution subject to ASA license or copyright; see http://acousticalsociety.org
le
f
to
elyd
f
es:
b-ldn
d
horizontal jaw retraction aiming at producing labio-denconstrictions is not taken into account as such, but thatacoustical consequences are dealt with in an indirect way~cf.Sec. IV B 3!.
E. Other articulatory measurements
Finally, a number of other articulatory measuremewere analyzed. Table III provides the linear correlation cefficients between these measurements.
Table III shows thatLarHei is partially correlated withProBot, ProTop, and LipHei. These correlations cannot bexplaineda priori by obvious biomechanical effects, anwill thus be ascribed to the speaker control strategies.deed, it is clearly established that lip rounding and larylowering constitutes, for some subjects, a synergetic strafor high rounded vowels@uy# ~Hoole and Kroos, 1998!. Lar-ynx height was thus represented by its centered and norized valueLY, and further used to control the grid system~cf.Sec. IV A 2!.
The horizontal position of the hyoid bone,XHyoid, isvery highly correlated to jaw height, while its vertical postion, YHyoid, is even more strongly correlated to larynheight~see Table III and Fig. 7!. These two components ar
FIG. 7. Plots showing the relations between hyoid bone coordinates andand larynx heights.
2172Beautemps et al.: Degrees of freedom in speech production
/content/terms. Download to IP: 152.77.24.10 On: Mon, 05 Jan 2015 16:28:58

Redist
TABLE IV. Correlation coefficients of the articulatory control parameters of the model.
JH TB TD TT TA LY LP LH LV
JH 1.000TB 1.000TD 1.000TT 1.000TA 1.000LY 20.358 20.041 0.272 20.499 20.103 1.000LP 0.215 0.472 20.125 20.118 0.461 1.000LH 20.256 20.039 0.236 20.075 20.417 20.215 1.000LV 0.215 0.065 20.006 20.164 20.045 1.000
in
ryonrsnitihu
asef
eo
a
as.tho
e-
eeatu
he
lt-rs
tiallyna-a-
es,the
,-in
inin
erhat
urs
clearly less correlated with each other~correlation coefficientR50.574), than found by Westbury~1988! using a morerestricted corpus for a single subject (R50.871).
Note that the position of the highest connection pobetween tongue and epiglottis, referred to asTngBot ~seeFig. 1!, is highly correlated withLarHei, as expected. Theelevation of tongue floorTngFlo is correlated withTngTipandJawHei.
IV. BERGAME: AN ARTICULATORY-ACOUSTICMODEL
As stated above, the main function of an articulatomodel is to offer a compact representation of articulatii.e., a representation that needs as few control parametepossible and is nevertheless accurate enough to be meaful for speech. The analysis presented in the previous secprepared the ground for establishing such a model, whicnecessarily the result of a compromise between a minimnumber of control parameters and a maximal explanationthe data variance~or minimal data reconstruction error!. Thepresent section describesBergame, an articulatory-acousticmodel developed at ICP with the aim of mimickingclosely as possible experimental data gathered on the rence subject.
Bergameconsists of:~1! a physiologically oriented lin-ear articulatory model, based on the articulatory data msured from the cineradiofilm and the video labiofilm madethe reference subject;~2! a model of midsagittal-to-arefunction conversion based on the same subject;~3! an acous-tic model.
A. The linear articulatory model
The principle of a linear articulatory model is tocalcu-late the position and shape of the various articulatorslinear combinations of the articulatory control parameterThe development of the model thus amounts to definingcontrol parameters and to determining the coefficientsthese linear combinations. The nine parameters chosencontrolling the articulatory model stem directly from the prvious component analysis:JH, TB, TD, TT, TA, LY, LH, LP,andLV, which are dimensionless, centered, and normalizThese parameters are, in most cases, orthogonal toother, the exceptions~see Table IV! being due to the subjecand language specific control strategies. The model eqtions are described in some detail in the following. Tmodel behavior is illustrated in Fig. 8 byarticulatory nomo-
2173 J. Acoust. Soc. Am., Vol. 109, No. 5, Pt. 1, May 2001
ribution subject to ASA license or copyright; see http://acousticalsociety.org
t
,as
ng-onismof
er-
a-n
s
ef
for
d.ch
a-
grams, i.e., the variations of the midsagittal contours resuing from variations of the articulatory control parametefrom 23 to 13 with 11 steps.
1. Jaw
The jaw has been shown above to possess essenone degree of freedom for this subject and the corpus alyzed. Jaw position is therefore controlled by the single prameterJH that definesJawHei_modby the simple linearrelation:
JawHei_mod5JawHei_mean1JawHei_std•JH,
whereJawHei_stdis the standard deviation ofJawHei andJawHei_meanits mean over the corpus.
2. Tongue, midsagittal distances, and vocal tractouter contours
Since the tongue contours are attached to the grid linthe next necessary step is to determine the position ofmobile parts of the grid system, namelyTngAdvandLarHei.The modeled tongue advance,TngAdv_mod, was found to bealmost linearly related toTA, JH, TB, andTD, and was there-fore controlled by:
TngAdv_mod5TngAdv_mean
1pred_TngAdv_JH_TB_TD_TA
•@JH,TB,TD,TA#,
where @JH,TB,TD,TA# is the matrix of control parametersandpred_TngAdv_JH_TB_TD_TAare the associated coefficients determined by multiple linear regression. As seenSec. II E,LarHei is controlled only byLY, and notLP andLH, despite a slight correlation between lips and larynx,order to ensure an independent control of lips and larynxthe model.LY is therefore partially correlated with a numbof other control parameters, as seen in Table IV. Note tTngAdvandLarHei are reconstructed without error.
Finally, the abscissa of the whole tongue contoInt_mod~lines 1 to 28! is determined as linear combinationof the parametersJH, TB, TD, andTT:
Int_mod5Int_mean1pred_Int_JH_TB_TD_TT
•@JH,TB,TD,TT#.
Figure 8 displays articulatory nomograms forJH, TB,TD, TT, andTA as well.
2173Beautemps et al.: Degrees of freedom in speech production
/content/terms. Download to IP: 152.77.24.10 On: Mon, 05 Jan 2015 16:28:58

Redist
FIG. 8. Articulatory nomograms: variations of the midsagittal contours resulting from variations of the articulatory control parameters from23 to 13 with11 steps. Note that the movements of upper and lower lips areoppositefor the LH nomogram, butparallel for the LV nomogram.
leutoio
thre
ionng
lyotis
lips
r
-
The midsagittal distances have been similarly handThe abscissa of the vocal tract outer contours are compas the sum of the abscissa of the tongue and the corresping midsagittal distances, except for the hard palate regthat is considered as a fixed contour.
3. Lips
It has been shown above that the lip geometry ofsubject is best described with three degrees of freedom,resented byLH, LP, andLV, in addition to the contributionof JH. The lip horn, considered as the vocal tract reganterior to the upper incisor plane, is represented by a sitube section, with a lengthProLip_modproportional to theprediction of theLipTop dimension, with a proportionality
2174 J. Acoust. Soc. Am., Vol. 109, No. 5, Pt. 1, May 2001
ribution subject to ASA license or copyright; see http://acousticalsociety.org
d.ednd-n
ep-
le
factor of 0.6. This length reduction aims at approximatetaking into account the fact that the lip corner position is nknown, and that the effective acoustical end of the lip hornlocated between the lip corner and the extremities of themeasured by ProTop and ProBot. The parameterProLip_modis thus defined by:
ProLip_mod50.6•~ProTop_mean
1pred_ProTop_JH_LH•@JH,LH# !,
where the coefficientspred_ProTop_JH_LHare obtained bymultiple linear regression.
Lip height LipHei_modis similarly modeled as a lineacombination ofJH, LH, andLP, as well as lip widthA_mod.Lip vertical positionLipTop_Modis also a linear combina
2174Beautemps et al.: Degrees of freedom in speech production
/content/terms. Download to IP: 152.77.24.10 On: Mon, 05 Jan 2015 16:28:58

Redistr
FIG. 8. ~Continued.!
-
vevt
id
sgt
aiou
cetoeFit
dwi
th
ittaldel-git-ss-
cal
up
e--he
e-
ying
tion of JH, LH, LP, andLV. Figure 8 shows also the articulatory nomograms relating these lip parameters.
B. Midsagittal and area functions—Acoustic models
The midsagittal contour alone is not sufficient to derithe corresponding vocal tract acoustic features. Acousticcal tract models are indeed based on tube acoustics, andneed a description of the vocal tract in terms ofarea func-tion. Most studies devoted to the problem of converting msagittal distancesd to area functionsS resulted in solutionsbased on the ‘‘a,b model’’ proposed by Heinz and Steven~1965!, whereS5a•db: the principle consists in calculatinthe area of each vocal tract section as a power function ofcorresponding midsagittal distance~cf., e.g., Beautempset al., 1995, for more details!. Finally, vocal tract aero-acoustic simulations in the time or in the frequency domallow the computation of the speech signal or speech actic characteristics from the area function~cf., e.g., Maeda,1982; Badin and Fant, 1984; Mawasset al., 2000!.
1. Vocal tract
The midsagittal function represents the sagittal distanbetween the tongue contour and the outer vocal tract conalong the vocal tract midline, estimated for each sectionclosed between two consecutive measurement grid lines.each section, a quadrilateral can be defined in the midsagplane by the intersection points of the tongue contour anthe vocal tract outer contours with the corresponding tlines of the grid. The midsagittal distance for this sectioncalculated as the surface of the quadrilateral divided bylength of the section. Following Heinz and Stevens~1965!,
2175 J. Acoust. Soc. Am., Vol. 109, No. 5, Pt. 1, May 2001
ibution subject to ASA license or copyright; see http://acousticalsociety.org
o-hus
-
he
ns-
surn-ortalofose
the vocal tract area function is estimated from the midsagfunction. It uses an extended version of a conversion mo~Beautempset al., 1996! optimized for both vowels and consonants: the area function is then derived from the midsatal function using a polynomial expression where the crosectional areaS depends on both the midsagittal distancedand thex distance from the glottis measured along the votract midline:
S~x,d!5a1~x!•d1a2~x!•d1.51a3~x!•d21a4~x!•d2.5.
The a i(x) functions are expressed as Fourier series,to the third order, ofp.x/ l tot , where thel tot is the vocal tractlength ~including the lips!:
a i~x!5ai0~x!1 (n51
3
ain•cosS np
l totxD1 (
n51
3
bin
•sinS np
l totxD .
The values of the Fourier coefficients~altogether, 28 pa-rameters! were optimized so as to minimize, for the N slected configurations, thex2 distance between the four formantsFik computed from the area function derived from tsynthesized contours and the formantsFik
c measured on theacoustic signal of the original data:
x25(i 51
N
(k51
4~Fik
c 2Fik!2
Fikc .
At first, the optimization procedure was applied to a rstricted set of eight vowels@a}eiyuoÖ#, in order to ensure aneasy convergence. The results were then refined by appl
2175Beautemps et al.: Degrees of freedom in speech production
/content/terms. Download to IP: 152.77.24.10 On: Mon, 05 Jan 2015 16:28:58

eura
lisiftioopub
herebq
ses
lemh
e-o,efieatidntluati
wi
urthysgtt f0
gu
onthe
den
k ofllareare-
lipng,
terhe
o-ndcu-
theic-adeoffor
al oftheric-of
ndby
-
of
Redist
the same optimization procedure to the whole corpus,cluding only the data for which measurement of the foformants was not possible, i.e., excluding the 347 configutions mainly associated with occlusive consonants@pbdg#.
Dang and Honda~1998! developed a similar polynomiadecomposition where the coefficients, a function of the dtance from the glottis, are determined by minimizing the dference between the estimated and MRI-based area funcfor five Japanese vowels. The present procedure, develbefore any 3-D vocal tract data were available for the sject, does not make use of 3-D data. However, Badinet al.~1998! subsequently acquired 3-D MRI data allowing tdirect determination of both midsagittal contours and afunctions for a set of vowel articulations for the same suject. These data have therefore been used to assess theity of this algorithm: for the ten French vowel@a}eiyuoÅÖ!# the comparison between the areas directlytimated from the 3-D measurements~excluding the larynxregion and the lips for which no MRI data were availab!and those computed by the present procedure from thesagittal contours estimated from the 3-D measurementsrevealed a global root mean square~rms! error value lowerthan 0.6 cm2. The relatively important rms error~more than1 cm2) observed in the low pharyngeal region for@aÅÖ!# isprobably due to the whispered production mode usedmaintain the articulation during the long 3-D MRI data rcording duration whose main consequence is a more cstricted tongue in the back region~cf. Matsuda and Kasuya1999!. This implies a decrease of the cross-sectional arbetween the glottis and the epiglottis and probably modithe relation between the midsagittal distances and the relarea functions. Finally, in the uvular region, the small msagittal distance measured is not representative of the ecross-section, due to the fact that the main part of the vebody is concentrated in the midsagittal plane with freeflow on both sides. The consequence is an underestimaof the area inherent to the conversion model.
The fit between measured and reconstructed dataalso assessed at the level of midsagittal functions. The msagittal functions of the synthesized vocal tract contohave thus been compared to the midsagittal functions oforiginal data calculated with the measurement gridline stem implemented in the model. The rms errors of the lenand of the midsagittal distances are almost zero excepthe larynx region where the errors can respectively reachand 0.3 cm, probably due to the poor modeling of the tonin this region~see Fig. 4!. A maximum of 0.2 cm for the rmserror on the midsagittal distances is also noted in the frpart of the vocal tract between the last tongue point andteeth, due to the fact that the sublingual cavity is not takinto account in the model.
2. Lip area
A possibility for computing lip areaS_modis the rela-tion established for the first time by Fromkin~1964!:
S_mod5pred_S_A_B•A•B,
whereA andB are, respectively, the intra-oral lip width anheight measured from the video labio-film. For the pres
2176 J. Acoust. Soc. Am., Vol. 109, No. 5, Pt. 1, May 2001
ribution subject to ASA license or copyright; see http://acousticalsociety.org
x-r-
--nsed-
a-ual-
-
id-as
to
n-
assed-iremiron
asd-se-hor.1e
ten
t
subject, a value of 0.80 was found forpred_S_A_Bby linearregression applied to the whole corpus. However, the lacaccuracy ofA_mod resulted in a poor modeling of smaareas. This method was therefore abandoned, and lipwas in practice calculated as a second order multilineargression of theJH, LH, andLP components, for which thecoefficients were optimized as to obtain the best fit to thearea measured on video front pictures. With this modeliwe obtained 0.2 cm2 for the rms error.
3. Acoustic effect of LV
In the absence of the horizontal jaw control parameJA, only vertical movements are taken into account for tlower incisors, i.e., throughJH. Therefore, there is nostraightforward provision in the model for producing labidental constrictions by a combination of jaw retraction alower lip elevation movements, which is the standard artilatory strategy for producing labio-dental fricatives.
This problem is overcome by a mechanism that usesLV parameter for the production of the labio-dental constrtion at the incisor section. The incisor section area is man indirect function of lower lip vertical position, and thusLV, by limiting it to a minimum threshold value function othe difference between lower lip position and upper incisedge~see Fig. 9!. This allowsLV to be audible, i.e., to haveacoustic consequences, at least in circumstances typiclabio-dentals where the lower lip has to be higher thanupper incisor edge in order to produce the proper consttion. This feature was particularly useful for the inversionthe articulatory-to-acoustic relation for fricatives~Mawasset al., 2000!.
4. Acoustic model
Acoustic transfer functions as well as formants abandwidths were determined from these area functionsmeans of a frequency domain vocal tract acoustic model~Ba-din and Fant, 1984!. A time domain reflection-type line analogue ~Bailly et al., 1994!, extended to include improved
FIG. 9. Minimum threshold for the area at the incisors as a functiondifference between lower lip position and upper incisor edge.
2176Beautemps et al.: Degrees of freedom in speech production
/content/terms. Download to IP: 152.77.24.10 On: Mon, 05 Jan 2015 16:28:58

is,
eeunttao
th
-e
b
w-
ely,anter-
rrorillrs;n a
ar-msum-jectto
w-ectcon-de-tip,ountses,m:e
andoneanyula-ainstiondelseds.
th
nomostrs
delthe
ttalels,forstsed
ies,ver,
Redist
voice ~Pelorsonet al., 1996! and noise source models~Badinet al., 1995!, can also be driven by these area functions,association with lung pressure and vocal cords parameterproduce high quality articulatory synthesis~cf Mawasset al.,2000!.
The area functions and the derived formants have bcomputed for the assessment of the midsagittal to area ftion conversion, starting from the synthesized midsagicontours. The rms error and the rms relative error on fmants have both been calculated for the whole corpus~ex-cluding 347 configurations for which the measurement offour formants was not possible!: 45 Hz ~12.86%!, 100 Hz~7.32%!, 162 Hz, ~6.47%!, and 173 Hz~5.21%!, respec-tively, for F1, F2, F3, andF4. The mean differences between the formants obtained by the model and those msured are 14 Hz,265 Hz, and 26 Hz, respectively, forF2,F3, F4 ~no significant difference was found forF1, except27 Hz for the vowels!.
The predicted maximal formant spaces are comparato the measured ones~cf. Fig. 2 and Fig. 10!. However, thecomputed formantF1 of @a# is about 34 Hz too low.
When modeling the area function of the four point voels of their two American subjects, Baeret al. ~1991! re-
FIG. 10. PredictedF2/F1 ~top! and F3/F1 ~bottom! formant spaces~inHz! for the vowels and consonants pooled.
2177 J. Acoust. Soc. Am., Vol. 109, No. 5, Pt. 1, May 2001
ribution subject to ASA license or copyright; see http://acousticalsociety.org
nto
nc-l
r-
e
a-
le
ported a deviation~in terms of the rms of the relative error!of 13%, 31%, and 13% on the measures for, respectivF1, F2, andF3; these deviations are noticeably higher ththose in the present study. From a set of 16 disyllabic utances@h.’CV # and one sentence, Mermelstein~1973! ob-tained 10.3%, 4.9%, and 5.5% for the average absolute eon F1, F2, andF3; in terms of rms, these errors are stlower. Mermelstein’s fits are thus clearly better than ouhowever, it should be recalled that they were obtained omuch more restricted set of data.
V. DISCUSSION AND PERSPECTIVES
A. Summary
A linear component analysis of tongue contours andticulatory measures extracted from cineradio- and labio-filmade on a reference subject revealed a relatively small nber of degrees of freedom. The jaw appears, for the substudied, to have mainly two degrees of freedom, relatedthe lower incisors vertical and horizontal movements. Hoever, only the vertical component exerts a significant effon tongue shape. The residue of tongue shape, once thetribution of the jaw has been removed, possesses fourgrees of freedom: tongue body, tongue dorsum, tongueand tongue advance. An extra parameter takes into accthe larynx height variance. Similarly, the lip shape possesin addition to the jaw contribution, three degrees of freedolip protrusion, lip height, and lip vertical elevation. Thesnine parameters are mostly independent of each other~cf.Table IV!, except forLY that is correlated with lips andtongue parameters and the correlation betweenLP and TD.These degrees of freedom are specific to the vocal tractarticulators of one subject uttering one specific corpus inlanguage. The corpus was designed to include as mFrench vowels and consonants as possible. A linear artictory model was developed based on these data; it expl96% of the tongue data variance, with an rms reconstrucerror of about 0.09 cm. It was complemented by a moconverting the midsagittal contours to an area function baon a fitting of midsagittal functions and formant frequencieFinally this model allows the calculation of formants wirms errors of 45 Hz forF1, 100 Hz forF2, and 162 Hz forF3 over the corpus. To the knowledge of the authors,such comprehensive model has been developed so far;of the available models deal with vowels only, while othedo not include acoustics.
B. Choice of subject and corpus
The development of such an articulatory-acoustic mobased on a specific reference subject was motivated byneed for a model that could fit a real subject’s midsagiprofiles of French fricative consonants, plosives, and vowas well as formants, with a fairly high degree of accuracya large number of configurations. The possibility now exito investigate in detail the articulatory strategies employby the subject, and in particular coarticulatory strategies~cf.Mawasset al., 2000, or Vilainet al., 1998!. One may arguethat no general conclusions may be drawn from such studas they are supported by one single subject’s data. Howe
2177Beautemps et al.: Degrees of freedom in speech production
/content/terms. Download to IP: 152.77.24.10 On: Mon, 05 Jan 2015 16:28:58

aala
se,ge
e
a
esthepth
waoagecmineoe
uses
edto
to
thar
dclide
eila
-n
ofE
aC
av-
furs
bysionithe
sisnon
hele
enceirlyea-
jawctedInn of
thispas-u-hisla-
he
y
reesrytheructula-tro-
tdgue
eetic
age-ndthe
sedmame
Redist
we were very much aware of the risk of blurring out cleindividual articulatory strategies employed by individusubjects when merging together several subjects’ data,therefore made the choice of a single subject for the prestudy. Similar analyses are under way for other subjectsorder to determine which features may be considered aseral and which ones as more subject-specific~Bailly et al.,1998; Vilain et al., 1998; Engwall and Badin, 1999!. Thesestudies will also allow us to investigate the number of dgrees of freedom of the jaw involved in speech.
The influence of the number of items used for the lineanalysis was studied for the present subject by Badinet al.~1998!; they found that, by choosing the contour sampli.e., by selecting only vowel and consonant targets ininitial corpus, an articulatory model was produced that rresented the whole corpus data with an accuracy close toobtained when the full model based on the whole corpusused. More specifically, they showed that the data recstruction error, computed as the rms error of the abscissthe tongue contour along each grid line for the 1222 imaof the available corpus of midsagittal contours, was 0.090.11 cm, and 0.17 cm when the model was elaborated usrespectively, 1222, 20, and 8 configurations. This justifithe elaboration of models from a much lower numberarticulations, and thus, in particular, the use of MRI imaginstead of x-ray images.
C. Comparison of the degrees of freedom found inother studies
Degrees of freedom are clearly subject and corpdependent but their number and their definition are closrelated to the method used to explain the whole datavariance. The linear component analysis used by Ma~1979, 1990! is sometimes referred to as a two-way facanalysis of the variance, where one mode corresponds topredictors and the other one to the matrix of coefficientsthe linear combinations. Using this principle, Maeda~1979!extracted one loading factor for the jaw, and three forresidual midsagittal tongue data to explain 98% of the vance for a corpus made of 400 frames of@pV1CV2# ~@aiu#and @dg#! sequences uttered by one subject. In an extencorpus of 519 frames corresponding to 10 French sententhree supplementary components were obtained for theincluding the frontal lip-opening shapes, and four tonguegrees of freedom explaining 88% of the variance~Maeda,1990!. Finally, for these data, Sanguinetiet al. ~1998! im-posed two degrees of freedom for the jaw~protrusion androtation!, and one for the larynx, and obtained three othdegrees of freedom for the tongue residue from a simanalysis in the so-calledl-space.
The PARAFAC method ~Harshman et al., 1977; Nixet al., 1996; Hoole, 1999! is a three-way factor generalization where the third mode corresponds to linear coefficiethat account for differences between subjects. Harshmet al. ~1977! derived two components for the descriptionrepresentative midsagittal tongue and lip shapes of tenglish vowels uttered by five subjects. Hoole~1999! proposeda two-factor PARAFAC model of the German vowels insymmetrical stop consonant context, plus an additional P
2178 J. Acoust. Soc. Am., Vol. 109, No. 5, Pt. 1, May 2001
ribution subject to ASA license or copyright; see http://acousticalsociety.org
r
ndntinn-
-
r
,e-ats
n-ofs,g,sfs
-lyeta
rhef
ei-
edes,ps-
rr
tsan
n-
A
component to capture the subject-specific nonvocalic behior of the tongue. More recently, Hooleet al. ~2000! ex-tracted a two-factorPARAFAC solution that explained 90% othe variance from a set of MRI midsagittal tongue contomeasured during the production of seven German vowelsnine speakers. The first component captured the dimenlow-back to high-front, and the second was associated wthe mid-front to high-back motion. The complex effect of thfirst component can be decomposed in a co-variation ofJHand TB, the second component being related toTD. Ulti-mately, and to the knowledge of the authors, no analybased on thePARAFAC method has been realized with aimposed jaw component. To conclude, no analysis basedPARAFAC principles has shown success in explaining tlarge and phonetically varied data obtained from multipspeakers.
Bailly et al. ~1998! studied the synergy between tonguand jaw for three subjects, including the present referesubject. They found that the two other subjects used a fastrong synergy: the amplitude of the tongue movements msured at the tip and at the root that were correlated withmovements were about twice as large as might be expefrom the simple mechanical carrying effect of the jaw.other words, the jaw and the tongue shared the executiothe tongue movements. The present subject does not usesynergy: the tongue is not so active, and appears to besively carried by the jaw. However, all three subjects’ articlators had qualitatively the same degrees of freedom. Tsynergy is still a crucial issue for understanding coarticution strategies.
D. Perspectives
The principles of this work have been duplicated for tmodeling of Swedish midsagittal tongue shapes~Engwalland Badin, 1999!. Over 90% of the variance is explained bthe four tongue degrees of freedomJH, TB, TD, andTT.
One of the main issues in the analysis of speech degof freedom is the possibility to build a linear articulatomodel that takes into account the redundant feature ofarticulators shapes. For instance, it can help to reconstcomplete tongue shapes from a reduced number of artictory measurement points, such as those provided by elecmagnetic articulometry. Badinet al. ~1997! used the presenmodel to retrieve, from one coil on the lower incisor anthree coils on the tongue of the reference subject, the tonshape as well as the articulatory control parametersJH, TB,TD, TT, and TA with a fairly good accuracy. This may buseful for investigating speech coarticulation and synergstrategies~cf., e.g., Vilain et al., 1998!, for testing hypoth-eses of the Frame/Content concept in the child’s langudevelopment~Vilain et al., 1999!, or evaluating the adaptability of speech articulation to various linguistic tasks aenvironmental conditions such as changes illustrated byLombard reflect~Beautempset al., 1999!.
The present articulatory-acoustic model can also be uto derive, by inversion, articulatory control parameters froformants measured in other utterances produced by the ssubject ~Mawasset al., 2000!. These data, in conjunction
2178Beautemps et al.: Degrees of freedom in speech production
/content/terms. Download to IP: 152.77.24.10 On: Mon, 05 Jan 2015 16:28:58

ave
dime
ththintaythhe
a
e
e
eing
avic
ssa
s
-
’ i,,
ec
.J.
.ry’ inata
ing
h2-3/
lly,:
sing
ging:
theh
Pro-is-nc.,
E
ewta,’’
er-
-
s
A.
rate
Redist
with aerodynamic data obtained for the same subject, hbeen used for the articulatory synthesis of French fricati~Mawasset al., 2000!.
Another extension of the present study is the thirdmension. 3-D MRI images have been recorded for the sasubject, and a 3-D linear articulatory model is being devoped according to the same approach~Badin et al., 1998,2000!; the new model has been elaborated in such a waypart of its control parameters are identical with those ofpresent midsagittal model, which opens the possibility ofheriting knowledge already acquired for the midsagitplane, while acquiring new features such as the capabilitproducing lateral consonants. Finally, the modeling ofvelum from MRI midsagittal data should complement tpresent model.
ACKNOWLEDGMENTS
This work has been partially funded by the EuropeCommunity~ESPRIT/BRprojectSpeech MapsNo. 6975!, andby the Rhoˆne-Alpes Agency for Social and Human Scienc~ARASSH! ~project ‘‘A Virtual Talking Head: Data andmodels in speech production’’!. It has benefited from thevaluable help of many people to whom the authors are vmuch indebted: Bernard Gabioud~who initiated a part of thiswork in the framework of theSpeech Mapsproject!, TaharLallouache~for the lip measurements!, Shinji Maeda~for theinitial version of the contour edition program, and more importantly for having largely inspired this work!, GilbertBrock, Pela Simon, and Jean-Pierre Zerling~for their exper-tise on cineradiography!, Agnes Hennel~for access to thecineradiography equipment at the Strasbourg SchiltighHospital!, Thierry Guiard-Marigny and the late ChristiaBenoıt ~for their help on data gathering and processin!,Christian Abry ~for many stimulating discussions!, MarijaTabain~for polishing our French English!, as well as manyother colleagues at ICP, Grenoble. We have also greatlypreciated the pertinent comments and careful editorial adof Anders Lofqvist and two anonymous reviewers.
1Note thatTngTipis identical to the last point of the tongue contour abscivector.
Abry, C., Badin, P., and Scully, C.~1994!. ‘‘Sound-to-gesture inversion inspeech: TheSpeech Mapsapproach,’’ inAdvanced Speech Application,edited by K. Varghese, S. Pfleger, and J. P. Lefe`vre ~Springer, Berlin!, pp.182–196.
Badin, P., Baricchi, E., and Vilain, A.~1997!. ‘‘Determining tongue articu-lation: from discrete fleshpoints to continuous shadow,’’ inProceedings ofthe 5th EuroSpeech Conference~University of Patras, Wire Communication Laboratory, Patras, Greece!, Vol. 1, pp. 47–50.
Badin, P., Mawass, K., and Castelli, E.~1995!. ‘‘A model of frication noisesource based on data from fricative consonants in vowel context,’Proceedings of the 13th International Congress of Phonetic Sciencesed-ited by K. Elenius and P. Branderud~Arne Strombergs Grafiska PressStockholm, Sweden!, Vol. 2, pp. 202–205.
Badin, P., Bailly, G., Raybaudi, M., and Segebarth, C.~1998!. ‘‘A three-dimensional linear articulatory model based on MRI data,’’ inProceed-ings of the Third ESCA/COCOSDA International Workshop on SpeSynthesis~Jenolan Caves, Australia!, pp. 249–254.
Badin P., Motoki, K., Miki, N., Ritterhaus, D., and Lallouache, T. M~1994a!. ‘‘Some geometric and acoustic properties of the lip horn,’’Acoust. Soc. Jpn.~E! 15, 243–253.
2179 J. Acoust. Soc. Am., Vol. 109, No. 5, Pt. 1, May 2001
ribution subject to ASA license or copyright; see http://acousticalsociety.org
ves
-e
l-
ate-lofe
n
s
ry
-
m
p-e
n
h
Badin, P., Borel, P., Bailly, G., Reve´ret, L., Baciu, M., and Segebarth, C~2000!. ‘‘Towards an audiovisual virtual talking head: 3D articulatomodeling of tongue, lips and face based on MRI and video images,’Proceedings of the 5th Seminar on Speech Production: Models and D& CREST Workshop on Models of Speech Production: Motor Plannand Articulatory Modelling~Kloster Seeon, Germany!, pp. 261–264.
Badin, P., and Fant, G.~1984!. ‘‘Notes on vocal tract computation,’’ SpeecTransmission Laboratory—Quarterly Progress Status Report Vol.1984, pp. 53–108.
Badin, P., Shadle, C. H., Pham Thi Ngoc, Y., Carter, J. N., Chiu, W., ScuC., and Stromberg, K.~1994b!. ‘‘Frication and aspiration noise sourcescontribution of experimental data to articulatory synthesis,’’ inProceed-ings of the 3rd International Conference on Spoken Language Procesedited by Mike Edington~Yokohama, Japan!, Vol. 1, pp. 163–166.
Baer, T., Gore, J. C., Gracco, L. C., and Nye, P. W.~1991!. ‘‘Analysis ofvocal tract shape and dimensions using magnetic resonance imaVowels,’’ J. Acoust. Soc. Am.90, 799–828.
Bailly, G. ~1993!. ‘‘Resonances as possible representations of speech inauditory-to-articulatory transform,’’ inProceedings of the 3rd EurospeecConference on Speech Communication and Technology~Berlin!, Vol. 3,pp. 1511–1514.
Bailly, G., Badin, P., and Vilain, A.~1998!. ‘‘Synergy between jaw andlips/tongue movements: Consequences in articulatory modelling,’’ inPro-ceedings of the 5th International Conference on Spoken Languagecessing, edited by R. H. Mannell, J. Robert-Ribes, and E. VatikiotBateson~Australian Speech Science and Technology Association, ISydney, Australia!, Vol. 5, pp. 1859–1862.
Bailly, G., Castelli, E., and Gabioud, B.~1994!. ‘‘Building prototypes forarticulatory speech synthesis,’’ inProceedings of the 2nd ESCA/IEEWorkshop on Speech Synthesis~New York!, pp. 9–12.
Beautemps, D., Badin, P., and Laboissie`re, R.~1995!. ‘‘Deriving vocal-tractarea functions from midsagittal profiles and formant frequencies: A nmodel for vowels and fricative consonants based on experimental daSpeech Commun.16, 27–47.
Beautemps, D., Borel, P., and Manolios, S.~1999!. ‘‘Hyper-articulatedspeech: Auditory and visual intelligibility,’’ inProceedings of the 6thEuropean Conference on Speech Communication and Technology, Vol. 1~Budapest, Hungary!, pp. 109–112, September 1999.
Beautemps, D., Badin, P., Bailly, G., Galva´n, A., and Laboissie`re, R.~1996!. ‘‘Evaluation of an articulatory-acoustic model based on a refence subject,’’ inProceedings of the 4th Speech Production Seminar~Au-trans, France!, pp. 45–48.
Boe, L. J., Gabioud, B., Schwartz, J. L., and Valle´e, N. ~1995!. ‘‘Towardsthe unification of vowel spaces,’’ inProceedings of the XIIIth Interna-tional Congress of Phonetic Sciences, edited by K. Elenius and P. Branderud ~Arne Strombergs Grafiska Press, Stockholm, Sweden!, Vol. 4, pp.582–585.
Bothorel, A., Simon, P., Wioland, F., and Zerling, J. P.~1986!. ‘‘Cinera-diographie des voyelles et consonnes du francais@Cineradiography ofvowels and consonants in French#,’’ Trav. de l’Inst. de Phone´tique deStrasbourg, 296 pp.
Coker, C., and Fujimura, O.~1966!. ‘‘Model for specification of the vocal-tract area function,’’ J. Acoust. Soc. Am.40, 1271.
Dang, J., and Honda, K.~1998!. ‘‘Speech production of vowel sequenceusing a physiological articulatory model,’’ inProceedings of the 5th In-ternational Conference on Spoken Language Processing,edited by RobertH. Mannell and Jordi Robert-Ribes, Vol. 5~Sydney, Australia R.H.!, pp.1767–1770.
Demolin, D., Giovanni, A., Hassid, S., Heim, C., Lecuit, V., and Soquet,~1997!. ‘‘Direct and indirect measurements of subglottic pressure,’’Pro-ceedings of Larynx 97~Marseille, France!, pp. 69–72.
Djeradi, A., Guerin, B., Badin, P., and Perrier, P.~1991!. ‘‘Measurement ofthe acoustic transfer function of the vocal tract: a fast and accumethod,’’ J. Phonetics19, 387–395.
Edwards, J., and Harris, K. S.~1990!. ‘‘Rotation and translation of the jawduring speech,’’ J. Speech Hear. Res.33, 550–562.
Engwall, O., and Badin, P.~1999!. ‘‘Collecting and analyzing two- andthree-dimensional MRI data for Swedish,’’ Tal Musik Ho¨rsel, QuarterlyProgress Status Report, Stockholm Vol. 3-4, pp. 11–38.
Fowler, C. A., and Saltzman, E.~1993!. ‘‘Coordination and coarticulation inspeech production,’’ Language and Speech36, 171–195.
Fromkin, V. A. ~1964!. ‘‘Lip positions in American English vowels,’’ Lan-guage and Speech7, 215–225 .
Gabioud, B.~1994!. ‘‘Articulatory models in speech synthesis,’’ inFunda-
2179Beautemps et al.: Degrees of freedom in speech production
/content/terms. Download to IP: 152.77.24.10 On: Mon, 05 Jan 2015 16:28:58

l
s-
keE.ia
e,i-ucdu
-
’’V
in
-
’’
ceato
s
atr
-
oc
tic
th
.,sus-
y
,’’ces
an-
, V.,
ro-ech
ond
st.
,’’ces
ech
in
rica-
ts
f
Pro-is-nc.,
el-ci-A.
sity
g
of
-m.
:
Redist
mentals of Speech Synthesis and Speech Recognition,edited by E. Keller~Wiley, Chichester!, pp. 215–230.
Harshman, R., Ladefoged, P., and Goldstein, L.~1977!. ‘‘Factor analysis oftongue shape,’’ J. Acoust. Soc. Am.62, 693–707.
Heinz, J. M., and Stevens, K. N.~1965!. ‘‘On the relations between lateracineradiographs, area functions, and acoustic spectra of speech,’’Proceed-ings of the Fifth International Congress of Acoustics~Liege, Belgium!,Paper A44.
Hoole, P.~1999!. ‘‘On the lingual organization of the German vowel sytem,’’ J. Acoust. Soc. Am.106, 1020–1032.
Hoole, P., and Kroos, C.~1998!. ‘‘Control of larynx height in vowel pro-duction,’’ in Proceedings of the 5th International Conference on SpoLanguage Processing,edited by R. H. Mannell, J. Robert-Ribes, andVatikiotis-Bateson~Australian Speech Science and Technology Assoction, Inc., Sydney, Australia!, Vol. 2, pp. 531–534.
Hoole, P., Wismu¨ller, A., Leisinger, G., Kroos, C., Geumann, A., and InouM. ~2000!. ‘‘Analysis of tongue configuration in multi-speaker, multvolume MRI data,’’ inProceedings of the 5th Seminar on Speech Prodtion: Models and Data & CREST Workshop on Models of Speech Protion: Motor Planning and Articulatory Modelling~Kloster Seeon,Germany!, pp. 157–160.
Kelso, J. A. S., Saltzman, E. L., and Tuller, B.~1986!. ‘‘The dynamicaltheory of speech production: Data and theory,’’ J. Phonetics14, 29–60.
Laboissiere, R., Ostry, D. J., and Feldman, A. G.~1996!. ‘‘Control of multi-muscle systems: Human jaw and hyoid movements,’’ Biol. Cybern.74,373–384.
Lallouache, M. T.~1990!. ‘‘Un poste Visage-Parole. Acquisition et traitement de contours labiaux@A ‘‘Face-Speech’’ workstation. Acquisition andprocessing of labial contours#,’’ Proceedings of the 18th Journe´es d’Etudesur la Parole~Montreal, Canada!, pp. 282–286.
Liljencrants, J.~1971!. ‘‘A Fourier series description of the tongue profile,Speech Transmission Laboratory—Quarterly Progress Status Report4/1971, pp. 9–18.
Lindblom, B. E. F. and Sundberg, J. E. F.~1971!. ‘‘Acoustical consequencesof lip, tongue and jaw movements,’’ J. Acoust. Soc. Am.50, 1166–1179.
Lindblom, B. E. F., Lubker, J., and Gay, T.~1979!. ‘‘Formant frequencies ofsome fixed-mandible vowels and a model of speech-motor programmby predictive simulation,’’ J. Phonetics7, 141–161.
Maeda, S.~1979!. ‘‘Un modele articulatoire de la langue avec des composantes line´aires,’’ Proceedings of the 10th Journe´es d’Etude sur la Pa-role ~Grenoble, France!, pp. 152–163.
Maeda, S.~1982!. ‘‘A digital simulation method of the vocal tract system,Speech Commun.1, 199–299.
Maeda, S.~1990!. ‘‘Compensatory articulation during speech: Evidenfrom the analysis and synthesis of vocal-tract shapes using an articulmodel,’’ in Speech Production and Speech Modeling, edited by W. J.Hardcastle and A. Marchal~Kluwer Academic, The Netherlands!, pp.131–149.
Maeda, S.~1991!. ‘‘On articulatory and acoustic variabilities,’’ J. Phonetic19, 321–331.
Matsuda, M., and Kasuya, H.~1999!. ‘‘Acoustic nature of the whisper,’’ inProceedings of the 6th European Conference on Speech Communicand Technology,Vol. 1 ~Budapest, Hungary!, pp. 133–136, Septembe1999.
Mawass, K., Badin, P., and Bailly, G.~2000!. ‘‘Synthesis of French frica-tives by audio-video to articulatory inversion,’’ Acta Acoustica86, 136–146.
Mermelstein, P.~1973!. ‘‘Articulatory model for the study of speech production’’ J. Acoust. Soc. Am.53, 1070–1082.
Nix, D. A., Papcun, G., Hogden, J., and Zlokarnik, I.~1996!. ‘‘Two cross-linguistic factors underlying tongue shapes for vowels,’’ J. Acoust. SAm. 99, 3707–3717.
Ostry, D., Vatikiotis-Bateson, E., and Gribble, P.~1997!. ‘‘An examinationof the degrees of freedom of human jaw motion in speech and mastion,’’ J. Acoust. Soc. Am.40, 1341–1351.
Payan, Y., and Perrier, P.~1997!. ‘‘Synthesis of V-V sequences with a 2Dbiomechanical tongue model controlled by the equilibrium point hypoesis,’’ Speech Commun.22, 185–205.
2180 J. Acoust. Soc. Am., Vol. 109, No. 5, Pt. 1, May 2001
ribution subject to ASA license or copyright; see http://acousticalsociety.org
n
-
-c-
ol.
g
ry
ion
.
a-
-
Pelorson, X., Hirschberg, A., Wijnands, A. P. J., Bailliet, H., Vescovi, Cand Castelli, E.~1996!. ‘‘Description of the flow through the vocal cordduring phonation. Application to voiced sounds synthesis,’’ Acta Acotica 82, 358–361.
Perkell, J. S.~1974!. ‘‘A physiological-oriented model of the tongue activitduring speech production,’’ Ph.D. dissertation, MIT, Cambridge.
Perkell, J. S.~1991!. ‘‘Models, theory and data in speech productionProceedings of the XIIth International Congress of Phonetic Scien~Universitede Provence, Aix-en-Provence, France!, Vol. 1, pp. 182–191.
Perrier, P., Ostry, D. J., and Laboissie`re, R.~1996!. ‘‘The equilibrium pointhypothesis and its application to speech motor control,’’ J. Speech, Lguage, and Hear. Res.39, 365–578.
Perrier, P., Payan, P., Perkell, J. S., Zandipour, M., Pelorson, X., Coisyand Matthies, M.~2000!. ‘‘An attempt to simulate fluid-walls interactionsduring velar stops,’’ inProceedings of the 5th Seminar on Speech Pduction: Models and Data & CREST Workshop on Models of SpeProduction: Motor Planning and Articulatory Modelling~Kloster Seeon,Germany!, pp. 149–152.
Reveret, L., and Benoıˆt, C. ~1998!. ‘‘A new 3D lip model for analysis andsynthesis of lip motion in speech production,’’ inProceedings of the In-ternational Conference on Auditory-Visual Speech Processing/SecESCA ETRW on Auditory-Visual Speech,edited by D. Burnham, J.Robert-Ribes, and E. Vatikiotis-Bateson~Terrigal-Sydney, Australia!, pp.207–212.
Sanguineti, V., Laboissie`re, R., and Ostry, D. J.~1998!. ‘‘A dynamic bio-mechanical model for neural control of speech production,’’ J. AcouSoc. Am.103, 1615–1627.
Scully, C.~1991!. ‘‘The representation in models of what speakers knowin Proceedings of the XIIth International Congress of Phonetic Scien~Universitede Provence, Aix-en-Provence, France!, Vol. 1, pp. 192–197.
Shadle, C. H., and Scully, C.~1995!. ‘‘An articulatory-acoustic-aerodynamic analysis of@s# in VCV sequences,’’ J. Phonetics23, 53–66.
Sorokin, V. N., Gay, T., and Ewan, W. G.~1980!. ‘‘Some biomechanicalcorrelates of jaw movements,’’ J. Acoust. Soc. Am. Suppl. 168, S32.
Stark, J., Lindblom, B., and Sundberg, J.~1996!. ‘‘APEX: An articulatorysynthesis model for experimental and computational studies of speproduction,’’ TMH-QPSR 2/1996, pp. 45–48.
Stetson, R. H.~1928!. ‘‘Motor phonetics. A study of speech movementsaction,’’ Archives Neerlandaises de Phone´tique Experimentale3, 216.
Stromberg, K, Scully, C., Badin, P., and Shadle, C. H.~1994!. ‘‘Aerody-namic patterns as indicators of articulation and acoustic sources for ftives produced by different speakers,’’ Institute of Acoustics16, 325–333.
Tiede, M. K.~1996!. ‘‘An MRI-based study of pharyngeal volume contrasin Akan and English,’’ J. Phonetics24, 399–421.
Vilain, A., Abry, C., and Badin, P.~1998!. ‘‘Coarticulation and degrees ofreedom in the elaboration of a new articulatory plant: Gentiane,’’ inPro-ceedings of the 5th International Conference on Spoken Languagecessing,edited by R. H. Mannell, J. Robert-Ribes, and, E. VatikiotBateson~Australian Speech Science and Technology Association, ISydney, Australia!, Vol. 7, pp. 3147–3150.
Vilain, A., Abry, C., Badin P., and Brosda, S.~1999!. ‘‘From idiosyncraticpure frames to variegated babbling: Evidence from articulatory moding,’’ in Proceedings of the 14th International Congress of Phonetic Sences,edited by J. J. Ohala, Y. Hasegawa, M. Ohala, D. Granville, andC. Bailey ~Congress organizers at the Linguistics Department, Univerof California at Berkeley, San Francisco, CA!, Vol. 3, pp. 2497–2500.
Westbury, J. R.~1988!. ‘‘Mandible and hyoid bone movements durinspeech,’’ J. Speech Hear. Res.31, 405–416.
Westbury, J. R.~1994!. ‘‘On coordinate systems and the representationarticulatory movements,’’ J. Acoust. Soc. Am.95, 2271–2273.
Wilhelms-Tricarico, R.~1995!. ‘‘Physiological modeling of speech production: Methods for modeling soft-tissue articulators,’’ J. Acoust. Soc. A97, 3085–3098.
Zerling, J. P.~1984!. ‘‘Phenomenes de nasalite´ et de nasalisation vocaliquesEtude cineradiographique pour deux locuteurs@in French#,’’ Trav. del’Inst. de Phone´tique de Strasbourg16, 241–266.
2180Beautemps et al.: Degrees of freedom in speech production
/content/terms. Download to IP: 152.77.24.10 On: Mon, 05 Jan 2015 16:28:58

D. Beautemps, M.-A. Cathiard & Y. Leborgne, 2003. Benefit of audiovisual presentation in
close shadowing task. In Proceedings of ICPHS conference, Barcellona, Spain.


N. Aboutabit, Denis Beautemps & Laurent Besacier, 2007. Automatic identification of vowels
in the Cued Speech context. In International Conference on Auditory-Visual Speech Processing
(AVSP), 2007.


Automatic identification of vowels in the Cued Speech context
Noureddine Aboutabit1, Denis Beautemps1, Laurent Besacier2
1Grenoble Images Parole Signal Automatique, département Parole & Cognition 46 Av. Félix Viallet, 38031 Grenoble, cedex 1, France
2Laboratoire d’Informatique de Grenoble, UMR 5217 - 681 rue de la passerelle - BP 72 - 38402 Saint Martin d'Hères, France
Abstract The phonetic translation of Cued Speech (CS) (Cornett [1]) gestures needs to mix the manual CS information together with the lips, taking into account the desynchronization delay (Attina et al. [2], Aboutabit et al. [3]) between these two flows of information. The automatic coding of CS hand positions and lip targets (Aboutabit et al. [3], Aboutabit et al. [4]) are thus a key factor in the mixing process. This contribution focuses on the identification of vowels by merging CS hand positions and vocalic lip information produced by a CS speaker. The hand flow is coded automatically as plateaus between transition phases. A plateau is defined as the interval during which the hand is maintained at a specific CS hand position. A transition is the interval during which the hand moves from a specific CS hand position to another one. The CS hand position is automatically obtained as the result of the hand 2d-coordinates Gaussian classification. The instants of reached hand targets are used as reference instants to define the interval inside which the lip target instant of the vowel is automatically detected. The lip parameters extracted at this instant are processed in a Gaussian classifier as to identify the vocalic lip feature of the vowel. The vowel is obtained as the result of the combination of the corresponding hand position and the lip feature. The global performance of the method attains 77.6% as correct identification score. This result does not take into account the CS coding errors. This result has to be compared with the global 83.5% score of speech perception by deaf people using CS (Nichols and Ling, 1982 [6]. Index Terms: Cued Speech production, lip target segmentation, vocalic lip classification, and CS gesture segmentation.
1. Introduction The Cued Speech (CS) (Cornett, 1967 [1]) is a manual cues system used to disambiguate the lip-reading and enhance speech perception from visual input by deaf and impaired-hearing people. In this system, the speaker moves the hand in close relation with speech (see Attina et al., 2004 [2] for a detailed study on CS temporal organization). The hand (with the back facing the perceiver) is a cue that uniquely determines a phoneme when associated with the corresponding lip shape. A manual cue in this system is made up of two components: the shape of the hand and the hand position relative to the face. Handshapes are designed to distinguish among consonants and hand positions among vowels. A single manual cue corresponds to phonemes that can be discriminated with lip shapes, while phonemes with
identical lip shapes are coded with different manual cues (see figure 1 which describes the complete system for French).
In the framework of communication between hearing and hearing impaired people, the automatic translation of CS components into a phonetic chain is a key issue. Due to the CS system, both hand and lip flows produced by the CS speaker carry a part of the phonetic information. Thus the recovering of the complete phonetic information needs to constrain the process of each flow by the other one (see Aboutabit et al., 2006 [3] for an example of a complete analysis of the hand flow).
Figure 1: CS Hand position (top) for vowels and CS handshapes (bottom) for consonants (adapted from [2]).
This paper focuses on the automatic recognition of French vowels by combining the two flows of information (hand and lip). The first part presents a method to automatically segment the hand flow. The objective of this segmentation is to detect the CS hand position and also to identify wether the hand is maintained in a position or is in transition between two positions. The second part develops an automatic method of lip target segmentation applied to vowels. The last part discusses how both flows of information are merged to recognize vowels in a sequence. Finally, an experimental evaluation is presented to measure the performance of the merging system as well as the performance of the segmentation method for each separate modality.
2. Data The data was obtained from a video recording of a speaker pronouncing and coding in French CS a set of 267 sentences, repeated at least twice.

Figure 2: Image of the speaker.
The French CS speaker is a native female speaker of French, certified in French CS. She regularly translates into French CS code in a school. The recording was made in a sound-proof booth at the Parole & Cognition department of Grenoble Images Parole Signal Automatique laboratory, (GIPSA-lab, department P&C), at 50 frames/second for the image video part. The speaker was seated and wore a helmet that served to keep her head in a fixed position and thus in the field of the camera. She wore opaque glasses to protect her eyes against a halogen floodlight. The camera in large focus was used for the hand and the face and was connected to a betacam recorder. The lips were painted in blue, and blue marks were placed on the speaker's glasses as reference points. Blue marks were placed on the left hand, on the back and at the extremity of the fingers to independently follow the displacement of the hand and the handshape formation. Blue marks were placed on the speaker's goggles as reference points (figure 2).
A square paper was recorded for further pixel-to-centimeter conversion. Using ICP’s Face-Speech processing system, the audio part of the video recording was digitized at 22,050 Hz in synchrony with the image part, the latter being stored as Bitmap frames every 20 ms. A specific image processing was applied to the Bitmap frames in the lip region to extract the inner and outer contours and to derive the corresponding characteristic parameters (Lallouache, 1991 [5]): lip width (A), lip aperture (B) and lip area (S). These parameters were converted using a pixel-to-centimeter conversion formula. Finally the parameters were low-pass filtered. The x and y coordinates of the center of gravity of the hand landmarks were automatically extracted from the image as follows. A process based on image processing detected all marks on the image, and the knowledge of those on the back of hand and on the goggles allowed to extract the marks on the fingers. The coordinates initially in pixels were converted into centimeters using the pixel-to-centimeter conversion formula.
The acoustic signal was automatically labeled at the phonetic level using forced alignment (see Lamy, 2004 [7] for a description of the speech recognition tools used for this). Since the orthographic transcription of each sentence was known, a dictionary containing the phonetic transcriptions of all words was used to produce the sequence of phonemes associated with each acoustic signal. This sequence was then aligned with the acoustic signal using French ASR acoustic models trained on the BRAF100 database (Vaufreydaz, 2000 [8]).
The whole process resulted in a set of temporally coherent signals: the x and y hand position of the reference hand landmark placed on the back of the hand near the knuckles, every 20 ms, the lip parameter values every 20 ms and the corresponding acoustic signal (figure 4).
Figure 4: Example of signals. From top to bottom: Inner lip
parameters (A, B, S and lip velocity calculated from S), x and y coordinates of the reference hand landmark, the acoustic
realization.
3. Automatic hand segmentation The x and y trajectories are characterized by smooth deviations between local extrema corresponding to spatial FCS Hand positions. The automatic segmentation process of the hand trajectories involved automatic temporal marking of the beginning and the end of each of these segments. The first step consisted of the automatic labeling of a hand position to each frame, i.e. every 20 ms.
The method uses the likelihood computed from a Gaussian model of the x-y coordinates that corresponds to the center of gravity of hand landmarks. This kind of classifier was chosen for its simplicity and especially for the homogeneous dispersion of the positions (see Figure 4, the results for the reference hand landmark). Each of the five hand positions was modelized by two 2-dimensional Gaussian models built from a dictionary of 30 images manually selected in the corpus. The first one is devoted to the reference hand landmark and the second one to the landmark placed at the extremity of the pointing finger. The use of the x-y coordinates of these two landmarks was needed to improve the robustness of the classifying method. For the classification phase, we consider a given frame with its x-y coordinates of both landmarks. For each landmark x-y coordinate, a vector made of five probability densities is delivered, thanks to the five Gaussian models. The two computed vectors are combined by a scalar product in order to obtain a final vector with five components. Thus recognized hand position is to the one that gives the maximum amongst the 5 components of the final vector.
Figure 4: 2 standard deviation ellipsis around the corresponding average values of the reference hand
landmark extracted from the learning data, for the 5 hand positions.

This method applied to each frame of a sentence delivers
a sequence of hand position numbers from 1 to 5, with a set of plateaus. A plateau is defined by a set of successive identical position numbers.
At this step of classification, it is not possible to distinguish the transitions between attained hand positions. Thus, a second step was needed to refine this result. Its principle was based on the use of the velocity minimum applied to the x-y coordinated of the reference hand landmark. The velocity was defined as the Euclidean distance between two successive (x-y) points temporally spaced by 20ms. Inside each plateau, the value of the velocity minimum is detected. In addition, the value of the velocity maximum is detected between the middle of the previous plateau and the middle of the considered one. The contrast is calculated as the difference between these two extreme values. A percentage (40%) of this contrast is added to the minimum value in order to define a threshold value. Thus for the considered plateau, the positions for which the velocity is lower than the threshold value are considered in the target hand position. In other hand, the positions for which the velocity is higher than the threshold value are considered in the transition. Finally, incorrect plateau detections (see comparison between Figure 5 and Figure 6) are considered as points in a transition.
Figure 5: Zoom of signals with hand positions plateaus
delivered by the classifier.
Figure 6: Zoom of signals with M1, M2, M3, A1, A2, A3 and L2 labels.
Following the nomenclature of Attina and colleagues, the extremity of the plateaus delimiting the attained hand position and the transitions were automatically labeled M1, M2 and M3 for the onset of the transition, the onset and the end of the reached hand position, respectively. For the acoustic signal,
the beginning of the acoustic realization of the consonant and of the vowel and the end of the vowel were labeled A1, A2 and A3.
4. Automatic lip target segmentation The lips were characterized at the instant the lip target was attained. The automatic definition of this instant, labeled L2 (see figure 6 for an example), is based on the temporally marked phonetic chain. Recall that the phonetic chain marks the acoustic realization. Note that the beginning and the end of each phoneme are obtained automatically with a forced alignment; this labeling may therefore include errors or fuzzy phone frontiers. Moreover, it is well known that the lip can anticipate the acoustic realization. Thus, in the automatic process of lip target calculation, the middle of the phoneme interval is considered as a first estimation of the instant of vocalic target. The target instant is finally obtained at the nearest instant of minimum lip velocity. In the case of important anticipation the research process is limited by the end frontier of the phone acoustic realization. Lip velocity (see Figure 3) is estimated from the lip area S parameter as the difference between two successive values normalized by the sample periodicity (20 ms). Note that S is highly correlated to the crossing of A by B (r = 0.99).
The algorithm for vocalic lip target instant detection is thus as follows: (1) calculation of the lip velocity from S parameter, (2) detection of all the local minima, (3) determination of the mid-point of the vowel from the phonetic chain (4) choice of the nearest instant of lip velocity local minimum.
From the L2 instants obtained with this method, it has been shown that vowels could be grouped into three categories in conformity with the phonetic description of the vowels (anterior non rounded vowels [ a, , i, , e, ], high and mid-high rounded [, y, o, ø, u] low and mid-low rounded vowels [ã , , œ]) (see Aboutabit et al., 2006 [4] for more details).
In this study, it has been demonstrated that when the CS hand position was given without error, high scores of vowel identification are obtained (89% as average recognition rate of vowel) with only one measure instant, defined by L2 instant.
5. Vowel recognition
5.1. Method The complete vowel recognition needs to merge both manual and lip informations obtained from the two previous automatic processing. Several merging approaches can be considered. Among these methods, the classical models of audio-visual integration (Schwartz et al., 1998 [9]) are interesting but a few ones can be adapted to the Cued Speech merging case, while others do not. For example, the direct identification model (DI) seems to be not appropriate to the CS gestures fusion. One raison is that this kind of identification needs a system that is capable to merge quantitative information provided from lips (lip parameter values) and qualitative information provided from CS hand gestures (hand position and configuration). Even if a transformation in quantitative components is possible from the CS hand information, the fact to take into account components with different origin in a same vector poses the problem of their weighting. As second raison, the temporal desynchronization between lip and hand information is a serious problem for this model.
Alternatively, the separated identification model (SI) seems to be convenient. Considering this model, on one hand, at the M2 instant the CS hand position is known and defines a first group of vowels, composed by two or three vowels. On the other hand, at the corresponding L2 instant a second group of vowels (viseme) is derived from a classification of lip parameters. Then, the vowel recognition results from the intersection between these two groups of vowels. In this case, it is possible that the intersection may be empty in the case of a determinist fusion. Thus, no vowel is recognized. This non identification problem may be caused by an error on the lip decision and/or on the hand position decision. To solve this problem, instead to use one classifier of viseme in the lip process, five classifiers, one for each CS hand position could be considered. Then, as result from the lip process, five vowels are selected (i.e. one vowel for each classifier).
To reduce the number of lip classifiers from five to a single one, a fusion model derived from the SI one is considered in the following. It consists to constrain the lip decision by the hand position decision considering the advance of the M2 instant over the L2 instant in the case of vowels (Aboutabit et al., 2006 [3]). Then, between two successive M2 instants, a L2 instant is located excepted in the case of a consonant alone. At the first M2 instant the CS hand position allows to identify a first group of vowels. A simple Gaussian classification on lip parameters extracted at L2 recognizes one element among this group. Figure 7 illustrates the method.
Figure 7: Vowel identification: fusion schema of both lip and hand information.
5.2. Results and discussion To test this merging method, the test corpus contains 774 vowels from 120 coded and pronounced sentences. The global score of vowel recognition is 77.6%. If the CS hand position is known without error, the vowel recognition is 89% (Aboutabit et al. [4]). Then, the difference between these two scores is due to the automatic decision on the CS hand position and/or to the matching of M2 and L2.
The recognition score of 77.6% is slightly lower than the CS perceptual effectiveness score of 83.5% obtained by Nicholls and Ling (1982, [6]) in their study on the reception of CV and VC syllables with hearing-impaired children.
In the evaluation of the corpus coded by the speaker, a decoding test in reception was performed by a profoundly hearing-impaired subject practicing regularly the CS system. The test consisted in the decoding of the whole sentences of the corpus. For the 120 sentences used previously, the score of correct decoding attains 94.8% for the vowels. This latter
is the reference to compare the performance of the recognition method (77.6%).
6. Conclusions and perspectives The merging model, in which the hand is considered at the M2 instant in advance to the L2 instant of the lips, was validated. The recognition score for vowels (77.6%), compared to the different reference scores previously recalled, is promising to go further. Indeed, an improvement of the automatic segmentation of the CS hand position should improve the decision on the CS hand position and enhance the precision of the M2 instant. This allows to reduce the M2-L2 matching errors due to the imprecision on M2. In addition, concerning the lips, a better selection of the velocity local minima, should increase the recognition performances.
As a perspective, the merging model could be extended to the consonant in vocalic context. In this case, the complete [M2, L2] interval should be considered in order to take into account the complex effect of the co articulation.
7. Acknowledgements Many thanks to Sabine Chevalier, our CS speaker, for having accepted the recording constraints. This work is supported by the French TELMA project (RNTS / ANR).
8. References [1] Cornett, R.O. "Cued Speech", American Annals of the
Deaf, 112, pp. 3-13, 1967. [2] Attina, V., Beautemps, D., Cathiard, M. A. and Odisio,
M. "A pilot study of temporal organization in Cued Speech production of French syllables: rules for Cued Speech synthesizer", Speech Communication, Vol. 44, 2004, pp. 197-214.
[3] Aboutabit, N., Beautemps, D. and Besacier, L. "Hand and Lips desynchronization analysis in French Cued Speech: Automatic segmentation of Hand flow", In Proceedings of ICASSP’06, 2006.
[4] Aboutabit, N., Beautemps, D. and Besacier, L., “Vowels classification from lips: the Cued Speech production case”. In Proceedings of ISSP’06, 2006.
[5] Lallouache, M.-T. “ Un poste Visage-Parole couleur. Acquisition et traitement automatique des contours des lèvres,” Doctoral dissertation, Institut National Polytechnique de Grenoble, Grenoble 1991.
[6] Nicholls, G., Ling, D. "Cued Speech and the reception of spoken language", Journal of Speech and Hearing Research.25, 262-269, 1982.
[7] Lamy, R., Moraru, D., Bigi, B., Besacier, L. Premiers pas du CLIPS sur les données d’évaluation ESTER. In Proc. of Journées d’Etude sur la Parole, Fès, Maroc, 2004.
[8] Vaufreydaz, D., Bergamini, J., Serignat, J. F., Besacier, L. & Akbar, M. A New Methodology for Speech Corpora Definition from Internet Documents. LREC2000, 2nd International Conference on Language Resources and Evaluation. Athens, Greece, pp. 423-426, 2000.
[9] Schwartz, J. L., Robert-Ribes, J. & Escudier, P. Ten years after Summerfield: a taxonomy of models for audio-visual fusion in speech perception. Hearing by Eye II, Advances in the psychology of speechreading and auditory visual speech. Psychology Press, pp. 85-108, Hove (UK), 1998.

Heracleous, P., Beautemps, D., Aboutabit, N., 2010. Cued Speech automatic recognition in
normal-hearing and deaf subjects. Speech Communication 52(6): 504-512.


Available online at www.sciencedirect.com
www.elsevier.com/locate/specom
Speech Communication 52 (2010) 504–512
Cued Speech automatic recognition in normal-hearing and deaf subjects
Panikos Heracleous a,b,*, Denis Beautemps b, Noureddine Aboutabit b
a ATR, Intelligent Robotics and Communication Laboratories, 2-2-2 Hikaridai Seika-cho, Soraku-gun, Kyoto-fu 619-0288, Japanb GIPSA-lab, Speech and Cognition Department, CNRS UMR 5216/Stendhal University/UJF/INPG, 961 rue de la Houille Blanche Domaine
universitaire BP 46, F-38402 Saint Martin d’Heres cedex, France
Received 31 March 2009; received in revised form 2 March 2010; accepted 3 March 2010
Abstract
This article discusses the automatic recognition of Cued Speech in French based on hidden Markov models (HMMs). Cued Speech isa visual mode which, by using hand shapes in different positions and in combination with lip patterns of speech, makes all the sounds of aspoken language clearly understandable to deaf people. The aim of Cued Speech is to overcome the problems of lipreading and thusenable deaf children and adults to understand spoken language completely. In the current study, the authors demonstrate that visiblegestures are as discriminant as audible orofacial gestures. Phoneme recognition and isolated word recognition experiments have beenconducted using data from a normal-hearing cuer. The results obtained were very promising, and the study has been extended by apply-ing the proposed methods to a deaf cuer. The achieved results have not shown any significant differences compared to automatic CuedSpeech recognition in a normal-hearing subject. In automatic recognition of Cued Speech, lip shape and gesture recognition are required.Moreover, the integration of the two modalities is of great importance. In this study, lip shape component is fused with hand componentto realize Cued Speech recognition. Using concatenative feature fusion and multi-stream HMM decision fusion, vowel recognition, con-sonant recognition, and isolated word recognition experiments have been conducted. For vowel recognition, an 87.6% vowel accuracywas obtained showing a 61.3% relative improvement compared to the sole use of lip shape parameters. In the case of consonant recog-nition, a 78.9% accuracy was obtained showing a 56% relative improvement compared to the use of lip shape only. In addition to voweland consonant recognition, a complete phoneme recognition experiment using concatenated feature vectors and Gaussian mixture model(GMM) discrimination was conducted, obtaining a 74.4% phoneme accuracy. Isolated word recognition experiments in both normal-hearing and deaf subjects were also conducted providing a word accuracy of 94.9% and 89%, respectively. The obtained results werecompared with those obtained using audio signal, and comparable accuracies were observed.� 2010 Elsevier B.V. All rights reserved.
Keywords: French Cued Speech; Hidden Markov models; Automatic recognition; Feature fusion; Multi-stream HMM decision fusion
1. Introduction
To date, visual information is widely used to improvespeech perception or automatic speech recognition (lip-reading) (Potamianos et al., 2003). With lipreading tech-nique, speech can be understood by interpreting themovements of lips, face and tongue. In spoken languages,a particular facial and lip shape corresponds to a specific
0167-6393/$ - see front matter � 2010 Elsevier B.V. All rights reserved.
doi:10.1016/j.specom.2010.03.001
* Corresponding author at: ATR, Intelligent Robotics and Communi-cation Laboratories, 2-2-2 Hikaridai Seika-cho, Soraku-gun, Kyoto-fu619-0288, Japan.
E-mail address: [email protected] (P. Heracleous).
sound (phoneme). However, this relationship is not one-to-one and many phonemes share the same facial and lipshape (visemes). It is impossible, therefore to distinguishphonemes using visual information alone.
Without knowing the semantic context, one cannot per-ceive the speech thoroughly even with high lipreading per-formances. To date, the best lip readers are far away intoreaching perfection. On average, only 40–60% of the vow-els of a given language (American English) are recognizedby lipreading (Montgomery and Jackson, 1983), and 32%when relating to low predicted words (Nicholls and Ling,1982). The best result obtained amongst deaf participantswas 43.6% for the average accuracy (Auer and Bernstein,

P. Heracleous et al. / Speech Communication 52 (2010) 504–512 505
2007; Bernstein et al., 2007). The main reason for this liesin the ambiguity of the visual pattern. However, as far asthe orally educated deaf people are concerned, the act oflipreading remains the main modality of perceiving speech.
To overcome the problems of lipreading and to improvethe reading abilities of profoundly deaf children, Cornett(1967) developed the Cued Speech system in 1967 to com-plement the lip information and make all phonemes of aspoken language clearly visible. As many sounds look iden-tical on face/lips (e.g., /p/, /b/, and /m/), using hand infor-mation those sounds can be distinguished and thus makepossible for deaf people to completely understand a spokenlanguage using visual information only.
Cued Speech (also referred to as Cued Language (Fleet-wood and Metzger, 1999)) uses hand shapes placed in dif-ferent positions near the face along with natural speechlipreading to enhance speech perception from visual input.This is a system where the speaker faces the perceiver andmoves his hand in close relation with speech. The hand,held flat and oriented so that the back of the hand facesthe perceiver, is a cue that corresponds to a unique pho-neme when associated with a particular lip shape. A man-ual cue in this system contains two components: the handshape and the hand position relative to the face. Handshapes distinguish among consonant phonemes whereashand positions distinguish among vowel phonemes. Ahand shape, together with a hand position, cues a syllable.
Cued Speech improves the speech perception of deafpeople (Nicholls and Ling, 1982; Uchanski et al., 1994).Moreover, for deaf people who have been exposed to thismode since their youth, it offers a complete representationof the phonological system, and therefore it has a positiveimpact on the language development (Leybaert, 2000).Fig. 1 describes the complete system for French. In French
Fig. 1. Hand shapes for consonants (top) and hand po
Cued Speech, eight hand shapes in five positions are used.The system was adapted from American English to Frenchin 1977. To date, Cued Speech has been adapted in morethan 60 languages.
Another widely used communication method for deafindividuals is the Sign Language (Dreuw et al., 2007;Ong and Ranganath, 2005). Sign Language is a languagewith its own grammar, syntax and community; however,one must be exposed to native and/or fluent users of SignLanguage to acquire it. Since the majority of childrenwho are deaf or hard-of-hearing have hearing parents(90%), these children usually have limited access to appro-priate Sign Language models. Cued Speech is a visual rep-resentation of a spoken language, and it was developed tohelp raise the literacy levels of deaf individuals. CuedSpeech was not developed to replace Sign Language. Infact, Sign Language will be always a part of deaf commu-nity. On the other hand, Cued Speech is an alternativecommunication method for deaf individuals. By cueing,children who are deaf would have a way to easily acquirethe native home language, read and write proficiently,and communicate more easily with hearing family memberswho cue them.
In the current study, the authors demonstrate that visi-ble gestures are as discriminant as audible orofacial ges-tures. Phoneme recognition and isolated word recognitionexperiments were conducted using data from a normal-hearing cuer, and promising results were obtained. In addi-tion, the proposed methods were applied to a deaf cuer andsimilar results were obtained compared with automatic rec-ognition of Cued Speech in normal-hearing subjects.
In the first attempt for vowel recognition in CuedSpeech, in Aboutabit et al. (2007) a method based on sep-arate identification, i.e., indirect decision fusion was used
sition (bottom) for vowels in French Cued Speech.

506 P. Heracleous et al. / Speech Communication 52 (2010) 504–512
and a 77.6% vowel accuracy was obtained. In this study,however, the proposed method is based on HMMs anduses concatenative feature fusion and multi-stream HMMdecision fusion to integrate the components into a com-bined one and then perform automatic recognition. Fusion(Nefian et al., 2002; Hennecke et al., 1996; Adjoudani andBenoıt, 1996) is the integration of all available single-modality streams into a combined one. In this study, lipshape and hand components are combined in order to real-ize automatic recognition in Cued Speech for French.
2. Methodology
2.1. Cued Speech materials
The data for vowel-, consonant-, and phoneme recogni-tion experiments were collected from a normal-hearingcuer. The female native French speaker employed for datarecording was certified in transliteration speech into CuedSpeech in the French language. She regularly cues inschools. The cuer wore a helmet to keep her head in a fixedposition and opaque glasses to protect her eyes againstglare from the halogen floodlight. The cuer’s lips werepainted blue, and blue marks were marked on her glassesas reference points. These constraints were applied inrecordings in order to control the data and facilitate theextraction of accurate features. The data were derived froma video recording of the cuer pronouncing and coding inCued Speech a set of 262 French sentences. The sentences(composed of low predicted multi-syllabic words) werederived from a corpus that was dedicated to Cued Speechsynthesis (Gibert et al., 2005). Each sentence was dictatedby an experimenter, and was repeated two or three times(to correct the pronunciation errors) by the cuer resultingin a set of 638 sentences.
The audio part of the video recording was synchronizedwith the image. Fig. 2 shows the lip shape parameters usedin the study. An automatic image processing method wasapplied to the video frames in the lip region to extract theirinner and outer contours and derive the correspondingcharacteristic parameters: lip width (A), lip aperture (B),and lip area (S) (i.e., six parameters in all).
The process described here resulted in a set of tempo-rally coherent signals: the 2D hand information, the lip
Fig. 2. Parameters used for lip shape modeling.
width (A), the lip aperture (B), and the lip area (S) valuesfor both inner and outer contours, and the correspondingacoustic signal. In addition, two supplementary parametersrelative to the lip morphology were extracted: the pinchingof the upper lip (Bsup) and lower (Binf) lip. As a result, aset of eight parameters in all was extracted for modeling lipshapes. For hand position modeling, the xy coordinates oftwo landmarks placed on the hand were used (i.e., fourparameters). For hand shape modeling, the xy coordinatesof the landmarks placed on the fingers were used (i.e., 10parameters). Non visible landmarks receive default coordi-nates [0,0].
During the recording of Cued Speech material for iso-lated word recognition experiments, the conditions weredifferent from the ones described earlier. The system wasimproved by excluding the use of a helmet by the cuer,enabling in this way the head movements during recording.The subject was seated on a chair in a way to avoid largemovements in the third direction (i.e., towards the camera).However, the errors that might occur have not been evalu-ated. In addition, the landmarks placed on the cuer’s fin-gers were of different colors in order to avoid the handshape coding and the finger identification (cf. Section 2.3),and this helped to simplify and speed up the image process-ing stage. In these recording sessions, a normal-hearingcuer and a deaf cuer were employed. The corpus consistedof 1450 isolated words with each of 50 words repeated 29times by the cuers.
2.2. Lip shape and hand components modeling
In the phoneme recognition experiments, context-inde-pendent, three-state, left-to-right, no-skip-phonemeHMMs were used. Each state was modeled with a mixtureof 32 Gaussians. In addition to the basic lip and handparameters, first- ðDÞ and second-order derivatives ðDDÞwere used as well. For training and test, 426 and 212 sen-tences were used, respectively. The training sentences con-tained 3838 vowel and 4401 consonant instances, and thetest sentences contained 1913 vowel and 2155 consonantinstances, respectively. Vowels and consonants wereextracted automatically from the data after a forced align-ment was performed using the audio signal.
For isolated word recognition experiments two HMMsets were trained (deaf and normal-hearing). Fifteen repeti-tions of each word were used to train 50, six-state, wholeword HMMs, and 14 repetitions were used for testing.Eight and ten parameters were used for lip shape and handshape modeling, respectively.
In automatic speech recognition, a diagonal covariancematrix is often used because of the assumption that theparameters are uncorrelated. In lipreading, however,parameters show a strong correlation. In this study, a glo-bal Principal Component Analysis (PCA) using all thetraining data was applied to decorrelate the lip shapeparameters and then a diagonal covariance matrix wasused. The test data were then projected into the PCA space.

Fig. 4. Image of a Cued Speech cuer (left) and the projection method(right).
P. Heracleous et al. / Speech Communication 52 (2010) 504–512 507
All PCA lip shape components were used for HMM train-ing. For training and recognition the HTK3.1 toolkit(Young et al., 2001) was used.
2.3. Ordering finger landmarks
For consonant recognition, the correct hand shape isalso required. Instead of a deterministic recognition ofthe hand shape, a probabilistic method is used based onthe xy coordinates of the landmarks placed on the fingers(Fig. 3). The coordinates are used as features for the handshape modeling. During the image processing stage, thesystem detects the landmarks located on the cuer’s fingersand their coordinates are computed. Since the landmarksare of the same color, the system cannot assign the coordi-nates to the appropriate finger in order to be used correctly(i.e., correct order) in the feature vectors. To do this, thehand shape is automatically recognized a-priori, and theinformation obtained is then used to assign the coordinatesto the appropriate finger.
In French Cued Speech, recognition of the eight handshapes is considered exceptional. In fact, a causal analysisbased on some knowledge, such as the number and disper-sion of fingers and also the angle between them, can distin-guish those eight hand shapes. Based on the number oflandmarks detected on fingers, the correct hand shapecan be recognized. In Fig. 1 the hand shapes were num-bered from left to right (i.e., S1–S8). The proposed algo-rithm to identify the Cued Speech hand shapes is asfollows:
� Number of fingers on which landmarks are detected = 1,then the hand shape is S1.� Number of fingers on which landmarks are detected = 4,
then the hand shape is S4.� Number of fingers on which landmarks are detected = 5,
then the hand shape is S5.� Number of finger on which landmarks are detected = 3,
then the hand shape is S3 or S7. If the thumb finger isdetected (using finger dispersion models) then the handshape is S7, else the hand shape is S3.� Number of finger on which landmarks are detected = 2,
then the hand shape is S2 or S6 or S8. If the thumb fin-ger is detected then the hand shape is S6, else the anglebetween the two finger landmarks according to the land-
Fig. 3. The three-step algorithm applied for lip shape and gesture detection bcolour in this figure legend, the reader is referred to the web version of this a
marks on the hand can identify if it is hand shape S2 orS8 (using a threshold).� In any other case hand shape S0, i.e., no Cued Speech
hand shape was detected.
The objective of finger identification stage (cf. Sec-tion 2.3) is to assign the computed coordinates to the cor-rect finger and, in this way, to have the correct order in thefeature vectors. The identification has been done in threesteps. In the first step, all landmarks in the frame weredetected. The landmarks placed on the speaker glassesand on the back of the hand were benched to have onlythe landmarks corresponding to the fingers. Secondly, thecoordinates of these landmarks were projected on the handaxis defined by the two landmarks on the back of the hand.The third step consisted of sorting the resulted coordinatesfollowing the perpendicular axis to the hand direction fromthe smaller to the largest (Fig. 4). In this step, the handshape coding was used to associate each coordinate withthe corresponding finger. For example, when there werethree landmarks coordinates and the hand shape numberwas S3, the smallest coordinate was associated with themiddle finger, the middle one to the ring finger, and the big-gest one to the baby finger. The coordinates of the fingerswhich are not present in a hand shape are replaced by aconstant in order to keep the same dimension of the featurevectors in the HMM modeling.
2.4. Concatenative feature fusion
The feature concatenation uses the concatenation of thesynchronous lip shape and hand features as the joint fea-ture vector
ased on detection of blue objects. (For interpretation of the references torticle.)
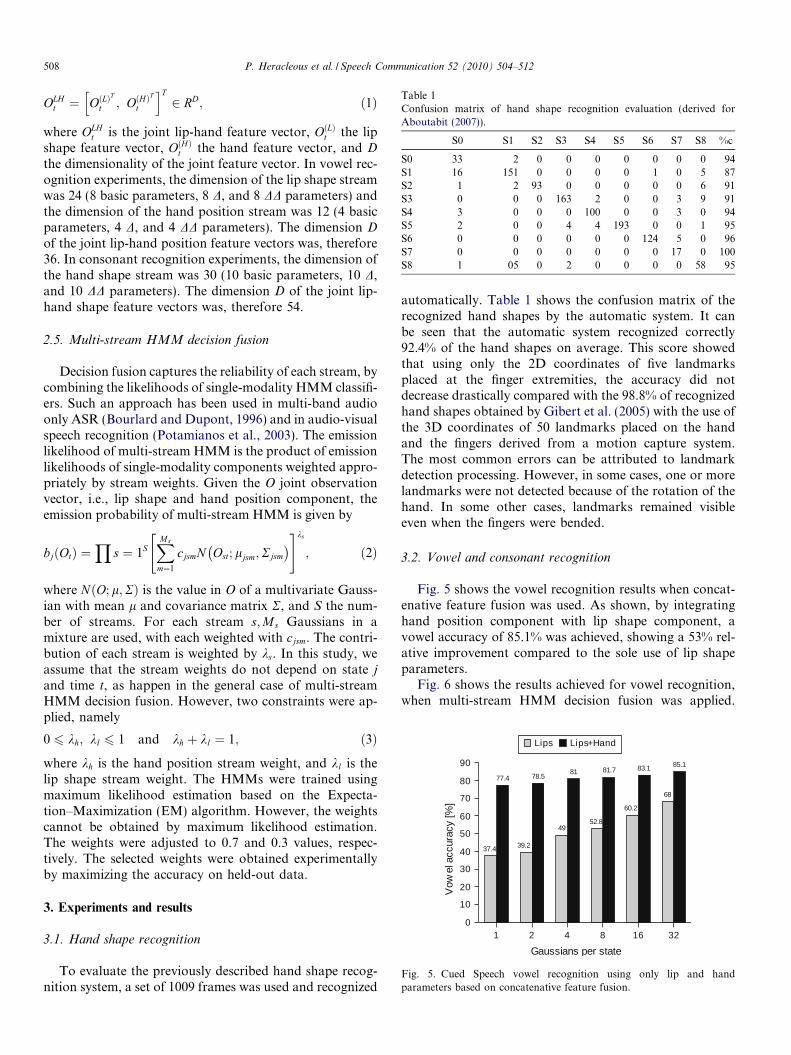
Table 1Confusion matrix of hand shape recognition evaluation (derived forAboutabit (2007)).
S0 S1 S2 S3 S4 S5 S6 S7 S8 %c
S0 33 2 0 0 0 0 0 0 0 94S1 16 151 0 0 0 0 1 0 5 87S2 1 2 93 0 0 0 0 0 6 91S3 0 0 0 163 2 0 0 3 9 91S4 3 0 0 0 100 0 0 3 0 94S5 2 0 0 4 4 193 0 0 1 95S6 0 0 0 0 0 0 124 5 0 96S7 0 0 0 0 0 0 0 17 0 100S8 1 05 0 2 0 0 0 0 58 95
Fig. 5. Cued Speech vowel recognition using only lip and handparameters based on concatenative feature fusion.
508 P. Heracleous et al. / Speech Communication 52 (2010) 504–512
OLHt ¼ OðLÞ
T
t ; OðHÞT
t
h iT2 RD; ð1Þ
where OLHt is the joint lip-hand feature vector, OðLÞt the lip
shape feature vector, OðHÞt the hand feature vector, and D
the dimensionality of the joint feature vector. In vowel rec-ognition experiments, the dimension of the lip shape streamwas 24 (8 basic parameters, 8 D, and 8 DD parameters) andthe dimension of the hand position stream was 12 (4 basicparameters, 4 D, and 4 DD parameters). The dimension D
of the joint lip-hand position feature vectors was, therefore36. In consonant recognition experiments, the dimension ofthe hand shape stream was 30 (10 basic parameters, 10 D,and 10 DD parameters). The dimension D of the joint lip-hand shape feature vectors was, therefore 54.
2.5. Multi-stream HMM decision fusion
Decision fusion captures the reliability of each stream, bycombining the likelihoods of single-modality HMM classifi-ers. Such an approach has been used in multi-band audioonly ASR (Bourlard and Dupont, 1996) and in audio-visualspeech recognition (Potamianos et al., 2003). The emissionlikelihood of multi-stream HMM is the product of emissionlikelihoods of single-modality components weighted appro-priately by stream weights. Given the O joint observationvector, i.e., lip shape and hand position component, theemission probability of multi-stream HMM is given by
bjðOtÞ ¼Y
s ¼ 1SXMs
m¼1
cjsmN Ost; ljsm;Rjsm
� �" #ks
; ð2Þ
where NðO; l;RÞ is the value in O of a multivariate Gauss-ian with mean l and covariance matrix R, and S the num-ber of streams. For each stream s;Ms Gaussians in amixture are used, with each weighted with cjsm. The contri-bution of each stream is weighted by ks. In this study, weassume that the stream weights do not depend on state j
and time t, as happen in the general case of multi-streamHMM decision fusion. However, two constraints were ap-plied, namely
0 6 kh; kl 6 1 and kh þ kl ¼ 1; ð3Þ
where kh is the hand position stream weight, and kl is thelip shape stream weight. The HMMs were trained usingmaximum likelihood estimation based on the Expecta-tion–Maximization (EM) algorithm. However, the weightscannot be obtained by maximum likelihood estimation.The weights were adjusted to 0.7 and 0.3 values, respec-tively. The selected weights were obtained experimentallyby maximizing the accuracy on held-out data.
3. Experiments and results
3.1. Hand shape recognition
To evaluate the previously described hand shape recog-nition system, a set of 1009 frames was used and recognized
automatically. Table 1 shows the confusion matrix of therecognized hand shapes by the automatic system. It canbe seen that the automatic system recognized correctly92.4% of the hand shapes on average. This score showedthat using only the 2D coordinates of five landmarksplaced at the finger extremities, the accuracy did notdecrease drastically compared with the 98.8% of recognizedhand shapes obtained by Gibert et al. (2005) with the use ofthe 3D coordinates of 50 landmarks placed on the handand the fingers derived from a motion capture system.The most common errors can be attributed to landmarkdetection processing. However, in some cases, one or morelandmarks were not detected because of the rotation of thehand. In some other cases, landmarks remained visibleeven when the fingers were bended.
3.2. Vowel and consonant recognition
Fig. 5 shows the vowel recognition results when concat-enative feature fusion was used. As shown, by integratinghand position component with lip shape component, avowel accuracy of 85.1% was achieved, showing a 53% rel-ative improvement compared to the sole use of lip shapeparameters.
Fig. 6 shows the results achieved for vowel recognition,when multi-stream HMM decision fusion was applied.

Fig. 6. Cued Speech vowel recognition using only lip and hand param-eters based on multi-stream HMM decision fusion was used.
P. Heracleous et al. / Speech Communication 52 (2010) 504–512 509
Using 32 Gaussians per state, an 87.6% vowel accuracy wasobtained, showing a relative improvement of 61%. Theresults obtained are comparable with the results obtainedfor vowel recognition when using audio speech (e.g., Mer-kx and Miles (2005)).
The results showed that multi-stream HMM decisionfusion results in better performance than a concatenativefeature fusion. To decide whether the difference in perfor-mance between the two methods is statistically significant,the McNemar’s test was applied (Gillick and Cox,1989).The observed p-value was 0.001 indicating that thedifference is statistically significant.
Using concatenative feature fusion, lip shape compo-nent was integrated with hand shape component and con-sonant recognition was conducted. For hand shapemodeling, the xy coordinates of the fingers, and first- andsecond-order derivatives were used. In total, 30 parameterswere used for hand shape modeling. For lip shape model-ing, 24 parameters were used. Fig. 7 shows the obtainedresults in the function of Gaussians per state. It can be seenthat when using 32 Gaussians per state, a consonant accu-
Fig. 7. Cued Speech consonant recognition using only lip and handparameters based on concatenative feature fusion.
racy of 78.9% was achieved. Compared to the sole use oflip shape, a 56% relative improvement was obtained.
3.3. Phoneme recognition
In the previous sections, it was reported that differenttypes of modeling were used for vowels and consonants.More specifically, for vowel modeling, fusion of lip shapeand hand position components was used. For consonantmodeling, fusion of lip shape and hand shape componentswas used. As a result, feature vectors in vowel and conso-nant recognition are of different lengths. The feature vec-tors for vowels have a length of 36 and the featurevectors of consonants have a length of 54. This is a limita-tion in using a common HMM set for phoneme recogni-tion. To deal with this problem, three approaches wereproposed in order to realize phoneme recognition in CuedSpeech for French.
In the first approach, feature vectors with the samelength were used. At each frame, lip shape parameters,hand position parameters, and hand shape parameterswere extracted during the image processing stage. For eachphoneme, all parameters were used in concatenated featurevectors with a length of 66 (i.e., eight lip shape parameters,four coordinates for hand position, 10 coordinates forhand shape, along with the first- and second-order deriva-tives, as well). The obtained phoneme accuracy was as lowas 61.5% due to a high number of confusions between vow-els and consonants. Although, phoneme recognition inCued Speech is a difficult task, the obtained phoneme accu-racy was lower than expected. To obtain a performancewith higher phoneme accuracy, different approaches werealso investigated.
Cued Speech phoneme recognition was furtherimproved by applying GMM discrimination. A vowel-independent and a consonant-independent GMM modelswere trained using lip shape parameters only. For trainingthe two GMMs the corresponding vowel and consonantdata were used. For modeling, 64 Gaussians were used.The number of Gaussians was selected experimentally onseveral experiments in order to achieve the highest classifi-cation scores. Phoneme recognition was realized in a two-pass scheme. In the first pass, using the two GMMs, thenature of the input was decided. More specifically, theinput and the two GMMs were matched. Based on theobtained likelihood, the input was considered to be vowelor consonant. When the likelihood of the vowel-GMMwas higher than that of the consonant-GMM, the decisionwas made for a vowel. When the consonant-GMM pro-vided a higher likelihood, the input was considered to bea consonant. In the case of vowel inputs, the discriminationaccuracy was 86.9% and in the case of consonant inputs thediscrimination accuracy was 81.5%. In the second pass,switching to the appropriate HMM set took place, andvowel or consonant recognition was realized using featurevectors corresponding to the vowel modeling or consonantmodeling, respectively. The obtained phoneme accuracy

Fig. 8. Word accuracy for isolated word recognition in the case of anormal-hearing subject.
Fig. 9. Word accuracy for isolated word recognition in the case of a deafsubject.
510 P. Heracleous et al. / Speech Communication 52 (2010) 504–512
was 70.9%. The obtained accuracies were lower than theaccuracies obtained in the separate vowel and consonantrecognition experiments, because of the discriminationerrors of the first pass. The obtained result, however,showed a relative improvement of 24% compared to theuse of concatenated feature vectors.
In the third approach for phoneme recognition, insteadof two, eight GMM models (i.e., each one corresponding toa viseme) were used. Three vowel-viseme GMMs and fiveconsonant-viseme GMMs were used based on the visemegrouping. Similar to the previous experiment, phonemerecognition was performed in two-passes. In the first pass,matching between the input and the eight GMMs tookplace. Based on the maximum likelihood, the systemswitched to the corresponding vowel- or consonant-HMM set, and recognition was performed. Using eightGMMs, the discrimination accuracy was increased up to89.3% for the vowels and up to 84.6% for the consonants.The achieved phoneme recognition was 74.4% (i.e., 80.3%vowel accuracy and 68.5% consonant accuracy). Comparedto the use of two GMMs, a relative improvement of 12%was obtained. Compared with the use of the full set of con-catenated parameters, a relative improvement of 33.5% wasachieved.
3.4. Isolated word recognition
In this section, isolated word recognition experimentsboth in normal-hearing and deaf subjects are presented.In these experiments, the landmarks were of different colorsin order to avoid the hand shape recognition and the fingeridentification stage. The image processing system locatesthe landmarks, and the coordinates of each landmark areassigned to each finger based on the colors. Doing this,the feature vectors of hand shape contains the coordinatesof the landmarks in the correct order, and the errors thatoccur during the hand shape coding are not accumulatedinto the recognition stage.
Fig. 8 shows the results obtained in the function of sev-eral Gaussians per state in the case of the normal-hearingcuer. In the case of a single Gaussian per state, using lipshape alone obtained a 56% word accuracy; however, whenhand shape information was also used, a 92.8% word accu-racy was obtained. The highest word accuracy when usinglip shape was 72%, obtained in the case of using four Gaus-sians per state. In that case, the Cued Speech word accu-racy using also hand information was 94.9%.
Fig. 9 shows the obtained results in the case of a deafcuer. The results show that in the case of the deaf subject,words were better recognized when using lip shape alonecompared to the normal-hearing subject. The fact thatdeafs rely on lipreading for speech communication mayincrease their ability not only for speech perception butalso for speech production. The word accuracy in the caseof the deaf subject was 89% compared to the 94.9% in thenormal-hearing subject. The difference in performancemight be because of the lower hand shape recognition in
the deaf subject. It should also be noted that the normal-hearing cuer was a professional teacher of Cued Speech.The results show that there are no additional difficultiesin recognizing Cued Speech in deaf subjects, other thanthose appearing in normal-hearing subjects.
A multi-cuer isolated word recognition experiment wasalso conducted using the normal-hearing and the deafcuers’ data. The aim of this experiment is to investigatewhether it is possible to train speaker-independent HMMsfor Cued Speech recognition. The training data consistedof 750 words from the normal-hearing subject, and 750words from the deaf subject. For testing 700 words fromnormal-hearing subject and 700 words from the deaf sub-ject were used, respectively. Each state was modeled witha mixture of four Gaussian distributions. For lip shapeand hand shape integration, the concatenative featurefusion was used.
Table 2 shows the results obtained when lip shape andhand shape features were used. The results show, thatdue to the large variability between the two subjects, wordaccuracy of cross-recognition is extremely low. On the

Table 2Word accuracy of a multi-speaker experiment.
Test data HMMs
Normal Deaf Normal + Deaf
Normal 94.9 0.6 92.0Deaf 2.0 89.0 87.2
P. Heracleous et al. / Speech Communication 52 (2010) 504–512 511
other hand, the word accuracy in normal-hearing subjectwhen using multi-speaker HMMs was 92%, which is com-parable with the 94.9% word accuracy when cuer-depen-dent HMMs were used. In the case of the deaf subject,the word accuracy when using multi-cuer HMMs was87.2%, which was also comparable with the 89% wordaccuracy when using speaker-dependent HMMs.
The results obtained indicate that creating speaker-inde-pendent HMMs for Cued Speech recognition using a largenumber of subjects should not face any particular differ-ence, other than those appear in the conventional audiospeech recognition. To prove this, however, additionalexperiments using a large number of subjects are required.
4. Discussion
This study deals with the automatic recognition of CuedSpeech in French based on HMMs. As far as our knowl-edge goes, automatic vowel-, consonant- and phoneme rec-ognition in Cued Speech based on HMMs is beingintroduced for the first time ever by the authors of thisstudy. Based on a review of the literature written aboutCued Speech, the authors of this study have not comeacross any other published work related to automaticvowel- or consonant recognition in Cued Speech for anyother Cued language.
The study aims at investigating the possibility of inte-grating lip shape and hand information in order to realizeautomatic recognition, and converting Cued Speech intotext with high accuracy. The authors were interested inthe fusion and the recognition part of the components,and details of image processing techniques are not coveredby this work.
In the conducted experiments, it was assumed that lipshape and hand shape components are synchronous. Basedon previous studies, however, there might be asynchronybetween the two components (Aboutabit et al., 2006). Latefusion (Potamianos et al., 2003), coupled HMMs (Nefianet al., 2002) and product HMMs (Nakamura et al., 2002)would be used as possible alternatives to the state-synchro-nous fusion methods used in this work.
Although the results are promising, problems still per-sist. For example, in order to extract accurate features,some constraints were applied in recording, and the com-putational cost was not considered. Also, a possible asyn-chrony between the components should be furtherinvestigated. The current pilot study on Cued Speech rec-ognition attempts to extend the research in areas relatedto deaf communities, by offering to individuals with hear-
ing disorders additional communication alternatives. Forpractical use, however, many questions should beaddressed and solved, such as speaker-, environment-inde-pendence, real-time processing, etc. The authors are stillanalyzing the remaining problems in the framework ofthe TELMA project.
5. Conclusion
In this article, vowel-, consonant-, and phoneme recog-nition experiments in Cued Speech for French were pre-sented. To recognize Cued Speech, lip shape and handcomponents were integrated into a single component usingconcatenative feature fusion and multi-stream HMM deci-sion fusion. The accuracies achieved were promising andcomparable to those obtained when using an audio speech.Specifically, accuracy obtained was 87.8% for vowel recog-nition, 78.9% for consonant recognition, and 74.4% forphoneme recognition. In addition, isolated word experi-ments in Cued Speech in both normal-hearing and deafsubjects were also conducted obtaining a 94.9% and 89%accuracy, respectively. A multi-cuer experiment using datafrom both normal-hearing and deaf subject showed an89.6% word accuracy, on average. This result indicates thattraining cuer-independent HMMs for Cued Speech using alarge number of subjects should not face particular difficul-ties. Currently, additional Cued Speech data collection is inprogress, in order to realize cuer-independent continuousCued Speech recognition.
Acknowledgements
The authors would like to thank the volunteer cuers Sa-bine Chevalier, Myriam Diboui, and Clementine Huriezfor their time spending on Cued Speech data recording,and also for accepting the recording constraints. Also theauthors would like to thank Christophe Savariaux andCoriandre Vilain for their help in the Cued Speech materialrecording. This work was mainly performed at GIPSA-lab,Speech and Cognition Department and was supported bythe TELMA project (ANR, 2005 edition).
References
Aboutabit, N., 2007. Reconnaissance de la Langue Franc�aise ParleeComplete (LPC): Decodage phonetique des gestes main-levres. Ph.D.Dissertation, Institut National Polytechnique de Grenoble, Grenoble,France.
Aboutabit, N., Beautemps, D., Besacier, L., 2006. Hand and lipsdesynchronization analysis in French Cued Speech: automatic seg-mentation of hand flow. In: Proceedings of ICASSP’2006, pp. 633–636.
Aboutabit, N., Beautemps, D., Besacier, L., 2007. Automatic identifica-tion of vowels in the Cued Speech context. In: Proceedings ofInternational Conference on Auditory-Visual Speech Processing(AVSP).
Adjoudani, A., Benoıt, C., 1996. On the integration of auditory and visualparameters in an HMM-based ASR. In: Stork, D.G., Hennecke, M.E.(Eds.), Speechreading by Humans and Machines. Springer, Berlin,Germany, pp. 461–471.

512 P. Heracleous et al. / Speech Communication 52 (2010) 504–512
Auer, E.T., Bernstein, L.E., 2007. Enhanced visual speech perception inindividuals with early-onset hearing impairment. Journal of Speech,Language, and Hearing 50, 1157–1165.
Bernstein, L., Auer, E., Jiang, J., 2007. Lipreading the lexicon and CuedSpeech. In: la Sasso, C., Crain, K., Leybaert, J. (Eds.), Cued Speechand Cued Language for Children Who are Deaf or Hard of Hearing.Plural Inc. Press, Los Angeles, CA.
Bourlard, H., Dupont, S., 1996. A new ASR approach based onindependent processing and recombination of partial frequency bands.In: Proceedings of International Conference on Spoken LanguageProcessing, pp. 426–429.
Cornett, R.O., 1967. Cued Speech. American Annals of the Deaf 112, 3–13.
Dreuw, P., Rybach, D., Deselaers, T., Zahedi, M., Ney, H., 2007. Speechrecognition techniques for a sign language recognition system. In:Proceedings of Interspeech, pp. 2513–2516.
Fleetwood, E., Metzger, M., 1999. Cued Language Structure: An Analysisof Cued American English Based on Linguistic Principles. CalliopePress, Silver Spring, MD (USA), ISBN 0-9654871-3-X.
Gibert, G., Bailly, G., Beautemps, D., Elisei, F., Brun, R., 2005. Analysis,synthesis of the 3D movements of the head, face and hand of a speakerusing Cued Speech. Journal of Acoustical Society of America 118 (2),1144–1153.
Gillick, L., Cox, S., 1989. Some statistical issues in the comparison ofspeech recognition algorithms. In: Proceedings of ICASSP’89, pp. 532–535.
Hennecke, M.E., Stork, D.G., Prasad, K.V., 1996. Visionary speech:looking ahead to practical speechreading systems. In: Stork, D.G.,Hennecke, M.E. (Eds.), Speechreading by Humans and Machines.Springer, Berlin, Germany, pp. 331–350.
Leybaert, J., 2000. Phonology acquired through the eyes and spelling indeaf children. Journal of Experimental Child Psychology 75, 291–318.
Merkx, P., Miles, J., 2005. Automatic vowel classification in speech. Anartificial neural network approach using cepstral feature analysis.Final Project for Math 196S, pp. 1–14.
Montgomery, A.A., Jackson, P.L., 1983. Physical characteristics of thelips underlying vowel lipreading performance. Journal of the Acous-tical Society of America 73 (6), 2134–2144.
Nakamura, S., Kumatani, K., Tamura, S., 2002. Multi-modal temporalasynchronicity modeling by product HMMs for Robust. In: Proceed-ings of Fourth IEEE International Conference on MultimodalInterfaces (ICMI’02), p. 305.
Nefian, A.V., Liang, L., Pi, X., Xiaoxiang, L., Mao, C., Murphy, K., 2002.A coupled HMM for audio-visual speech recognition. In: Proceedingsof ICASSP 2002.
Nicholls, G., Ling, D., 1982. Cued Speech and the reception of spokenlanguage. Journal of Speech and Hearing Research 25, 262–269.
Ong, S., Ranganath, S., 2005. Automatic sign language analysis: a surveyand the future beyond lexical meaning. IEEE Transactions on PAMI27 (6), 873–891.
Potamianos, G., Neti, C., Gravier, G., Garg, A., Senior, A., 2003. Recentadvances in the automatic recognition of audiovisual speech. Proceed-ings of the IEEE 91 (9), 1306–1326.
Uchanski, R.M., Delhorne, L.A., Dix, A.K., Braida, L.D., Reedand,C.M., Durlach, N.I., 1994. Automatic speech recognition to aid thehearing impaired: prospects for the automatic generation of CuedSpeech. Journal of Rehabilitation Research and Development 31 (1),20–41.
Young, S., Evermann, G., Gales, M., Hain, T., Kershaw, D., Liu, X.,Moore, G., Odell, J., Ollason, D., Povey, D., Valtchev, V., Woodland,P., 2001. The HTK Book. Cambridge University EngineeringDepartment.


Beautemps, D., Cathiard, M. A., Attina, V., Savariaux, C., 2012. Temporal organisation of
Cued Speech Production. In Audiovisual Speech Processing, G. Bailly, P. Perrier & E.
Vatikiotis-Bateson (Eds), pp. 104-120.


Ming, Z., Beautemps, D., Feng, G., 2013. GMM Mapping Of Visual Features of Cued Speech
From Speech Spectral Features. In Proceedings of the International Conference on Auditory-
Visual Speech Processing (AVSP), 2013.

GMM Mapping Of Visual Features of Cued Speech
From Speech Spectral Features
Zuheng Ming, Denis Beautemps, Gang Feng
To cite this version:
Zuheng Ming, Denis Beautemps, Gang Feng. GMM Mapping Of Visual Features of CuedSpeech From Speech Spectral Features. 12th International Conference on Auditory-VisualSpeech Processing (AVSP 2013), Aug 2013, St Jorioz, France. pp.191 - 196. <hal-00863875>
HAL Id: hal-00863875
https://hal.archives-ouvertes.fr/hal-00863875
Submitted on 19 Sep 2013
HAL is a multi-disciplinary open accessarchive for the deposit and dissemination of sci-entific research documents, whether they are pub-lished or not. The documents may come fromteaching and research institutions in France orabroad, or from public or private research centers.
L’archive ouverte pluridisciplinaire HAL, estdestinee au depot et a la diffusion de documentsscientifiques de niveau recherche, publies ou non,emanant des etablissements d’enseignement et derecherche francais ou etrangers, des laboratoirespublics ou prives.

GMM Mapping Of Visual Features of Cued Speech
From Speech Spectral Features
Zuheng Ming1,2
, Denis Beautemps1,2
, Gang Feng1,2
1 Univ. Grenoble Alpes, GIPSA-lab, F-38402 Saint Martin d'Hères Cedex
2 CNRS, UMR 5216
Abstract
In this paper, we present a statistical method based on GMM
modeling to map the acoustic speech spectral features to visual
features of Cued Speech in the regression criterion of
Minimum Mean-Square Error (MMSE) in a low signal level
which is innovative and different with the classic text-to-visual
approach. Two different training methods for GMM, namely
Expecting-Maximization (EM) approach and supervised
training method were discussed respectively. In comparison
with the GMM based mapping modeling we first present the
results with the use of a Multiple-Linear Regression (MLR)
model also at the low signal level and study the limitation of
the approach. The experimental results demonstrate that the
GMM based mapping method can significantly improve the
mapping performance compared with the MLR mapping
model especially in the sense of the weak linear correlation
between the target and the predictor such as the hand positions
of Cued Speech and the acoustic speech spectral features.
Index Terms: Cued Speech, LSP, MFCC, GMM mapping.
1. Introduction
The framework of this paper is speech communication for deaf
orally-educated people. Speech is concerned here in its
multimodal dimensions and in the context of automatic
processing. Indeed, the benefit of visual information for
speech perception (called “lip-reading”) is widely admitted.
However, even with high lip reading performances, without
knowledge about the semantic context, speech cannot be
thoroughly perceived. The best lip readers scarcely reach
perfection. On average, only 40 to 60% of the phonemes of a
given language are recognized by lip reading ([1]), and 32%
when relating to low predicted words ([2]) with the best results
obtained amongst deaf participants - 43.6% for the average
accuracy and 17.5% for standard deviation with regards to
words ([3], [4]), with an advantage of deaf women with
33.3 % for females but only 23.5 % for males (see the study on
word perception of [5]). The main reason for this lies in the
ambiguity of the visual pattern. However, as far as the orally
educated deaf people are concerned, the act of lip-reading
remains the main modality of perceiving speech. This led
Cornett ([6]) to develop the Cued Speech system (CS) as a
complement to lip information. CS is a visual communication
system that makes use of hand shapes placed in different
positions near the face in combination with the natural speech
lip-reading to enhance speech perception from visual input.
This is a system (See Figure 1) where the speaker, facing the
perceiver, moves his hand in close relation with speech (See [7]
for a detailed study on CS temporal organization in French
language).
Figure 1: Hand placements for coding vowels in French
Cued Speech (from [7]).
CS is largely improving speech perception for deaf people
([2]), relating to the identification of American-English
syllables; and ([8]), relating to the identification of sentences
in American-English language (scores between 78 and 97%).
Moreover, CS offers to deaf people a thorough representation
of the phonological system, inasmuch as they have been
exposed to this method since their youth, and therefore it has a
positive impact on the language development (see [9] for CS
in French language).
As we have seen from this short review, the Cued Speech
method offers a real advantage for complete speech perception.
Nowadays, one of the important challenges is the question of
speech communication between normal hearing people who do
not practice CS but produce acoustic speech and deaf people
with no auditory rests who use lip-reading completed by CS
code for speech perception. To solve this question, one can use
a human translator. Another solution is based on the
development of automatic translation systems. This paper is a
contribution to this topic. In a more general framework, two
sources of information could contribute to this translation
operation: (i) The a priori knowledge of the phonetic,
phonologic and linguistic constraints; (ii) the a priori
knowledge of the correlations between the different vocal
activity: neuronal and neuro-muscular activities, articulatory
movements, aerodynamic parameters, vocal tract geometry,
face deformation and acoustic sound. Different methods allow
their modelling and their optimal merging with the input
signals and the output ones. On an axis ordering the methods
in function of their dependence upon the used language, one
can find at the two extremities: (i) the method using the
phonetic level of interface, combining speech recognition and
speech synthesis to take into account speech phonology
organization. Note that the recognition and synthesis
processing can call on very various modelling techniques. If
the phonetic models based on Hidden Markov Models (HMM)
are the basis of the main recognition systems, synthesis based
on concatenative of multi-parametered units of various lengths
is still very popular. Note the increasing interest of synthesis
by trajectory models based on HMMs ([10], [11]) allowing the
jointed learning of the recognition and synthesis systems; (ii)
The methods using the correlation between signals without the
help of the phonetic level but using various mapping
techniques. These techniques capture the correlations between

input and output samples using Vector Quantification or
Gaussian Mixture Model ([12], [13]). For Cued Speech, the
classic method to convert audio speech to CS components
consists of coupling a recognition system to a text-to-visual
speech synthesizer ([7], [14], [15], [16]). The link between the
two systems requires at least the phonetic high level. Before
this work, no studies aimed at using the very low signal level.
This work is a contribution to this challenge in the case of oral
French vowels. A new approach based on the mapping of
speech spectral parameters with the visual components made
of CS and lip parameters is proposed. In this context the
objective of the mapping process is to deliver visual
parameters that can be used as target parameters for visual
speech synthesis. In this paper, we explore the GMM-based
mapping. Berthommier ([17]) applied a similar procedure to
estimate the DCT coefficients of the lip region in the objective
of speech enhancement of noisy signal. The present paper
deals with normal speech in the case of speech supplemented
by CS. In the following, we will start by defining the audio
and visual parameters which will be taken into account in the
mapping process. Then we will first present the results with
the linear approach and then the improvement obtained with
the use of multiple GMMs.
2. Experimental set-up and spectral, lip
and Cued Speech material
2.1. Database recording
The data have been derived from a video recording of a
speaker pronouncing and coding in CS a set of 50 isolated
French words. The words were made of 32 digits (from 0 to
31), 12 months and 6 more ordinary words. Each word was
presented once on a monitor placed in front of the speaker, in a
random order. The corpus has been uttered 10 times. The
speaker is a female native speaker of French graduated in CS.
The recording has been made in a sound-proof booth and the
image video recording rate was set on 25 image/second. The
speaker was seated in front of a microphone and a camera
connected to a Betacam recorder. Landmarks were placed
between eyebrows and at the extremity of the fingers to further
extraction of the coordinates used as Cued Speech hand
parameters. In addition, a square paper was recorded for pixel-
to-centimeter conversion.
The video recording has been done with the PAL format, thus
saved as numerical Bitmap RGB images made of the
interlaced half-frames of the video (respectively even and odd
lines). Each image was de-interlaced into two half-frames and
the missing lines of the each half-frame were filled by linear
interpolation, as to obtain two de-interlaced full frames
corresponding to two recordings separated with 20 ms.
2.2. Extraction of lip and hand visual features
These frames constitute the set of images at the rate of 50 Hz
that we will refer to in the following. For its part, the audio of
the recording was digitalized at 44100 Hz and re-sampled at
16000 Hz. For each word, the coordinates of the inner contour
of the lips have been manually selected on the corresponding
images and converted into centimeters with the use of the
pixel-to-centimeter conversion equation. Finally, the
following geometric lip features were derived (following
[18]): the lip width (A), the lip aperture (B) and the lip area
(S) respectively. The work presented in this paper focuses on
vowels. The database has thus been made by the vowels
extracted from this set of material. The audio signal was used
as to first locate the vowels inside the isolated words, then to
derive the corresponding video frames. Thereafter the t0
instants in which the lips were at the corresponding target
were precisely defined from the analysis of the subset of video
frames. 16 LSP coefficients were derived from the audio on
the basis of a 20 ms Hamming window centered on t0 together
with 16 MFCC coefficients calculated on the basis of a 32 ms
Hamming window. In addition 4 formants were derived from
the spectral envelop (obtained with the LSP coefficients).
Since the Cued Speech hand position target are often not
synchronous with variation of lips or speech, the t1 instants for
Cued Speech hand target are selected separately by analysis of
the subset of video frames. Then the hand features defined as
the relative (x,y) coordinates of the fingertip of the middle
finger (or index finger if middle finger is missing) in reference
to the landmark between eyebrows were extracted. The whole
of these processing thus made it possible to constitute a
database made of 1371occurrences of the 10 French vowels
(table 1). In the next, the accuracy of the mapping methods
will be measured using a 1/5 cross-validation test. For that,
the 1371 occurrences were divided into 5 partitions made of
approximate 275 elements for each partition. Finally, 4
principal components (derived from a PCA Analysis) of the 4
formants, 16 principal components of the LSPs, 16 principal
components of the MFCCs, the totally 32 principal
components of the set of the LSP and MFCC coefficients, the
(x, y) coordinates of the hand and the (A, B, S) lip parameters
were derived for each element of each of the 5 partitions.
Table 1. List of the ten French vowels with their occurrence
Vowels [i] [e] [] [a] [y] [] [] [] [o] [u]
Occurrence 236 255 231 168 37 80 137 83 40 104
3. The Multiple-linear regression based
mapping modeling
In this section, the objective is to predict the (A, B, S) lip
parameters and the (x,y) hand coordinates with the
corresponding spectral parameters (their principal components
) using the multiple-linear modeling.
3.1. The used method
The set of was ordered in function of their “prediction
power” using their correlation coefficient with the parameter
to be predicted. The predictors were then sorted following
the decreasing values of their as to obtain the
sorted , ( ). In the following,
the method is illustrated with the lip parameter B defined as
the target, after being centered. B was submitted to a linear
regression with the first predictor . The linear coefficient
was obtained as to minimize the residual error between the
real values of the target and the predicted ones in the sense of
least square error. The residual error was then submitted to a
linear regression with the second predictor and so on until
the order. Finally, the estimation equation at the order is
the following:
(1)

(2)
Where, . As mentioned before, the 5
partitions of the database was used to evaluate the accuracy of
the mapping. One of the partitions was reserved for testing by
turns, while the other 4 partitions were used for the training by
applying the estimation equation (1). The residual variance as
the complement of the explained variance of the considered
lip parameter was calculated. Finally, the average residual
variance was calculated over the 5 combinations of the
training and testing partitions for evaluating the model.
3.2. Results for the lip parameters
In the following, the average residual variance calculated over
the 5 combinations of the training partitions is considered.
Figure 2 plots the average residual variance of lip parameter B
in function of the number of predictors. From the figure, it can
be first observed that the residual variance decreases in
function of the number of used predictors. One can then notice
that the residual variance remains high with the use of
formants (around 39 % of the initial variance). This is
probably due to a lack of dimensions. Indeed the 16 MFCC
and LSP coefficients improve very significantly the
performances of the prediction (the residual variances are 25%
and 18% respectively). The MFCCs allow a quicker decrease
while the LSP coefficients attain a lower residual variance.
Finally, the prediction based on the mixture of the MFCC and
LSP has the advantage of the quick decrease property of the
MFCCs and the low residual of the LSP. This mixture of
MFCCs and LSP is thus considered as the best parameters for
this prediction even if the final error is still relatively high
(around 14 % on the training database). The prediction
performance of the other two lip parameters A and S are
similar to situation of the B. These results will be used as a
reference for the following, in particular for the choice of the
set of pertinent predictors. Finally, we obtained very similar
results with the test data.
Figure 2: The average residual variance of the lip parameters
B over the 5 combinations of the training partitions, in
function of the number of predictors (based on 2 formants (P-
fmt2), 4 formants (P-fmt4), MFCC, LSP and the mixture of
MFCC-LSP).
3.3. Results for the hand parameters
The same method of analysis was applied for predicting the
(x,y) coordinates of the hand. The final value of the residual
variance reaches 39 % for x and 29 % for y, even in the case
of the best predictors made up of the whole of the LSP
parameters and MFCCs (see Figure 3). This high value of the
final residual variance is explained by the low values of the
correlations coefficient between the predictors and the target
(0.43 and 0.42 respectively with x and y). This weak linear
correlation between the spectral parameters and the (x, y)
coordinates of the hand positions probably gives rise to the
limit of the linear method.
Figure 3: The average residual variance of the hand
coordinates on the 5 combinations of the training partitions
with the first best predictors of the whole set of MFCC-LSP in
function of the number of predictors.
In order to check this assumption, the Cued Speech (x, y)
coordinates have been re-organized in a coherent way with the
French vocalic triangle defined by the formant space consisted
of the first two formants, given the strong linear correlation
between formants and the spectral parameters LSP (The
maximum linear correlation coefficients between the spectral
parameters LSP and the first two formants are 0.96 and 0.87
respectively). Therefore a great fall of the residual variances
could be obtained which finally reach 7.85% and 7.08%
respectively for the redistributed x and y coordinates.
4. The GMM based mapping model
4.1. The Method
In this section, the principal components of the set of 16 LSP
and 16 MFCC coefficients constitute the source vector with
dimension ( ) and the lip or hand parameters are
the target vector . In reference to the equation (3) (see also
[19], [20]), the estimator (in the sense of MMSE) of the
parameter has a linear regression form of observation
weighted by the a posteriori conditional probability of
component :
(3)
Where, is the a posteriori conditional probability that
observation is generated by the component/Gaussian with
the mean vector and covariance matrix , and
being the transform and the bias matrices respectively
associated to component .
(4)
(5)
(6)
Where, is the weighting coefficient of the Gaussian model,
the sum of all the coefficients is 1; is the matrix of
covariance between and and calculated on the component

( ) subset of data and is the mean vector of the
target vector on this same subset. Note that when the number
of the Gaussian equals to one, namely =1, the GMM based
mapping model in the sense of the MMSE regression criteria
corresponds exactly to the multiple-linear regression model
presented in the previous section. Finally, the spectral
principal components are sorted following the decreasing
order of their explanation variance of the estimated parameter.
Then the first principal components of the spectral
parameters as source vectors are according to this order. The
parameters of GMM such as mean vectors , and the
covariance matrices and are determined during the
GMM training processing. Two different training methods for
GMM are discussed in our work. EM is the most used
unsupervised training methods for GMM training, which trains
the model without any label information of the elements and
the data cluster automatically given the initialization
parameters by the iterative procedure until the condition of
convergence is satisfied [21]. In contrast with the unsupervised
training method, a supervised training method is introduced to
train the GMM based on the a priori information: the visemes
of vowels (see Table 2) which is a speech presentation in the
visual domain for the lips or the different Cued Speech five
hand positions (see Figure 1) for hand respectively. Thus 3
Gaussian components of GMM corresponding to the three
vowel visemes are trained for lips and 5 Gaussian components
corresponding to the five hand positions defined in CS are
trained for hand.
Table 2. Visemes of French vowels
Visemes Phonemes of vowels
V1 [a],[i],[e],[]
V2 [y],[o],[u],[]
V3 [],[]
We use the joint source and target vectors defined in equation
(7) rather than the source vectors only to train the GMM both
in the EM and supervised training methods, which is more
robust for small amounts spcifically since the joint density
should lead to a more judicious clustering for the regression
problem ([20]).
(7)
Where, is the dimension of the joint vector . Once the
GMM is trained, the parameters of GMM are fixed.
4.2. Results
The residual variances of the estimated lip and hand
parameters obtained by the supervised training GMM decrease
significantly compared to the multiple-linear model (see
Figure 4). The residual variances decreased with the increment
of the dimension of the source vector, i.e. the number of
predictors. Finally, the residual variance reaches to around 7%
for lip parameters (A, B and S) and 3% for hand coordinates
(x, y) respectively by using 16-dimensions source vector.
Figure 4: The average residual variance of the lip parameters
and the hand coordinates on the training data in function of
the dimension of the source vector. On the left column, the
number of the Gaussians m=3 for the lips parameters and on
the right column, m=5 for the hand parameters.
Figure 5: The average residual variance of the lip parameters
B (on left) and the hand coordinates x (on right) on training
data in function of the number of Gaussians in GMM. The red
line with crosses corresponds to the EM training GMM, the
black line with squares corresponds to the supervised training
GMM, the blue line with triangles corresponds to the multiple-
linear regression model.
Figure 5 compares the residual variance obtained by the
multiple-linear regression model, the supervised training
GMM mapping model and the EM trained GMM mapping
model. The results show that the residual variance tends
asymptotically to a limit value when the number of the
Gaussians increases for both lip and hand parameters
estimation in the case of EM trained GMM. And the residual
variances obtained by the multiple-linear model (denoted by
the blue triangle) are completely equal to the ones obtained by
the uni-Gaussian GMM model. The supervised training GMM
mapping model shows the competitive performance compared
to the EM trained GMM model in terms of number of
Gaussians. That is to say the supervised training GMM
mapping model is more efficient than the one trained by EM
method. In addition, the supervised training GMM model also
shows good robustness in the evaluation procedure (i.e. test
procedure) where it also retains the superior performance (see
Table 3).
Table 3. Evaluation results of the lip and hand parameter
mapping in terms of the 3 different models.
(%) MLR GMM (supervised) GMM (EM)*
A 17% 9% 7% (38 comp.)
B 12% 9% 9% (40 comp.)
S 14% 8% 8% (40 comp.)
(%) MLR GMM (supervised) GMM (EM) *
X 43% 8% 8% (60 comp.)
Y 31% 4% 5% (54 comp.)
* GMM (EM) shows the minimum residual variance and the number of the Gaussians with which the best results were obtained.

5. Discussion
These successive maps processing of the acoustic spectrum to
the lips parameters and the hand position showed that it is
much more difficult to estimate the hand position than lips
parameters. Several different approaches, from the direct
multi-linear method to the sophisticate GMM-based regression
method, have been employed to this problem. Actually the
source of the difficulty is that there is no relation between the
hand position and the spectral parameters unlike the case of
the lips as a vocal articulator with corresponding acoustic
consequences. More specifically, there are two key points of
the meaning of “no relation”: (1) there is no structural
topological relation between the acoustic space and the hand
position space. That is to say, the two closed vowels in the
acoustic space may be very far in the hand position space,
such as the vowel [e] and [i]. On the contrary, two far vowels
in the acoustic space may be corresponding to the same hand
position, such as vowel [a] and [o]. It indicates that the two
spaces have totally different topology structure since the hand
position is determined by the rules of CS but not the acoustic
parameters. This is the real reason why a large residual
variance was obtained with the multi-linear approach; (2) there
is no relation of the variance within group between the
acoustic space and the hand position space. That is to say, the
tiny variation of the sound will not consequently change the
hand position of the speaker. Indeed the hand position around
the center within group is random from person to person. Thus
it is impossible to establish a global linear relation by the
multi-linear model or even a local linear relation by the GMM
to predict the movement of the hand around the center within
group from the acoustic spectrum.
Figure 6. The linear interpolation in the acoustic
space between vowels [a] and [i].
In order to have a further understanding and comparison of the
different mapping approaches, a continuous transition has
been achieved by a linear interpolation in the acoustic spectral
parameter (i.e. MFCC+LSP) between the vowels [a] and [i].
The 16-dimension acoustic spectral parameters were projected
onto their first two PCA components to verify the continuous
linear transition in the acoustic space (see Figure 6). In fact
there are many ways to go to vowel [i] from vowel [a] in the
acoustic space in function of the choice on different starts and
ends, but here only one of them is presented as an example to
show the corresponding transition obtained by the different
mapping models. The corresponding transitions of the
estimated lip parameters and hand positions are shown in
Figure 7 and Figure 8. For the multi-linear method, the figures
present a reasonable linear relation between the linear
interpolation spectral parameters and the estimated hand
position or lip parameter. For the GMM based mapping
method (in the MMSE regression criterion, with 5 components
corresponding to the five hand position in CS for hand
position estimation and 10 components corresponding to the
ten vowels for lip parameter estimation), the four stable phases
during the transition both for the hand position and lips are
corresponding to the passing vowels ([a],[],[e],[i]) during the
spectral parameters changing linearly from vowel [a] to [i] in
the acoustic space. With the four stable phases, the GMM-
based mapping method shows classification-like property
which helps the model to decrease significantly the residual
variance in comparing with the multi-linear model. However,
unlike the GMM-based classification method which cannot
project the variance of the source data at all, the GMM-based
mapping method can still reflect the linear relation locally in
the region of the phase as shown in the figures. Due to the
strong linear correlation between the acoustic spectrum and
the lips parameter, the transition of lips shown in Figure 7 is
different as the case of the hand. The order of the phases
change in coherence with the lip parameter B and the multi-
linear model performs well passing close to the centers of
phases corresponding to the different vowels. The local linear
regression of GMM-based mapping method is effective and
varies in the right direction, however in the case of the hand
position estimation the local regression is weak and even in
the wrong direction (such as the local regression on the phase
of vowel [a] in Figure 6) due to there is “no relation” between
the hand position and the acoustic spectral parameters. With
the effective local regression, the GMM-based mapping
method can improve the estimation performance in
comparison with the multi-linear model.
Figure 7: The dynamic transition of X coordinates of
hand position by interpolation between the vowel [a]
and [i]. Results with the multi-linear mapping (X-
linear), the GMM mapping (X-gmm), and the gaussian
classifier applied to the spectral space (X-class).
Figure 8: The transition of lip parameter B by
interpolation between the vowel [a] and [i]. Results
with the multi-linear mapping (B-linear), the GMM
mapping (B-gmm), and the gaussian classifier applied
to the spectral space (B-class).
In the case of the hand positions estimation, the residual
variance of the GMM-based mapping approach decreases
i
a
e
a
e
i
i
a
e

significantly comparing to the linear approach by the class-like
property but results in the phase changing rapidly. In the case
of lip parameters estimation, the local regression of the GMM-
based mapping approach is more effective and the phase
changing is more gradual meanwhile the multi-linear approach
also performs well due to the strong linear correlation between
the acoustic spectral parameters and lips parameters.
With both the properties of the classifier and the regression
estimator, the GMM-based mapping method decreases the
residual variance of the estimated value significantly
comparing with the multi-linear model. These properties are
well presented in the case of the lip parameters estimation in
which the local regression and classification methods perform
well. However, when the relation is weak or even no relation
between the source and target data, the local regression will
degenerate or even meaningless such as the case of the hand
position estimation. At this time, the GMM-based mapping
method more tends to the classification method, thus the
residual variance may be no longer appropriate for evaluating
the model since the errors probably cannot be understood at all
even if the model has a small residual variance. The cognitive
effect of the human being in a perception task may be an
alternative evaluation criterion. But note that in the GMM-
based mapping method, there is one point essentially different
with the classification method that is the contributions of all
the components are always considered and weighted to
produce the final results. From this aspect, GMM-based
mapping method will effect better than the binary
classification method in the mapping problem.
6. Conclusion
This paper discusses the relations between the speech spectral
space and the visual space of speech and Cued Speech. This
program started with the case of oral French vowels. The
multiple-linear regression model as a simple case of the GMM
modeling has been first used to convert the spectral parameters
towards the lip parameters as well as the hand parameters of
the Cued Speech. The results show that the best predictors are
16 principal components derived from the 16 LSP and 16
MFCC coefficients. The linear approach showed its limit in
the case of the manual setting hand component of the Cued
Speech. Two types of GMM based model have been
introduced to solve the mapping problem. Since the GMM
based model explore the regression relationship between the
source and target vectors based on the Gaussians locally and
precisely rather than the rough regression based on the global
set as in the multiple-linear model, the results obtained by the
GMM based model were improved significantly with an
explanation of 93% for lip and 96% for hand components of
the original variance for the best results. In addition, the
supervised training GMM shows a high efficiency and good
robustness benefiting from the a priori phonetic information in
comparison with the EM training GMM which may be
affected more by the outliers due to the important dependence
on the data itself. For the future, these results have to be
evaluated in perception with deaf persons using supplemented
visual speech synthesizers.
7. Acknowledgements
The authors wish to thank the speaker to have accepted the
constraints of recording and Thomas Hueber for the fruitful
discussions on the method. This work is supported by the
National Agency of French Research through the TELMA and
PLASMODY projects.
8. References
[1] Montgomery, A. A., Jackson, P. L., 1983. Physical characteristics of the
lips underlying vowel lipreading performance. Journal of the Acoustical
Society of America 73(6),
[2] Nicholls, G., Ling, D., 1982. Cued Speech and the reception of spoken
language. Journal of Speech and Hearing Research 25, 262-269.
[3] Auer, E.T. Bernstein, L.E., 2007. Enhanced Visual Speech Perception in
Individuals With Early-Onset Hearing Impairment. Journal of Speech,
Language, and Hearing Research, Vol.50, pp. 1157-1165.
[4] Bernstein, L.E., Auer, E.T., Jr, & Jiang, J. (2010). "Lipreading, the
lexicon, and Cued Speech", in C. la Sasso, J. Leybaert, K. Crain (Eds.),
Cued Speech for the Natural Acquisition of English, Reading, and
Academic Achievement. Oxford University Press.
[5] Strelnikov, K., Rouger, J., Lagleyre, S., Fraysse, B., Deguine, O. &
Barone, P. 2009. Improvement in speech-reading ability by auditory
training: Evidence from gender differences in normally hearing, deaf and
cochlear implanted subjects. Neuropsychologia, 47, 972-979.
[6] Cornett, R. O. (1967). “Cued Speech,” American Annals of the Deaf ,112,
3-13, 1967.
[7] Attina, V., Beautemps, D., Cathiard, M. A. & Odisio, M. (2004). “A pilot
study of temporal organization in Cued Speech production of French
syllables: rules for Cued Speech synthesizer,” Speech Communication,
vol. 44, pp. 197-214.
[8] Uchanski, R.M., Delhorne, L.A., Dix, A.K., Braida, L.D., Reed, C.M.,
Durlach, N.I., 1994. Automatic speech recognition to aid the hearing
impaired: Prospects for the automatic generation of cued speech. Journal
of Rehabilitation Research and Development 31(1), 20-41.
[9] Leybaert, J., 2000. Phonology acquired through the eyes and spelling in
deaf children. Journal of Experimental Child Psychology 75, 291-318.
[10] Tokuda, K., T. Yoshimura, et al. (2000). Speech parameter generation
algorithms for HMM-based speech synthesis. IEEE International
Conference on Acoustics, Speech, and Signal Processing, Istanbul,
Turkey.
[11] Zen, H., K. Tokuda, et al. (2004). An introduction of trajectory model into
HMM-based speech synthesis. ISCA Speech Synthesis Workshop,
Pittsburgh, PE.
[12] Toda, T., A. W. Black, et al. (2004). Mapping from articulatory
movements to vocal tract spectrum with Gaussian mixture model for
articulatory speech synthesis. International Speech Synthesis Workshop,
Pittsburgh, PA.
[13] Uto, Y., Y. Nankaku, et al. (2006). Voice conversion based on mixtures of
factor analyzers. InterSpeech, Pittsburgh, PE.
[14] Duchnovski, P., D. S. Lum, J. C. Krause, M. G. Sexton, M. S. Bratakos
and L. D. Braida (2000). "Development of speechreading supplements
based on automatic speech recognition." IEEE Transactions on
Biomedical Engineering 47(4): 487-496.
[15] Gibert, G., Bailly, G., Beautemps, D., Elisei, F., & Brun, R. (2005).
“Analysis and synthesis of the 3D movements of the head, face and hand
of a speaker using Cued Speech,” J. Acoust. Soc. Am., vol. 118(2), pp.
1144–1153.
[16] Beautemps, D., Girin, L., Aboutabit, N., Bailly, G., Besacier, L., Breton,
G., Burger, T., Caplier, A., Cathiard, M.A., Chêne, D., Clarke, J., Elisei,
F., Govokhina, O., Le, V.B., Marthouret, M., Mancini, S., Mathieu, Y.,
Perret, P., Rivet, B., Sacher, P., Savariaux, C., Schmerber, S., Sérignat,
J.F., Tribout, M., Vidal, S. (2007), “TELMA: Telephony for the Hearing-
Impaired People, From Models to User Tests,” In Proceedings of.
ASSISTH 2007, pp. 201–208
[17] Berthommier F. (2003). Audiovisual Speech Enhancement Based on the
Association between Speech Enveloppe and Video Features. In
Proceedings of Eurospeech’2003.
[18] Lallouache, M.T. (1991). “Un poste Visage-Parole couleur. Acquisition et
traitement automatique des contours des lèvres,” Ph.D. Thesis, Institut
National Polytechnique de Grenoble, 1991.
[19] Kain, A. (2001). High-resolution voice transformation (PhD, OGI School
of Science & Engineering, Oregon Health & Science University)..
[20] Hueber, T., Benaroya, E.L, Denby, B., Chollet, G. (2011). "Statistical
Mapping between Articulatory and Acoustic Data for an Ultrasound-based
Silent Speech Interface", Proceedings of Interspeech, pp. 593-596,
Firenze, Italia.
[21] Bishop, C. M. (2006). Pattern Recognition and Machine Learning. New
York: Springer.


Lucie Scarbel, Denis Beautemps, Jean-Luc Schwartz, S. Schmerber, Marc Sato.
(2014). L'ombre d'un doute ? Interactions perceptivo-motrices lors de taches de close-
shadowing auditive et audio-visuelles. Journées d'Etudes sur la Parole (JEP 2014), June 2014,
Le Mans, France.


L’ombre d’un doute ? Interactions perceptivo-motrices
lors de taches de close-shadowing auditive et
audio-visuelles
Lucie Scarbel, Denis Beautemps, Jean-Luc Schwartz, S. Schmerber, Marc Sato
To cite this version:
Lucie Scarbel, Denis Beautemps, Jean-Luc Schwartz, S. Schmerber, Marc Sato. L’ombre d’undoute ? Interactions perceptivo-motrices lors de taches de close-shadowing auditive et audio-visuelles. Journees d’Etudes sur la Parole (JEP 2014), Jun 2014, Le Mans, France. pp.1-10.<hal-01072081>
HAL Id: hal-01072081
https://hal.archives-ouvertes.fr/hal-01072081
Submitted on 7 Oct 2014
HAL is a multi-disciplinary open accessarchive for the deposit and dissemination of sci-entific research documents, whether they are pub-lished or not. The documents may come fromteaching and research institutions in France orabroad, or from public or private research centers.
L’archive ouverte pluridisciplinaire HAL, estdestinee au depot et a la diffusion de documentsscientifiques de niveau recherche, publies ou non,emanant des etablissements d’enseignement et derecherche francais ou etrangers, des laboratoirespublics ou prives.

L'ombre d'un doute? L'ombre d'un doute? L'ombre d'un doute? L'ombre d'un doute?
Interactions perceptivoInteractions perceptivoInteractions perceptivoInteractions perceptivo----motrices lors de tâches de closemotrices lors de tâches de closemotrices lors de tâches de closemotrices lors de tâches de close----
shadowing auditive et audioshadowing auditive et audioshadowing auditive et audioshadowing auditive et audio----visuellesvisuellesvisuellesvisuelles
Lucie Scarbel1, Denis Beautemps 1, Jean-Luc Schwartz 1, Sébastien Schmerber2, Marc Sato 1
(1) GIPSA-LAB, Département Parole & Cognition ; CNRS UMR 5216 - Université de Grenoble-Alpes ; (2) Service ORL du CHU Grenoble
RESUME _________________________________________________________________________________________________
Un argument classique en faveur des théories motrices de la perception de la parole provient
du paradigme de « close-shadowing » (répétition rapide). Le fait que cette tâche de close-
shadowing entraîne des réponses orales bien plus rapides qu’en réponses manuelles suggère
en effet un codage des représentations perceptives dans un format moteur, compatible avec
une réponse orale. Un autre argument est apporté par les interactions audio-visuelles lors de
la perception de parole, souvent interprétées en référence à un couplage fonctionnel entre
audition, vision et motricité. Dans cette étude, nous avons combiné ces deux paradigmes de
manière à tester si la modalité visuelle pouvait induire des réponses motrices plus rapides
lors d'une tâche de close-shadowing. Pour ce faire, différentes tâches de catégorisation orale
et manuelle de stimuli de parole présentés auditivement ou audio-visuellement, en présence
ou non d'un bruit blanc, ont été réalisées. De manière générale, les réponses orales ont été
plus rapides que les réponses manuelles, mais aussi moins précises, notamment dans le
bruit, ce qui suggère que la représentation motrice induite par la stimulation pourrait être
peu précise dans un premier niveau de traitement. En présence d'un bruit acoustique, la
modalité audiovisuelle s’est avérée à la fois plus rapide et plus précise que la modalité
auditive. Aucune interaction entre le mode de réponse et la modalité de présentation des
stimuli n'a cependant été observée. Nous interprétons l’ensemble de ces résultats dans un
cadre théorique proposant l'existence de boucles perceptivo-motrices, dans lesquelles les
entrées auditives et visuelles seraient intégrées et reliées à la génération interne de
représentations motrices préalablement au processus final de décision.
ABSTRACT _______________________________________________________________________________________________
The sThe sThe sThe shadow of a doubt? Evidence for perceptuohadow of a doubt? Evidence for perceptuohadow of a doubt? Evidence for perceptuohadow of a doubt? Evidence for perceptuo----motor linkage during auditory and motor linkage during auditory and motor linkage during auditory and motor linkage during auditory and
audiovisual close shadowingaudiovisual close shadowingaudiovisual close shadowingaudiovisual close shadowing
One classical argument in favor of a functional role of the motor system in speech perception
comes from the close shadowing task in which a subject has to identify and to repeat as
quickly as possible an auditory speech stimulus. The fact that close shadowing can occur
very rapidly and much faster than manual identification of the speech target is taken to
suggest that perceptually-induced speech representations are already shaped in a motor-
compatible format. Another argument is provided by audiovisual interactions often
interpreted as referring to a multisensory-motor framework. In this study, we attempted to

combine these two paradigms by testing whether the visual modality could speed motor
response in a close-shadowing task. To this aim, both oral and manual responses were
evaluated during the perception of auditory and audio-visual speech stimuli, clear or
embedded in white noise. Overall, oral responses were much faster than manual ones, but it
also appeared that they were less accurate in noise, which suggests that motor
representations evoked by the speech input could be rough at a first processing stage. In the
presence of acoustic noise, the audiovisual modality led to both faster and more accurate
responses than the auditory modality. No interaction was however observed between
modality and response. Altogether, these results are interpreted within a two-stage sensory-
motor framework, in which the auditory and visual streams are integrated together and with
internally generated motor representations before a final decision may be available.
MOTS-CLES : perception de la parole, production de la parole, perception de la parole audio-
visuelle, close-shadowing, interaction sensorimotrice
KEYWORDS: speech perception, speech production, audio visual speech perception, close-
shadowing, sensory motor interaction
1 Introduction
Un débat classique dans le domaine de la perception de la parole concerne l’implication du
système moteur et du lien fonctionnel entre représentations auditives et motrices. Les
théories auditives de la perception de parole réfutent l'implication du système moteur et
proposent l'existence de processus auditifs de décodage phonétique à partir du signal
acoustique (Diehl et al., 2004). A contrario, Liberman et al. (1985) et Fowler (1986)
supposent que pour percevoir la parole, nous utilisons des représentations procédurales
motrices basées sur notre expérience de locuteur. Enfin, les théories perceptivo-motrices
postulent que les représentations motrices soient utilisées en lien avec les représentations
auditives dans le traitement et décodage des informations phonétiques (Skipper et al., 2007,
Schwartz et al. 2012).
Dans une récente revue sur les théories motrices, Galantucci et al. (2006) rappellent les
principaux arguments expérimentaux et en mentionnent notamment deux qui fournissent le
cœur du présent travail. Un premier argument en faveur d’un couplage perceptivo-moteur
en parole provient du paradigme de close-shadowing. Ce paradigme (Porter et al., 1980 ;
Fowler et al., 2003) consiste à répéter le plus rapidement possible des stimuli de parole.
L’analyse des réponses orales permet de mesurer la rapidité et le taux de répétitions
correctes. Galantucci (2006) compare ces résultats avec les temps de réaction obtenus par
Luce (1986) dans une tâche de réponse manuelle dans laquelle les sujets utilisaient une
touche. Les résultats montrent une augmentation des temps de réaction dans le cas de la
réponse manuelle. Cette différence ne pouvant être expliquée par la difficulté du choix des
touches dans la tâche de décision manuelle, Galantucci et al. l’interprètent par le fait que si
percevoir la parole c’est percevoir des gestes, alors la perception des gestes préparerait la
réponse orale et la rendrait ainsi plus rapide.
Le second paradigme est celui de la multisensorialité. De nombreuses études ont montré que
l’entrée visuelle améliore la compréhension de parole, tant pour les sujets malentendants
que normo-entendants. Sumby & Pollack (1954) ont été parmi les premiers à démontrer
l'apport de la modalité visuelle pour percevoir et comprendre la parole dans des conditions

bruitées. L’apport de la modalité visuelle a été également démontré dans des études de
répétition (shadowing) où la tâche consistait à répéter oralement les stimuli, et à mettre
ainsi en évidence une meilleure compréhension par des sujets de matériaux linguistiques
complexes ou produits dans une langue étrangère ou avec accent étranger (Reisberg, 1987 ;
Davis and Kim, 2001). Cependant, ces tâches de répétition se sont faites sans pression de
temps (shadowing et non close-shadowing). Or la tâche de répétition rapide fournit une
fenêtre riche sur la dynamique temporelle du processus de décision. A l’inverse les
expériences de close-shadowing n’ont jamais incorporé la modalité visuelle, se privant d’une
connaissance sur le rôle des interactions audiovisuelles en lien avec les relations perceptuo-
motrices. La présente étude se propose précisément d’étudier, pour la première fois, quel est
l’apport de la modalité visuelle dans une tâche de close-shadowing.
Cette étude est composée de deux expériences, toutes deux focalisées sur une évaluation
conjointe de la précision et de la rapidité de réponses orales ou manuelles à des stimuli
auditifs ou audio-visuels. Les deux expériences ont été réalisées sur des stimuli de parole
non-lexicaux (logatomes), présentés sans bruit dans la première expérience (Expérience A)
ou avec bruit acoustique dans la seconde expérience (Expérience B). Les hypothèses sous-
jacentes sont que (1) les réponses orales devraient être plus rapides que les réponses
manuelles, en accord avec les études précédentes sur le close-shadowing, et que (2) les
réponses aux stimuli audio-visuels devraient être plus rapides et plus précises que celles aux
stimuli auditifs, au moins dans l'Expérience B impliquant des stimuli bruités. Une question
supplémentaire concerne la possibilité d’une interaction entre ces deux effets, qui
permettrait d’évaluer si l’effet de la vision est différent entre une modalité de réponse
(orale) et l’autre (manuelle).
2 Méthodologie
2.1 Participants
Deux groupes de quinze et quatorze adultes sains, de langue maternelle française, ont
participé aux Expériences A et B (Expérience A: 10 femmes; moyenne d’âge: 29 ans, entre 20
et 38 ans - Expérience B: 11 femmes; moyenne d’âge: 24 ans, entre 19-34 ans). Tous les
participants ont une vision normale ou corrigée à la normale et ont rapporté n’avoir jamais
eu des troubles moteurs, de la parole ou de l’audition.
2.2 Procédure expérimentale
Chaque expérience consistait en deux tâches de catégorisation : une tâche de close-
shadowing où les réponses étaient données oralement, en répétant le plus vite possible la
séquence présentée, et une tâche de décision manuelle, où les réponses étaient données
manuellement, en appuyant le plus vite possible sur la touche appropriée. Les stimuli à
catégoriser correspondaient aux séquences /apa/, /ata/ et /aka/ (voir ci-dessous). Les
participants étaient informés qu’on allait leur présenter des séquences /apa/, /ata/ ou
/aka/, soit de manière auditive soit de manière audio-visuelle. Dans la tâche de close-
shadowing, on leur demandait de catégoriser et répéter chaque séquence le plus vite
possible. Pour ce faire, ils devaient produire la voyelle initiale /a/ puis répéter
immédiatement la syllabe CV perçue (/pa/, /ta/ ou /ka/). Lors de la tâche de décision
manuelle, les participants devaient catégoriser chaque énoncé en appuyant le plus vite

possible avec leur main dominante sur une des trois touches correspondant respectivement
à /apa/, /ata/ ou /aka/. L’ordre des touches était contrebalancé entre les participants. Pour
chaque tâche (avec réponses manuelles ou orales) et chaque modalité (auditive ou audio-
visuelle), 16 répétitions de chacune des séquences /apa/, /ata/ et /aka/ étaient présentées
de manière randomisée. Les ordres de présentation des tâches et des modalités étaient
contrebalancés entre les participants. Les deux expériences ont été réalisées dans une
chambre sourde. Les participants étaient assis en face d’un ordinateur à une distance
d’approximativement 50 cm. Les stimuli acoustiques étaient présentés à un niveau sonore
confortable, celui-ci étant le même pour tous les participants. Le logiciel Presentation
(Neurobehavioral Systems, Albany, CA) a été utilisé pour contrôler la présentation des
stimuli et pour enregistrer les réponses manuelles. Toutes les productions des participants
ont été enregistrées grâce à un microphone AKG 1000S pour les analyses offline, avec un
système assurant la synchronisation entre les stimuli présentés et la réponse des
participants. Une courte session d’entrainement précédait chaque tâche. La durée totale de
chaque expérience était d’environ 30 minutes.
2.3 Stimuli
Les séquences /apa/ /ata/ et /aka/, produites dans une chambre sourde par un homme de
langue maternelle française ont été enregistrées audio-visuellement au moyen d'un
microphone AKG 1000S (44.1 kHz) et d'une caméra haute qualité au format PAL placée en
face du locuteur (images détramées de 572 par 520 pixels, 50 Hz). Le corpus a été enregistré
avec pour objectif d’obtenir pour chaque séquence 4 productions distinctes impliquant
quatre durées de la voyelle initiale /a/ (0.5s, 1s, 1.5s et 2 s) dans le but de réduire toute
prédiction temporelle de la séquence à catégoriser). Les durées des 12 stimuli ainsi
sélectionnés ont été égalisées (3 séquences x 4 productions). Les stimuli étaient présentés
sans bruit additionnel dans l’Expérience A, un bruit blanc (filtré à -6 dB/oct) a été ajouté à
chaque stimulus dans l'Expérience B (rapport signal sur bruit de -3 dB).
2.4 Analyses acoustiques
Afin de calculer les temps de réaction (RTs) et la proportion de réponses correctes dans la
tâche à réponses orales, des analyses acoustiques de la production des participants ont été
réalisées en utilisant le logiciel Praat (Boersma et Weenink, 2013). Les temps de réaction ont
été calculés uniquement pour les réponses correctes : les omissions ou tout autre type
d’erreurs (c’est-à-dire le remplacement d’une consonne par une autre ou la production de
deux consonnes ou de deux syllabes pour un même stimulus dans la tâche de close-
shadowing) ont été exclues. Les temps de réaction pour les réponses orales ont été mesurés
entre le début du burst consonantique du stimulus et de la réponse.
2.5 Analyse des données
Dans chaque expérience, la proportion de réponses correctes et la médiane des temps de
réaction étaient déterminées individuellement pour chaque participant, chaque tâche et
chaque modalité, séparément pour /apa/, /ata/ et /aka/. Deux ANOVA à mesures répétées
ont été réalisées sur ces données, avec le groupe (Expérience A avec stimuli non-bruités vs.
Expérience B avec stimuli bruités) comme variable inter-sujets et la tâche (close shadowing

vs. décision manuelle), la modalité (audio vs. audio-visuelle), et le type de stimulus (/apa/ vs
/ata/ vs /aka/) comme variables intra-sujets.
3 Résultats
Pour toutes les analyses suivantes, le niveau de significativité était fixé à p = .05 et corrigé en
cas de violation de l’hypothèse de sphéricité. Les analyses post-hoc ont été effectuées en
utilisant des tests de Bonferroni.
3.1 Temps de réaction
Comme attendu, l’effet principal du groupe est significatif (F(1,27)=24,38; p<0.001), avec
des temps de réaction pour les stimuli non bruités de l’expérience A plus courts que ceux des
stimuli bruités de l’expérience B (351 ms vs 484 ms). Les effets principaux de la tâche
(F(1,27)=151,70; p<0.001) et de la modalité (F(1,27)=14,79; p<0.001) sont aussi
significatifs. Pour la tâche, les réponses orales étaient plus rapides que les réponses
manuelles (286ms vs 545ms). Par rapport à la modalité, les temps de réaction étaient plus
courts dans la modalité audio-visuelle par rapport à la modalité auditive (405 ms vs. 425
ms). Une interaction significative entre groupe et modalité (F(1,27)=21,74; p<0.001)
montre que l’effet bénéfique de la présentation audio-visuelle est présent avec les stimuli
bruités dans l’expérience B (461 ms vs. 507 ms) mais non avec les stimuli non-bruités de
l’expérience A (354 ms vs. 349 ms). Par contre, l’interaction entre modalité et réponse n’est
pas significative.
Ces effets semblent être dépendants des syllabes perçues. Notamment, une interaction à
trois facteurs ‘tâche x modalité x syllabe’ a été trouvée (F(2,54)=6,49; p<0.005). Dans la
modalité auditive, aucune différence significative des temps de réaction n’a été observée
entre les syllabes à la fois pour les réponses orales et pour les réponses manuelles. Par
contre, dans la modalité audio-visuelle, les temps de réaction pour les réponses orales
étaient plus rapides pour la syllabe /pa/ par rapport aux syllabes /ta/ et /ka/, alors que les
temps de réaction pour les réponses manuelles étaient plus rapides pour /pa/ par rapport à
/ka/ et pour /ka/ par rapport à /ta/.
Ainsi, globalement, on obtient un patron de résultats attendus : des temps de réponse plus
courts en réponse orale, un effet du bruit ralentissant les temps de réponse, une accélération
de la réponse en modalité audiovisuelle par rapport à la modalité auditive en présence de
bruit. Il n’apparaît cependant pas d’interaction entre modalité et type de réponse.
3.2 Proportion de réponses correctes
L’effet principal du groupe est significatif (F(1,27)=266,28; p<0.001) avec une proportion
de réponses correctes plus élevée pour les stimuli non-bruités de l’expérience A (95%) par
rapport aux stimuli bruités de l’expérience B (61%). D’autres effets principaux ont été
significatifs, à la fois pour la tâche (F1(1,27)=69,40 ; p<0.001) et pour la modalité
(F(1,27)=52,39; p<0.001). Concernant la tâche, une baisse importante des réponses
correctes a été observée pour les réponses orales par rapport aux réponses manuelles (73%
vs. 85%). Comme l’interaction significative du groupe par la tâche (F(1,27)=38,67;
p<0.001) l’indique, cet effet n’apparait que pour les stimuli bruités de l’expérience B (71%

vs. 50%) alors qu’aucune différence n’a été observée entre les réponses orales et manuelles
pour les stimuli non-bruités de l’expérience A (93% vs. 98%). Concernant la modalité, la
modalité audio-visuelle apporte plus de réponses correctes que la modalité auditive (82%
vs. 75%). Par contre, comme l’indique l’interaction significative ’groupe x modalité’
(F(1,27)=72,36; p<0.001) aucune différence n’apparaît entre les deux modalités avec les
stimuli non-bruités de l’expérience A (96% vs. 95%) alors qu’avec les stimuli bruités de
l’expérience B, la modalité audio-visuelle apporte plus de réponses correctes (68%) que la
modalité auditive (53%).
Là encore, les résultats dépendent de la syllabe présentée. Si les 3 syllabes sont parfaitement
identifiées dans l’Expérience A en l’absence de bruit, quelle que soit la tâche et la modalité,
en condition bruitée (Expérience B) la syllabe « pa » apparaît la plus saillante à la fois
auditivement et visuellement. Si on obtient ici encore une confirmation d’un patron attendu
(réponses plus précises en l’absence de bruit et, dans le cas de stimuli bruités, en présence
de la modalité visuelle), un résultat fort et inattendu doit être relevé : le fait que la réponse
orale dégrade la précision de la réponse en cas de stimuli bruités (Expérience B). Une
nouvelle fois, il n’apparaît pas d’interaction entre modalité et type de réponse.
Tableau 1: Moyenne des temps de réaction (en ms.) et des % de réussite
modalitémodalitémodalitémodalité AAAA AAAA AAAA AAAA AAAA AAAA AVAVAVAV AVAVAVAV AVAVAVAV AVAVAVAV AVAVAVAV AVAVAVAV
modemodemodemode oraloraloraloral oraloraloraloral oraloraloraloral manuelmanuelmanuelmanuel manuelmanuelmanuelmanuel manuelmanuelmanuelmanuel oraloraloraloral oraloraloraloral oraloraloraloral manuelmanuelmanuelmanuel manuelmanuelmanuelmanuel manuelmanuelmanuelmanuel
syllabesyllabesyllabesyllabe kakakaka papapapa tatatata kakakaka papapapa tatatata kakakaka papapapa tatatata kakakaka papapapa tatatata
RTs sans bruitRTs sans bruitRTs sans bruitRTs sans bruit 250 208 259 471 442 465 261 197 268 474 416 506
RTs avec bruitRTs avec bruitRTs avec bruitRTs avec bruit 348 335 373 614 666 632 277 296 318 531 653 601
% sa% sa% sa% sans bruitns bruitns bruitns bruit 90% 99% 93% 98% 99% 98% 89% 100% 88% 98% 96% 97%
% avec bruit% avec bruit% avec bruit% avec bruit 56% 36% 40% 67% 42% 79% 89% 44% 38% 96% 58% 85%
4 Discussion
4.1 Effet de la tâche : mode de réponse oral ou manuel
Dans la condition non bruitée (Expérience A), les réponses orales sont plus rapide que les
réponses manuelles (240ms vs. 462ms), mais aussi marginalement moins précises (93% vs.
98%, effet non significatif). Les temps de réaction sont en adéquation avec ceux obtenus par
Fowler et al. (2003) et par Porter & Castellanos (1980). Ces auteurs interprètent la rapidité
de la réponse dans le mode oral en référence avec les théories motrices. Le système orofacial
serait ainsi favorisé pour répondre de manière très rapide, puisque le percept serait déjà en
adéquation avec le format moteur ; le système manuel, nécessitant une étape transitoire
entre la décision et l’action, serait ralenti d’autant. Cependant, les données de la condition
bruitée (Expérience B) apportent des précisions importantes et inattendues sur ce
raisonnement. En effet, alors que les temps de réaction restent plus courts dans la tâche de
close-shadowing (334ms vs. 633ms), la précision dans la tâche de réponse orale diminue
considérablement par rapport à la tâche de décision manuelle (50% vs. 71%).
Ces nouvelles données nécessitent de modifier l’interprétation des tenants des théories
motrices jusqu’à un certain point. Nous allons proposer une tentative d’explication dans le

cadre du modèle proposé par Skipper et al. (2007) pour intégrer les interactions perceptuo-
motrices dans la perception de parole. Ces auteurs proposent un modèle inspiré de
« l’analyse par la synthèse » (Stevens & Halle 1967 ; Bever & Poeppel, 2010). Le modèle de
Skipper et al. implique une boucle corticale entre les aires auditives et motrices. Après un
stade initial de traitement auditif dans le cortex temporal (cortex auditif primaire,
secondaire et aires associatives : stade 1), le cortex frontal générerait des hypothèses
phonémiques associées avec les buts articulatoires puis des commandes motrices
correspondant à cette prédiction initiale (Pars opercularis, cortex pré moteur ventral et
cortex moteur primaire : stade 2), afin d’émettre des copies d’efférence qui seraient ensuite
renvoyées dans le cortex auditif afin d’être comparées avec l’input auditif (stade 3). Ce
modèle peut être utilisé comme une base pour tenter d’interpréter nos propres données.
Pour ce faire, nous supposons que les réponses manuelles et orales sont générées à deux
stades différents dans cette boucle de traitement. Les réponses orales seraient générées au
stade 2, en accord avec les postulats de Porter & Castellanos ou de Fowler et al. Quand
l’information provenant du cortex auditif aurait généré des commandes motrices dans le
cortex moteur, le système orofacial, pré-activé depuis le début de l’expérience de close-
shadowing pour permettre aux participants de répondre le plus vite possible, générerait une
réponse orale produite par ces commandes motrices. Les réponses orales étant traitées à un
stade précoce, elles seraient donc plus rapides mais sont aussi, selon nos résultats, moins
précises, ce qui correspond au modèle de Skipper et al. qui considère qu’il ne s’agirait que
d’une première hypothèse de réponse qui devraient être affinées à un stade ultérieur. Au
stade 2, par contre, le système manuel ne reçoit pas de stimulations spécifiques permettant
de générer une réponse. Par contre, au stade suivant (stade 3), le transfert de l’information
auditive au cortex auditif, grâce à la copie d’efférence, fournit, en intégrant cette hypothèse
motrice avec l’entrée acoustique, une information plus précise qui peut alors être transférée
au système manuel pour réponse. Dans ce raisonnement, les réponses orales et manuelles
seraient émises à deux instants différents du processus d’analyse par synthèse. Par
conséquent, les temps de réaction pour les réponses manuelles seraient plus lents que ceux
des réponses orales, mais les réponses seraient plus précises puisque, contrairement aux
réponses orales, dans la tâche de décision manuelle les prédictions auraient été confirmées
et ajustées avec le cortex auditif avant la décision finale envoyée aux commandes motrices
manuelles pour appui de la touche adéquate. Bien sûr cette explication est probablement
trop simple pour tenir compte de tous les aspects de nos données. Néanmoins, l’aspect
crucial de nos résultats est qu’une hypothèse de pur processus d’identification motrice,
certes compatible avec des temps de réaction plus courts en réponse orale, ne semble pas
pouvoir rendre compte de la diminution de la précision de réponse orale pour des stimuli
bruités. Ces résultats semblent donc réfuter une version stricte des théories motrices au
profit de théories perceptuo-motrices de la perception de parole telles que celle de Skipper
et al. (2007).
4.2 Effets de la modalité : auditive vs. audio-visuelle
Les effets de la modalité n’apparaissent dans notre étude que dans l’Expérience B avec les
stimuli bruités. Dans la modalité auditive, les temps de réaction sont alors plus longs que
dans la modalité audio-visuelle, et les proportions de réponses correctes sont plus faibles.
Pris ensemble, ces résultats montrent un bénéfice clair de l’apport de la modalité visuelle à
l’input auditif, ce qui est en accord avec toutes les études depuis Sumby et Pollack (1954).

Dans notre étude, l’avantage audio-visuel apparaît essentiellement pour la syllabe /pa/ ce
qui est classique et en lien avec la haute visibilité des mouvements des lèvres associées à la
bilabiale /p/, et le fort degré de confusion entre les mouvements visuels associés à /t/ ou
/k/, généralement considérés comme appartenant à la même classe visémique. Ces effets de
la modalité ne sont pas présents dans l’Expérience A avec des stimuli non-bruités, très
probablement parce que les temps de réaction dans la modalité auditive sont déjà trop
courts et les proportions de réponses correctes trop élevées pour être améliorés par l’entrée
visuelle (effet plafond).
Un point intéressant est qu’il n’y a pas d’interaction significative entre la modalité et la tâche
c’est-à-dire que la diminution des temps de réaction et l’amélioration des proportions de
réponses correctes de la modalité auditive à la modalité audiovisuelle sont similaires dans
les tâches orales ou manuelles. Nous allons là encore tenter d’interpréter cette absence
d’interaction dans le cadre du modèle proposé par Skipper et collègues. Dans ce modèle, les
informations auditives et visuelles, après prétraitement dans les aires auditives et visuelles,
convergeraient dans une aire multi-sensorielle dans le cortex temporal postéro-supérieur
(stade 1). Ensuite, dans le cas d’un input multi-sensoriel, les premières hypothèses seraient
donc plutôt multi-sensorielles plutôt qu’uniquement auditives. A partir de là comme
précédemment génération d’une hypothèse phonémique associée avec des buts
articulatoires puis des commandes motrices orofaciales (stade 2), et émission d’une copie
d’efférence fournissant une prédiction multisensorielle comparée avec l’input (stade 3).
Dans notre étude, les interactions audio-visuelles du stade 1 affineraient les procédés
sensori-moteurs et produiraient des hypothèses phonémiques plus rapides et plus précises
au stade 2, qui est le stade où, dans notre interprétation, les réponses orales seraient
générées. Ensuite le même gain en rapidité et en précision serait rétro-propagé vers les aires
auditives pour génération des réponses manuelles (stade 3). Il n’y aurait ainsi pas de raison
d’attendre des différences de gain visuel entre les tâches orales ou manuelles, le gain étant
essentiellement déterminé dès le stade 1 dans le modèle.
5 Conclusion
En résumé, les résultats de la présente étude suggèrent que les réponses manuelles et orales
sont générées à deux stades différents dans la chaine de perception de la parole. Dans la
théorie du modèle « d’analyse par synthèse », les réponses manuelles serait fournies
seulement à la fin de la boucle complète, incluant un processus feedworward de génération
de prédictions phonémiques associées avec les buts articulatoires puis des commandes
motrices émettant en feedback des hypothèses multi-sensorielles comparées au flux
d’évènements multi-sensoriels. Contrairement aux réponses manuelles, les réponses orales
seraient produites à un stade plus précoce (fin du processus feedforward) où les commandes
motrices sont générées, produisant des réponses plus rapides mais moins précises. L’apport
visuel améliorerait la rapidité et la précision pour les phonèmes suffisamment visibles
(comme par exemple /p/) et ce lorsque le système auditif est en difficulté (conditions
adverses, par exemple en présence de bruit). Bien évidemment, d’autres interprétations ou
d’autres théories pourraient être confrontées aux présentes données expérimentales. Mais
globalement, l’ensemble des résultats de cette étude semble nécessiter une théorie
perceptuo-motrice de la perception de parole dans laquelle les flux auditifs et visuels sont
intégrés à des représentations motrices auto-générées, avant d’aboutir à une décision finale.

Remerciements
Les auteurs tiennent à remercier l’ANR Plasmody qui a permis de financer cette étude, ainsi
que les participants qui se sont portés volontaires pour les deux expériences.
Bibliographie
Bever, T. G., & Poeppel, D. (2010). Analysis by synthesis: A (re-)emerging program of research for
language and vision. Biolinguistics, 4.2-.3, 174-200.
Davis, C. & Kim, J. (2001), 'Repeating and remembering foreign language words: Implications for
language teaching system', Artificial Intelligence Review, vol 16, no 1 , pp 37 - 47.
Diehl, R.L., Lotto, A.J., & Holt, L.L. (2004). Speech perception. Annual Review of Psychology, 55, 149-
179.
Fowler, C. A., Brown, J. M., Sabadini, L., & Weihing, J. (2003). Rapid access to speech gestures in
perception: Evidence from choice and simple response time tasks. Journal of Memory and Language,
49, 296–314.
Fowler, C. A. (1986). An event approach to the study of speech perception from a direct-realist
perspective. Journal of Phonetics, 14, 3–28.
Galantucci, B., Fowler, C. A., & Turvey, M. T. (2006). The motor theory of speech perception reviewed.
Psychonomic Bulletin & Review, 13, 361-377.
Liberman, A. M., & Mattingly, I. G. (1985). "The motor theory of speech perception revised". Cognition
21 (1): 1–36.
Luce RD. (1986). Response times: Their role in inferring elementary mental organization. Oxford
University Press; New York.
Porter, R., & Castellanos, F. (1980). Speech production measures of speech perception: Rapid
shadowing of VCV syllables. Journal of the Acoustical Society of America, 67, 1349–1356.
Reisberg, D, McLean, J. & Goldfield, A. (1987). Easy to Hear to Understand: A Lip-Reading Advantage
with Intact Auditory Stimuli. In Dodd, B. and Cambell, R. (eds.) Hearing by Eye: The Psychology of Lip-
Reading, 97-113. London: Lawrence Erlbaum.
Schwartz, J.L., Basirat, A., Ménard, L., & Sato, M. (2010). The Perception-for-Action-Control Theory
(PACT): A perceptuo-motor theory of speech perception. Journal of Neurolinguistics, 25, 336-354.
Skipper, J. I., van Wassenhove, V., Nusbaum, H. C., & Small, S. L. (2007). Hearing lips and seeing voices:
How cortical areas supporting speech production mediate audiovisual speech perception. Cerebral
Cortex. 17 : 2387-2399.
Stevens, K.N., & Halle, M. (1967). Remarks on analysis by synthesis and distinctive features. In:
Wathem-Dunn, W. (ed), Models for the Perception of Speech and Visual Form. Cambridge, MA: MIT
Press.
Sumby W.H., & Pollack I. (1954). Visual contribution to speech intelligibility in noise. J. Acoust. Soc. Am.
26 (2), 212-215.