Embed Size (px)
Citation preview

HSEHealth & Safety
Executive
The scale of occupational stress:A further analysis of the impact of
demographic factors and type of job
Prepared by:Centre for Occupational and Health Psychology
School of Psychology, Cardiff Universityfor the Health and Safety Executive
CONTRACT RESEARCH REPORT
311/2000

HSEHealth & Safety
Executive
The scale of occupational stress:A further analysis of the impact of
demographic factors and type of job
Andrew Smith, Carolyn Brice, Alison Collins,Victoria Matthews & Rachel McNamara
Centre for Occupational and Health PsychologySchool of Psychology, Cardiff University
PO Box 901, Cardiff CF10 3YG
A recent survey of a random population sample showed that about 20% of the workers reported veryhigh or extremely high levels of stress at work. Preliminary analyses suggested that the scale of stressmay vary considerably and the present report describes further analyses of the data reported in HSEContract Research Report 265/2000. The aim of the analyses was to identify factors associated withperceptions of stress at work. The results do not allow conclusions about causal links between thefactors and reported stress. Analyses of the demographic variables showed that gender had littleoverall effect although it did interact with other factors, such as full-time/part-time employment. Themiddle aged workers (30-50 year olds) had slightly higher proportions in the high reported stresscategory than those at the extremes of the age range. Educational attainment was found to be animportant factor, with those educated to degree level (or equivalent) having a higher proportion in thehigh reported stress category. Marital status also influenced the reporting of stress, with those whowere widowed/divorced or separated having a greater proportion in the high reported stress category.Ethnicity also influenced reporting of stress, with the non-white group having a greater proportion in thehigh reported stress category. The number of non-whites in the sample was small and it is essential totry to replicate the present findings with a much larger group. The occupational variables were alsofound to have a large impact on reporting of stress. Reported stress was greater in full-timeemployment than part-time employment, increased with salary, and there was a greater proportion inthe high reported stress category in social group II. Reported stress was found to be highest inteachers, nurses and managers. Levels of reported stress increased as a direct function of the numberof critical features present.
This report and the work it describes were funded by the Health and Safety Executive. Its contents,including any opinions and/or conclusions expressed, are those of the author(s) alone and do notnecessarily reflect HSE policy.
This study reports a further analysis of some of the data reported in HSE Contract Research Report 265/2000. You may alsowish to refer to this report, which is available from HSE Books as shown on the back cover.
HSE BOOKS
ii
© Crown copyright 2000Applications for reproduction should be made in writing to:Copyright Unit, Her Majesty’s Stationery Office,St Clements House, 2-16 Colegate, Norwich NR3 1BQ
First published 2000
ISBN 0 7176 1910 9
All rights reserved. No part of this publication may bereproduced, stored in a retrieval system, or transmittedin any form or by any means (electronic, mechanical,photocopying, recording or otherwise) without the priorwritten permission of the copyright owner.

iii
CONTENTS EXECUTIVE SUMMARY v
1. BACKGROUND 1
2. METHODS 2
3. AGE, GENDER, AND MARITAL STATUS 3-4
3.1 Age 3
3.2 Gender 4
3.3 Marital status 4
4. FULL-TIME / PART-TIME EMPLOYMENT, EDUCATION, SOCIO-ECONOMIC STATUS AND SALARY
5-7
4.1 Full-time/part-time employment 5
4.2 Educational level 5
4.3 Socio-economic groups 6
4.4 Salary 6
5. OCCUPATION 8-10
6. ETHNICITY 11-15
6.1 Gender-non-whites only 11
6.2 Age-non-whites only 12
6.3 Education-non-whites only 12
6.4 Salary-non-whites only 13
6.5 Socio-economic groups-non-whites only 14
6.6 Full-time/part-time-non-whites only 14
6.7 Occupation-non-whites only 15
7. COMBINATIONS OF VARIABLES 16-51
7.1 Gender and other variables 16-22
7.2 Marital status and other variables 23-29
7.3 Age and other variables 30-35
7.4 Education and other variables 36-40
7.5 Socio-economic group and other variables 41-45
7.6 Salary and other variables 46-48
7.7 Full-time/part-time x occupation 49-50
7.8 Occupation 51
iv
8. COMBINATIONS OF THE HIGH STRESS SUB-GROUPS 52-55
9. DISCUSSION 56-60
9.1 A summary of the results 56
9.2 Comments on present findings 58
9.3 How do the findings compare with previous research? 59
9.4 Implications for further research and management of occupational stress
60
10. REFERENCES 61

v
EXECUTIVE SUMMARY Results from the Bristol Stress and Health at Work study (described in detail in HSE
Contract Research Report 265/2000) showed that about 20 percent of the sample reported
very high or extremely high levels of stress at work. The present report describes further
analyses of the impact of demographic and occupational variables on reported stress at work.
This analysis is based mainly on statistical significance testing. Consequently, the results do
not establish with any certainty a causal link between any of the demographic and
occupational factors measured and reported stress at work. The results may be suggestive of
such a link but more in-depth research would be necessary to establish its validity.
In the majority of the analyses reported stress levels were similar in males and females. The
exceptions were that there were higher proportions of males than females in the high reported
stress category in those with no secondary school qualifications and the lowest salary group.
In contrast, there were higher proportions of females than males in the high reported stress
category in social class III.2, all the salary groups except the lowest and in the full-time
employment group.
Marital status was related to the reporting of stress with those who were widowed/divorced or
separated generally having a higher proportion in the high reported stress category. This was
statistically significant for females, those in the 50 + age group, those educated to degree
level, the highest salary group and those in full-time employment.
There were generally higher proportions in the high reported stress category in the middle age
groups. This was significant for males, those who were single, those educated to degree level,
social class II, those in full-time employment and those in the most stressful jobs.
There were also generally higher proportions in the high reported stress category in the group
educated to degree level. This was significant in both sexes, those who were married, all but
the youngest age group, the highest salary group, both full and part-time employment and the
second occupational category.

vi
The present sample was not a very good one for examining ethnicity, with there being very
few non-white respondents. The non-white group reported greater stress at work than the
sample as a whole. Slight differences were found as a function of ethnicity in the effects of
the demographic and occupational variables although these should be treated with caution
due to the small numbers in certain cells. Further research on occupational stress in non-white
groups is now essential, especially as the evidence from the current small sample suggests
that non-white groups may report higher levels of stress at work than their white counterparts.
However, on the basis of the present analyses, it is unclear whether it is ethnicity per se that is
important or correlated attributes present in the non-white sample.
The scale of occupational stress was clearly much greater for those in full-time employment
than those with part-time jobs. The proportion in the high stress category also increased with
salary.
Job category showed a strong relationship with reporting of stress at work. When socio-
economic groups based on occupation were examined it was generally found that those in
group II had a higher proportion in the high reported stress category. Analyses of occupations
showed that teachers, nurses and managers had the highest proportion in the high reported
stress category.
Sub-groups with the highest reported stress for each variable were identified. The proportions
in the high reported stress category were then examined as a function of the number of these
factors present. A clear dose response emerged, with reported stress increasing linearly as a
function of the number of factors present. This was confirmed in regression equations where
all the occupational variables remained as significant effects.
In conclusion, the present analyses show that the scale of occupational stress will vary as a
function of demographic and occupational factors. Specifically, greater reported occupational
stress is associated with being middle-aged, widowed/divorced or separated, educated to
degree level, in full-time employment earning over £20,000, and having an occupation such
as teaching, nursing or being a manager (or being in social group II). The magnitude of
reported stress appears to be a direct function of the number of these features that are present,
although it should be noted that stress at work is not an automatic consequence of having
vii
these characteristics. The analyses also showed that non-whites report higher levels of stress
and further research on this topic is clearly desirable.

viii
1
1. BACKGROUND
Recent research (1) has investigated the scale and severity of occupational stress in a random
population sample. This epidemiological survey of 17000 randomly selected people from the
Bristol electoral register revealed that approximately 20% of the working sample (4,000+
workers) reported that they had very high or extremely high levels of stress at work. This
effect was reliable over time, related to potentially stressful working conditions and
associated with impaired physical and mental health. These effects of occupational stress
could not be attributed to life stress or negative affectivity.
Preliminary analyses were conducted to determine whether perceptions of stress at work
varied across gender, age and full-time/part-time work. The results showed little difference
between males and females although this reflected the fact that more females did part-time
work. Full-time work was associated with greater occupational stress and females in full-time
work reported higher stress levels than males. These analyses show the importance of
considering combinations of variables rather than examining each in isolation. When age was
examined, it was found that those at either end of the age range (18-35, 55+) reported less
stress than the 35-55 age group.
It is clearly important to have further information on the distribution of occupational stress by
key demographic variables. Similarly, additional consideration of different types of job is
required. The initial aim of the present research was to conduct further analyses of data
reported in HSE Contract Research Report 265/2000 (which will be referred to as the main
report). These new analyses examined associations between self-reported stress and age,
gender, marital status, ethnicity, full-time/part-time status, occupation and socio-economic
status (by income, occupational class I-V, and educational attainment). Initial cross-
tabulations were produced to indicate the proportion of self-reported work stress in each sub-
category of the variables (with stress being defined as those who reported being very or
extremely stressed at work on a 5 point Likert scale). Following this, pairs of variables were
examined to determine which combinations are associated with highest proportions of work
stress. Finally, combinations of all the variables were examined to determine whether effects
are additive or interact in complex ways.
2
2. METHODS
The approach adopted here combined statistical testing with an overview of consistent
patterns and interpretable trends. The statistical testing was used to support interpretation
based on observation of cross-tabulations of variables. Sophisticated statistical modelling was
not intended and when focusing on the statistical outcomes one should always note the
following points. First, there is considerable variation in the sample sizes in different
analyses. This means that statistical significance will reflect the number of respondents being
considered in any particular analysis. Secondly, given the number of tests conducted certain
effects will occur by chance. Emphasis was, therefore, placed on consistent patterns of effects
and when these are based on small numbers it is recommended that the effects are replicated
in future work.
This analysis is based mainly on statistical significance testing. Consequently, the results do
not establish with any certainty a causal link between any of the demographic and
occupational factors measured and reported stress at work. The results may be suggestive of
such a link but more in-depth research would be necessary to establish its validity.
In most analyses results from chi-square tests are reported. If the data are ordinal (e.g. age
categories), then McNemar’s chi square values were used to determine significance. In the
case of very small cell sizes (expected < 5) results from Fisher’s exact test were used.
The next section applies these methods to examine associations between levels of reported
stress and demographic variables. Where the terms “high stress” or “low stress” are used
these refer to “reported stress at work”.
3
3. AGE, GENDER, AND MARITAL STATUS
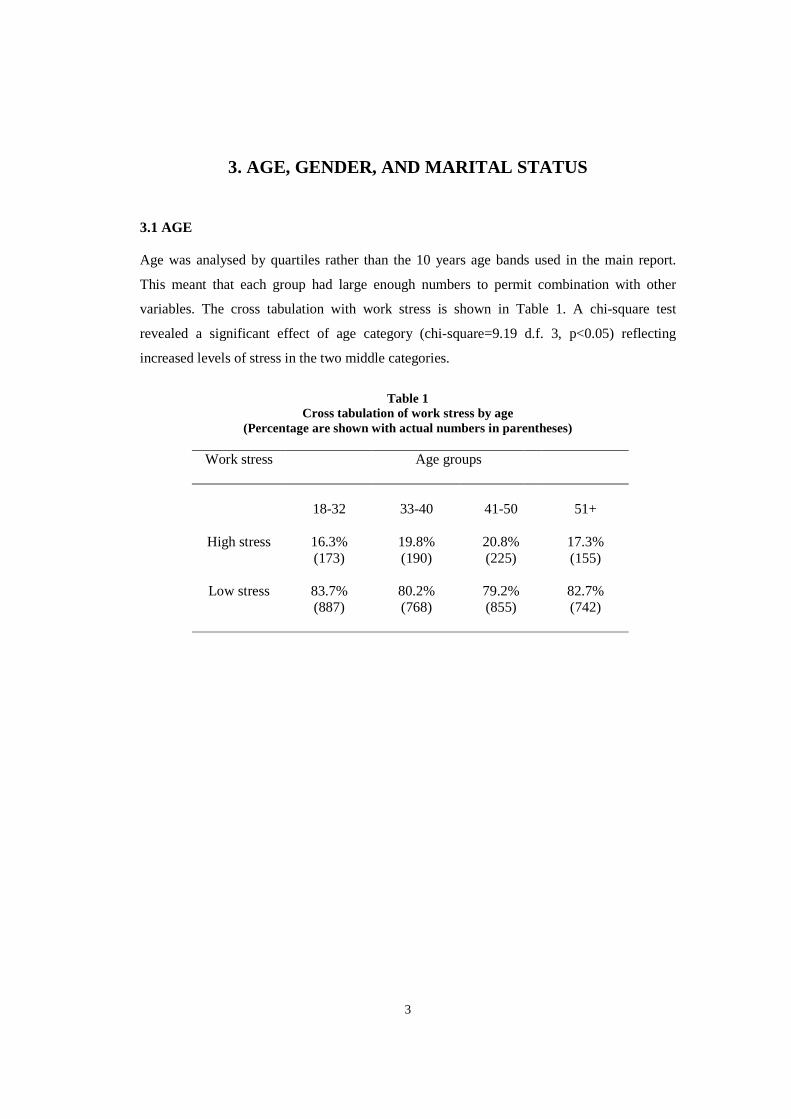
3.1 AGE Age was analysed by quartiles rather than the 10 years age bands used in the main report.
This meant that each group had large enough numbers to permit combination with other
variables. The cross tabulation with work stress is shown in Table 1. A chi-square test
revealed a significant effect of age category (chi-square=9.19 d.f. 3, p<0.05) reflecting
increased levels of stress in the two middle categories.
Table 1
Cross tabulation of work stress by age (Percentage are shown with actual numbers in parentheses)
Work stress
Age groups
High stress
18-32
16.3% (173)
33-40
19.8% (190)
41-50
20.8% (225)
51+
17.3% (155)
Low stress 83.7%
(887) 80.2% (768)
79.2% (855)
82.7% (742)
4
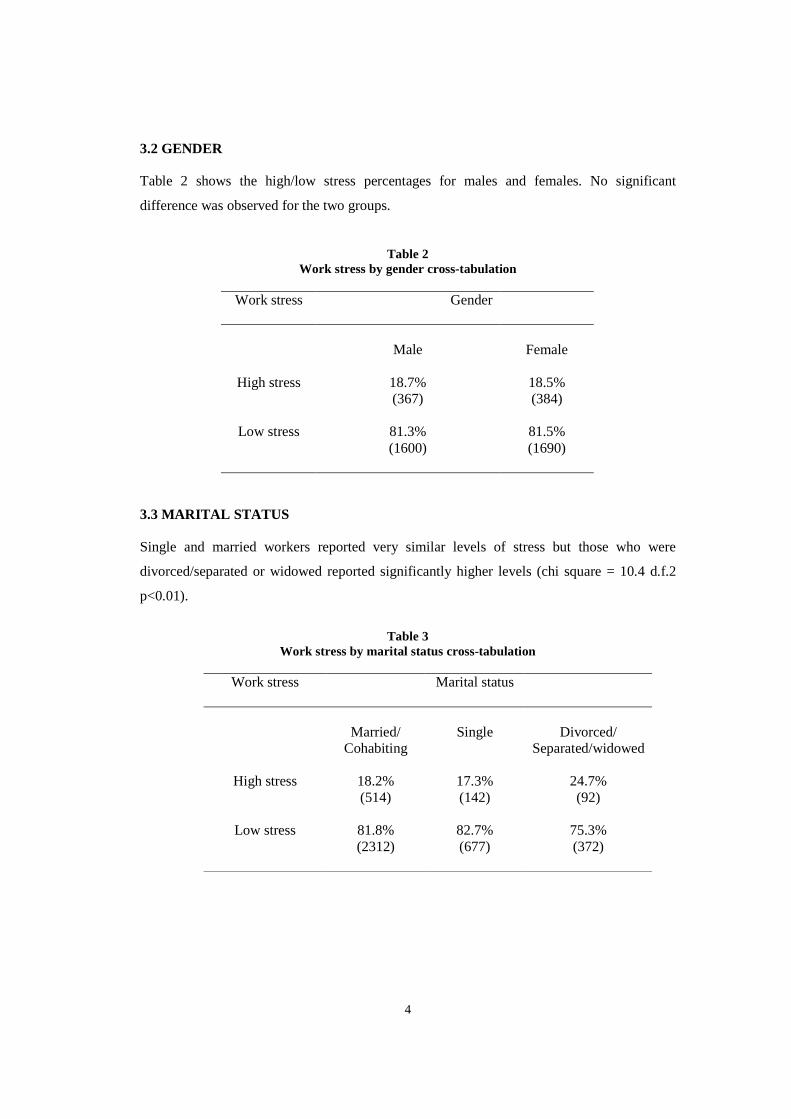
3.2 GENDER Table 2 shows the high/low stress percentages for males and females. No significant
difference was observed for the two groups.
Table 2 Work stress by gender cross-tabulation
Work stress
Gender
High stress
Male
18.7% (367)
Female
18.5% (384)
Low stress 81.3%
(1600) 81.5% (1690)
3.3 MARITAL STATUS Single and married workers reported very similar levels of stress but those who were
divorced/separated or widowed reported significantly higher levels (chi square = 10.4 d.f.2
p<0.01).
Table 3
Work stress by marital status cross-tabulation
Work stress
Marital status
High stress
Married/
Cohabiting
18.2% (514)
Single
17.3% (142)
Divorced/
Separated/widowed
24.7% (92)
Low stress 81.8%
(2312) 82.7% (677)
75.3% (372)
5
4. FULL-TIME / PART-TIME EMPLOYMENT, EDUCATION, SOCIO-ECONOMIC STATUS AND SALARY
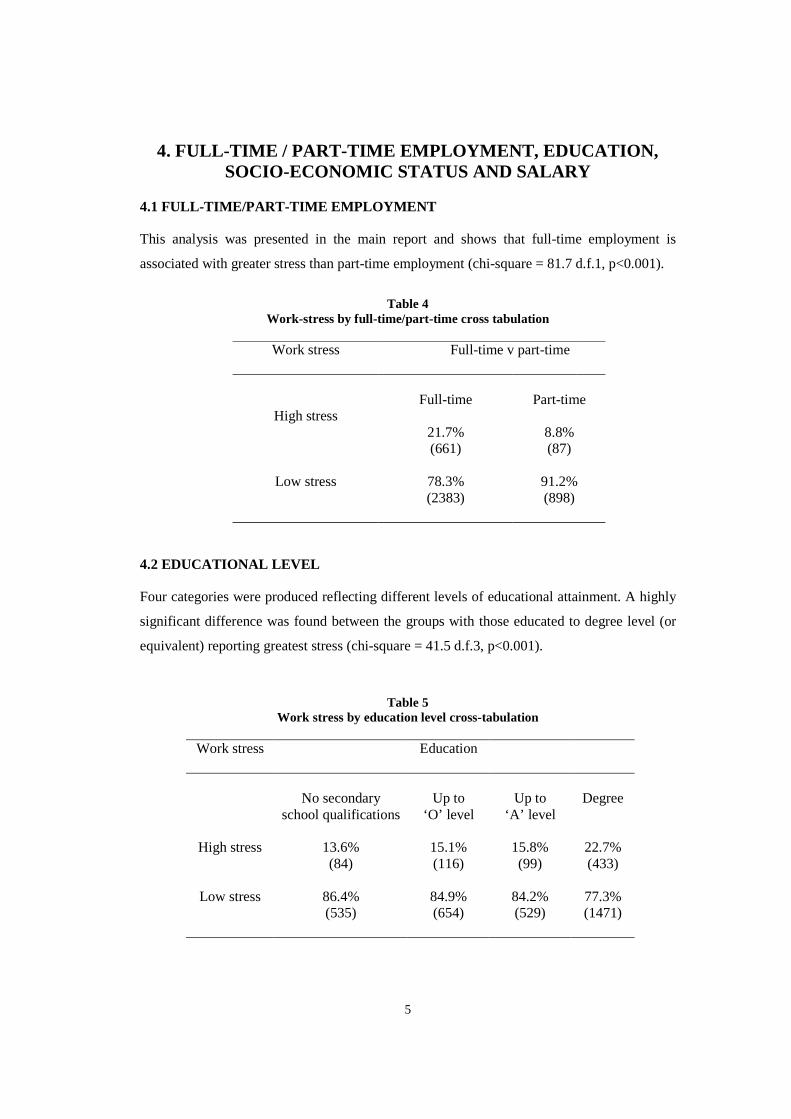
4.1 FULL-TIME/PART-TIME EMPLOYMENT This analysis was presented in the main report and shows that full-time employment is
associated with greater stress than part-time employment (chi-square = 81.7 d.f.1, p<0.001).
Table 4
Work-stress by full-time/part-time cross tabulation
Work stress
Full-time v part-time
High stress
Full-time
21.7% (661)
Part-time
8.8% (87)
Low stress 78.3%
(2383) 91.2% (898)
4.2 EDUCATIONAL LEVEL Four categories were produced reflecting different levels of educational attainment. A highly
significant difference was found between the groups with those educated to degree level (or
equivalent) reporting greatest stress (chi-square = 41.5 d.f.3, p<0.001).
Table 5 Work stress by education level cross-tabulation
Work stress
Education
High stress
No secondary
school qualifications
13.6% (84)
Up to
‘O’ level
15.1% (116)
Up to
‘A’ level
15.8% (99)
Degree
22.7% (433)
Low stress 86.4%
(535) 84.9% (654)
84.2% (529)
77.3% (1471)
6
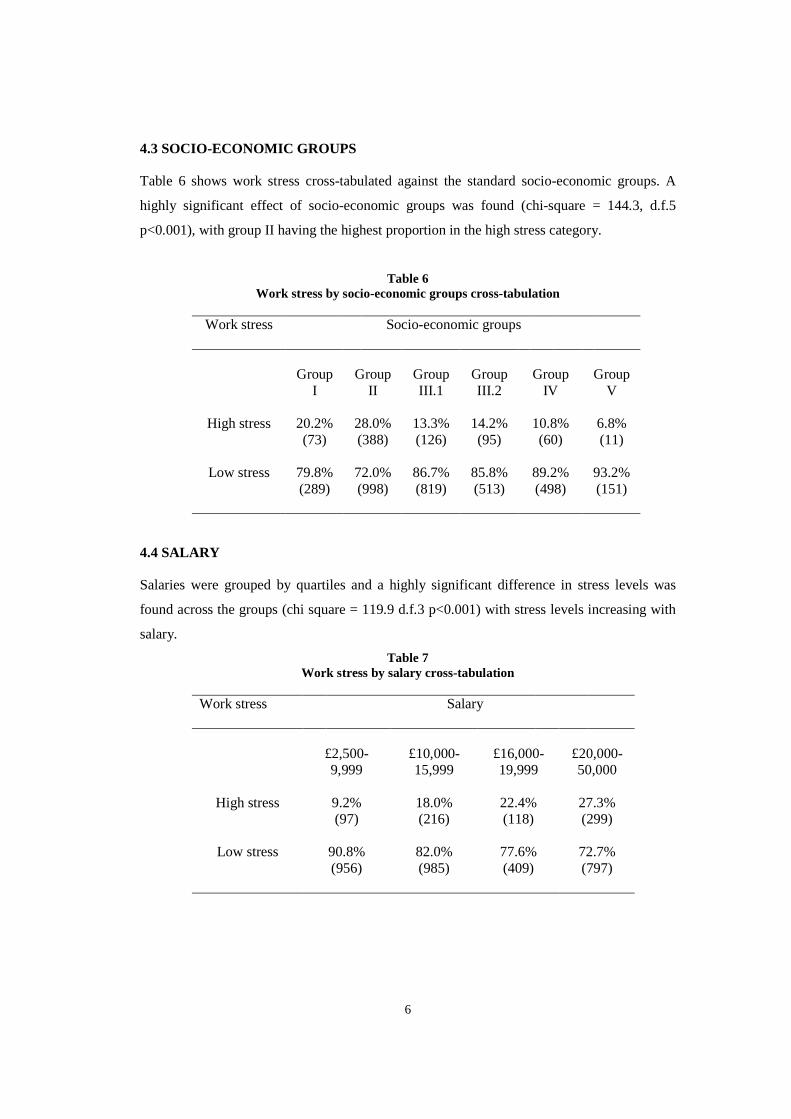
4.3 SOCIO-ECONOMIC GROUPS Table 6 shows work stress cross-tabulated against the standard socio-economic groups. A
highly significant effect of socio-economic groups was found (chi-square = 144.3, d.f.5
p<0.001), with group II having the highest proportion in the high stress category.
Table 6 Work stress by socio-economic groups cross-tabulation
Work stress
Socio-economic groups
High stress
Group
I 20.2% (73)
Group
II
28.0% (388)
Group III.1
13.3% (126)
Group III.2
14.2% (95)
Group
IV
10.8% (60)
Group
V
6.8% (11)
Low stress 79.8%
(289) 72.0% (998)
86.7% (819)
85.8% (513)
89.2% (498)
93.2% (151)
4.4 SALARY Salaries were grouped by quartiles and a highly significant difference in stress levels was
found across the groups (chi square = 119.9 d.f.3 p<0.001) with stress levels increasing with
salary. Table 7
Work stress by salary cross-tabulation
Work stress
Salary
High stress
£2,500-9,999
9.2% (97)
£10,000-15,999
18.0% (216)
£16,000- 19,999
22.4% (118)
£20,000- 50,000
27.3% (299)
Low stress 90.8%
(956) 82.0% (985)
77.6% (409)
72.7% (797)

7
In summary, this section shows that (1) reported stress is greater in full-time jobs than part-
time jobs, (2) reported stress increases with educational attainment and salary, and (3)
reported stress increases up to socio-economic group II and then decreases slightly in group I.
The largest differences are related to full-time/part-time employment, socio-economic groups
and salary. These are all variables which may be related to the specific nature of the job. This
is examined in the next section.
8
5. OCCUPATION
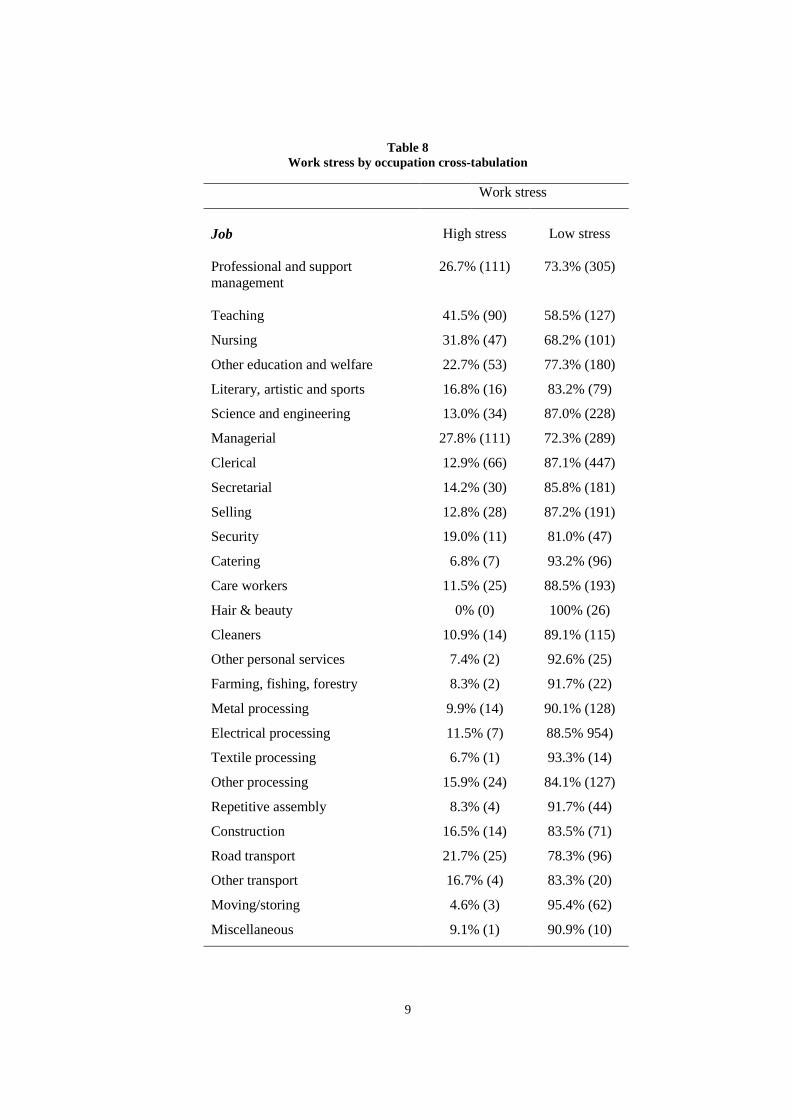
Occupation was initially categorised using the Computer Assisted Standard Occupational
Coding (2). Categories were then combined in the same way as in the SWI report (3). These
occupational groups are cross-tabulated against reported stress in Table 8.
The differences between the groups were highly significant (chi square = 216.2 d.f. 26
p<0.001). Some of the groups had very small numbers and the results must be treated with
caution. However, the profile obtained from the larger groups confirms that teachers, nurses
and managers have the greatest proportions of high stress. In further analyses the above
groups were collapsed to give four categories reflecting levels of reported stress (low stress
occupations to high stress occupations). This new grouping is shown in Table 9.
9
Table 8 Work stress by occupation cross-tabulation
Work stress
Job
High stress
Low stress
Professional and support management
26.7% (111) 73.3% (305)
Teaching 41.5% (90) 58.5% (127)
Nursing 31.8% (47) 68.2% (101)
Other education and welfare 22.7% (53) 77.3% (180)
Literary, artistic and sports 16.8% (16) 83.2% (79)
Science and engineering 13.0% (34) 87.0% (228)
Managerial 27.8% (111) 72.3% (289)
Clerical 12.9% (66) 87.1% (447)
Secretarial 14.2% (30) 85.8% (181)
Selling 12.8% (28) 87.2% (191)
Security 19.0% (11) 81.0% (47)
Catering 6.8% (7) 93.2% (96)
Care workers 11.5% (25) 88.5% (193)
Hair & beauty 0% (0) 100% (26)
Cleaners 10.9% (14) 89.1% (115)
Other personal services 7.4% (2) 92.6% (25)
Farming, fishing, forestry 8.3% (2) 91.7% (22)
Metal processing 9.9% (14) 90.1% (128)
Electrical processing 11.5% (7) 88.5% 954)
Textile processing 6.7% (1) 93.3% (14)
Other processing 15.9% (24) 84.1% (127)
Repetitive assembly 8.3% (4) 91.7% (44)
Construction 16.5% (14) 83.5% (71)
Road transport 21.7% (25) 78.3% (96)
Other transport 16.7% (4) 83.3% (20)
Moving/storing 4.6% (3) 95.4% (62)
Miscellaneous 9.1% (1) 90.9% (10)

10
Table 9 New groupings of occupations
Category 1 (lowest reported stress)
Catering
Hair & beauty
Other personal services
Farming, fishing, forestry
Textile processing
Repetitive assembly
Moving/storing
Category 2
Clerical
Care workers
Cleaners
Metal processing
Electrical processing
Miscellaneous
Selling
Category 3
Literary, artistic, sports
Science & engineering
Secretarial
Other processing
Construction
Other transport
Category 4 (highest reported stress)
Professional, support. Management
Teaching
Nursing
Other education & welfare
Managerial
Security
Road transport
11
6. ETHNICITY
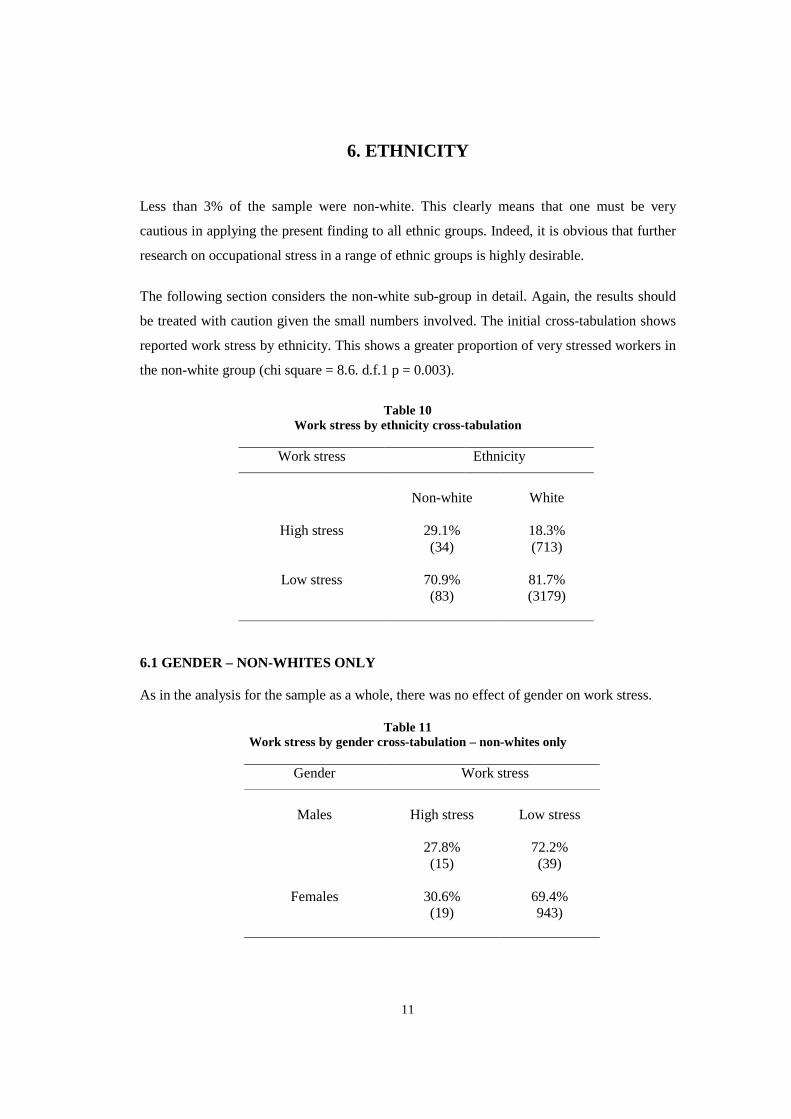
Less than 3% of the sample were non-white. This clearly means that one must be very
cautious in applying the present finding to all ethnic groups. Indeed, it is obvious that further
research on occupational stress in a range of ethnic groups is highly desirable.
The following section considers the non-white sub-group in detail. Again, the results should
be treated with caution given the small numbers involved. The initial cross-tabulation shows
reported work stress by ethnicity. This shows a greater proportion of very stressed workers in
the non-white group (chi square = 8.6. d.f.1 p = 0.003).
Table 10
Work stress by ethnicity cross-tabulation
Work stress Ethnicity
High stress
Non-white
29.1% (34)
White
18.3% (713)
Low stress 70.9%
(83) 81.7% (3179)
6.1 GENDER – NON-WHITES ONLY As in the analysis for the sample as a whole, there was no effect of gender on work stress.
Table 11 Work stress by gender cross-tabulation – non-whites only
Gender Work stress
Males
High stress
27.8% (15)
Low stress
72.2% (39)
Females 30.6%
(19) 69.4% 943)

12
6.2 AGE – NON-WHITES ONLY In this sample, stress increased with age although the differences were not significant.
Table 12
Work stress by age cross-tabulation – non-whites only
Age Work stress
18-32
High stress
20.6%
(7)
Low stress
79.4% (27)
33-40 25.6%
(11) 74.4% (32)
41-50 42.9%
(69) 57.1% (12)
51+ 43.8%
(7) 56.3%
(9)
6.3 EDUCATION – NON-WHITES ONLY Again, reported stress was greatest in those educated to degree level. However, the
differences between groups were not significant.
Table 13
Work stress by education cross-tabulation– non-whites only
Education Work stress
No secondary school qualifications
High stress
14.3%
(1)
Low stress
85.7%
(6)
Up to ‘O’ levels 28.6% (6)
71.4% (15)
Up to ‘A’ level 12.5%
(2) 87.5% (14)
Degree 33.3%
(24) 66.7% (48)

13
6.4 SALARY - NON-WHITES ONLY The results showed a different profile from the sample as a whole, with reported stress being
greatest in the £16,000 – 19,999 group. However, these differences were not statistically
significant.
Table 14
Work stress by salary cross-tabulation – non-whites only
Salary Work stress
£2,500-9,999
High stress
25.9%
(7)
Low stress
74.1% (20)
£10,000-15,999 18.2%
(6) 81.8% (27)
£16,000-19,999 47.6%
(10) 52.4% (110
£20,000-50,000+ 31.4%
(11) 68.6% (24)

14
6.5 SOCIO-ECONOMIC GROUPS - NON-WHITES ONLY Again, reported stress was significantly greater in group II (p=0.002).
Table 15
Work stress by socio-economic groups cross-tabulation – non-whites only
Socio-economic Groups
Work stress
I
High stress
25.0%
(1)
Low stress
75.0%
(3)
II 45.8% (27)
54.2% (32)
III.1 11.5%
(3) 88.5% (23)
III.2 8.3%
(1) 91.7% (11)
IV 12.5%
(2) 87.5% (14)
6.6 FULL-TIME/PART-TIME - NON-WHITES ONLY In this analysis, part-time work was associated with as high a level of reported stress as full-time work.
Table 16 Work stress by full-time/part-time cross-tabulation – non-whites only
Full-time/part-time
employment Work stress
Full-time
High stress
29.2% (26)
Low stress
70.8% (63)
Part-time 29.6%
(8) 70.4% (19)
15
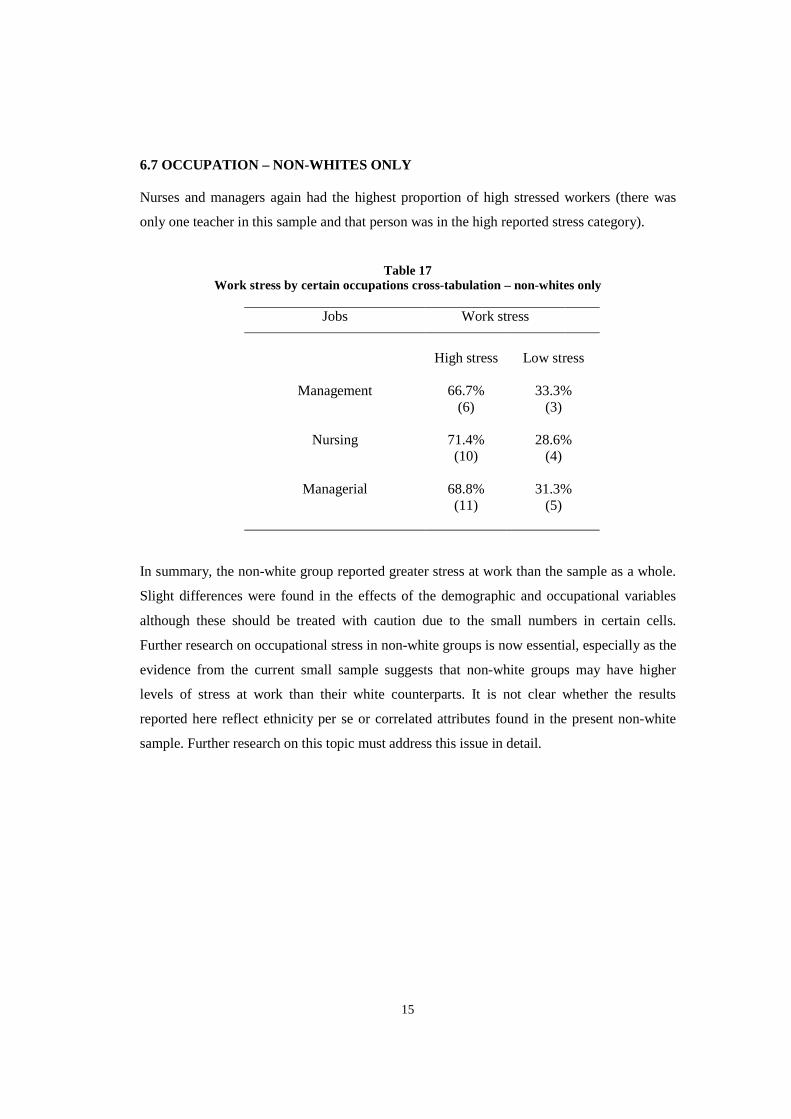
6.7 OCCUPATION – NON-WHITES ONLY Nurses and managers again had the highest proportion of high stressed workers (there was
only one teacher in this sample and that person was in the high reported stress category).
Table 17 Work stress by certain occupations cross-tabulation – non-whites only
Jobs Work stress
Management
High stress
66.7%
(6)
Low stress
33.3%
(3)
Nursing 71.4% (10)
28.6% (4)
Managerial 68.8%
(11) 31.3%
(5)
In summary, the non-white group reported greater stress at work than the sample as a whole.
Slight differences were found in the effects of the demographic and occupational variables
although these should be treated with caution due to the small numbers in certain cells.
Further research on occupational stress in non-white groups is now essential, especially as the
evidence from the current small sample suggests that non-white groups may have higher
levels of stress at work than their white counterparts. It is not clear whether the results
reported here reflect ethnicity per se or correlated attributes found in the present non-white
sample. Further research on this topic must address this issue in detail.

16
7. COMBINATIONS OF VARIABLES
7.1 GENDER AND OTHER VARIABLES Separate analyses were carried out to determine whether there were significant differences
between males and females in the various sub-groups of the other factors.
7.1.1 Marital status There was no significant effect of gender in any of the marital status groups
Table 18 Work stress by gender by marital status cross tabulation
Marital status Work stress Gender
Married / cohabiting
Low stress
Male
1139
80.8%
Female
1172
82.8%
High stress 270 19.2%
244 17.2%
Single Low stress 344 83.5%
333 81.8%
High stress 68 16.5%
74 18.2%
Widowed / divorced / separated
Low stress 105 79.5%
174 72.8%
High stress 27 20.5%
65 27.2%
17
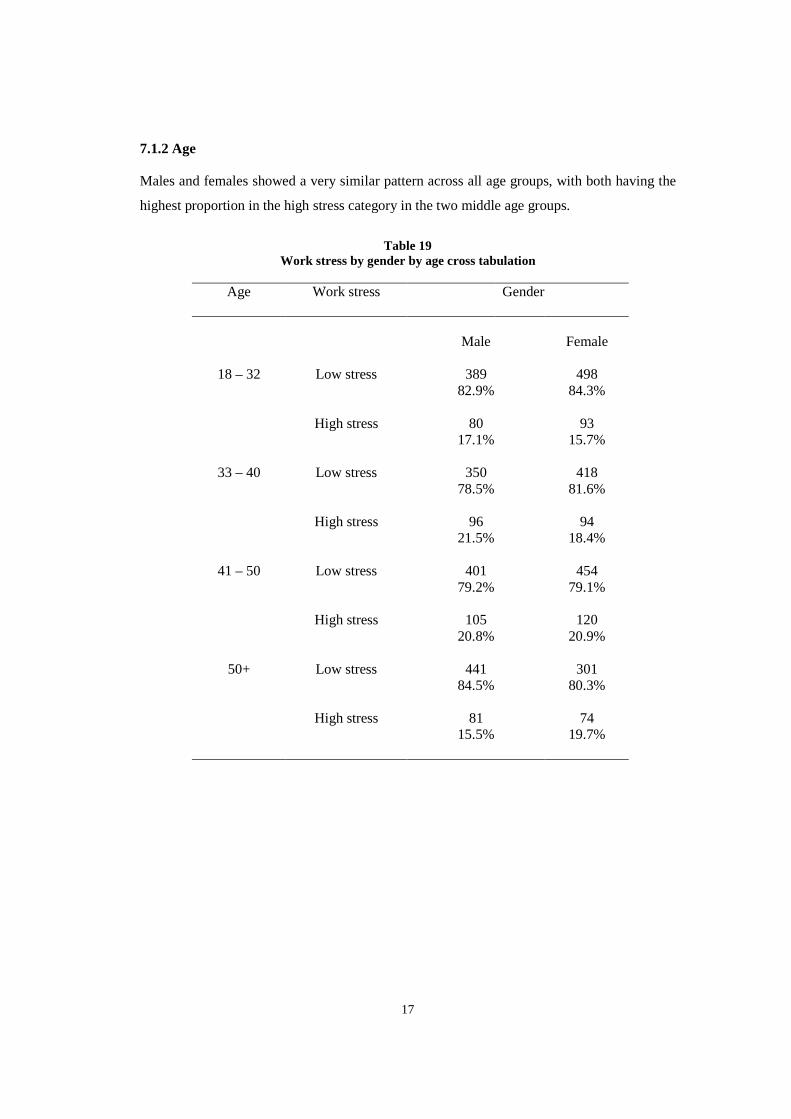
7.1.2 Age Males and females showed a very similar pattern across all age groups, with both having the
highest proportion in the high stress category in the two middle age groups.
Table 19
Work stress by gender by age cross tabulation
Age
Work stress
Gender
18 – 32
Low stress
Male
389
82.9%
Female
498
84.3%
High stress 80 17.1%
93 15.7%
33 – 40 Low stress 350 78.5%
418 81.6%
High stress 96 21.5%
94 18.4%
41 – 50 Low stress 401 79.2%
454 79.1%
High stress 105 20.8%
120 20.9%
50+ Low stress 441 84.5%
301 80.3%
High stress 81 15.5%
74 19.7%

18
7.1.3 Education There were significantly more males than females in the high stress category for workers with
no secondary school academic qualifications (chi square = 5.26 d.f.1 p<0.05). In the other
educational groups there were no significant differences between males and females.
Table 20
Work stress by gender by education level cross tabulation
Education level
Work stress
Gender
No academic qualification
Low stress
Male
272
83.4%
Female
263
89.8%
High stress 54 16.6%
30 10.2%
Up to ‘O’ level Low stress 271 82.6%
383 86.7%
High stress 57 17.4%
59 13.3%
Up to ‘A’ level Low stress 339 84.5%
190 83.7%
High stress 62 15.5%
37 16.3%
Degree Low stress 669 78.4%
800 76.3%
High stress 184 21.6%
249 23.7%

19
7.1.4 Socio-economic group There were higher proportions of females than males in the high stress category for group I
(chi square = 7.2 d.f.1 p<0.01) and this pattern was reversed for group III.2 (chi square = 4.8
d.f.1 p<0.01).
Table 21 Work stress by gender by socio-economic status cross tabulation
Socio-economic status Work stress Gender
I
Low stress
Male
195
84.1%
Female
94
72.3%
High stress 37 15.9%
36 27.7%
II Low stress 470 72.6%
527 71.4%
High stress 177 27.4%
211 28.6%
III.1 Low stress 213 85.5%
605 87.1%
High stress 36 14.5%
90 12.9%
III.2 Low stress 421 84.4%
91 92.9%
High stress 78 15.6%
7 7.1%
IV Low stress 223 87.8%
275 90.5%
High stress 31 12.2%
29 9.5%
V Low stress 66 93.0%
85 93.4%
High stress 5 7.0%
6 6.6%
20
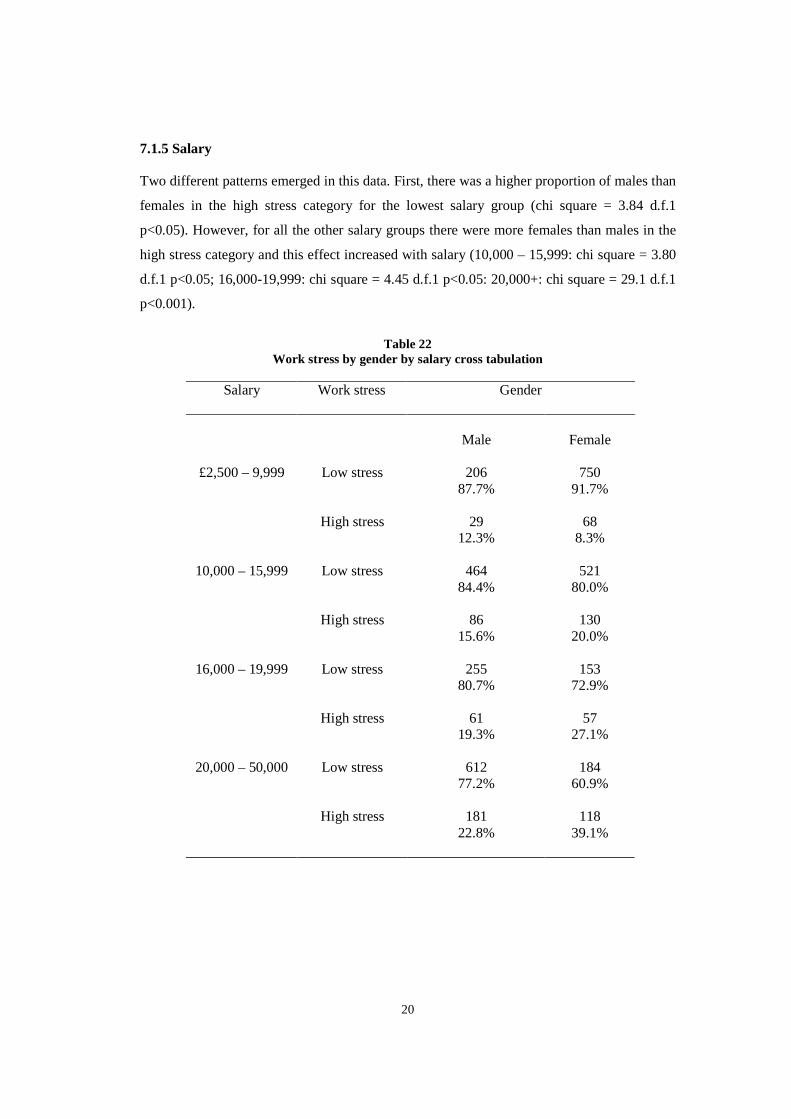
7.1.5 Salary Two different patterns emerged in this data. First, there was a higher proportion of males than
females in the high stress category for the lowest salary group (chi square = 3.84 d.f.1
p<0.05). However, for all the other salary groups there were more females than males in the
high stress category and this effect increased with salary (10,000 – 15,999: chi square = 3.80
d.f.1 p<0.05; 16,000-19,999: chi square = 4.45 d.f.1 p<0.05: 20,000+: chi square = 29.1 d.f.1
p<0.001).
Table 22
Work stress by gender by salary cross tabulation
Salary Work stress Gender
£2,500 – 9,999
Low stress
Male
206
87.7%
Female
750
91.7%
High stress 29 12.3%
68 8.3%
10,000 – 15,999 Low stress 464 84.4%
521 80.0%
High stress 86 15.6%
130 20.0%
16,000 – 19,999 Low stress 255 80.7%
153 72.9%
High stress 61 19.3%
57 27.1%
20,000 – 50,000 Low stress 612 77.2%
184 60.9%
High stress 181 22.8%
118 39.1%

21
7.1.6 Full time / part time There were more females in the high stress category for both full and part-time employment
but only the full-time employment effect was significant (chi square = 11.7 d.f.1 p=0.001).
Table 23 Work stress by gender by full time / part time employment cross tabulation
Full-time/
part-time employment
Work stress Gender
Full time
Low stress
Male
1461
80.4%
Female
919
75.1%
High stress 357 19.6%
304 29.4%
Part time Low stress 134 94.4%
764 90.6%
High stress 8 5.6%
79 9.4%

22
7.1.7 Occupation There were no significant differences between males and females for any of the job
categories.
Table 24 Work stress by gender by occupation cross tabulation
Occupation
Work stress
Gender
1 (Low stress)
Low stress
Male
107
93.0%
Female
139
92.1%
High stress 8 7.0%
12 7.9%
2 Low stress 472 87.7%
717 88.7%
High stress 66 12.3%
91 11.3%
3 Low stress 493 82.9%
283 87.3%
High stress 102 17.1%
41 12.7%
4 (High stress)
Low stress 509 73.0%
539 69.6%
High stress 188 27.0%
235 30.4%
7.1.8 Summary In summary, there were higher proportions of males than females in the high stress category
in those with no secondary school qualifications and the lowest salary group. In contrast,
there were higher proportions of females than males in the high stress category in social class
III.2, all the salary groups except the lowest and in the full-time employment group.
23
7.2 MARITAL STATUS AND OTHER VARIABLES Separate analyses were carried out to determine whether there were significant effects of
marital status in the various sub-groups of the other factors.
7.2.1 Gender These data have already been presented in table 18. Marital status had no significant effect in
the males but did for the females (chi square = 13.48 d.f. 2 p=0.001), with the highest
proportion in the high stress category being in those who were widowed/divorced or
separated.

24
7.2.2 Age Marital status had a significant effect in the two oldest categories. In the 41-50 year olds there
was a higher proportion in the high stress category for those who were single (chi square =
6.70 d.f. 2 p<0.05) whereas in those who were 50+ years old the highest proportion was in
the widowed/divorced/separated group (chi square = 7.46 d.f. 2 p<0.05).
Table 25
Work stress by marital status by age cross tabulation
Age Work stress Marital status
18 – 32
Low stress
Married/
Cohabiting
420 81.4%
Single
432 86.1%
Widowed/
Divorced/separated
27 79.4%
High stress 96
18.6% 70
13.9% 7
20.6%
33 – 40 Low stress 596 81.2%
121 78.1%
50 74.6%
High stress 138
18.8% 34
21.9% 17
25.4%
41 – 50 Low stress 676 80.7%
71 71.0%
101 74.8%
High stress 162
19.3% 29
29.0% 34
25.2%
50+ Low stress 595 84.2%
42 84.0%
99 74.4%
High stress 112
15.8% 8
16.0% 34
25.6%

25
7.2.3 Education Marital status only had a significant effect in the group educated to degree level. In this
group those who were widowed/divorced or separated had the highest proportion in the high
stress category (chi square = 10.13 d.f. 2 p<0.05).
Table 26
Work stress by marital status by education level cross tabulation
Education level
Work stress Marital Status
No academic qualification
Low stress
Married/
cohabiting
436 87.0%
Single
40 88.9%
Widowed/
divorced/separated
56 80.0%
High stress 65
13.0% 5
11.1% 14
20.0%
Up to ‘O’ level
Low stress 489 86.2%
106 82.2%
55 79.7%
High stress 78
13.8% 23
17.8% 14
20.3%
Up to ‘A’ level
Low stress 344 84.1%
145 85.8%
34 77.3%
High stress 65
15.9% 24
14.2% 10
22.7%
Degree Low stress 970 76.9%
378 80.9%
116 69.0%
High stress 292
23.1% 89
19.1% 52
31.0%

26
7.2.4 Salary Marital status only had a significant effect in the group earning £20,000+ (chi square = 10.30
d.f. 2 p<0.01) with those who were widowed/divorced or separated having the highest
proportion in the high stress category.
Table 27
Work stress by marital status by salary cross tabulation
Salary Work stress Marital status
£2,500 – 9,999
Low stress
Married/
Cohabiting
651 91.4%
Single
216 90.8%
Widowed/
divorced/separated
78 84.8%
High stress 61
8.6% 22
9.2% 14
15.2%
10,000 – 15,999 Low stress 645 81.1%
230 85.5%
105 79.5%
High stress 150
18.9% 39
14.5% 27
20.5%
16,000 – 19,000 Low stress 287 77.8%
93 79.5%
27 69.2%
High stress 82
22.2% 24
20.5% 12
30.8%
20,000 – 50,000 Low stress 625 75.0%
112 67.5%
58 61.7%
High stress 208
25.0% 54
32.5% 36
38.3%

27
7.7.5 Socio-economic group Marital status did not have a significant effect in any of the socio-economic groups (which
probably reflects the small numbers in each group).
Table 28 Work stress by marital status by socio-economic status cross tabulation
Socio-economic
status Work stress Marital status
I
Low stress
Married/
Cohabiting
204 77.9%
Single
64 87.7%
Widowed/
divorced/separated
20 76.9%
High stress 58
22.1% 9
12.3% 6
23.1%
II Low stress 702 72.7%
206 73.3%
88 64.7%
High stress 263
27.3% 75
26.7% 48
35.3%
III.1 Low stress 552 87.6%
181 85.8%
80 81.6%
High stress 78
12.4% 30
14.2% 18
18.4%
III.2 Low stress 383 84.9%
89 89.0%
33 84.6%
High stress 68
15.1% 11
11.0% 6
15.4%
IV Low stress 345 91.0%
104 86.7%
44 81.5%
High stress 34
9.0% 16
13.3% 10
18.5%
V Low stress 110 94.0%
24 96.0%
15 88.2%
High stress 7
6.0% 1
4.0% 2
11.8%
28
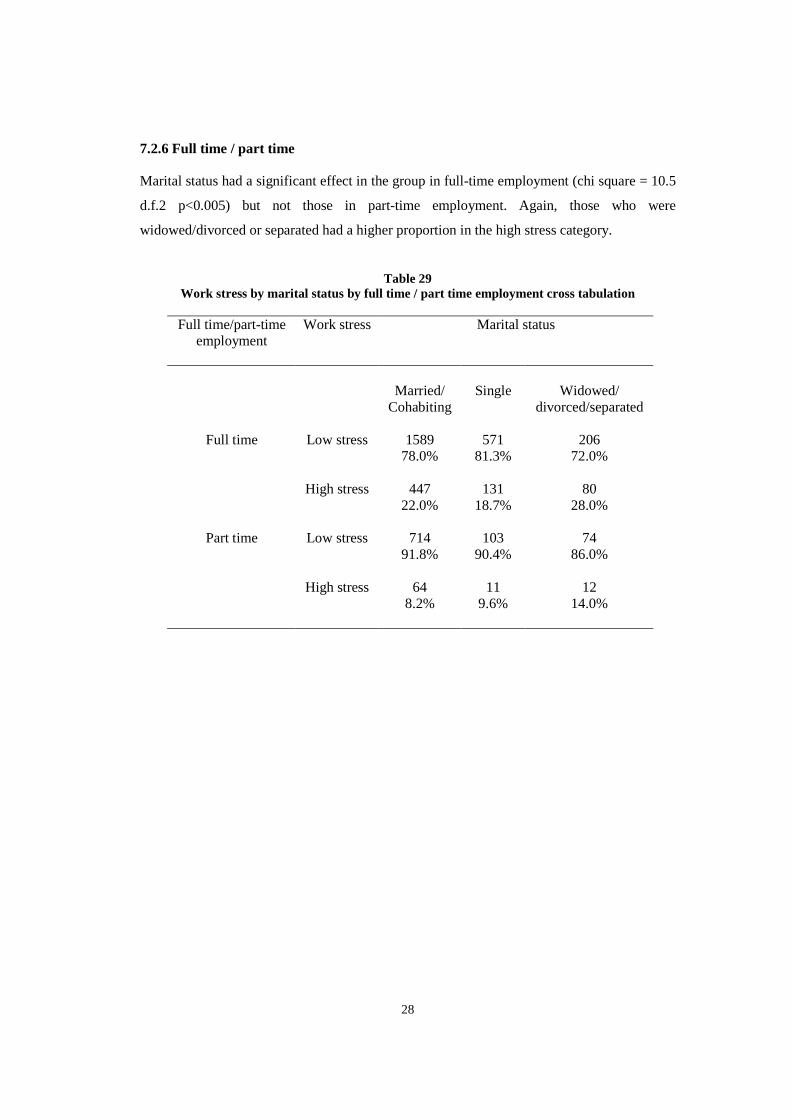
7.2.6 Full time / part time Marital status had a significant effect in the group in full-time employment (chi square = 10.5
d.f.2 p<0.005) but not those in part-time employment. Again, those who were
widowed/divorced or separated had a higher proportion in the high stress category.
Table 29 Work stress by marital status by full time / part time employment cross tabulation
Full time/part-time
employment
Work stress Marital status
Full time
Low stress
Married/
Cohabiting
1589 78.0%
Single
571 81.3%
Widowed/
divorced/separated
206 72.0%
High stress 447 22.0%
131 18.7%
80 28.0%
Part time Low stress 714 91.8%
103 90.4%
74 86.0%
High stress 64 8.2%
11 9.6%
12 14.0%

29
7.2.7 Occupation Marital status had no significant effect in any of the job categories.
Table 30
Work stress by marital status by occupation cross tabulation
Occupation Work stress Marital status
1 (low reported
stress)
Low stress
Married/
Cohabiting
159 90.9%
Single
62 95.4%
Widowed/
divorced/separated
21 95.5%
High stress 16
9.1% 3
4.6% 1
4.5%
2 Low stress 825 89.4%
245 87.2%
108 83.1%
High stress 98
10.6% 36
12.8% 22
16.9%
3 Low stress 559 85.2%
154 83.2%
59 79.7%
High stress 97
14.8% 31
16.8% 15
20.3%
4 (High reported
stress)
Low stress
748 71.6%
207 74.2%
91 63.6%
High stress 297
28.4% 72
25.8% 52
36.4%
7.2.8 Summary In summary, those who were widowed/divorced or separated generally had a higher
proportion in the high stress category. This effect was significant for females, those in the 50
+ age group, those educated to degree level, the highest salary group and those in full-time
employment.

30
7.3 AGE AND OTHER VARIABLES Separate analyses were carried out to examine whether there were significant effects of age in
all the sub-groups of the other factors.
7.3.1 Gender These data have already been presented in table 19. There was a significant effect of age in
the males but not females (chi square = 8.07, d.f.3 p<0.05) with the highest proportion in the
high stress category being in the middle aged workers.
7.3.2 Marital status These data have already been presented in Table 25. Age had a significant effect in the single
workers (chi square = 15.77 p<0.005) with the highest proportion in the high stress category
occurring in the 41-50 year olds.

31
7.3.3 Education Age only had a significant effect in those educated to degree level, with the middle aged
groups having a higher proportion in the high stress category (chi square = 15.58 d.f. 3
p<0.005). This is shown in Table 31.
Table 31 Work stress by age by education level cross tabulation
Education level Work stress Age
No academic qualification
Low stress
18-32
21
91.3%
33-40
68
88.3%
41-50
188
85.5%
51+
253
86.1%
High stress 2 8.7%
9 11.7%
32 14.5%
41 13.9%
Up to
‘O’ level Low stress 187
86.2% 198
85.0% 133
82.6% 127
84.7%
High stress 30 13.8%
35 15.0%
28 17.4%
23 15.3%
Up to
‘A’ level Low stress 190
83.3% 119
86.9% 134
82.2% 82
86.3%
High stress 38 16.7%
18 13.1%
29 17.8%
13 13.7%
Degree Low stress 481
82.8% 370
74.4% 365
73.9% 237
76.9%
High stress 100 17.2%
127 25.6%
129 26.1%
71 23.1%

32
7.3.4 Socio-economic group Age only had a significant effect in class II, with there being a higher proportion in the high
stress category in the middle age groups (chi square = 12.2 d.f. 3 p<0.01).
Table 32 Work stress by age by socio-economic status cross tabulation
Socio-economic
status Work stress Age
I
Low stress
18-32
77
83.7%
33-40
68
80.0%
41-50
78
78.0%
51+
60
77.9%
High stress 15 16.3%
17 20.0%
22 22.0%
17 22.1%
II Low stress 254
77.2% 257
67.8% 278
68.8% 200
76.3%
High stress 75 22.8%
122 32.2%
126 31.2%
62 23.7%
III.1 Low stress 270
86.3% 183
91.0% 183
83.2% 172
86.4%
High stress 43 13.7%
18 9.0%
37 16.8%
27 13.6%
III.2 Low stress 124
87.9% 108
84.4% 141
85.5% 133
85.3%
High stress 17 12.1%
20 18.2%
24 14.5%
23 14.7%
IV Low stress 124
87.3% 122
92.4% 131
91.6% 117
86.0%
High stress 18 12.7%
10 7.6%
12 8.4%
19 14.0%
V Low stress 30
88.2% 26
100.0% 35
92.1% 56
93.3%
High stress 4 11.8%
0 0.0%
3 7.9%
4 6.7%
33
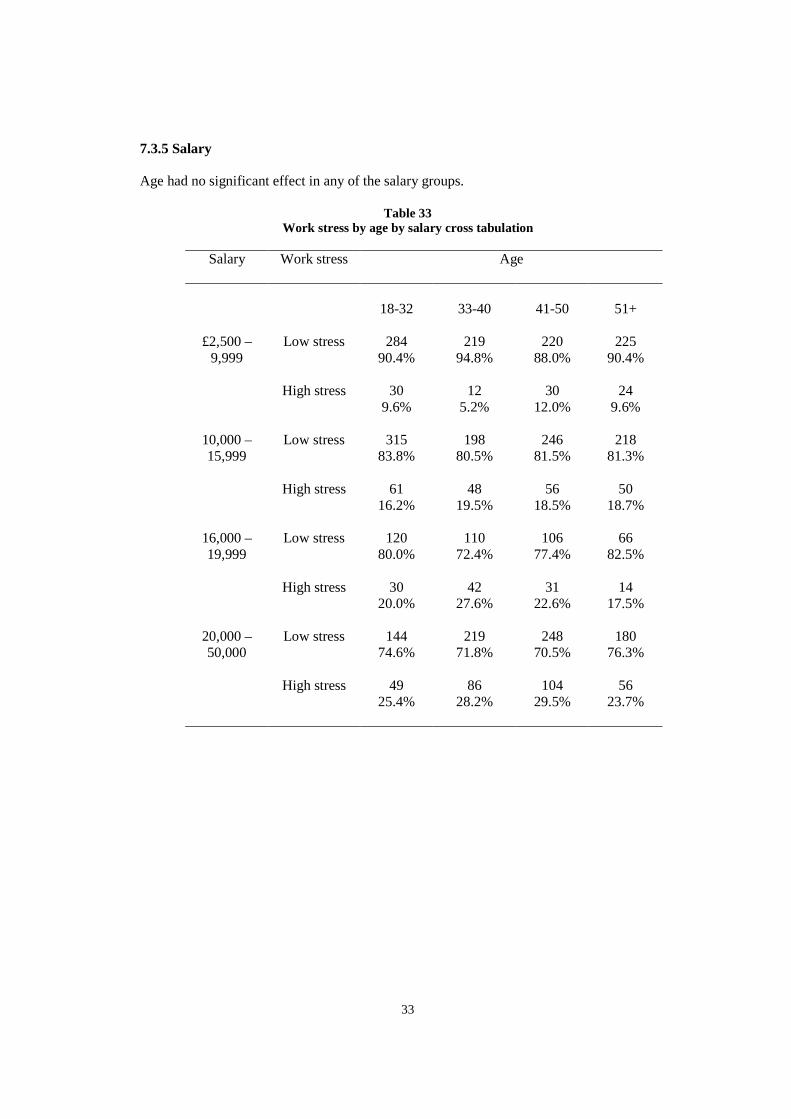
7.3.5 Salary Age had no significant effect in any of the salary groups.
Table 33 Work stress by age by salary cross tabulation
Salary Work stress Age
£2,500 – 9,999
Low stress
18-32
284
90.4%
33-40
219
94.8%
41-50
220
88.0%
51+
225
90.4%
High stress 30 9.6%
12 5.2%
30 12.0%
24 9.6%
10,000 – 15,999
Low stress 315 83.8%
198 80.5%
246 81.5%
218 81.3%
High stress 61
16.2% 48
19.5% 56
18.5% 50
18.7%
16,000 – 19,999
Low stress 120 80.0%
110 72.4%
106 77.4%
66 82.5%
High stress 30
20.0% 42
27.6% 31
22.6% 14
17.5%
20,000 – 50,000
Low stress 144 74.6%
219 71.8%
248 70.5%
180 76.3%
High stress 49
25.4% 86
28.2% 104
29.5% 56
23.7%
34
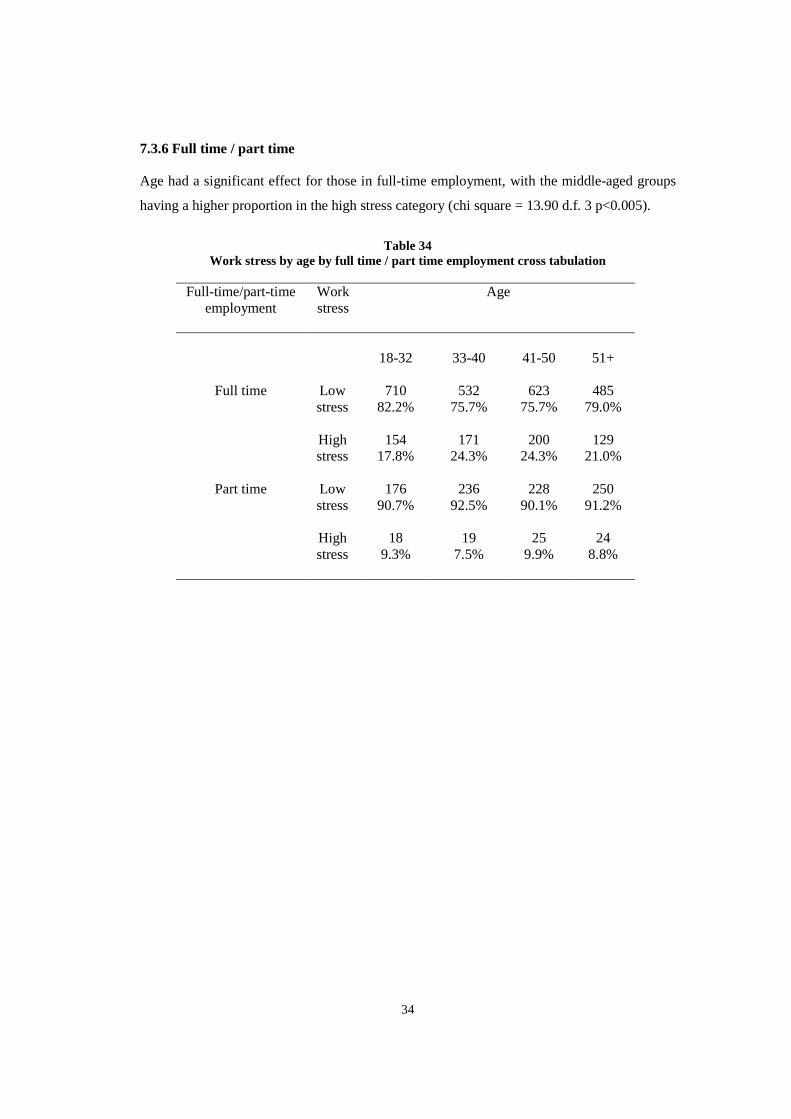
7.3.6 Full time / part time Age had a significant effect for those in full-time employment, with the middle-aged groups
having a higher proportion in the high stress category (chi square = 13.90 d.f. 3 p<0.005).
Table 34
Work stress by age by full time / part time employment cross tabulation
Full-time/part-time employment
Work stress
Age
Full time
Low stress
18-32
710
82.2%
33-40
532
75.7%
41-50
623
75.7%
51+
485
79.0%
High stress
154 17.8%
171 24.3%
200 24.3%
129 21.0%
Part time Low
stress 176
90.7% 236
92.5% 228
90.1% 250
91.2%
High stress
18 9.3%
19 7.5%
25 9.9%
24 8.8%
35
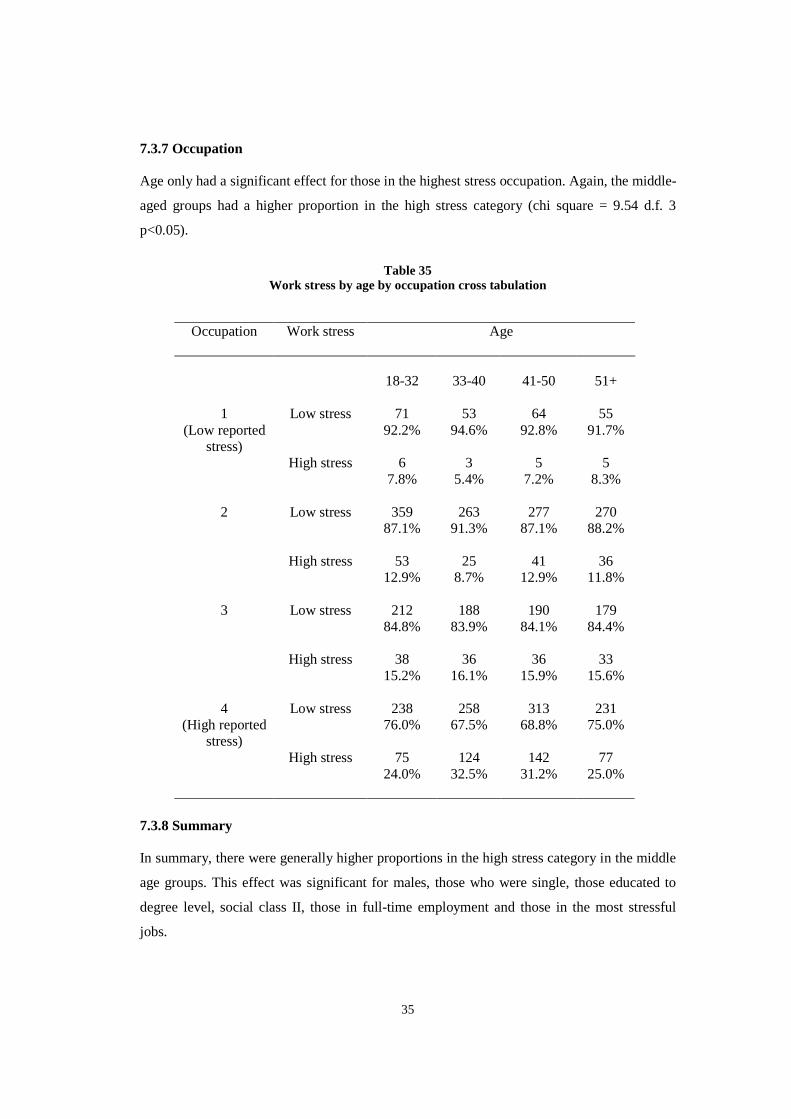
7.3.7 Occupation Age only had a significant effect for those in the highest stress occupation. Again, the middle-
aged groups had a higher proportion in the high stress category (chi square = 9.54 d.f. 3
p<0.05).
Table 35
Work stress by age by occupation cross tabulation
Occupation Work stress Age
18-32
33-40
41-50
51+
1 (Low reported
stress)
Low stress 71 92.2%
53 94.6%
64 92.8%
55 91.7%
High stress 6 7.8%
3 5.4%
5 7.2%
5 8.3%
2 Low stress 359
87.1% 263
91.3% 277
87.1% 270
88.2%
High stress 53 12.9%
25 8.7%
41 12.9%
36 11.8%
3 Low stress 212
84.8% 188
83.9% 190
84.1% 179
84.4%
High stress 38 15.2%
36 16.1%
36 15.9%
33 15.6%
4
(High reported stress)
Low stress 238 76.0%
258 67.5%
313 68.8%
231 75.0%
High stress 75
24.0% 124
32.5% 142
31.2% 77
25.0%
7.3.8 Summary In summary, there were generally higher proportions in the high stress category in the middle
age groups. This effect was significant for males, those who were single, those educated to
degree level, social class II, those in full-time employment and those in the most stressful
jobs.
36
7.4 EDUCATION
Separate analyses were carried out to assess the effect of educational attainment in all the
sub-groups of the other variables.
7.4.1 Gender These data have already been shown in Table 20. Educational level had a significant effect
for both males (chi square = 8.74 d.f. 3 p<0.05) and females (chi square = 40.57 d.f.3
p<0.001). In both sexes the highest proportion in the high stress category was found in those
educated to degree level.
7.4.2 Marital status These data have already been shown in Table 26.There was only a significant effect of
educational level in those who were married (chi square = 38.75 d.f. 3 p<0.001). In this group
the percentages in the high stress category increased with educational attainment.
7.4.3 Age These data have already been shown in Table 31. Educational level had a significant effect in
all age groups except for the 18-32 year olds. In all of the other age groups the highest
proportion in the high stress category was found in those educated to degree level (33-40 year
group: chi square = 20.5 d.f.3 p<0.001; 41-50 year group: chi square = 15.59 d.f. 3 =0.001;
51 years +: chi square = 10.61 d.f. 3 p<0.05).

37
7.4.4 Socio-economic groups There were no significant effects of education in any of the socio-economic groups
Table 36 Work stress by education level by socio-economic status cross tabulation
Socio-
economic status
Work stress Educational level
I
Low stress
No academic qualifications
1
50.0%
Up to
‘O’ level
17 81.0%
Up to ‘A’
level
21 80.8%
Degree
250 79.9%
High stress 1 50.0%
4 19.0%
5 19.2%
63 20.1%
II Low stress 60 78.9%
125 71.4%
138 77.5%
662 70.4%
High stress 16 21.1%
50 28.6%
40 22.5%
278 29.6%
III.1 Low stress 128 90.1%
264 87.7%
106 82.2%
303 86.6%
High stress 14 9.9%
37 12.3%
23 17.8%
47 13.4%
III.2 Low stress 134 83.8%
99 86.8%
158 90.8%
99 82.5%
High stress 26 16.3%
15 13.2%
16 9.2%
21 17.5%
IV Low stress 133 85.8%
114 92.7%
87 87.0%
137 89.5%
High stress 22 14.2%
9 7.3%
13 13.0%
16 10.5%
V Low stress 72 94.7%
32 97.0%
15 93.8%
13 86.7%
High stress 4 5.3%
1 3.0%
1 6.3%
2 13.3%
38
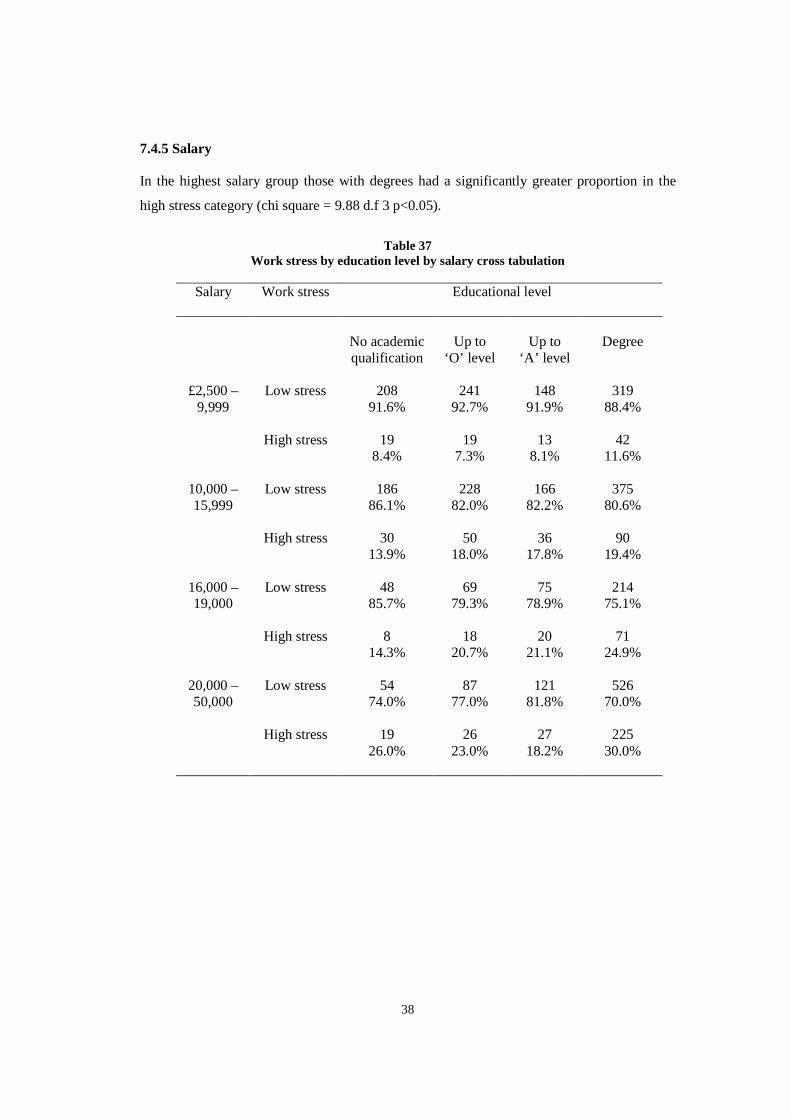
7.4.5 Salary In the highest salary group those with degrees had a significantly greater proportion in the
high stress category (chi square = 9.88 d.f 3 p<0.05).
Table 37
Work stress by education level by salary cross tabulation
Salary
Work stress Educational level
£2,500 – 9,999
Low stress
No academic qualification
208
91.6%
Up to
‘O’ level
241 92.7%
Up to
‘A’ level
148 91.9%
Degree
319 88.4%
High stress 19
8.4% 19
7.3% 13
8.1% 42
11.6%
10,000 – 15,999
Low stress 186 86.1%
228 82.0%
166 82.2%
375 80.6%
High stress 30
13.9% 50
18.0% 36
17.8% 90
19.4%
16,000 – 19,000
Low stress 48 85.7%
69 79.3%
75 78.9%
214 75.1%
High stress 8
14.3% 18
20.7% 20
21.1% 71
24.9%
20,000 – 50,000
Low stress 54 74.0%
87 77.0%
121 81.8%
526 70.0%
High stress 19
26.0% 26
23.0% 27
18.2% 225
30.0%
39
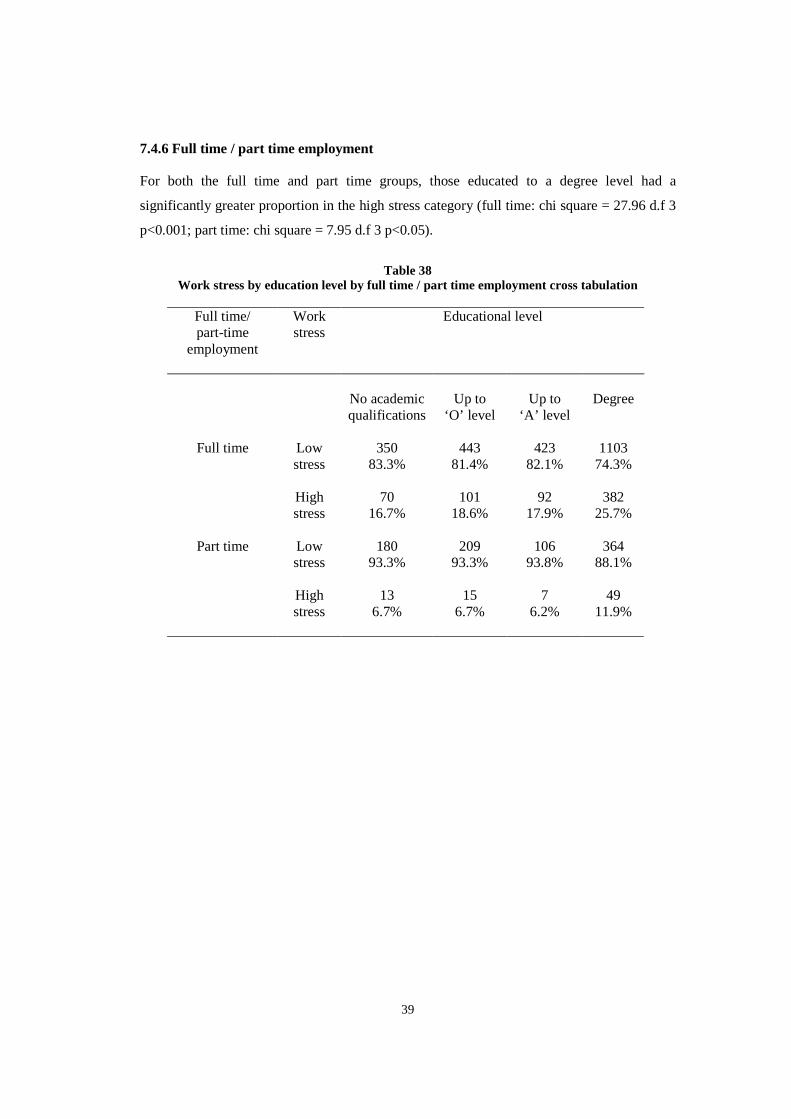
7.4.6 Full time / part time employment For both the full time and part time groups, those educated to a degree level had a
significantly greater proportion in the high stress category (full time: chi square = 27.96 d.f 3
p<0.001; part time: chi square = 7.95 d.f 3 p<0.05).
Table 38
Work stress by education level by full time / part time employment cross tabulation
Full time/ part-time
employment
Work stress
Educational level
Full time
Low stress
No academic qualifications
350
83.3%
Up to
‘O’ level
443 81.4%
Up to
‘A’ level
423 82.1%
Degree
1103 74.3%
High
stress 70
16.7% 101
18.6% 92
17.9% 382
25.7%
Part time Low stress
180 93.3%
209 93.3%
106 93.8%
364 88.1%
High
stress 13
6.7% 15
6.7% 7
6.2% 49
11.9%

40
7.4.7 Occupation The only group to show a significant effect at education level was occupation category 2,
where those educated to degree level had the highest proportion in the high stress category
(chi square = 10.35 d.f 3 p<0.05).
Table 39
Work stress by education level by occupation cross tabulation
Occupation
Work stress Educational level
1
(Low reported stress)
Low stress
No academic qualifications
77
93.9%
Up to
‘O’ level
50 89.3%
Up to
‘A’ level
61 93.8%
Degree
48 90.6%
High stress 5
6.1% 6
10.7% 4
6.2% 5
9.4% 2 Low stress 255
91.7% 318
90.3% 222
88.1% 343
84.5%
High stress 23 8.3%
34 9.7%
30 11.9%
63 15.5%
3 Low stress 127
77.9% 147
86.5% 132
85.7% 349
86.4%
High stress 36 22.1%
23 13.5%
22 14.3%
55 13.6%
4
(High reported stress)
Low stress 64 78.0%
137 72.1%
108 71.5%
725 70.5%
High stress 18
22.0% 53
27.9% 43
28.5% 304
29.5%
7.4.8 Summary In summary, there were generally higher proportions in the high stress category in the group
educated to degree level. This effect was significant in both sexes, those who were married,
all but the youngest age group, the highest salary group, both full and part-time employment
and the second occupational category.
41
7.5 SOCIO-ECONOMIC GROUP AND OTHER VARIABLES Separate analyses were carried out to determine whether socio-economic status had a
significant effect in all the sub-groups of the other variables.
7.5.1 Gender
Both males and females showed a significant effect of socio-economic group (males: chi
square = 52.59 d.f.5 p<0.001; females: chi square = 104.74 d.f.5 p<0.001). In the males,
Group II had the highest proportion in the high stress category and in the females the highest
percentages were found in Groups I and II. These data have already been presented in Table
21.
7.5.2 Marital status
These data have already been presented in Table 28. Socio-economic status had a significant
effect in all groups (married: chi square = 106.92 d.f.5 p<0.001; single: chi square = 26.85
d.f.5 p<0.001; divorced/widowed/separated = 14.94 d.f.5 p<0.05) with the highest proportion
in the high stress category being in Group II.
7.5.3 Age
Socio-economic group had a significant effect in all age groups (18-32 years: chi square =
15.37 d.f. 5, p<0.01; 33-40 years: chi square = 72.14 d.f.5 p<0.001; 41-50 years: chi square =
49.55 d.f.5 p<0.0001; 51+ years: chi square = 17.24 d.f.5 p<0.005). In all groups the highest
proportion in the high stress group was found in Group II. These data have already been
presented in Table 32.
7.5.4 Education
These data have already been presented in Table 36. There was a significant effect of socio-
economic group in all educational groups (no secondary qualifications: chi square = 13.05
d.f.5 p<0.05; up to ‘O’ level: chi square = 36.73 d.f. 5 p<0.001; up to ‘A’ level: chi square =
14.03. d.f.5 p<0.05; degree level: chi square = 59.52 d.f.5 p<0.001). At all levels of
42
educational attainment the highest percentage of workers in the high stress category was
found in social class II.
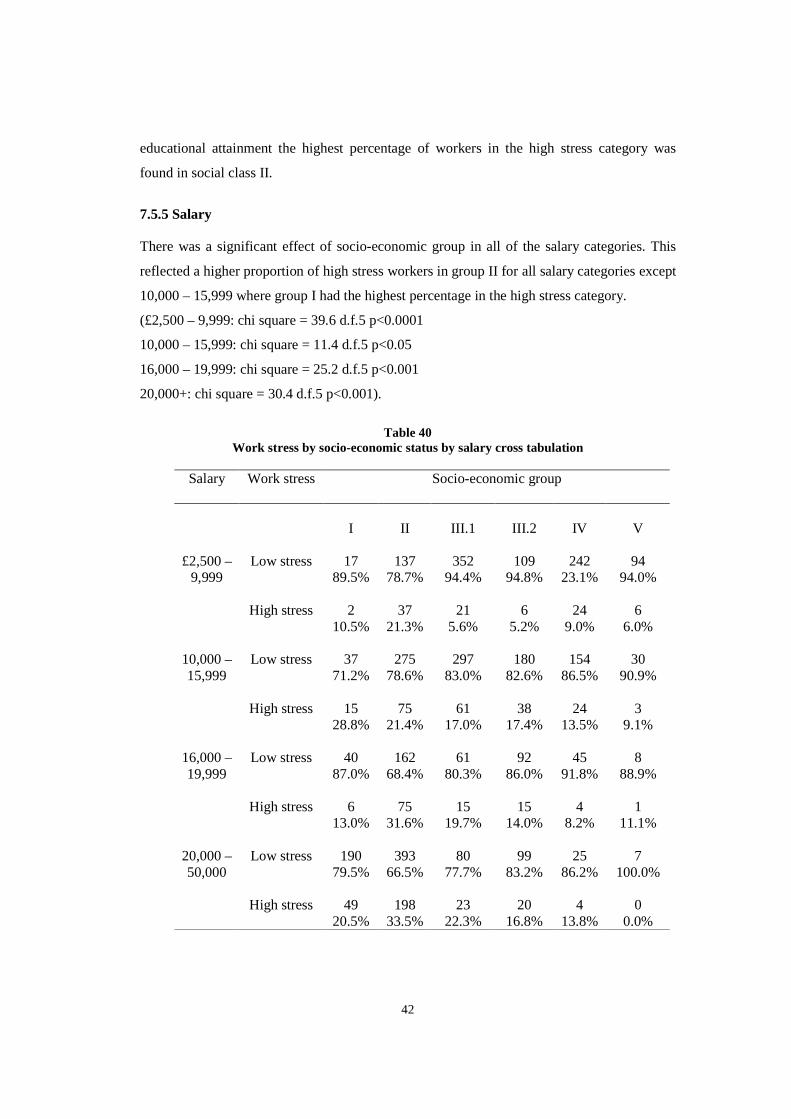
7.5.5 Salary There was a significant effect of socio-economic group in all of the salary categories. This
reflected a higher proportion of high stress workers in group II for all salary categories except
10,000 – 15,999 where group I had the highest percentage in the high stress category.
(£2,500 – 9,999: chi square = 39.6 d.f.5 p<0.0001
10,000 – 15,999: chi square = 11.4 d.f.5 p<0.05
16,000 – 19,999: chi square = 25.2 d.f.5 p<0.001
20,000+: chi square = 30.4 d.f.5 p<0.001).
Table 40 Work stress by socio-economic status by salary cross tabulation
Salary
Work stress Socio-economic group
I
II
III.1
III.2
IV
V
£2,500 – 9,999
Low stress 17 89.5%
137 78.7%
352 94.4%
109 94.8%
242 23.1%
94 94.0%
High stress 2
10.5% 37
21.3% 21
5.6% 6
5.2% 24
9.0% 6
6.0%
10,000 – 15,999
Low stress 37 71.2%
275 78.6%
297 83.0%
180 82.6%
154 86.5%
30 90.9%
High stress 15
28.8% 75
21.4% 61
17.0% 38
17.4% 24
13.5% 3
9.1%
16,000 – 19,999
Low stress 40 87.0%
162 68.4%
61 80.3%
92 86.0%
45 91.8%
8 88.9%
High stress 6
13.0% 75
31.6% 15
19.7% 15
14.0% 4
8.2% 1
11.1%
20,000 – 50,000
Low stress 190 79.5%
393 66.5%
80 77.7%
99 83.2%
25 86.2%
7 100.0%
High stress 49
20.5% 198
33.5% 23
22.3% 20
16.8% 4
13.8% 0
0.0%
43
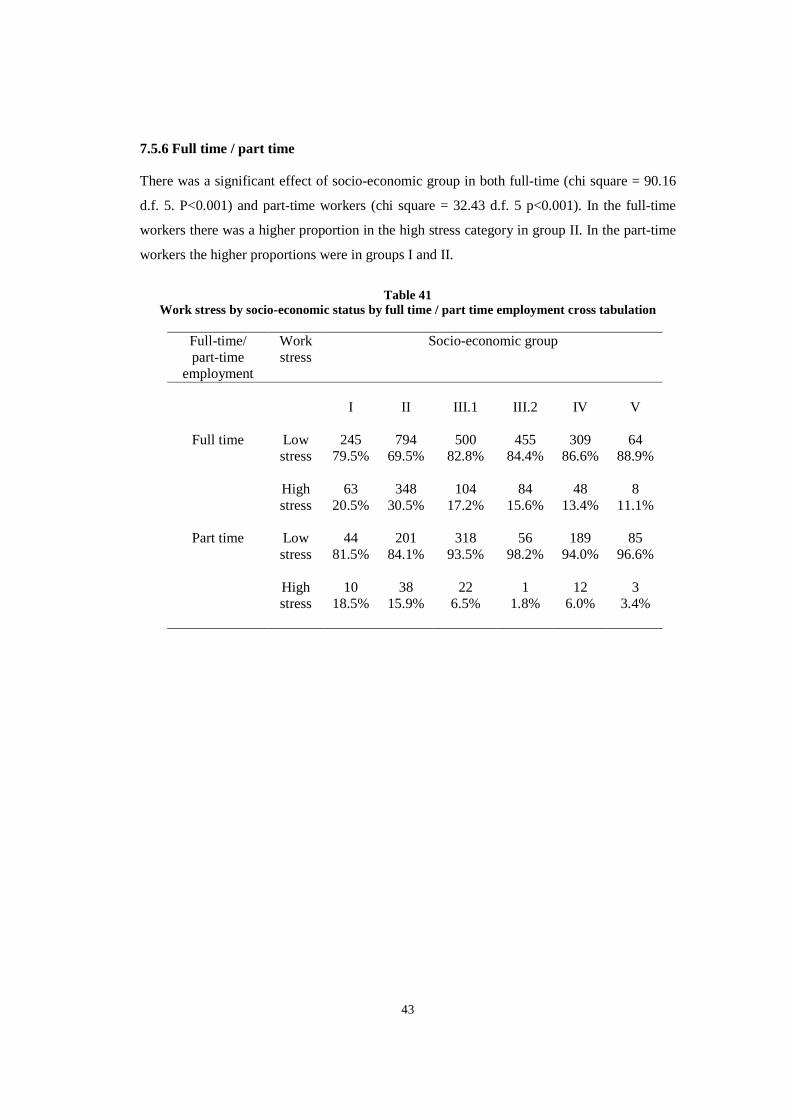
7.5.6 Full time / part time There was a significant effect of socio-economic group in both full-time (chi square = 90.16
d.f. 5. P<0.001) and part-time workers (chi square = 32.43 d.f. 5 p<0.001). In the full-time
workers there was a higher proportion in the high stress category in group II. In the part-time
workers the higher proportions were in groups I and II.
Table 41
Work stress by socio-economic status by full time / part time employment cross tabulation
Full-time/ part-time
employment
Work stress
Socio-economic group
Full time
Low stress
I
245 79.5%
II
794 69.5%
III.1
500
82.8%
III.2
455
84.4%
IV
309
86.6%
V
64 88.9%
High
stress 63
20.5% 348
30.5% 104
17.2% 84
15.6% 48
13.4% 8
11.1%
Part time Low stress
44 81.5%
201 84.1%
318 93.5%
56 98.2%
189 94.0%
85 96.6%
High
stress 10
18.5% 38
15.9% 22
6.5% 1
1.8% 12
6.0% 3
3.4%
44
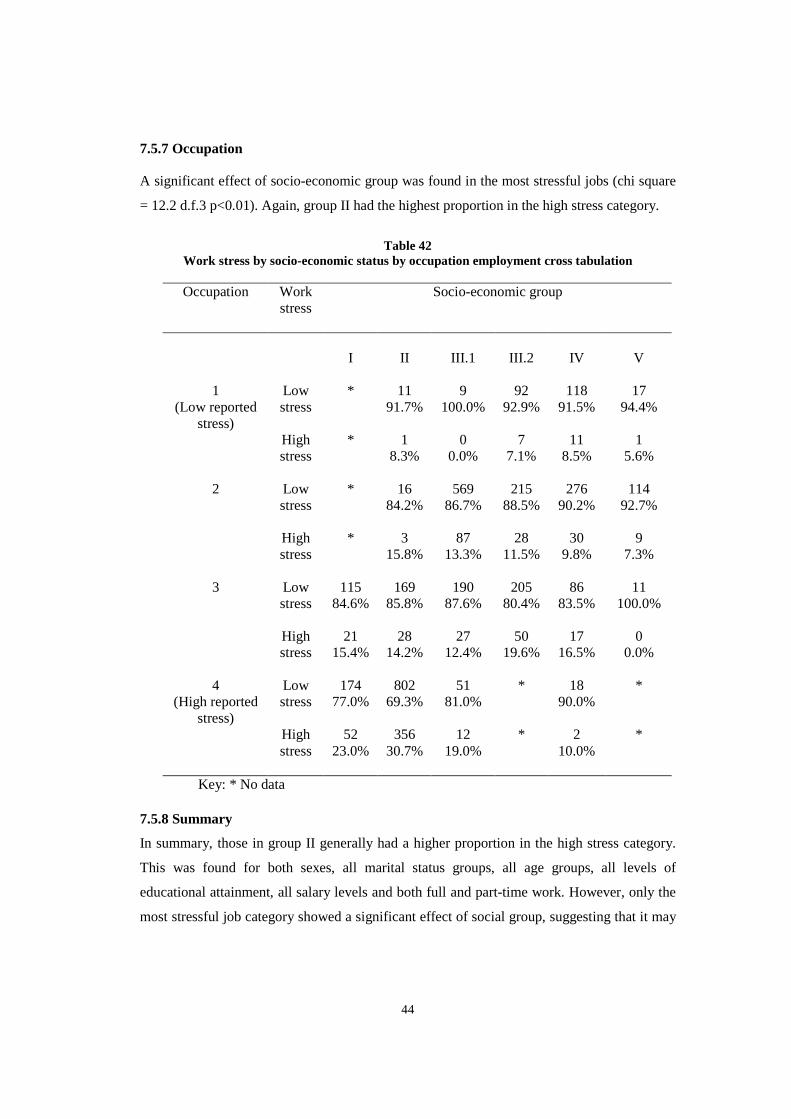
7.5.7 Occupation A significant effect of socio-economic group was found in the most stressful jobs (chi square
= 12.2 d.f.3 p<0.01). Again, group II had the highest proportion in the high stress category.
Table 42
Work stress by socio-economic status by occupation employment cross tabulation
Occupation
Work stress
Socio-economic group
I
II
III.1
III.2
IV
V
1 (Low reported
stress)
Low stress
* 11 91.7%
9 100.0%
92 92.9%
118 91.5%
17 94.4%
High
stress * 1
8.3% 0
0.0% 7
7.1% 11
8.5% 1
5.6%
2 Low stress
* 16 84.2%
569 86.7%
215 88.5%
276 90.2%
114 92.7%
High
stress * 3
15.8% 87
13.3% 28
11.5% 30
9.8% 9
7.3%
3 Low stress
115 84.6%
169 85.8%
190 87.6%
205 80.4%
86 83.5%
11 100.0%
High
stress 21
15.4% 28
14.2% 27
12.4% 50
19.6% 17
16.5% 0
0.0%
4 (High reported
stress)
Low stress
174 77.0%
802 69.3%
51 81.0%
* 18 90.0%
*
High stress
52 23.0%
356 30.7%
12 19.0%
* 2 10.0%
*
Key: * No data
7.5.8 Summary
In summary, those in group II generally had a higher proportion in the high stress category.
This was found for both sexes, all marital status groups, all age groups, all levels of
educational attainment, all salary levels and both full and part-time work. However, only the
most stressful job category showed a significant effect of social group, suggesting that it may
45
be the nature of the job, rather than social group per se that is important. Given that the socio-
economic groupings used here are based on occupation this is not surprising.
46
7.6 SALARY AND OTHER VARIABLES Separate analyses were carried out to determine whether salary had a significant effect on all
sub-groups of the other factors.
7.6.1 Gender These data have already been shown in Table 22. There were significant effects of salary for
both males (chi square = 18.46 d.f3 p< 0.001) and females (chi square=150.22 d.f3 p <
0.001), with the proportion in the high stress category increasing with salary in both sexes.
7.6.2 Marital status
These data are shown in Table 27. Again, the proportion in the high stress category increased
with salary for all groups (married: chi square = 73.20 d.f3 p < 0.001; single: chi square =
39.45 d.f3 p < 0.001; widowed/divorced or separated: chi square = 15.74 d.f3 p < 0.001).
7.6.3 Age
These data are shown in Table 33. Again, there were significant effects of salary in all age
groups (18-32: chi square = 23.47 d.f3 p < 0.001; 33-40: chi square =49.77 d.f3 p < 0.001;
41-50: chi square = 28.76 d.f3 p < 0.001; 51+: chi square= 17.39 d.f3 p < 0.001).
7.6.4 Education
These data are shown in Table 37. The effect of salary was once again significant in all
groups (no secondary qualifications: chi square = 15.16 d.f3 p < 0.005; ‘O’ level: chi square
= 21.48 d.f3 p < 0.001; ‘A’ level: chi square = 10.46 d.f3 p < 0.05; Degree: chi square =
50.97 d.f3 p < 0.001).
7.6.5 Socio-economic group
These data are shown in Table 40. There were significant effects of salary in Groups II (chi
square = 21.48 d.f3 p < 0.001), III.1 (chi square= 33.62 d.f3 p < 0.001) and III.2 (chi square =
47
10.19 df 3 p < 0.001). The absence of significant effects in the extreme groups reflects the
small numbers in certain categories (i.e. very few low salary workers in Group I and very few
highly paid workers in Groups IV and V).
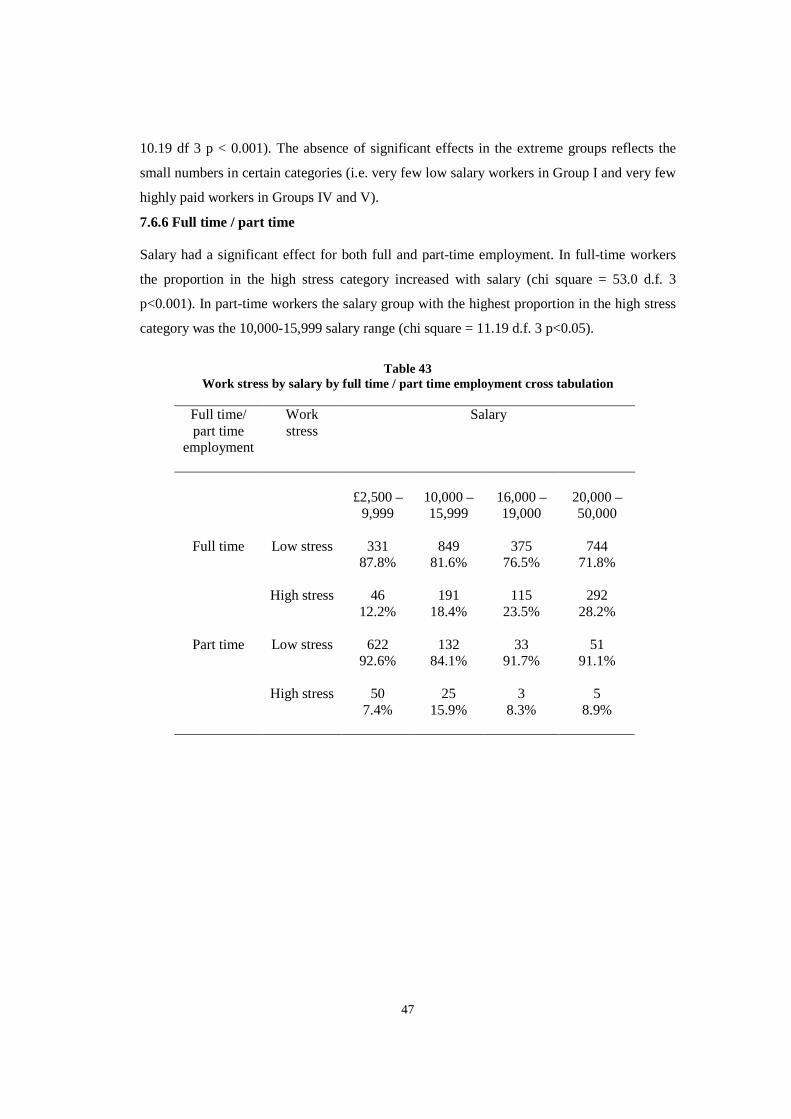
7.6.6 Full time / part time Salary had a significant effect for both full and part-time employment. In full-time workers
the proportion in the high stress category increased with salary (chi square = 53.0 d.f. 3
p<0.001). In part-time workers the salary group with the highest proportion in the high stress
category was the 10,000-15,999 salary range (chi square = 11.19 d.f. 3 p<0.05).
Table 43
Work stress by salary by full time / part time employment cross tabulation
Full time/ part time
employment
Work stress
Salary
£2,500 –
9,999
10,000 – 15,999
16,000 – 19,000
20,000 – 50,000
Full time Low stress 331
87.8% 849
81.6% 375
76.5% 744
71.8%
High stress 46 12.2%
191 18.4%
115 23.5%
292 28.2%
Part time Low stress 622
92.6% 132
84.1% 33
91.7% 51
91.1%
High stress 50 7.4%
25 15.9%
3 8.3%
5 8.9%
48
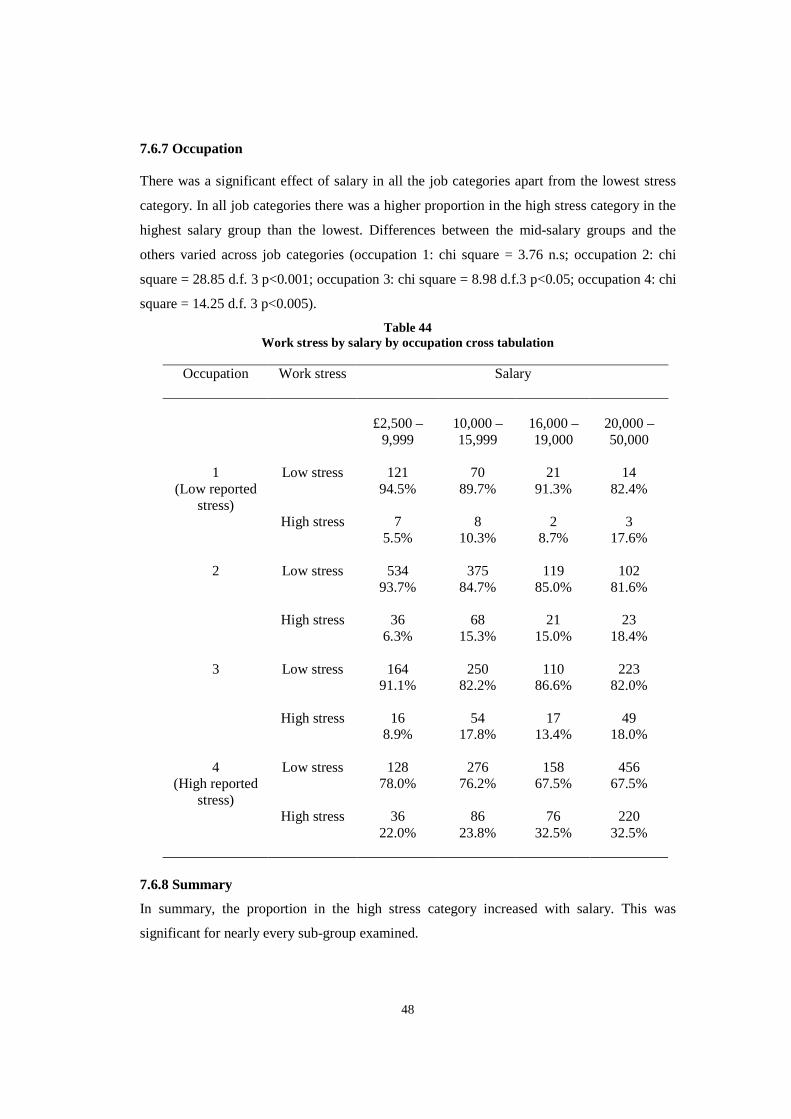
7.6.7 Occupation There was a significant effect of salary in all the job categories apart from the lowest stress
category. In all job categories there was a higher proportion in the high stress category in the
highest salary group than the lowest. Differences between the mid-salary groups and the
others varied across job categories (occupation 1: chi square = 3.76 n.s; occupation 2: chi
square = 28.85 d.f. 3 p<0.001; occupation 3: chi square = 8.98 d.f.3 p<0.05; occupation 4: chi
square = 14.25 d.f. 3 p<0.005).
Table 44 Work stress by salary by occupation cross tabulation
Occupation
Work stress Salary
£2,500 –
9,999
10,000 – 15,999
16,000 – 19,000
20,000 – 50,000
1
(Low reported stress)
Low stress 121 94.5%
70 89.7%
21 91.3%
14 82.4%
High stress 7
5.5% 8
10.3% 2
8.7% 3
17.6%
2 Low stress 534 93.7%
375 84.7%
119 85.0%
102 81.6%
High stress 36
6.3% 68
15.3% 21
15.0% 23
18.4%
3 Low stress 164 91.1%
250 82.2%
110 86.6%
223 82.0%
High stress 16
8.9% 54
17.8% 17
13.4% 49
18.0%
4 (High reported
stress)
Low stress 128 78.0%
276 76.2%
158 67.5%
456 67.5%
High stress 36
22.0% 86
23.8% 76
32.5% 220
32.5%
7.6.8 Summary
In summary, the proportion in the high stress category increased with salary. This was
significant for nearly every sub-group examined.

49
7.7 FULL TIME / PART TIME EMPLOYMENT AND OTHER VARIABLES
There were significantly higher proportions in the high stress category for those in full-time
employment than those working part-time in analyses examining gender (see Table 22),
marital status (see Table 29), age (see Table 34), education (see Table 38), socio-economic
groups (see Table 41) and salary (see Table 43). 7.7.1 Occupation There were significantly greater proportions of full-time workers in the high stress category for all
occupation groups except for group I. (occupation 2: chi square = 30.05 d.f.1 p<0.001; occupation 3:
chi square = 8.27 d.f. 1 p<0.005; occupation 4: chi square = 21.32 d.f.1 p<0.001).
Table 45
Work stress by full time / part time employment by occupation cross tabulation
Occupation
Work stress
Full-time/part-time employment
1 (Low reported
stress)
Low stress
Full-time
158
91.3%
Part-time
89
94.7%
High stress 15 8.7%
5 5.3%
2 Low stress 734
84.8% 454
94.8%
High stress 132 15.2%
25 5.2%
3 Low stress 647
82.9% 126
92.6%
High stress 133 17.1%
10 7.4%
4
(High reported stress)
Low stress 824 68.7%
222 82.8%
High stress 375
31.3% 46
17.2%
50
7.7.2 Summary In summary, all of the analyses clearly demonstrated that the scale of occupational stress is
much greater in full-time employment than in part-time work.
51
7.8 OCCUPATION
7.8.1 Summary
Job category had a highly significant effect on the proportion in the high stress category. This
effect was found in the analyses of gender (Table 23), marital status (Table 30), age (Table
35), education (Table 39), socio-economic groups (Table 42), salary (Table 44) and full-
time/part-time employment (Table 45). In a few analyses the effect of job was not significant
due to the small numbers in certain cells.
52
8. COMBINATIONS OF THE HIGH STRESS SUB-GROUPS
The previous section showed that gender differences in the scale of reported stress were
variable, with some sub-groups showing a greater level of stress in males and others showing
the reverse. Marital status had a more general influence with there being a higher proportion
in the high stress category in those who were widowed/divorced or separated. Age had a
small but significant effect in most analyses with the middle-aged having a higher proportion
in the high stress category than the other age groups. Level of educational attainment was
also a significant factor, with those educated to degree level reporting greater stress. The
proportion in the high stress category also increased with salary. Similarly, high stress was
greater in full-time work than part-time employment. Type of job also achieved significance
in the majority of analyses. As socio-economic group was based on occupation it was not
surprising that this showed a similar pattern.
The analyses reported below took the sub-groups with the highest reported stress levels from
all of the variables and examined how stress varied as a function of the number of these
variables present. The sub-groups considered as “highest reported stress” for the various
factors were:
Marital status: Divorced/separated/widowed
Age: 41-50 years old
Full-time/part-time Full-time
Education: To degree level
Socio-economic group: Group II
Salary: £20,000+
Occupation: Category 4 (professional,
teaching, nursing, other education
and welfare, managerial, security
and road transport)
Gender was not examined as this did not have a significant overall effect on the proportion in
the high stress category.
53
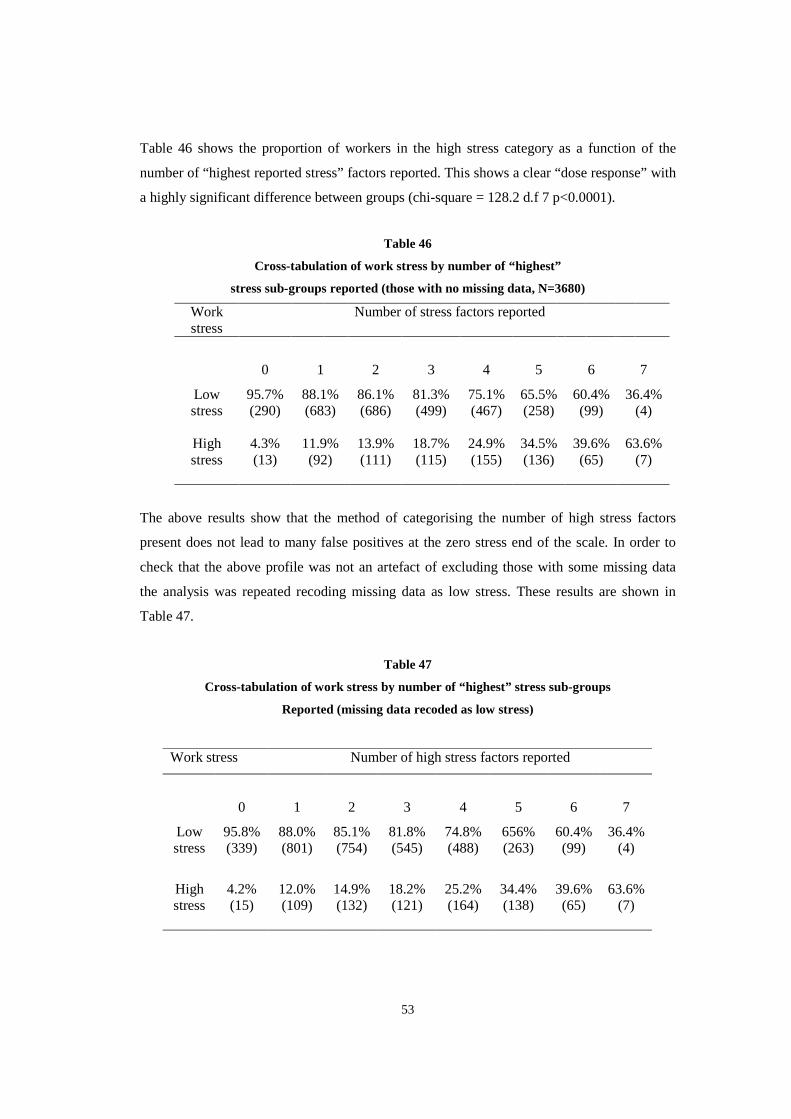
Table 46 shows the proportion of workers in the high stress category as a function of the
number of “highest reported stress” factors reported. This shows a clear “dose response” with
a highly significant difference between groups (chi-square = 128.2 d.f 7 p<0.0001).
Table 46
Cross-tabulation of work stress by number of “highest”
stress sub-groups reported (those with no missing data, N=3680)
Work stress
Number of stress factors reported
0
1
2
3
4
5
6
7
Low stress
95.7% (290)
88.1% (683)
86.1% (686)
81.3% (499)
75.1% (467)
65.5% (258)
60.4% (99)
36.4% (4)
High stress
4.3% (13)
11.9% (92)
13.9% (111)
18.7% (115)
24.9% (155)
34.5% (136)
39.6% (65)
63.6% (7)
The above results show that the method of categorising the number of high stress factors
present does not lead to many false positives at the zero stress end of the scale. In order to
check that the above profile was not an artefact of excluding those with some missing data
the analysis was repeated recoding missing data as low stress. These results are shown in
Table 47.
Table 47
Cross-tabulation of work stress by number of “highest” stress sub-groups
Reported (missing data recoded as low stress)
Work stress Number of high stress factors reported
0
1
2
3
4
5
6
7
Low stress
95.8% (339)
88.0% (801)
85.1% (754)
81.8% (545)
74.8% (488)
656% (263)
60.4% (99)
36.4% (4)
High stress
4.2% (15)
12.0% (109)
14.9% (132)
18.2% (121)
25.2% (164)
34.4% (138)
39.6% (65)
63.6% (7)

54
Again, there was a highly significant effect of number of factors (chi square = 218.2 d.f.7
p<0.0001) and the profile was identical to the previous analysis.
The above results suggest that the different factors associated with the reporting of stress are
independent and additive. This was confirmed by conducting a logistic regression. This
revealed that type of job, full-time/part-time employment, socio-economic status, and marital
status had a significant effects. Education and age no longer had significant effects when the
other variables were also entered into the equation. The variables in the regression equation
are shown in Table 48.
Table 48
Logistic regression entering the variables dichotomised into
sub-groups associated with high and low stress
Variable Wald Sig R Log odds ratio
95% CI log odds ratio
lower upper
Job type
30.86
.0000
0.092
1.0068
1.0044
1.0092
Full-time 42.36 .0000 0.109 1.0088 1.0061 1.0114
Socio-economic
9.18 .0024 0.046 1.0036 1.0013 1.0060
Salary 4.98 0026 0.030 1.0022 1.0003 1.0041
Marital status
8.98 0.003 0.045 1.0042 1.0015 1.0070
An identical profile emerged when stepwise multiple regression was used with the work
stress rating (now on a 5 point scale rather than dichotomised) as the dependent variable.
Additional regressions were carried out using the original categorisation of variables rather
than the dichotomies. The logistic regression showed an identical outcome apart from the fact

55
that socio-economic group was no longer significant. Similarly, in the multiple regression the
only difference was that educational level now had a significant effect.
Summary
Overall, these analyses have shown that the proportion in the high reported stress category
increases as a function of the number of highest stress sub-groups reported. Regressions have
shown that the associations between the occupational variables and reported work stress are
robust whereas demographics such as age no longer have an impact when the other variables
are entered into the regression equation. Full-time employment and type of job clearly have
the strongest associations with reported work stress but the other factors can add to these
variables. Marital status also appears to be important and cannot be accounted for by the
other variables considered here.
56
9. DISCUSSION
9.1 A SUMMARY OF THE RESULTS
Results from the main study showed that about 20 percent of the sample reported very high or
extremely high levels of stress at work. The present report describes further analyses of the
impact of demographic and occupational variables on reported stress at work.
This analysis is based mainly on statistical significance testing. Consequently, the results do
not establish with any certainty a causal link between any of the demographic and
occupational factors measured and reported stress at work. The results may be suggestive of
such a link but more in-depth research would be necessary to establish its validity.
In the majority of the analyses reported stress levels were similar in males and females. The
exceptions were that there were higher proportions of males than females in the high reported
stress category in those with no secondary school qualifications and the lowest salary group.
In contrast, there were higher proportions of females than males in the high reported stress
category in social class III.2, all the salary groups except the lowest and in the full-time
employment group.
Marital status was related to the reporting of stress with those who were widowed/divorced
or separated generally having a higher proportion in the high reported stress category. This
was significant for females, those in the 50 + age group, those educated to degree level, the
highest salary group and those in full-time employment.
There were generally higher proportions in the high reported stress category in the middle age
groups. This was significant for males, those who were single, those educated to degree level,
social class II, those in full-time employment and those in the most stressful jobs.
There were also generally higher proportions in the high reported stress category in the group
educated to degree level. This was significant in both sexes, those who were married, all but
57
the youngest age group, the highest salary group, both full and part-time employment and the
second occupational category.
The present sample was not a very good one for examining ethnicity, with there being very
few non-white respondents. The non-white group reported greater stress at work than the
sample as a whole. Slight differences were found as a function of ethnicity in the effects of
the demographic and occupational variables although these should be treated with caution
due to the small numbers in certain cells. Further research on occupational stress in non-white
groups is now essential, especially as the evidence from the current small sample suggests
that non-white groups may have higher levels of stress at work than their white counterparts.
However, it is unclear whether the differences reflect ethnicity per se or the influence of other
factors that are correlated with ethnicity in the present sample.
The scale of occupational stress was clearly much greater for those in full-time employment
than those with part-time jobs. The proportion in the high stress category also increased with
salary.
Job category showed a strong relationship with the reporting of stress. When socio-economic
groups based on occupation were examined it was generally found that those in-group II had
a higher proportion in the high reported stress category. Analyses of occupations showed that
teachers, nurses and managers had the highest proportion in the high reported stress category.
Sub-groups with the highest reported stress for each variable were identified. The proportions
in the high reported stress category were then examined as a function of the number of these
factors present. A clear dose response emerged suggesting that the various factors are
independent and additive. This was confirmed in regression equations where all the
occupational variables remained as significant effects.
In conclusion, the present analyses show that the scale of occupational stress is associated
with both demographic and occupational factors. Specifically, greater reported occupational
stress is associated with being middle-aged, widowed/divorced or separated, educated to
degree level, in full-time employment earning over £20,000, and having an occupation such
as teaching, nursing or being a manager (or being in social group II). The magnitude of

58
reported stress appears to be a direct function of the number of these features that are present,
although it should be noted that stress at work is not an automatic consequence of having
these characteristics. The analyses also showed that non-whites report higher levels of stress
and further research on this topic is clearly desirable.
9.2 COMMENTS ON PRESENT FINDINGS
The results have shown that there are clearly some groups of employees who report
statistically significantly higher levels of work-related stress than average. These groups can
be identified by standard demographic and occupational characteristics. The impact of the
different factors clearly varies in magnitude. For example, if one considers the demographic
variables one finds that the difference between the most stressed and least stressed sub-groups
is in the region of 5-10% (Age: 4.5 %, 18-32 v 41-50 groups; Marital status: 7.5 %, single v
widowed/divorced or separated; education: 9.1 %, no secondary qualifications versus degree;
ethnicity: 10.8 %, whites v non-whites). The occupational variables lead to greater variation
with differences between the least and most stressed sub-groups ranging from 12- 40% (
part-time v full-time: 12.9%; salary: 18.1%, lowest v highest; socio-economic group: 21.2%,
group V v group II; occupation: 41.5%, hair and beauty v teachers).
Analyses combining the variables showed that the effects are independent and additive. The
presence of 4 or more of the factors was associated with stress levels well above average and
50% of the high reported stress sample fell into those categories. However, it should be noted
that 27% of the low reported stress sample had 4 or more of the factors present which
suggests that high reported levels of stress at work are not an automatic consequence of the
presence of certain demographic and occupational characteristics. This suggests further
research on why certain individuals perceive high levels of stress whereas others do not.
Indeed, the present approach is very similar to early research on the effects of negative life
events on health (4). While exposure to stressful events is clearly one important factor it has
been shown that appraisal of the stress cannot be ignored, and that coping strategies must be
considered. Nevertheless, if one looks at the group with 6 of the potentially stress-related
characteristics, one finds that the proportion of high stress workers in this group is over twice
the average. This would seem, therefore, to be a sub-group that require urgent investigation.
59
The present analyses cannot answer the question of whether it is the nature of the job that
causes the stress or whether it is the characteristics of individuals who do certain jobs that is
crucial. Further research investigating the impact of changes in the nature of the job will
provide better information on this issue. However, the estimates of the scale of occupational
stress have increased over the last decade and the nature of many jobs has also changed over
this period. Indeed, there are anecdotal reports from professions such as teaching which
suggest that teachers are now doing very different jobs from those they originally carried out.
The extra administrative demands now associated with the jobs, and uncertainty due to the
changing nature of work, may be related to the increases in perceived stress.
9.3 HOW DO THE PRESENT FINDINGS COMPARE WITH PREVIOUS
RESEARCH?
Similar results have been obtained in some previous research. For example, SWI95 (5)
identified teachers and nurses as being a group with high levels of stress at work and also
found little in the way of gender differences. Very different results emerge from studies such
as Whitehall II, where work-related ill-health often shows a social gradient. As perceived
stress has not been measured in Whitehall II it is difficult to resolve any differences.
However, it is clearly the case that stress is not unitary but can have a varied aetiology and
also different outcomes. Indeed, the most recent report from Whitehall II (6) shows that an
effort-reward imbalance has global effects on health whereas high job demands, low decision
latitude and work social support and control influence specific health outcomes. Only small
social gradients were found for self-report health measures, and in the case of the women
there was a lack of a gradient or a tendency towards an inverse gradient.
The apparently discrepant findings can probably be best accounted for in the following way.
Job characteristics can increase perceived stress but greater reporting of stress is not an
inevitable consequence in every person. Similarly, both job characteristics and perceived
stress are related to ill-health but again there will be individuals who do not show such
associations. It may also be the case that different pathways are involved, with not all job-
health effects being mediated by an increase in stress. This type of effect can be seen clearly
in research on susceptibility to upper respiratory tract infections (7). Here, stressful events
were associated with increased colds and so was perceived stress. However, the biological
60
pathways affected by the two variables were different, with the stressful events influencing
the development of symptoms after infection and perceived stress increasing the initial
susceptibility to infection.
All one has to assume is that the direct job characteristics to health pathway also involves a
social gradient whereas the job –perceived stress-health pathway does not, or involves an
inverse one.
9.4 WHAT ARE THE IMPLICATIONS OF THE PRESENT FINDINGS FOR
FURTHER RESEARCH AND MANAGEMENT OF OCCUPATIONAL STRESS?
The present research has identified one area which clearly requires further study, namely
investigation of occupational stress in different ethnic groups. It has categorized the most
prevalent type of reported occupational stress and this can be labeled “social group II” stress.
This is clearly very different from the social gradient health effects that have been widely
studied and it requires further investigation.
With regard to the targeting of sub-groups, the present research confirms that occupational
stress is perceived as a major problem by teachers, nurses and managers. However, perceived
stress is not an automatic consequence of these occupations and it is not absent in other jobs.
This suggests the necessity for both a global approach to the topic and a focused
consideration of those occupations where it appears to be a particularly big problem at the
moment. Further research on individual differences in perceived occupational stress is also
vital and we may make as much progress in understanding perceived stress at work by
studying those who do not experience it as those who do.

61
10. REFERENCES
1. Smith A., Johal S., Wadsworth E., Davey Smith G. and Peters T (2000). The
scale of occupational stress: The Bristol Stress and Health at work study. Contract
research report 265/2000. Health & Safety Executive. HSE Books: Sudbury.
2. Elias P., Halstead K. and Prandy K (1993). Computer assisted standard
occupational coding (CASOC). HMSO: London.
3. Jones JR., Hodgson JT. and Osman J (1997). Self-reported working conditions
in 1995: Results from a household survey. Health & Safety Executive. HSE Books:
Sudbury.
4. Holmes TH. and Rahe RH (1967). The social readjustment rating scale. Journal
of Psychosomatic Research, 11, 213-218.
5. Jones JR., Hodgson JT., Clegg TA and Elliott RC (1998). Self-reported work-
related illness in 1995: Results from a household survey. Health & Safety
Executive. HSE Books: Sudbury.
6. Stansfeld S., Head J. and Marmot M (2000). Work related factors and ill-health:
The Whitehall II Study. Contract research report 266 /2000. Health & Safety
Executive. HSE Books: Sudbury.
7. Cohen S., Tyrrell DAJ. and Smith AP (1993). Negative life events, perceived
stress, negative affect and susceptibility to the common cold. Journal of Personality
and Social Psychology, 64, 131-140.

Printed and published by the Health and Safety ExecutiveC30 1/98
Printed and published by the Health and Safety ExecutiveC2.5 12/00

CRR 311
£15.00 9 78071 7 61 91 08
ISBN 0-7176-1910-9