Embed Size (px)
Citation preview

BUREAU OF POINT & NON-POINT SOURCE MANAGEMENT
Continuous Instream Monitoring Report
(CIMR) Most recent revision: 6/25/15 Revised by: Hoger
STATION DESCRIPTION: STREAM CODE: 01024
STREAM NAME: Skippack Creek
SITE NAME: Skippack Creek DWS Route 63
COUNTY: Montgomery
LATITUDE: 40.253802 LONGITUDE: -75.356011
LOCATION DESCRIPTION: Skippack Creek DWS Rt. 63 and just UPS of Mainland Road
within thalweg.
HUC: 02040203
DRAINAGE AREA: 11.57 sq. miles
BACKGROUND AND HISTORY: Skippack Creek is a freestone tributary to Perkiomen
Creek within Towamencin Township, Montgomery County (Figure 1). The portion of the
basin above this site is characterized by relatively shallow topography with land use
consisting of urban areas (42.2%), agricultural open use (34.2%) and forested land
(23.6%). The purpose of this survey was to characterize water quality and biological
conditions from early-spring to late fall as part of a greater nutrient impact assessment
development. These data also allowed for comparison of the early-spring water quality
throughout a basin as additional sites were located at Towamencin Creek, a tributary to
Skippack Creek, and Skippack Creek at Ridge Pike in the lower portion of the watershed
(Figure 1). Skippack Creek has a designated use of Trout Stocking, Migratory Fishes (TSF,
MF). Three sewage discharges are active in this portion of the basin.
The primary objectives of the assessment were to:
1. Characterize baseline water temperature, specific conductance, pH and dissolved
oxygen using 24-hour monitoring.
2. Characterize water chemistry.
3. Characterize baseline biological communities.

Figure 1. Map of the CIM locations within the Skippack Creek basin. Sites include a lower
Skippack Creek location (at Ridge Pike), upper Skippack Creek location (Route 63) and one
tributary (Towamencin Creek at Metz Rd).

Figure 2. Skippack Creek DWS Route 63 sampling location.
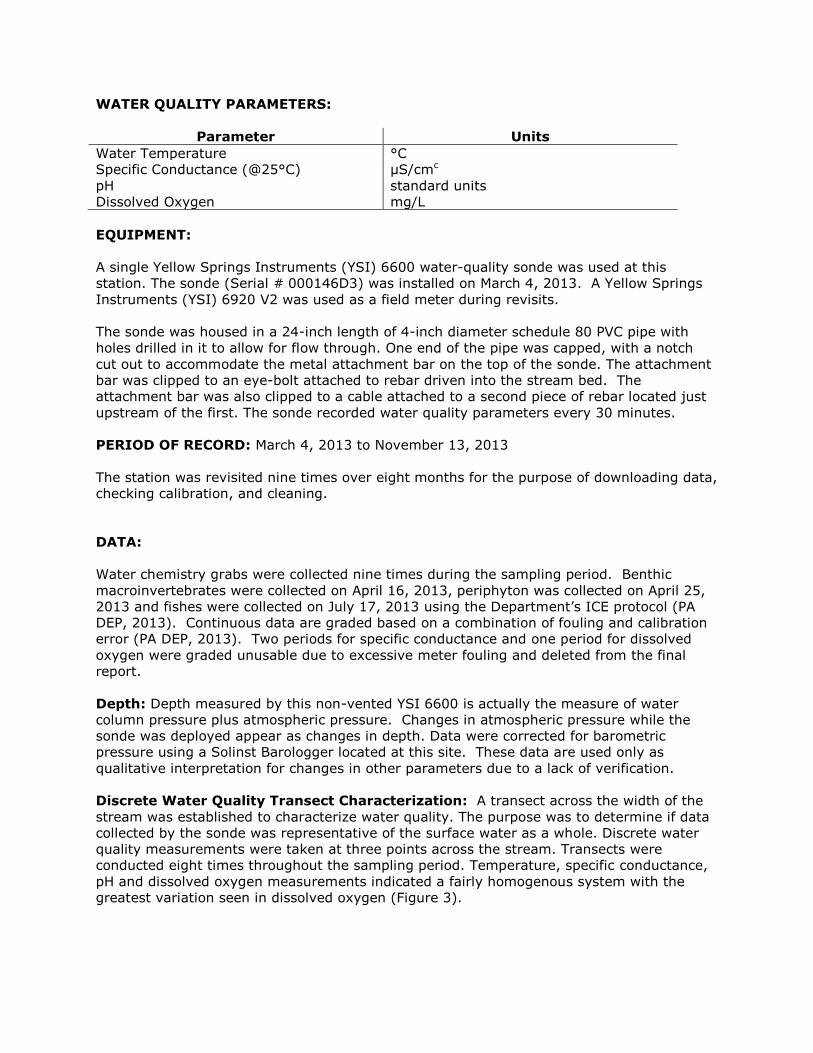
WATER QUALITY PARAMETERS:
Parameter Units
Water Temperature °C
Specific Conductance (@25°C) µS/cmc
pH standard units
Dissolved Oxygen mg/L
EQUIPMENT:
A single Yellow Springs Instruments (YSI) 6600 water-quality sonde was used at this
station. The sonde (Serial # 000146D3) was installed on March 4, 2013. A Yellow Springs
Instruments (YSI) 6920 V2 was used as a field meter during revisits.
The sonde was housed in a 24-inch length of 4-inch diameter schedule 80 PVC pipe with
holes drilled in it to allow for flow through. One end of the pipe was capped, with a notch
cut out to accommodate the metal attachment bar on the top of the sonde. The attachment
bar was clipped to an eye-bolt attached to rebar driven into the stream bed. The
attachment bar was also clipped to a cable attached to a second piece of rebar located just
upstream of the first. The sonde recorded water quality parameters every 30 minutes.
PERIOD OF RECORD: March 4, 2013 to November 13, 2013
The station was revisited nine times over eight months for the purpose of downloading data,
checking calibration, and cleaning.
DATA:
Water chemistry grabs were collected nine times during the sampling period. Benthic
macroinvertebrates were collected on April 16, 2013, periphyton was collected on April 25,
2013 and fishes were collected on July 17, 2013 using the Department’s ICE protocol (PA
DEP, 2013). Continuous data are graded based on a combination of fouling and calibration
error (PA DEP, 2013). Two periods for specific conductance and one period for dissolved
oxygen were graded unusable due to excessive meter fouling and deleted from the final
report.
Depth: Depth measured by this non-vented YSI 6600 is actually the measure of water
column pressure plus atmospheric pressure. Changes in atmospheric pressure while the
sonde was deployed appear as changes in depth. Data were corrected for barometric
pressure using a Solinst Barologger located at this site. These data are used only as
qualitative interpretation for changes in other parameters due to a lack of verification.
Discrete Water Quality Transect Characterization: A transect across the width of the
stream was established to characterize water quality. The purpose was to determine if data
collected by the sonde was representative of the surface water as a whole. Discrete water
quality measurements were taken at three points across the stream. Transects were
conducted eight times throughout the sampling period. Temperature, specific conductance,
pH and dissolved oxygen measurements indicated a fairly homogenous system with the
greatest variation seen in dissolved oxygen (Figure 3).

Figure 3. Discrete water quality transects.

Water Temperature: Average: 17.85°C; Maximum: 30.45°C; Minimum: 3.52°C.
Figure 4. Continuous water temperature, continuous depth, and discrete water temperature from March 4, 2013 to November
13, 2013. The data gap at the end of May was due to battery failure.

Specific Conductance: Average: 1410.9 µS/cm; Maximum: 2591 µS/cm; Minimum: 111 µS/cm.
Figure 5. Continuous specific conductance, continuous depth, and discrete specific conductance from March 4, 2013 to
November 13, 2013. The data gap at the end of May was due to battery failure. Gaps at the end of April and beginning of July
were due to excessive meter fouling.

pH: Average: 7.92 units; Maximum: 9.57 units; Minimum: 7.00 units.
Figure 6. Continuous pH, continuous depth, and discrete pH from March 4, 2013 to November 13, 2013. The data gap at the
end of May was due to battery failure.

Dissolved Oxygen: Average: 9.36 mg/l; Maximum: 23.33 mg/l; Minimum: 2.74 mg/l.
Figure 7. Continuous dissolved oxygen, continuous depth, and discrete dissolved oxygen from March 4, 2013 to November 13,
2013. The data gap at the end of May was due to battery failure. The data gap in July and August was due to excessive meter
fouling.

In-situ Water Chemistry: Samples were collected nine times using standard analysis code 612. Measurements with “<”
indicate concentrations below the reporting limit. Discharge values with “*” indicates that it was taken on the previous day.
Table 1. Chemical grab sample results.
PARAMETER UNITS 03/27/2013 04/25/2013 06/04/2013 06/25/2013 07/17/2013 08/07/2013 9/10/2013 10/16/2013 11/13/2013
09:42 12:43 06:50 09:01 12:30 10:15 09:30 10:26 15:00
DISCHARGE CFS 12.383 8.537 10.502* 5.056 10.242* 7.058 4.466 5.386 3.770
ALUMINUM T UG/L 30.000 32.000 <13.7514 <13.7514 19.000 <13.7514 <13.7514 <13.7514 86.000
BARIUM T UG/L 77.000 59.000 76.000 92.000 82.000 78.000 62.000 57.000 55.000
BORON T UG/L 50.00 60.00 90.00 100.00 80.00 100.00 120.00 110.00 110.00
BROMIDE UG/L 96.1340 83.4070 108.6570 630.0000 847.0000 1175.0000 1324.0000 1237.0000 1824.0000
CALCIUM T MG/L 57.300 46.000 53.900 54.370 59.200 60.000 46.030 45.300 41.100
CHLORIDE T MG/L 319.0000 267.0000 366.0000 383.0000 290.0000 358.0000 430.0000 377.7210 527.0000
COPPER T UG/L 4.800 4.300 15.300 5.460 5.010 7.350 8.490 9.040 6.160
IRON T UG/L 93.000 37.000 23.000 24.000 17.000 25.000 21.000 18.000 75.000
LEAD T UG/L 0.166 0.189 0.662 0.110 0.121 0.127 0.193 0.169 0.225
MAGNESIUM T MG/L 14.400 12.100 14.100 14.350 14.000 14.200 12.790 12.400 13.300
MANGANESE T UG/L 17.000 15.000 12.000 4.000 12.000 4.000 3.000 5.000 9.000
NICKEL T UG/L <13.7856 <13.7856 <13.7856 <13.7856 <13.7856 <13.7856 <13.7856 <13.7856 <13.7856
SELENIUM T UG/L <0.32605 <0.32605 0.369 1.950 3.170 3.880 4.590 1.620 <0.32605
SODIUM T MG/L 168.000 166.000 236.000 271.200 185.000 233.000 276.600 266.000 355.000
STRONTIUM T UG/L 301.000 263.000 310.000 346.000 309.000 322.000 288.000 260.000 262.000
SULFATE T MG/L 32.1800 31.5980 42.4470 36.7810 32.4590 41.5470 49.8210 41.2940 49.5090
ZINC T UG/L 14.000 19.000 12.000 15.000 18.000 25.000 24.000 18.000 24.000
HARDNESS T MG/L 203 165 193 195 206 209 168 164 158
OSMOTIC PRESSURE MOSM 23 24 27 30 21 26 30 29 39
pH pH units 8.3 8.2 7.9 8.1 8.2 7.9 7.9 7.6 8.4
SPECIFIC COND @ 25C umhos/cm 1396.00 1257.00 1617.00 1776.00 1430.00 1631.00 1774.00 1772.00 2190.00
TDS @ 180C MG/L 858 730 968 1112 894 1472 1008 752 1240
TSS MG/L <5 <5 <5 <5 <5 <5 <5 <5 16
TURBIDITY NTU 1.27
TOC MG/L 4.4090 4.9740 4.8740 4.6810 4.4780 5.0160 5.0710 6.1150 6.9180
ALKALINITY MG/L 102.4 100.8 97.6 87.8 102.4 99.6 97.0 102.0 102.2
AMMONIA D MG/L 0.013 0.041 0.042 0.089 0.044 0.045 0.035 0.02900 0.03000
AMMONIA T MG/L 0.014 0.033 0.048 0.091 0.034 0.037 0.029 0.024 0.032
NITRATE & NITRITE D MG/L 13.737 13.618 19.950 30.896 28.464 29.533 12.422 21.882 17.056
NITRATE & NITRITE T MG/L 13.807 13.705 19.390 30.871 30.122 29.625 12.260 22.407 16.344
NITROGEN D MG/L 14.957 15.155 20.069 32.634 28.674 36.872 12.924 22.673 18.664
NITROGEN T MG/L 14.957 14.730 19.008 33.701 29.303 31.374 12.817 22.235 18.653
ORTHO PHOSPHORUS D MG/L 0.126 0.314 0.445 0.478 0.258 0.325 0.668 0.436 0.581
ORTHO PHOSPHORUS T MG/L 0.128 0.317 0.444 0.477 0.260 0.322 0.668 0.453 0.577
PHOSPHORUS D MG/L 0.153 0.329 0.482 0.508 0.274 0.350 0.701 0.476 0.623
PHOSPHORUS T MG/L 0.179 0.348 0.486 0.512 0.281 0.359 0.715 0.510 0.639

Ammonia Toxicity: The toxicity of ammonia in an aquatic environment varies with respect to the temperature and pH of the
water. The ammonia concentrations measured from grab samples were compared to acute and chronic criteria derived from
continuous temperature and pH data and formulas in Table 3 of §93.7(a) (Figure 8 and Table 2). Measured values were well
below these calculated toxicity values.
Figure 8. Calculated acute ammonia toxicity, calculated chronic ammonia toxicity, and measured ammonia concentrations. The
gap in the calculated toxicity values at the end of May is due to the lack of pH and temperature data because of battery failure.
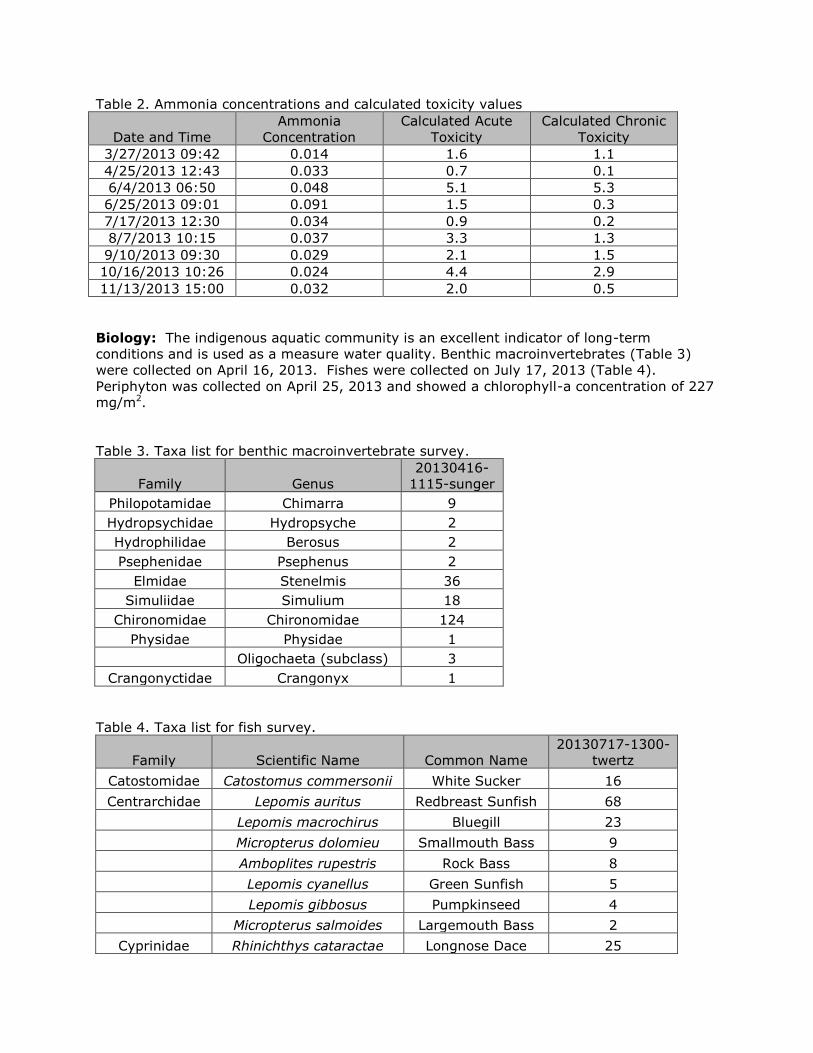
Table 2. Ammonia concentrations and calculated toxicity values
Date and Time
Ammonia
Concentration
Calculated Acute
Toxicity
Calculated Chronic
Toxicity
3/27/2013 09:42 0.014 1.6 1.1
4/25/2013 12:43 0.033 0.7 0.1
6/4/2013 06:50 0.048 5.1 5.3
6/25/2013 09:01 0.091 1.5 0.3
7/17/2013 12:30 0.034 0.9 0.2
8/7/2013 10:15 0.037 3.3 1.3
9/10/2013 09:30 0.029 2.1 1.5
10/16/2013 10:26 0.024 4.4 2.9
11/13/2013 15:00 0.032 2.0 0.5
Biology: The indigenous aquatic community is an excellent indicator of long-term
conditions and is used as a measure water quality. Benthic macroinvertebrates (Table 3)
were collected on April 16, 2013. Fishes were collected on July 17, 2013 (Table 4).
Periphyton was collected on April 25, 2013 and showed a chlorophyll-a concentration of 227
mg/m2.
Table 3. Taxa list for benthic macroinvertebrate survey.
Family Genus
20130416-
1115-sunger
Philopotamidae Chimarra 9
Hydropsychidae Hydropsyche 2
Hydrophilidae Berosus 2
Psephenidae Psephenus 2
Elmidae Stenelmis 36
Simuliidae Simulium 18
Chironomidae Chironomidae 124
Physidae Physidae 1
Oligochaeta (subclass) 3
Crangonyctidae Crangonyx 1
Table 4. Taxa list for fish survey.
Family Scientific Name Common Name
20130717-1300-
twertz
Catostomidae Catostomus commersonii White Sucker 16
Centrarchidae Lepomis auritus Redbreast Sunfish 68
Lepomis macrochirus Bluegill 23
Micropterus dolomieu Smallmouth Bass 9
Amboplites rupestris Rock Bass 8
Lepomis cyanellus Green Sunfish 5
Lepomis gibbosus Pumpkinseed 4
Micropterus salmoides Largemouth Bass 2
Cyprinidae Rhinichthys cataractae Longnose Dace 25

Luxilus cornutus Common Shiner 17
Cyprinella spiloptera Spotfin Shiner 13
Notropis amoenus Comely Shiner 2
Fundulidae Fundulus diaphanus Banded Killifish 7
Ictaluridae Ameiurus natalis Yellow Bullhead 8
Percidae Etheostoma olmstedi Tessellated Darter 2
ASSESSMENT:
Continuous: Data collected by the instream monitor indicated very poor water quality. The
Department takes into consideration the analytical uncertainty of the method used to
measure the data when an ambient measurement is compared to a numeric criterion. This
uncertainty is the product of an instrument’s ability to discriminate between minute
differences in a measurement. In the case of pH, the surface water quality criterion is a
maximum of 9.0 units (Table 3 of §93.7(a)) and the margin of error for the instrument is ±
0.2 units. Therefore, to confidently state that the criterion has been exceeded with this
instrument, a value of 9.2 units is used instead of 9.0 units. This criterion is to be met “at
least 99% of the time” (§96.3(c)). Since parameters were recorded in 30 minute intervals,
176 readings would constitute greater than one percent of a year and represent a violation
of the criterion. Early spring pH was very high with a max of 9.57 units. The 9.2 unit
threshold was exceeded 267 times during this period, representing 1.52% of a year and a
violation of the criterion. Measurements below the minimum criterion for dissolved oxygen
were also recorded during this period. After considering the margin of error of the
instrument, the minimum criterion is 4.7 mg/L. Sixty-three measurements fell below this
value, representing 0.36% of a year. Dissolved oxygen also exhibited extreme diel swings.
Mean production-based diel variation for the period was 6.0 mg/L and the max was 14.6
mg/L. Although there are no state criteria for daily changes in dissolved oxygen, changes of
this degree indicate a highly productive environment, most likely due to excess nutrient
loading. Specific conductance was extremely high reaching a max of 2591 µS/cm during the
period.
Biological: The benthic macroinvertebrate community also indicated very poor water
quality (Table 5). Only 10 taxa were present in the collection, including no stoneflies or
mayflies. Sixty-three percent of the sample was Chironomidae. The fish community was
poor with only 209 individuals collected, and had a noticeable lack of insectivores and
benthic species. The fish community also had a high percentage of pollution tolerant species
such as white sucker, bluegill, banded killifish, and yellow bullhead.
Table 5. Benthic macroinvertebrate metric calculations.
Date IBI Richness Mod EPT HBI
% Dom
% Mod May Beck3
Shannon Div
April 16, 2013 21.8 10 1 5.75 62.6 0 0 1.22

Intra-basin Comparison: Data were collected at two different sites on Skippack Creek
during early spring of 2013. An upstream site was located at the crossing of Route 63 and a
downstream site at the crossing of Ridge Pike (Figure 1). There are three active sewage
discharges in the upstream portion of the basin and an additional four sewage discharges
before the lower site. Specific conductance was considerably higher at Route 63 (Figure 9).
Additionally, nutrient concentrations were significantly greater at this upstream site (Table
6), which likely contributed to the greater diel swings observed (Figure 10). These
differences in water quality were reflected in the biological communities of the two sites.
The macroinvertebrate community indicated poorer water quality at the upper site than the
lower site (IBI scores of 21.8 and 31.7, respectively), and the while the fish community at
both locations was dominated by tolerant species, Skippack Creek at Ridge Pike had a more
balanced fish community with a greater percentage of insectivores. The pH data, however,
was notably higher at the lower site, with considerably more exceedances of the 9.2
criterion (Figure 10).
A third site was located in this basin during early spring of 2013 on Towamencin Creek, a
tributary to Skippack Creek between the upper and lower sites (Figure 1). Data collected at
Towamencin Creek more closely resembled water quality of the upper Skippack Creek site
and therefore do not account for the slight improvement in water quality at the lower site of
Skippack Creek. While water quality does appear to improve at the lower portion of the
basin, these data show a highly impacted watershed with extremely poor water quality
throughout the basin.
Figure 9. Comparison of specific conductance at two Skippack Creek sites.

Table 6. Comparison of nutrients from chemical grab samples.
Parameter Units
3/27/2013 4/25/2013
Route 63 Ridge Pike Route 63 Ridge Pike
NITRATE & NITRITE D MG/L 13.737 3.522 13.618 4.275
NITRATE & NITRITE T MG/L 13.807 3.515 13.705 4.248
NITROGEN D MG/L 14.957 4.172 15.155 4.843
NITROGEN T MG/L 14.957 4.074 14.730 4.905
ORTHO PHOSPHORUS D MG/L 0.126 0.023 0.314 0.111
ORTHO PHOSPHORUS T MG/L 0.128 0.026 0.317 0.114
PHOSPHORUS D MG/L 0.153 0.034 0.329 0.121
PHOSPHORUS T MG/L 0.179 0.052 0.348 0.135
Figure 10. Comparison of daily dissolved oxygen range at two Skippack Creek sites.

Figure 11. Comparison of daily maximum pH at two Skippack Creek sites.
SUMMARY:
This section of Skippack Creek is currently impaired for aquatic life, citing nutrients, siltation
and excessive algal growth due to small residential runoff. Continuous monitoring, in-situ
lab chemistries, and biological data from this report all support poor water quality conditions
in Skippack Creek. Recorded pH data violated the criterion listed in Table 3 of §93.7(a),
while extremely high specific conductance and increased dissolved oxygen swings further
characterized a highly impacted watershed. These conditions are expressed through the
extremely poor macroinvertebrate community and the small fish community dominated by
tolerant species. A comparison of multiple sites within the basin revealed marginally worse
water quality at this upper site within the Skippack Creek basin; however, water quality
throughout the watershed has been shown to be highly influenced by human activity.

LITERATURE CITED
PA DEP. 2013. Instream Comprehensive Evaluations (ICE).
http://files.dep.state.pa.us/Water/Drinking%20Water%20and%20Facility%20Regulation/W
aterQualityPortalFiles/Methodology/2013%20Methodology/ICE.pdf
PA DEP. 2013. Continuous Instream Monitoring Protocol.
http://files.dep.state.pa.us/Water/Drinking%20Water%20and%20Facility%20Regulation/W
aterQualityPortalFiles/Methodology/2013%20Methodology/CIM_PROTOCOL.pdf