Embed Size (px)
Citation preview
31.5.2012
1
INVESTIGATING EFFECTS IN GPS TIME SERIES AND CASE STUDY ON TROPOSPHERIC EFFECTS
İsmail ŞANLIOĞLU and Tahsin KARA, [email protected]@gmail.com
CONTENTS OF PRESENTATION
INTRODUCTION TIME SERIES TYPES OF TIME SERIES IN PERMANENT GNSS STATIONS FACTORS
AFFECTING TIME SERIES NUMERICAL APPLICATION CONCLUSIONS

31.5.2012
2
INTRODUCTION
Time series are a set of values and observed measurementsover a period of time, For example, a weekly amount of productexported from the factory, a highway accidents that occurannually, seasonal sea-level height, a fixed point is an exampleof an annual time series of coordinate changes. The use oftime series can be expressed in the form of reporting results ofthe forward predictive with established by the mathematicalmodels or in unknown time intervals in any way before thetemporal data obtained from measurements made at regularintervals or with expected to occur in the future situation.
INTRODUCTION
Time series analysis is of great importance in the field ofengineering. We consider that a very high cost and labor-intensive seen in their realization of the plan-project phasesand steps of structures such as dams, bridges, towers and toensure the continuation of engineering structures. Thesestructures show a different behavior in life expectancy underdifferent loads, such as deformation and displacement. Thenecessary measures will be provided in time with continuousmonitoring of behavior and with this pre-determination of thepossible accidents that may occur.

31.5.2012
3
TIME SERIES
At the periodic points of time, collecting data throughobservation of a response variable is called a time series(Sincich 1996). Time series appear while saving sequentialvalues of variable in clear time space. Free variable can changecontent of study topic in time series. It can appear as inGeodesy science changes of coordinate components, ineconomy science this wholesale price index yearly, exporting ofone product yearly for any firm. Data recording space is usuallyacceptable equal. However, in the practice usually come uponwith no equal time series. This situation creates problems inanalysis step.
TIME SERIES
Time series analysis produces summarizationproperties of a series and outstanding of a seriesstructure. This process can handle in frequencydimension like the time dimension. In other words,while frequency dimension periodic moves canconsider, in the time dimension is given point toappearance of between different observations ontime’s different points. Both of the dimension analysishas properties vitals and same knowledge givesdifferent ideas about a time series’ qualitative indifferent ways.

31.5.2012
4
TIME SERIES
In statistics, signal processing, econometrics and mathematicalfinance, a time series is a sequence of data points, measuredtypically at successive time instants spaced at uniform timeintervals. Time series analysis comprises methods for analyzingtime series data in order to extract meaningful statistics andother characteristics of the data. Time series forecasting is theuse of a model to predict future values based on previouslyobserved values. Time series are very frequently plotted via linecharts.
TIME SERIES In a classical model, time serial has a four component
(Mann 1995). Long-term common trend, T Conjecture wave, C Seasonal wave, S Variation and irregular randomly motions, I
Y=T.C.S.I
Time series aim for statically is investigation ofmentioned above each of four components how mucheffective take value on the event.

31.5.2012
5
TIME SERIES
Trend is naming which a time series shows a clear route tendency. If trend components find in time series, conforming of line or curve equation with LSM could obtain for separation of this component from series.
Few method’s using for calculate of Trend. The graphical method Moving averages method Principle of least squares method
TYPES OF TIME SERIES
Autocorrelation function Partial autocorrelation function The moving average (Moving Average, MA) series Autoregressive (auto regressive, R) series Difference equations Autoregressive moving average (ARMA) series Holt-Winters exponential smoothing forecasting model The Fourier technique and seasonal time series.

31.5.2012
6
IN PERMANENT GNSS STATIONS FACTORS AFFECTING TIME SERIES
The effect of satellites, The long-term multipath effects, Atmospheric effects, Hardware effects, Seasonal effect (ocean loading, streams of ocean, tidal
effect, glacial effects, ocean stream, Tropospheric effects (temperature and pressure), Earthquake effect (postsismic, co-sismic and inrtersismic
effect), fault movements Global plate movements etc.
NUMERICAL APPLICATION
Time series raw data of IGNSS stations in Turkey
ANKR (20805M002), TUBI (20806M001), ISTA (20807M001), TRAB (20808M001),

31.5.2012
7
NUMERICAL APPLICATION
GNSS station used in time series analysis
NUMERICAL APPLICATION
The raw data of N (North), E (East) ve U (Up) local coordinates components of these stations from the Scripps Orbit and Permanent Array Center (SOPAC) GPS archive (web-1, 2009).

31.5.2012
8
NUMERICAL APPLICATION
Dates of the data cover the period from 26/06/1995 to 12/21/2008
in ANKR station, the period from 21/12/1995 to 08/05/1998
in TUBI station, the period from 26/12/1999 to 12/21/2008
in ISTA station, the period from 26/12/1999 to 28/11/2007
in TRAB station.
NUMERICAL APPLICATION

31.5.2012
9
NUMERICAL APPLICATION Up component of four stations’ coordinate time series is similar to the
periodic due to seasonal effects and it appears to have been seen toact. In addition, the unusual changes were noticed in up componentand these changes that changes caused by earthquakes are assumed.Firstly, the data interruptions of stations and gaps in time series wereexamined. For these gaps and interruptions, time series were analyzed.The long-term discontinuities in the stations were analyzed separatelyfor different ranges of epochs.
Then V-test was performed to determine outliers. Thus the outliers wereeliminated from time series. Then, in height component of time series,periodic changes or seasonal effects were detected. So covering theyears 1995 and 2008 daily average temperature and pressure valuesof four stations were obtained from General Directorate of StateMeteorology Affairs. Regression analysis of height component wasperformed with according to the average pressure and averagetemperatures.
NUMERICAL APPLICATION
In the measures made for sample the elements x1, x2, ...., xn, V-statistics is used to examine the values showing the greatest difference whether belonging to the same set or not.
For the implementation of this test
S root mean square of value must be calculated. Here V;

31.5.2012
10
NUMERICAL APPLICATION
V - Statistics were performed separately for every period ofapplication because of big range of data. The purpose of thistest, one can understand whether the series are stationary ornot when one investigate the long periodic time series. As aresult, values not outlying must stay in the own time series.
According to V-statistics, outliers were extracted from timeseries of four station .In table 1 outliers of ISTA station areseen. There is much outlier in the other stations. But in thispaper other outlier tables are not presented because of bigtables.
NUMERICAL APPLICATION

31.5.2012
11
NUMERICAL APPLICATION
Regression Analysis of height components in ANKR, TUBI,ISTA ant TRAB GNSS Stations with average temperatureand pressure
Each station’s average temperature and pressure valueswith height components are shown in the graphics e.g. inFigure 3 and Figure 4 TRAB station height componentswith temperature and pressure values. In these graphics ycolumn is no unit. Two variables multiplied by specificcoefficients for better understanding of the visual. Then,regression analysis of height component was performedwith according to the average pressure and averagetemperatures
NUMERICAL APPLICATION

31.5.2012
12
NUMERICAL APPLICATION
NUMERICAL APPLICATION
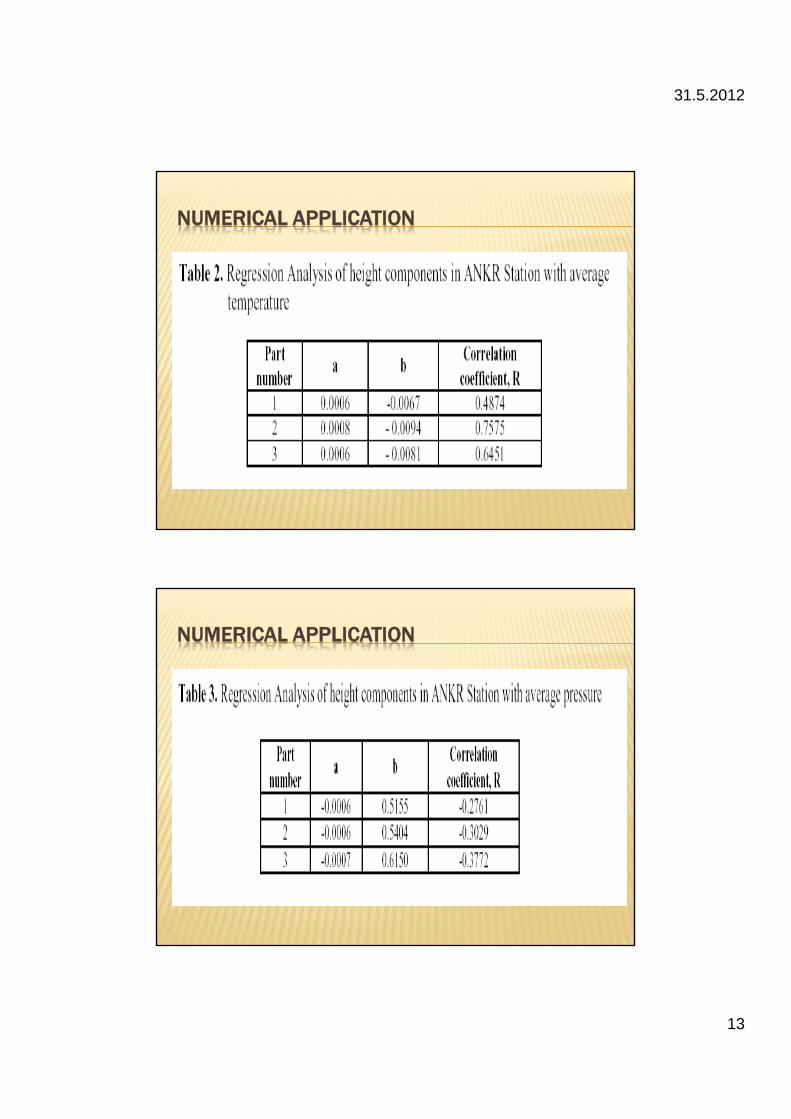
Regression Analysis in ANKR Station ANKARA station data was divided into three parts because of
long term gaps and regression analysis was made separatelyfor the three sections. The first part of ANKR station, the datescover the period from 13.08.1999 to 26.06.1995. The secondpart, the dates cover the period from 17.03.2004 to25.11.2000. The third part, dates cover the period from30.11.2007 to 20.07.2004. In table 2, regression analysiscoefficients and correlation coefficient with temperature areseen as y=ax+b regression equation. In table 3, regressionanalysis coefficients and correlation coefficient with pressureare seen as y=ax+b
31.5.2012
13
NUMERICAL APPLICATION
NUMERICAL APPLICATION

31.5.2012
14
NUMERICAL APPLICATION
First part of ANKR Station regression line of height componentswith average temperature
NUMERICAL APPLICATION
First part of ANKR Station regression line of height components with average pressure

31.5.2012
15
NUMERICAL APPLICATION
Regression Analysis in Other Stations
CONCLUSIONS
One of the non secular behaviors often observed in GPS timeseries is the periodic variations with an annual period. Themost obvious environmental factors with such period aretemperature and pressure. Non-uniform temperaturedistributions and pressure of Earth surface due to solarradiation and tropospheric layer can cause thermal stress,expansion, subsidence and hence change in displacementsand instability at the geodetic sites.

31.5.2012
16
CONCLUSIONS
In this study, we analyzed time series of GPS stations withtemperature and pressure variations in a longer period of time.The GPS time series of stations lead us to assume that thedisplacement change of the GNSS station due to temperatureand pressure. Also there is a linear correlation between heightcomponent of station coordinates and temperature. On theother hand inverse correlation between height component ofstation coordinates and pressure has been seen.
Thank you for listening


![Dnevni list [broj 3895, 31.5.2012]](https://img.dokumen.tips/doc/110x75/544a8c1baf7959b0438b49c9/dnevni-list-broj-3895-3152012.jpg)


![037 Plus [broj 117, 31.5.2012]](https://img.dokumen.tips/doc/110x75/577d1d621a28ab4e1e8c2721/037-plus-broj-117-3152012.jpg)