Embed Size (px)
Citation preview

1
Consolidated Business Performancefor the First Half of the Fiscal Year
Ending March 2014(Fiscal 2014)
November 7, 2013
1. Consolidated Business Performance for theFirst Half of FY2014
2. Segment Information◆Business Segments◆Profitability Improvement Progress◆Geographic Segments◆Topics by Region
3. Consolidated Full-Year Forecasts for FY2014
1
Contents

2
Consolidated Business Performance for the First Half of FY2014
2
Consolidated Business Performance for the First Half of FY2014
Sales
OperatingIncome
OrdinaryIncome
Net Income
First half FY2013Ratio to sales
228.2
12.5 5.5%
12.05.3%
-7.9 -3.5%
First halfFY2014
(Results)
249.6
14.3 5.8%
14.15.7%
12.2 4.9%
YoY change% change
+21.3+9.4%
+1.8+14.6%
+2.2+17.9%
+20.1-
First half FY2014
(Announced targets)
(August 21)
252.0
14.65.8%
13.85.5%
10.24.0%
(Billions of yen)
33
3
Consolidated Business Performance for the First Half of FY2014
44
【Sales】 +¥21.3 billionJapan: +¥2.4 billion Industrial Gases -¥1.6 billion, Electronics +¥1.2 billion
Energy +¥1.1 billion, Other +¥1.7 billionOverseas: +¥18.9 billion North America +¥12.0 billion, Asia +¥6.9 billion
(Exchange rate effects: +¥12.8 billion [North America +¥9.5 billion, Asia +¥3.3 billion])
【Operating Income】 +¥1.8 billionJapan: -¥0.2 billion Electronics earnings recovered, plants and machinery sales
decreased Overseas: +¥2.1 billion North America +¥1.6 billion, Asia +¥0.4 billion(Exchange rate effects: +¥0.68 billion [North America +¥0.45 billion, Asia +¥0.23 billion])
【Ordinary Income】 +¥2.2 billionInvestment return from equity: +¥0.26 billion
Analysis of year-on-year change (1)
Consolidated Business Performance for the First Half of FY2014
55
[Extraordinary Gain and Loss (before tax)] +¥29.4 billionFY2013 Loss on liquidation of business + ¥23.5 billionFY2014 Gain on sale of Shimbashi building and others + ¥3.8 billion
Gain on sales of investment securities + ¥3.2 billionLoss on liquidation of a subsidiary - ¥0.5 billionEarly retirement expenses - ¥0.3 billionLoss on valuation of investment securities - ¥0.3 billion
[Net Income] +¥20.1 billion
Analysis of year-on-year change (2)
4
Consolidated Business Performance for the First Half of FY2014
66
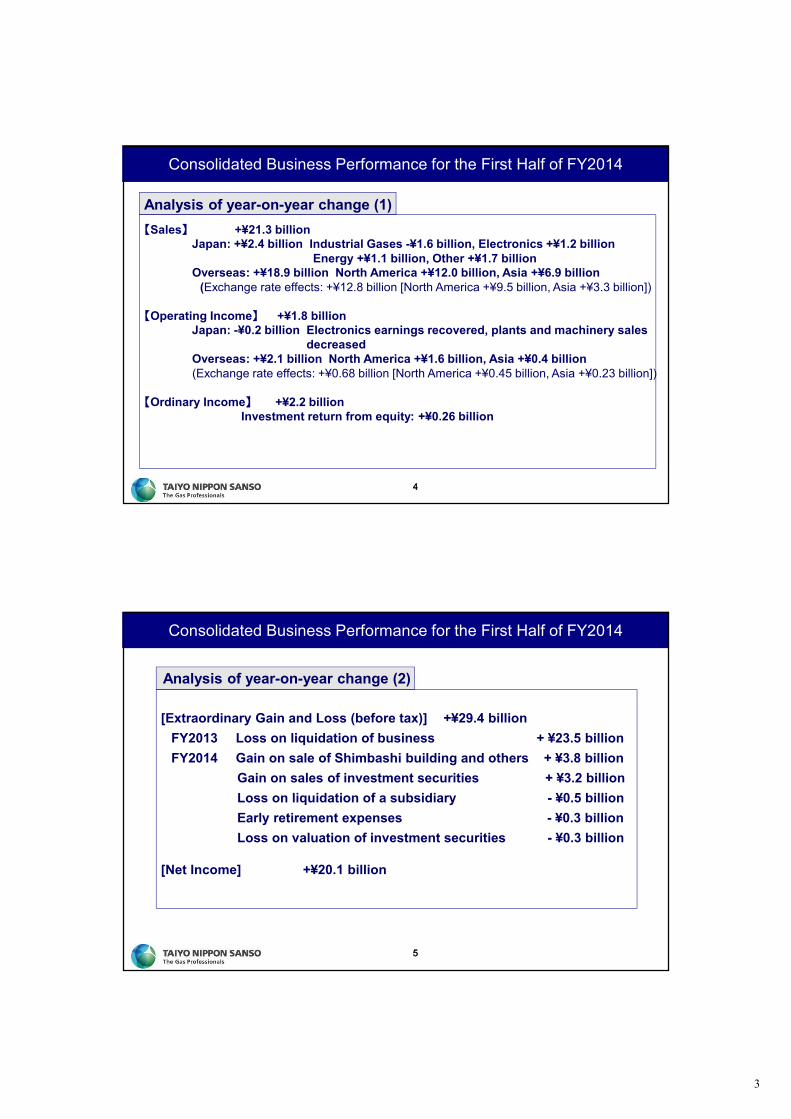
・Depreciation and amortization:Increased due to exchange rate effects, new consolidation, and investments in plant and equipment overseas
・Free cash flow (FCF):Drastic increase due to decrease in income taxes paid and gain on sales of fixed assets
・Net debt:Decreased compared with end of previous fiscal year due to increase in FCF, despite yen-dollar exchange rate that was a factor for increase (+¥9.5 billion)
⇒Net D/E ratio:At less than one times due to shareholders’ equity increase
FY2013First half
FY2014First half Change
Capital expenditure 15.9 13.6 -2.3Equity investments 1.7 0.7 -1.0Depreciation andamortization 15.6 18.3 2.7 (Amortization of goodwill) 1.2 1.6 0.4FCF (operating cash flow-investment cash flow) -1.1 14.9 16.0
March 2013 September2013 Change
Total assets 615.8 652.7 36.9Shareholders' equity 203.7 232.2 28.5Net debt 228.6 227.1 -1.5Net D/E ratio 1.12 0.98 -0.14
Other results(Billions of yen)
Performance by Segment
7

5
First Half of FY2014 Performance by Business Segments
(Billions of yen)
First Half of FY2013
Margin
First Half of FY2014
Margin
SalesOperating
IncomeSales
OperatingIncome
Industrial Gas 148.3 11.2 7.6% 163.9 10.6 6.5%Electronics 46.1 -0.6 -1.3% 48.5 2.2 4.6%
Energy 17.4 0.7 4.4% 18.5 0.6 3.4%Other 16.3 1.7 10.8% 18.5 1.5 8.2%Adjustments -0.6 -0.6Consolidated 228.2 12.5 5.5% 249.6 14.3 5.8%
8
Industrial Gas Segment (Billions of yen)
9
Bulk/On-siteJapan: On-site demands from steel and chemicals were
strong, but liquefied gas was down year on year due to sluggish demands
Overseas: Large increase due to exchange rate effects and volume increases in North America, and new consolidations in Asia
SalesOperating
Incom eMargin Sales
OperatingIncom e
Margin SalesOperating
Incom eSegment Total 148.3 11.2 7.6% 163.9 10.6 6.5% 10.6% -5.2%
Japan 98.1 96.5 -1.6%Overseas 50.2 67.4 34.4%
Bulk /On-s ite 80.0 85.1 6.5%Japan 64.8 65.2 0.6%
Overseas 15.1 19.9 31.4%Packaged 48.4 57.9 19.5%
Japan 15.2 14.7 -3.2%Overseas 33.2 43.2 29.9%
Plants andequipment 19.7 20.7 5.2%
Japan 18.0 16.5 -8.2%Overseas 1.7 4.2 145.0%
First Hal f o f FY2013 Fi rst Hal f o f FY2014 Change
PackagedOverseas: Exchange rate effects and volume increases in
North AmericaPlants and equipment
Japan: Decrease in plant ordersOverseas: Revenue increase owing to Leeden Limited

6
Electronics Segment
10
GasesJapan: Sales of specialty gases and argon gas continued to decreaseOverseas: Revenue increased due to exchange rate effects in North America/Asia
Equipment and InstallationJapan: Installation sales increased and MOCVD was delivered to Nagoya Institute of TechnologyOverseas: Sales decreased in Taiwan
(Billions of yen)
SalesOperating
Incom eMargin Sales
OperatingIncom e
Marg in SalesOpera ting
Incom eSegm ent Tota l 46.1 -0.6 -1.3% 48.5 2.2 4.6% 5.2% -
Japan 35.6 36.8 3.3%Overseas 10.4 11.6 11.6%
Gases 35.4 35.9 1.2%Japan 26.2 25.4 -3.3%
Overseas 9.2 10.5 13.8%Equipm ent andInstal lation 10.5 12.5 18.5%
Japan 9.3 11.4 21.6%Overseas 1.2 1.1 -5.3%
Fi rst Hal f of FY2013 First Ha l f of FY2014 Change
Energy Segment
11
GasesConsumer demand declined amid higher-than-average temperatures throughout the spring and summerPurchasing costs increased due mainly to the weak yen, and sales prices rose in line with higher purchasing
(Billions of yen)
SalesOperating
Incom eMarg in Sales
OperatingIncom e
Marg in SalesOperating
Incom e
Segm ent Tota l 17.4 0.7 4.4% 18.5 0.6 3.4% 6.4% -18.4%
Gases 15.6 16.9 8.0%
Related Equipm ent 1.7 1.6 -7.8%
First Hal f of FY2013 First Hal f o f FY2014 Change

7
Other Segment
12
MedicalGas-related sales were steadyEquipment-related sales to hospitals and home healthcare equipment sales were steady
ThermosNew product sales were strong
(Billions of yen)
SalesOperating
Incom eMargin Sales
OperatingIncom e
Margin SalesOperating
Incom eSegm ent Tota l 16.3 1.7 10.8% 18.5 1.5 8.2% 13.2% -14.8%
Japan 15.8 17.6 11.4%Overseas 0.5 0.9 80.0%
Medica l 8.5 8.9 5.4%Japan 8.5 8.9 5.4%
Overseas 0.0 0.0 -Therm os 6.6 8.2 24.2%
Japan 6.1 7.4 21.3%Overseas 0.5 0.8 70.4%
Other 1.2 1.2 4.1%Japan 1.2 1.2 4.1%
Overseas 0.0 0.0 -
First Ha l f o f FY2013 First Ha l f o f FY2014 Change
Profitability Improvement Progress(Billions of yen)
FY2014Full-Year
Target
First Half of FY2014 Results
Improve profitability of industrial gases in response to electric power rate hikes 0.5 -0.01
Strengthen partnerships with distributors 0.8 0.0
Improve profitability in the domestic electronics businesses 0.8 0.6
Improve profitability of the North American business 2.5 *1.61
Expand our business in Asia 0.5 *0.48
Total 5.1 2.68
13* Results for the first half includes effects of exchange rates and new consolidations

8
First Half of FY2014Performance by Geographic Segment
(Billions of yen)
First Half of FY2013Margin
First Half of FY2014Margin
Sales Operating Income Sales Operating
IncomeJapan 167.0 11.1 6.7% 169.5 10.8 6.4%North America 45.4 1.0 2.4% 57.4 2.7 4.7%Other 15.7 0.8 5.5% 22.6 1.3 6.0%Adjustments -0.5 -0.5Consolidated 228.2 12.5 5.5% 249.6 14.3 5.8%
14
Topics by Region
Japan◆Medical Business Expansion
◆Development Project Progress
North America◆Plant Capacity Expansion
Asia◆New Market Development
15
9
Medical Business Expansion (Japan)
16
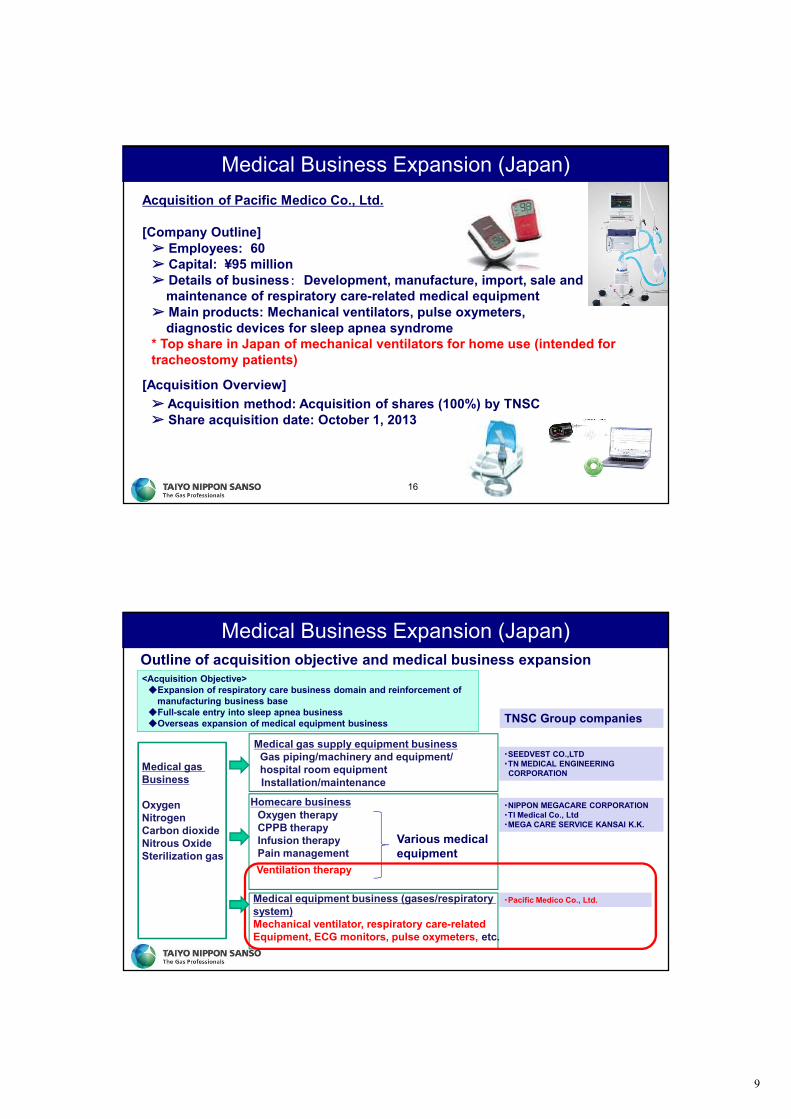
Acquisition of Pacific Medico Co., Ltd.
[Company Outline]➢ Employees: 60➢ Capital: ¥95 million➢ Details of business: Development, manufacture, import, sale and
maintenance of respiratory care-related medical equipment➢ Main products: Mechanical ventilators, pulse oxymeters,
diagnostic devices for sleep apnea syndrome * Top share in Japan of mechanical ventilators for home use (intended for tracheostomy patients)
[Acquisition Overview]➢ Acquisition method: Acquisition of shares (100%) by TNSC➢ Share acquisition date: October 1, 2013
Medical Business Expansion (Japan)
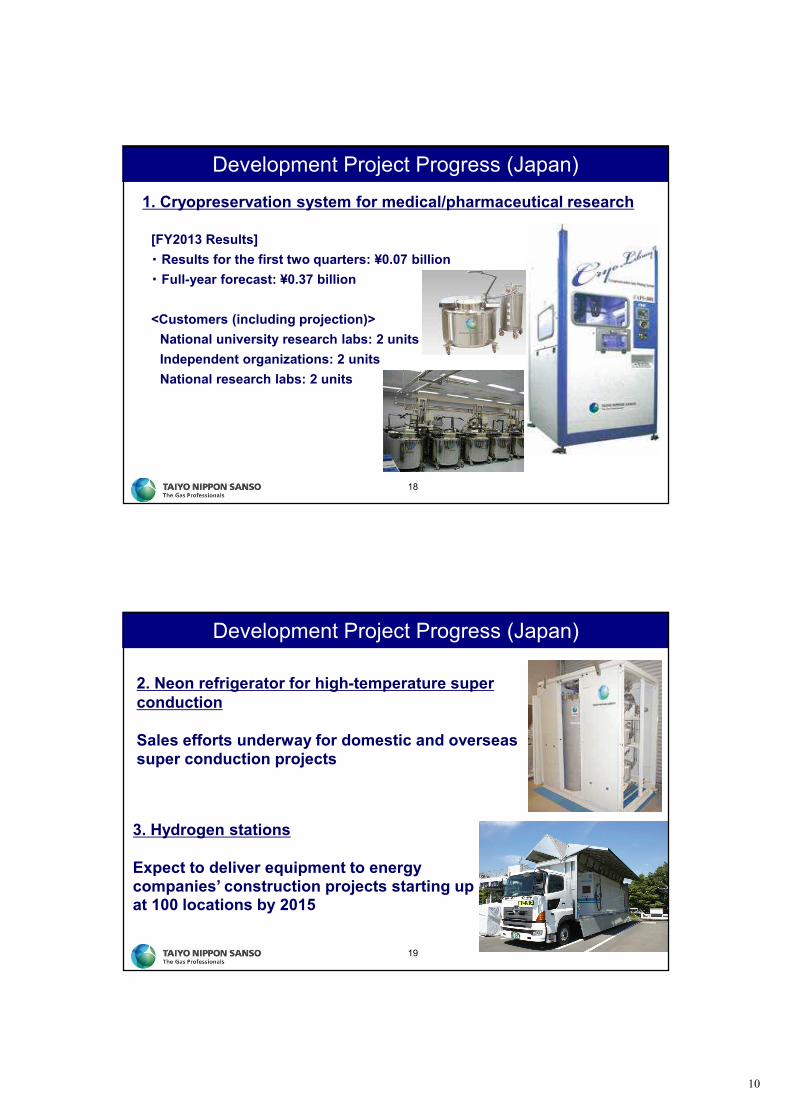
<Acquisition Objective>◆Expansion of respiratory care business domain and reinforcement of
manufacturing business base◆Full-scale entry into sleep apnea business◆Overseas expansion of medical equipment business
Medical gas Business
OxygenNitrogenCarbon dioxideNitrous OxideSterilization gas
・SEEDVEST CO.,LTD ・TN MEDICAL ENGINEERING
CORPORATION
・NIPPON MEGACARE CORPORATION・TI Medical Co., Ltd・MEGA CARE SERVICE KANSAI K.K.
Medical gas supply equipment businessGas piping/machinery and equipment/hospital room equipmentInstallation/maintenance
Homecare businessOxygen therapyCPPB therapyInfusion therapyPain managementVentilation therapy
・Pacific Medico Co., Ltd.Medical equipment business (gases/respiratory system)Mechanical ventilator, respiratory care-relatedEquipment, ECG monitors, pulse oxymeters, etc.
Outline of acquisition objective and medical business expansion
TNSC Group companies
Various medical equipment
10
Development Project Progress (Japan)
18
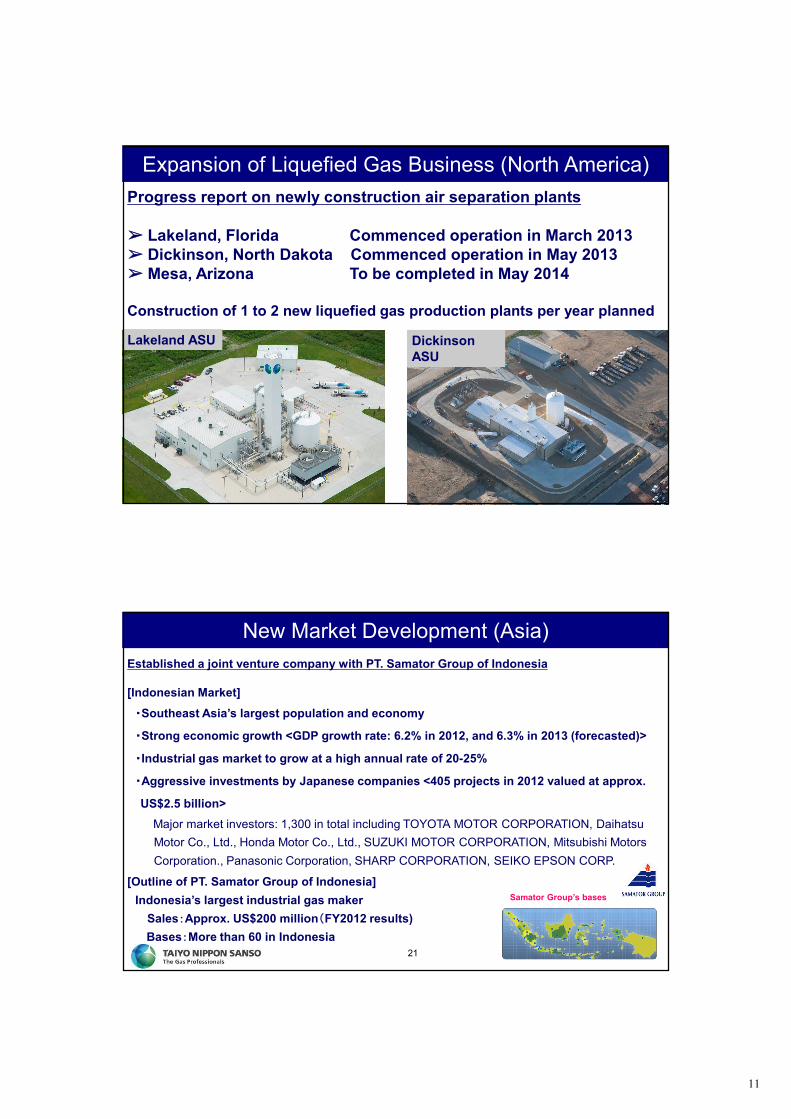
1. Cryopreservation system for medical/pharmaceutical research
[FY2013 Results]・ Results for the first two quarters: ¥0.07 billion・ Full-year forecast: ¥0.37 billion
<Customers (including projection)>National university research labs: 2 unitsIndependent organizations: 2 unitsNational research labs: 2 units
Development Project Progress (Japan)
19
2. Neon refrigerator for high-temperature superconduction
Sales efforts underway for domestic and overseassuper conduction projects
3. Hydrogen stations
Expect to deliver equipment to energy companies’ construction projects starting upat 100 locations by 2015
11
Expansion of Liquefied Gas Business (North America)
20
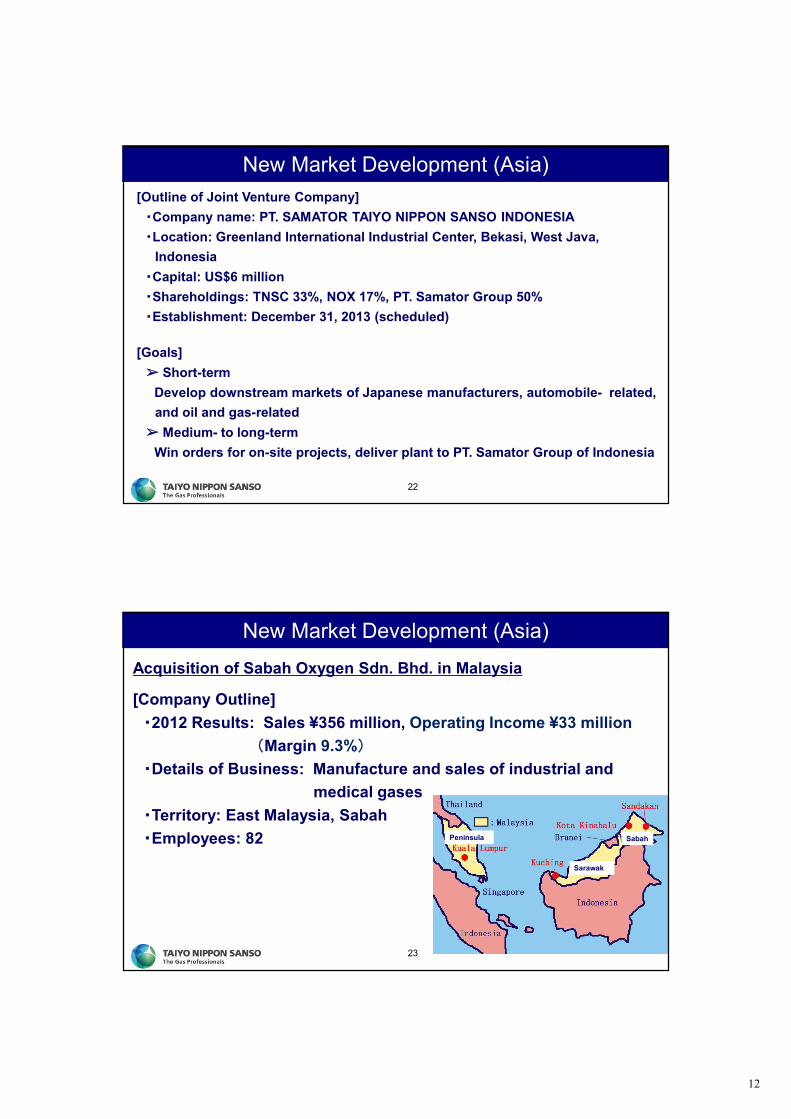
Progress report on newly construction air separation plants
➢ Lakeland, Florida Commenced operation in March 2013➢ Dickinson, North Dakota Commenced operation in May 2013➢ Mesa, Arizona To be completed in May 2014
Construction of 1 to 2 new liquefied gas production plants per year planned
Dickinson ASU
Lakeland ASU
New Market Development (Asia)
21
Established a joint venture company with PT. Samator Group of Indonesia
[Indonesian Market]・Southeast Asia’s largest population and economy
・Strong economic growth <GDP growth rate: 6.2% in 2012, and 6.3% in 2013 (forecasted)>
・Industrial gas market to grow at a high annual rate of 20-25%
・Aggressive investments by Japanese companies <405 projects in 2012 valued at approx.
US$2.5 billion>Major market investors: 1,300 in total including TOYOTA MOTOR CORPORATION, Daihatsu Motor Co., Ltd., Honda Motor Co., Ltd., SUZUKI MOTOR CORPORATION, Mitsubishi Motors Corporation., Panasonic Corporation, SHARP CORPORATION, SEIKO EPSON CORP.
[Outline of PT. Samator Group of Indonesia]Indonesia’s largest industrial gas maker
Sales:Approx. US$200 million(FY2012 results) Bases:More than 60 in Indonesia
Samator Group’s bases
12
New Market Development (Asia)
22
[Outline of Joint Venture Company]・Company name: PT. SAMATOR TAIYO NIPPON SANSO INDONESIA・Location: Greenland International Industrial Center, Bekasi, West Java,
Indonesia・Capital: US$6 million・Shareholdings: TNSC 33%, NOX 17%, PT. Samator Group 50%・Establishment: December 31, 2013 (scheduled)
[Goals]➢ Short-term
Develop downstream markets of Japanese manufacturers, automobile- related, and oil and gas-related➢ Medium- to long-term
Win orders for on-site projects, deliver plant to PT. Samator Group of Indonesia
New Market Development (Asia)
23
Acquisition of Sabah Oxygen Sdn. Bhd. in Malaysia
[Company Outline]・2012 Results: Sales ¥356 million, Operating Income ¥33 million
(Margin 9.3%)・Details of Business: Manufacture and sales of industrial and
medical gases ・Territory: East Malaysia, Sabah・Employees: 82
Sarawak
SabahPeninsula
13
New Market Development (Asia)
24
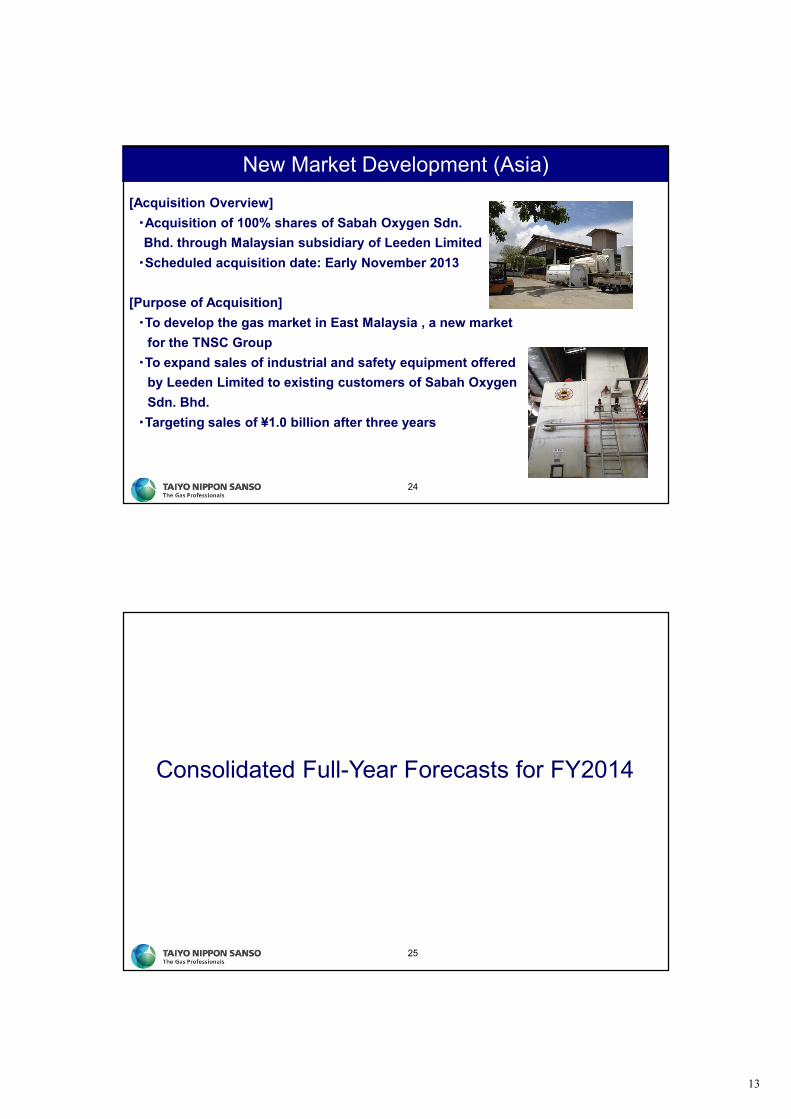
[Acquisition Overview]・Acquisition of 100% shares of Sabah Oxygen Sdn. Bhd. through Malaysian subsidiary of Leeden Limited ・Scheduled acquisition date: Early November 2013
[Purpose of Acquisition]・To develop the gas market in East Malaysia , a new market
for the TNSC Group・To expand sales of industrial and safety equipment offered
by Leeden Limited to existing customers of Sabah Oxygen Sdn. Bhd.・Targeting sales of ¥1.0 billion after three years
Consolidated Full-Year Forecasts for FY2014
25
14
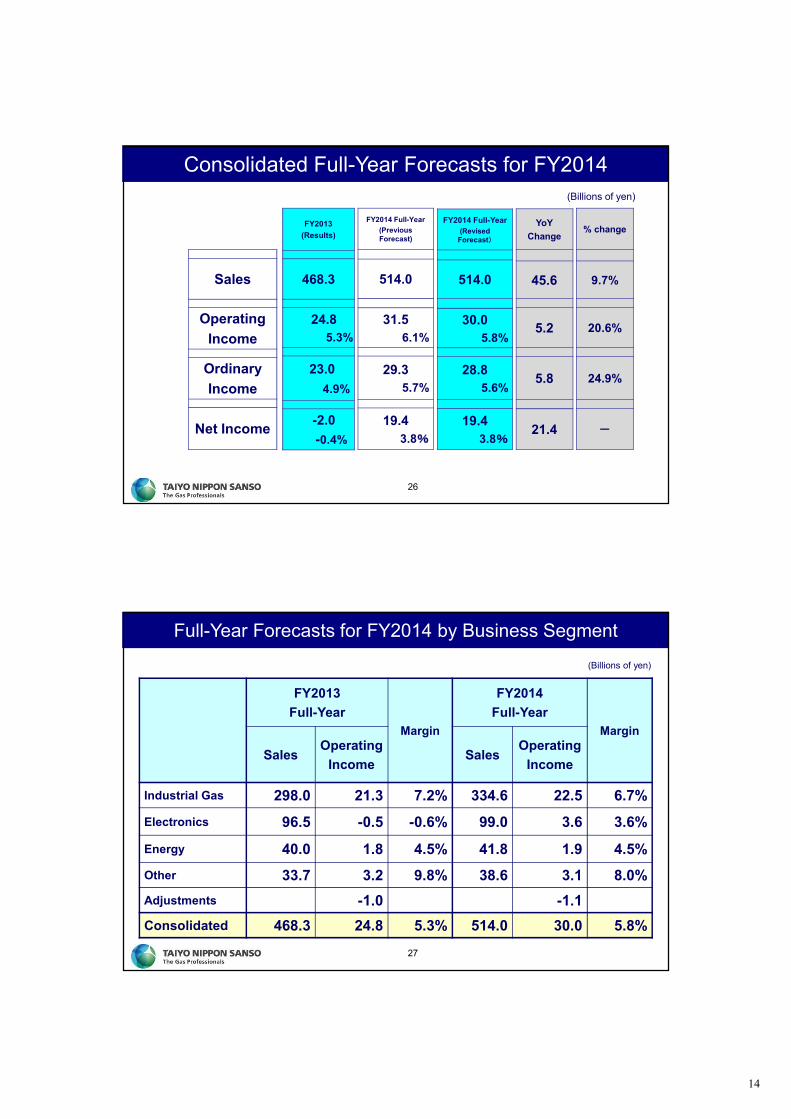
(Billions of yen)
Sales
OperatingIncome
OrdinaryIncome
Net Income
FY2013(Results)
468.3
24.8 5.3%
23.04.9%
-2.0 -0.4%
FY2014 Full-Year(Previous Forecast)
514.0
31.56.1%
29.35.7%
19.43.8%
YoYChange
45.6
5.2
5.8
21.4
% change
9.7%
20.6%
24.9%
-
Consolidated Full-Year Forecasts for FY2014
26
FY2014 Full-Year(Revised
Forecast)
514.0
30.05.8%
28.85.6%
19.43.8%
Full-Year Forecasts for FY2014 by Business Segment
(Billions of yen)
27
FY2013Full-Year
Margin
FY2014Full-Year
Margin
SalesOperating
IncomeSales
OperatingIncome
Industrial Gas 298.0 21.3 7.2% 334.6 22.5 6.7%Electronics 96.5 -0.5 -0.6% 99.0 3.6 3.6%
Energy 40.0 1.8 4.5% 41.8 1.9 4.5%Other 33.7 3.2 9.8% 38.6 3.1 8.0%Adjustments -1.0 -1.1Consolidated 468.3 24.8 5.3% 514.0 30.0 5.8%
15
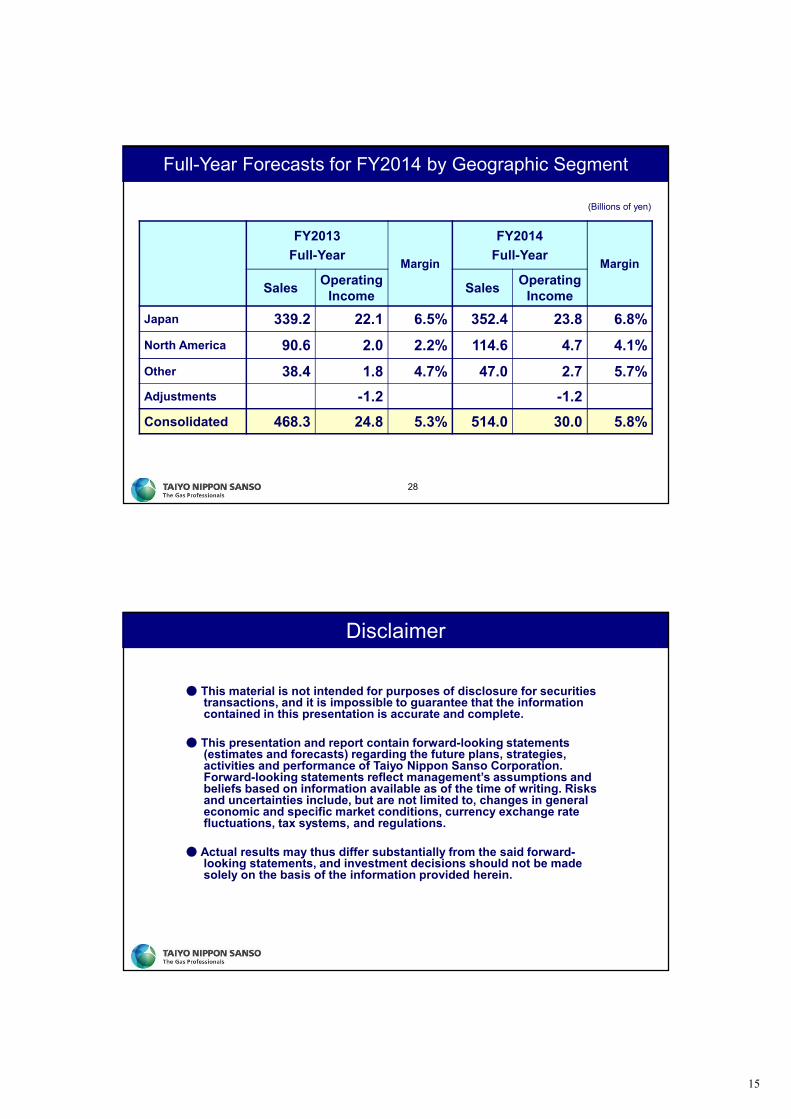
Full-Year Forecasts for FY2014 by Geographic Segment
(Billions of yen)
28
FY2013Full-Year Margin
FY2014Full-Year Margin
Sales Operating Income Sales Operating
IncomeJapan 339.2 22.1 6.5% 352.4 23.8 6.8%North America 90.6 2.0 2.2% 114.6 4.7 4.1%Other 38.4 1.8 4.7% 47.0 2.7 5.7%Adjustments -1.2 -1.2Consolidated 468.3 24.8 5.3% 514.0 30.0 5.8%
● This material is not intended for purposes of disclosure for securities transactions, and it is impossible to guarantee that the information contained in this presentation is accurate and complete.
● This presentation and report contain forward-looking statements (estimates and forecasts) regarding the future plans, strategies, activities and performance of Taiyo Nippon Sanso Corporation. Forward-looking statements reflect management’s assumptions and beliefs based on information available as of the time of writing. Risks and uncertainties include, but are not limited to, changes in general economic and specific market conditions, currency exchange rate fluctuations, tax systems, and regulations.
● Actual results may thus differ substantially from the said forward-looking statements, and investment decisions should not be made solely on the basis of the information provided herein.
Disclaimer