Embed Size (px)
Citation preview

Kansas Hazard Mitigation Plan Final 3-1 2018
Contents Chapter 3 Risk Assessment ................................................................................................................ 3
3.1 Exposure and Analysis of State Development Trends ................................................................. 5
3.1.1. Growth ..................................................................................................................................... 5
3.1.2. Population ................................................................................................................................ 5
3.1.3 Social Vulnerability................................................................................................................ 24
3.1.4. Land Use and Development Trends .................................................................................... 27
3.1.5. Exposure of Built Environment/Cultural Resources ......................................................... 35
3.2. Hazard Identification ................................................................................................................... 48
3.2a. Potential Climate Change Impacts on the 22 Identified Hazards in Kansas ........................ 63
3.3. Hazard Profiles and State Risk Assessment .............................................................................. 65
3.3.1. Agricultural Infestation ........................................................................................................ 68
3.3.2. Civil Disorder ........................................................................................................................ 87
3.3.3. Dam and Levee Failure ......................................................................................................... 93
3.3.4. Drought ................................................................................................................................ 152
3.3.5. Earthquake .......................................................................................................................... 176
3.3.6. Expansive Soils .................................................................................................................... 203
3.3.7. Extreme Temperatures ....................................................................................................... 207
3.3.8. Flood ..................................................................................................................................... 226
3.3.9. Hailstorm ............................................................................................................................. 296
3.3.10. Hazardous Materials ......................................................................................................... 318
3.3.11. Land Subsidence ............................................................................................................... 342
3.3.12. Landslide ............................................................................................................................. 358
3.3.13. Lightning ............................................................................................................................ 364
3.3.14. Major Disease Outbreak .................................................................................................. 380
3.3.15. Radiological ....................................................................................................................... 397
3.3.16. Soil Erosion and Dust ....................................................................................................... 403
3.3.17. Terrorism/Agri-Terrorism ................................................................................................ 409
3.3.18. Tornado ............................................................................................................................... 417
3.3.19. Utility/Infrastructure Failure ........................................................................................... 453
3.3.20. Wildfire .............................................................................................................................. 470
3.3.21. Windstorm ........................................................................................................................... 486

Kansas Hazard Mitigation Plan Final 3-2 2018
3.3.22. Winter Storm ..................................................................................................................... 509
3.4. Integration of Local Plans: Vulnerability and Loss Estimates ............................................. 534
3.4.1. Overview and Analysis of Local Plan Vulnerability Assessments .................................. 534
3.4.2. Overview and Analysis of Local Plan Potential Loss Estimates ..................................... 548
3.5. State Owned and Operated Facilities: Vulnerability and Loss Estimates ............................. 556
3.5.1. Agricultural Infestation ....................................................................................................... 564
3.5.2. Civil Disorder ....................................................................................................................... 564
3.5.3. Dam and Levee Failure ......................................................................................................... 566
3.5.4. Drought ................................................................................................................................. 568
3.5.5. Earthquake ........................................................................................................................... 568
3.5.6. Expansive Soils .................................................................................................................... 572
3.5.7. Extreme Temperatures ....................................................................................................... 572
3.5.8. Flood ...................................................................................................................................... 572
3.5.9. Hailstorm .............................................................................................................................. 574
3.5.10. Hazardous Materials .......................................................................................................... 575
3.5.11. Land Subsidence ................................................................................................................ 578
3.5.12. Landslide ............................................................................................................................. 580
3.5.13. Lightning ............................................................................................................................ 582
3.5.14. Major Disease Outbreak ................................................................................................... 583
3.5.15. Radiological ........................................................................................................................ 583
3.5.16. Soil Erosion and Dust ........................................................................................................ 585
3.5.17. Terrorism/Agri-terrorism ................................................................................................. 585
3.5.18. Tornado ............................................................................................................................... 585
3.5.19. Utility/Infrastructure Failure ............................................................................................ 586
3.5.20 Wildfire ................................................................................................................................ 586
3.5.21. Windstorm .......................................................................................................................... 587
3.5.22. Winter Storm ...................................................................................................................... 588
3.6. References .................................................................................................................................... 590

Kansas Hazard Mitigation Plan Final 3-3 2018
Chapter 3 Risk Assessment
The foundation of the Kansas Hazard Mitigation Plan is the statewide risk assessment. In order to define effective mitigation actions to make Kansas more resilient to the impacts of future disasters, it is necessary to understand the hazards that threaten the state and how they disrupt Kansas communities. It is also necessary to understand how the communities are vulnerable to the impacts of the identified hazards and the scope or extent of that vulnerability. This chapter details the risk assessment process conducted by the Kansas Hazard Mitigation Team (KHMT). Its purpose is to provide, on a statewide basis, an understanding of the risks posed by the hazards that threaten Kansas. This allows the KHMT to focus its planning efforts on the hazards that pose the most risk to the people of Kansas, their property, and their communities.
The Federal Emergency Management Agency (FEMA) defines risk assessment terminology as follows:
Hazard – a hazard is an act or phenomenon that has the potential to produce harm or other undesirable consequences to a person or thing.
Vulnerability – Vulnerability is susceptibility to physical injury, harm, damage or economic loss. It depends on an asset’s construction, contents and economic value of its functions.
Exposure – Exposure describes the people, property, systems, or functions that could be lost to a hazard. Generally, exposure includes what lies in the area the hazard could affect.
Risk – Risk depends on hazards, vulnerability, and exposure. It is the estimated impact that a hazard would have on people, services, facilities, and structures in a community. It refers to the likelihood of a hazard event resulting in an adverse condition that causes injury or damage.
The risk assessment in this 2018 plan update is to reflect recent events, the availability of new information, and a reevaluation of the hazards that threaten Kansas. This chapter has been organized and is broken down into six sections:
Exposure and Analysis of State Development Trends – This sections looks at population changes, social vulnerability, land use and development trends and building exposure.
Hazard Identification – This section identifies the hazards of greatest concern to Kansas and how and why they were identified.
Hazard Profiles and State Risk Assessment – This section describes each hazard identified in the previous section, discusses where in the state the hazard is most likely to occur, gives examples of previous occurrences, states the probability of occurrence and analyzes the vulnerability and potential losses by jurisdiction (county), which includes discussions on development in hazard-prone areas.
Integration of Local Plans: Vulnerability and Loss Estimates – This section includes an overview and analysis of potential losses to identified vulnerable structures based on estimates provided in local risk assessments.

Kansas Hazard Mitigation Plan Final 3-4 2018
State Owned or Operated Facilities: Vulnerability and Loss Estimates – This section addresses the vulnerability and loss estimates to state owned or operated facilities located in the identified hazard areas.
References – This section consolidates the hazard references used throughout Chapter 3.
Like any other aspect of planning, hazard identification and vulnerability assessment is an ongoing, continually evolving process. This plan incorporates efforts to not only improve the knowledge of the KHMT, stakeholders, and citizens regarding the hazards known to threaten the State but also to assess if previously unidentified natural, technological or manmade hazards need to be addressed by the Kansas Hazard Mitigation Plan.

Kansas Hazard Mitigation Plan Final 3-5 2018
3.1 Exposure and Analysis of State Development Trends
Requirement for Update 201.4(d): Plan must be reviewed and revised to reflect changes in development.
Development, demographic and land use trends along with building value exposure are important elements to consider in a risk assessment. This section will examine growth, social vulnerability, other demographics, land use and development trends and exposure of the built environment as inputs to the vulnerability discussions that will take place by hazard in Section 3.3 Hazard Profiles and State Risk Assessment.
3.1.1. Growth As part of the plan update process, the State looked at changes in growth and development and examined these changes in the context of the State’s hazard-prone areas and how the changes in growth and development affect loss estimates and vulnerability. When the population in a hazardous area increases, so does the vulnerability of people and property associated with the hazards unless mitigation measures are taken. Recognizing both the population growth trends and the geographic locations of the growth patterns within the State is necessary to understand this issue. The discussion here focuses on population growth and increases in housing units and density by county, based on U.S. Census Bureau data.
3.1.2. Population The U.S. Census Bureau lists the Kansas population estimate in V2016 at 2,907,289. This reflects a 1.9% increase between 2010 and 2016. In 2016 Kansas ranked 33rd among the 50 states in population, 13th in land area at 81,758.72 square miles, and 41st in population density. Decennial census findings from the last few decades illustrate growth in Kansas (see Table 3.1). (The year V2016 was added to show more current population trends due to the plan update being two years prior to the next census).
Table 3.1. Kansas’ Decennial Census 1970 - V2016
Year Population % Change 1970 2,246,578 +3.1 1980 2,363,679 +5.2 1990 2,477,574 +4.8 2000 2,688,418 +8.5 2010 2,853,118 +6.1 V2016 2,907,289 +1.9%
Source: U.S. Census Bureau, https://www.census.gov/quickfacts/table/PST045216/20
*V means vintage year.
Figure 3.1 shows Kansas’ numerical population changes by county. Between 2010 and 2016, Kansas saw an increase in population of 54,171 people (See Table 3.5 and Table 3.6). Table 3.5a shows the 10 least populous counties in Kansas and Table 3.2 below lists all the Kansas

Kansas Hazard Mitigation Plan Final 3-6 2018
County populations in 2000, 2010, V2016 estimates and population changes categorized by their mitigation planning region.
Table 3.2 shows Kansas’ population by Counties as of the V2016 estimate.
Table 3.2. Kansas Counties Census Population for 2000, 2010, and V2016 Estimates (numbers in red in the V2016 estimate column denote declines in population).
County 2000 Census Population
2010 Census Population
Population Change (Numerical) 2000-2010
Population Change (Percent) 2000-2010
2016 Population Estimates V2016
Population Change (Numerical) 2010 - V2016
Mitigation Planning Region A
Cheyenne 3,165 2,726 -439 -13.87% 2,661 -65
Decatur 3,472 2,961 -511 -14.72% 2,832 -129
Gove 3,068 2,695 -373 -12.16% 2,589 -106
Logan 3,046 2,756 -290 -9.52% 2,831 75
Rawlins 2,966 2,519 -447 -15.07% 2,549 30
Sheridan 2,813 2,556 -257 -9.14% 2,509 -47
Sherman 6,760 6,010 -750 -11.09% 5,965 -45
Thomas 8,180 7,900 -280 -3.42% 7,892 -8
Wallace 1,749 1,485 -264 -15.09% 1,497 12
Subtotal 35,219 31,608 -3,611 -10.25% 31,325 -283
Mitigation Planning Region B
Ellis 27,507 28,452 945 3.44% 28,893 441
Graham 2,946 2,597 -349 -11.85% 2,564 -33
Ness 3,454 3,107 -347 -10.05% 2,962 -145
Norton 5,953 5,671 -282 -4.74% 5,493 -178
Phillips 6,001 5,642 -359 -5.98% 5,428 -214
Rooks 5,685 5,181 -504 -8.87% 5,076 -105
Rush 3,551 3,307 -244 -6.87% 3,058 -249
Russell 7,370 6,970 -400 -5.43% 6,988 18
Trego 3,319 3,001 -318 -9.58% 2,872 -129
Subtotal 65,786 63,928 -1,858 -2.82% 63,334 -594
Mitigation Planning Region C Grant 7,909 7,829 -80 -1.01% 7,646 -183
Greeley 1,534 1,247 -287 -18.71% 1,296 49
Hamilton 2,670 2,690 20 0.75% 2,536 -154
Kearny 4,531 3,977 -554 -12.23% 3,917 -60

Kansas Hazard Mitigation Plan Final 3-7 2018
Morton 3,496 3,233 -263 -7.52% 2,848 -385
Scott 5,120 4,936 -184 -3.59% 5,032 96
Stanton 2,406 2,235 -171 -7.11% 2,062 -173
Stevens 5,463 5,724 261 4.78% 5,584 -140
Wichita 2,531 2,234 -297 -11.73% 2,112 -122
Subtotal 35,660 34,105 -1,555 -5.18% 25,387 -1072
Mitigation Planning Region D
Clark 2,390 2,215 -175 -7.32% 2,072 -143
Finney 40,523 36,776 -3,747 -9.25% 36,722 -54
Ford 32,458 33,848 1,390 4.28% 33,971 123
Gray 5,904 6,006 102 1.73% 6,034 28
Haskell 4,307 4,256 -51 -1.18% 4,006 -250
Hodgeman 2,085 1,916 -169 -8.11% 1,870 -46
Lane 2,155 1,750 -405 -18.79% 1,636 -114
Meade 4,631 4,575 -56 -1.21% 4,216 -359
Seward 22,510 22,952 442 1.96% 22,709 -243
Subtotal 116,963 114,294 -2,669 -1.97% 113,236 -1058
Mitigation Planning Region E Barber 5,307 4,861 -446 -8.40% 4,688 -173
Barton 28,205 27,674 -531 -1.88% 26,775 -899
Comanche 1,967 1,891 -76 -3.86% 1,862 -29
Edwards 3,449 3,037 -412 -11.95% 2,938 -99
Kiowa 3,278 2,553 -725 -22.12% 2,483 -70
Pawnee 7,233 6,973 -260 -3.59% 6,743 -230
Pratt 9,647 9,656 9 0.09% 9,584 -72
Stafford 4,789 4,437 -352 -7.35% 4,208 -229
Subtotal 63,875 61,082 -2,793 -4.37% 59,281 -1,801
Mitigation Planning Region F
Clay 8,822 8,535 -287 -3.25% 8,143 -392
Cloud 10,268 9,533 -735 -7.16% 9,150 -383
Dickinson 19,344 19,754 410 2.12% 19,064 -690
Ellsworth 6,525 6,497 -28 -0.43% 6,328 -169
Jewell 3,791 3,077 -714 -18.83% 2,901 -176
Lincoln 3,578 3,241 -337 -9.42% 3,073 -168
Mitchell 6,932 6,373 -559 -8.06% 6,243 -130
Osborne 4,452 3,858 -594 -13.34% 3,642 -216

Kansas Hazard Mitigation Plan Final 3-8 2018
Ottawa 6,163 6,091 -72 -1.17% 5,920 -171
Republic 5,835 4,980 -855 -14.65% 4,699 -281
Saline 53,597 55,606 2,009 3.75% 55,142 -464
Smith 4,536 3,853 -683 -15.06% 3,632 -221
Subtotal 133,843 131,398 -2,445 -1.83% 127,937 -3,461
Mitigation Planning Region G Butler 59,482 65,880 6,398 10.76% 67,025 1,145
Cowley 36,291 36,311 20 0.06% 35,753 -558
Harper 6,536 6,034 -502 -7.68% 5,685 -349
Harvey 32,869 34,684 1,815 5.52% 34,913 229
Kingman 8,673 7,858 -815 -9.40% 7,467 -391
McPherson 29,554 29,180 -374 -1.27% 28,804 -376
Marion 13,361 12,660 -701 -5.25% 12,112 -548
Reno 64,790 64,511 -279 -0.43% 63,220 -1,291
Rice 10,761 10,083 -678 -6.30% 9,831 -252
Sedgwick 452,869 498,365 45,496 10.05% 511,995 13,630
Sumner 25,946 24,132 -1,814 -6.99% 23,272 -860
Subtotal 741,132 789,698 48,566 6.55% 800,077 10,379
Mitigation Planning Region H
Allen 14,385 13,371 -1,014 -7.05% 12,714 -657
Bourbon 15,379 15,173 -206 -1.34% 14,617 -556
Chautauqua 4,359 3,669 -690 -15.83% 3,374 -295
Cherokee 22,605 21,603 -1,002 -4.43% 20,246 -1,357
Crawford 38,242 39,134 892 2.33% 39,164 30
Elk 3,261 2,882 -379 -11.62% 2,547 -335
Greenwood 7,673 6,689 -984 -12.82% 6,151 -538
Labette 22,835 21,607 -1,228 -5.38% 20,444 -1,163
Montgomery 36,252 35,471 -781 -2.15% 32,746 -2,725
Neosho 16,997 16,512 -485 -2.85% 16,146 -366
Wilson 10,332 9,409 -923 -8.93% 8,723 -686
Woodson 3,788 3,309 -479 -12.65% 3,165 -144
Subtotal 196,108 188,829 -7,279 -3.71% 180,037 -8,792
Mitigation Planning Region I
Chase 3,030 2,790 -240 -7.92% 2,669 -121
Geary 27,947 34,362 6,415 22.95% 35,586 1,224
Lyon 35,935 33,690 -2,245 -6.25% 33,510 -180

Kansas Hazard Mitigation Plan Final 3-9 2018
Morris 6,104 5,923 -181 -2.97% 5,573 -350
Pottawatomie 18,209 21,604 3,395 18.64% 23,661 2,057
Riley 62,843 71,115 8,272 13.16% 73,343 2,228
Wabaunsee 6,885 7,053 168 2.44% 6,891 -162
Subtotal 160,953 176,537 15,584 9.68% 181,233 4,696
Mitigation Planning Region J Anderson 8,110 8,102 -8 -0.10% 7,827 -275
Coffey 8,865 8,601 -264 -2.98% 8,433 -168
Franklin 24,784 25,992 1,208 4.87% 25,560 -432
Linn 9,570 9,656 86 0.90% 9,558 -98
Miami 28,351 32,787 4,436 15.65% 32,964 177
Osage 16,712 16,295 -417 -2.50% 15,843 -452
Shawnee 169,871 177,934 8,063 4.75% 178,146 212
Subtotal 266,263 279,367 13,104 4.92% 278,331 -1,036
Mitigation Planning Region K
Atchison 16,774 16,924 150 0.89% 16,380 -544
Brown 10,724 9,984 -740 -6.90% 9,684 -300
Doniphan 8,249 7,945 -304 -3.69% 7,664 -281
Douglas 99,962 110,826 10,864 10.87% 119,440 8,614
Jackson 12,657 13,462 805 6.36% 13,291 -171
Jefferson 18,426 19,126 700 3.80% 18,897 -229
Marshall 10,965 10,117 -848 -7.73% 9,836 -281
Nemaha 10,717 10,178 -539 -5.03% 10,241 63
Washington 6,483 5,799 -684 -10.55% 5,546 -253
Subtotal 194,957 204,361 9,404 4.82% 210,979 6,618
Mitigation Planning Region L Johnson 451,086 544,179 93,093 20.64% 584,451 40,272
Leavenworth 68,691 76,227 7,536 10.97% 80,204 3,977
Wyandotte 157,882 157,505 -377 -0.24% 163,831 6,326
Subtotal 677,659 777,911 100,252 14.79% 828,486 50,575
Statewide Total 2,688,418 2,853,118 164,700 6.12% 2,907,289 54,171
Source: U.S. Census Bureau, Factfinder 2016, https://factfinder.census.gov/faces/nav/jsf/pages/index.xhtml
Table 3.3 shows the Top 10 Counties Ranked by Population by the census bureau, V2016 estimates. Table 3.4 shows the Ten Counties with the greatest population gains, and Table 3.5

Kansas Hazard Mitigation Plan Final 3-10 2018
reflects counties with the greatest loss of population and Table 3.5a shows the 10 least populous counties in Kansas per the Census Bureau in V2016 estimates.
Table 3.3. Top 10 Counties Ranked by Population, 2010-V2016 Estimated
County Mitigation Planning Region
V2016 (est) Population
Johnson L 584,451 Sedgwick G 511,995 Shawnee J 178,146 Wyandotte L 163,831 Douglas K 119,440 Leavenworth L 80,204 Riley I 73,343 Butler G 67,025 Reno G 63,220 Saline F 55,142
Source: U.S. Census Bureau, Factfinder 2016, https://factfinder.census.gov/faces/nav/jsf/pages/index.xhtml
Table 3.4. Ten Counties with Greatest Population Gains, 2010-V2016 Estimated
County Mitigation Planning Region
Population Gain V2016 (est)
Johnson L 40,272 Sedgwick G 13,630 Douglas K 8,614 Wyandotte L 6,326 Leavenworth L 3,977 Riley I 2,228 Pottawatomie I 2,057 Geary I 1,224 Butler G 1,145 Ellis B 441
Source: U.S. Census Bureau, Factfinder 2016, https://factfinder.census.gov/faces/nav/jsf/pages/index.xhtml
Table 3.5. Ten Counties with Greatest Population Losses, 2010 – V2016 (est)
County Mitigation Planning Region
Population Loss 2000-V2016
.Montgomery H -2,725 Cherokee H -1,357 Reno G -1,291 .Labette H -1,163 Barton E -899 Dickinson F -690 Wilson H -686 Allen H -657

Kansas Hazard Mitigation Plan Final 3-11 2018
Cowley G -558 Bourbon H -556
Source: U.S. Census Bureau, Factfinder 2016, https://factfinder.census.gov/faces/nav/jsf/pages/index.xhtml
Table 3.5a. Ten Smallest Counties Ranked by Population, V2016 Estimates
County Mitigation Planning Region V2016 Population
Greeley C 1,296 Wallace A 1,497 Lane D 1,636 Comanche E 1,862 Hodgeman D 1,870 Stanton C 2,062 Clark D 2,072 Wichita C 2,112 Kiowa E 2,483 Sheridan A 2,509
Source: U.S. Census Bureau, Factfinder 2016, https://factfinder.census.gov/faces/nav/jsf/pages/index.xhtml
Interim population projections issued by the U.S. Census suggest that state-wide Kansas’ population will continue to grow, but percentage increase will drop, through 2030 (see Table 3.6).
Table 3.6. Interim Kansas Populations 2015-2030
Year Projected Population Percent Change
2010 2,688,418 2015 2,852,690 6.11% 2020 2,890,566 1.33% 2025 2,919,002 0.98% 2030 2,940,084 0.72%
Source: U.S. Census Bureau 2010, www.census.gov
Figure 3.1 shows the population trends in the State of Kansas for the V2016 census bureau estimates. Red hues are a population decrease and green hues are a population increase

Kansas Hazard Mitigation Plan Final 3-13 2018
Figure 3.1. Population Trends Based on Census Bureau Estimates, V2016

Kansas Hazard Mitigation Plan Final 3-14 2018
The number of housing units is also an indicator of growth for population and the economy. The census defines a housing unit as: a house, an apartment, a mobile home or trailer, a group of rooms, or a single room that is occupied, or, if vacant, is intended for occupancy as separate living quarters. According to the U.S. Census Bureau, the number of housing units in Kansas increased 3.98 percent (44,959 units) between 2000 and 2010. As of 2015 the estimate is: 1,243,672, an increase of 10,457 units since 2010. Johnson and Sedgwick counties top the list for numerical gains in this time period, and the 10 counties with the greatest rate of population growth (percent change) also had the greatest growth in housing units with the exception of Ellis Co. Shawnee County was added to the list for top ten counties for housing unit gains, while Ellis County did not make this list.
Table 3.7. Ten Counties with Greatest Housing Unit Gains (Numerical) 2010 – V2015 (Est)
County Mitigation Planning Region
Housing Unit Gains 2010-V2015 est.
Johnson L 4,458 Sedgwick G 2,107 Riley I 1,345 Douglas K 1,081 Geary I 492 Wyandotte L 366 Leavenworth L 302 Pottawatomie I 292 Shawnee J 285 Butler G 271
Source: U.S. Census Bureau 2015, factfinder, https://factfinder.census.gov/faces/tableservices/jsf/pages/productview.xhtml?pid=ACS_15_5YR_DP04&src=pt
Table 3.8. Six Counties with Greatest Housing Unit Gains (Percent) 2010-V2015 est
County Mitigation Planning Region
Housing Unit Gains 2010-V2015 est. Percent
Scott C 8.2% Hodgeman D 6.3% Riley I 4.7% Geary I 3.4% Pottawatomie I 3.4% Douglas K 2.3%
Source: U.S. Census Bureau 2015, factfinder, https://factfinder.census.gov/faces/tableservices/jsf/pages/productview.xhtml?pid=ACS_15_5YR_DP04&src=pt Note: In order to be consistent, only six counties are reflected due to the year parameters, that had a measureable percentage gain.

Kansas Hazard Mitigation Plan Final 3-15 2018
Table 3.9. Top 10 Counties Ranked by Number of Housing Units V2015 (estimate)
County Mitigation Planning Region
Number of Housing Units, 2015
Johnson L 231,029 Sedgwick G 213,700 Shawnee J 79,425 . Wyandotte L 67113 Douglas K 47,812 . Riley I 29,557 Leavenworth L 28,999 Reno G 28,274 Butler G 26,329 Saline F 24,192
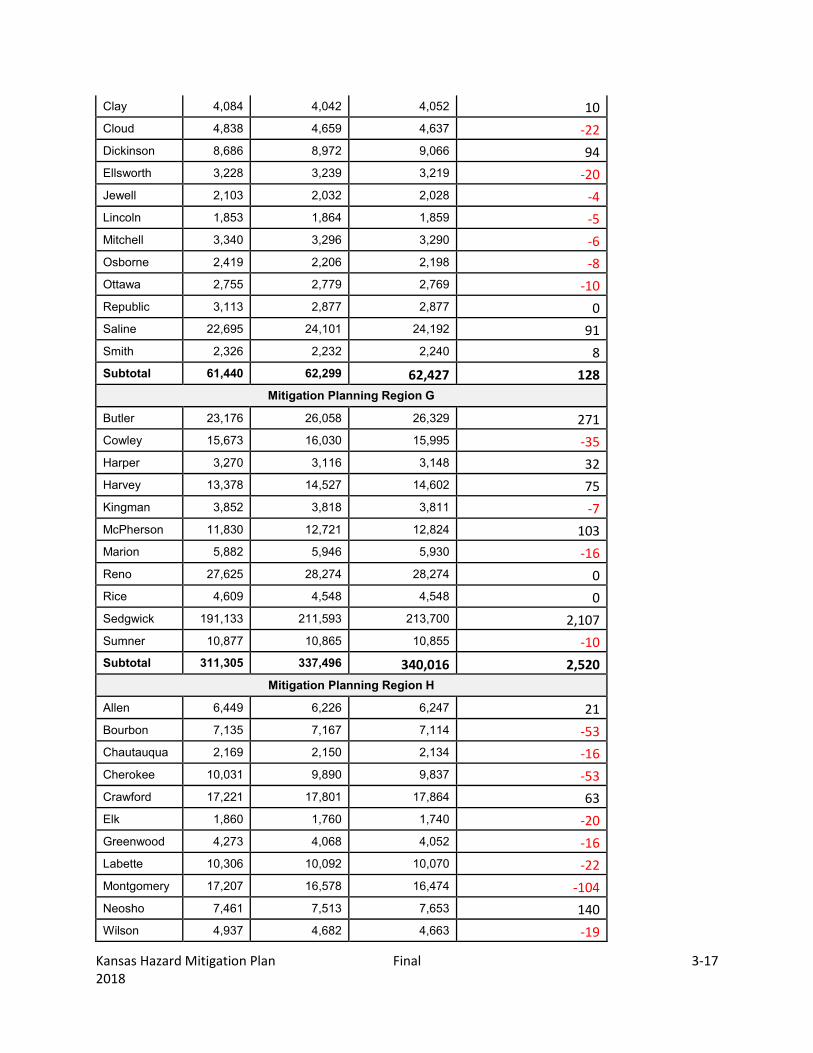
Source: U.S. Census Bureau 2015, factfinder, https://factfinder.census.gov/faces/tableservices/jsf/pages/productview.xhtml?pid=ACS_15_5YR_DP04&src=pt Table 3.10 shows the Kansas County census housing units data from 2000 and 2010 and the estimates for V2015. This information is categorized by the Mitigation Planning Regions. Table 3.11 shows the Housing Density by Mitigation Planning Region for the top 10 counties.
Table 3.10. Kansas Counties Census Housing Units 2000 – 2010, and 2015 estimates
County 2000 Census Housing Units
2010 Census Housing Units
V2015 Census Housing Units Estimate
Housing Unit Change (Numerical) 2010 - V2015
Mitigation Planning Region A
Cheyenne 1,636 1,518 1496 -22
Decatur 1,821 1,818 1812 -6
Gove 1,423 1,373 1383 10
Logan 1,423 1,441 1443 2
Rawlins 1,565 1,458 1458 0
Sheridan 1,263 1,265 1263 -2
Sherman 3,184 3,148 3124 -24
Thomas 3,562 3,536 3539 3
Wallace 791 781 813 32
Subtotal 16,668 16,338 16331 -7
Mitigation Planning Region B
Ellis 12,078 12,872 12,296 -576
Graham 1,553 1,484 1,479 -5
Ness 1,835 1,740 1,741 1
Norton 2,673 2,542 2,535 -7
Phillips 3,088 3,049 3,044 -5

Kansas Hazard Mitigation Plan Final 3-16 2018
Rooks 2,758 2,768 2,757 -11
Rush 1,928 1,869 1,797 -72
Russell 3,871 3,910 3,892 -18
Trego 1,723 1,682 1,665 -17
Subtotal 31,507 31,916 31,206 -710
Mitigation Planning Region C
Grant 3,027 2,945 2,934 -11
Greeley 712 629 588 -41
Hamilton 1,211 1,236 1,195 -41
Kearny 1,657 1,556 1,556 0
Morton 1,519 1,467 1,458 -9
Scott 2,291 2,193 2,373 180
Stanton 1,007 990 1,014 24
Stevens 2,265 2,306 2,294 -12
Wichita 1,119 1,054 868 -186
Subtotal 14,808 14,376 14,280 -96
Mitigation Planning Region D
Clark 1,111 1,135 1,162 27
Finney 13,763 13,276 13,290 14
Ford 11,650 12,005 12,081 76
Gray 2,181 2,340 2,388 48
Haskell 1,639 1,666 1,660 -6
Hodgeman 945 973 1,034 61
Lane 1,065 990 955 -35
Meade 1,968 1,998 1,943 -55
Seward 8,027 8,061 8,110 49
Subtotal 42,349 42,444 42,623 179
Mitigation Planning Region E
Barber 2,740 2,765 2,792 27
Barton 12,888 12,696 12,617 -79
Comanche 1,088 1,044 993 -51
Edwards 1,754 1,636 1,630 -6
Kiowa 1,643 1,220 1,227 7
Pawnee 3,114 3,152 3,165 13
Pratt 4,633 4,514 4,485 -29
Stafford 2,458 2,319 2,303 -16
Subtotal 30,318 29,346 29,212 -134
Mitigation Planning Region F
Kansas Hazard Mitigation Plan Final 3-17 2018
Clay 4,084 4,042 4,052 10
Cloud 4,838 4,659 4,637 -22
Dickinson 8,686 8,972 9,066 94
Ellsworth 3,228 3,239 3,219 -20
Jewell 2,103 2,032 2,028 -4
Lincoln 1,853 1,864 1,859 -5
Mitchell 3,340 3,296 3,290 -6
Osborne 2,419 2,206 2,198 -8
Ottawa 2,755 2,779 2,769 -10
Republic 3,113 2,877 2,877 0
Saline 22,695 24,101 24,192 91
Smith 2,326 2,232 2,240 8
Subtotal 61,440 62,299 62,427 128
Mitigation Planning Region G
Butler 23,176 26,058 26,329 271
Cowley 15,673 16,030 15,995 -35
Harper 3,270 3,116 3,148 32
Harvey 13,378 14,527 14,602 75
Kingman 3,852 3,818 3,811 -7
McPherson 11,830 12,721 12,824 103
Marion 5,882 5,946 5,930 -16
Reno 27,625 28,274 28,274 0
Rice 4,609 4,548 4,548 0
Sedgwick 191,133 211,593 213,700 2,107
Sumner 10,877 10,865 10,855 -10
Subtotal 311,305 337,496 340,016 2,520
Mitigation Planning Region H
Allen 6,449 6,226 6,247 21
Bourbon 7,135 7,167 7,114 -53
Chautauqua 2,169 2,150 2,134 -16
Cherokee 10,031 9,890 9,837 -53
Crawford 17,221 17,801 17,864 63
Elk 1,860 1,760 1,740 -20
Greenwood 4,273 4,068 4,052 -16
Labette 10,306 10,092 10,070 -22
Montgomery 17,207 16,578 16,474 -104
Neosho 7,461 7,513 7,653 140
Wilson 4,937 4,682 4,663 -19

Kansas Hazard Mitigation Plan Final 3-18 2018
Woodson 2,076 2,022 2,007 -15
Subtotal 91,125 89,949 89,855 -94
Mitigation Planning Region I
Chase 1,529 1,503 1,496 -7
Geary 11,959 14,517 15,009 492
Lyon 14,757 15,237 15,218 -19
Morris 3,160 3,206 3,195 -11
Pottawatomie 7,311 8,626 8,918 292
Riley 23,397 28,212 29,557 1,345
Wabaunsee 3,033 3,227 3,241 14
Subtotal 65,146 74,528 76,634 2,106
Mitigation Planning Region J
Anderson 3,596 3,720 3,712 -8
Coffey 3,876 3,964 3,999 35
Franklin 10,229 11,147 11,114 -33
Linn 4,720 5,446 5,446 0
Miami 10,984 13,190 13,273 83
Osage 7,018 7,503 7,501 -2
Shawnee 73,768 79,140 79,425 285
Subtotal 114,191 124,110 124,470 360
Mitigation Planning Region K
Atchison 6,818 6,990 6,958 -32
Brown 4,815 4,779 4,768 -11
Doniphan 3,489 3,576 3,556 -20
Douglas 40,250 46,731 47,812 1,081
Jackson 5,094 5,779 5,764 -15
Jefferson 7,491 8,160 8,210 50
Marshall 4,999 4,866 4,882 16
Nemaha 4,340 4,562 4,571 9
Washington 3,142 2,955 2,956 1
Subtotal 80,438 88,398 89,477 1,079
Mitigation Planning Region L
Johnson 181,612 226,571 231,029 4,458
Leavenworth 24,401 28,697 28,999 302
Wyandotte 65,892 66,747 67,113 366
Subtotal 271,905 322,015 327,141 5,126 Statewide Total 1,131,200 1,233,215 1,243,672 10,457

Kansas Hazard Mitigation Plan Final 3-19 2018
Source: U.S. Census Bureau 2015, factfinder, https://factfinder.census.gov/faces/tableservices/jsf/pages/productview.xhtml?pid=ACS_15_5YR_DP04&src=pt
Density
Kansas has a surface land area of 81,758 square miles (2010 census), a population of 2,907,289 (V2016 census estimate), and a population density of 35.5 people per square mile. In V2016, 31 (29 percent) of Kansas’ counties had population densities of less than five people per square mile. Figure 3.2 shows a map that reflects the Kansas’ Population Density by Census Tract, based on the estimated V2016 population changes. Note: county square miles was taken from the 2010 census, and the population figure was taken from the V2016 census estimates in order to get a more current population density per county. While the square miles could have had shrinkage, it was felt that it would be statistically insignificant.
Figure 3.2. Kansas Population Density by Census Total, V2016 (Estimate)
Kansas Hazard Mitigation Plan Final 3-20 2018
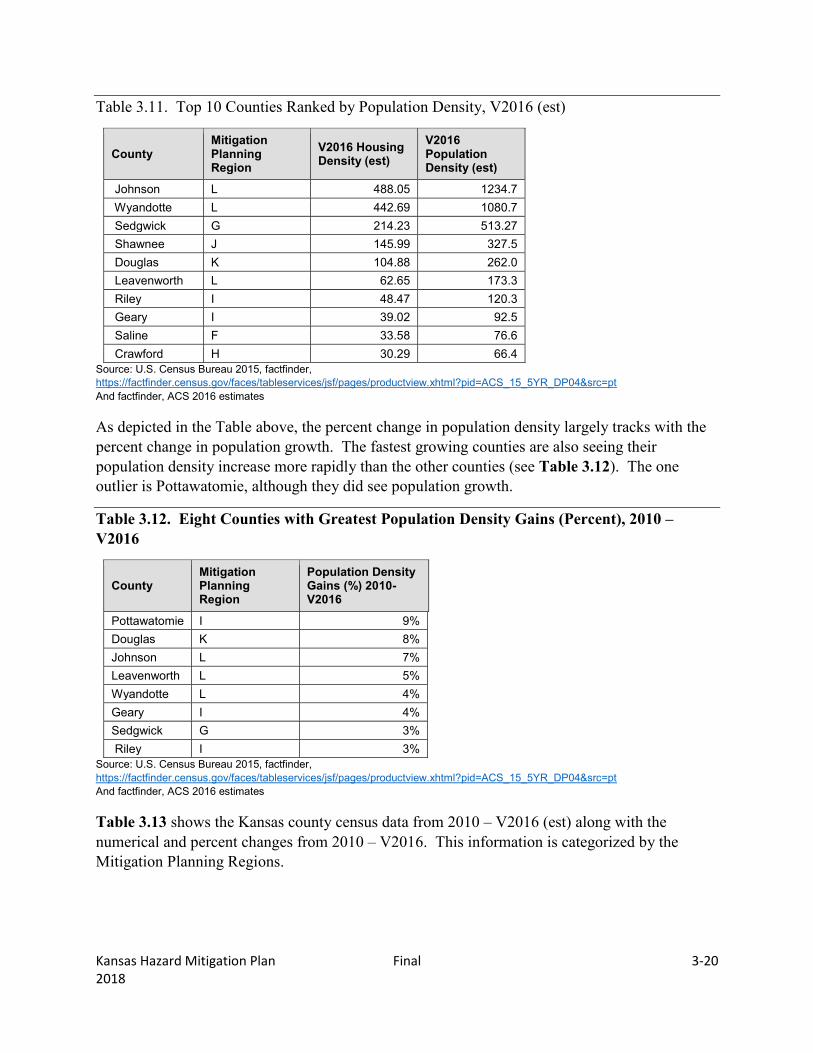
Table 3.11. Top 10 Counties Ranked by Population Density, V2016 (est)
County Mitigation Planning Region
V2016 Housing Density (est)
V2016 Population Density (est)
Johnson L 488.05 1234.7 Wyandotte L 442.69 1080.7 Sedgwick G 214.23 513.27 Shawnee J 145.99 327.5 Douglas K 104.88 262.0 Leavenworth L 62.65 173.3 Riley I 48.47 120.3 Geary I 39.02 92.5 Saline F 33.58 76.6 Crawford H 30.29 66.4
Source: U.S. Census Bureau 2015, factfinder, https://factfinder.census.gov/faces/tableservices/jsf/pages/productview.xhtml?pid=ACS_15_5YR_DP04&src=pt And factfinder, ACS 2016 estimates
As depicted in the Table above, the percent change in population density largely tracks with the percent change in population growth. The fastest growing counties are also seeing their population density increase more rapidly than the other counties (see Table 3.12). The one outlier is Pottawatomie, although they did see population growth.
Table 3.12. Eight Counties with Greatest Population Density Gains (Percent), 2010 – V2016
County Mitigation Planning Region
Population Density Gains (%) 2010-V2016
Pottawatomie I 9% Douglas K 8% Johnson L 7% Leavenworth L 5% Wyandotte L 4% Geary I 4% Sedgwick G 3% Riley I 3%
Source: U.S. Census Bureau 2015, factfinder, https://factfinder.census.gov/faces/tableservices/jsf/pages/productview.xhtml?pid=ACS_15_5YR_DP04&src=pt And factfinder, ACS 2016 estimates
Table 3.13 shows the Kansas county census data from 2010 – V2016 (est) along with the numerical and percent changes from 2010 – V2016. This information is categorized by the Mitigation Planning Regions.

Kansas Hazard Mitigation Plan Final 3-21 2018
Table 3.13. Kansas Counties Population Density Census for 2010 – V2016 (est)
County 2010 Census Population Density
V2016 Census Population Density
Population Density Change (Numerical) 2010-V2016 est
Population Density Change (Percent) 2010 – V2016 est
Mitigation Planning Region A
Cheyenne 2.7 2.6 -0.1 -4%
Decatur 3.3 3.2 -0.1 -3%
Gove 2.5 2.4 -0.1 -4%
Logan 2.6 2.6 0 0%
Rawlins 2.4 2.4 0 0%
Sheridan 2.9 2.8 -0.1 -3%
Sherman 5.7 5.6 -0.1 -2%
Thomas 7.4 7.3 -0.1 -1%
Wallace 1.6 1.6 0 0%
Mitigation Planning Region B
Ellis 31.6 32.1 0.5 2%
Graham 2.9 2.9 0 0%
Ness 2.9 2.8 -0.1 -3%
Norton 6.5 6.3 -0.2 -3%
Phillips 6.4 6.1 -0.3 -5%
Rooks 5.8 5.7 -0.1 -2%
Rush 4.6 4.3 -0.3 -7%
Russell 7.9 7.9 0 0%
Trego 3.4 3.2 -0.2 -6%
Mitigation Planning Region C
Grant 13.6 13.3 -0.3 -2%
Greeley 1.6 1.7 0.1 6%
Hamilton 2.7 2.5 -0.2 -7%
Kearny 4.6 4.5 -0.1 -2%
Morton 4.4 3.9 -0.5 -11%
Scott 6.9 7 0.1 1%
Stanton 3.3 3 -0.3 -9%
Stevens 7.9 7.7 -0.2 -3%
Wichita 3.1 2.9 -0.2 -6%
Mitigation Planning Region D
Clark 2.3 2.1 -0.2 -9%

Kansas Hazard Mitigation Plan Final 3-22 2018
Finney 28.2 28.2 0 0%
Ford 30.8 30.9 0.1 0%
Gray 6.9 6.9 0 0%
Haskell 7.4 6.9 -0.5 -7%
Hodgeman 2.2 2.2 0 0%
Lane 2.4 2.3 -0.1 -4%
Meade 4.7 4.3 -0.4 -9%
Seward 35.9 35.5 -0.4 -1%
Mitigation Planning Region E
Barber 4.3 4.1 -0.2 -5%
Barton 30.9 29.9 -1 -3%
Comanche 2.4 2.4 0 0%
Edwards 4.9 4.7 -0.2 -4%
Kiowa 3.5 3.4 -0.1 -3%
Pawnee 9.2 8.9 -0.3 -3%
Pratt 13.1 13 -0.1 -1%
Stafford 5.6 5.3 -0.3 -5%
Mitigation Planning Region F
Clay 13.2 12.6 -0.6 -5%
Cloud 13.3 12.8 -0.5 -4%
Dickinson 23.3 22.5 -0.8 -3%
Ellsworth 9.1 8.8 -0.3 -3%
Jewell 3.4 3.2 -0.2 -6%
Lincoln 4.5 4.3 -0.2 -4%
Mitchell 9.1 8.9 -0.2 -2%
Osborne 4.3 4.1 -0.2 -5%
Ottawa 8.5 8.2 -0.3 -4%
Republic 6.9 6.6 -0.3 -4%
Saline 77.2 76.6 -0.6 -1%
Smith 4.3 4.1 -0.2 -5%
Mitigation Planning Region G
Butler 46.1 46.9 0.8 2%
Cowley 32.3 31.8 -0.5 -2%
Harper 7.5 7.1 -0.4 -5%
Harvey 64.3 64.7 0.4 1%
Kingman 9.1 8.7 -0.4 -4%
McPherson 32.5 32.1 -0.4 -1%
Marion 13.4 12.8 -0.6 -4%

Kansas Hazard Mitigation Plan Final 3-23 2018
Reno 51.4 50.1 -1.3 -3%
Rice 13.9 13.5 -0.4 -3%
Sedgwick 499.6 513.3 13.7 3%
Sumner 20.4 19.7 -0.7 -3%
Mitigation Planning Region H
Allen 26.7 25.4 -1.3 -5%
Bourbon 23.9 23 -0.9 -4%
Chautauqua 5.7 5.3 -0.4 -7%
Cherokee 36.8 34.5 -2.3 -6%
Crawford 66.4 66.4 0 0%
Elk 4.5 3.9 -0.6 -13%
Greenwood 5.9 5.4 -0.5 -8%
Labette 33.5 31.7 -1.8 -5%
Montgomery 55.1 50.9 -4.2 -8%
Neosho 28.9 28.3 -0.6 -2%
Wilson 16.5 15.3 -1.2 -7%
Woodson 6.6 6.4 -0.2 -3%
Mitigation Planning Region I
Chase 3.6 3.5 -0.1 -3%
Geary 89.3 92.5 3.2 4%
Lyon 39.8 39.5 -0.3 -1%
Morris 8.5 8 -0.5 -6%
Pottawatomie 25.7 28.1 2.4 9%
Riley 116.6 120.3 3.7 3%
Wabaunsee 8.9 8.7 -0.2 -2%
Mitigation Planning Region J
Anderson 14 13.5 -0.5 -4%
Coffey 13.7 13.5 -0.2 -1%
Franklin 45.5 44.7 -0.8 -2%
Linn 16.3 16.1 -0.2 -1%
Miami 57 57.3 0.3 1%
Osage 23.1 22.5 -0.6 -3%
Shawnee 327.1 327.5 0.4 0%
Mitigation Planning Region K
Atchison 39.3 38 -1.3 -3%
Brown 17.5 17 -0.5 -3%
Doniphan 20.2 19.5 -0.7 -3%
Douglas 243.1 262 18.9 8%

Kansas Hazard Mitigation Plan Final 3-24 2018
Jackson 20.5 20.3 -0.2 -1%
Jefferson 35.9 35.5 -0.4 -1%
Marshall 11.2 10.9 -0.3 -3%
Nemaha 14.2 14.3 0.1 1%
Washington 6.5 6.2 -0.3 -5%
Mitigation Planning Region L
Johnson 1149.6 1234.7 85.1 7%
Leavenworth 164.7 173.3 8.6 5%
Wyandotte 1038.95 1080.7 41.75 4% Source: U.S. Census Bureau 2015, factfinder, https://factfinder.census.gov/faces/tableservices/jsf/pages/productview.xhtml?pid=ACS_15_5YR_DP04&src=pt And factfinder, ACS 2016 estimates
3.1.3 Social Vulnerability
A Social Vulnerability Index compiled by the Hazards and Vulnerability Research Institute in the Department of Geography at the University of South Carolina measures the social vulnerability of U.S. counties to environmental hazards for the purpose of examining the differences in social vulnerability among counties. Based on national data sources, including the 2010 census, it synthesizes 42 socioeconomic and built environment variables that research literature suggests contribute to reduction in a community’s ability to prepare for, respond to and recover from hazards (i.e., social vulnerability). Eleven composite factors were identified that differentiate counties according to their relative level of social vulnerability: personal wealth, age, density of the built environment, single-sector economic dependence, housing stock and tenancy, race (African American and Asian), ethnicity (Hispanic and Native American), occupation and infrastructure dependence.
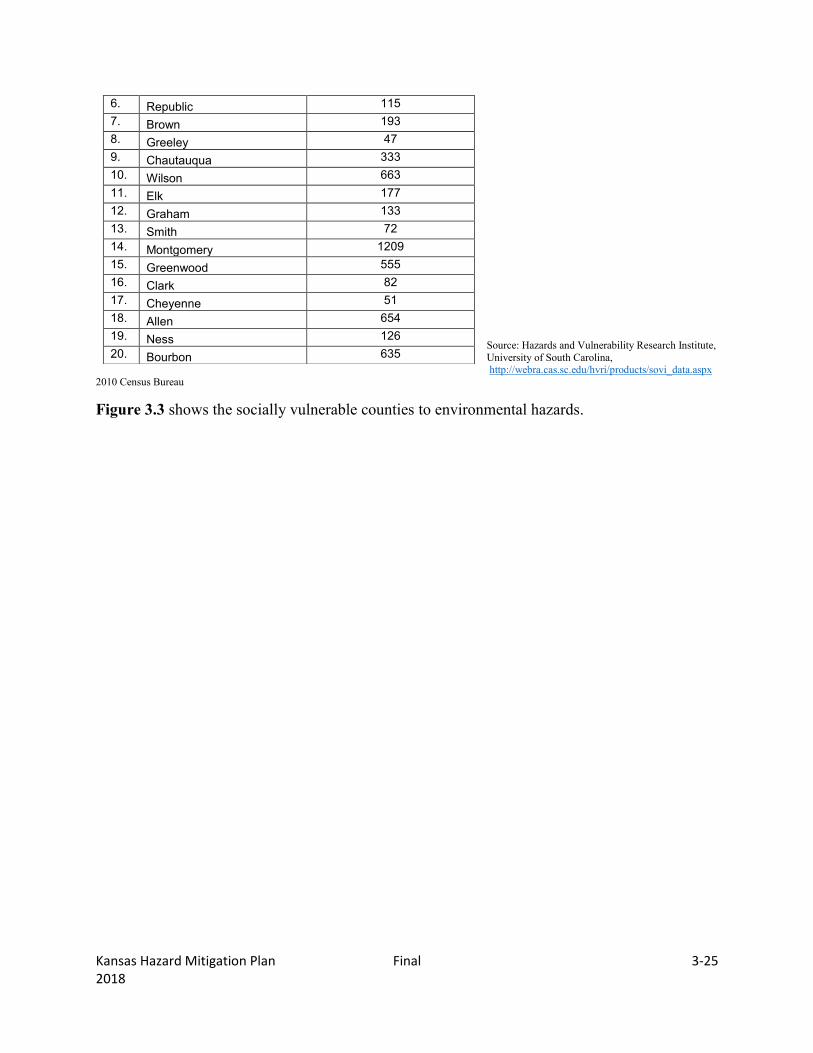
At the time of the 2018 plan update, the Social Vulnerability Index 2010 - 2014, updated in 2016 is the most recent data. The index can be used by the State to help determine where social vulnerability and exposure to hazards overlaps and how and where mitigation resources might best be used. According to the index, the following, listed in order, are Kansas’ most socially vulnerable counties. The number of mobile homes in each county is shown as that is an added source of vulnerability as mobile homes are more susceptible to weather hazards than fixed structures, specifically when applied to tornadoes, wind storms, and winter storms.
Table 3.14. Kansas’ Socially Most Vulnerable Counties, 2016.
County Number of Mobile Homes 1. Decatur 100 2. Wyandotte 1598 3. Cloud 79 4. Comanche 68 5. Kiowa 72
Kansas Hazard Mitigation Plan Final 3-25 2018
Source: Hazards and Vulnerability Research Institute, University of South Carolina, http://webra.cas.sc.edu/hvri/products/sovi_data.aspx
2010 Census Bureau Figure 3.3 shows the socially vulnerable counties to environmental hazards.
6. Republic 115 7. Brown 193 8. Greeley 47 9. Chautauqua 333 10. Wilson 663 11. Elk 177 12. Graham 133 13. Smith 72 14. Montgomery 1209 15. Greenwood 555 16. Clark 82 17. Cheyenne 51 18. Allen 654 19. Ness 126 20. Bourbon 635

Kansas Hazard Mitigation Plan Final 3-26 2018
Figure 3.3. Socially Most Vulnerable to Environmental Hazards by County
Kansas Hazard Mitigation Plan Final 3-27 2018
The social vulnerability index data will be integrated into the risk assessment of this plan update.
3.1.4. Land Use and Development Trends
General Land Use in Kansas
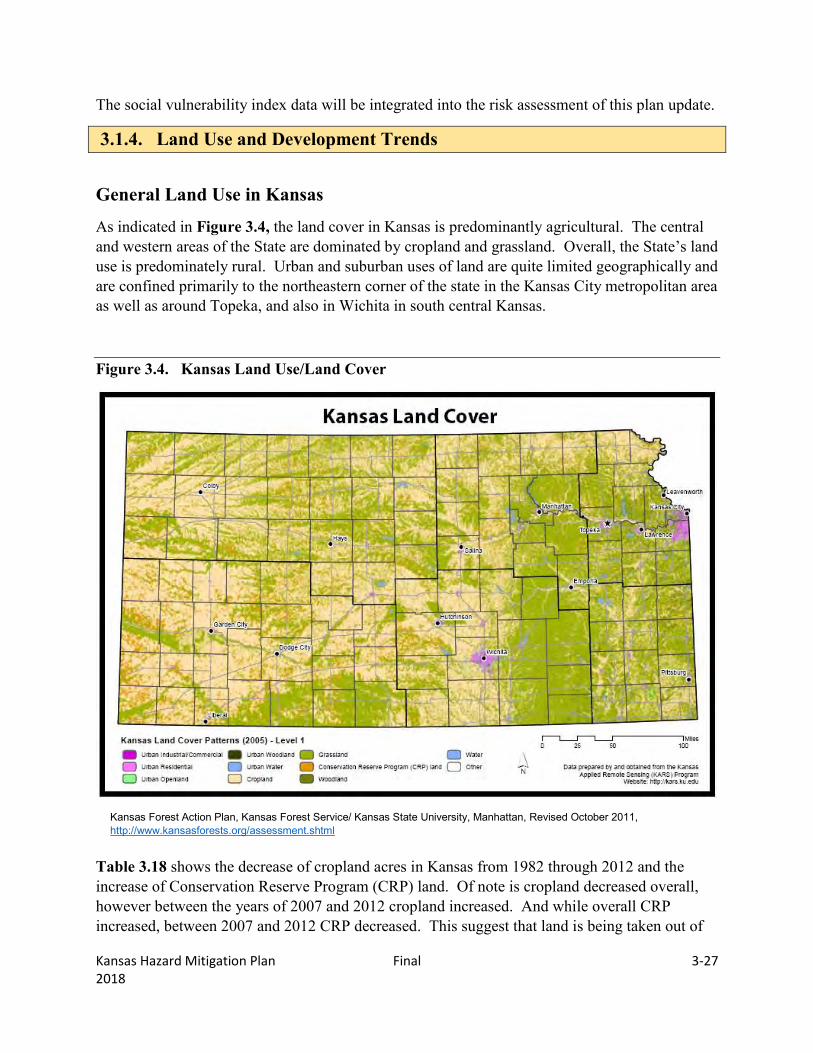
As indicated in Figure 3.4, the land cover in Kansas is predominantly agricultural. The central and western areas of the State are dominated by cropland and grassland. Overall, the State’s land use is predominately rural. Urban and suburban uses of land are quite limited geographically and are confined primarily to the northeastern corner of the state in the Kansas City metropolitan area as well as around Topeka, and also in Wichita in south central Kansas.
Figure 3.4. Kansas Land Use/Land Cover
Kansas Forest Action Plan, Kansas Forest Service/ Kansas State University, Manhattan, Revised October 2011, http://www.kansasforests.org/assessment.shtml
Table 3.18 shows the decrease of cropland acres in Kansas from 1982 through 2012 and the increase of Conservation Reserve Program (CRP) land. Of note is cropland decreased overall, however between the years of 2007 and 2012 cropland increased. And while overall CRP increased, between 2007 and 2012 CRP decreased. This suggest that land is being taken out of

Kansas Hazard Mitigation Plan Final 3-28 2018
the CRP program and used to grow crops. Or the terms of the contract have expired, allowing the land to be used as cropland. (note: this is the latest data available at the writing of this portion of the plan).
One characteristic of local land use in Kansas, which must be considered in both state and local/regional hazard mitigation planning is how the land use patterns are changing at the community level. Identifying both the type and rate of change from existing land uses to future land uses, whether they are planned or unplanned, can help to identify the local jurisdictions most subject to development pressures and consequently help to focus the mitigation planning to minimize the vulnerability to future disasters of the newly constructed neighborhoods, facilities and infrastructure. Data from local plans can be used to identify the jurisdictions where planned land uses are significantly different from existing land uses.
Table 3.18. Land Cover/Use of Non-Federal Rural Land
Year Cropland CRP land Pastureland Rangeland Forest Land
Other Rural Land
Total Rural Land
1982 29,122.8 0 2122.9 16427.5 1571.2 688.3 49,932.7 1987 28,496.6 645.7 2173.0 16,332.1 1574.7 682.2 49,904.3 1992 26,535.2 2,867.3 2,292.1 15,753.0 1,658.1 688.5 49,794.2 1997 26,485.8 2,848.8 2,319.1 15,659.8 1,666.2 699.7 49,679.4 2002 26,458.3 2,625.5 2,414.8 15,694.7 1,688.9 714.1 49,596.3 2007 25,606.2 3,164.7 2,566.7 15,686.8 1,746.2 762.6 49,533.2 2012 25,834.1 2,352.8 2,967.0 15,808.1 1,790.1 760.6 49,512.7
U.S. Department of Agriculture, Natural Resources Conservation Service, August 2015, National Resources Inventory. Note: Land measured in thousands of acres, with margins of error (CPR) stands for Conservation Reserve Program land. http://www.nrcs.usda.gov/Internet/FSE_DOCUMENTS/nrcseprd396218.pdf
According to the Census of Agriculture estimates for 2012, approximately 88.9% of land in Kansas is farmland, of which 61.8% is cropland; 33.7% is pastureland; and 4.6% is for other uses. The number of farms has decreased from 65,531 in 2007 to 61,773 in 2012 or -6%. The amount of acres in farmland has stayed steady while the average size of the farms in Kansas has grown by 6%. This suggest that bigger farms are absorbing smaller farms.
Agriculture and agribusiness are major contributors to the Kansas economy. Agriculture is a critical part of Kansas’ past, and it is a key economic driver in our present, but it also holds great potential for our future (KS Department of Ag). The market value of agricultural products sold in 2012 was $18,460,564,000, an increase of 28% from 2007. The average per farm was $298,845 in 2012, an increase of 36% from 2007 when that number stood at $219,944. According to the 2012 Census of Agriculture, Kansas ranked 6th in the total value of agricultural products sold, 9th in the value of crops including nursery and greenhouses, and 5th in value of livestock, poultry, and their products.
The top crop items in Kansas for 2012 were wheat and winter wheat, whereby Kansas ranked number 1 in the United States. Kansas ranked 3rd in the U.S. for cattle and calves livestock inventory.

Kansas Hazard Mitigation Plan Final 3-29 2018
Like other businesses, the size of farm enterprises will typically reflect the vulnerability of a farm to the impacts of disasters and is indicative of the availability of financial resources to recover in an event’s aftermath. The average size of farms in 2013 is 747 acres, an increase of 6% from 2007.
Table 3.19 and Figure 3.5 show the total farmland acreage by county.
Table 3.19 Top 10 Kansas Counties Ranked by Farmland Acreage, USDA Agriculture Census, 2012
County Total Land In Farms, Acres Finney 815,905 Reno 789,525 Butler 768,149 Sumner 719,611 Greenwood 701,012 Ford 699,719 Ness 678,149 Thomas 675,079 Hamilton 635,157 Meade 617,997
Source: http://www.nass.usda.gov/Statistics_by_State/Kansas/Publications/Annual_Statistical_Bulletin/ff2013.pdf
Figure 3.5. Farmland Acreage by County

Kansas Hazard Mitigation Plan Final 3-30 2018
Table 3.20 Top 10 Counties Ranked by Number of Farms, USDA Agriculture Census
County Total Number Farms Reno 1,633 Butler 1,353 Sedgwick 1,344 Miami 1,305 McPherson 1,147 Leavenworth 1,133 Sumner 1,096 Jackson 1,054 Jewell, Franklin 1,024 Osage 1,014
Source: http://www.nass.usda.gov/Statistics_by_State/Kansas/Publications/Annual_Statistical_Bulletin/ff2013.pdf

Kansas Hazard Mitigation Plan Final 3-31 2018
Figure 3.6. Number of Farms by County

Kansas Hazard Mitigation Plan Final 3-32 2018
The percent of land dedicated to farming in Kansas statistically stayed the same, while the number of farms decreased. The average size of a farm increased by 6%. Again, this suggest that the smaller farms were absorbed into the larger farms, or for other purposes. Figure 3.6.a reflects the change in the number of farms per county by percentage, while Figure 3.6.b shows the change in the acreage in farms per county by percentage.

Kansas Hazard Mitigation Plan Final 3-33 2018
Figure 3.6a. Change in Number of Farms by County (%)

Kansas Hazard Mitigation Plan Final 3-34 2018
Figure 3.6.b. Change in Farm Acreage by County (%)

Kansas Hazard Mitigation Plan Final 3-35 2018
Figures 3.6.a and 3.6.b show the northeast portion of the state have lost acreage and number of farms, suggesting that the land is being put to another use. Changes from rural to urban land use, and vice versa, will continue to alter the type and scale of the vulnerability of local jurisdictions to future disasters.
3.1.5. Exposure of Built Environment/Cultural Resources
Built Environment
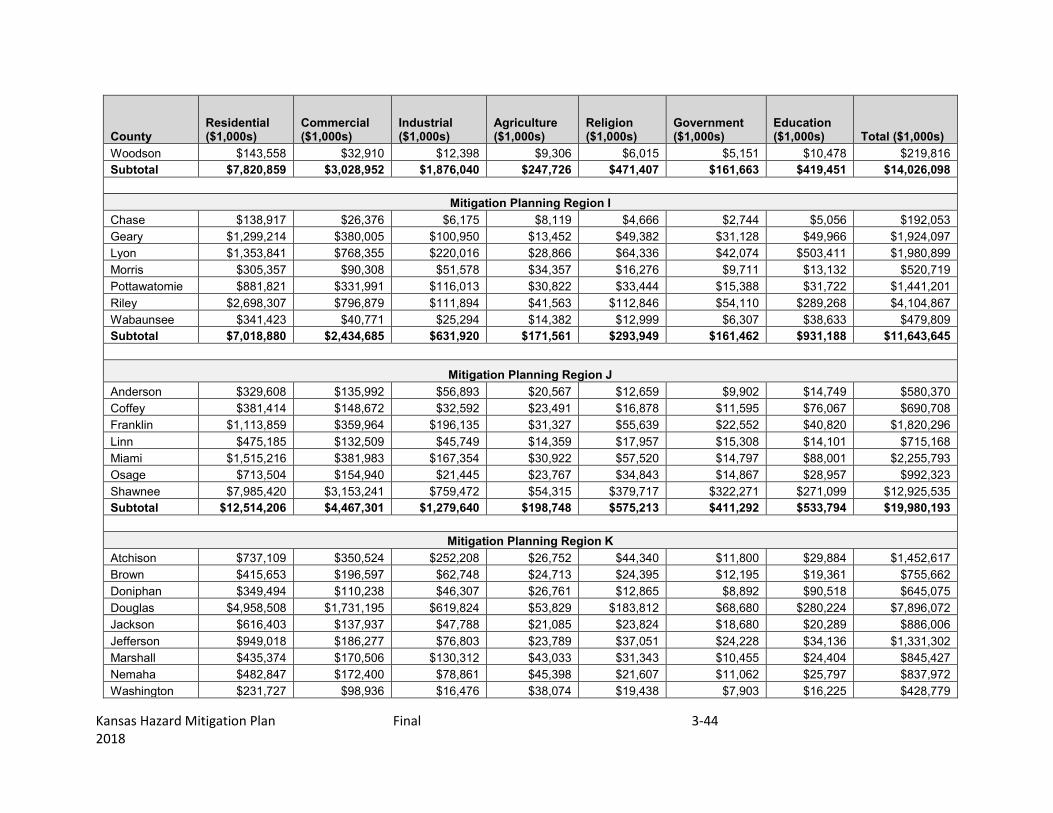
This section quantifies the buildings exposed to potential hazards, by county. Table 3.21 and Table 3.22 provide the value of the State’s built environment and its contents, which in addition to the population information presented above, forms the basis of the vulnerability and risk assessment presented in this plan. Figure 3.7 illustrates the statewide distribution of the building exposure, with both the structure and content values. This information was derived from inventory data associated with FEMA’s loss estimation software HAZUS-4.0. HAZUS classifies building stock types into seven categories: residential, commercial, industrial, agriculture, religion, government, and education. Values associated with each of these categories reflect 2010 valuations. According to the HAZUS-4.0 inventory, the total estimated replacement value of buildings within the State is $335.1 billion and the total buildings content’s estimated value within the State is $216. 8 billion. The exposure value of buildings is incorporated as a factor in vulnerability assessments for hailstorm, tornado, windstorm, and winter storm hazards that are profiled later in this plan. Information about state facilities is in Section 3.5, State Owned or Operated Facilities: Vulnerability and Loss Estimation.

Kansas Hazard Mitigation Plan Final 3-36 2018
Table 3.21. Estimated Replacement Value of Buildings by Category for Kansas (2010 Valuations) X1000
County Residential ($1,000s)
Commercial ($1,000s)
Industrial ($1,000s)
Agriculture ($1,000s)
Religion ($1,000s)
Government ($1,000s)
Education ($1,000s) Total ($1,000s)
Mitigation Planning Region A Cheyenne $240,726 $48,651 $11,291 $15,420 $7,932 $1,269 $8,017 $333,306 Decatur $287,182 $48,031 $7,003 $14,770 $12,109 $3,347 $5,773 $378,215 Gove $240,003 $49,869 $16,015 $23,122 $8,091 $3,105 $17,397 $357,602 Logan $244,656 $65,458 $5,671 $16,332 $8,557 $3,157 $9,357 $353,188 Rawlins $273,134 $59,372 $7,987 $17,663 $7,744 $5,902 $7,322 $379,124 Sheridan $265,056 $52,184 $4,992 $14,757 $6,786 $2,337 $8,108 $354,220 Sherman $585,010 $132,855 $16,182 $20,840 $20,563 $4,980 $21,317 $801,747 Thomas $698,175 $170,273 $21,340 $29,962 $24,941 $6,869 $56,452 $1,008,012 Wallace $175,557 $24,175 $1,949 $9,206 $5,924 $3,312 $5,412 $225,535 Subtotal $3,009,499 $650,868 $92,430 $162,072 $102,647 $34,278 $139,155 $4,190,949
Mitigation Planning Region B Ellis $2,415,843 $525,025 $144,124 $28,419 $45,541 $18,863 $66,922 $3,244,737 Graham $273,646 $58,711 $7,972 $6,187 $6,285 $2,091 $8,800 $363,694 Ness $391,622 $76,648 $13,363 $11,675 $15,182 $2,551 $9,697 $520,738 Norton $505,323 $91,817 $27,601 $19,856 $12,627 $8,347 $11,934 $677,505 Phillips $573,018 $90,002 $26,435 $20,237 $18,417 $7,809 $18,664 $754,582 Rooks $497,605 $113,815 $25,025 $331,540 $18,923 $7,967 $12,083 $1,006,958 Rush $284,607 $51,304 $20,285 $11,766 $8,554 $3,967 $10,811 $391,294 Russell $678,698 $121,458 $36,121 $14,736 $17,200 $5,928 $13,728 $887,869 Trego $302,864 $50,329 $8,643 $8,282 $10,786 $7,297 $8,051 $396,252 Subtotal $5,923,226 $1,179,109 $309,569 $452,698 $153,515 $64,820 $160,690 $8,243,629
Mitigation Planning Region C Grant $567,842 $156,283 $32,830 $22,443 $17,318 $5,291 $16,575 $818,582 Greeley $151,849 $30,659 $3,843 $9,638 $3,467 $1,169 $5,024 $205,649 Hamilton $174,113 $44,917 $3,638 $19,463 $6,797 $4,396 $4,318 $257,642 Kearny $265,602 $37,083 $5,820 $16,564 $6,720 $4,057 $10,928 $346,774 Morton $289,255 $55,778 $7,099 $12,123 $13,991 $5,273 $10,136 $394,544

Kansas Hazard Mitigation Plan Final 3-37 2018
County Residential ($1,000s)
Commercial ($1,000s)
Industrial ($1,000s)
Agriculture ($1,000s)
Religion ($1,000s)
Government ($1,000s)
Education ($1,000s) Total ($1,000s)
Scott $500,210 $85,302 $11,406 $32,605 $15,726 $3,225 $1,600 $650,074 Stanton $195,262 $38,280 $3,674 $14,193 $5,133 $5,249 $4,037 $265,828 Stevens $400,687 $58,650 $10,904 $9,797 $16,160 $2,791 $9,885 $508,874 Wichita $176,524 $32,647 $3,101 $17,678 $17,622 $5,065 $6,128 $258,765 Subtotal $2,721,344 $539,599 $82,315 $154,504 $102,934 $36,516 $68,631 $3,706,732
Mitigation Planning Region D
Clark $179,303 $28,210 $11,985 $6,663 $8,969 $2,339 $10,473 $247,942 Finney $2,527,894 $574,135 $108,789 $50,842 $50,388 $19,647 $53,614 $3,385,309 Ford $2,181,622 $473,364 $127,482 $40,354 $54,313 $20,220 $40,052 $2,937,407 Gray $488,512 $73,178 $11,722 $36,073 $11,074 $8,748 $17,760 $647,067 Haskell $316,477 $62,224 $9,643 $17,236 $10,162 $6,634 $8,584 $430,960 Hodgeman $143,584 $18,841 $1,627 $11,298 $2,922 $2,560 $2,864 $183,696 Lane $158,664 $42,666 $2,374 $14,226 $4,560 $3,842 $6,321 $232,653 Meade $420,131 $51,629 $9,842 $26,158 $13,099 $4,364 $20,049 $545,272 Seward $1,361,234 $340,765 $48,002 $6,746 $38,093 $12,047 $24,223 $1,831,110 Subtotal $7,777,421 $1,665,012 $331,466 $209,596 $193,580 $80,401 $183,940 $10,441,416
Mitigation Planning Region E
Barber $433,070 $105,656 $18,671 $18,823 $15,800 $7,038 $11,253 $610,311 Barton $2,398,960 $500,059 $258,077 $42,686 $68,431 $19,194 $43,950 $3,331,357 Comanche $158,834 $27,821 $5,000 $9,086 $5,936 $1,646 $14,019 $222,342 Edwards $302,868 $54,652 $15,784 $10,714 $6,985 $7,770 $9,613 $408,386 Kiowa $224,580 $50,797 $6,998 $12,811 $13,276 $3,243 $9,212 $320,917 Pawnee $664,009 $77,874 $6,248 $12,049 $19,793 $5,064 $9,940 $794,977 Pratt $894,656 $177,358 $28,067 $21,716 $20,595 $10,875 $56,107 $1,209,374 Stafford $382,953 $71,150 $8,400 $20,701 $15,189 $2,750 $14,795 $515,938 Subtotal $5,459,930 $1,065,367 $347,245 $148,586 $166,005 $57,580 $168,889 $7,413,602
Mitigation Planning Region F
Clay $773,478 $125,761 $46,200 $30,122 $23,123 $7,308 $17,506 $1,023,498 Cloud $791,261 $154,830 $29,463 $19,073 $40,803 $8,047 $39,504 $1,082,981 Dickinson $1,785,470 $321,006 $63,799 $42,221 $57,864 $13,867 $32,613 $2,316,840 Ellsworth $574,834 $88,303 $37,982 $20,706 $20,433 $11,421 $21,229 $774,908

Kansas Hazard Mitigation Plan Final 3-38 2018
County Residential ($1,000s)
Commercial ($1,000s)
Industrial ($1,000s)
Agriculture ($1,000s)
Religion ($1,000s)
Government ($1,000s)
Education ($1,000s) Total ($1,000s)
Jewell $347,301 $41,784 $18,731 $15,449 $8,402 $6,280 $16,101 $454,048 Lincoln $391,668 $44,689 $10,496 $16,837 $9,318 $5,931 $8,672 $587,611 Mitchell $616,068 $122,773 $48,679 $24,465 $21,788 $4,650 $18,215 $856,638 Osborne $341,376 $81,545 $68,343 $19,371 $16,614 $3,705 $7,650 $538,604 Ottawa $573,325 $70,629 $20,114 $18,534 $32,759 $4,931 $16,147 $736,439 Republic $580,602 $83,036 $15,181 $27,417 $15,074 $6,892 $11,924 $740,126 Saline $4,871,442 $1,012,492 $335,226 $37,196 $122,497 $43,216 $94,629 $6,516,698 Smith $403,020 $58,463 $21,607 $17,623 $12,223 $3,295 $9,394 $525,625 Subtotal $12,049,845 $2,205,311 $715,821 $289,014 $380,898 $119,543 $293,584 $16,154,016
Mitigation Planning Region G
Butler $5,644,550 $593,993 $177,715 $44,603 $102,145 $30,588 $71,352 $6,664,946 Cowley $2,863,141 $467,222 $84,565 $27,072 $65,503 $17,500 $101,307 $3,626,310 Harper $558,034 $114,005 $46,536 $17,675 $20,842 $7,102 $15,369 $779,563 Harvey $2,937,605 $501,887 $203,015 $35,974 $86,542 $25,127 $63,613 $3,863,763 Kingman $809,962 $93,499 $72,146 $21,440 $20,868 $9,372 $14,682 $1,041,969 McPherson $2,832,041 $465,005 $277,502 $55,761 $81,015 $17,988 $37,411 $3,766,723 Marion $1,200,017 $154,955 $61,874 $33,844 $38,317 $22,195 $26,976 $1,538,178 Reno $5,390,636 $969,342 $395,829 $61,067 $125,674 `$61,487 $96,146 $7,100,181 Rice $922,270 $147,055 $36,115 $26,089 $24,744 $8,637 $33,598 $1,198,508 Sedgwick $42,651,853 $8,588,902 $3,208,594 $113,725 $808,708 $180,708 $582,890 $56,135,645 Sumner $2,219,976 $283,323 $122,372 $47,942 $61,828 $17,571 $47,695 $2,800,707 Subtotal $68,030,085 $12,379,188 $4,686,263 $485,192 $1,436,186 $336,788 $1,091,039 $88,516,493
Mitigation Planning Region H
Allen $1,168,503 $203,938 $83,621 $15,102 $38,528 $8,369 $39,655 $1,557,716 Bourbon $1,259,025 $233,149 $146,238 $13,896 $39,962 $9,189 $18,850 $1,720,309 Chautauqua $365,601 $52,602 $10,332 $46,451 $12,026 $4,307 $9,140 $500,459 Cherokee $1,666,309 $235,981 $135,630 $28,887 $42,312 $11,920 $41,976 $2,163,015 Crawford $3,103,510 $651,113 $249,504 $32,397 $75,932 $25,881 $72,941 $4,211,278 Elk $302,503 $25,955 $3,078 $4,240 $4,807 $4,480 $8,329 $353,392 Greenwood $681,297 $81,114 $23,267 $12,700 $18,061 $3,706 $14,560 $834,705 Labette $1,800,237 $305,616 $116,577 $22,762 $46,696 $19,703 $37,573 $2,349,164 Montgomery $2,950,885 $569,650 $272,528 $18,657 $102,450 $22,043 $76,459 $4,012,672

Kansas Hazard Mitigation Plan Final 3-39 2018
County Residential ($1,000s)
Commercial ($1,000s)
Industrial ($1,000s)
Agriculture ($1,000s)
Religion ($1,000s)
Government ($1,000s)
Education ($1,000s) Total ($1,000s)
Neosho $1,245,917 $272,867 $137,453 $24,753 $44,988 $22,325 $34,106 $1,782,409 Wilson $794,936 $125,398 $118,928 $18,575 $39,630 $9,891 $21,318 $1,128,676 Woodson $286,521 $31,988 $8,832 $9,306 $6,015 $4,594 $10,478 $357,734 Subtotal $15,625,244 $2,789,371 $1,305,988 $247,726 $471,407 $146,408 $385,385 $20,971,529
Mitigation Planning Region I
Chase $277,473 $25,784 $4,928 $8,119 $4,666 $2,744 $5,056 $328,770 Geary $2,597,116 $354,699 $72,177 $13,452 $49,382 $29,002 $47,463 $3,163,291 Lyon $2,705,819 $686,951 $154,942 $28,866 $64,336 $38,569 $357,560 $4,037,043 Morris $609,991 $88,187 $37,230 $34,357 $16,276 $8,303 $11,572 $805,916 Pottawatomie $1,762,317 $301,373 $83,868 $30,822 $33,444 $12,650 $30,118 $2,254,592 Riley $5,394,685 $751,222 $86,075 $41,563 $112,846 $52,137 $218,209 $6,656,737 Wabaunsee $682,047 $40,199 $18,660 $14,382 $12,999 $5,663 $38,633 $812,583 Subtotal $14,029,448 $2,248,415 $457,880 $171,561 $293,949 $149,068 $708,611 $18,058,932
Mitigation Planning Region J
Anderson $658,316 $124,150 $40,269 $20,567 $12,659 $8,700 $14,749 $879,410 Coffey $761,724 $140,804 $23,877 $23,491 $16,878 $10,733 $76,067 $1,053,574 Franklin $2,225,978 $343,011 $141,541 $31,327 $55,639 $19,070 $37,196 $2,853,762 Linn $948,957 $130,801 $34,312 $14,359 $17,957 $11,982 $14,101 $1,172,469 Miami $3,028,856 $359,699 $129,281 $30,922 $57,520 $12,256 $87,882 $3,706,416 Osage $1,425,639 $152,698 $17,331 $23,767 $34,843 $13,191 $28,181 $1,695,650 Shawnee $15,966,710 $2,920,933 $566,856 $54,315 $379,717 $315,624 $261,391 $20,465,546 Subtotal $25,016,180 $4,172,096 $953,467 $198,748 $575,213 $391,556 $519,567 $31,826,827
Mitigation Planning Region K
Atchison $1,473,238 $318,870 $174,307 $26,752 $44,340 $10,264 $29,569 $2,077,340 Brown $830,487 $181,994 $44,433 $24,713 $24,395 $10,492 $19,259 $1,135,773 Doniphan $698,298 $104,303 $33,291 $26,761 $12,865 $7,603 $70,489 $953,610 Douglas $9,914,359 $1,613,351 $445,073 $53,829 $183,812 $59,265 $220,151 $12,489,840 Jackson $1,231,822 $128,354 $36,066 $21,085 $23,824 $15,745 $20,289 $1,477,185 Jefferson $1,896,855 $169,452 $59,327 $23,789 $37,051 $19,224 $34,136 $2,239,834 Marshall $869,634 $163,819 $89,198 $43,033 $31,343 $9,618 $24,404 $1,231,049 Nemaha $964,612 $160,681 $54,897 $45,398 $21,607 $9,104 $25,797 $1,282,096

Kansas Hazard Mitigation Plan Final 3-40 2018
County Residential ($1,000s)
Commercial ($1,000s)
Industrial ($1,000s)
Agriculture ($1,000s)
Religion ($1,000s)
Government ($1,000s)
Education ($1,000s) Total ($1,000s)
Washington $462,844 $95,510 $12,748 $38,074 $19,438 $6,002 $16,225 %650,841 Subtotal $18,342,149 $2,936,334 $949,340 $303,434 $398,675 $147,317 $460,319 $22,893,235
Mitigation Planning Region L
Johnson $60,513,754 $11,658,309 $2,420,521 $157,111 $848,457 $201,234 $593,090 $76,392,486 Leavenworth $6,829,875 $812,889 $145,250 $37,469 $110,421 $57,239 $180,869 $8,174,012 Wyandotte $12,211,531 $3,430,956 $1,044,423 $30,987 $472,361 $93,385 $248,759 $17,532,402 Subtotal $79,555,160 $15,902,154 $3,610,194 $225,567 $1,431,239 $351,858 $1,022,718 $102,098,900
Statewide Total $257,549,533 $47,732,824 $13,842,877 $3,048,698 $5,706,513 $1,977,620 $5,202,528 $335,060,593

Kansas Hazard Mitigation Plan Final 3-41 2018
Table 3.22. Estimated Replacement Value of Building’s Contents by Category for Kansas
County Residential ($1,000s)
Commercial ($1,000s)
Industrial ($1,000s)
Agriculture ($1,000s)
Religion ($1,000s)
Government ($1,000s)
Education ($1,000s) Total ($1,000s)
Mitigation Planning Region A Cheyenne $120,534 $52,292 $16,110 $15,420 $7,932 $1,269 $8,017 $221,574 Decatur $143,768 $49,726 $8,735 $14,770 $12,109 $3,517 $5,773 $238,398 Gove $120,149 $55,444 $21,368 $23,122 $8,091 $3,494 $17,397 $249,065 Logan $122,505 $70,760 $6,564 $16,332 $8,557 $3,317 $9,357 $237,392 Rawlins $136,736 $65,510 $11,195 $17,663 $7,744 $5,902 $7,322 $252,072 Sheridan $132,678 $55,374 $6,336 $14,757 $6,786 $2,337 $8,108 $226,376 Sherman $292,810 $146,015 $21,443 $20,840 $20,563 $5,138 $21,317 $528,126 Thomas $349,426 $181,110 $28,334 $29,962 $24,941 $6,869 $60,696 $681,338 Wallace $87,872 $24,691 $2,521 $9,206 $5,924 $4,507 $5,412 $140,133 Subtotal $1,506,478 $700,922 $122,606 $162,072 $102,647 $36,350 $143,399 $2,774,474
Mitigation Planning Region B Ellis $1,208,693 $572,567 $203,719 $28,419 $45,541 $21,396 $80,376 $2,160,711 Graham $136,953 $68,236 $11,284 $6,187 $6,285 $2,091 $8,800 $239,836 Ness $196,005 $90,228 $19,031 $11,675 $15,182 $2,989 $9,697 $344,807 Norton $252,848 $98,081 $38,705 $19,856 $12,627 $8,736 $12,286 $443,139 Phillips $286,857 $92,141 $37,498 $20,237 $18,417 $8,347 $18,664 $482,161 Rooks $249,107 $119,451 $35,191 $331,540 $18,923 $8,521 $12,083 $774,816 Rush $142,527 $57,792 $29,722 $11,766 $8,554 $4,610 $10,811 $265,782 Russell $339,636 $127,457 $51,258 $14,736 $17,200 $7,094 $13,728 $571,109 Trego $151,590 $51,005 $11,048 $8,282 $10,786 $9,927 $8,051 $250,689 Subtotal $2,964,216 $1,276,958 $437,456 $452,698 $153,515 $73,711 $174,496 $5,533,050
Mitigation Planning Region C
Grant $284,223 $175,171 $44,722 $22,443 $17,318 $5,862 $16,575 $566,314 Greeley $76,024 $37,287 $5,057 $9,638 $3,467 $1,513 $5,024 $138,010 Hamilton $87,224 $48,097 $4,788 $19,463 $6,797 $5,364 $4,318 $176,051 Kearny $133,046 $38,511 $8,333 $16,564 $6,720 $4,553 $10,928 $218,655 Morton $144,830 $64,492 $11,167 $12,123 $13,991 $5,805 $10,136 $262,544 Scott $250,298 $86,278 $15,009 $32,605 $15,726 $3,225 $1,600 $404,741 Stanton $97,803 $43,720 $4,825 $14,193 $5,133 $5,249 $4,037 $174,960

Kansas Hazard Mitigation Plan Final 3-42 2018
County Residential ($1,000s)
Commercial ($1,000s)
Industrial ($1,000s)
Agriculture ($1,000s)
Religion ($1,000s)
Government ($1,000s)
Education ($1,000s) Total ($1,000s)
Stevens $200,687 $60,614 $14,094 $9,797 $16,160 $2,791 $9,885 $314,028 Wichita $88,429 $36,189 $4,219 $17,678 $17,622 $6,758 $6,128 $177,023 Subtotal $1,362,564 $590,359 $112,214 $154,504 $102,934 $41,120 $68,631 $2,432,326
Mitigation Planning Region D
Clark $89,795 $30,753 $17,098 $6,663 $8,969 $2,576 $11,062 $166,916 Finney $1,264,400 $620,459 $147,649 $50,842 $50,388 $21,814 $54,952 $2,210,504 Ford $1,091,558 $505,895 $181,679 $40,354 $54,313 $22,437 $42,734 $1,938,970 Gray $244,581 $73,800 $15,547 $36,073 $11,074 $10,108 $17,760 $408,943 Haskell $158,469 $72,786 $13,763 $17,236 $10,162 $8,362 $8,584 $289,362 Hodgeman $71,924 $20,042 $2,035 $11,298 $2,922 $2,560 $2,864 $113,645 Lane $79,491 $50,494 $3,361 $14,226 $4,560 $4,166 $6,321 $162,619 Meade $210,311 $53,241 $13,376 $26,158 $13,099 $4,607 $20,049 $340,841 Seward $681,170 $380,164 $64,230 $6,746 $38,093 $12,047 $25,043 $1,207,493 Subtotal $3,891,699 $1,807,634 $458,738 $209,596 $193,580 $88,677 $189,369 $6,839,293
Mitigation Planning Region E
Barber $216,833 $117,359 $25,664 $18,823 $15,800 $7,315 $11,465 $413,259 Barton $1,200,138 $543,256 $372,104 $42,686 $68,431 $21,546 $45,670 $2,293,831 Comanche $79,544 $30,735 $7,152 $9,086 $5,936 $1,704 $14,019 $148,176 Edwards $151,628 $59,345 $22,688 $10,714 $6,985 $9,200 $9,795 $270,355 Kiowa $112,438 $54,507 $9,424 $12,811 $13,276 $3,741 $9,232 $215,429 Pawnee $332,269 $83,159 $7,482 $12,049 $19,793 $5,614 $9,940 $470,306 Pratt $447,658 $184,316 $37,553 $21,716 $20,595 $12,415 $77,116 $801,369 Stafford $191,763 $76,612 $11,344 $20,701 $15,189 $2,750 $14,795 $333,154 Subtotal $2,732,271 $1,149,289 $493,411 $148,586 $166,005 $64,285 $192,032 $4,945,879
Mitigation Planning Region F
Clay $387,141 $128,822 $64,903 $30,122 $23,123 $8,620 $17,506 $660,237 Cloud $395,972 $171,153 $38,032 $19,073 $40,803 $8,441 $50,246 $723,720 Dickinson $893,574 $343,707 $88,740 $42,221 $57,864 $15,716 $32,613 $1,474,435 Ellsworth $287,796 $94,975 $55,133 $20,706 $20,433 $12,964 $21,229 $513,236 Jewell $173,894 $44,088 $27,382 $15,449 $8,402 $6,280 $16,101 $291,596 Lincoln $196,044 $46,517 $14,386 $16,837 $9,318 $7,031 $8,672 $298,805

Kansas Hazard Mitigation Plan Final 3-43 2018
County Residential ($1,000s)
Commercial ($1,000s)
Industrial ($1,000s)
Agriculture ($1,000s)
Religion ($1,000s)
Government ($1,000s)
Education ($1,000s) Total ($1,000s)
Mitchell $308,302 $125,922 $65,329 $24,465 $21,788 $4,650 $20,603 $571,059 Osborne $170,938 $84,744 $100,837 $19,371 $16,614 $4,371 $7,650 $404,525 Ottawa $286,939 $75,239 $27,694 $18,534 $32,759 $5,899 $16,147 $463,211 Republic $290,575 $88,688 $20,769 $27,417 $15,074 $8,172 $11,924 $462,619 Saline $2,436,606 $1,094,546 $469,042 $37,196 $122,497 $47,456 $100,117 $4,307,460 Smith $201,744 $63,641 $31,491 $17,623 $12,223 $3,619 $9,394 $339,735 Subtotal $6,029,525 $2,362,042 $1,003,738 $289,014 $380,898 $133,219 $312,202 $10,510,638
Mitigation Planning Region G
Butler $2,823,534 $641,771 $235,820 $44,603 $102,145 $35,654 $74,364 $3,957,891 Cowley $1,432,459 $505,837 $117,208 $27,072 $65,503 $19,484 $133,727 $2,301,290 Harper $279,411 $124,951 $68,235 $17,675 $20,842 $7,304 $15,369 $533,787 Harvey $1,474,482 $555,501 $284,916 $35,974 $86,542 $26,520 $69,558 $2,533,493 Kingman $405,356 $99,788 $105,639 $21,440 $20,868 $11,202 $14,682 $678,975 Marion $600,640 $159,326 $87,118 $33,844 $38,317 $27,146 $27,690 $974,081 McPherson $1,416,919 $517,899 $403,651 $55,761 $81,015 $21,045 $38,792 $2,535,082 Reno $2,696438 $1,015,761 $561,951 $61,067 $125,674 $64,606 $101,160 $4,626,657 Rice $461,540 $155,760 $50,863 $26,089 $24,744 $10,172 $34,321 $763,489 Sedgwick $21,329,744 $9,745,292 $4,623,478 $113,725 $808,973 $198,319 $609,163 $37,428,694 Sumner $1,111,030 $307,345 $175,212 $47,942 $61,828 $19,516 $47,880 $1,770,753 Subtotal $34,031,553 $13,829,231 $6,714,091 $485,192 $1,436,451 $440,968 $1,166,706 $58,104,192
Mitigation Planning Region H
Allen $585,024 $216,411 $120,941 $15,102 $38,528 $8,369 $46,948 $1,031,323 Bourbon $630,145 $256,948 $214,039 $13,896 $39,962 $9,454 $19,762 $1,184,206 Chautauqua $183,067 $61,140 $14,366 $46,451 $12,026 $4,635 $9,140 $330,825 Cherokee $834,076 $244,954 $194,971 $28,887 $42,312 $13,168 $42,596 $1,400,964 Crawford $1,552,972 $719,506 $356,703 $32,397 $75,932 $28,446 $82,057 $2,848,013 Elk $151,484 $27,992 $3,870 $4,240 $4,807 $5,092 $8,329 $205,814 Greenwood $341,086 $87,150 $31,269 $12,700 $18,061 $4,244 $14,560 $509,070 Labette $901,019 $341,631 $167,628 $22,762 $46,696 $22,988 $38,474 $1,541,198 Montgomery $1,476,709 $624,532 $391,218 $18,657 $102,450 $24,609 $89,267 $2,727,442 Neosho $623,611 $280,523 $196,895 $24,753 $44,988 $24,735 $36,522 $1,232,027 Wilson $398,108 $135,255 $171,742 $18,575 $39,630 $10,772 $21,318 $795,400
Kansas Hazard Mitigation Plan Final 3-44 2018
County Residential ($1,000s)
Commercial ($1,000s)
Industrial ($1,000s)
Agriculture ($1,000s)
Religion ($1,000s)
Government ($1,000s)
Education ($1,000s) Total ($1,000s)
Woodson $143,558 $32,910 $12,398 $9,306 $6,015 $5,151 $10,478 $219,816 Subtotal $7,820,859 $3,028,952 $1,876,040 $247,726 $471,407 $161,663 $419,451 $14,026,098
Mitigation Planning Region I
Chase $138,917 $26,376 $6,175 $8,119 $4,666 $2,744 $5,056 $192,053 Geary $1,299,214 $380,005 $100,950 $13,452 $49,382 $31,128 $49,966 $1,924,097 Lyon $1,353,841 $768,355 $220,016 $28,866 $64,336 $42,074 $503,411 $1,980,899 Morris $305,357 $90,308 $51,578 $34,357 $16,276 $9,711 $13,132 $520,719 Pottawatomie $881,821 $331,991 $116,013 $30,822 $33,444 $15,388 $31,722 $1,441,201 Riley $2,698,307 $796,879 $111,894 $41,563 $112,846 $54,110 $289,268 $4,104,867 Wabaunsee $341,423 $40,771 $25,294 $14,382 $12,999 $6,307 $38,633 $479,809 Subtotal $7,018,880 $2,434,685 $631,920 $171,561 $293,949 $161,462 $931,188 $11,643,645
Mitigation Planning Region J Anderson $329,608 $135,992 $56,893 $20,567 $12,659 $9,902 $14,749 $580,370 Coffey $381,414 $148,672 $32,592 $23,491 $16,878 $11,595 $76,067 $690,708 Franklin $1,113,859 $359,964 $196,135 $31,327 $55,639 $22,552 $40,820 $1,820,296 Linn $475,185 $132,509 $45,749 $14,359 $17,957 $15,308 $14,101 $715,168 Miami $1,515,216 $381,983 $167,354 $30,922 $57,520 $14,797 $88,001 $2,255,793 Osage $713,504 $154,940 $21,445 $23,767 $34,843 $14,867 $28,957 $992,323 Shawnee $7,985,420 $3,153,241 $759,472 $54,315 $379,717 $322,271 $271,099 $12,925,535 Subtotal $12,514,206 $4,467,301 $1,279,640 $198,748 $575,213 $411,292 $533,794 $19,980,193
Mitigation Planning Region K
Atchison $737,109 $350,524 $252,208 $26,752 $44,340 $11,800 $29,884 $1,452,617 Brown $415,653 $196,597 $62,748 $24,713 $24,395 $12,195 $19,361 $755,662 Doniphan $349,494 $110,238 $46,307 $26,761 $12,865 $8,892 $90,518 $645,075 Douglas $4,958,508 $1,731,195 $619,824 $53,829 $183,812 $68,680 $280,224 $7,896,072 Jackson $616,403 $137,937 $47,788 $21,085 $23,824 $18,680 $20,289 $886,006 Jefferson $949,018 $186,277 $76,803 $23,789 $37,051 $24,228 $34,136 $1,331,302 Marshall $435,374 $170,506 $130,312 $43,033 $31,343 $10,455 $24,404 $845,427 Nemaha $482,847 $172,400 $78,861 $45,398 $21,607 $11,062 $25,797 $837,972 Washington $231,727 $98,936 $16,476 $38,074 $19,438 $7,903 $16,225 $428,779

Kansas Hazard Mitigation Plan Final 3-45 2018
County Residential ($1,000s)
Commercial ($1,000s)
Industrial ($1,000s)
Agriculture ($1,000s)
Religion ($1,000s)
Government ($1,000s)
Education ($1,000s) Total ($1,000s)
Subtotal $9,176,133 $3,154,610 $1,331,327 $303,434 $398,675 $173,895 $540,838 $15,078,912
Mitigation Planning Region L Johnson $30,260,089 $12,361,773 $3,369,301 $157,111 $848,457 $227,046 $663,699 $47,887,476 Leavenworth $3,415,840 $881,652 $181,652 $37,469 $110,421 $63,441 $185,855 $4,876,330 Wyandotte $6,107,028 $3,687,814 $1,484,610 $30,987 $472,361 $98,622 $295,122 $12,176,544 Subtotal $39,782,957 $16,931,239 $5,035,563 $225,567 $1,431,239 $389,109 $1,144,676 $64,940,350 Statewide Total $128,831,341 $51,733,222 $19,496,744 $3,048,698 $5,706,513 $2,175,750 $5,816,782 $216,809,050

Kansas Hazard Mitigation Plan Final 3-46 2018
Figure 3.7. Total Building Exposure (Structure and Content) (1000’s)
Kansas Hazard Mitigation Plan Final 3-47 2018
Cultural Resources
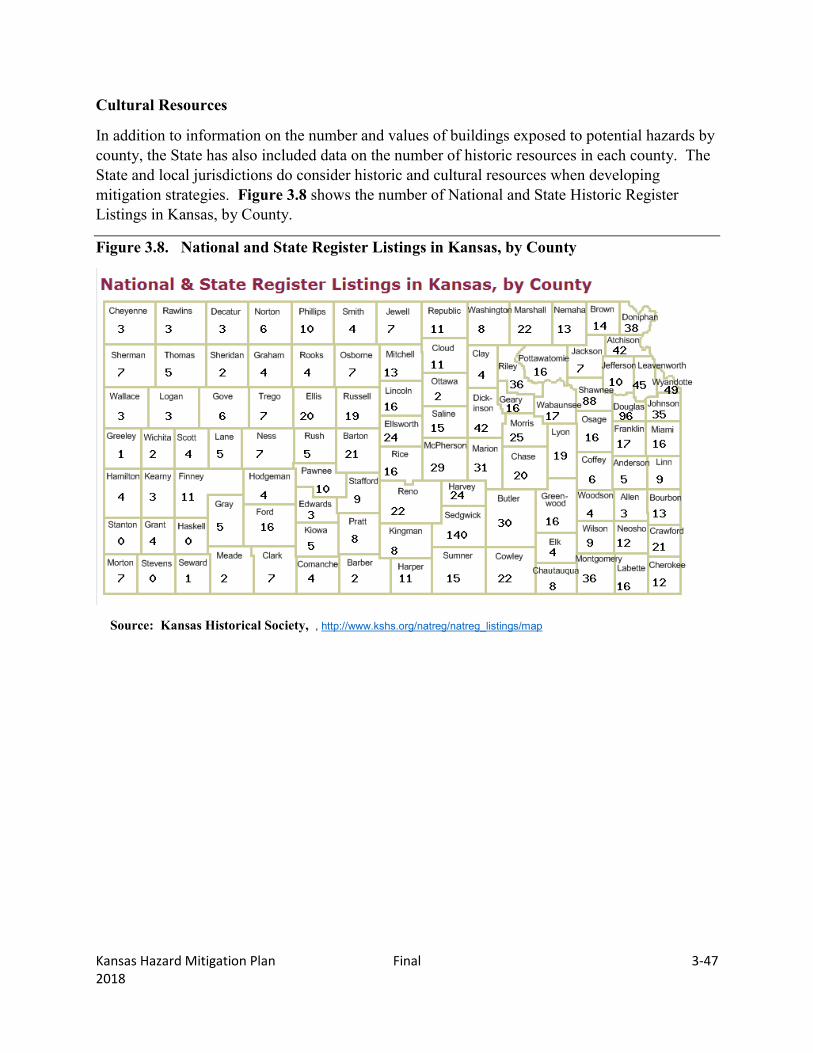
In addition to information on the number and values of buildings exposed to potential hazards by county, the State has also included data on the number of historic resources in each county. The State and local jurisdictions do consider historic and cultural resources when developing mitigation strategies. Figure 3.8 shows the number of National and State Historic Register Listings in Kansas, by County.
Figure 3.8. National and State Register Listings in Kansas, by County
Source: Kansas Historical Society, , http://www.kshs.org/natreg/natreg_listings/map

Kansas Hazard Mitigation Plan Final 3-48 2018
3.2. Hazard Identification Requirement §201.4(c)(2)(i): The state risk assessment shall include an] overview of the type…of all natural hazards that can affect the State.
The natural, technological and manmade hazards that pose a threat to Kansas are identified in this section. In addition, this section defines the current priority for planning significance assigned to each hazard by the KHMT based on the profiles and vulnerability assessments.
As an interagency state level committee, the KHMT represents a broad range of expertise and interest related to hazard mitigation. When considering the human, economic and environmental impacts of disasters and emergencies, the origin of the event is not as significant as its effect. Therefore, the KHMT chose to address natural, technological and manmade hazards, recognizing that mitigation efforts for one may be beneficial for the others. In its initial process to identify and categorize the hazards threatening Kansas, the KHMT worked as a single group, exchanging information and viewpoints during a facilitated consensus process to reach decisions on the hazards to be addressed and the priority for each. The intent of the analysis was an objective assessment of the vulnerability of the State of Kansas to each hazard under discussion.
In deciding to discuss hazards as individual hazards, it must be emphasized that this division is somewhat artificial and used only to facilitate analyses. That is, one hazard event can result in another different hazard event. For example, drought can lead to wildfire, soil erosion and dust; severe winter storms and high wind events often cause utility and infrastructure failures. Similarly, some hazards can occur simultaneously, as the result of the same storm (e.g., tornado, hailstorm, lightning, flood and windstorm).
Methodology
Based on the experience of the representatives of the participating agencies of the KHMT, the hazards identified in the previous plans have been revisited, reevaluated, reorganized and reprioritized to reflect the hazards environment in Kansas at the time of the 2018 plan update. Twenty-two hazards have been identified as threatening to all or significant portions of the state of Kansas, and pose a sufficient level of human, economic and/or environmental risk to the communities of the State that they warrant incorporation into the Kansas Hazard Mitigation Plan. Listed alphabetically, these hazards are:
Agricultural Infestation Hailstorm Soil Erosion and Dust
Civil Disorder Hazardous Materials Terrorism/Agri-Terrorism Dam and Levee Failure Land Subsidence Tornado Drought Landslide Utility/Infrastructure Failure Earthquake Lightning Wildfire
Expansive Soils Major Disease Outbreak Windstorm Extreme Temperatures Radiological Winter Storm Flood

Kansas Hazard Mitigation Plan Final 3-49 2018
The following natural hazards identified by FEMA are not included in this analysis because they do not threaten Kansas: avalanche, coastal erosion, coastal storm, hurricane, tsunami and volcano.
In the previous plan and in this plan, the State used the methodology to prioritize the 22 hazards based on a Calculated Priority Risk Index (CPRI) that considered four elements of risk: probability, magnitude/severity, warning time and duration. Table 3.23 defines the levels for each element of risk.

Kansas Hazard Mitigation Plan Final 3-50 2018
Table 3.23. Calculated Priority Risk Index (CPRI) Element Definitions
Element/Level Characteristics
Probability*
4 - Highly Likely
Event is probable within the calendar year Event has up to 1 in 1 year chance of occurring (1/1=100%) History of events is greater than 33% likely per year Event is "Highly Likely" to occur
3 - Likely
Event is probable within the next three years
Event has up to 1 in 3 years chance of occurring (1/3=33%)
History of events is greater than 20% but less than or equal to 33% likely per year Event is "Likely" to occur
2 - Possible
Event is probable within the next five years Event has up to 1 in 5 years chance of occurring (1/5=20%) History of events is greater than 10% but less than or equal to 20% likely per year Event could "Possibly" occur
1 - Unlikely
Event is possible within the next 10 years Event has up to 1 in 10 years chance of occurring (1/10=10%) History of events is less than or equal to 10% likely per year Event is "Unlikely" but is possible of occurring
Magnitude / Severity**
4 - Catastrophic Multiple deaths Complete shutdown of facilities for 30 or more days More than 50% of property is severely damaged
3 - Critical Injuries and/or illnesses result in permanent disability Complete shutdown of critical facilities for at least two weeks 25–50% of property is severely damaged
2 - Limited Injuries and/or illnesses do not result in permanent disability Complete shutdown of critical facilities for more than one week 10–25% of property is severely damaged
1 - Negligible
Injuries and/or illnesses are treatable with first aid Minor quality of life lost Shutdown of critical facilities and services for 24 hours or less Less than 10% of property is severely damaged
Warning Time 4 Less Than 6 Hours 3 6-12 Hours 2 12-24 Hours 1 24+ Hours Duration 4 More Than 1 Week 3 Less Than 1 Week 2 Less Than 1 Day 1 Less Than 6 Hours
* Based on history, using the definitions given, the likelihood of future events is quantified. ** According to the severity associated with past events or the probable worst case scenario possible in the state.
Kansas Hazard Mitigation Plan Final 3-51 2018
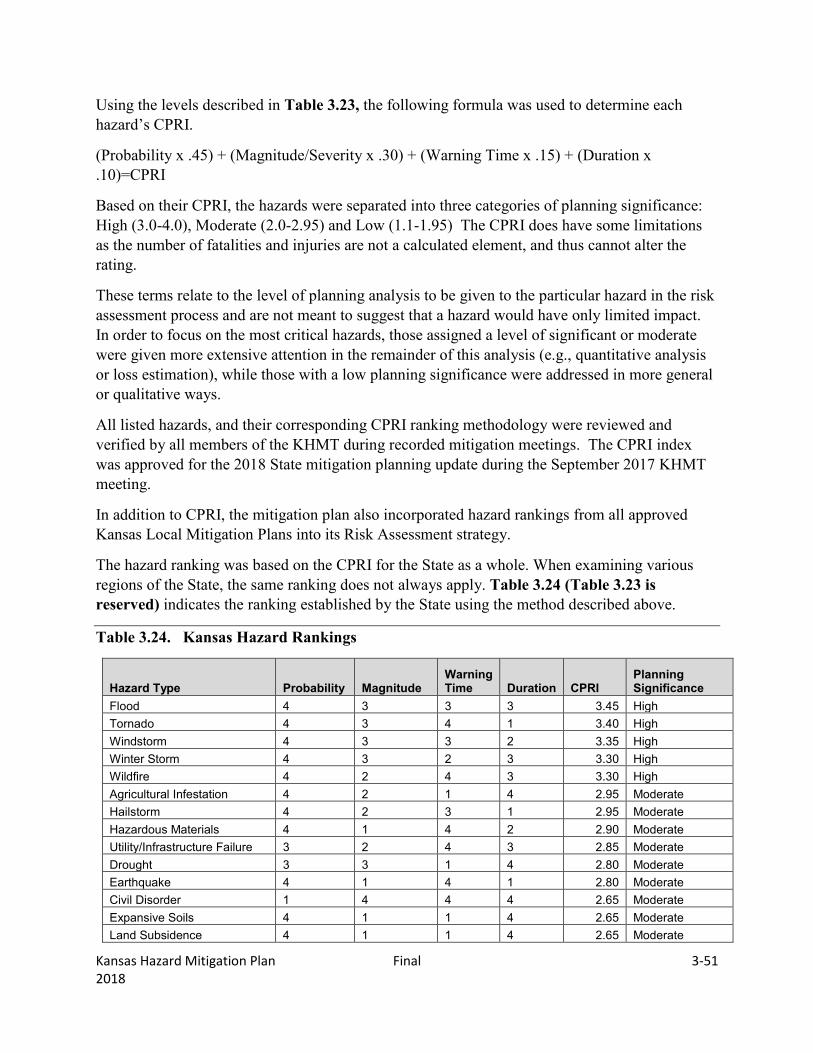
Using the levels described in Table 3.23, the following formula was used to determine each hazard’s CPRI.
(Probability x .45) + (Magnitude/Severity x .30) + (Warning Time x .15) + (Duration x .10)=CPRI
Based on their CPRI, the hazards were separated into three categories of planning significance: High (3.0-4.0), Moderate (2.0-2.95) and Low (1.1-1.95) The CPRI does have some limitations as the number of fatalities and injuries are not a calculated element, and thus cannot alter the rating.
These terms relate to the level of planning analysis to be given to the particular hazard in the risk assessment process and are not meant to suggest that a hazard would have only limited impact. In order to focus on the most critical hazards, those assigned a level of significant or moderate were given more extensive attention in the remainder of this analysis (e.g., quantitative analysis or loss estimation), while those with a low planning significance were addressed in more general or qualitative ways.
All listed hazards, and their corresponding CPRI ranking methodology were reviewed and verified by all members of the KHMT during recorded mitigation meetings. The CPRI index was approved for the 2018 State mitigation planning update during the September 2017 KHMT meeting.
In addition to CPRI, the mitigation plan also incorporated hazard rankings from all approved Kansas Local Mitigation Plans into its Risk Assessment strategy.
The hazard ranking was based on the CPRI for the State as a whole. When examining various regions of the State, the same ranking does not always apply. Table 3.24 (Table 3.23 is reserved) indicates the ranking established by the State using the method described above.
Table 3.24. Kansas Hazard Rankings
Hazard Type Probability Magnitude Warning Time Duration CPRI
Planning Significance
Flood 4 3 3 3 3.45 High Tornado 4 3 4 1 3.40 High Windstorm 4 3 3 2 3.35 High Winter Storm 4 3 2 3 3.30 High Wildfire 4 2 4 3 3.30 High Agricultural Infestation 4 2 1 4 2.95 Moderate Hailstorm 4 2 3 1 2.95 Moderate Hazardous Materials 4 1 4 2 2.90 Moderate Utility/Infrastructure Failure 3 2 4 3 2.85 Moderate Drought 3 3 1 4 2.80 Moderate Earthquake 4 1 4 1 2.80 Moderate Civil Disorder 1 4 4 4 2.65 Moderate Expansive Soils 4 1 1 4 2.65 Moderate Land Subsidence 4 1 1 4 2.65 Moderate
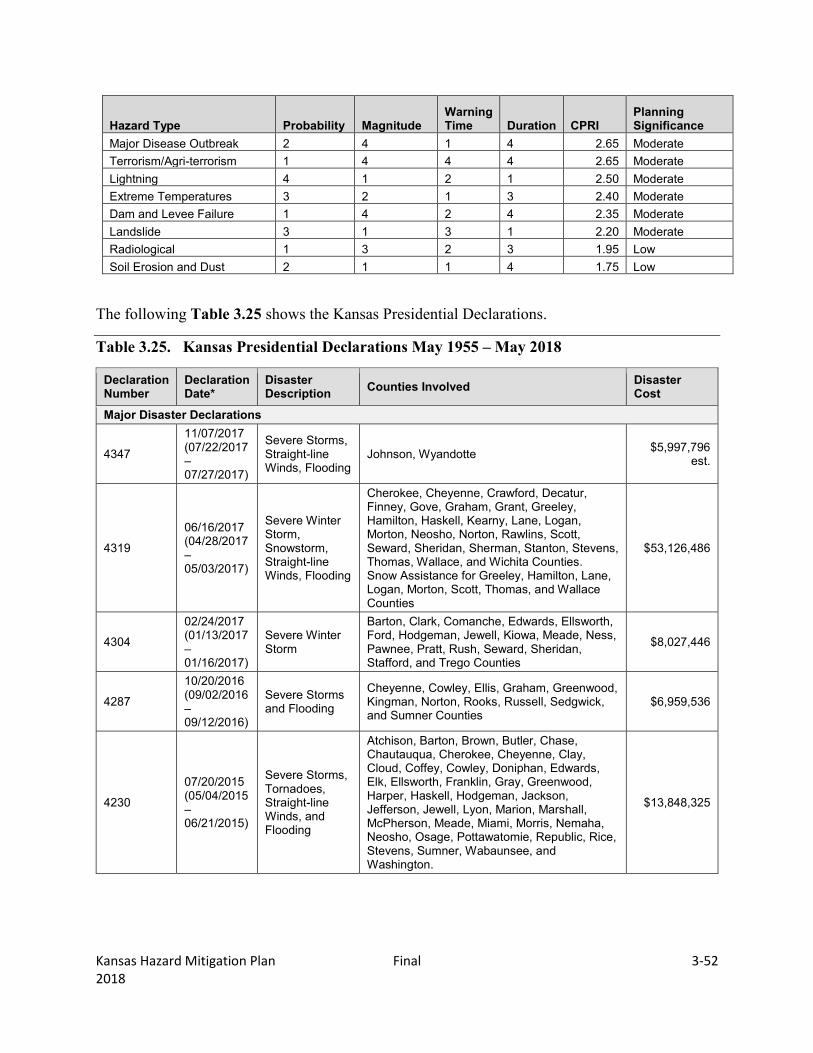
Kansas Hazard Mitigation Plan Final 3-52 2018
Hazard Type Probability Magnitude Warning Time Duration CPRI
Planning Significance
Major Disease Outbreak 2 4 1 4 2.65 Moderate Terrorism/Agri-terrorism 1 4 4 4 2.65 Moderate Lightning 4 1 2 1 2.50 Moderate Extreme Temperatures 3 2 1 3 2.40 Moderate Dam and Levee Failure 1 4 2 4 2.35 Moderate Landslide 3 1 3 1 2.20 Moderate Radiological 1 3 2 3 1.95 Low Soil Erosion and Dust 2 1 1 4 1.75 Low
The following Table 3.25 shows the Kansas Presidential Declarations.
Table 3.25. Kansas Presidential Declarations May 1955 – May 2018
Declaration Number
Declaration Date*
Disaster Description Counties Involved Disaster
Cost Major Disaster Declarations
4347
11/07/2017 (07/22/2017 – 07/27/2017)
Severe Storms, Straight-line Winds, Flooding
Johnson, Wyandotte $5,997,796 est.
4319
06/16/2017 (04/28/2017 – 05/03/2017)
Severe Winter Storm, Snowstorm, Straight-line Winds, Flooding
Cherokee, Cheyenne, Crawford, Decatur, Finney, Gove, Graham, Grant, Greeley, Hamilton, Haskell, Kearny, Lane, Logan, Morton, Neosho, Norton, Rawlins, Scott, Seward, Sheridan, Sherman, Stanton, Stevens, Thomas, Wallace, and Wichita Counties. Snow Assistance for Greeley, Hamilton, Lane, Logan, Morton, Scott, Thomas, and Wallace Counties
$53,126,486
4304
02/24/2017 (01/13/2017 – 01/16/2017)
Severe Winter Storm
Barton, Clark, Comanche, Edwards, Ellsworth, Ford, Hodgeman, Jewell, Kiowa, Meade, Ness, Pawnee, Pratt, Rush, Seward, Sheridan, Stafford, and Trego Counties
$8,027,446
4287
10/20/2016 (09/02/2016 – 09/12/2016)
Severe Storms and Flooding
Cheyenne, Cowley, Ellis, Graham, Greenwood, Kingman, Norton, Rooks, Russell, Sedgwick, and Sumner Counties
$6,959,536
4230
07/20/2015 (05/04/2015 – 06/21/2015)
Severe Storms, Tornadoes, Straight-line Winds, and Flooding
Atchison, Barton, Brown, Butler, Chase, Chautauqua, Cherokee, Cheyenne, Clay, Cloud, Coffey, Cowley, Doniphan, Edwards, Elk, Ellsworth, Franklin, Gray, Greenwood, Harper, Haskell, Hodgeman, Jackson, Jefferson, Jewell, Lyon, Marion, Marshall, McPherson, Meade, Miami, Morris, Nemaha, Neosho, Osage, Pottawatomie, Republic, Rice, Stevens, Sumner, Wabaunsee, and Washington.
$13,848,325

Kansas Hazard Mitigation Plan Final 3-53 2018
Declaration Number
Declaration Date*
Disaster Description Counties Involved Disaster
Cost
4150
10/22/2013 (07/22/2013 – 08/15/2013)
Severe Storms, Straight-line Winds, Tornadoes, and Flooding
Barber, Barton, Bourbon, Butler, Chase, Cherokee, Clark, Clay, Cloud, Coffey, Comanche, Cowley, Crawford, Dickinson, Edwards, Elk, Ellsworth, Ford, Geary, Greenwood, Hamilton, Harper, Harvey, Hodgeman, Kingman, Kiowa, Lane, Linn, Lyon, Marion, McPherson, Meade, Montgomery, Morris, Ness, Ottawa, Pawnee, Pratt, Reno, Republic, Rice, Saline, Sumner, Washington, Wilson, and Woodson Counties.
$11,412,827
4112 04/26/2013 (02/20-02/23/2013)
Snowstorm
Barber, Barton, Dickinson, Ellis, Franklin, Harper, Harvey, Hodgeman, Kingman, Marion, McPherson, Ness, Osage, Osborne, Pawnee, Phillips, Pratt, Rice, Rooks, Rush, Russell, Smith and Stafford.
$1,102,861 (Estimate)
4063 05/24/2012 (4/14-4/15/2012)
Severe Storms, Tornadoes, Straight-line Winds and Flooding
Edwards, Ellsworth, Harper, Hodgeman, Jewell, Kiowa, Mitchell, Osborne, Rice, Rush, Russell, Sedgwick, Stafford and Sumner
$6,923,919
4035 09/23/2011 (6/1-8/1/2011)
Flooding Atchison, Doniphan, Leavenworth and Wyandotte $7,462,881
4010 07/29/2011 (5/19-6/4/2011)
Severe Storms, Straight-line Winds, Tornadoes and Flooding
Barton, Clay, Cloud, Hamilton, Jewell, Lincoln, Logan, Lyon, Marion, Mitchell, Morton, Osage, Osborne, Ottawa, Pottawatomie, Republic, Riley, Rooks, Rush, Russell, Sherman, Smith, Stafford, Stanton and Washington
$8,259,620
1932 08/10/2010 (6/7-7/21/2010)
Severe Storms, Flooding and Tornadoes
Atchison, Brown, Butler, Chase, Cheyenne, Clay, Cloud, Comanche, Decatur, Doniphan, Elk, Ellis, Franklin, Greenwood, Harvey, Jackson, Jewell, Kiowa, Lyon, Marion, Marshall, McPherson, Miami, Mitchell, Morris, Norton, Osage, Osborne, Pawnee, Phillips, Pottawatomie, Republic, Riley, Rooks, Rush, Sheridan, Smith, Wabaunsee, Washington, Wilson and Woodson
$9,279,257
1885 03/09/2010 (12/9/2009-1/8/2010)
Severe Winter Storms and Snowstorm
Allen, Anderson, Atchison, Bourbon, Brown, Butler, Cherokee, Cheyenne, Clay, Cowley, Crawford, Decatur, Doniphan, Elk, Franklin, Gove, Graham, Greenwood, Jackson, Jefferson, Jewell, Labette, Linn, Logan, Lyon, Marshall, Miami, Morris, Nemaha, Neosho, Norton, Osage, Phillips, Pottawatomie, Rawlins, Republic, Riley, Shawnee, Sheridan, Wabaunsee, Wallace, Washington, Wilson, Woodson and Wyandotte
$19,100,658
1868 12/23/2009 (11/14-11/16/2009)
Severe Winter Storm Marshall, Republic and Washington $43,217,690
1860 09/30/2009 (7/8-7/14/2009)
Severe Storms and Flooding
Anderson, Bourbon, Franklin, Linn and Sedgwick $3,347,662

Kansas Hazard Mitigation Plan Final 3-54 2018
Declaration Number
Declaration Date*
Disaster Description Counties Involved Disaster
Cost
1849 06/25/2009 (4/25-5/16/2009)
Severe Storms, Flooding, Straight-line Winds, and Tornadoes
Anderson, Barber, Bourbon, Butler, Chase, Cherokee, Coffey, Cowley, Crawford, Elk, Finney, Greenwood, Harper, Harvey, Kingman, Labette, Linn, Lyon, Marion, Marshall, Montgomery, Morris, Neosho, Reno, Rice, Sumner, Wabaunsee and Wilson
$15,013,488
1848 06/24/2009 (3/26-29/2009)
Severe Winter Storm and Record and Near Record Snow
Butler, Chase, Chautauqua, Coffey, Cowley, Dickinson, Elk, Grant, Greenwood, Harvey, Lyon, Marion, Morris, Sumner, and Woodson
$20,174,657
1808 10/31/2008 Severe Storms, Flooding, and Tornadoes
Anderson, Butler, Chase, Cowley, Greenwood, Harper, Harvey, Russell, and Sumner $4,167,044
1776 07/09/2008 Severe Storms, Flooding, and Tornadoes
Barber, Barton, Bourbon, Brown, Butler, Chautauqua, Cherokee, Clark, Clay, Comanche, Cowley, Crawford, Decatur, Dickinson, Edwards, Elk, Ellis, Ellsworth, Franklin, Gove, Graham, Harper, Haskell, Hodgeman, Jackson, Jewell, Kingman, Kiowa, Lane, Linn, Logan, Mitchell, Montgomery, Ness, Norton, Osborne, Pawnee, Phillips, Pratt, Reno, Republic, Riley, Rooks, Rush, Saline, Seward, Sheridan, Smith, Stafford, Sumner, Thomas, Trego, Wallace and Wilson
$70,629,544
1741 02/01/2008 Severe Winter Storms
Atchison, Barber, Barton, Brown, Butler, Chase, Cherokee, Clark, Clay, Cloud, Comanche, Crawford, Dickinson, Doniphan, Edwards, Ellis, Ellsworth, Ford, Geary, Graham, Gove, Harvey, Hodgeman, Jackson, Jefferson, Jewell, Kingman, Kiowa, Labette, Leavenworth, Lincoln, Logan, Lyon, Marion, Marshall, McPherson, Miami, Mitchell, Morris, Nemaha, Osage, Osborne, Ottawa, Pawnee, Phillips, Pottawatomie, Pratt, Reno, Republic, Rice, Riley, Rooks, Rush, Russell, Saline, Sedgwick, Shawnee, Sheridan, Smith, Stafford, Thomas, Wabaunsee, Wallace, Washington, and Woodson.
$359,557,345
1711 7/2/2007 (6/26-30/2007)
Severe Storms and Flooding
Allen, Anderson, Bourbon, Butler, Chautauqua, Cherokee, Coffey, Cowley, Crawford, Edwards, Elk, Franklin, Greenwood, Harper, Labette, Linn, Miami, Montgomery, Neosho, Osage, Pawnee, Wilson, Woodson
$40,238,600
1699 5/6/2007 (5/4/2007)
Severe Storms, Tornadoes, and Flooding
Barton, Brown, Chase, Cherokee, Clay, Cloud, Comanche, Cowley, Dickinson, Doniphan, Douglas, Edwards, Ellsworth, Harper, Harvey, Jackson, Kingman, Kiowa, Leavenworth, Lincoln, Lyon, Marshall, McPherson, Morris, Nemaha, Osage, Osborne, Ottawa, Pawnee, Phillips, Pottawatomie, Pratt, Reno, Rice, Riley, Saline, Shawnee, Smith, Stafford, Sumner, Wabaunsee, Washington
$117,565,269

Kansas Hazard Mitigation Plan Final 3-55 2018
Declaration Number
Declaration Date*
Disaster Description Counties Involved Disaster
Cost
1675
1/7/2007 (12/28-30/2006)
Severe Winter Storm
Cheyenne, Clark, Comanche, Decatur, Edwards, Ellis, Finney, Ford, Gove, Graham, Grant, Gray, Greeley, Hamilton, Haskell, Hodgeman, Jewell, Kearny, Kiowa, Lane, Logan, Meade, Morton, Ness, Norton, Osborne, Pawnee, Phillips, Rawlins, Rooks, Rush, Russell, Scott, Seward, Sheridan, Sherman, Smith, Stafford, Stanton, Stevens, Thomas, Trego, Wallace, Wichita
$315,201,639
1638 4/14/2006 (3/12-13/2006)
Severe Storms, Tornadoes, and Straight-Line Winds
Douglas, Wyandotte $6,233,044
1626 1/26/2006 (11/27-28/2005)
Severe Winter Storm
Cheyenne, Decatur, Edwards, Gove, Graham, Hodgeman, Ness, Norton, Pawnee, Phillips, Rawlins, Rooks, Rush, Sheridan, Sherman, Thomas, Trego
$50,281,517
1615 11/21/2005 (10/1-2/2005)
Severe Storms and Flooding
Atchison, Jackson, Jefferson, Leavenworth, Shawnee
$10,286,064
1600 8/23/2005 (6/30-7/1/2005)
Severe Storms and Flooding Cherokee, Crawford, Neosho $4,344,569
1579 2/8/2005 (1/4-6/2005)
Severe Winter Storm, Heavy Rains, and Flooding
Anderson, Atchison, Barber, Brown, Butler, Chase, Chautauqua, Clark, Coffey, Comanche, Cowley, Crawford, Douglas, Elk, Franklin, Greenwood, Harper, Harvey, Jackson, Jefferson, Kingman, Kiowa, Leavenworth, Lyon, Marion, McPherson, Morris, Osage, Pratt, Reno, Rice, Sedgwick, Shawnee, Sumner, Wabaunsee, Woodson, Wyandotte
$106,873,672
1562 09/30/2004 (8/27-30/2004)
Severe Storms, Flooding, and Tornadoes
Douglas, Wyandotte $2,103,376
1535 8/3/2004 (6/12-7/25/2004)
Severe Storms, Flooding, and Tornadoes
Barton, Butler, Cherokee, Decatur, Ellis, Geary, Graham, Jewell, Labette, Lyon, Marion, Mitchell, Morris, Ness, Osborne, Pawnee, Phillips, Rooks, Rush, Russell, Shawnee, Sheridan, Smith, Thomas, Trego, Wabaunsee, Wallace, Woodson, Wyandotte
$12,845,892
1462 5/6/2003 (5/4-30/2003)
Severe Storms, Tornadoes, and Flooding
Allen, Anderson, Cherokee, Crawford, Douglas, Haskell, Labette, Leavenworth, Meade, Miami, Neosho, Osage, Seward, Woodson, Wyandotte
$988,056
1402 2/6/2002 (1/29-2/15/2002)
Ice Storm
Allen, Anderson, Barber, Bourbon, Butler, Chautauqua, Cherokee, Coffey, Comanche, Cowley, Crawford, Douglas, Elk, Franklin, Greenwood, Harper, Jefferson, Johnson, Kingman, Kiowa, Labette, Leavenworth, Linn, Lyon, Miami, Montgomery, Neosho, Osage, Pratt, Sedgwick, Shawnee, Sumner, Wilson, Woodson, Wyandotte
$60,185,754
1366 4/27/2001 (4/21/2001)
Severe Storms and Tornado Barton $4,730,957
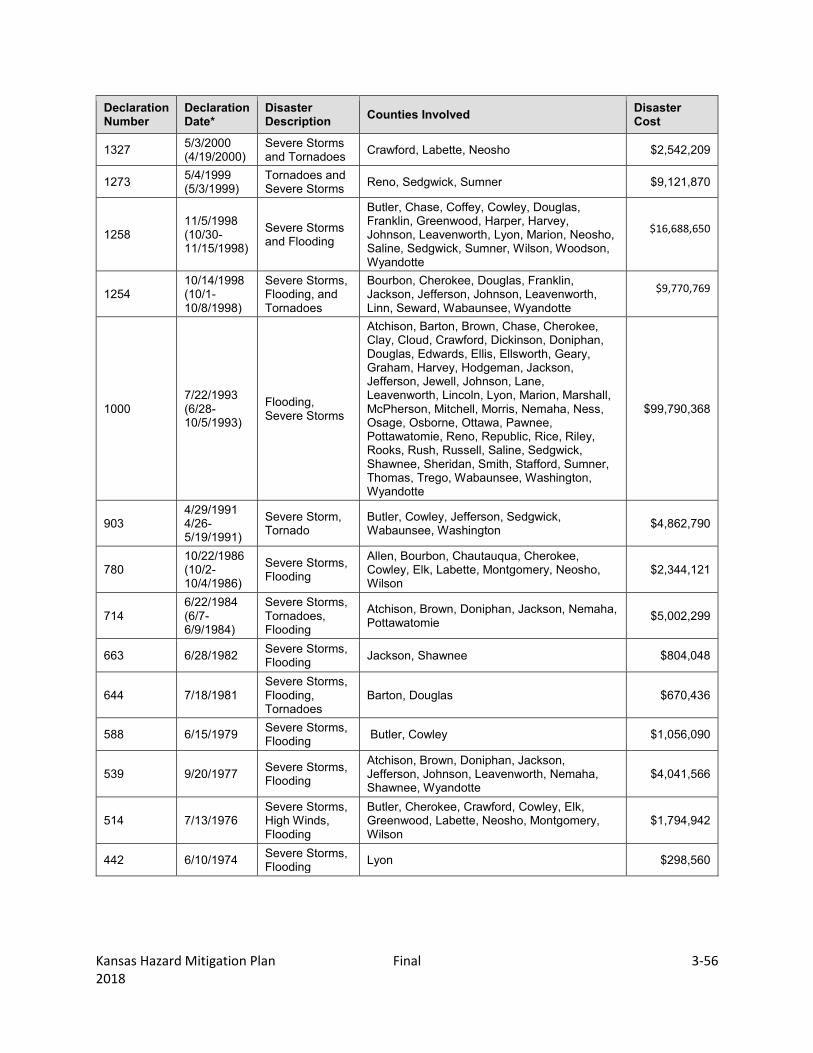
Kansas Hazard Mitigation Plan Final 3-56 2018
Declaration Number
Declaration Date*
Disaster Description Counties Involved Disaster
Cost
1327 5/3/2000 (4/19/2000)
Severe Storms and Tornadoes Crawford, Labette, Neosho $2,542,209
1273 5/4/1999 (5/3/1999)
Tornadoes and Severe Storms Reno, Sedgwick, Sumner $9,121,870
1258 11/5/1998 (10/30-11/15/1998)
Severe Storms and Flooding
Butler, Chase, Coffey, Cowley, Douglas, Franklin, Greenwood, Harper, Harvey, Johnson, Leavenworth, Lyon, Marion, Neosho, Saline, Sedgwick, Sumner, Wilson, Woodson, Wyandotte
$16,688,650
1254 10/14/1998 (10/1-10/8/1998)
Severe Storms, Flooding, and Tornadoes
Bourbon, Cherokee, Douglas, Franklin, Jackson, Jefferson, Johnson, Leavenworth, Linn, Seward, Wabaunsee, Wyandotte
$9,770,769
1000 7/22/1993 (6/28-10/5/1993)
Flooding, Severe Storms
Atchison, Barton, Brown, Chase, Cherokee, Clay, Cloud, Crawford, Dickinson, Doniphan, Douglas, Edwards, Ellis, Ellsworth, Geary, Graham, Harvey, Hodgeman, Jackson, Jefferson, Jewell, Johnson, Lane, Leavenworth, Lincoln, Lyon, Marion, Marshall, McPherson, Mitchell, Morris, Nemaha, Ness, Osage, Osborne, Ottawa, Pawnee, Pottawatomie, Reno, Republic, Rice, Riley, Rooks, Rush, Russell, Saline, Sedgwick, Shawnee, Sheridan, Smith, Stafford, Sumner, Thomas, Trego, Wabaunsee, Washington, Wyandotte
$99,790,368
903 4/29/1991 4/26-5/19/1991)
Severe Storm, Tornado
Butler, Cowley, Jefferson, Sedgwick, Wabaunsee, Washington $4,862,790
780 10/22/1986 (10/2-10/4/1986)
Severe Storms, Flooding
Allen, Bourbon, Chautauqua, Cherokee, Cowley, Elk, Labette, Montgomery, Neosho, Wilson
$2,344,121
714 6/22/1984 (6/7-6/9/1984)
Severe Storms, Tornadoes, Flooding
Atchison, Brown, Doniphan, Jackson, Nemaha, Pottawatomie $5,002,299
663 6/28/1982 Severe Storms, Flooding Jackson, Shawnee $804,048
644 7/18/1981 Severe Storms, Flooding, Tornadoes
Barton, Douglas $670,436
588 6/15/1979 Severe Storms, Flooding Butler, Cowley $1,056,090
539 9/20/1977 Severe Storms, Flooding
Atchison, Brown, Doniphan, Jackson, Jefferson, Johnson, Leavenworth, Nemaha, Shawnee, Wyandotte
$4,041,566
514 7/13/1976 Severe Storms, High Winds, Flooding
Butler, Cherokee, Crawford, Cowley, Elk, Greenwood, Labette, Neosho, Montgomery, Wilson
$1,794,942
442 6/10/1974 Severe Storms, Flooding Lyon $298,560

Kansas Hazard Mitigation Plan Final 3-57 2018
Declaration Number
Declaration Date*
Disaster Description Counties Involved Disaster
Cost
403 9/28/1973 Severe Storms, Tornadoes, Flooding
Atchison, Barber, Barton, Brown, Butler, Chase, Clay, Cloud, Coffey, Comanche, Cowley, Dickinson, Doniphan, Douglas, Edwards, Ellsworth, Franklin, Geary, Greenwood, Harper, Harvey, Jackson, Jefferson, Kingman, Kiowa, Leavenworth, Lincoln, Linn, Lyon, Marion, Marshall, McPherson, Miami, Morris, Nemaha, Osage, Ottawa, Pawnee, Pottawatomie, Pratt, Reno, Republic, Rice, Riley, Saline, Sedgwick, Shawnee, Stafford, Sumner, Wabaunsee, Washington, Woodson, Wyandotte
$4,296,913
378 5/2/1973 Severe Storms, Flooding
Atchison, Barber, Barton, Bourbon, Brown, Butler, Chautauqua, Cherokee, Clark, Coffey, Crawford, Dickinson, Doniphan, Douglas, Edwards, Ellsworth, Ford, Franklin, Gray, Greenwood, Harper, Harvey, Haskell, Hodgeman, Jackson, Jefferson, Kingman, Kiowa, Labette, Leavenworth, Lincoln, Linn, Lyon, Marion, Marshall, McPherson, Meade, Miami, Montgomery , Morris, Nemaha, Ness, Osage, Osborne, Ottawa, Pawnee, Pottawatomie, Pratt, Reno, Republic, Rice, Rush, Russell, Saline, Sedgwick, Seward, Shawnee, Stafford, Stevens, Sumner, Wabaunsee, Washington, Woodson, Wyandotte
$1,954,624
267 7/15/1969 Tornadoes, Severe Storms, Flooding
Allen, Anderson, Bourbon, Crawford, Dickinson, Douglas, Ellsworth, Franklin, Johnson, Leavenworth, Linn, Lyon, McPherson, Miami, Morris, Neosho, Osage, Saline, Woodson, Wyandotte
$733,524
229 7/18/1967 Tornadoes, Severe Storms, Flooding
Anderson, Atchison, Chase, Cloud, Coffey, Crawford, Doniphan, Douglas, Finney, Franklin, Harper, Jackson, Jefferson, Kingman, Leavenworth, Linn, Lyon, Marion, Miami, Mitchell, Nemaha, Ness, Osage, Pottawatomie, Republic, Washington, Wabaunsee
$847,439
219 6/10/1966 Tornadoes, Severe Storms Riley, Shawnee $2,856,131
201 6/23/1965 Flooding
Barton, Butler, Chase, Edwards, Finney, Ford, Grant, Gray, Greenwood, Hamilton, Harvey, Kearny, Lyon, Marion, McPherson, Pawnee, Reno, Rice, Sedgwick, Stafford, Stanton
$1,046,450
88 11/6/1958 Floods Atchison, Clay, Cloud, Nemaha, Republic, Washington $121,504
81 9/5/1957 Floods n/a $66,816 34 5/27/1955 Tornado Cowley $294,167
Emergency Declarations
3324 6/25/2011 Flooding Atchison, Doniphan, Leavenworth and Wyandotte n/a

Kansas Hazard Mitigation Plan Final 3-58 2018
Declaration Number
Declaration Date*
Disaster Description Counties Involved Disaster
Cost
3282 12/12/2007 Severe Winter Storms All n/a
3236 9/1/0/2005 Hurricane Katrina Evacuation
All n/a
3126 6/9/1998 Grain Elevator Explosion Harvey, Sedgwick $972,216
Fire Management Assistance Declarations
5176 03/06/2017 Comanche County Fire Comanche NA
5175 03/06/2017 Rooks County Fire Rooks NA
5174 03/06/2017 Ness County Fire NESS NA
5173 03/06/2017 Ford County Fire Complex Ford NA
5172 03/06/2017 Ellsworth-Lincoln-Russell Fire Complex
Russell, Lincoln, and Ellsworth NA
5171 03/06/2017 Clark County Fire Clark NA
5170 03/05/2017 Highland Hills Fire Reno, McPherson, Rice NA
5121 04/05/2016 Burr Oak Fire Wabaunsee $160,939
5120 03/23/2016 Anderson Creek Fire Barber and Comanche $1,319,118
2878 4/3/2011 Haskell County Fire Haskell and Stevens n/a
2632 3/30/2006 Obee Fire Reno n/a
Sources: http://www.fema.gov/disasters, and Kansas Division of Emergency Management * Incident dates are in parentheses. ** Disaster costs include Public Assistance and Individual Assistance
Figure 3.9 shows a map of Kansas depicting the amount of Federal Declarations by county from 1955 – 2017.

Kansas Hazard Mitigation Plan Final 3-59 2018
Figure 3.9 Federal Declarations by County in Kansas, 1955 - 2017

Kansas Hazard Mitigation Plan Draft 3-60 2018
Table 3.26 lists the U.S. Department of Agriculture Secretarial Disaster Declarations and the disaster description for the State of Kansas for the period 2013-2018. Secretarial Disasters are designated from a natural disaster and have a minimum of 30 percent production loss of at least one crop in the county must have occurred.
Table 3.26. USDA Disaster Declarations in Kansas 2013- April 2018.
Declaration Number
Declaration Date Disaster Description Counties Involved
S4305 4/11/2018 Drought – Fast Track
Allen, Anderson, Bourbon, Butler, Chase, Chautauqua, Clay, Coffey, Cowley, Crawford, Dickinson, Elk, Ellis, Finney, Geary, Gove, Greenwood, Hodgeman, Labette, Lane, Linn, Lyon, McPherson, Marion, Montgomery, Morris, Neosho, Ness, Ottawa, Pawnee, Rush, Saline, Trego, Wilson, Woodson
S4301 3/30/2018 Drought – Fast Track Chautauqua, Cowley, Sumner
S4299 3/30/2018 Drought – Fast Track
Barton, Butler, Chase, Chautauqua, Cowley, Dickinson, Elk, Ellis, Ellsworth, Geary, Greenwood, Harvey, Lincoln, Lyon, McPherson, Marion, Morris, Ness, Ottawa, Pawnee, Reno, Rice, Rush, Russell, Saline, Sedgwick, Sumner, Wabaunsee
S4293 3/29/2018 Drought – Fast Track Greeley, Hamilton, Stanton
S4290 3/15/2018 Drought – Fast Track
Barton, Butler, Cowley, Ellsworth, Grant, Greeley, Hamilton, Harvey, Kearny, Kingman, McPherson, Morton, Reno, Rice, Sedgwick, Stafford, Stanton, Stevens, Sumner, Wichita
S4286 3/8/2018 Drought - Fast Track Barber, Clark, Comanche, Harper, Meade, Morton, Seward, Stevens, Sumner
S4281 3/8/2018 Drought- Fast Track
Barber, Barton, butler, Clark, Comanche, Cowley, Edwards, Ellsworth, Finney, Ford, Grant, Gray, Hamilton, Harper, Harvey, Haskell, Hodgeman, Kearny, Kingman, Kiowa, Lane, McPherson, Meade, Morton, Ness, Pawnee, Pratt, Reno, Rice, Rush, Russell, Scott, Sedgwick, Seward, Stafford, Stanton, Stevens, Sumner, Wichita
S4280 3/8/2018 Drought – Fast Track Morton, Stanton
S4254 11/13/2017 High Winds, Hail, Lightning Ellis, Gove, Graham, Ness, Rooks, Trego
S4253 11/13/2017 Drought Brown, Jackson, Marshall, Nemaha, Pottawatomie, Riley, Washington
S4208 8/16/2017
High Winds, Excessive Rain, hail, flash flooding
Cheyenne, Finney, Barber, Grant, Hamilton, Harper, Haskell, Kearny, Kingman, Logan, Pratt, Rawlins, Reno, Sedgwick, Sherman, Stanton, Stevens, Sumner, Thomas, Wallace
S4192 7/5/2017 Excessive Rain/Flooding Cherokee, Crawford
S4161 3/8/2017 Drought-Fast Track Cowley, Sumner S4159 3/2/2017 Drought-Fast Track Chautauqua, Montgomery
S4152 2/23/2017 Drought-Fast Track Chautauqua, Comanche, Cowley, Morton, Seward, Stevens
S4148 2/23/2017 Drought-Fast Track
Finney, Grant, Hamilton, Haskell, Hodgeman, Kearny, Lane, Morton, Ness, Scott, Stanton, Stevens, Wichita, Edwards, Ellis, Ford, Gove, Gray,
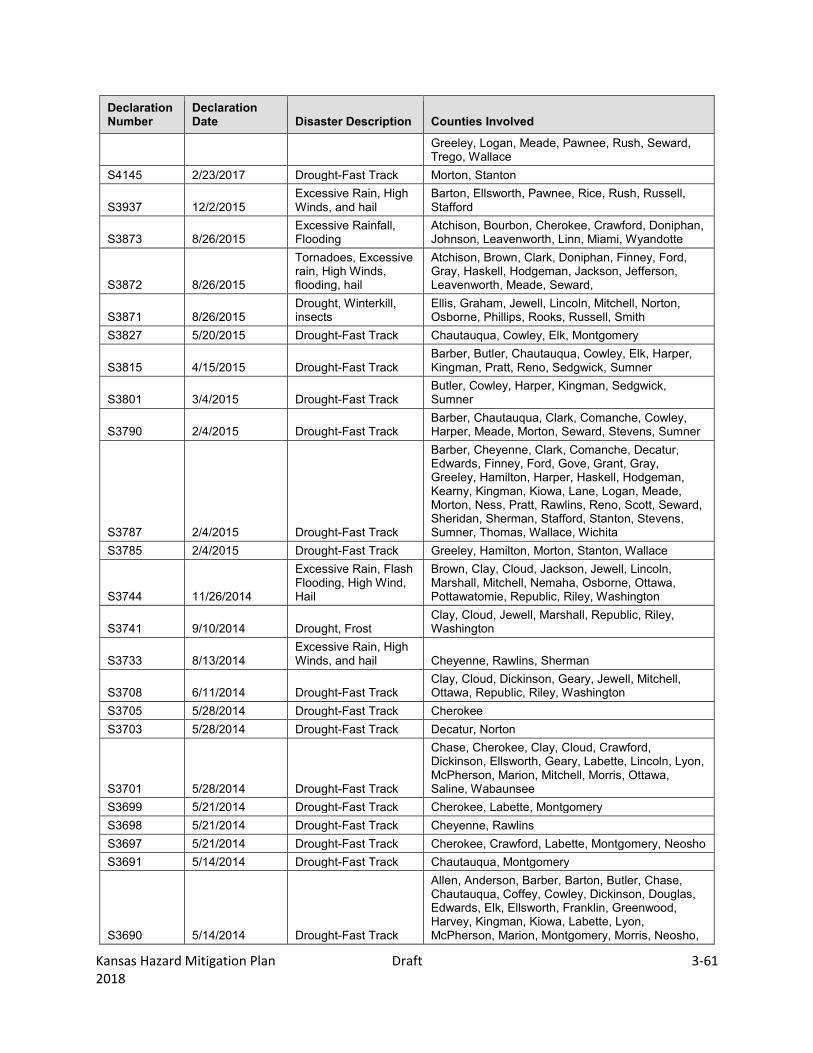
Kansas Hazard Mitigation Plan Draft 3-61 2018
Declaration Number
Declaration Date Disaster Description Counties Involved
Greeley, Logan, Meade, Pawnee, Rush, Seward, Trego, Wallace
S4145 2/23/2017 Drought-Fast Track Morton, Stanton
S3937 12/2/2015 Excessive Rain, High Winds, and hail
Barton, Ellsworth, Pawnee, Rice, Rush, Russell, Stafford
S3873 8/26/2015 Excessive Rainfall, Flooding
Atchison, Bourbon, Cherokee, Crawford, Doniphan, Johnson, Leavenworth, Linn, Miami, Wyandotte
S3872 8/26/2015
Tornadoes, Excessive rain, High Winds, flooding, hail
Atchison, Brown, Clark, Doniphan, Finney, Ford, Gray, Haskell, Hodgeman, Jackson, Jefferson, Leavenworth, Meade, Seward,
S3871 8/26/2015 Drought, Winterkill, insects
Ellis, Graham, Jewell, Lincoln, Mitchell, Norton, Osborne, Phillips, Rooks, Russell, Smith
S3827 5/20/2015 Drought-Fast Track Chautauqua, Cowley, Elk, Montgomery
S3815 4/15/2015 Drought-Fast Track Barber, Butler, Chautauqua, Cowley, Elk, Harper, Kingman, Pratt, Reno, Sedgwick, Sumner
S3801 3/4/2015 Drought-Fast Track Butler, Cowley, Harper, Kingman, Sedgwick, Sumner
S3790 2/4/2015 Drought-Fast Track Barber, Chautauqua, Clark, Comanche, Cowley, Harper, Meade, Morton, Seward, Stevens, Sumner
S3787 2/4/2015 Drought-Fast Track
Barber, Cheyenne, Clark, Comanche, Decatur, Edwards, Finney, Ford, Gove, Grant, Gray, Greeley, Hamilton, Harper, Haskell, Hodgeman, Kearny, Kingman, Kiowa, Lane, Logan, Meade, Morton, Ness, Pratt, Rawlins, Reno, Scott, Seward, Sheridan, Sherman, Stafford, Stanton, Stevens, Sumner, Thomas, Wallace, Wichita
S3785 2/4/2015 Drought-Fast Track Greeley, Hamilton, Morton, Stanton, Wallace
S3744 11/26/2014
Excessive Rain, Flash Flooding, High Wind, Hail
Brown, Clay, Cloud, Jackson, Jewell, Lincoln, Marshall, Mitchell, Nemaha, Osborne, Ottawa, Pottawatomie, Republic, Riley, Washington
S3741 9/10/2014 Drought, Frost Clay, Cloud, Jewell, Marshall, Republic, Riley, Washington
S3733 8/13/2014 Excessive Rain, High Winds, and hail Cheyenne, Rawlins, Sherman
S3708 6/11/2014 Drought-Fast Track Clay, Cloud, Dickinson, Geary, Jewell, Mitchell, Ottawa, Republic, Riley, Washington
S3705 5/28/2014 Drought-Fast Track Cherokee S3703 5/28/2014 Drought-Fast Track Decatur, Norton
S3701 5/28/2014 Drought-Fast Track
Chase, Cherokee, Clay, Cloud, Crawford, Dickinson, Ellsworth, Geary, Labette, Lincoln, Lyon, McPherson, Marion, Mitchell, Morris, Ottawa, Saline, Wabaunsee
S3699 5/21/2014 Drought-Fast Track Cherokee, Labette, Montgomery S3698 5/21/2014 Drought-Fast Track Cheyenne, Rawlins S3697 5/21/2014 Drought-Fast Track Cherokee, Crawford, Labette, Montgomery, Neosho S3691 5/14/2014 Drought-Fast Track Chautauqua, Montgomery
S3690 5/14/2014 Drought-Fast Track
Allen, Anderson, Barber, Barton, Butler, Chase, Chautauqua, Coffey, Cowley, Dickinson, Douglas, Edwards, Elk, Ellsworth, Franklin, Greenwood, Harvey, Kingman, Kiowa, Labette, Lyon, McPherson, Marion, Montgomery, Morris, Neosho,

Kansas Hazard Mitigation Plan Draft 3-62 2018
Declaration Number
Declaration Date Disaster Description Counties Involved
Osage, Pawnee, Pratt, Reno, Rice, Saline, Shawnee, Stafford, Wabaunsee, Wilson, Woodson
S3686 5/7/2014 Drought-Fast Track
Barber, Butler, Chase, Cowley, Elk, Greenwood, Harper, Harvey, Kingman, McPherson, Marion, Pratt, Reno, Rice, Sedgwick, Stafford, Sumner
S3683 4/30/2014 Drought-Fast Track Chautauqua, Cowley, Harper, Sumner
S3682 4/30/2014 Drought-Fast Track
Barber, Butler, Chautauqua, Comanche, Cowley, Elk, Harper, Kingman, Kiowa, Pratt, Sedgwick, Sumner
S3669 4/9/2014 Drought-Fast Track Decatur, Rawlins S3664 3/26/2014 Drought-Fast Track Barber, Harper
S3663 3/25/2014 Drought-Fast Track
Barber, Barton, Clark, Cloud, Comanche, Edwards, Ellis, Ellsworth, Ford, Hodgeman, Jewell, Kiowa, Lincoln, McPherson, Mitchell, Osborne, Ottawa, Pawnee, Phillips, Pratt, Republic, Rice, Rooks, Rush, Russell, Saline, Smith, Stafford
S3641 4/9/2014 Drought-Fast Track
Cheyenne, Clark, Decatur, Finney, Ford, Gove, Graham, Grant, Gray, Greeley, Hamilton, Haskell, Kearny, Lane Logan, Meade, Morton, Norton, Phillips, Rawlins, Rooks, Scott, Seward, Sheridan, Sherman, Smith, Stanton, Stevens, Thomas, Trego, Wallace, Wichita
S3632 1/15/2014 Drought-Fast Track Barber, Clark, Comanche, Meade, Morton, Seward, Stevens
S3629 1/15/2014 Drought-Fast Track
Barber, Barton, Cheyenne, Clark, Comanche, Decatur, Edwards, Ellis, Finney, Ford, Gove, Graham, Grant, Gray, Greeley, Hamilton, Haskell, Hodgeman, Kearny, Kiowa, Lane, Logan, Meade, Morton, Ness, Norton, Osborne, Pawnee, Phillips, Rawlins, Rooks, rush, Russell, Scott, Seward, Sheridan, Sherman, Smith, Stafford, Stanton, Stevens, Thomas, Trego, Wallace, Wichita
S3627 1/15/2014 Drought-Fast Track Cheyenne, Greeley, Hamilton, Morton, Sherman, Stanton, Wallace
S3592 9/25/2013
Flood, Flash Flood, Excessive rain, Humidity Crawford, Linn, Bourbon
S3573 8/21/2013 Frost/Freeze
Clark, Finney, Ford, Grant, Gray, Greeley, Hamilton, Haskell, Kearny, Logan, Meade, Morton, Scott, Seward, Stanton, Stevens, Wallace, Wichita
S3505 4/10/2013 Drought-Fast Track Cheyenne, Decatur, Jewell, Marshall, Norton, Phillips, Rawlins, Republic, Smith, Washington
S3470 1/16/2013 Drought-Fast Track
Allen, Anderson, Atchison, courbon, Brown, Cherokee, Clay, Cloud, Coffey, Crawford, Dickinson, Doniphan, Douglas, Franklin, Jackson, Jefferson, Jewell, Johnson, Labette, Leavenworth, Lincoln, Linn, Marshall, Miami, Mitchell, Nemaha, Neosho, Ottawa, Pottawatomie, Republic, Riley, Saline, Washington, Wilson, Woodson, Wyandotte
S3460 1/9/2013 Drought-Fast Track Doniphan, Linn, Miami S3459 1/9/2013 Drought-Fast Track State-wide
S3456 1/9/2013 Drought-Fast Track Cheyenne, Greeley, Hamilton, Morton, Sherman, Stanton, Wallace

Kansas Hazard Mitigation Plan Draft 3-63 2018
Source: USDA Department of Agriculture. http://www.fsa.usda.gov/programs-and-services/disaster-assistance-program/disaster-designation-information/index
3.2a. Potential Climate Change Impacts on the 22 Identified Hazards in Kansas
The most recent National Climate Assessment (Hafer, 2014) indicates that Kansas will face increasing climate challenges in the coming decades. Increased precipitation is expected, along with increased frequency of high intensity events. Overall increase in precipitation can have both a positive and a negative effect. Greater moisture means more available water, but also increases the possibility of flood events. Increased flood events increase pressure on dams and levees which in turn heighten the risk of failure for these systems. Also heightened is the risk of land subsidence or landslides.
Timing of the precipitation is also likely to impact agricultural practices, with increased possibility of delayed plantings, and disease outbreaks. The extreme nature of the precipitation is also likely to result in increased frequency of droughts with rapid onset (flash droughts). The increased frequency of droughts makes dust storms and wind erosion more probable. It also increases the danger from wildfires. The rapid switch from very moist conditions which favor vegetative growth to very dry conditions were prominent factors in the wildfires of 2016 and 2017.
Temperatures are expected to warm, with the greatest increase in the winter months and in night-time lows. This does not preclude an increase in the number of days above 100 oF or 95 oF, both of which are considered factors for heat related deaths/illness. It does increase the probability of crop damage (Hu, 2006) (NOAA, 2008). With milder winter temperatures, there would also be increased pressure from insects as a result of increased winter survival and increased migration.
Estimating the change in frequency of individual storm events, such as tornado, wind storm, hail storm, and lightning are not possible at this time.
Table 3.26a shows the table with the CPRI for the 22 identified hazards in Kansas, and in addition, it reflects the change in the threat level due to climate variability. When the climate variability threat is not known it is annotated as unknown.
Table 3.26a. Potential Change due to Climate Variability
Hazard Type Probability Magnitude
Change in threat level due to climate variability
Warning Time Duration CPRI
Planning Significance
Flood 4 3 Increase 3 3 3.45 High Tornado 4 3 Unknown 4 1 3.40 High Windstorm 4 3 Unknown 3 2 3.35 High Winter Storm 4 3 Unknown 2 3 3.30 High Wildfire 4 2 Increase 4 3 3.30 High

Kansas Hazard Mitigation Plan Draft 3-64 2018
Hazard Type Probability Magnitude
Change in threat level due to climate variability
Warning Time Duration CPRI
Planning Significance
Agricultural Infestation 4 2
Increase 1 4 2.95 Moderate
Hailstorm 4 2 Unknown 3 1 2.95 Moderate Hazardous Materials 4 1
Unknown 4 2 2.90 Moderate
Utility/Infrastructure Failure 3 2
Unknown 4 3 2.85 Moderate
Drought 3 3 Increase 1 4 2.80 Moderate Earthquake 4 1 Unknown 4 1 2.80 Moderate Civil Disorder 1 4 Unknown 4 4 2.65 Moderate Expansive Soils 4 1 Increase 1 4 2.65 Moderate Land Subsidence 4 1 Increase 1 4 2.65 Moderate Major Disease Outbreak 2 4
Increase 1 4 2.65 Moderate
Terrorism/Agro-terrorism 1 4
Unknown 4 4 2.65 Moderate
Lightning 4 1 Unknown 2 1 2.50 Moderate Extreme Temperatures 3 2
Increase 1 3 2.40 Moderate
Dam and Levee Failure 1 4
Increase 2 4 2.35 Moderate
Landslide 3 1 Increase 3 1 2.20 Moderate Radiological 1 3 Unknown 2 3 1.95 Low Soil Erosion and Dust 2 1
Increase 1 4 1.75 Low
The Climate Vulnerability section was provided by the following:
Bibliography
Hafer, M. D. (2014). Global Change: Great Plains. Retrieved from GlobalChange.gov:
http://nca2014.globalchange.gov/report/regions/great-plains
Hu, Q. A. (2006). Earlier winter wheat heading dates and warmer spring in the U.S. Great Plains.
Agricultural and Forest Meteorology, 284-290.
NOAA, a. U. (2008). The Easter Freeze of April 2007:A Climatological Perspective and
Assessment of Impacts and Services. NOAA/USDA Tech Report 2008-1.

Kansas Hazard Mitigation Plan Draft 3-65 2018
3.3. Hazard Profiles and State Risk Assessment
Requirement §201.4(c)(2)(i): [The state risk assessment shall include an overview of the] location of all natural hazards that can affect the state, including information on previous occurrences of hazard events, as well as the probability of future hazard events, using maps where appropriate.
Requirements §201.4(c)(2)(ii) and §201.4(c)(2)(iii): The state risk assessment shall include an] overview and analysis of the state’s vulnerability to the hazards described in this paragraph (c)(2), based on estimates provided in local risk assessments as well as the State risk assessment. The state shall describe vulnerability in terms of the jurisdictions most threatened by the identified hazards, and most vulnerable to damage and loss associated with hazard events.
[The state risk assessment shall include an] overview and analysis of potential losses to identified vulnerable structures, based on estimates provided in local risk assessments as well as the State risk assessment.
Requirement for Update §201.4(d): Plan must be reviewed and revised to reflect changes in development.
The risks posed by the hazards identified in Section 3.2 Hazard Identification are considered sufficient and complete by the Kansas Hazard Mitigation Team. The general level of risk posed to the people, property, and the environment and economy of the affected communities should be evaluated as part of the statewide mitigation planning effort. General profiles for each of these hazards were compiled for the previous plans. These profiles have been updated for the 2018 plan update.
Each profile describes the hazard and its potential impacts, its location in the State, previous occurrences, and its probability of future hazard events. Profiles then go on to explore state vulnerability analysis, state estimates of potential losses, development in hazard prone areas and the hazard impact overview. The magnitude of the impact caused by a hazard event (past and perceived) is related directly to the vulnerability of the people, property, and the environment. This is a function of when the event occurs, the jurisdictions and community sectors affected, the resilience of the community, and the effectiveness of the emergency response and disaster recovery efforts.
The level of information presented in the profiles varies by hazard based on the amount of information available. Resources used to compile these profiles can be found at the end of the chapter. With each update of this plan, new information will be incorporated to provide an improvement in evaluation and prioritization of the hazards that affect Kansas.

Kansas Hazard Mitigation Plan Draft 3-66 2018
General 2018 Update Changes
For the 2018 Hazard Mitigation update, each profile was updated with more historical impact information. For most of the tables herein, the counties are sorted by Mitigation Planning Region and then alphabetically within the planning region. The vulnerability assessment and state estimates of potential losses have been updated for all hazards addressed in the plan where sufficient data is available. In addition, statewide flood and earthquake losses have been quantified using HAZUS-4. In addition, with the approval of the KHMT, some of the hazards were limited for the years of 2011 – 2016. This was to reflect a better analysis due to the climate change we have experienced in the past few years. It is noted that while the figures changed in tables to reflect shorter time periods, the overall ranking of the hazard did not change. This was true for all hazards that these years were used.
Data Presented by Mitigation Planning Region
Where data is presented by county, the Mitigation Planning Region is indicated. This organization is done to facilitate the use of the data within regional plans.
EMAP Consequence Analysis
A consequence analysis of the potential for detrimental impacts of hazards is included in this 2018 plan update for the Emergency Management Accreditation Program (EMAP). Each hazard identified in this plan is followed by the Consequence Analysis result.
In this analysis all 22 of the State of Kansas’ hazards have been addressed, with the impacts that each will have on the following:
Impact on the Public: Health and safety of persons in the area of the incident
Impact on Responders: Health and safety of responders (i.e., firefighters, law enforcement, emergency
management personnel, etc) in the area responding to the incident Continuity of Operations:
Activation of the Continuity of Operations Plan – will organization need to relocate in order to fulfill duties
Delivery of Services: Delivery of services such as food, medical, or any other life sustaining entities
Impact on Property, Facilities, and Infrastructure: Damages to structures (private and public), utilities, treatment plants, electric grid, roads,
bridges, etc. Impact on the Environment:
How has the incident affected the surrounding environment, i.e., contamination (water , soil or air), erosion, crop damage, etc.
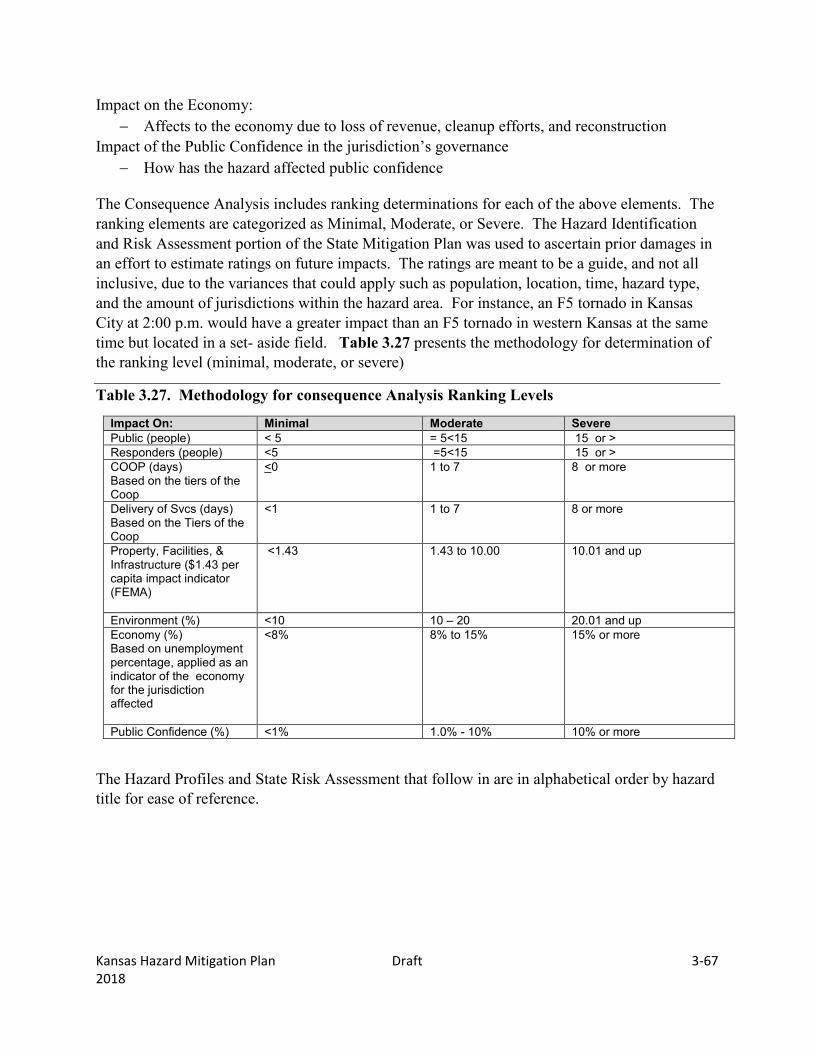
Kansas Hazard Mitigation Plan Draft 3-67 2018
Impact on the Economy: Affects to the economy due to loss of revenue, cleanup efforts, and reconstruction
Impact of the Public Confidence in the jurisdiction’s governance How has the hazard affected public confidence
The Consequence Analysis includes ranking determinations for each of the above elements. The ranking elements are categorized as Minimal, Moderate, or Severe. The Hazard Identification and Risk Assessment portion of the State Mitigation Plan was used to ascertain prior damages in an effort to estimate ratings on future impacts. The ratings are meant to be a guide, and not all inclusive, due to the variances that could apply such as population, location, time, hazard type, and the amount of jurisdictions within the hazard area. For instance, an F5 tornado in Kansas City at 2:00 p.m. would have a greater impact than an F5 tornado in western Kansas at the same time but located in a set- aside field. Table 3.27 presents the methodology for determination of the ranking level (minimal, moderate, or severe)
Table 3.27. Methodology for consequence Analysis Ranking Levels
Impact On: Minimal Moderate Severe Public (people) < 5 = 5<15 15 or > Responders (people) <5 =5<15 15 or > COOP (days) Based on the tiers of the Coop
<0 1 to 7 8 or more
Delivery of Svcs (days) Based on the Tiers of the Coop
<1 1 to 7 8 or more
Property, Facilities, & Infrastructure ($1.43 per capita impact indicator (FEMA)
<1.43 1.43 to 10.00 10.01 and up
Environment (%) <10 10 – 20 20.01 and up Economy (%) Based on unemployment percentage, applied as an indicator of the economy for the jurisdiction affected
<8% 8% to 15% 15% or more
Public Confidence (%) <1% 1.0% - 10% 10% or more
The Hazard Profiles and State Risk Assessment that follow in are in alphabetical order by hazard title for ease of reference.
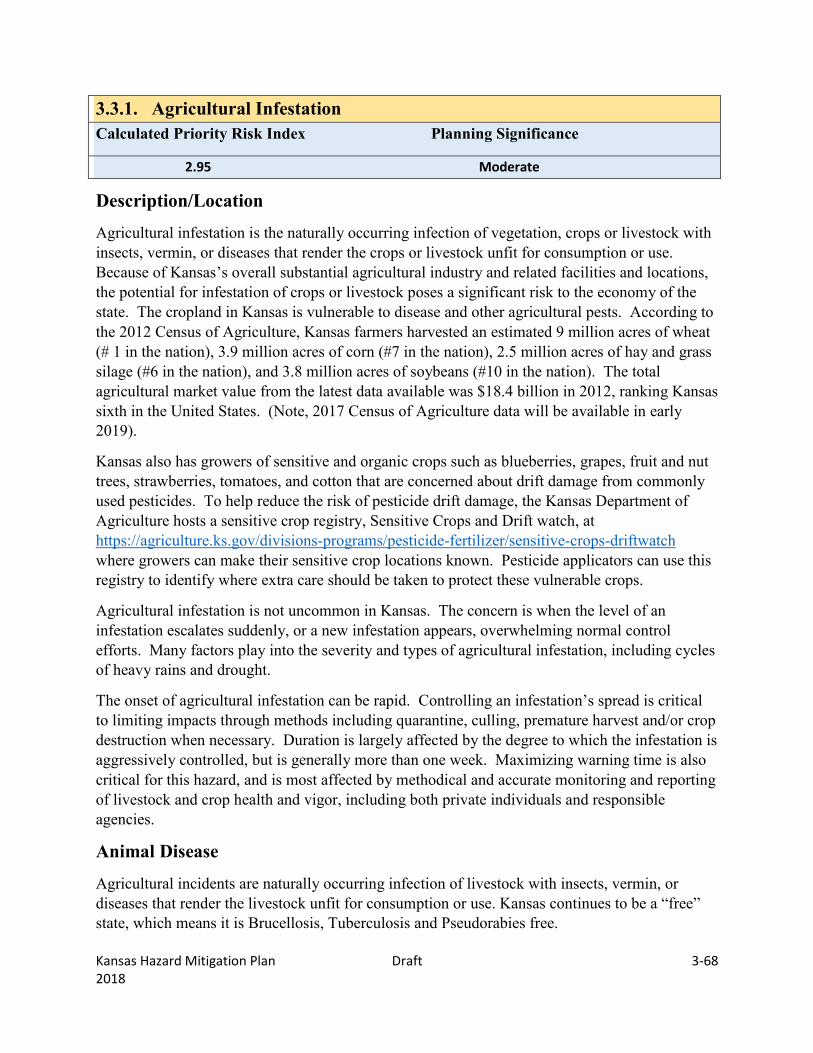
Kansas Hazard Mitigation Plan Draft 3-68 2018
3.3.1. Agricultural Infestation Calculated Priority Risk Index Planning Significance
2.95 Moderate
Description/Location
Agricultural infestation is the naturally occurring infection of vegetation, crops or livestock with insects, vermin, or diseases that render the crops or livestock unfit for consumption or use. Because of Kansas’s overall substantial agricultural industry and related facilities and locations, the potential for infestation of crops or livestock poses a significant risk to the economy of the state. The cropland in Kansas is vulnerable to disease and other agricultural pests. According to the 2012 Census of Agriculture, Kansas farmers harvested an estimated 9 million acres of wheat (# 1 in the nation), 3.9 million acres of corn (#7 in the nation), 2.5 million acres of hay and grass silage (#6 in the nation), and 3.8 million acres of soybeans (#10 in the nation). The total agricultural market value from the latest data available was $18.4 billion in 2012, ranking Kansas sixth in the United States. (Note, 2017 Census of Agriculture data will be available in early 2019).
Kansas also has growers of sensitive and organic crops such as blueberries, grapes, fruit and nut trees, strawberries, tomatoes, and cotton that are concerned about drift damage from commonly used pesticides. To help reduce the risk of pesticide drift damage, the Kansas Department of Agriculture hosts a sensitive crop registry, Sensitive Crops and Drift watch, at https://agriculture.ks.gov/divisions-programs/pesticide-fertilizer/sensitive-crops-driftwatch where growers can make their sensitive crop locations known. Pesticide applicators can use this registry to identify where extra care should be taken to protect these vulnerable crops.
Agricultural infestation is not uncommon in Kansas. The concern is when the level of an infestation escalates suddenly, or a new infestation appears, overwhelming normal control efforts. Many factors play into the severity and types of agricultural infestation, including cycles of heavy rains and drought.
The onset of agricultural infestation can be rapid. Controlling an infestation’s spread is critical to limiting impacts through methods including quarantine, culling, premature harvest and/or crop destruction when necessary. Duration is largely affected by the degree to which the infestation is aggressively controlled, but is generally more than one week. Maximizing warning time is also critical for this hazard, and is most affected by methodical and accurate monitoring and reporting of livestock and crop health and vigor, including both private individuals and responsible agencies.
Animal Disease
Agricultural incidents are naturally occurring infection of livestock with insects, vermin, or diseases that render the livestock unfit for consumption or use. Kansas continues to be a “free” state, which means it is Brucellosis, Tuberculosis and Pseudorabies free.

Kansas Hazard Mitigation Plan Draft 3-69 2018
In 2012, the State of Kansas ranked third in livestock inventory for cattle and calves with 6 million head according to the State Agriculture Census, 2012, (this is the most current Agricultural Census available). The state was also home to 1.9 million hogs and pigs. With this substantial agricultural industry and related facilities throughout the State, the potential for infestation of livestock poses a significant risk to the Kansas economy.
A key concern regarding this hazard is the potential introduction of a rapid and economically devastating foreign animal disease, such as foot and mouth disease and bovine spongiform encephalopathy (BSE) disease to Kansas. Because Kansas is a major cattle state, with cattle raised locally as well as imported into the State, the potential for highly contagious diseases such as these is a continuing, significant threat to the economy of the State. The loss of milk production, abortion, decrease in production, and other lasting problems resulting from an outbreak could cause continual and severe economic losses, as well as widespread unemployment. It would affect not only farmers, ranchers, and butchers, but also support and related industries.
Figure 3.11 shows the number of active Confined Animal Feeding Operations (CAFO) facilities with 300 or more animal units per county in Kansas. The CAFO facilities are regulated by the Kansas Department of Health & Environment, Bureau of Water, and Livestock Waste Management. The CAFO includes beef, dairy, sheep, swine, chicken, turkey, and horses.
Figure 3.11. Active Number of Confined Animal Feeding Operations (CAFO) Facilities
Kansas Hazard Mitigation Plan Draft 3-70 2018
The Kansas Department of Agriculture, Division of Animal Health monitors and reports on animal reportable diseases such as Avian Influenza, Bovine Spongiform Encephalopathy (BSE) Disease, Chronic Wasting Disease, Exotic Newcastle Disease, Foot and Mouth Disease, Johne’s Disease, Pseudo Rabies, Scrapie and West Nile Virus. Producers are required by state law to report any of the reportable animal diseases.
Crop Pests/Diseases
A plant disease outbreak or a pest infestation could negatively impact crop production and agriculturally dependent businesses. An extreme outbreak or infestation could potentially result in billions of dollars in production losses. The cascading net negative economic effects could result in wide-spread business failures, reduction of tax revenues, harm to other state economies, and diminished capability for this country to compete in the global market.
Many factors influence disease development in plants, including hybrid/variety genetics, plant growth stage at the time of infection, weather (e.g., temperature, rain, wind, hail, etc.), single versus mixed infections, and genetics of the pathogen populations.
Field crops in Kansas are also subject to various types of infestation. Significant wheat crop losses because of these diseases are well documented in various areas of Kansas. Sorghum losses can occur when a crop is infected with sooty stripe early in the growing season. Aspergillus Ear Rot (Aflatoxin) is a growing problem for corn crops.
According to the Kansas Department of Agriculture, Plant Protection and Weed Control Division, the following are the highest risk crop pests to Kansas:
Corn – Aspergillus Ear Rot (Aflatoxin) Soybean – Austro-Asian Rust Wheat – Stripe Rust, Leaf Rust, Wheat Streak Mosaic Complex
Infestation is not only a risk to crops in the field, but insect infestation can also cause major losses to stored grain. It is estimated that damage to stored grain by the lesser grain borer, rice weevil, red flour beetle, and rusty grain beetle costs the United States about $500 million annually.
Tree Pests
According to the Kansas Department of Agriculture, Plant Protection and Weed Control Division, the following are the highest risk plant pests by host to Kansas:
Ash Trees – Emerald Ash Borer Maple, Birch, Willow, Mimosa, Ash, Sycamore & Poplar Trees – Asian Longhorned
Beetle Walnut Trees – Thousand Cankers
The Asian Longhorned Beetle is an exotic insect that threatens a wide variety of hardwood trees in Kansas. It is suspected that Asian Longhorned Beetle came to the U.S. via wood packing

Kansas Hazard Mitigation Plan Draft 3-71 2018
material from Asia. Tens of thousands of trees have been destroyed since it was first discovered in Brooklyn, New York in 1996. This beetle feeds on a wide variety of hardwood tree species that are native or planted in Kansas. It kills trees by creating large tunnels as larvae causing branches or stems to break and eventually lead to tree death. Because this beetle is not native to North America, it has no known natural enemies, and our trees have low resistance to this pest. It has not been detected in Kansas yet.
The Thousand Cankers is newly recognized disease in 2008 and first noticed in the western U.S. Currently it is located in both the east and western parts of the U.S. It has not been detected in Kansas, however the department of agriculture is working to ensure the introduction of the disease is not introduced into Kansas. This disease is caused by a combination of a fungus and the walnut twig beetle. The walnut twig beetles carries fungal spores, and when they tunnel through the outer bark into the tree the fungus is transmitted during gallery construction. This has also been found if the beetle “tastes” the tree and does not produce a gallery. The fungus kills an area under the bark and the areas of dead tissue are called cankers. When the walnut twig beetles are abundant, numerous cankers can form and coalesce to girdle twigs and branches, restricting movement of water and nutrients. Black walnut, the most valuable native species to the State, is the most susceptible to this disease.
Emerald ash borer is a pest of ash trees native to Asia. This pest is a slender, emerald green beetle that is ½ inch long, and responsible for the destruction of approximately 20 million ash trees in Indiana, Illinois, Iowa, Kentucky, Maryland, Michigan, Minnesota, Missouri, New York, Ohio, Pennsylvania, Tennessee, Virginia, West Virginia, Wisconsin and Ontario, Canada. In 2012, it was detected in Kansas, Connecticut and Massachusetts. Financially, the United States risks an economic loss of $20 billion to $60 billion because of this pest. A complete devastation of ash trees could seriously affect our ecosystem. On August 29, 2012, the pest was confirmed at the Wyandotte County Lake in Wyandotte County, Kansas. Immediately after confirmation by USDA, the Kansas Secretary of Agriculture implemented an emergency intrastate quarantine for Wyandotte County. On July 5, 2013, Johnson County showed evidence of an adult emerald ash borer. Subsequently, Leavenworth (2014), Douglas (2015), and Jefferson (2015), Atchison (2016), Doniphan (2017), and Shawnee (2017) counties have had the Emerald Ash Borer detected. All these counties are under a permanent Emerald Ash Borer Quarantine.
Regulated items under the Emerald Ash Borer quarantine include the following:
The emerald ash borer, (Agrilus planipennis [Coleoptera: Buprestidae]), in any living stage of development;
Firewood of all hardwood (non-coniferous) species;
Nursery stock of the genus Fraxinus (Ash);
Green lumber of the genus Fraxinus (Ash);
Other material living, dead, cut, or fallen, including logs, stumps, roots, branches, and composted and uncomposted chips of the genus Fraxinus (Ash);

Kansas Hazard Mitigation Plan Draft 3-72 2018
Any other article, product, or means of conveyance that an inspector determines presents a risk of spreading emerald ash borer and notifies the person in possession of the article, product, or means of conveyance that it is subject to the restrictions of the regulations.
Figure 3.12 is a map of the Cooperative Emerald Ash Borer Project from the USDA, Animal and Plant Health Inspection Service. It shows the Federal Emerald Ash Borer (EAB) Quarantine and Authorized Transit areas as of September 6, 2017. Kansas has counties within the Federal Quarantine boundaries.
Figure 3.12. Cooperative Emerald Ash Borer Project Quarantine and Authorized Transit Areas
Source: https://www.aphis.usda.gov/plant_health/plant_pest_info/emerald_ash_b/downloads/AshRangeMap.pdf
Wildlife Pests
In addition to crop loss due to wildlife foraging in Kansas, there are also several fatal diseases that can affect the deer and captive elk population. Chronic Wasting Disease (CWD) is one fatal disease and has no known treatment or eradiation method. Surveillance of this disease began in
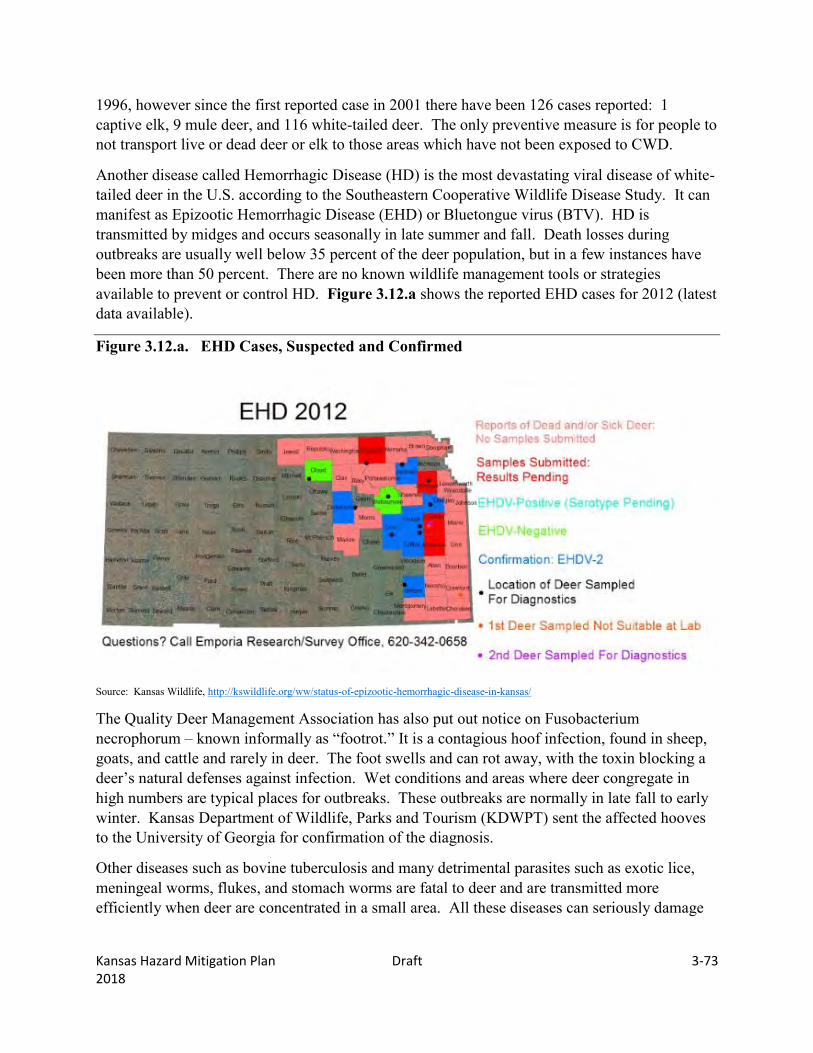
Kansas Hazard Mitigation Plan Draft 3-73 2018
1996, however since the first reported case in 2001 there have been 126 cases reported: 1 captive elk, 9 mule deer, and 116 white-tailed deer. The only preventive measure is for people to not transport live or dead deer or elk to those areas which have not been exposed to CWD.
Another disease called Hemorrhagic Disease (HD) is the most devastating viral disease of white-tailed deer in the U.S. according to the Southeastern Cooperative Wildlife Disease Study. It can manifest as Epizootic Hemorrhagic Disease (EHD) or Bluetongue virus (BTV). HD is transmitted by midges and occurs seasonally in late summer and fall. Death losses during outbreaks are usually well below 35 percent of the deer population, but in a few instances have been more than 50 percent. There are no known wildlife management tools or strategies available to prevent or control HD. Figure 3.12.a shows the reported EHD cases for 2012 (latest data available).
Figure 3.12.a. EHD Cases, Suspected and Confirmed
Source: Kansas Wildlife, http://kswildlife.org/ww/status-of-epizootic-hemorrhagic-disease-in-kansas/
The Quality Deer Management Association has also put out notice on Fusobacterium necrophorum – known informally as “footrot.” It is a contagious hoof infection, found in sheep, goats, and cattle and rarely in deer. The foot swells and can rot away, with the toxin blocking a deer’s natural defenses against infection. Wet conditions and areas where deer congregate in high numbers are typical places for outbreaks. These outbreaks are normally in late fall to early winter. Kansas Department of Wildlife, Parks and Tourism (KDWPT) sent the affected hooves to the University of Georgia for confirmation of the diagnosis.
Other diseases such as bovine tuberculosis and many detrimental parasites such as exotic lice, meningeal worms, flukes, and stomach worms are fatal to deer and are transmitted more efficiently when deer are concentrated in a small area. All these diseases can seriously damage

Kansas Hazard Mitigation Plan Draft 3-74 2018
the populations of the captive deer and elk farms and the wild deer populations, but also affects the annual $350 million dollar plus hunting economy in Kansas.
All agricultural and urban areas in Kansas are subject to agricultural infestations. The central and western parts of the State are more susceptible to crop and livestock infestation.
In addition, there are several aspects of agricultural infestation that are directly parallel to the risk of agri-terrorism. Many experts fear that intentional, criminal introduction of a disease such as foot and mouth to one or more of Kansas stockyards would result in very rapid spread of the disease throughout the nation and could have very severe economic consequences to the industry. Additional information is provided about Agri-terrorism in Section 3.3.17 Terrorism/Agri-Terrorism.
Previous Occurrences
The Kansas Department of Agriculture’s Kansas Cooperative Plant Disease Survey Report, dated 2016 reports annual wheat disease loss estimates starting from 1976 through 2016. Figure 3.13 is the loss estimate percentages that began in 1976 and that have many peaks and valleys over the years that are associated with disease epidemics and weather conditions. The trend is a steady decline in the wheat disease losses. Stripe Rust was the most important disease of 2016, followed by Leaf rust, and Wheat Streak Mosaic Complex.
Figure 3.13. Annual Wheat Disease Loss Estimate Percentages from 1976 through 2016
Source: Kansas Cooperative Plant Disease Survey Report, http://www.ksda.gov/includes/document_center/plant_protection/Plant_Disease_Reports/2012KSWheatDiseaseLossEstimates.pdf, dated August 2016
Other Infestations
June 2017: Emerald ash borer was detected in Doniphan and Shawnee counties. Doniphan and Shawnee were placed on the permanent list.

Kansas Hazard Mitigation Plan Draft 3-75 2018
2016: Atchison County is added to the permanent quarantine for emerald ash borer. Doniphan (2017), counties have had the Emerald Ash Borer detected. In June 2017 the emerald ash borer was confirmed, however they have not been put on a quarantine as of yet. All these counties are under a permanent Emerald Ash Borer Quarantine except for Shawnee.
October 27, 2015: The emerald ash borer is confirmed in Jefferson County. Permanent Quarantine expanded to include Douglas and Jefferson Counties on same date.
October 8, 2015: The confirmed presence of the emerald ash borer in Douglas County. July 16, 2014: The emerald ash borer was detected in Leavenworth County. Quarantine
was put in place July 17, 2014. July 5, 2013: The emerald ash borer was detected in Johnson County. A permanent
emergency intrastate quarantine became effective September 24, 2013. February 2013: Pro-Pet plant in Kansas City, Kansas recalled five different product lines of
its privately branded dog food due to aflatoxin. The elevated levels of aflatoxin were contained in the corn used to make the pet food, which was distributed across 8 Midwestern states.
August 29, 2012: The emerald ash borer pest was confirmed at the Wyandotte County Lake in Wyandotte County, Kansas. Immediately after confirmation by USDA, the Kansas Secretary of Agriculture implemented an emergency intrastate quarantine for Wyandotte County. The stipulations for the quarantine can be found on the Kansas Department of Agriculture’s website: http://www.ksda.gov/plant_protection/content/379.
Summer 2012: Scrapie was found in two sheep at a regulatory slaughter test in Kansas. The sheep were from two unrelated flocks. There had not been any cases in Kansas for more than two years. In 2011, there had been no positive Scrapie cases on sheep slaughter surveillance.
2001: A major infestation of webworms attacked the State’s alfalfa crop particularly in eastern Kansas.
1989: Gray leaf spot of corn was first identified in the State in the Republican River Valley. The disease reached economic threshold levels by 1992 and has caused economic damages somewhere in the State every year from 1992 to 1998. In 1998, it was the most severe in northeast Kansas and in the irrigated areas of south central and southwest Kansas.
According to the USDA Risk Management Agency, insured crop losses through the State of Kansas as a result of insects, Aflatoxin, plant disease and wildlife foraging for the ten year period 2006 – 2015 totaled $$40,158,784. In Table 3.28, the USDA Risk Management Agency insured crop losses through the State of Kansas are shown by year 2006 – 2015. It shows the highest year of crop losses as 2006 in this 10 year period. This information is also reported and annualized by county for the five year period of 2011 – 2015 in Table 3.31 in the State Estimates of Potential Losses Section. Note that this data only applies to insured crops.
Table3.28. Total Insured Crop Insurance Paid by Year, 2006 – 2015
Year Crop Insurance Paid 2015 $4,690,521 2014 $984,054 2013 $2,164,871

Kansas Hazard Mitigation Plan Draft 3-76 2018
2012 $5,441,845 2011 $2,501,360 2010 $1,905,403 2009 $1,766,449 2008 $4,648,900 2007 $2,399,839 2006 $13,655,542 Total $40,158,784
Probability of Future Hazard Events
Agricultural losses every year are experienced in Kansas as a result of naturally-occurring diseases that impact animals/livestock. This hazard’s CPRI probability is “Highly Likely.”
While the probability of the hazard is “Highly Likely”, the acres of land in farms is decreasing in Kansas as seen in Table 3.29. This trend is expected to continue in Kansas which would decrease the acres of crops and number of livestock animals that could be infected with an infestation.
Table 3.29. Kansas Land in Farms
2002 2007 2010 2012 Percent change from 2002-2012
Land in Farms (acres) 47,227,944 46,345,827 46,200,000 46,137,295 -2.36% Source: USDA, National Agricultural Statistics Service, 2012
The Emerald Ash Borer has already spread since the last plan update from being in Wyandotte County then and having a presence in Jefferson, Douglas, Johnson, Wyandotte, Leavenworth, Atchison, Doniphan, and Shawnee counties now. Prevention is more cost-effective than trying to contain established pest, and as such the State will continue working in tandem with the public, firewood dealers, arborists, and the nursery industry to prevent further spreading. The 1.5 million ash trees that occur in Kansas towns and cities will pose a great cost to Kansans in removal, stump grinding, and replacement if the pest further spreads throughout the State.
State Vulnerability Analysis
The cumulative disease lost estimate for the 2016 wheat crop was 13.1% or 68.4 million bushels. The potential yield of the wheat crop without diseases was calculated at 522 million bushels, or 64.4 bushels per acre. Kansas ranks first in wheat in the nation, as well as sorghum production with over 43% of the production. Plant pest are a significant risk to the Kansas agricultural sector, some even capable of destroying the entire State’s crop or plant. Table 3.30 list the highest risk plant pests to Kansas, their crop or host plant, the global distribution of the pest and the acreage at risk.
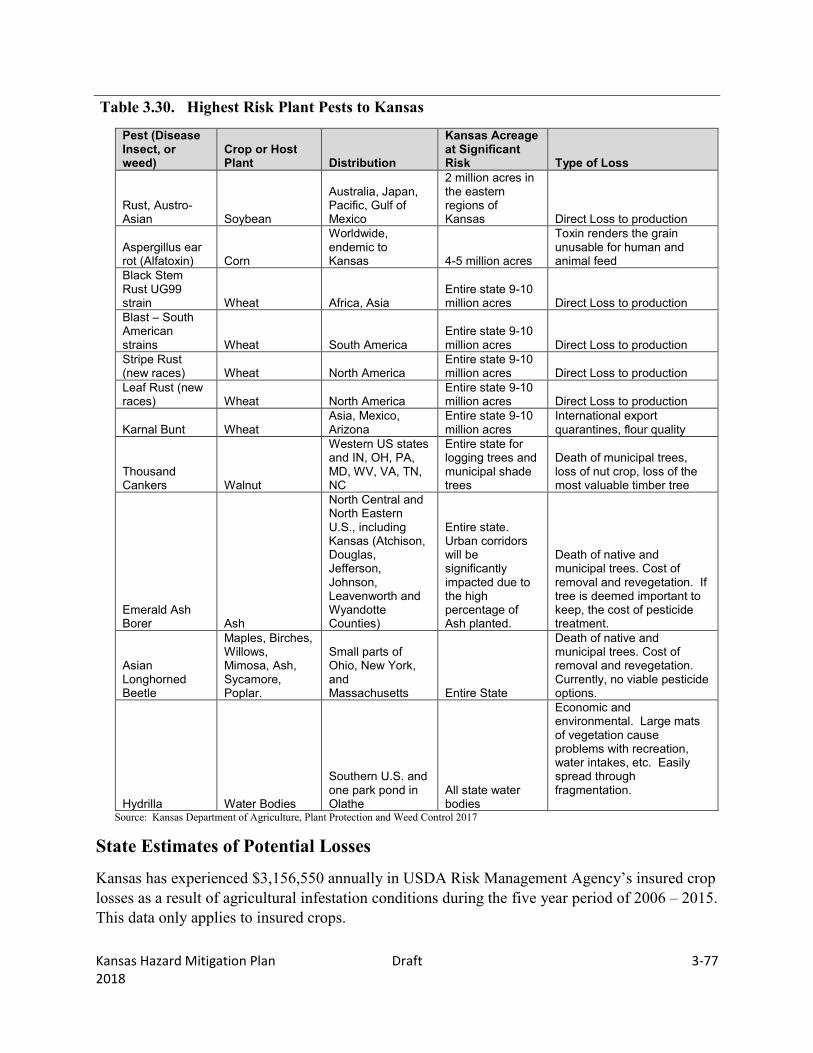
Kansas Hazard Mitigation Plan Draft 3-77 2018
Table 3.30. Highest Risk Plant Pests to Kansas
Pest (Disease Insect, or weed)
Crop or Host Plant Distribution
Kansas Acreage at Significant Risk Type of Loss
Rust, Austro-Asian Soybean
Australia, Japan, Pacific, Gulf of Mexico
2 million acres in the eastern regions of Kansas Direct Loss to production
Aspergillus ear rot (Alfatoxin) Corn
Worldwide, endemic to Kansas 4-5 million acres
Toxin renders the grain unusable for human and animal feed
Black Stem Rust UG99 strain Wheat Africa, Asia
Entire state 9-10 million acres Direct Loss to production
Blast – South American strains Wheat South America
Entire state 9-10 million acres Direct Loss to production
Stripe Rust (new races) Wheat North America
Entire state 9-10 million acres Direct Loss to production
Leaf Rust (new races) Wheat North America
Entire state 9-10 million acres Direct Loss to production
Karnal Bunt Wheat Asia, Mexico, Arizona
Entire state 9-10 million acres
International export quarantines, flour quality
Thousand Cankers Walnut
Western US states and IN, OH, PA, MD, WV, VA, TN, NC
Entire state for logging trees and municipal shade trees
Death of municipal trees, loss of nut crop, loss of the most valuable timber tree
Emerald Ash Borer Ash
North Central and North Eastern U.S., including Kansas (Atchison, Douglas, Jefferson, Johnson, Leavenworth and Wyandotte Counties)
Entire state. Urban corridors will be significantly impacted due to the high percentage of Ash planted.
Death of native and municipal trees. Cost of removal and revegetation. If tree is deemed important to keep, the cost of pesticide treatment.
Asian Longhorned Beetle
Maples, Birches, Willows, Mimosa, Ash, Sycamore, Poplar.
Small parts of Ohio, New York, and Massachusetts Entire State
Death of native and municipal trees. Cost of removal and revegetation. Currently, no viable pesticide options.
Hydrilla Water Bodies
Southern U.S. and one park pond in Olathe
All state water bodies
Economic and environmental. Large mats of vegetation cause problems with recreation, water intakes, etc. Easily spread through fragmentation.
Source: Kansas Department of Agriculture, Plant Protection and Weed Control 2017
State Estimates of Potential Losses
Kansas has experienced $3,156,550 annually in USDA Risk Management Agency’s insured crop losses as a result of agricultural infestation conditions during the five year period of 2006 – 2015. This data only applies to insured crops.
Kansas Hazard Mitigation Plan Draft 3-78 2018
Table 3.31 is a list of the annualized crop insurance paid per county for agricultural infestation for the years 2006 - 2015. It also shows the State’s concentration of the Top Livestock Inventory and Top Crop in Acres from USDA Census of Agriculture, 2012 (latest data available).
Figure 3.14 shows the Annualized Agricultural Infestation Crop Loss Damages per county. The counties of Crawford, Sumner, and Labette have the highest annualized crop losses for this ten year period.
There is a data limitation for the value of livestock animals that have been killed or euthanized from disease infestation. That data is not available for this planning effort and is not summarized in this potential losses section.
Also, there is no state-wide data on the number of ash trees that could be affected by the Emerald Ash Borer pest and thus there is no summarized data in this potential losses section.
The KHMT approved the use of the 10 year period to reflect the change in the climate and more accurately depict changes in our state. This hazards ranking did not change due to this time period, but stayed the same. In the 2013 update the years 2002 – 2011 were used with a ranking result of 2.95 – medium planning significance. In 2018 the years 2006 – 2015 were used with a ranking result of 2.95 – medium.

Kansas Hazard Mitigation Plan Draft 3-79 2018
Table 3.31. Total Insured Crop Insurance Paid per County from 2011 - 2015, Top Livestock Inventory Number and Top Crop in Acres from USDA Census 2012. (A numerical zero does not denote ‘none’, it denotes that it is not featured in the top livestock or crop category for that county).
County Ann
ualiz
ed C
rop
Insu
ranc
e Pa
id
for
Agr
icul
tura
l In
fest
atio
n D
amag
es
All
Goa
ts In
vent
ory
Cat
tle &
Cal
ves
Inve
ntor
y
Hog
s &
Pig
s In
vent
ory
Hor
ses
& P
onie
s In
vent
ory
Shee
p &
Lam
bs,
Inve
ntor
y, W
ool
Prod
uctio
n
Cor
n H
arve
sted
in
Acr
es
Fora
ge H
arve
sted
in
Acr
es
Sorg
hum
for G
rain
H
arve
sted
in A
cres
Soyb
eans
for B
eans
H
arve
sted
in A
cres
Whe
at H
arve
sted
in
Acr
es
Mitigation Planning Region A Cheyenne $15,312 0 50,788 0 284 D 53,256 9,190 7,008 0 99,307 Decatur $4,568 0 48,347 94 192 D 79,490 10,610 7,447 0 84,930 Gove $13,823 0 71,266 0 399 D 76,031 11,344 34,586 0 106,514 Logan $16,386 0 24,412 0 319 777 58,078 6,301 26,491 0 112,086 Rawlins $46,860 0 30,406 0 195 0 66,074 13,824 18,755 0 119,847 Sheridan $23,603 0 117,073 0 336 0 123,299 0 0 19,590 83,186 Sherman $21,846 D 28,316 0 384 0 108,802 18,150 11,484 0 151,236 Thomas $11,608 96 51,233 0 506 0 171,616 0 17,552 11,789 168,086 Wallace $13,064 0 16,427 D 244 612 64,455 4,491 16,619 0 86,131 Subtotal $167,070 96 438,268 94 2,859 1,389 801,101 73,910 139,942 31,379 1,011,323
Mitigation Planning Region B
Ellis $12,877 0 26,923 273 492 0 0 21,349 34,933 2,972 86,982 Graham $16,855 133 20,920 D 283 0 28,495 14,843 41,780 0 73,589 Ness $37,259 0 29,645 132 262 31 3,679 13,718 50,338 0 126,807 Norton $1,124 0 52,373 125,966 515 310 67,620 13,552 0 15,587 67,100
Phillips $4,394 0 48,880
38,403 497 897 27,554 0 32,266 23,560 73,628 Rooks $24,422 0 44,803 45 244 104 0 21,867 62,529 26,902 96,588 Rush $8,175 0 32,046 D 358 0 0 19,103 51,233 8,129 111,488 Russell $11,255 0 27,162 0 597 356 0 20,401 35,357 12,247 75,600

Kansas Hazard Mitigation Plan Draft 3-80 2018
County Ann
ualiz
ed C
rop
Insu
ranc
e Pa
id
for
Agr
icul
tura
l In
fest
atio
n D
amag
es
All
Goa
ts In
vent
ory
Cat
tle &
Cal
ves
Inve
ntor
y
Hog
s &
Pig
s In
vent
ory
Hor
ses
& P
onie
s In
vent
ory
Shee
p &
Lam
bs,
Inve
ntor
y, W
ool
Prod
uctio
n
Cor
n H
arve
sted
in
Acr
es
Fora
ge H
arve
sted
in
Acr
es
Sorg
hum
for G
rain
H
arve
sted
in A
cres
Soyb
eans
for B
eans
H
arve
sted
in A
cres
Whe
at H
arve
sted
in
Acr
es
Trego $8,472 98 26,823 0 172 0 7,589 11,130 45,463 0 81,169 Subtotal $124,833 231 309,575 164,819 3,420 1,698 134,937 135,963 353,899 89,397 792,951
Mitigation Planning Region C Grant $1,899 102 216,959 D 190 300 47,834 0 8,623 0 105,557 Greeley $23,161 0 36,586 D 0 0 31,939 5,217 34,647 0 170,557 Hamilton $25,051 115 120,981 76 246 0 10,780 13,836 33,002 0 147,852 Kearny $12,860 193 74,039 D 345 0 22,959 22,941 45,823 0 130,786 Lane $3,286 218 66,279 D 200 28 11,024 0 24,813 0 112,795 Morton $3,858 0 20,603 D 157 14 28,394 2,130 30,404 0 134,488 Scott $34 0 223,521 69,063 295 120 34,315 0 54,648 0 129,420 Stanton $24,382 0 20,481 D 31 D 57,241 0 26,581 0 119,380 Stevens $98,841 0 37,666 D 265 0 115,242 0 27,034 6,127 75,044 Wichita $4,206 0 138,561 D 189 D 40,630 0 39,106 0 135,947 Subtotal $197,578 628 955,676 69,139 1,918 462 400,358 44,124 324,681 6,127 1,261,826
Mitigation Planning Region D
Clark 0 0 47,289 D 340 276 1,285 12,454 10,616 0 67,650 Finney $19,080 363 212,712 0 793 0 92,465 39,848 67,606 0 202,300 Ford $16,730 82 141,784 0 1,608 112 41,013 23,152 74,915 0 178,605 Gray $32,380 0 244,620 D 374 0 58,589 28,263 65,573 0 109,196 Haskell $3,276 0 400,552 20 133 0 60,344 15,553 26,377 0 70,806 Hodgeman $35,496 223 72,063 0 189 124 11,093 11,070 26,370 26,370 109,562 Meade $2,359 0 53,032 D 285 D 94,825 0 26,351 11,549 105,742 Seward $2,138 0 123,422 0 307 D 50,062 8,689 30,197 0 71,742 Subtotal $111,459 668 1,295,474 20 4,029 512 409,676 139,029 328,005 37,919 915,603
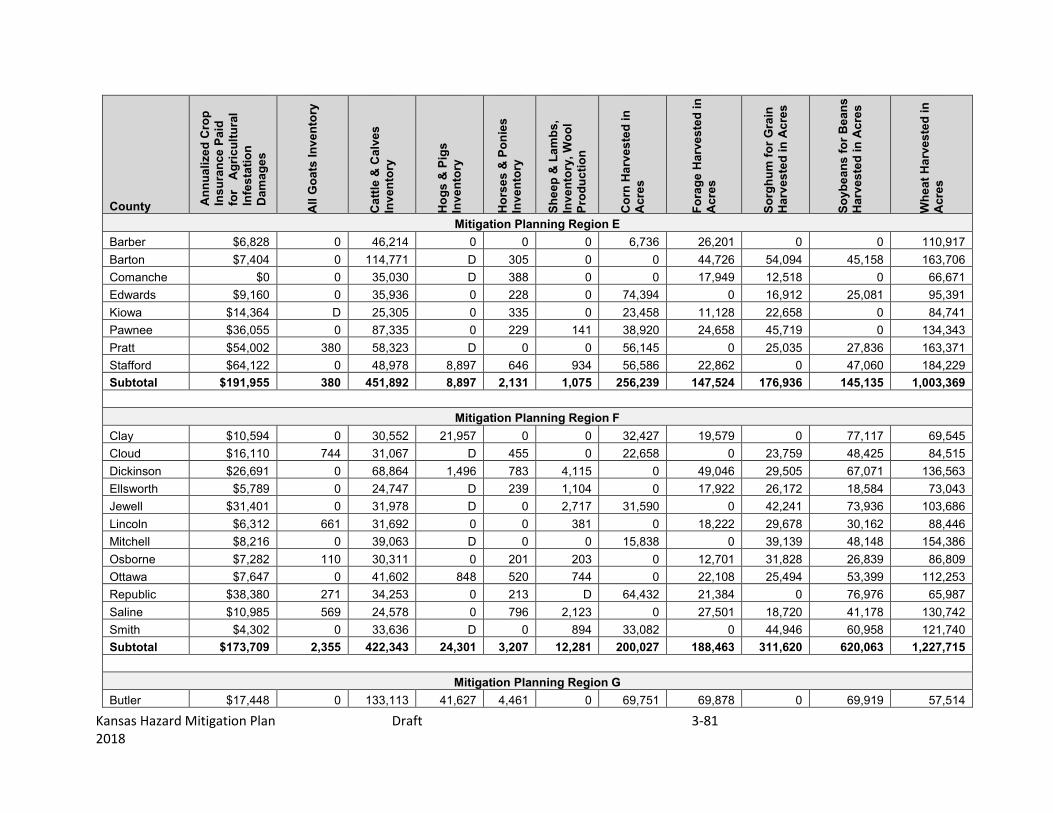
Kansas Hazard Mitigation Plan Draft 3-81 2018
County Ann
ualiz
ed C
rop
Insu
ranc
e Pa
id
for
Agr
icul
tura
l In
fest
atio
n D
amag
es
All
Goa
ts In
vent
ory
Cat
tle &
Cal
ves
Inve
ntor
y
Hog
s &
Pig
s In
vent
ory
Hor
ses
& P
onie
s In
vent
ory
Shee
p &
Lam
bs,
Inve
ntor
y, W
ool
Prod
uctio
n
Cor
n H
arve
sted
in
Acr
es
Fora
ge H
arve
sted
in
Acr
es
Sorg
hum
for G
rain
H
arve
sted
in A
cres
Soyb
eans
for B
eans
H
arve
sted
in A
cres
Whe
at H
arve
sted
in
Acr
es
Mitigation Planning Region E Barber $6,828 0 46,214 0 0 0 6,736 26,201 0 0 110,917 Barton $7,404 0 114,771 D 305 0 0 44,726 54,094 45,158 163,706 Comanche $0 0 35,030 D 388 0 0 17,949 12,518 0 66,671 Edwards $9,160 0 35,936 0 228 0 74,394 0 16,912 25,081 95,391 Kiowa $14,364 D 25,305 0 335 0 23,458 11,128 22,658 0 84,741 Pawnee $36,055 0 87,335 0 229 141 38,920 24,658 45,719 0 134,343 Pratt $54,002 380 58,323 D 0 0 56,145 0 25,035 27,836 163,371 Stafford $64,122 0 48,978 8,897 646 934 56,586 22,862 0 47,060 184,229 Subtotal $191,955 380 451,892 8,897 2,131 1,075 256,239 147,524 176,936 145,135 1,003,369
Mitigation Planning Region F
Clay $10,594 0 30,552 21,957 0 0 32,427 19,579 0 77,117 69,545 Cloud $16,110 744 31,067 D 455 0 22,658 0 23,759 48,425 84,515 Dickinson $26,691 0 68,864 1,496 783 4,115 0 49,046 29,505 67,071 136,563 Ellsworth $5,789 0 24,747 D 239 1,104 0 17,922 26,172 18,584 73,043 Jewell $31,401 0 31,978 D 0 2,717 31,590 0 42,241 73,936 103,686 Lincoln $6,312 661 31,692 0 0 381 0 18,222 29,678 30,162 88,446 Mitchell $8,216 0 39,063 D 0 0 15,838 0 39,139 48,148 154,386 Osborne $7,282 110 30,311 0 201 203 0 12,701 31,828 26,839 86,809 Ottawa $7,647 0 41,602 848 520 744 0 22,108 25,494 53,399 112,253 Republic $38,380 271 34,253 0 213 D 64,432 21,384 0 76,976 65,987 Saline $10,985 569 24,578 0 796 2,123 0 27,501 18,720 41,178 130,742 Smith $4,302 0 33,636 D 0 894 33,082 0 44,946 60,958 121,740 Subtotal $173,709 2,355 422,343 24,301 3,207 12,281 200,027 188,463 311,620 620,063 1,227,715
Mitigation Planning Region G
Butler $17,448 0 133,113 41,627 4,461 0 69,751 69,878 0 69,919 57,514

Kansas Hazard Mitigation Plan Draft 3-82 2018
County Ann
ualiz
ed C
rop
Insu
ranc
e Pa
id
for
Agr
icul
tura
l In
fest
atio
n D
amag
es
All
Goa
ts In
vent
ory
Cat
tle &
Cal
ves
Inve
ntor
y
Hog
s &
Pig
s In
vent
ory
Hor
ses
& P
onie
s In
vent
ory
Shee
p &
Lam
bs,
Inve
ntor
y, W
ool
Prod
uctio
n
Cor
n H
arve
sted
in
Acr
es
Fora
ge H
arve
sted
in
Acr
es
Sorg
hum
for G
rain
H
arve
sted
in A
cres
Soyb
eans
for B
eans
H
arve
sted
in A
cres
Whe
at H
arve
sted
in
Acr
es
Cowley $89,964 1,218 47,793 0 1,540 1,044 0 38,139 23,607 53,705 101,683 Harper $17,748 0 57,025 0 333 531 0 16,914 12,347 10,005 220,195 Harvey $31,922 0 35,702 12,989 0 0 57,651 0 20,697 80,273 125,019 Kingman $48,157 554 43,721 0 869 1,200 0 28,372 15,409 16,081 204,022 McPherson $56,655 0 39,083 16,939 0 2,448 39,661 0 27,647 77,900 229,152 Marion $41,278 0 96,938 6,947 0 1,199 35,242 45,976 0 74,432 133,649 Reno $45,994 0 79,307 14,191 2,311 3,396 0 52,938 44,695 108,103 261,315 Rice $10,757 0 48,298 13,473 499 0 30,347 0 35,080 60,118 180,237 Sedgwick $76,489 0 29,784 1,990 2,220 3,034 37,730 36,683 0 76,601 198,603 Sumner $123,152 0 29,132 1,076 781 764 0 39,825 35,783 74,986 368,554 Subtotal $559,564 554 458,990 67,605 7,013 12572 200,631 220,708 191,658 578,499 1,920,746
Mitigation Planning Region H Allen $98,650 268 31,771 0 366 0 23,937 33,451 0 43,096 15,136 Bourbon $38,682 1,092 55,301 0 1,777 607 13,622 48,340 0 30,919 8,751 Chautauqua $1,079 863 28,299 391 775 0 3,100 14,296 0 6,889 4,673 Cherokee $37,416 0 24,830 D 678 0 54,289 22,329 0 108,074 74,355 Crawford $298,483 719 40,769 0 930 0 51,857 30,307 0 68,438 35,705 Elk $1,460 749 36,354 0 724 296 4,108 21,498 0 12,068 7,194 Greenwood $2,545 967 79,768 D 5,325 0 10,716 36,609 0 28,505 8,843 Labette $116,726 1,305 77,845 0 1,733 0 42,635 40,302 0 66,063 57,301 Montgomery $19,965 0 33,580 D 2,037 0 34,990 37,342 0 55,783 46,400 Neosho $43,615 0 46,538 2,354 0 0 36,161 29,538 0 58,189 32,743 Wilson $77,030 730 16,864 0 266 114 36,376 24,043 0 57,614 31,846 Woodson $25,104 243 38,892 0 330 0 30,280 40,837 0 44,133 21,789 Subtotal $760,755 6,936 510,811 2,754 14,941 1,017 342,071 378,892 0 579,771 344,736
Mitigation Planning Region I
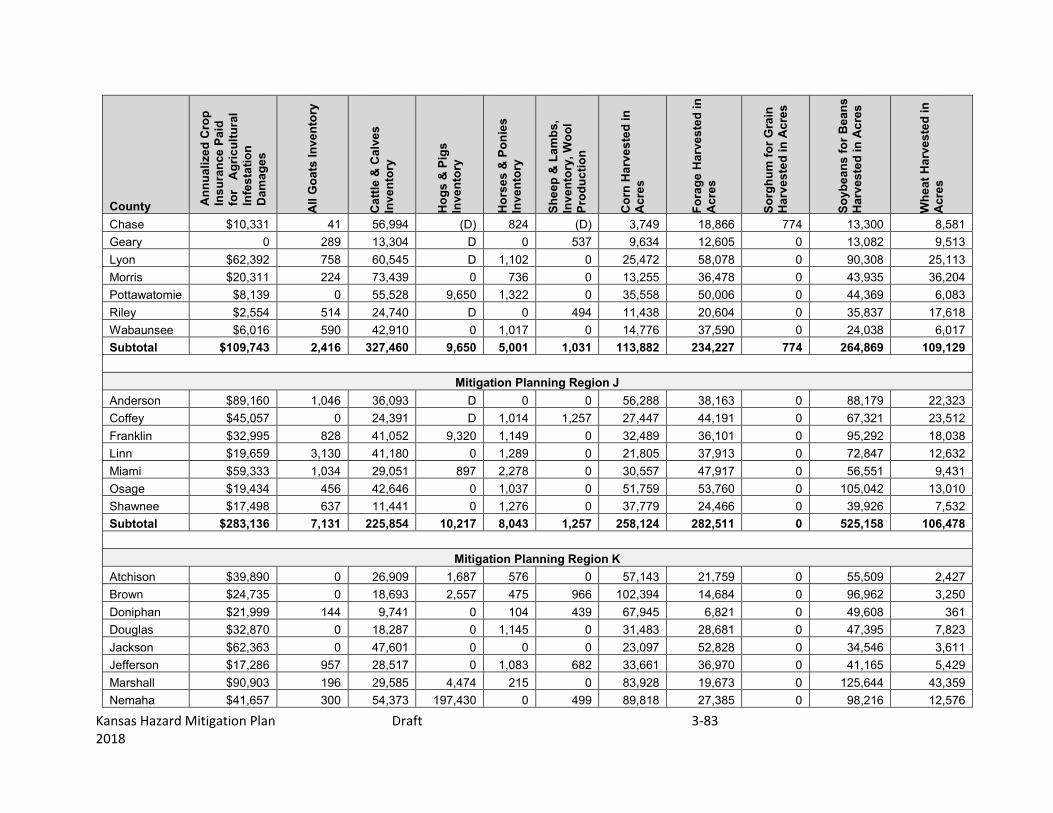
Kansas Hazard Mitigation Plan Draft 3-83 2018
County Ann
ualiz
ed C
rop
Insu
ranc
e Pa
id
for
Agr
icul
tura
l In
fest
atio
n D
amag
es
All
Goa
ts In
vent
ory
Cat
tle &
Cal
ves
Inve
ntor
y
Hog
s &
Pig
s In
vent
ory
Hor
ses
& P
onie
s In
vent
ory
Shee
p &
Lam
bs,
Inve
ntor
y, W
ool
Prod
uctio
n
Cor
n H
arve
sted
in
Acr
es
Fora
ge H
arve
sted
in
Acr
es
Sorg
hum
for G
rain
H
arve
sted
in A
cres
Soyb
eans
for B
eans
H
arve
sted
in A
cres
Whe
at H
arve
sted
in
Acr
es
Chase $10,331 41 56,994 (D) 824 (D) 3,749 18,866 774 13,300 8,581 Geary 0 289 13,304 D 0 537 9,634 12,605 0 13,082 9,513 Lyon $62,392 758 60,545 D 1,102 0 25,472 58,078 0 90,308 25,113 Morris $20,311 224 73,439 0 736 0 13,255 36,478 0 43,935 36,204 Pottawatomie $8,139 0 55,528 9,650 1,322 0 35,558 50,006 0 44,369 6,083 Riley $2,554 514 24,740 D 0 494 11,438 20,604 0 35,837 17,618 Wabaunsee $6,016 590 42,910 0 1,017 0 14,776 37,590 0 24,038 6,017 Subtotal $109,743 2,416 327,460 9,650 5,001 1,031 113,882 234,227 774 264,869 109,129
Mitigation Planning Region J Anderson $89,160 1,046 36,093 D 0 0 56,288 38,163 0 88,179 22,323 Coffey $45,057 0 24,391 D 1,014 1,257 27,447 44,191 0 67,321 23,512 Franklin $32,995 828 41,052 9,320 1,149 0 32,489 36,101 0 95,292 18,038 Linn $19,659 3,130 41,180 0 1,289 0 21,805 37,913 0 72,847 12,632 Miami $59,333 1,034 29,051 897 2,278 0 30,557 47,917 0 56,551 9,431 Osage $19,434 456 42,646 0 1,037 0 51,759 53,760 0 105,042 13,010 Shawnee $17,498 637 11,441 0 1,276 0 37,779 24,466 0 39,926 7,532 Subtotal $283,136 7,131 225,854 10,217 8,043 1,257 258,124 282,511 0 525,158 106,478
Mitigation Planning Region K Atchison $39,890 0 26,909 1,687 576 0 57,143 21,759 0 55,509 2,427 Brown $24,735 0 18,693 2,557 475 966 102,394 14,684 0 96,962 3,250 Doniphan $21,999 144 9,741 0 104 439 67,945 6,821 0 49,608 361 Douglas $32,870 0 18,287 0 1,145 0 31,483 28,681 0 47,395 7,823 Jackson $62,363 0 47,601 0 0 0 23,097 52,828 0 34,546 3,611 Jefferson $17,286 957 28,517 0 1,083 682 33,661 36,970 0 41,165 5,429 Marshall $90,903 196 29,585 4,474 215 0 83,928 19,673 0 125,644 43,359 Nemaha $41,657 300 54,373 197,430 0 499 89,818 27,385 0 98,216 12,576

Kansas Hazard Mitigation Plan Draft 3-84 2018
County Ann
ualiz
ed C
rop
Insu
ranc
e Pa
id
for
Agr
icul
tura
l In
fest
atio
n D
amag
es
All
Goa
ts In
vent
ory
Cat
tle &
Cal
ves
Inve
ntor
y
Hog
s &
Pig
s In
vent
ory
Hor
ses
& P
onie
s In
vent
ory
Shee
p &
Lam
bs,
Inve
ntor
y, W
ool
Prod
uctio
n
Cor
n H
arve
sted
in
Acr
es
Fora
ge H
arve
sted
in
Acr
es
Sorg
hum
for G
rain
H
arve
sted
in A
cres
Soyb
eans
for B
eans
H
arve
sted
in A
cres
Whe
at H
arve
sted
in
Acr
es
Washington $59,821 675 70,551 86,002 0 0 56,372 27,837 0 95,979 67,052 Subtotal $391,524 2,272 304,257 292,150 3,598 2,586 545,841 236,638 0 645,024 145,888
Mitigation Planning Region L Johnson $18,346 0 11,154 D 1,843 0 10,818 14,887 0 23,713 4,471 Leavenworth $65,300 0 21,185 1,516 1,468 0 15,751 37,370 0 31,315 4,379 Wyandotte $1,578 85 1,407 0 215 148 1,741 1,817 0 2,731 130 Subtotal $85,224 85 33,746 1,516 3,526 148 28,310 54,074 0 57,759 8,980
Statewide Total $3,156,550 23,752 5,734,346 651,162 59,686 36,028 3,691,197 2,136,063 1,827,515 3,581,100 8,848,744 Source: USDA Risk Management Agency, 2015; USDA Census of Agriculture, 2012. Note: (D) is cannot be disclosed

Kansas Hazard Mitigation Plan Draft 3-85 2018
Figure 3.14. Annualized Agricultural Infestation Crop Loss Damages

Kansas Hazard Mitigation Plan Draft 3-86 2018
Development in Hazard Prone Areas
Agricultural infestation does not cause damage to buildings and critical facilities. As more agricultural land is converted to developed land it could decrease agriculture infestation with the decrease in cropland and farm animals.
Consequence Analysis
The threat of foreign animal disease is analyzed in KDEM’s Threat/Hazard Identification & Risk Assessment (THIRA), 2017. This hazard of concern was identified as such because it poses one of the worst, yet most plausible in risk to Kansas communities requiring a comprehensive application of Core Capabilities across the five mission areas of Prevention, Protection, Mitigation Response, and Recovery.
The information in Table 3.32 provides the Consequence Analysis of Potential for Detrimental Impacts of Hazards done for accreditation with the Emergency Management Accreditation Program (EMAP).
Table 3.32. EMAP Consequence Analysis: Agricultural Infestation
Subject Ranking Impacts/Agricultural Infestation Health and Safety of Persons in the Area of the Incident
Minimal Impact for this incidence on the Health and Safety of Persons in the area would be minimal. If the infestation is unrecognized, then there is the potential for the food supply to be contaminated.
Responders Minimal Impact to responders would be minimal with protective clothing, gloves, etc as these diseases cause no risk to humans.
Continuity of Operations Minimal Minimal expectation of execution of the COOP. Property, Facilities, and Infrastructure
Minimal Localized impact to facilities and infrastructure in the incident area is minimal to non-existent.
Delivery of Services Minimal Impacts to the delivery of services would be non-existent to minimal. Impact could be larger depending on the extent of the contaminated crop/crop loss.
Environment Minimal to Severe Impact could be severe to the incident area, specifically, plants, trees, bushes, and crops.
Economic Conditions Minimal to Severe Impacts to the economy will depend on the severity of the infestation. The potential for economic loss to the community and state could be severe if the infestation is hard to contain, eliminate, or reduce. Impact could be minimized due to crop insurance.
Public Confidence in Jurisdiction’s Governance
Minimal to Severe Confidence could be in question depending on timeliness and steps taken to warn the producers and public, and treat/eradicate the infestation.

Kansas Hazard Mitigation Plan Draft 3-87 2018
3.3.2. Civil Disorder Calculated Priority Risk Index Planning Significance
2.65 Moderate
Description/Location
In the United States, civil disorder has been most commonly associated with urban areas and college campuses, particularly in the 1960s around the issues of civil rights and the Vietnam War. Civil disorder is a term that generally refers to groups of people purposely choosing not to observe a law, regulation, or rule, usually in order to bring attention to their cause, concern, or agenda. According to U.S. Code (18 U.S.C. §232), civil disorder is “any public disturbance involving acts of violence by a group of three or more persons causing immediate danger, damage, or injury to the property or person of another individual.” In Kansas, civil disorder is recognized as a societal hazard because of the associated potential for injury, loss of life, property damage, and economic disruption. Civil disorder can take the form of small gatherings or large groups impeding access to a building or disrupting normal activities by generating noise and intimidating people. They can range from a peaceful sit-in to a full-scale riot. Even in its more passive forms, a group that blocks roadways, sidewalks, or buildings interferes with public order. In the 1990s, abortion clinics, for example, were targets for these disruptive-type activities.
Types of Crowds
Crowds can be classified into four general categories:
Casual Crowd—A casual crowd is merely a group of people who happen to be in the same place at the same time. Examples of this type include shoppers and sightseers. The likelihood of violent conduct is all but nonexistent.
Cohesive Crowd—A cohesive crowd consists of members who are involved in some type of unified behavior. Members of this group are involved in some type of common activity, such as worshiping, dancing, or watching a sporting event. Although they may have intense internal discipline (e.g., rooting for a team), they require substantial provocation to arouse to action.
Expressive Crowd—An expressive crowd is one held together by a common commitment or purpose. Although they may not be formally organized, they are assembled as an expression of common sentiment or frustration. Members wish to be seen as a formidable influence. One of the best examples of this type is a group assembled to protest something.
Aggressive Crowd—An aggressive crowd is made up of individuals who have assembled for a specific purpose. This crowd often has leaders who attempt to arouse the members or motivate them to action. Members are noisy and threatening and will taunt authorities. They tend to be impulsive and highly emotional and require only minimal stimulation to arouse them to violence. Examples of this type of crowd include demonstrations and strikers.

Kansas Hazard Mitigation Plan Draft 3-88 2018
Types of Mobs
A mob can be defined as a large disorderly crowd or throng. Mobs are usually emotional, loud, tumultuous, violent, and lawless. Like crowds, mobs have different levels of commitment and can be classified into four categories:
Aggressive Mob—An aggressive mob is one that attacks, riots, and terrorizes. The object of violence may be a person, property, or both. An aggressive mob is distinguished from an aggressive crowd only by lawless activity. Examples of aggressive mobs are the inmate mobs in prisons and jails, mobs that act out their frustrations after political defeat, or violent mobs at political protests or rallies.
Escape Mob—An escape mob is attempting to flee from something such as a fire, bomb, flood, or other catastrophe. Members of escape mobs have lost their capacity to reason and are generally impossible to control. They are characterized by unreasonable terror.
Acquisitive Mob—An acquisitive mob is one motivated by a desire to acquire something. Riots caused by other factors often turn into looting sprees. This mob exploits a lack of control by authorities in safeguarding property. Examples of acquisitive mobs would include the looting in South Central Los Angeles in 1992, or food riots in other countries.
Expressive Mob—An expressive mob is one that expresses fervor or revelry following some sporting event, religious activity, or celebration. Members experience a release of pent up emotions in highly charged situations. Examples of this type of mob include the June 1994 riots in Canada following the Stanley Cup professional hockey championship, European soccer riots, and those occurring after other sporting events in many countries, including the United States.
Although members of mobs have differing levels of commitment, as a group they are far more committed than members of a crowd. As such, a “mob mentality” sets in, which creates a cohesiveness and sense of purpose that is generally lacking in crowds.
Previous Occurrences
Previous occurrences in Kansas which could be described as Civil Disorder are listed below:
1920 Independence, Kansas Riots: A grocer had been murdered in his store early Thursday morning, presumably by an African-American man, who was caught in the act of robbing the cash register within the store, by a passing citizen, who immediately gave the alarm and notified local police authorities. Several suspects were arrested, and one was identified as the man seen within the store of the murdered man. Soon after the identity had been established crowds began to gather within the vicinity of the jail, and threats of violence were heard. Armed African-Americans, who claimed they came to offer their services to the police officials in the protection of the prisoner from mob violence, were present, as were armed whites who had been engaged in the hunt for the murderer, or were attracted by the threats of violence. The police officials, with the aid of the man who identified the prisoner, attempted
Kansas Hazard Mitigation Plan Draft 3-89 2018
to pacify the crowd and induce them to disperse. During the parley a shot was fired by parties unknown, and immediately a fusillade of shots were exchanged between the Caucasians and African-Americans, resulting in the killing of one African-American, two Caucasians, and the serious wounding of three other Caucasians, whose recovery was doubtful. After the first exchange of shots the African-Americans retired to cover, with the whites gathering force, and it looked like a race war was on. The local peace officers quickly realized that they were unable to successfully cope with the situation, and thereupon called for volunteers to assist in restoring order and upholding the law. Many members of the American Legion from Independence and near-by towns responded to the call for assistance, and a force approximating 450 men was organized and controlled the situation, under Legion officers, until the arrival of National Guard troops. During this period National Guard troops were ordered into active service to suppress lawlessness and assist civil authorities in upholding the law upon two different occasions. At Independence, KS, on December 17, 1920, after a clash between Caucasians and African-Americans in which several persons were killed or injured. The sheriff of Montgomery County called for military aid. Nine officers and 104 enlisted men of the Fourth Infantry were dispatched to Independence, arriving there at 3:45 a.m., December 18, 1920. The situation was quickly in hand, and all troops returned to their home stations the following day. The near race riot which caused troops to be called to Independence resulted from the murder of an Independence citizen by an African-American
1984 and 1986 Aggieville Riots: These riots occurred in Manhattan, Kansas, following football games between Kansas State University and the University of Kansas. They were some of the earliest collegiate sports-related riots in the United States. On October 13, 1984, Kansas State defeated KU 24-7 in football. That evening, Kansas State students and townspeople gathered to celebrate the victory in Aggieville, a student entertainment district in Manhattan filled with bars. An estimated 6,000 to 8,000 people jammed the main street outside the bars. As night fell, the revelers turned violent, smashing windows and signs, overturning a car, and uprooting street signs. Police who attempted to intervene were chased by students who hurled obscenities and bottles at them. Five police officers were cornered for a time and pelted with rocks and bottles. http://en.wikipedia.org/wiki/Aggieville_Riots - cite_note-Collegian-3 At one point, the Kansas Highway Patrol called Governor John W. Carlin's office to request that he declare a state of emergency and send Kansas National Guard troops to Aggieville – ultimately, this was not done. Ten people were injured in the riot, including six police officers. Twenty-four arrests were made. Two years later, despite a number of precautions, Aggieville was the site of another riot after Kansas State again defeated Kansas University 29-12 on October 18, 1986. Students wearing t-shirts that said "Riotville" and "Riot II" mingled amongst 4,000 to 6,000 people that again filled the main street outside the bars. As night fell, the crowd again turned violent. Almost every building in Aggieville had its windows smashed, people climbed to the tops of several buildings, and a 1968 Volkswagen Beetle was rolled over and torched. Eighteen arrests were made. Although the property damage was greater in 1986, injuries were limited. In 1987, Manhattan was again the site of the KSU-KU football game, but this time the town completely cordoned-off Aggieville and brought in police officers from all over the State of Kansas to

Kansas Hazard Mitigation Plan Draft 3-90 2018
control entry points and patrol the streets inside. This ended the cycle of violence. A 17-17 tie in what became known as the "Toilet Bowl" left little cause for celebration on either side.
1991 Summer of Mercy Wichita: Operation Rescue National's activities gained attention again in 1991 during the “Summer of Mercy” in Wichita, Kansas, led by Keith Tucci. Thousands of anti-abortion protesters flocked to Wichita and were arrested at sit-in protests and blockades of clinic entrances and adjacent streets. The protests were held at three different clinic locations in Wichita but focused on George Tiller's abortion clinic. Over 1,600 arrests took place during the first three weeks, with thousands of locals gathering and dozens of clergy people becoming involved. The event lasted six weeks, with over 2,600 arrests accomplished by the Wichita Police Department. The protests culminated in a rally that filled Cessna Stadium, featuring Pat Robertson. The New York Times ran an article on August 4, 1991, quoting John Snow, a retired accountant who sat on the sidewalk across from Tiller's clinic in Wichita, dispensing Kool-Aid and saying the rosary. Despite the large numbers of arrests, Operation Rescue founder Randall Terry was quoted as saying "The Wichita Police handled the Operation Rescue event better than almost any police department in history." As a result, Wichita Police Chief Rick Stone received the United States Department of Justice Marshal's Service "Law Enforcement Officer of the Year Award" for his "outstanding professionalism and law enforcement leadership".
2016 Butler County Jail riot. Approximately 50 inmates at the Butler County Jail in El Dorado, Kansas, refused to return to their cells after lunch because they did not like the meal they were served for lunch. Tables were tipped over, fire extinguishers were set off, and some security cameras were torn up. Emergency personnel from across the county responded to the incident.
2017 Norton Correctional Facility Riot. A violent inmate uprising saw multiple fires set in the Norton Correctional Facility. Computers were destroyed, staff offices overrun, and the prisons clinic was vandalized. Over 400 inmates were involved in the riot. Correctional officers stated tensions had been rising recently due to overcrowding.
Probability of Future Hazard Events
Nationwide, riots are likely to be a feature of life. Without question, Kansas will continue to experience marches, protests, demonstrations, and gatherings in various cities and communities that could lead to some type of civil disorder. However, based on the State’s general history of civil disturbance and the various human factors noted above, the probability that such incidents will develop into full-scale riots is considered “Unlikely”. Other than the two riots in 2016 and 2017, which were in correctional facilities, the other incidents of disorder were at least 15 years apart.
State Vulnerability Analysis Although it is a rare event, when rioting or civil disorders do occur, they generally prove extremely difficult for law enforcement authorities to control. Initial law enforcement presence

Kansas Hazard Mitigation Plan Draft 3-91 2018
is often staffed below the peak loads needed to bring things back under control. As a result, the civil disorder continues until sufficient state police or National Guard units arrive to bolster the arrest process and subsequently restore order. In some cases, damage to life and property may already be extensive. Therefore, this Hazard’s magnitude has the potential to be “catastrophic”, including multiple deaths, to the jurisdiction in which it occurs. Additionally, civil disorder can occur with very little, or no notice and can continue for days. Civil disorder could occur when any large crowd of persons gather. These disorders can have political, social or other causes making it difficult to determine when and where they will occur. At this point in time, for events having the potential for large crowds and /or mob activity, pre-planning is done and many potential civil disturbances are quelled through the presence of sufficient law enforcement personnel and pre-planning for crowd control.
State Estimates of Potential Losses
Potential losses from Civil Disorder include all infrastructure, critical facilities, and human life. The degree of impact would be directly related to the type of incident and the target. Potential losses could include cost of repair or replacement of damaged facilities, lost economic opportunities for businesses, loss of human life, injuries to persons, and immediate damage to the surrounding environment.
While it is not possible to predict the location of civil disorders, those locations with correctional facilities are somewhat more likely to be susceptible to such incidents Section 3.5 discusses State Correctional Facilities and other facilities in which Kansas Inmates are housed and Table 3.33 below provides resident average daily inmate populations for each Kansas Correctional Facility. Of note is that in the 16 year period all inmate totals increased. The cost of a response and recovery from a civil disorder is difficult to determine.
Table 3.33. Resident average Daily Inmate Population in Kansas, by Correctional Facility, Fiscal Years 2010 and 2016
Facility / Location 2010 Inmate Population
2016 Inmate Population
Lansing / Leavenworth County 2,346 2,399 Hutchinson / Reno County 1,783 1,866 El Dorado / Butler County 1,242 1,549 Norton / Norton County 703 832 Ellsworth / Ellsworth County 812 900 Topeka / Shawnee County * (all female inmates) 562 829 Winfield / Cowley County 523 550 Wichita Work Release / Sedgwick County 251 234 Larned (CMHF and non- KDOC Facilities) total 466 542 Source: Kansas Department of Corrections
Development in Hazard Prone Areas
With human-caused hazards such as this that can have multiple variables involved, increases in development and increases in the replacement cost of the built environment can be a factor in

Kansas Hazard Mitigation Plan Draft 3-92 2018
increases cost of the event. The cost for such an event is largely related to the location and the level of violence the crowd chooses.
Consequence Analysis
When rioting does break out, it generally proves extremely difficult for law enforcement authorities to stop the violence promptly. The rules of constitutional law set stringent limits on how police officers can behave toward the people they try to arrest. Restraint also plays a crucial part in avoiding any action that “fans the flames.” Initial police presence is often undermined because forces may be staffed below the peak loads needed to bring things back under control. As a result, the riot may continue until enough state police or National Guard units arrive to bolster the arrest process and subsequently restore order. In many cases, damage to life and property may already be extensive.
The information in Table 3.34 provides the Consequence Analysis of Potential for Detrimental Impacts of Hazards done for accreditation with the Emergency Management Accreditation Program (EMAP).
Table 3.34. Consequence Analysis: Civil Disorder
Subject Ranking Impacts/Civil Disorder
Health and Safety of Persons in the Area of the Incident
Severe Impact could be severe for persons in the incident area.
Responders Minimal to Severe Impact to responders could be severe if not trained and properly equipped. Responders that are properly trained and equipped will have a low to moderate impact.
Continuity of Operations Minimal to Severe Depending on damage to facilities/personnel in the incident area, re-location may be necessary and lines of succession execution (minimal to severe).
Property, Facilities, and Infrastructure
Severe Impact within the incident area could be severe for explosion, moderate to low for Hazmat.
Delivery of Services Minimal to Severe Delivery of services could be affected within and around the affected area especially if communications, road and railways, and facilities incur damage (minimal to severe).
Environment Minimal to Severe Localized impact within the incident area could be severe depending on the type of human caused incident.
Economic Conditions Minimal to Severe Economic conditions could be adversely affected and dependent upon time and length of clean up and investigation (minimal to severe).
Public Confidence in Jurisdiction’s Governance
Minimal to Severe Impact will be dependent on whether or not the incident could have been avoided by government or non-government entities, clean-up and investigation times, and outcomes. (minimal to severe)

Kansas Hazard Mitigation Plan Draft 3-93 2018
3.3.3. Dam and Levee Failure Calculated Priority Risk Index Planning Significance 2.35 Moderate
Description/Location
Kansas is a state with many dams, impoundments, and levees. The failure of these structures could result in injuries, loss of life and property, and environmental and economic damage. While levees are built solely for flood protection, dams often serve multiple purposes, one of which may be flood control. Severe flooding and other storms can increase the potential that dams and levees will be damaged and fail as a result of the physical force of the flood waters or overtopping.
Dams and levees are usually engineered to withstand a flood with a computed risk of occurrence. If a larger flood occurs, then that structure will likely be overtopped. If during the overtopping the dam or levee fails or is washed out, the water behind it is released as a flash flood. Failed dams and levees can create floods that are catastrophic to life and property because of the tremendous energy of the released water.
Dams
A dam is defined by the National Dam Safety Act as an artificial barrier that impounds or diverts water and (1) is more than 6 feet high and stores 50 acre feet or more or (2) is 25 feet or more high and have the capacity to impound 50 or more acre feet of water at the auxiliary spillway. Based on this definition, there are approximately 80,000 dams in the United States. Over 95 percent of these dams are non-federal, with most being owned by state governments, municipalities, watershed districts, industries, lake associations, land developers, and private citizens. Dam owners have primary responsibility for the safe design, operation, and maintenance of their dams. They also have responsibility for providing early warning of problems at the dam, for developing an effective emergency action plan, and for coordinating that plan with local officials.
Dams can fail for many reasons. The most common are as follows:
Piping—Internal erosion caused by embankment leakage, foundation leakage, and/or deterioration of pertinent structures appended to the dam;
Erosion—Inadequate spillway capacity causing overtopping of the dam, flow erosion, and/or inadequate slope protection;
Structural Failure—caused by an earthquake, slope instability, and/or faulty construction.

Kansas Hazard Mitigation Plan Draft 3-94 2018
State-Regulated Dams
In Kansas, the State has regulatory jurisdiction over non-federal dams that meet the following definition of a “jurisdictional” dam as defined by K.S.A. 82a-301 et seq, and amendments thereto:
any artificial barrier including appurtenant works with the ability to impound water,
waste water or other liquids that has a height of 25 feet or more; or has a height of six
feet or greater and a storage volume at the top of the emergency spillway elevation 50 or
more acre feet. The height of a dam or barrier shall be measured from the lowest
elevation of the streambed, downstream toe or outside limit of the dam to the elevation of
the top of the dam.
The prior written consent or permit of the chief engineer shall not be required for
construction or modification of a hazard class A dam that:
(1) Has a height of less than 30 feet and a storage volume at the top of the emergency
spillway elevation of less than 125 acre feet, and the dam location and dimensions have
been registered with the division of water resources in a written form prescribed by the
chief engineer; or
(2) is a wastewater storage structure for a confined feeding facility that has been
approved by the secretary of health and environment pursuant to K.S.A. 65-171d, and
amendments thereto.
Dam classifications have been developed to describe the level of risk associated with dam failure. These classifications do not reflect the physical condition of the dams, but rather describe areas downstream of the dams that could be impacted in the event of failure, which is generally unlikely. The Kansas Department of Agriculture, Division of Water Resources (KDA-DWR) classifies jurisdictional dams as follows:
Class C (high hazard)—A “hazard class C dam” shall mean a dam located in an area where failure could result in any of the following: extensive loss of life, damage to more than one home, damage to industrial or commercial facilities, interruption of a public utility serving a large number of customers, damage to traffic on high-volume roads that meet the requirements for hazard class C dams or a high-volume railroad line, inundation of a frequently used recreation facility serving a relatively large number of persons, or two or more individual hazards described in hazard class B. Emergency Action Plans (EAPs) are required for all High Hazard Dams.
Class B (significant hazard)—A “hazard class B dam” means a dam located in an area where failure could endanger a few lives, damage an isolated home, damage traffic on moderate volume roads that meet the requirements for hazard class B dams, damage low-volume railroad tracks, interrupt the use or service of a utility serving a small number of customers, or inundate recreation facilities, including campground areas intermittently used for sleeping and serving a relatively small number of persons.

Kansas Hazard Mitigation Plan Draft 3-95 2018
Class A (low hazard)—A “hazard class A dam” means a dam located in an area where failure could damage only farm or other uninhabited buildings, agricultural or undeveloped land including hiking trails, or traffic on low-volume roads that meet the requirements for hazard class A dams.
At the time this plan update was developed there were 4,498 state-regulated jurisdictional dams in Kansas. Of those, 232 were Class C (High Hazard Dams), 166 were Class B (Significant Hazard Dams), and approximately 4100 were Class A (Low Hazard Dams). High and significant hazard dams are required to have plans prepared and maintained for emergency response to protect public safety in the event of a dam failure. At this time, 209 high hazard dams and 96 significant hazard dams have plans on file with the KDA-DWR/
Table 3.35 provides the numbers of state-regulated low, significant, and high hazard dams for each county in Kansas broken down by Mitigation Planning sub-region.
Table 3.35. Number of State-Regulated Dams by Hazard Class
County
Low Hazard Dams
Significant Hazard Dams
High Hazard Dams
High Hazard Dams
Without EAP
Total Dams
Mitigation Planning Region A Cheyenne 20 0 0 0 20 Decatur 25 0 0 0 25 Gove 21 0 0 0 21 Logan 13 0 0 0 13 Rawlins 18 1 2 0 21 Sheridan 8 0 1 0 9 Sherman 8 0 0 0 8 Thomas 8 0 0 0 8 Wallace 9 0 0 0 9 Subtotal 130 1 3 0 134
Mitigation Planning Region B
Ellis 16 0 1 0 17 Graham 19 0 0 0 19 Ness 34 0 3 0 37 Norton 25 0 0 0 25 Phillips 34 0 0 0 34 Rooks 24 1 1 0 26 Rush 24 9 1 0 34 Russell 19 0 0 0 19 Trego 12 0 0 0 12 Subtotal 207 10 6 0 223
Mitigation Planning Region C
Grant 6 0 0 0 6 Greeley 4 0 0 0 4 Hamilton 21 0 0 0 21 Kearny 9 1 3 0 13 Lane 20 0 0 0 20 Morton 0 0 0 0 0 Scott 6 0 0 0 6

Kansas Hazard Mitigation Plan Draft 3-96 2018
County
Low Hazard Dams
Significant Hazard Dams
High Hazard Dams
High Hazard Dams
Without EAP
Total Dams
Stanton 9 0 0 0 9 Stevens 6 0 0 0 6 Wichita 11 0 0 0 11 Subtotal 92 1 3 0 96
Mitigation Planning Region D
Clark 14 0 0 0 14 Finney 39 1 0 0 40 Ford 14 0 1 0 15 Gray 11 0 4 0 15 Haskell 0 0 0 0 0 Hodgeman 26 0 3 0 29 Meade 13 0 0 0 13 Seward 4 0 0 0 4 Subtotal 121 1 8 0 130
Mitigation Planning Region E
Barber 44 1 1 0 46 Barton 11 0 0 0 11 Comanche 20 1 0 0 21 Edwards 1 0 0 0 1 Kiowa 6 0 0 0 6 Pawnee 19 0 0 0 19 Pratt 8 0 0 0 8 Stafford 1 0 0 0 1 Subtotal 110 2 1 0 113
Mitigation Planning Region F
Clay 24 0 0 0 24 Cloud 13 0 2 0 15 Dickinson 64 4 2 0 70 Ellsworth 24 1 1 0 26 Jewell 26 0 0 0 26 Lincoln 50 8 4 3 62 Mitchell 28 6 1 0 35 Osborne 50 0 0 0 50 Ottawa 59 3 2 0 64 Republic 17 1 0 0 18 Saline 50 0 1 0 51 Smith 38 0 0 0 38 Subtotal 443 23 13 3 479
Mitigation Planning Region G
Butler 171 8 12 3 191 Cowley 98 8 3 2 109 Harper 11 0 0 0 11 Harvey 19 1 8 0 28 Kingman 20 0 1 0 21 Marion 22 1 0 0 23 McPherson 19 0 1 0 20 Reno 10 0 0 0 10 Rice 11 0 0 0 11 Sedgwick 34 1 7 2 42 Sumner 8 1 1 0 10

Kansas Hazard Mitigation Plan Draft 3-97 2018
County
Low Hazard Dams
Significant Hazard Dams
High Hazard Dams
High Hazard Dams
Without EAP
Total Dams
Subtotal 423 20 33 7 476
Mitigation Planning Region H Allen 18 0 0 0 18 Bourbon 69 4 4 0 77 Chautauqua 70 1 3 0 74 Cherokee 6 0 0 0 6 Crawford 34 2 1 0 37 Elk 75 6 3 2 84 Greenwood 118 8 3 0 129 Labette 41 1 0 0 42 Montgomery 31 0 2 1 33 Neosho 43 1 1 0 45 Wilson 32 0 1 0 33 Woodson 33 1 0 0 34 Subtotal 570 24 18 3 612
Mitigation Planning Region I
Chase 69 7 0 0 76 Geary 7 0 2 0 9 Lyon 75 12 2 0 89 Morris 26 1 4 0 31 Pottawatomie 75 5 6 0 86 Riley 10 0 4 2 14 Wabaunsee 45 5 2 0 52 Subtotal 307 30 20 2 357
Mitigation Planning Region J
Anderson 44 0 1 0 45 Coffey 46 2 1 1 49 Franklin 59 2 2 0 63 Linn 45 1 12 0 58 Miami 44 0 3 1 47 Osage 28 6 4 1 38 Shawnee 99 2 11 0 112 Subtotal 365 13 34 3 412
Mitigation Planning Region K
Atchison 128 3 22 0 153 Brown 189 8 5 0 202 Doniphan 67 1 0 0 68 Douglas 65 2 11 0 78 Jackson 201 6 3 0 210 Jefferson 204 3 2 0 209 Marshall 107 3 5 0 115 Nemaha 142 3 1 0 146 Washington 26 1 0 0 27 Subtotal 1129 30 49 0 1208
Mitigation Planning Region L
Johnson 48 7 26 4 81 Leavenworth 136 2 6 0 144 Wyandotte 19 2 12 1 33 Subtotal 203 11 44 5 258

Kansas Hazard Mitigation Plan Draft 3-98 2018
County
Low Hazard Dams
Significant Hazard Dams
High Hazard Dams
High Hazard Dams
Without EAP
Total Dams
Statewide Totals 4100 166 232 23 4498 Source: Kansas Department of Agriculture, Division of Water Resources, Water Structures Program, 2017
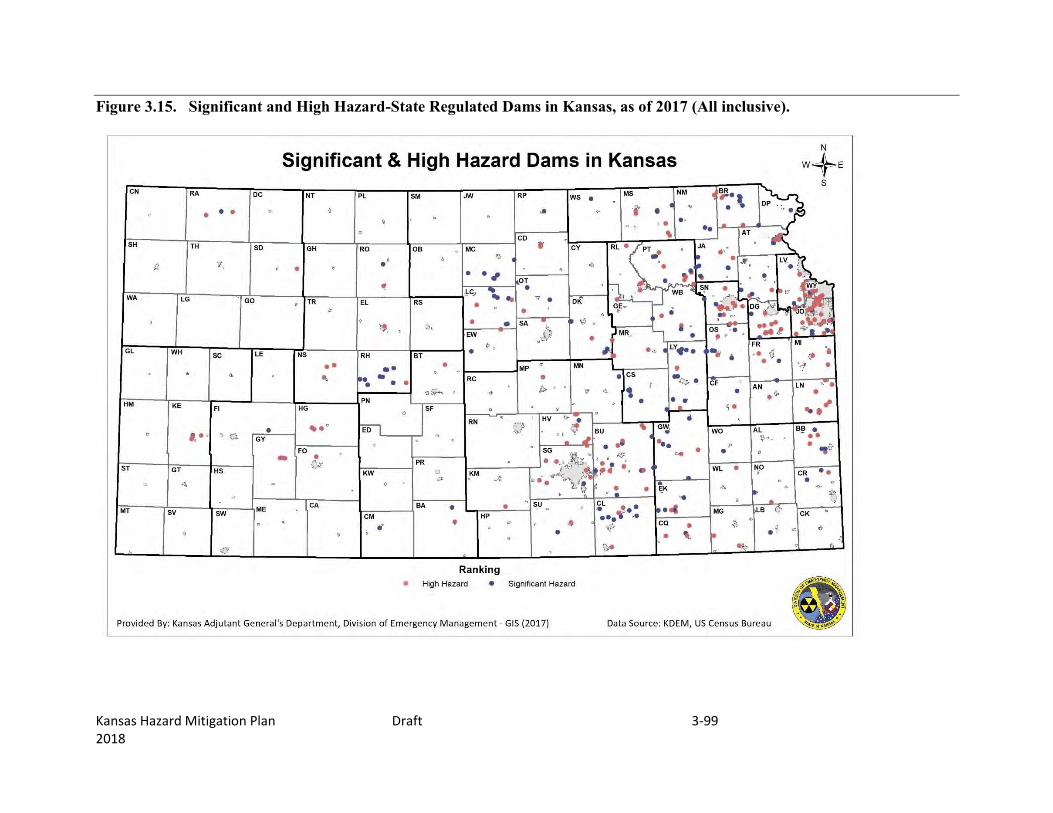
Kansas Hazard Mitigation Plan Draft 3-99 2018
Figure 3.15. Significant and High Hazard-State Regulated Dams in Kansas, as of 2017 (All inclusive).

Kansas Hazard Mitigation Plan Draft 3-100 2018
Federal Dams/Reservoirs
There are also 33 dams in Kansas that are maintained and operated by the federal government as seen in Table 3.36 below. Six are maintained and operated by the Bureau of Reclamation, Seven are maintained and operated by the U.S. Army, two are maintained and operated by the U.S. Fish & Wildlife Service, and the remaining eighteen are maintained and operated by the U.S. Army Corps of Engineers (USACE). In addition, Harlan County Dam is located in Nebraska, although is in close proximity to communities in Kansas. Of those maintained by USACE, nine are maintained by the Tulsa District Office and 10 (including Harlan) are maintained by the Kansas City District Office. To better ensure public safety, the Corps has decided to use a risk-based approach to evaluate its dams. The results of those relative risk assessments are being used to prioritize dam rehabilitation funding. In collaboration with the Bureau of Reclamation and the Federal Energy Regulatory Commission, a Dam Safety Action Classification (DSAC) rating scale of 1 to 5 was developed, where a DSAC 1 is high risk and DSAC V (5) is low risk.

Kansas Hazard Mitigation Plan Draft 3-101 2018
Table 3.36. Federal Reservoirs in Kansas
MT Planning Region
Reservoir County
Year Storage Began
Operating Agency*
River Basin
Contributing Drainage Area (Sq.
miles)
Surface Area
(acres)
Est. Storage Capacity
(acre feet) B Cedar Bluff Trego 1950 BOR Missouri 5,365 6,869 172,452 F Glen Elder (Waconda) Mitchell 1967 BOR Missouri 2,559 12,602 219,420 B Kirwin Phillips 1955 BOR Missouri 1,367 5,079 98,154 F Lovewell Jewell 1957 BOR Missouri 358 2,987 35,666 B Norton (Keith Sebelius) Norton 1964 BOR Missouri 715 2,181 34,510 B Webster Rooks 1956 BOR Missouri 1,150 3,767 76,157 H Ammunition Plant Dam Labette 1/1/1942 US ARMY NR NR NR I Camp Moon Lake Dam Geary 1/1/1952 US ARMY NR NR 60 L Merritt Lake Leavenworth 1/1/1942 US ARMY NR NR 19 - No Name Dam NR NR US ARMY NR NR NR - No Name Dam NR 1/1/1970 US ARMY NR NR 35 L Smith Lake Leavenworth 1/1/1942 US ARMY NR NR 9 L Sunflower Pond B Dam Johnson 1/1/1943 US ARMY NR NR 36 E Lake Darrynane Stafford 1/1/1955 USF&W NR NR 50 J Stateline Pond Dam Outlet Linn 1/1/1972 USF&W 150 32.38 114.49 K Clinton Douglas 1977 USACE-KC Missouri 367 7,000 110,400 NA
Harlan County Lake, NE
Harlan, NE, Jewell, Republic, KS USACE-KC
Republican
Unk Unk Unk J Hillsdale Miami 1981 USACE-KC Missouri 144 4,580 71,950 F Kanopolis Ellsworth 1948 USACE-KC Missouri 2,330 3,406 49,474 J Melvern Osage 1970 USACE-KC Missouri 349 6,885 154,000 F Milford Clay 1964 USACE-KC Missouri 3,796 15,700 351,577 K Perry Jefferson 1966 USACE-KC Missouri 1,117 11,146 209,513 J Pomona Osage 1962 USACE-KC Missouri 322 3,865 59,642 I Tuttle Creek Pottawatomie 1963 USACE-KC Missouri 9,600 12,617 253,265 B Wilson Russell 1965 USACE-KC Missouri 1,917 9,045 242,528 H
Big Hill (Pearson-Skubitz) Labette
1981 USACE-Tulsa
Arkansas 37 1,240 26,650
I Council Grove
Morris 1964
USACE-Tulsa
Arkansas 245 3,235 43,984
G El Dorado
Butler 1981
USACE-Tulsa
Arkansas 247 8,000 158,189
H Elk City
Montgomery 1966
USACE-Tulsa
Arkansas 634 4,500 38,385

Kansas Hazard Mitigation Plan Draft 3-102 2018
MT Planning Region
Reservoir County
Year Storage Began
Operating Agency*
River Basin
Contributing Drainage Area (Sq.
miles)
Surface Area
(acres)
Est. Storage Capacity
(acre feet) H
Fall River Greenwood
1949 USACE-Tulsa
Arkansas 585 2,329 19,433
J John Redmond
Coffey 1964
USACE-Tulsa
Arkansas 3,015 9,400 67,302
G Marion
Marion 1968
USACE-Tulsa
Arkansas 200 6,160 67,734
H Toronto
Woodson 1960
USACE-Tulsa
Arkansas 730 2,580 15,734
G
Cheney
Kingman, Reno, Sedgwick 1964
USACE - Tulsa
Arkansas
1,036 9,550 167,074 Source: Kansas Water Office and Kansas Department of Agriculture, Division of Water Resources; *BOR=Bureau of Reclamation, USF&W = U.S. Fish & wildlife Service; USACE= U.S. Army Corps of Engineers; NR=Not Reported

Kansas Hazard Mitigation Plan Draft 3-103 2018
Figure 3.16 shows the locations of the Bureau of Reclamation Reservoirs in Kansas. Figure 3.17 shows the locations of both Bureau of Reclamation Reservoirs and the U.S. Army Corps of Engineers Reservoirs in Kansas.
Figure 3.16. Bureau of Reclamation Reservoirs in Kansas
Source: Bureau of Reclamation, http://www.usbr.gov/gp/lakes_reservoirs/kansas_lakes.htm

Kansas Hazard Mitigation Plan Draft 3-104 2018
Figure 3.17. Federal Reservoirs in Kansas
Source: Source: Surface Water in Kansas and its Interactions with Groundwater, 2000, www.kgs.ku.edu/HighPlains/atlas/atswqn.htm

Kansas Hazard Mitigation Plan Draft 3-105 2018
Dams in Adjacent States Colorado: The two large dams that could have flooding consequences in Kansas in the event of failure are Bonny Dam on the South Fork of the Republican River and John Martin Dam on the Arkansas. Both of these dams are federally owned/regulated dams. Bonny is owned by the Bureau of Reclamation and John Martin is owned by the Corps of Engineers.
Oklahoma: Most of the major rivers are flowing south into Oklahoma, rather than north into Kansas. The Cimarron River is the only major river that flows into Kansas from Oklahoma and there are no high hazard dams on that river that would impact Kansas in the event of failure.
Nebraska: There are nine high hazard dams in southern Nebraska Counties that border Kansas as follows:
Hitchcock County-Trenton Dam, Red Willow County-Kelly Creek West Dam, Harlan County-Harlan County Dam: Rated as DSAC III in 2007, Thayer County-Hebron Dam, Gage County-Little Indian Creek 15A Dam, Upper Big Nemaha 25C Dam, Mud Creek 2A
Dam, and Big Indian Creek 14B Dam, and Richardson County-Long Branch 21 Dam.
Missouri: There are two dams in Bates County, Missouri that would potentially impact portions of Kansas in the unlikely event of failure:
Drexel Lake Dam (ID # MO20046), and Drexel City Reservoir (ID# MO 20213).
There are also several dams in Jasper, Newton, Barton, Dade, and Lawrence Counties in Missouri that drain to Crawford and/or Cherokee County, Kansas. However, given the size of the dams and their distance upstream of the state line, it is unlikely that failure of any of these dams would have a significant impact in Kansas.
Levees
Levees are earth embankments constructed along rivers and coastlines to protect adjacent lands from flooding. Floodwalls are concrete structures, often components of levee systems, designed for urban areas where there is insufficient room for earthen levees. Levees are usually engineered to withstand a flood with a computed risk of occurrence. When a larger flood occurs and/or levees and floodwalls and their appurtenant structures are stressed beyond their capabilities to withstand floods, levee failure can result in loss of life and injuries as well as damages to property, the environment, and the economy. In Kansas, there are hundreds of levees ranging in size from small agricultural levees that were constructed primarily to protect farmland from high frequency flooding to large urban levees that were constructed to protect people and property from larger, less frequent flooding events, such as the 100-year and 500-year flood

Kansas Hazard Mitigation Plan Draft 3-106 2018
events. For purposes of this plan, the levee failure hazard will refer to both overtopping and breach of a levee as defined in FEMA’s publication “So You Live Behind a Levee” (http://content.asce.org/ASCELeveeGuide.html)
Overtopping: When a Flood Is Too Big—Overtopping occurs when floodwaters exceed the height of a levee and flow over its crown. As the water passes over the top, it may erode the levee, worsening the flooding and potentially causing an opening, or breach, in the levee.
Breaching: When a Levee Gives Way—A levee breach occurs when part of a levee gives way, creating an opening through which floodwaters may pass. A breach may occur gradually or suddenly. The most dangerous breaches happen quickly during periods of high water. The resulting torrent can quickly swamp a large area behind the failed levee with little or no warning.
Levees are usually engineered to withstand a flood with a computed risk of occurrence. Many levees in Kansas were largely constructed to protect agricultural land and are not built to design standards established to protect people and property. Their presence can, in some cases, generate a false sense of security.
Levees have been constructed across the State by public and private entities with varying levels of protection, inspection oversight, and maintenance. The USACE National Levee Database (NLD), and the FEMA levee database, FAST, were used as sources for levee data in this plan update. However, the emphasis was put on the FEMA FAST database as the NLD was going through major changes.
Figure 3.18 shows the 158 levees that were included in the FAST database from FEMA. Those in green are those levees that are currently shown on the effective Flood Insurance Rate Map (FIRM) as providing protection from at least the 1 – percent annual chance of flood.
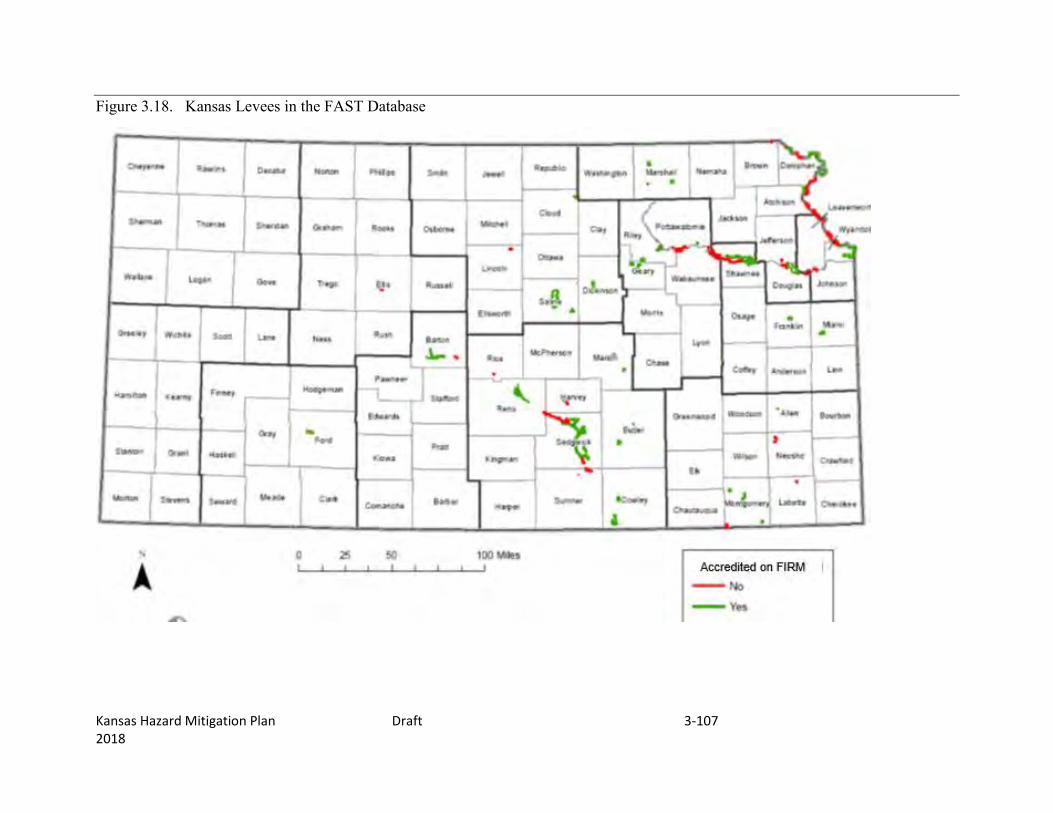
Kansas Hazard Mitigation Plan Draft 3-107 2018
Figure 3.18. Kansas Levees in the FAST Database

Kansas Hazard Mitigation Plan Draft 3-108 2018
For purposes of the levee failure hazard profile and risk assessment in this hazard mitigation plan, levees in Kansas will be discussed in four categories:
1. Levees in the USACE Levee Safety Program
2. FEMA Accredited Levees
3. Levees that are both in the USACE Levee Safety Program and Accredited by FEMA
4. All other levees
The graphic in Figure 3.19 displays the four levee categories described above. In terms of assessing risk, levees in categories 1, 2, and 3 all undergo or have undergone some sort of inspection, certification, or accreditation that indicates the level of protection and/or structural integrity of the levee system. However, the levees in the category 4 may not be regularly monitored or inspected.
Figure 3.19. Four Categories of Levees
Source: U.S. Army Corps of Engineers, Kansas City District
Under the Levee Safety Program, USACE conducts levee inspections (routine, periodic and special event). During these inspections, deficiencies may be identified such as unsatisfactory

Kansas Hazard Mitigation Plan Draft 3-109 2018
culverts, non-compliant vegetation, encroachments, and animal burrows. USACE uses inspection findings to “rate” levee systems to determine compliance with operation and maintenance requirements, understand the overall levee condition, and determine eligibility for federal rehabilitation assistance under P.L. 84-99.
According to the database, there are currently 72 levees in Kansas in the Levee Safety Program. The Kansas City District Office manages 48 of these and the Tulsa District Office manages 24.
USACE utilizes the Levee Screening Tool (LST) to understand the risks associated with each levee system and assist with developing risk management solutions. The screening results support the assignment of a Levee Safety Action Classification (LSAC) to denote the level of risk associated with each system. Table 3.37 provides the descriptions of the five LSAC levels that will be assigned to each levee in the LSP.
Table 3.37. USACE Levee Safety Action Classifications
Levee Safety Action Classification
Class Characteristics Actions
Very High
Urgency
Likelihood of inundation with
associated consequences
characterizing each class,
emphasis on life-safety.
Actions recommended for
each class and level of
urgency grouped by
responsible O&M entity.
High Urgency
Moderate
Urgency
Low Urgency
Normal
Source: U.S. Army Corps of Engineers, Kansas City District A primary purpose for assessing and classifying the risk associated with levee systems is to inform responsible parties on appropriate actions that should be taken to reduce risk. Risk assessments, including levee screenings, identify risk drivers associated with a particular levee. Risk assessments also identify actions that may be taken to reduce those risks. Actions may be permanent in nature (e.g., replacing defective components or constructing physical improvements to a levee). In many cases Interim Risk Reduction Measures (IRRMs) may be warranted as a means of reducing risk in the interim while permanent measures are planned and implemented. IRRMs for a particular levee system may be developed and implemented by multiple authorities depending on the nature of the risk and the distribution of authorities for that levee system. Parties that could be involved with developing and implementing IRRMs could include: individuals (i.e., the general public); levee boards; local communities; county, state and federal emergency management agencies; USACE; and others.

Kansas Hazard Mitigation Plan Draft 3-110 2018
FEMA Accredited Levees
Many levees shown on effective Flood Insurance Rate Maps (FIRM) were mapped in the 1970s and 1980s and have never been remapped by FEMA. Prior to 1986, levees were shown on FIRMs as providing protection from the base flood when they were designed and constructed in accordance with sound engineering practices. Since 1986, levees have been shown as accredited on FIRMs only when they meet the requirements of 44 CFR 65.10 “Mapping Areas Protected by Levee Systems”, including certification by a registered professional engineer or a Federal agency with responsibility for levee design.
Levees that do not meet the requirements of 44 CFR 65.10 cannot be shown as accredited on a FIRM. Furthermore, floodplain areas behind the levee are at risk to base flood inundation and are mapped as high risk areas subject to FEMA’s minimum floodplain management regulations and mandatory flood insurance purchase requirement.
In 2004, as it initiated work under the Flood Map Modernization Initiative (Map Mod), FEMA determined that analysis of the role of levees in flood risk reduction would be an important part of the mapping efforts. A report issued in 2005 noted that the status of the Nation‘s levees was not well understood and the condition of many levees and floodwalls had not been assessed since their original inclusion in the NFIP. As a result, FEMA established policies to address existing levees.
For the remainder of this discussion, FEMA Accredited levees will be discussed in two main types: Those mapped on Digital Flood Insurance Rate Maps (DFIRM) since the Flood Map Modernization Initiative and those that were mapped prior to the Flood Map Modernization Initiative and are not mapped on DFIRMs.
FEMA Accredited Levees mapped on DFIRMS
As DFIRMs are developed, levees fall under one of the three following categories:
Accredited Levee - With the except of areas of residual flooding (interior drainage), if the data and documentation specified in 44 CFR 65.10 is readily available and provided to FEMA, the area behind the levee will be mapped as a moderate-risk area. There is no mandatory flood insurance purchase requirement in a moderate-risk area, but flood insurance is strongly recommended.
Provisionally Accredited Levee (PAL) - If data and documentation is not readily available, and no known deficiency precludes meeting requirements of 44 CFR 65.10, FEMA can allow the party seeking recognition up to two years to compile and submit full documentation to show compliance with 44 CFR 65.10. During this two-year period of provisional accreditation, the area behind the levee will be mapped as moderate-risk with no mandatory flood insurance purchase requirement.
De-Accredited Levees – If the information established under 44 CFR 65.10 is not readily available and provided to FEMA, and the levee is not eligible for the PAL designation, the levee will be de-accredited by FEMA. If a levee is de-accredited, FEMA will evaluate the level of risk

Kansas Hazard Mitigation Plan Draft 3-111 2018
associated with each non-accredited levee through their Levee Analysis Mapping Procedures (LAMP) criteria to consider how to map the floodplain and which areas on the dry side of the levee will be shown as high risk. The mapping will then be updated to reflect this risk.
According to the FAST/NLD database, the total number of FEMA accredited levees on Digital Flood Insurance Rate Maps is 73. These Accredited Levees are reflected in Figure 3.20 with the 26 counties the levees reside in outlined. Figure 3.20 shows the status of DFIRMS as of September 2017. Additionally, Table 3.38 lists these counties with Accredited Levees that have DFIRMS, grouped by Mitigation Planning Region.

Kansas Hazard Mitigation Plan Draft 3-112 2018
Figure 3.20. Kansas DFIRM Counties with Levees-Map, 2017

Kansas Hazard Mitigation Plan Draft 3-113 2018
Table 3.38. Kansas DFIRM Counties With Accredited Levees-List
Mitigation Planning Region
DFIRM Counties with Acc Levees
Mitigation Planning Region
DFIRM Counties with Acc Levees
E Barton I Geary
F Ford J Franklin
F Cloud J Miami
G Butler J Shawnee
G Cowley J Osage
G Harvey K Douglas
G Marion K Jefferson
G Reno K Atchison
G Sedgwick K Marshall
H Allen L Leavenworth
I Lyon L Wyandotte
I Pottawatomie L Johnson
I Riley
I Wabaunsee
FEMA Accredited Levees not Mapped on DFIRMs
Throughout the early days of the National Flood Insurance Program (NFIP), little guidance was available associated with the inclusion of existing levees. Decisions were made on whether to accredit hundreds of levees across Kansas. Because there were no levee standards and accreditation of a levee was left largely to the judgments of the study contractors, many levees were accredited as providing flood protection even though they would not meet the current NFIP levee standards as stated in 44 CFR 65.10.
During subsequent re-mapping, many of these levees were re-evaluated and accredited as providing flood protection, but do not meet the standards of 44 CFR 65.10. Additionally, some levees, originally indicated as accredited have never been re-evaluated. If levees are depicted on the paper FIRMS in counties that have not been re-mapped on DFIRMs, their protection level has not been re-evaluated. Until re-evaluation occurs, these levees are considered accredited. According to the FAST, there are accredited levees that are not mapped on DFIRMS. The counties that have areas protected by FEMA-accredited levees that have not yet been re-evaluated through the re-mapping process include:
Coffey
Brown
Pawnee
Ellis
Doniphan
Lincoln

Kansas Hazard Mitigation Plan Draft 3-114 2018
This information was obtained via the NLD database.
Figure 3.20a shows the Ongoing Kansas Floodplain Mapping Projects that include Levee’s.

Kansas Hazard Mitigation Plan Draft 3-115 2018
Figure 3.20a. Ongoing Kansas Floodplain Mapping Projects that Include Levee Projects
Kansas Hazard Mitigation Plan Draft 3-116 2018
Levees that are both in the USACE Levee Safety Program and Accredited by FEMA
Several Kansas levees are both accredited by FEMA and part of the USACE Levee Safety program. See Table 3.39

Kansas Hazard Mitigation Plan Draft 3-117 2018
Table 3.39. Levees in Kansas (FAST, FEMA Database)
Mitigation Planning Region County Jurisdiction System_Name Flooding_Sources
USACE_District
Federal_Levee USACE LSP
Levee_System_Accred_Status_on_Effective_FIRM_LSS
DFIRM Status
B Ellis County Hays city Hays City Levee Big Creek
Kansas City Yes Yes Non-Accredited Levee System None
D Ford County Dodge City city DODGE CITY NORTH LEVEE ARKANSAS RIVER Tulsa No Yes Provisionally Accredited Levee (PAL) System Effective
D Ford County
Ford County,Dodge City city
Dodge City North Levee Arkansas River Tulsa Yes Yes Provisionally Accredited Levee (PAL) System Effective
D Ford County
Ford County,Dodge City city
Dodge City South Levee Arkansas River Tulsa Yes Yes Provisionally Accredited Levee (PAL) System Effective
E Barton County Barton County
AGRICULTURAL LEVEES ALONG ARKANSAS RIVER 1 ARKANSAS RIVER Tulsa No No Non-Accredited Levee System Effective
E Barton County Barton County
AGRICULTURAL LEVEES ALONG ARKANSAS RIVER 2-4 ARKANSAS RIVER Tulsa No No Non-Accredited Levee System Effective
E Barton County Barton County ARKANSAS RIVER Tulsa Yes No Non-Accredited Levee System Effective
E Barton County
Barton County,Great Bend city
Great Bend Airport Ring Levee
Walnut Creek,Arkansas River Tulsa Yes Yes Accredited Levee System Effective
E Barton County
Barton County,Great Bend city
Great Bend Levee North Side & Walnut Creek
Arkansas River,Walnut Creek Tulsa Yes Yes Accredited Levee System Effective
E Barton County
Barton County,Great Bend city
Great Bend Levee South Side Arkansas River Tulsa Yes Yes Accredited Levee System Effective

Kansas Hazard Mitigation Plan Draft 3-118 2018
E Pawnee County
Larned city,Pawnee County
Larned Kansas Levee
Pawnee River,Arkansas River Tulsa Yes Yes Accredited Levee System None
F Cloud County Clyde city,Cloud County Clyde Elk creek
Kansas City Yes No Non-Accredited Levee System None
F Dickinson County Dickinson County ABILENE UNIT MUD CREEK
Kansas City No No Non-Accredited Levee System
Preliminary
F Dickinson County
Abilene city,Dickinson County
Abilene Unit Left Bank Mud Creek
Kansas City Yes Yes Accredited Levee System
Preliminary
F Dickinson County
Abilene city,Dickinson County
Abilene Unit Right Bank Mud Creek
Kansas City Yes Yes Accredited Levee System
Preliminary
F Lincoln County
Barnard city,Lincoln County
Barnard, Kansas Salt Creek
Kansas City Yes No
No Regulatory Flood Hazard Information Published by FEMA None
F Saline County Gypsum city,Saline County Gypsum Gypsum Creek
Kansas City Yes Yes Accredited Levee System
Preliminary
F Saline County Salina city SALINA FPP DRY CREEK Kansas City No Yes Accredited Levee System
Preliminary
F Saline County Salina city,Saline County Salina, KS FPP Mulberry Creek
Kansas City Yes Yes Accredited Levee System
Preliminary
G Butler County
Butler County,Augusta city Augusta
Whitewater River,Walnut River Tulsa Yes Yes Provisionally Accredited Levee (PAL) System Effective
G Butler County El Dorado city El Dorado Levee Walnut River Tulsa Yes NA Provisionally Accredited Levee (PAL) System Effective
G Butler County Butler County JAYCEE'S POND Tulsa No Yes Non-Accredited Levee System Effective
G Butler County
Butler County,Augusta city
WHITEWATER RIVER N&S LEVEE WHITEWATER RIVER Tulsa No Yes Accredited Levee System Effective
G Cowley County
Cowley County,Arkansas City city Arkansas City
Arkansas River,Walnut River Tulsa Yes NO Accredited Levee System Effective
G Cowley County
Cowley County,Winfield city Winfield Levee Walnut River Tulsa Yes Yes Accredited Levee System Effective

Kansas Hazard Mitigation Plan Draft 3-119 2018
G Harvey County
Halstead city,Harvey County
Halstead Local Flood Protection Project Little Arkansas River Tulsa Yes Yes Accredited Levee System Effective
G Marion County
Florence city,Marion County FLORENCE DOYLE CREEK Tulsa No Yes Accredited Levee System Effective
G Marion County
Florence city,Marion County Florence Levee Cottonwood River Tulsa Yes Yes Accredited Levee System Effective
G Marion County
Marion city,Marion County Marion Levee
Cottonwood River,Mud Creek Tulsa Yes Yes Provisionally Accredited Levee (PAL) System Effective
G Reno County Reno County
ARK RIV NORTH BANK/COW CREEK DIVERSION 1 ARKANSAS RIVER Tulsa No No Provisionally Accredited Levee (PAL) System Effective
G Reno County Hutchinson city,Reno County
Hutchinson Levee - Arkansas North & Cow Crk East Arkansas River Tulsa Yes Yes Provisionally Accredited Levee (PAL) System Effective
G Reno County Hutchinson city,Reno County
Hutchinson Levee - Arkansas North & Cow Crk West Arkansas River Tulsa Yes Yes Provisionally Accredited Levee (PAL) System Effective
G Reno County
Reno County,South Hutchinson city
Hutchinson Levee - Arkansas South Bank Arkansas River Tulsa Yes Yes Provisionally Accredited Levee (PAL) System Effective
G Reno County Reno County Hutchinson Levee - Levee C Arkansas River Tulsa Yes Yes Provisionally Accredited Levee (PAL) System Effective
G Reno County
Reno County,Willowbrook city
Hutchinson Levee - Ring Levee Arkansas River Tulsa Yes Yes Provisionally Accredited Levee (PAL) System Effective
G Rice County Sterling city UNDEFINED BULL CREEK Tulsa No No Non-Accredited Levee System None
G Sedgwick County WICHITA
ARKANSAS RIVER Tulsa No No Non-Accredited Levee System Effective
G Sedgwick County Sedgwick County
BIG SLOUGH LEVEE C
BIG SLOUGH ARKANSAS RIVER Tulsa No Yes Non-Accredited Levee System Effective

Kansas Hazard Mitigation Plan Draft 3-120 2018
G Sedgwick County
Wichita city,Sedgwick County
Big Slough Levee C North
Arkansas River,Big Slough Tulsa Yes NA Accredited Levee System Effective
G Sedgwick County
Wichita city,Haysville city,Sedgwick County
Big Slough Levee C South
Big Slough,Cowskin Creek Tulsa Yes NA Accredited Levee System Effective
G Sedgwick County Sedgwick County
Big Slough Levee D & Riverside Levee P & R & S
Cowskin Creek,Arkansas River,Big Slough,Middle Fork Chisholm Creek,Creek Tulsa Yes Yes Accredited Levee System Effective
G Sedgwick County
Wichita city,Sedgwick County,Park City city
Chisholm Levee P & Levee N & Park City Levee
Chisholm Creek,Little Arkansas River,Middle Fork Chisholm Creek Tulsa Yes Yes Accredited Levee System Effective
G Sedgwick County Sedgwick County
Little Ark Levee J
Little Arkansas River,Canal/Ditch,Arkansas River Tulsa Yes NA Accredited Levee System Effective
G Sedgwick County
Valley Center city,Wichita city,Sedgwick County,Park City city
Little Ark Levees FKLM and West Branch West
Unnamed Creek/Stream,Arkansas River,Canal/Ditch,Jester Creek,Little Arkansas River,Chisholm Creek Tulsa Yes NA Accredited Levee System Effective
G Sedgwick County
Sedgwick County,Park City city
TRIBUTARY M1 MIDDLE FORK CHISHOLM CREEK LEVEE
TRIBUTARY M1 MIDDLE FORK CHISHOLM CREEK ,TRIBUTARY M1 MIDDLE FORK CHISHOLM CREEK Tulsa No NA Accredited Levee System Effective
G Sedgwick County
Haysville city,Sedgwick County UNDEFINED
COWSKIN CREEK SOUTH Tulsa No NA Non-Accredited Levee System Effective
G Sedgwick County
Haysville city,Sedgwick County UNDEFINED
COWSKIN CREEK SOUTH Tulsa No NA Non-Accredited Levee System Effective
G Sedgwick County Sedgwick County UNDEFINED SEDGWICK DITCH Tulsa No No Non-Accredited Levee System Effective
G Sedgwick County Sedgwick County UNDEFINED SEDGWICK DITCH Tulsa No No Non-Accredited Levee System Effective

Kansas Hazard Mitigation Plan Draft 3-121 2018
G Sedgwick County
Sedgwick County,Park City city
West Branch Chisholm Creek East Bank S1 & Levee T
Chisholm Creek,Unnamed Creek/Stream Tulsa Yes Yes Accredited Levee System Effective
G Sedgwick County
Valley Center city,Sedgwick County,Park City city
West Branch Chisholm Creek East Bank Spoil 2
Unnamed Creek/Stream Tulsa Yes No Non-Accredited Levee System Effective
G Sedgwick County
Valley Center city,Sedgwick County
West Branch Chisholm Creek East Bank Spoil 3
Unnamed Creek/Stream Tulsa Yes No Non-Accredited Levee System Effective
G Sedgwick County Sedgwick County
West Branch Chisholm Creek East Bank Spoil 4
Unnamed Creek/Stream Tulsa Yes No Non-Accredited Levee System Effective
G Sedgwick County Sedgwick County
WICHITA KANSAS LEVEES
MIDDLE FORK CHISHOLM CREEK Tulsa No No Accredited Levee System Effective
G Sedgwick County Wichita city
WICHITA KANSAS LEVEES ARKANSAS RIVER Tulsa No No Accredited Levee System Effective
G Sedgwick County Wichita city
WICHITA KANSAS LEVEES
WICHITA VALLEY CENTER FLOODWAY Tulsa No No Accredited Levee System Effective
G Sedgwick County
Wichita city,Sedgwick County
WICHITA KANSAS LEVEES
LITTLE ARKANSAS RIVER Tulsa No No Non-Accredited Levee System Effective
G Sedgwick County
Wichita city,Sedgwick County
WICHITA KANSAS LEVEES
WICHITA VALLEY CENTER FLOODWAY Tulsa No No Accredited Levee System Effective
G
Sedgwick County,Reno County
Reno County,Sedgwick County
ARK RIV NORTH BANK 2 ARKANSAS RIVER Tulsa No No Non-Accredited Levee System
Effective, Effective
G
Sedgwick County,Reno County
Reno County,Sedgwick County
ARK RIV SOUTH BANK 3 ARKANSAS RIVER Tulsa No No Non-Accredited Levee System
Effective, Effective
G Sumner County
Mulvane city,Sumner County UNDEFINED COWSKING CREEK Tulsa No No Non-Accredited Levee System Effective
G Sumner County
Mulvane city,Sumner County,Sedgwick County UNDEFINED COWSKING CREEK Tulsa No No Accredited Levee System Effective
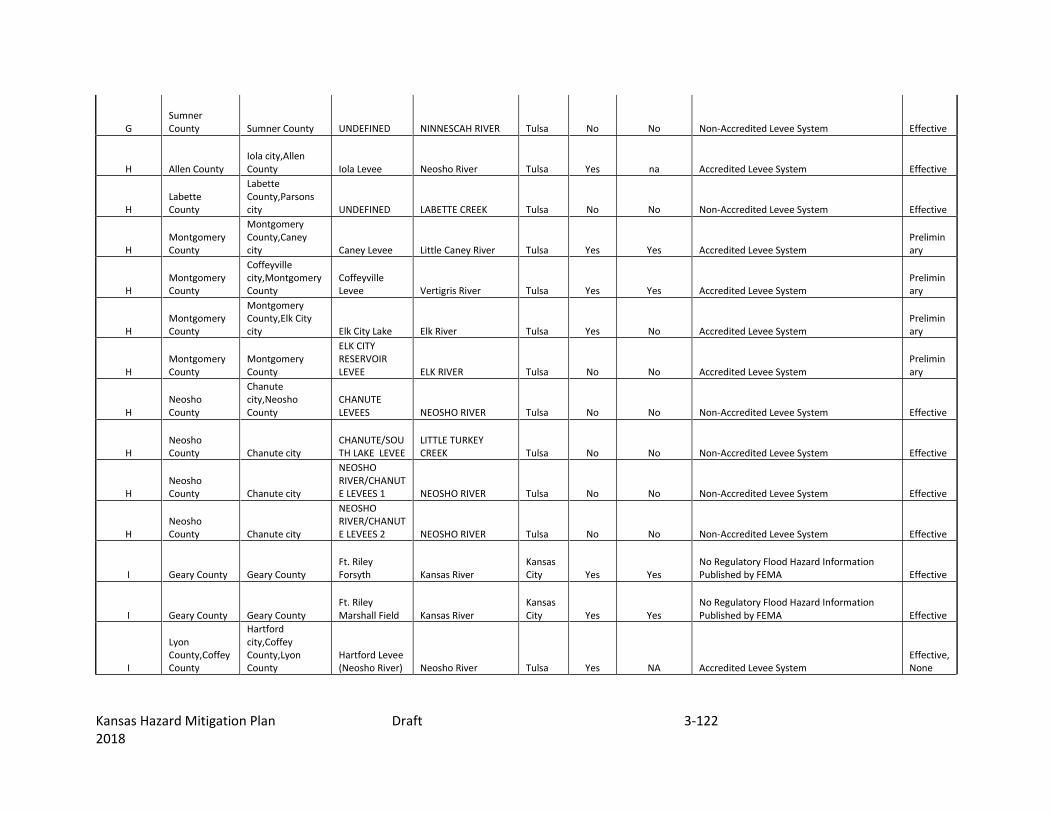
Kansas Hazard Mitigation Plan Draft 3-122 2018
G Sumner County Sumner County UNDEFINED NINNESCAH RIVER Tulsa No No Non-Accredited Levee System Effective
H Allen County Iola city,Allen County Iola Levee Neosho River Tulsa Yes na Accredited Levee System Effective
H Labette County
Labette County,Parsons city UNDEFINED LABETTE CREEK Tulsa No No Non-Accredited Levee System Effective
H Montgomery County
Montgomery County,Caney city Caney Levee Little Caney River Tulsa Yes Yes Accredited Levee System
Preliminary
H Montgomery County
Coffeyville city,Montgomery County
Coffeyville Levee Vertigris River Tulsa Yes Yes Accredited Levee System
Preliminary
H Montgomery County
Montgomery County,Elk City city Elk City Lake Elk River Tulsa Yes No Accredited Levee System
Preliminary
H Montgomery County
Montgomery County
ELK CITY RESERVOIR LEVEE ELK RIVER Tulsa No No Accredited Levee System
Preliminary
H Neosho County
Chanute city,Neosho County
CHANUTE LEVEES NEOSHO RIVER Tulsa No No Non-Accredited Levee System Effective
H Neosho County Chanute city
CHANUTE/SOUTH LAKE LEVEE
LITTLE TURKEY CREEK Tulsa No No Non-Accredited Levee System Effective
H Neosho County Chanute city
NEOSHO RIVER/CHANUTE LEVEES 1 NEOSHO RIVER Tulsa No No Non-Accredited Levee System Effective
H Neosho County Chanute city
NEOSHO RIVER/CHANUTE LEVEES 2 NEOSHO RIVER Tulsa No No Non-Accredited Levee System Effective
I Geary County Geary County Ft. Riley Forsyth Kansas River
Kansas City Yes Yes
No Regulatory Flood Hazard Information Published by FEMA Effective
I Geary County Geary County Ft. Riley Marshall Field Kansas River
Kansas City Yes Yes
No Regulatory Flood Hazard Information Published by FEMA Effective
I
Lyon County,Coffey County
Hartford city,Coffey County,Lyon County
Hartford Levee (Neosho River) Neosho River Tulsa Yes NA Accredited Levee System
Effective, None

Kansas Hazard Mitigation Plan Draft 3-123 2018
I Pottawatomie County
Pottawatomie County UNDEFINED KANSAS RIVER
Kansas City No No Non-Accredited Levee System Effective
I Pottawatomie County
Pottawatomie County UNDEFINED UNNAMED STREAM
Kansas City No No Non-Accredited Levee System Effective
I Pottawatomie County
Pottawatomie County UNDEFINED KANSAS RIVER
Kansas City No No Non-Accredited Levee System Effective
I Pottawatomie County
Pottawatomie County UNDEFINED KANSAS RIVER
Kansas City No No Non-Accredited Levee System Effective
I Pottawatomie County
St. George city,Pottawatomie County UNDEFINED KANSAS RIVER
Kansas City No No Non-Accredited Levee System Effective
I Pottawatomie County
St. Marys city,Pottawatomie County UNDEFINED COLLEGE CREEK
Kansas City No No Accredited Levee System Effective
I Pottawatomie County
St. Marys city,Pottawatomie County UNDEFINED COLLEGE CREEK
Kansas City No No Accredited Levee System Effective
I Riley County Riley County Ft. Riley Funston Kansas River
Kansas City Yes Yes Non-Accredited Levee System Effective
I
Riley County,Pottawatomie County
Manhattan city,Riley County,Pottawatomie County
Manhattan Unit Kansas River
Kansas City Yes Yes Accredited Levee System Effective
I
Riley County,Wabaunsee County
Wabaunsee County,Riley County UNDEFINED DEEP CREEK
Kansas City No No Non-Accredited Levee System Effective
I
Riley County,Wabaunsee County
Wabaunsee County,Riley County UNDEFINED KANSAS RIVER
Kansas City No No Non-Accredited Levee System Effective
I Wabaunsee County
Wabaunsee County UNDEFINED KANSAS RIVER
Kansas City No No Accredited Levee System Effective
I Wabaunsee County
Wabaunsee County UNDEFINED KANSAS RIVER
Kansas City No No Non-Accredited Levee System Effective
I
Wabaunsee County,Pottawatomie County
Wabaunsee County,Wamego city UNDEFINED KANSAS RIVER
Kansas City No No Non-Accredited Levee System Effective

Kansas Hazard Mitigation Plan Draft 3-124 2018
I, J
Pottawatomie County,Shawnee County,Wabaunsee County
Wabaunsee County,Pottawatomie County,Shawnee County
Tri-County Drainage District No. 1, Section 1 Kansas River
Kansas City Yes No Non-Accredited Levee System
Effective, Effective, Effective
J Franklin County
Ottawa city,Franklin County
Ottawa KS Left Bank
Marais Des Cygnes River
Kansas City Yes Yes Provisionally Accredited Levee (PAL) System Effective
J Franklin County
Ottawa city,Franklin County
Ottawa KS Right Bank
Marais Des Cygnes River
Kansas City Yes Yes Provisionally Accredited Levee (PAL) System Effective
J Miami County
Osawatomie city,Miami County Osawatomie
Marais Des Cygnes River
Kansas City Yes Yes Provisionally Accredited Levee (PAL) System Effective
J Shawnee County Topeka city
Auburndale Unit (S. Topeka) Kansas River
Kansas City Yes Yes Provisionally Accredited Levee (PAL) System Effective
J Shawnee County Topeka city
KAW RIVER DRAINAGE DISTRICT KANSAS RIVER
Kansas City No Yes Provisionally Accredited Levee (PAL) System Effective
J Shawnee County
Topeka city,Shawnee County
Kaw River Drainage District Kansas River
Kansas City Yes Yes Provisionally Accredited Levee (PAL) System Effective
J Shawnee County
Topeka city,Shawnee County
North Topeka Unit - Soldier Creek RB2 Kansas River
Kansas City Yes Yes Provisionally Accredited Levee (PAL) System Effective
J Shawnee County Shawnee County
SILVER LAKE DITCH LEVEE 1 SILVER LAKE DITCH
Kansas City No No Provisionally Accredited Levee (PAL) System Effective
J Shawnee County Shawnee County
SILVER LAKE DITCH LEVEE 2 SILVER LAKE DITCH
Kansas City No No Provisionally Accredited Levee (PAL) System Effective
J Shawnee County Shawnee County
Soldier Creek Unit LB1 Kansas River
Kansas City Yes Yes Provisionally Accredited Levee (PAL) System Effective
J Shawnee County Shawnee County
Soldier Creek Unit LB2 Kansas River
Kansas City Yes Yes Provisionally Accredited Levee (PAL) System Effective
J Shawnee County Shawnee County
Soldier Creek Unit LB3 Kansas River
Kansas City Yes NA Non-Accredited Levee System Effective
J Shawnee County Topeka city
Soldier Creek Unit LB4 Kansas River
Kansas City Yes Yes Provisionally Accredited Levee (PAL) System Effective

Kansas Hazard Mitigation Plan Draft 3-125 2018
J Shawnee County Topeka city
Soldier Creek Unit LB5 Kansas River
Kansas City Yes Yes Provisionally Accredited Levee (PAL) System Effective
J Shawnee County
Topeka city,Shawnee County
Soldier Creek Unit LB6 Kansas River
Kansas City Yes Yes Provisionally Accredited Levee (PAL) System Effective
J Shawnee County Shawnee County
Soldier Creek Unit RB1 Kansas River
Kansas City Yes Yes Non-Accredited Levee System Effective
J Shawnee County
Topeka city,Shawnee County
South Topeka Oakland Unit Kansas River
Kansas City Yes No Non-Accredited Levee System Effective
J Shawnee County Shawnee County
TRI-COUNTY DRAINAGE DISTRICT NO. 1, SECTION 1 BOURBONAIS CREEK
Kansas City No Yes Non-Accredited Levee System Effective
J Shawnee County Shawnee County
TRI-COUNTY DRAINAGE DISTRICT NO. 1, SECTION 2 KANSAS RIVER
Kansas City No No Non-Accredited Levee System Effective
J Shawnee County Shawnee County
TRI-COUNTY DRAINAGE DISTRICT NO. 1, SECTION 3 CROSS CREEK
Kansas City No No Non-Accredited Levee System Effective
J Shawnee County Shawnee County
Tri-County Drainage District No.1, Section 3 Kansas River
Kansas City Yes NA Non-Accredited Levee System Effective
J Shawnee County Topeka city
Water Works Unit (South Topeka) Kansas River
Kansas City Yes Yes Non-Accredited Levee System Effective
J, I
Shawnee County,Wabaunsee County
Wabaunsee County,Shawnee County
Tri-County Drainage District No. 1, Section 2 Kansas River
Kansas City Yes Yes Non-Accredited Levee System
Effective, Effective
K Atchison County Atchison County
Henry Pohl Levee Missouri River
Kansas City Yes Yes Non-Accredited Levee System Effective
K Atchison County Atchison County
HENRY POHL LEVEE 1 MISSOURI RIVER
Kansas City No No Non-Accredited Levee System Effective
K Atchison County Atchison County Schrader Missouri River
Kansas City Yes Yes Non-Accredited Levee System Effective
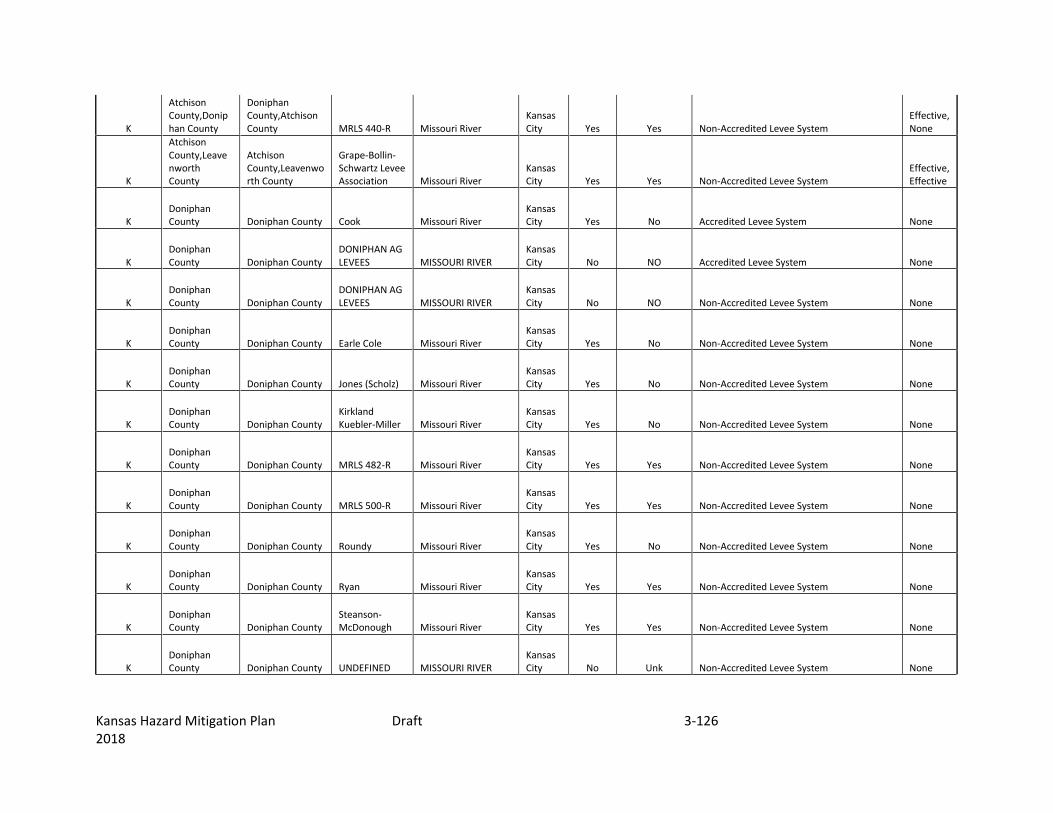
Kansas Hazard Mitigation Plan Draft 3-126 2018
K
Atchison County,Doniphan County
Doniphan County,Atchison County MRLS 440-R Missouri River
Kansas City Yes Yes Non-Accredited Levee System
Effective, None
K
Atchison County,Leavenworth County
Atchison County,Leavenworth County
Grape-Bollin-Schwartz Levee Association Missouri River
Kansas City Yes Yes Non-Accredited Levee System
Effective, Effective
K Doniphan County Doniphan County Cook Missouri River
Kansas City Yes No Accredited Levee System None
K Doniphan County Doniphan County
DONIPHAN AG LEVEES MISSOURI RIVER
Kansas City No NO Accredited Levee System None
K Doniphan County Doniphan County
DONIPHAN AG LEVEES MISSOURI RIVER
Kansas City No NO Non-Accredited Levee System None
K Doniphan County Doniphan County Earle Cole Missouri River
Kansas City Yes No Non-Accredited Levee System None
K Doniphan County Doniphan County Jones (Scholz) Missouri River
Kansas City Yes No Non-Accredited Levee System None
K Doniphan County Doniphan County
Kirkland Kuebler-Miller Missouri River
Kansas City Yes No Non-Accredited Levee System None
K Doniphan County Doniphan County MRLS 482-R Missouri River
Kansas City Yes Yes Non-Accredited Levee System None
K Doniphan County Doniphan County MRLS 500-R Missouri River
Kansas City Yes Yes Non-Accredited Levee System None
K Doniphan County Doniphan County Roundy Missouri River
Kansas City Yes No Non-Accredited Levee System None
K Doniphan County Doniphan County Ryan Missouri River
Kansas City Yes Yes Non-Accredited Levee System None
K Doniphan County Doniphan County
Steanson-McDonough Missouri River
Kansas City Yes Yes Non-Accredited Levee System None
K Doniphan County Doniphan County UNDEFINED MISSOURI RIVER
Kansas City No Unk Non-Accredited Levee System None
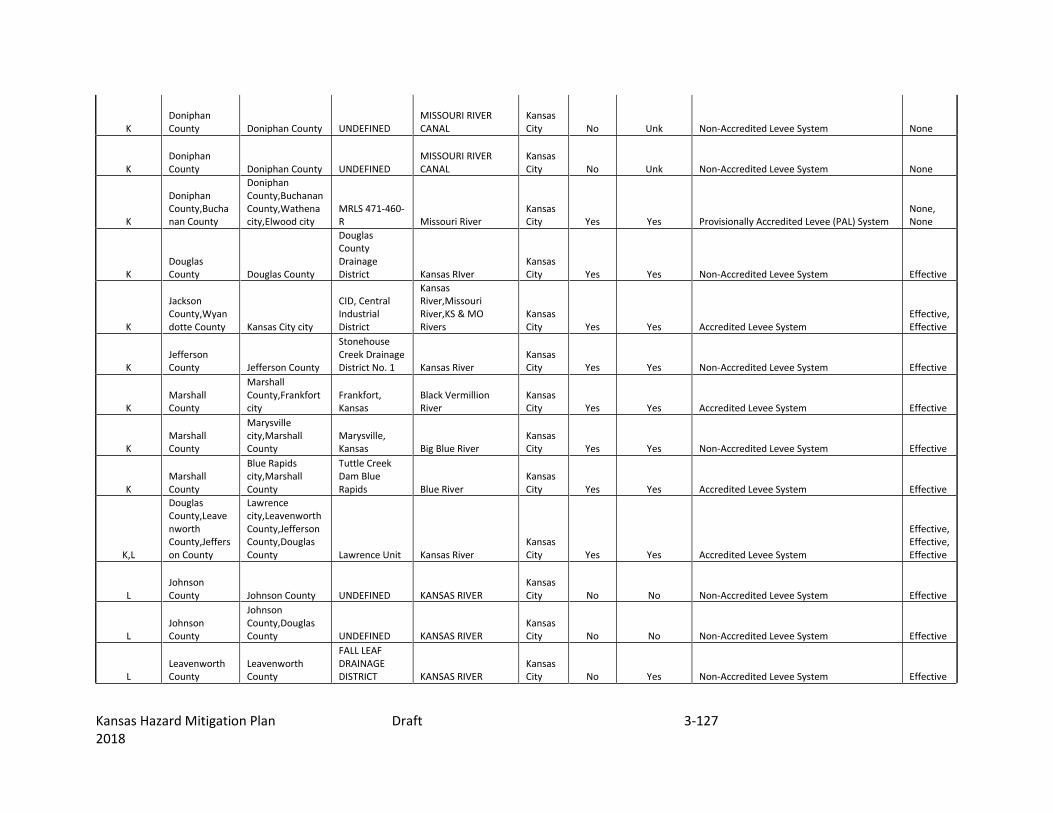
Kansas Hazard Mitigation Plan Draft 3-127 2018
K Doniphan County Doniphan County UNDEFINED
MISSOURI RIVER CANAL
Kansas City No Unk Non-Accredited Levee System None
K Doniphan County Doniphan County UNDEFINED
MISSOURI RIVER CANAL
Kansas City No Unk Non-Accredited Levee System None
K
Doniphan County,Buchanan County
Doniphan County,Buchanan County,Wathena city,Elwood city
MRLS 471-460-R Missouri River
Kansas City Yes Yes Provisionally Accredited Levee (PAL) System
None, None
K Douglas County Douglas County
Douglas County Drainage District Kansas RIver
Kansas City Yes Yes Non-Accredited Levee System Effective
K
Jackson County,Wyandotte County Kansas City city
CID, Central Industrial District
Kansas River,Missouri River,KS & MO Rivers
Kansas City Yes Yes Accredited Levee System
Effective, Effective
K Jefferson County Jefferson County
Stonehouse Creek Drainage District No. 1 Kansas River
Kansas City Yes Yes Non-Accredited Levee System Effective
K Marshall County
Marshall County,Frankfort city
Frankfort, Kansas
Black Vermillion River
Kansas City Yes Yes Accredited Levee System Effective
K Marshall County
Marysville city,Marshall County
Marysville, Kansas Big Blue River
Kansas City Yes Yes Non-Accredited Levee System Effective
K Marshall County
Blue Rapids city,Marshall County
Tuttle Creek Dam Blue Rapids Blue River
Kansas City Yes Yes Accredited Levee System Effective
K,L
Douglas County,Leavenworth County,Jefferson County
Lawrence city,Leavenworth County,Jefferson County,Douglas County Lawrence Unit Kansas River
Kansas City Yes Yes Accredited Levee System
Effective, Effective, Effective
L Johnson County Johnson County UNDEFINED KANSAS RIVER
Kansas City No No Non-Accredited Levee System Effective
L Johnson County
Johnson County,Douglas County UNDEFINED KANSAS RIVER
Kansas City No No Non-Accredited Levee System Effective
L Leavenworth County
Leavenworth County
FALL LEAF DRAINAGE DISTRICT KANSAS RIVER
Kansas City No Yes Non-Accredited Levee System Effective

Kansas Hazard Mitigation Plan Draft 3-128 2018
L Leavenworth County
Leavenworth County
Fall Leaf Drainage District Kansas River
Kansas City Yes Yes Non-Accredited Levee System Effective
L Leavenworth County Leavenworth city
Ft. Leavenworth, Kansas Missouri River
Kansas City Yes Yes Non-Accredited Levee System Effective
L Leavenworth County
Leavenworth County
GRAPE-BOLLIN-SCHWARTZ LEVEE ASSOCIATION MISSOURI RIVER
Kansas City No Yes Non-Accredited Levee System Effective
L Leavenworth County
Lansing city,Leavenworth County,Leavenworth city
Kansas Department of Corrections Missouri River
Kansas City Yes Yes Non-Accredited Levee System Effective
L Leavenworth County
Leavenworth County
Lower Iatan Bend Missouri River
Kansas City Yes No Non-Accredited Levee System Effective
L
Leavenworth County,Wyandotte County
Leavenworth County,Kansas City city
Wolcott Drainage District Section 1 Missouri River
Kansas City Yes Yes Non-Accredited Levee System
Effective, Effective
L Wyandotte County Kansas City city Argentine Unit Kansas River
Kansas City Yes Yes Provisionally Accredited Levee (PAL) System Effective
L Wyandotte County Kansas City city
Armourdale Unit Kansas River
Kansas City Yes Yes Accredited Levee System Effective
L Wyandotte County Kansas City city
Fairfax-Jersey Creek Missouri River
Kansas City Yes Yes Non-Accredited Levee System Effective
L Wyandotte County Kansas City city
NEARMAN CREEK POWER STATION MISSOURI RIVER
Kansas City No No Accredited Levee System Effective
L Wyandotte County Kansas City city
Turkey Creek LB Levee and Restored Channel Turkey Creek
Kansas City Yes Unk Accredited Levee System Effective
L Wyandotte County Kansas City city
Turkey Creek RB Levee, Tunnel and Walled Channel Turkey Creek
Kansas City Yes Unk Non-Accredited Levee System Effective
L Wyandotte County Kansas City city
Wolcott Drainage Missouri River
Kansas City Yes Yes Non-Accredited Levee System Effective

Kansas Hazard Mitigation Plan Draft 3-129 2018
District Section 2
L Wyandotte County Kansas City city
Wolcott Drainage District Section 3 Missouri River
Kansas City Yes Yes Non-Accredited Levee System Effective
All Other Levees
There are also levees throughout the State that are intended to mitigate low-level flooding and/or protect agricultural land that are not in the USACE Levee Safety program. Additionally, since these levees are not intended to protect populations or development from flooding from the 1% annual chance flood, they are not, nor seek to be accredited by FEMA for flood insurance purposes. These levees may provide a false sense of security to residents behind these levees. Additionally, these levees may not be routinely inspected by levee owners. There is no agency with regulatory authority over these levees.
According to an analysis of the FAST database, there are currently 45 levees that are not accredited by FEMA or in the USACE Levee Safety Program. These levees are in the following counties: Atchison, Barton, Cloud, Dickinson, Doniphan, Johnson, Labette, Leavenworth, Lincoln, Montgomery, Neosho, Pottawatomie, Riley, Rice, Sedgwick, Shawnee, Sumner, Wabaunsee, and Wyandotte. There are also likely many more levees, such as agricultural levees that have not been inventoried. Populations and development behind these levees could be considered to be at a higher risk since there are no requirements for these levees to be routinely inspected and/or certified.
The inventory of levees in Table 3.39 above, has been compiled from the FEMA FAST Database. The USACE database, NLD, was going through a major revision and while it was utilized, the FEMA FAST Database was relied on more heavily.

Kansas Hazard Mitigation Plan Draft 3-130 2018
Previous Occurrences
This section discusses previous occurrences for dam and levee failure in Kansas.
Dam Failure
According to Stanford University‘s National Performance of Dams Program, there were 31 dam incidents in Kansas between 1925 and 2017. The most recent dam failure incident occurred March 13, 2002. No incidents were reported from this event to 2017. Of the 31 incidents, 7 (23 percent) of them were failures.
Note: Dam failure can be a collapse, breach, resulting in the sudden rapid and uncontrolled release of impounded water to some degree. An incident is normally of an engineering and safety interest that provides insight into the structural and functional integrity of dam systems and their operation.
Table 3.40. Dam Incidents in Kansas, 1925 – 2002
MT Planning Region County NID # Dam Name
Incident Date Incident Type
Dam Failure
K Brown KS02458 Horton, City Of, Mission Lake Dam 1924 Not Known Yes
* Unknown KSS00003 Unnamed Dam (KSS00003) 1951 Not Known Yes
G Butler KS02146 Timber Creek Watershed Dam 1 1967 Piping Yes
G Butler KS05104 Blackstone 1976 Inflow Flood - Hydrologic Event Yes
K Atchison KS04490
Maur Hill Prep School, Inc. May-78 Landslide Yes
J Osage KS01572
Kitchen, E. L., Lake Oshawno Dam 5/18/1995
Concrete Deterioration; Embankment Slide No
E Pratt KS07714
Pratt County Lake Dam 6/2/1995 Piping No
H Woodson KS00900
Kansas F And Game Commission (Kansas Dept. Of Wildlife & Parks) 1/10/1996 Seepage No
* Unknown KSS00001 Decker Dam 1996 Inflow Flood - Hydrologic Event Yes
* Unknown KSS00002 Speer Dam 11/14/1996 Inflow Flood - Hydrologic Event Yes
K Jackson KS00955 Porter, John M. 5/12/1997 Seepage/Piping No
H Montgomery KS03891
Wheeler, C.L. & Vesta, Hadden-Wheeler Dam 10/8/1997
Concrete Deterioration No
L Wyandotte KS02987 Ksnoname 2987 5/14/1997 Seepage; Piping No B Trego KS00019 Cedar Bluff 2/8/1998 Embankment Slide No
K Atchison KS00180
Kansas F And Game Commission(Kansas Dept. Of Wildlife & Parks) 2/9/1998 Embankment Slide No
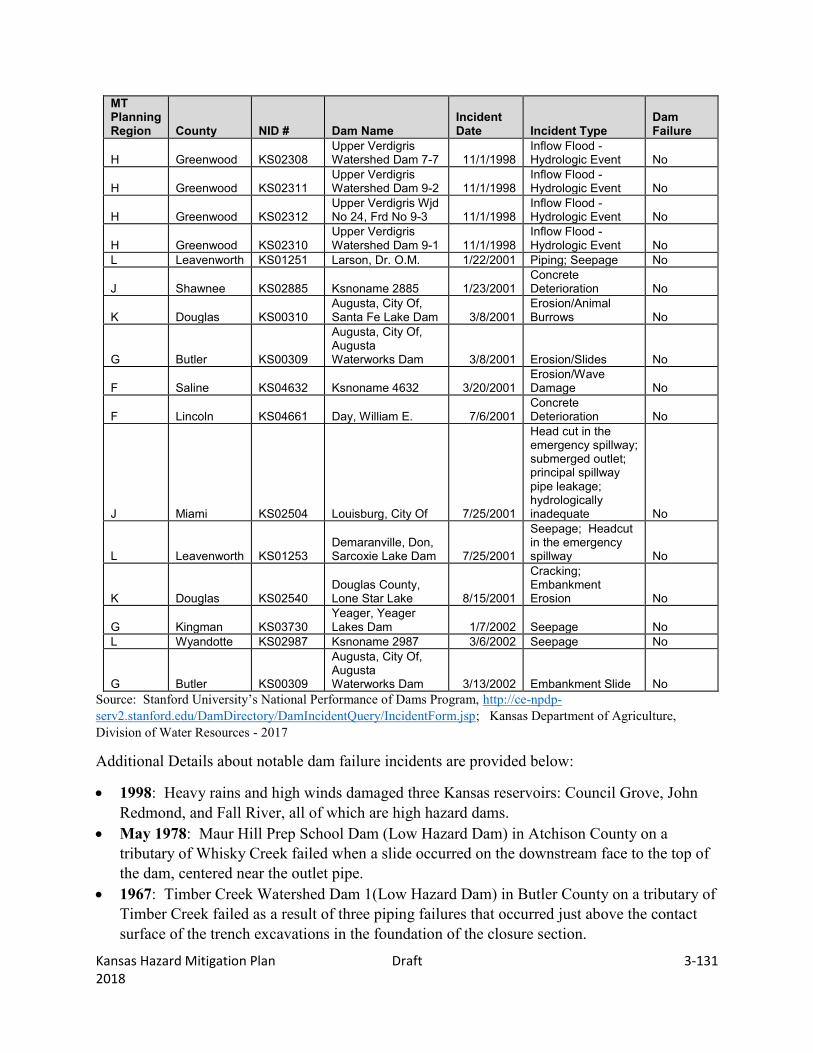
Kansas Hazard Mitigation Plan Draft 3-131 2018
MT Planning Region County NID # Dam Name
Incident Date Incident Type
Dam Failure
H Greenwood KS02308
Upper Verdigris Watershed Dam 7-7 11/1/1998
Inflow Flood - Hydrologic Event No
H Greenwood KS02311
Upper Verdigris Watershed Dam 9-2 11/1/1998
Inflow Flood - Hydrologic Event No
H Greenwood KS02312
Upper Verdigris Wjd No 24, Frd No 9-3 11/1/1998
Inflow Flood - Hydrologic Event No
H Greenwood KS02310
Upper Verdigris Watershed Dam 9-1 11/1/1998
Inflow Flood - Hydrologic Event No
L Leavenworth KS01251 Larson, Dr. O.M. 1/22/2001 Piping; Seepage No
J Shawnee KS02885 Ksnoname 2885 1/23/2001 Concrete Deterioration No
K Douglas KS00310
Augusta, City Of, Santa Fe Lake Dam 3/8/2001
Erosion/Animal Burrows No
G Butler KS00309
Augusta, City Of, Augusta Waterworks Dam 3/8/2001 Erosion/Slides No
F Saline KS04632 Ksnoname 4632 3/20/2001 Erosion/Wave Damage No
F Lincoln KS04661 Day, William E. 7/6/2001 Concrete Deterioration No
J Miami KS02504 Louisburg, City Of 7/25/2001
Head cut in the emergency spillway; submerged outlet; principal spillway pipe leakage; hydrologically inadequate No
L Leavenworth KS01253
Demaranville, Don, Sarcoxie Lake Dam 7/25/2001
Seepage; Headcut in the emergency spillway No
K Douglas KS02540
Douglas County, Lone Star Lake 8/15/2001
Cracking; Embankment Erosion No
G Kingman KS03730
Yeager, Yeager Lakes Dam 1/7/2002 Seepage No
L Wyandotte KS02987 Ksnoname 2987 3/6/2002 Seepage No
G Butler KS00309
Augusta, City Of, Augusta Waterworks Dam 3/13/2002 Embankment Slide No
Source: Stanford University’s National Performance of Dams Program, http://ce-npdp-serv2.stanford.edu/DamDirectory/DamIncidentQuery/IncidentForm.jsp; Kansas Department of Agriculture, Division of Water Resources - 2017
Additional Details about notable dam failure incidents are provided below:
1998: Heavy rains and high winds damaged three Kansas reservoirs: Council Grove, John Redmond, and Fall River, all of which are high hazard dams.
May 1978: Maur Hill Prep School Dam (Low Hazard Dam) in Atchison County on a tributary of Whisky Creek failed when a slide occurred on the downstream face to the top of the dam, centered near the outlet pipe.
1967: Timber Creek Watershed Dam 1(Low Hazard Dam) in Butler County on a tributary of Timber Creek failed as a result of three piping failures that occurred just above the contact surface of the trench excavations in the foundation of the closure section.

Kansas Hazard Mitigation Plan Draft 3-132 2018
1951: KS No Name Dam KS00003 failed and resulted in 11 fatalities. June 1925: The Mission Lake Dam and Spillway, in Horton, Kansas, was completed in
1924. During the period of June 7-8 and 15-18, 1925, heavy rainfall caused the dam to overtop and a section just west of the spillway washed out (see Figure 3.21). Total rainfall reports from the U.S. Weather Bureau for this period show a total of 14.30 inches over the 12-day period. No deaths, injuries, or property damage was indicated.
Figure 3.21. Mission Lake Dam, 1925
Source: 2013 Kansas State Hazard Mitigation Plan
Levee Failure
2011 Flood: USACE reported that every non-federal levee from Rulo, NE to Wolcott,KS on both sides of the river were either overtopped or breached as a result of this flood. Specifically, the following levees along the Missouri River and tributaries in Leavenworth County were breached.
Grape Bollin-Schwartz levee
Sherman Airfield Levee (federal levee)—water reached the hangars which had been evacuated.
Ft. Leavenworth levee
Kansas Department of Corrections Levee
The Levee Repair Working Group of the Missouri River Flood Task Force, established in response to the Missouri River Basin flood of 2011, reported that the following federal and non-federal levees in Kansas were damaged by the flooding.
Project Type Project Name MR Mile Markers State City Federal MRLS 500-R 501.8 to 496.8 KS Doniphan Federal MRLS 482-R 467.0 to 458.0 KS Doniphan
Federal MRLS 471-460-R 456.6 to 441.7 MO / KS Elwood / St. Joseph
Non-Federal Henry Pohl Levee 412.3 to 409.9 KS Atchison
Non-Federal Grape-Bollin-Schwartz Levee Association 409.9 to 406.2 KS Leavenworth
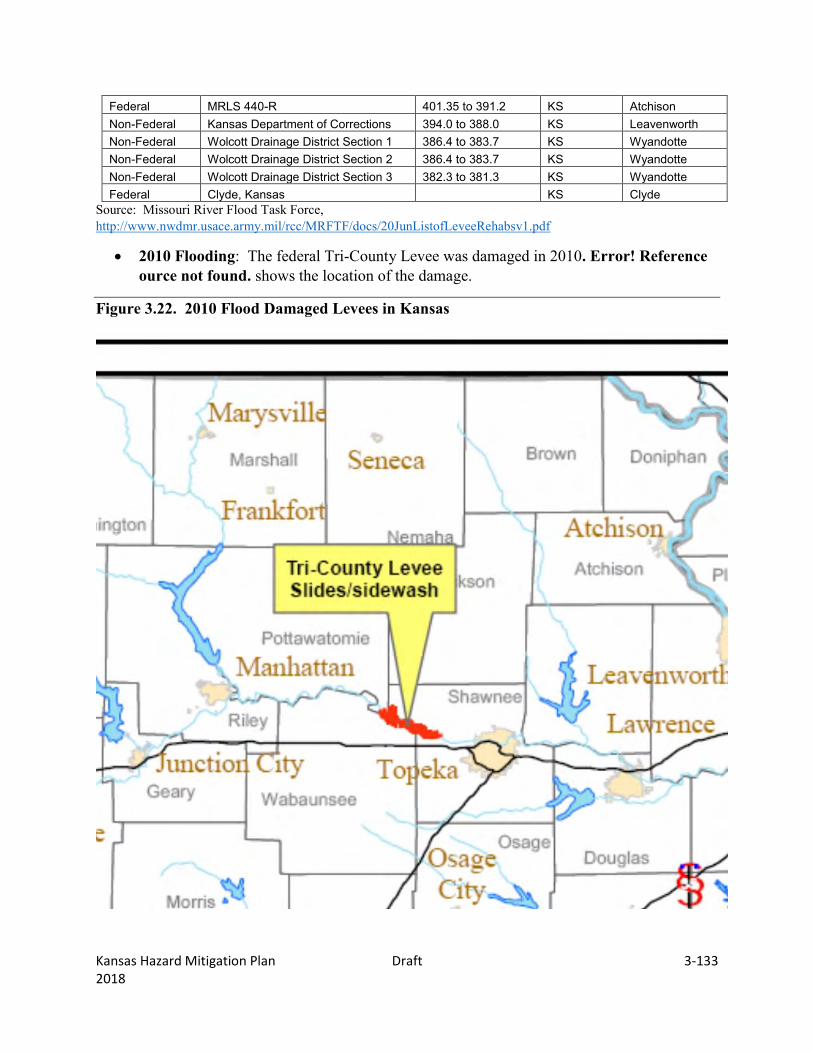
Kansas Hazard Mitigation Plan Draft 3-133 2018
Federal MRLS 440-R 401.35 to 391.2 KS Atchison Non-Federal Kansas Department of Corrections 394.0 to 388.0 KS Leavenworth Non-Federal Wolcott Drainage District Section 1 386.4 to 383.7 KS Wyandotte Non-Federal Wolcott Drainage District Section 2 386.4 to 383.7 KS Wyandotte Non-Federal Wolcott Drainage District Section 3 382.3 to 381.3 KS Wyandotte Federal Clyde, Kansas KS Clyde
Source: Missouri River Flood Task Force, http://www.nwdmr.usace.army.mil/rcc/MRFTF/docs/20JunListofLeveeRehabsv1.pdf
2010 Flooding: The federal Tri-County Levee was damaged in 2010. Error! Reference ource not found. shows the location of the damage.
Figure 3.22. 2010 Flood Damaged Levees in Kansas

Kansas Hazard Mitigation Plan Draft 3-134 2018
Source: USACE, KC District Website, http://www.nwk.usace.army.mil/Portals/29/docs/emergencymanagement/leveerehab/LeveeRepairs-Status-KS.pdf
2009 Flooding: Two non-federal Kansas levees were damaged by flooding in 2009 as follows: Wolcott Levee Section 1 and Wolcott Levee Section 2. Figure 3.23 show the location of the damage. Figure 3.23. 2009 Flood Damaged Levees
Source: USACE KC District Website, http://www.nwk.usace.army.mil/Portals/29/docs/emergencymanagement/leveerehab/2009-LeveeRepairs-Status-MO.pdf
2008 Flooding: Flooding in 2008 caused minor damage to several Kansas Levees as follows: MRLS 5-12-513 R, MRLS 482-R, MRLS 471-460. The map in Figure 3.24 shows these levees along with several levees in Missouri that were damaged.

Kansas Hazard Mitigation Plan Draft 3-135 2018
Figure 3.24. 2008 Flood Damaged Levees
Source: USACE KC District Website, http://www.nwk.usace.army.mil/Portals/29/docs/emergencymanagement/leveerehab/LeveeRepairs-Status-08%20flood-May21-2010.pdf
2007 Flood: Heavy rains in caused widespread flooding in Kansas, particularly impacting Southeast Kansas. Figure 3.25 shows damaged levees in Kansas that are under the jurisdiction of the KC District of USACE including MRLS 471-460 R, Tri-County Levee, Soldier Creek Levee, Salina Levee, Abilene Levee, and Ottawa Levee.
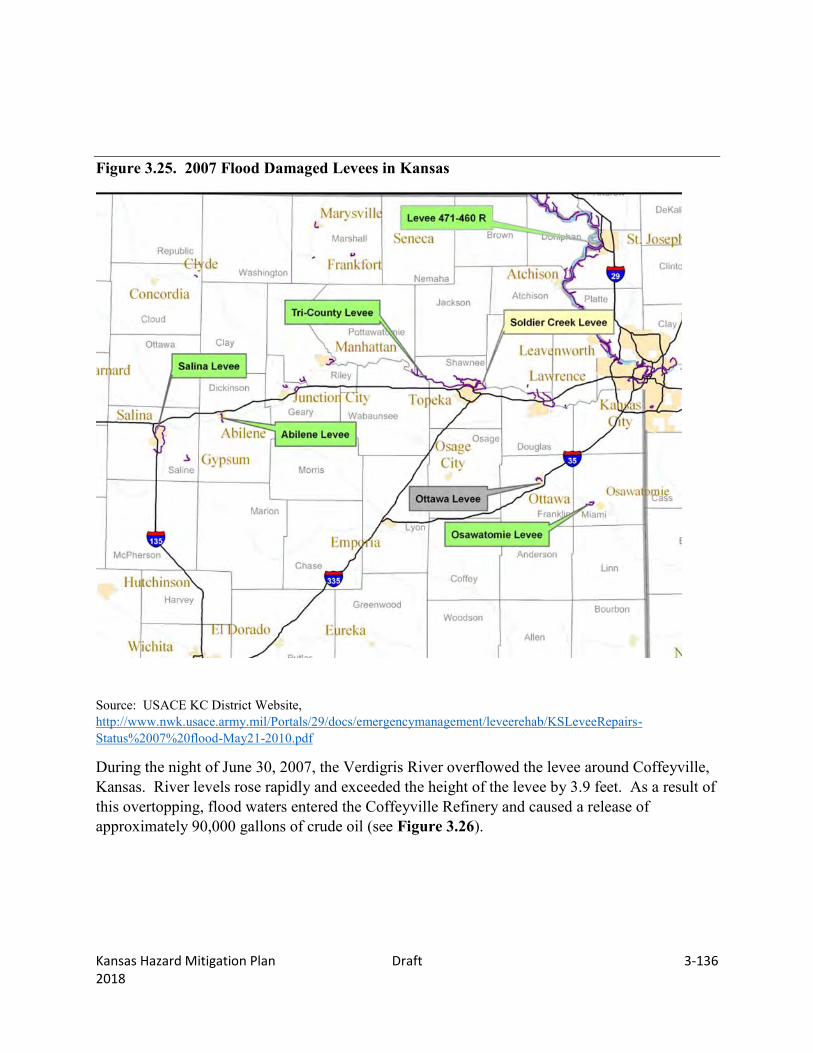
Kansas Hazard Mitigation Plan Draft 3-136 2018
Figure 3.25. 2007 Flood Damaged Levees in Kansas
Source: USACE KC District Website, http://www.nwk.usace.army.mil/Portals/29/docs/emergencymanagement/leveerehab/KSLeveeRepairs-Status%2007%20flood-May21-2010.pdf
During the night of June 30, 2007, the Verdigris River overflowed the levee around Coffeyville, Kansas. River levels rose rapidly and exceeded the height of the levee by 3.9 feet. As a result of this overtopping, flood waters entered the Coffeyville Refinery and caused a release of approximately 90,000 gallons of crude oil (see Figure 3.26).

Kansas Hazard Mitigation Plan Draft 3-137 2018
Figure 3.26. Levee in Coffeyville, KS Overtopped During 2007 Floods
Source: Kansas Division of Water Resources
1998 Flooding: November flooding damaged the Augusta Levee as a result of the Whitewater River breaching the city’s levee system at several locations along the west side of Augusta. Subsequent to the flooding (2011), USACE began a project to raise and extend the levee to provide 500-year protection.
1993 Floods: During the spring floods of 1993, which covered nine Midwest states, a high percentage of crop acres in the U.S. Army Corps of Engineers KC District floodplain areas suffered losses because of overtopping of nine of the 15 units in the federally constructed Missouri River Levee System and virtually all the nonfederal farm levees in the district.
Probability of Future Hazard Events
Dam Failure
The variability of the size and construction of the dams in Kansas makes estimating the probability of dam failure difficult on any scale less than a case-by-case basis. The limited data on previous occurrences indicates that in the last 92 years, there have been 7 recorded dam

Kansas Hazard Mitigation Plan Draft 3-138 2018
failure events in Kansas which is less than 1 event in 10 years. Therefore, this hazard’s CPRI probability is “Unlikely” (event is possible within the next 10 years).
Levee Failure
Although both federal and nonfederal levees have been damaged in previous regional flood events such as the floods in 1993, 2007, and 2011, the damage has not resulted in catastrophic failure and/or damages. Levees in Kansas that have been constructed to protect development and populations from the 1-percent annual chance flood are routinely inspected and maintained. Based on current historical data pertaining to damaging/significant Levee Failure incidents in the State of Kansas, This hazard’s CPRI probability is “Unlikely” (event is possible within the next 10 years).
State Vulnerability Analysis
Dam Failure
The State requires emergency action plans for all high and significant hazard dams. Of the 232 high hazard dams, 209 have emergency action plans, and of the 166 significant hazard dams, only 96 have emergency action plans.
The 2009 Kansas Water Plan states that some dams are exhibiting structural deficiencies because of age, while post-construction development downstream of others has raised their hazard class.
The average age of the 1,840 dams with completion dates in the state’s inventory database is 42.2 years old, and some of them are exhibiting structural deficiencies. Common problems with older dams include:
Deteriorating metal pipes and structural components,
Inadequate hydrologic capacity,
Increased runoff because of upstream development, and
Increased failure hazard because of downstream development.
Nationally, there is growing concern that many small flood control dams, which were built by local watershed districts with U.S. Department of Agriculture technical and financial assistance are at or near the end of their 50-year planned design life. There are 776 watershed dams in Kansas built with this support that now qualify for rehabilitation assistance along with 55 other watershed dams (for a total of 831).
To complete an analysis of vulnerability to dam failure as well as attempt to describe vulnerability in terms of the jurisdictions most threatened by dam failure, points were assigned to each type of dam and then aggregated for a total point score for each county. Points were assigned as follows for each dam: Low Hazard Dams, 1 point, Significant Hazard Dams, 2 points, High Hazard Dams, 3 points, High Hazard Dams without an EAP, an additional 2 points,

Kansas Hazard Mitigation Plan Draft 3-139 2018
Federal Reservoir Dams, 3 points. This analysis does not intend to demonstrate vulnerability in terms dam structures that are likely to fail, but rather provides a general overview of the counties that have a high number of dams, with weighted consideration given to dams whose failure would result in greater damages. Table 3.41 shows the results of this analysis for each county, by Mitigation Planning Region.
Low Medium-Low Medium Medium-High High 0 – 26 27 – 50 51 – 100 101 – 200 201 - 327
Table 3.41. Dam Failure Vulnerability Analysis
County
Low Hazard Dams
Significant Hazard Dams
High Hazard Dams
High Hazard Dams
Without EAP
Federal Reservoirs
Vulnerability Rating
Vulnerability Level
Mitigation Planning Region A Cheyenne 20 0 0 0 20 Low Decatur 25 0 0 0 25 Low Gove 21 0 0 0 21 Low Logan 13 0 0 0 13 Low Rawlins 18 1 2 0 26 Low Sheridan 8 0 1 0 11 Low Sherman 8 0 0 0 8 Low Thomas 8 0 0 0 8 Low Wallace 9 0 0 0 9 Low Subtotal 130 1 3 0 0 141
Mitigation Planning Region B
Ellis 16 0 1 0 19 Low Graham 19 0 0 0 19 Low Ness 34 - 3 0 43 Medium-Low Norton 25 0 0 0 1 28 Medium-Low Phillips 34 0 0 0 1 37 Medium-Low Rooks 24 1 1 0 1 32 Medium-Low Rush 24 9 1 0 45 Medium-Low Russell 19 0 0 0 1 22 Low Trego 12 0 0 0 1 15 Low Subtotal 207 10 6 0 5 260
Mitigation Planning Region C
Grant 6 0 0 0 6 Low Greeley 4 0 0 0 4 Low Hamilton 21 0 0 0 21 Low Kearny 9 1 3 0 20 Low Lane 20 0 0 0 20 Low Morton 0 0 0 0 0 Low Scott 6 0 0 0 6 Low Stanton 9 0 0 0 9 Low Stevens 6 0 0 0 6 Low Wichita 11 0 0 0 11 Low Subtotal 92 1 3 0 0 103
Mitigation Planning Region D
Clark 14 0 0 0 14 Low

Kansas Hazard Mitigation Plan Draft 3-140 2018
County
Low Hazard Dams
Significant Hazard Dams
High Hazard Dams
High Hazard Dams
Without EAP
Federal Reservoirs
Vulnerability Rating
Vulnerability Level
Finney 39 1 0 0 41 Medium-Low Ford 14 0 1 0 17 Low Gray 11 0 4 0 22 Low Haskell 0 0 0 0 0 Low Hodgeman 26 0 3 0 35 Medium-Low Meade 13 0 0 0 13 Low Seward 4 0 0 0 4 Low Subtotal 121 1 8 0 0 146
Mitigation Planning Region E
Barber 44 1 1 0 49 Medium-Low Barton 11 0 0 0 11 Low Comanche 20 1 0 0 22 Low Edwards 1 0 0 0 1 Low Kiowa 6 0 0 0 6 Low Pawnee 19 0 0 0 19 Low Pratt 8 0 0 0 8 Low Stafford 1 0 0 0 1 4 Low Subtotal 110 2 1 0 1 120
Mitigation Planning Region F
Clay 24 0 0 0 1 27 Medium-Low Cloud 13 0 2 0 19 Low Dickinson 64 4 2 0 78 Medium Ellsworth 24 1 1 0 1 32 Medium-Low Jewell 26 0 0 0 1 29 Medium-Low Lincoln 50 8 4 3 84 Medium Mitchell 28 6 1 0 1 46 Medium-Low Osborne 50 0 0 0 50 Medium-Low Ottawa 59 3 2 0 71 Medium Republic 17 1 0 0 19 Low Saline 50 0 1 0 53 Medium-Low Smith 38 0 0 0 38 Medium-Low Subtotal 443 23 13 3 4 546
Mitigation Planning Region G
Butler 171 8 12 3 1 232 High Cowley 98 8 3 2 127 Medium-High Harper 11 0 0 0 11 Low Harvey 19 1 8 0 45 Medium-Low Kingman 20 0 1 0 1 26 Low Marion 22 1 0 0 1 27 Medium-Low McPherson 19 0 1 0 22 Low Reno 10 0 0 0 1 13 Low Rice 11 0 0 0 11 Low Sedgwick 34 1 7 2 1 64 Medium Sumner 8 1 1 0 13 Low Subtotal 423 20 33 7 5 591
Mitigation Planning Region H
Allen 18 0 0 0 18 Low Bourbon 69 4 4 0 89 Medium Chautauqua 70 1 3 0 81 Medium Cherokee 6 0 0 0 6 Low

Kansas Hazard Mitigation Plan Draft 3-141 2018
County
Low Hazard Dams
Significant Hazard Dams
High Hazard Dams
High Hazard Dams
Without EAP
Federal Reservoirs
Vulnerability Rating
Vulnerability Level
Crawford 34 2 1 0 41 Medium-Low Elk 75 6 3 2 100 Medium Greenwood 118 8 3 0 1 146 Medium-High Labette 41 1 0 0 2 49 Medium-Low Montgomery 31 0 2 1 1 42 Medium-Low Neosho 43 1 1 0 48 Medium-Low Wilson 32 0 1 0 35 Medium-Low Woodson 33 1 0 0 1 38 Medium-Low Subtotal 570 24 18 3 5 693
Mitigation Planning Region I
Chase 69 7 0 0 83 Medium Geary 7 0 2 0 1 16 Low Lyon 75 12 2 0 105 Medium-High Morris 26 1 4 0 1 43 Medium-Low Pottawatomie 75 5 6 0 1 106 Medium-High Riley 10 0 4 2 26 Low Wabaunsee 45 5 2 0 61 Medium Subtotal 307 30 20 2 3 440
Mitigation Planning Region J
Anderson 44 0 1 0 47 Medium-Low Coffey 46 2 1 1 1 58 Medium Franklin 59 2 2 0 69 Medium Linn 45 1 12 0 1 86 Medium Miami 44 0 3 1 1 58 Medium Osage 28 6 4 1 2 60 Medium Shawnee 99 2 11 0 136 Medium-High Subtotal 365 13 34 3 5 514
Mitigation Planning Region K
Atchison 128 3 22 0 200 Medium-High Brown 189 8 5 0 220 High Doniphan 67 1 0 0 69 Medium Douglas 65 2 11 0 1 105 Medium-High Jackson 201 6 3 0 222 High Jefferson 204 3 2 0 1 219 High Marshall 107 3 5 0 128 Medium-High Nemaha 142 3 1 0 151 Medium-High Washington 26 1 0 0 28 Low Subtotal 1129 30 49 0 2 1342
Mitigation Planning Region L
Johnson 48 7 26 4 1 151 Medium-High Leavenworth 136 2 6 0 2 164 Medium-High Wyandotte 19 2 12 1 61 Medium Subtotal 203 11 44 5 3 376
Statewide Totals 4100 166 232 23 33 5272 Source: Analysis by KDEM utilizing data from: Kansas Department of Agriculture, Division of Water Resources, Water Structures program; U.S. Army Corps of Engineers; Bureau of Reclamation; U.s. Army, U.S. Fish and Wildlife.

Kansas Hazard Mitigation Plan Draft 3-142 2018
Note: The number of dams decreased during this plan update, due to legislature action. 2013 HB2363: The definition of a dam in the Obstructions in Steams Act, K.S.A. 82a-301, was revised on July 1, 2013. Previously, the jurisdictional storage volume minimum of 50 acre-feet was measured at the top of the dam. It is now measured at the auxiliary spillway. In addition, permit exemptions were added for Class A, low hazard dams.
In the 2013 plan there were 6 dams with a High Vulnerability Level. In 2018 there are four, due to the changes in 2013 HB2363. The map in Figure 3.27 displays the results of the analysis for the 2018 plan.

Kansas Hazard Mitigation Plan Draft 3-143 2018
Figure 3.27. Dam Failure Vulnerability Analysis Map
Source: KDEM, Department of Ag (KS), Division of Water Resources, USACE, Bureau of Reclamation, US Fish and Wildlife

Kansas Hazard Mitigation Plan Draft 3-144 2018
Table 3.42 shows the top ten counties by dam failure vulnerability rating based on the vulnerability analysis methodology described above.
Table 3.42. Top 10 Counties by Dam Failure Vulnerability Rating
Mitigation Planning Region County
Vulnerability Rating
G Butler 232 – High K Brown 220 – High K Jackson 222 – High K Jefferson 219 – High K Atchison 200 – Med High L Leavenworth 164 – Med High L Johnson 151 – Med High K Nemaha 151 – Med High H Greenwood 146 – Med High J Shawnee 136 – Med High
During the development of this plan, the Kansas Department of Agriculture, Division of Water Resources was working on a project to complete emergency action plans and dam inundation mapping for potential High and Significant hazard dams. This project will be ongoing until the fall of 2018. It is recommended that the State develop a state-wide dam inundation GIS layer that could be utilized to provide a more accurate analysis of vulnerability to dam inundation. A statewide dam inundation does not exist at this time.
Levee Failure
To complete an analysis of vulnerability to levee failure, as well as attempt to describe vulnerability in terms of the jurisdictions most threatened by levee failure, The FEMA FAST, Army Corps of Engineers NLD, and the census block data available in Hazus 4 was used to determine the number of people and the value of development in these identified levee protected areas. This analysis does not attempt to evaluate which levees are more prone to overtopping or failure, but rather provide a general picture of those counties that have more people and property protected by levees and therefore the potential for more damage if failure or overtopping were to occur.
Table 3.43 provides a breakdown by county of the population, structure value, contents value, and total value in levee protected areas for the levees in the FAST with available delineated protection areas. This data is to be used only for general determination of those areas of the State that could suffer the greatest losses in the event of levee failure events. Data limitations prevent a more accurate analysis including: lack of delineation of protected areas for all levees and, lack of statewide parcel-type data which would provide more accurate results in determining structures and values within levee protected areas.

Kansas Hazard Mitigation Plan Draft 3-145 2018
Table 3.43. Populations and Values Protected by Levees (by Mitigation Planning Region)
Mitigation Planning Region County
Structure Exposure (1,000s)
Contents Exposure (1000s)
Total Exposure (1000s) Population
B Ellis $542,515 $443,397 $985,912 4,285 B Total $542,515 $443,397 $985,912 4,285 D Ford $376,760 $300,588 $677,348 3,784 D Total $376,760 $300,588 $677,348 3,784 E Barton $2,154,243 $1,456,559 $3,610,802 17,471 E Pawnee $207,094 $138,261 $345,355 961 E Total $2,361,337 $1,594,820 $3,956,157 18,432 F Cloud $61,155 $43,961 $105,116 324 F Dickinson $486,135 $325,899 $812,034 2,513 F Lincoln $23,653 $14,806 $38,459 65 F Saline $4,881,119 $3,279,331 $8,160,450 44,159 F Total $5,452,062 $3,663,997 $9,116,059 47,061 G Butler $341,898 $273,539 $615,427 1,544 G Cowley $1,084,931 $674,545 $1,759,476 8,316 G Harvey $233,272 $152,580 $385,852 2,134 G Marion $149,850 $104,500 $254,350 743 G Reno $2,058,484 $1,443,690 $3,502,174 18,050 G Rice $32,399 $19,271 $51,670 251 G Sedgwick $27,380,841 $18,447,721 $45,828,562 249,053 G Sumner $74,498 $39,501 $113,999 458 G Total $31,356,173 $21,155,347 $52,511,510 280,549 H Allen $640 $484 $1124 2 H Labette $70,435 $44,720 $115,155 394 H Montgomery $240,636 $178,243 $418,879 1,104 H Neosho $7,389 $7,481 $14,870 8 H Total $319,100 $230,928 $550,028 1,508 I Chase $1,039 $521 $1,560 7 I Geary $87,487 $46,055 $133,542 2,604 I Lyon $23,948 $12,784 $36,732 152 I Pottawatomie $186,840 $184,626 $371,466 524 I Riley $637,159 $466,917 $1,104,076 5,134 I Wabaunsee $5,328 $2,668 $7,996 34 I Total $941,801 $713,571 $1,655,372 8,455 J Coffey $837 $581 $1,418 0 J Franklin $340,043 $231,705 $571,748 2,216 J Miami $271,589 $172,902 $444,491 2,260 J Shawnee $2,243,023 $1,696,042 $3,939,065 15,446 J Total $2,855,492 $2,101,230 $4,956,722 19,922 K Atchison $4,017 $2,310 $6327 0 K Brown $469 $235 $704 1 K Doniphan $230,762 $168,945 $399,707 1,571 K Douglas $378,403 $266,280 $644,683 2,774 K Jefferson $17,557 $10,362 $27,919 93 K Marshall $231,220 $159,560 $390,780 1,180
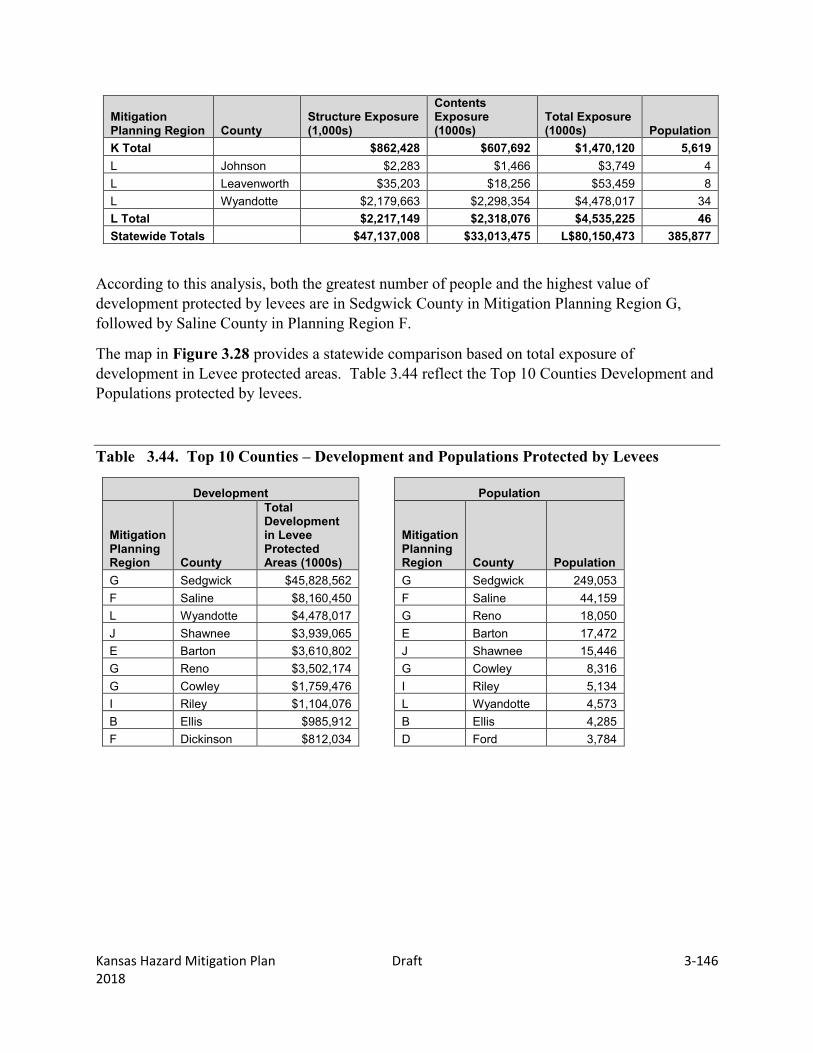
Kansas Hazard Mitigation Plan Draft 3-146 2018
Mitigation Planning Region County
Structure Exposure (1,000s)
Contents Exposure (1000s)
Total Exposure (1000s) Population
K Total $862,428 $607,692 $1,470,120 5,619 L Johnson $2,283 $1,466 $3,749 4 L Leavenworth $35,203 $18,256 $53,459 8 L Wyandotte $2,179,663 $2,298,354 $4,478,017 34 L Total $2,217,149 $2,318,076 $4,535,225 46 Statewide Totals $47,137,008 $33,013,475 L$80,150,473 385,877
According to this analysis, both the greatest number of people and the highest value of development protected by levees are in Sedgwick County in Mitigation Planning Region G, followed by Saline County in Planning Region F.
The map in Figure 3.28 provides a statewide comparison based on total exposure of development in Levee protected areas. Table 3.44 reflect the Top 10 Counties Development and Populations protected by levees.
Table 3.44. Top 10 Counties – Development and Populations Protected by Levees
Development Population
Mitigation Planning Region County
Total Development in Levee Protected Areas (1000s)
Mitigation Planning Region County Population
G Sedgwick $45,828,562 G Sedgwick 249,053 F Saline $8,160,450 F Saline 44,159 L Wyandotte $4,478,017 G Reno 18,050 J Shawnee $3,939,065 E Barton 17,472 E Barton $3,610,802 J Shawnee 15,446 G Reno $3,502,174 G Cowley 8,316 G Cowley $1,759,476 I Riley 5,134 I Riley $1,104,076 L Wyandotte 4,573 B Ellis $985,912 B Ellis 4,285 F Dickinson $812,034 D Ford 3,784

Kansas Hazard Mitigation Plan Draft 3-147 2018
Figure 3.28. Value of Development in Levee Protected Areas

Kansas Hazard Mitigation Plan Draft 3-148 2018
State Estimates of Potential Losses
Dam Failure
Inundation maps for state-regulated and federal dams are not readily available to determine loss estimates based on inundation areas. As inundation maps are developed for significant and high hazard dams, local hazard mitigation plans should work to develop potential loss estimates for dam failure events. At this time, it is not anticipated that a statewide dam inundation layer will be developed. Therefore, the State will rely on potential loss estimates generated in local plans for this hazard.
Levee Failure
To estimate potential losses associated with levee failure, 20 percent loss was considered for all development (structure and contents) in levee protected areas as defined on the Fast Database. The 20 percent damage estimation is based on FEMA Flood Insurance Administration (FIA) depth-damage curves for a one-story structure with no basement flooded to two feet. Again, this analysis does not intend to make a determination as to specific levees that are prone to failure, but rather demonstrate an overall worst case scenario for those counties if they were all to fail in an event causing an average 20 percent in damages to the development protected by those levees. Table 3.45 has the potential loss estimates for levee failure.

Kansas Hazard Mitigation Plan Draft 3-149 2018
Table 3.45. State Estimates of Potential Loss-Levee Failure (by Mitigation Planning Region)

Kansas Hazard Mitigation Plan Draft 3-150 2018
Development in Hazard Prone Areas
Dam Failure
Of the top 10 counties with the highest vulnerability rating for dam failure, 4 were also in the top 10 for greatest housing unit gains from 2010 - 2015. Those counties, in order of housing unit gains are: Johnson, Leavenworth, Shawnee, and Butler. It is not known if development is occurring within dam inundation zones. Most counties within Kansas do not have ordinances prohibiting or limiting development in dam inundation areas. If additional development does occur in inundation areas, the vulnerability to this hazard also increases.
Levee Failure
Of the top 10 counties in terms of development protected by levees, four were also in the top 10 for greatest housing unit gains from 2010 - 2015. Those counties in order of housing unit gains are: Sedgwick, Riley, Wyandotte, and Shawnee. Additionally, of the top 10 counties in terms of populations protected by levees, 4 were also in the top 10 for population gains from 2010 to 2016. Those counties in order of population gains are: Sedgwick, Wyandotte, Riley, and Ellis. If additional development and population growth is occurring in levee protected areas, this increases the vulnerability if levee failures or overtopping occur.
Consequence Analysis
When a dam fails, the stored water can be suddenly released and have catastrophic effects on life and property downstream. Homes, bridges, and roads can be demolished in minutes. At least 7 dam failures have occurred in Kansas since 1924. Residents near a Significant or High Hazard dam should become familiar with the dam’s emergency actions plans, if available. Emergency plans written for dams include procedures for notification and coordination with law enforcement and other governmental agencies, information on the potential inundation area, plans for warning and evacuation, and procedures for making emergency repairs.
The impact of levee failure during a flooding event can be very similar to a dam failure in that the velocity of the water caused by sudden release as a result of levee breach can result in a flood surge or flood wave that can cause catastrophic damages. If the levee is overtopped as a result of flood waters in excess of the levee design, impacts are similar to flood impacts.
The information in Table 3.46 provides the Consequence Analysis of Potential for Detrimental Impacts of Hazards done for accreditation with the Emergency Management Accreditation Program (EMAP).

Kansas Hazard Mitigation Plan Draft 3-151 2018
Table 3.46. EMAP Consequence Analysis: Dam and Levee Failure
Subject Ranking Impacts/Dam and Levee Failure
Health and Safety of Persons in the Area of the Incident
Severe Localized impact expected to be severe for the inundation area and moderate to minimal for other affected areas.
Responders Minimal Impact to responders is expected to be minimal with proper training. Impact could be severe if there is lack of training.
Continuity of Operations Minimal Temporary relocation may be necessary if inundation affects government facilities.
Property, Facilities, and Infrastructure
Minimal to Severe Localized impact could be severe in the inundation area of the incident to facilities and infrastructure. The further away from the incident area the damage lessens to minimal to moderate.
Delivery of Services Minimal to Severe Delivery of services could be affected if there is any disruption to the roads and/or utilities due to the inundation. Minimal to severe depending on area size and location affected.
Environment Severe Impact will be severe for the immediate impacted area. Impact will lessen as distance increases from the immediate incident area.
Economic Conditions Minimal to Severe Impacts to the economy will greatly depend on the scope of the inundation and the amount of time it takes for the water to recede.
Public Confidence in Jurisdiction’s Governance
Minimal to Severe Depending on the perception of whether the failure could have been prevented, warning time, and the time it takes for response and recovery will greatly impact the public’s confidence.

Kansas Hazard Mitigation Plan Draft 3-152 2018
3.3.4. Drought Calculated Priority Risk Index Planning Significance 2.80 Moderate
Description/Location Drought is generally defined as a condition of moisture levels significantly below normal for an extended period of time over a large area that adversely affects plants, animal life, and humans. It can also be defined in terms of meteorology, agricultural, hydrological and socio-economic.
Meteorological drought is defined on the basis of the degree of dryness (in comparison to some “normal” or average amount) and the duration of the dry period. A meteorological drought must be considered as region-specific since the atmospheric conditions that result in deficiencies of precipitation are highly variable from region to region.
Agricultural drought links various characteristics of meteorological (or hydrological) drought to agricultural impacts, focusing on precipitation shortages, differences between actual and potential evaporation, soil water deficits, reduced ground water or reservoir levels, and so forth. Plant water demand depends on prevailing weather conditions, biological characteristics of the specific plant, its stage of growth, and the physical and biological properties of the soil. Deficient topsoil moisture at planting may hinder germination, leading to low plant populations per hectare and a reduction of final yield. However, if topsoil moisture is sufficient for early growth requirements, deficiencies in subsoil moisture at this early stage may not affect final yield if subsoil moisture is replenished as the growing season progresses or if rainfall meets plant water needs.
Hydrological drought is associated with the effects of periods of precipitation (including snowfall) shortfalls on surface or subsurface water supply (i.e., streamflow, reservoir and lake levels, ground water). The frequency and severity of hydrological drought is often defined on a watershed or river basin scale. Although all droughts originate with a deficiency of precipitation, hydrologists are more concerned with how this deficiency plays out through the hydrologic system. Hydrological droughts are usually out of phase with or lag the occurrence of meteorological and agricultural droughts. It takes longer for precipitation deficiencies to show up in components of the hydrological system such as soil moisture, streamflow, and ground water and reservoir levels. As a result, these impacts are out of phase with impacts in other economic sectors.
Socioeconomic drought refers to when physical water shortage begins to affect people.
The four different definitions all have significance in Kansas. A meteorological drought is the easiest to determine based on rainfall data and is an easier drought to monitor from rain gauges and reports. A hydrological drought means that stream and river levels are low, which also has

Kansas Hazard Mitigation Plan Draft 3-153 2018
an impact for surface water and ground water irrigators. In addition, discharges from reservoirs that are made to meet instream targets, further reduce the levels in the reservoirs—some of which are set to protect threatened and endangered mussel populations. An agricultural drought represents difficulty for Kansas’s agricultural-based economy and is also relatively easy to monitor based on crop viabilities for different regions.
The National Drought Mitigation Center (NDMC) located at the University of Nebraska in Lincoln provides drought monitoring and technical assistance to all areas of the world. NDMC’s website is found at http://www.drought.unl.edu/. Specific drought impacts by county are recorded at http://droughtreporter.unl.edu/.
In Kansas, the Kansas Water Office (KWO) is responsible for monitoring, reporting, and coordinating the Governor’s Drought Response Team. The Drought Response Team advises the governor of drought conditions and recommends state actions. The KWO gathers information from the NDMC, Regional Climate Centers, the Kansas Weather Data Library, Federal, state and local agencies and water users to report drought and climate conditions periodically.
Periods of drought are normal occurrences in all parts of Kansas. Drought in Kansas is caused by severely inadequate amounts of precipitation that adversely affect farming and ranching, surface and ground water supplies, and uses of surface waters for navigation and recreation. Drought can also create favorable conditions for wildfires and wind erosion (See Section 3.3.20 Wildfire and Section 3.3.16 Soil Erosion and Dust).
The impacts of drought can be categorized as economic, environmental, or social. Many economic impacts occur in agriculture and related sectors, including increasing food prices globally. In addition to obvious losses in yields in both crop and livestock production, drought is associated with increases in insect infestations, plant disease, and wind erosion. Droughts also bring increased problems with insects and disease to forests and reduce growth. The incidence of wildfires increases substantially during extended droughts, which in turn places both human and wildlife populations at higher levels of risk. Income loss is another indicator used in assessing the impacts of drought because so many sectors are affected.
Although environmental losses are difficult to quantify, increasing public awareness and concern for environmental quality has forced public officials to focus greater attention and resources on these effects. Environmental losses are the result of damages to plant and animal species, wildlife habitat, and air and water quality, wildfires, degradation of landscape quality, loss of biodiversity, and soil erosion. Some of the effects are short-term and conditions quickly return to normal following the end of the drought. Other environmental effects linger for some time or may even become permanent. Wildlife habitat, for example may be degraded through the loss of wetlands, lakes, and vegetation. However, many species will eventually recover from this temporary aberration. The degradation of landscape quality, with increased soil erosion, may lead to a more permanent loss of biological productivity of the landscape.

Kansas Hazard Mitigation Plan Draft 3-154 2018
Although drought is not predictable, long-range outlooks may indicate an increased chance of drought, which can serve as a warning (P.L. 109-430 established a National Integrated Drought Information System within the National Oceanic and Atmospheric Administration to improve drought monitoring and forecasting capabilities http://www.drought.gov/drought/). A drought period can last for months, years, or even decades. It is rarely a direct cause of death, though the associated heat, dust, and stress can all contribute to increased mortality.
According to the NOAA.gov website, the average cost of drought per year in the United States from the year 1980 – 2016 in billions of dollars was $6.6 with a frequency of 13%. For the year 2015 – 2016 the average event cost of drought was 4.5 billions of dollars, with a frequency of 4.5%. While the 1980 drought damage was estimated at $29 billion nationally, the 2016 damage amounts were $4.6 billion nationally. While this shows a decline, climate change could see this number dramatically increase in the U.S.
Figure 3.29 indicates that all of Kansas has experienced drought at some point between the years 2000 – 2017. (note: 100% equals all counties in Kansas).
Figure 3.29. Percentage of Kansas in Drought 2000 - 2017
Source: Drought Monitor http://droughtmonitor.unl.edu/MapsAndData/Graph.aspx
In eastern Kansas, the primary source of water is surface water: rivers, federal reservoirs, multipurpose small lakes, and municipal lakes. In western Kansas, the primary source is groundwater drawn from wells that reach into the water bearing aquifers. While 68 percent of the State’s public water systems rely upon groundwater sources, these systems serve only 29 percent of the population. Ground water use is primarily from the High Plains Aquifer and is used for domestic, municipal, industrial and agricultural purposes, primarily where the aquifer is near the surface in southwestern and central Kansas. In Kansas, the Ogallala, Great Bend Prairie and

Kansas Hazard Mitigation Plan Draft 3-155 2018
Equus beds are the primary aquifers that form the High Plains aquifer. Where interconnected, the alluvial aquifers are also considered part of the High Plains aquifer. Composed primarily of silt, sand, gravel and clay, from rock debris washed off the Rocky Mountains and other sources, the High Plains aquifer lies beneath eight states, covering approximately 174,000 square miles; in Kansas it includes 30,500 square miles. Droughts in southwest and south central Kansas in 2011 – 2016 led to increased irrigation pumping resulting in steep declines in the Ogallala aquifer. In southwestern Kansas, the Dakota is used in conjunction with the overlying High Plains aquifer (the Ogallala and associated shallow aquifers) as a source of water for irrigation. In central Kansas, the Dakota provides a good source of water for irrigation, stock watering, municipal supply and industry. In west-central Kansas, the aquifer is a primary source of water for livestock and domestic use (see Figure 3.30).
Alluvial aquifers, those sand and gravel deposits along rivers and streams also supply water to many Kansans. In many parts of the state it is the only source of drinkable water for public water suppliers and individual domestic wells. Alluvial aquifers are generally recharged by flow in the associated rivers and streams.
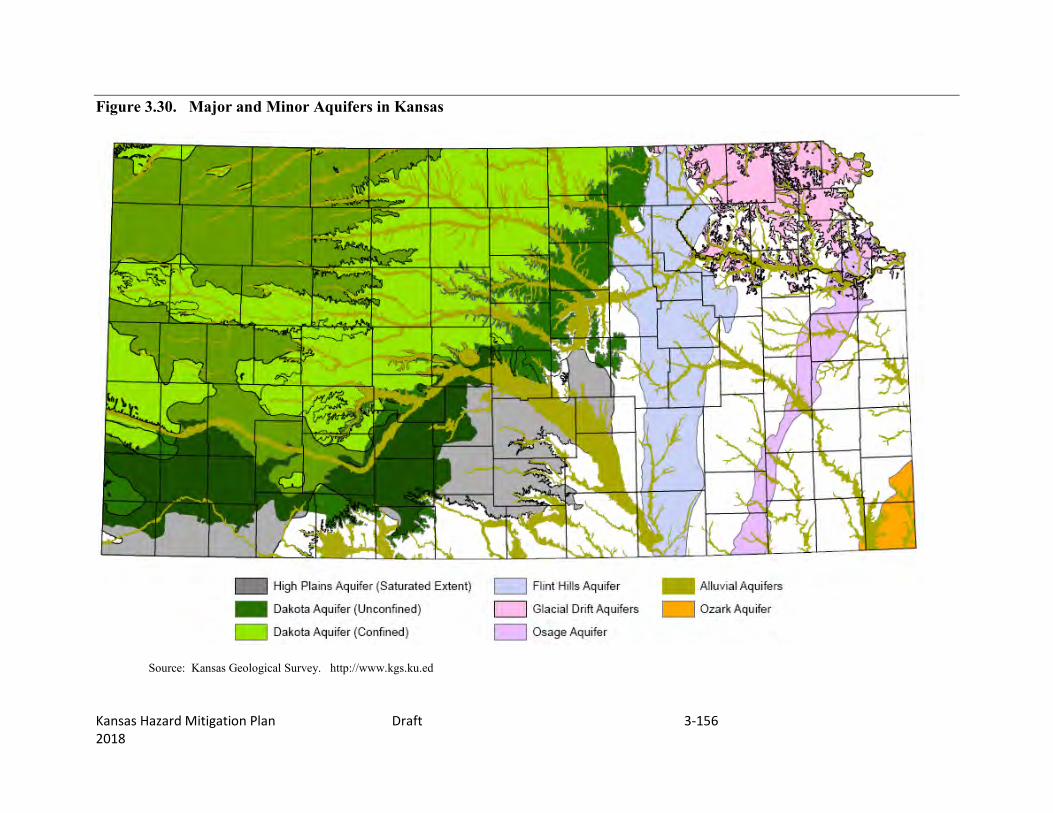
Kansas Hazard Mitigation Plan Draft 3-156 2018
Figure 3.30. Major and Minor Aquifers in Kansas
Source: Kansas Geological Survey. http://www.kgs.ku.ed
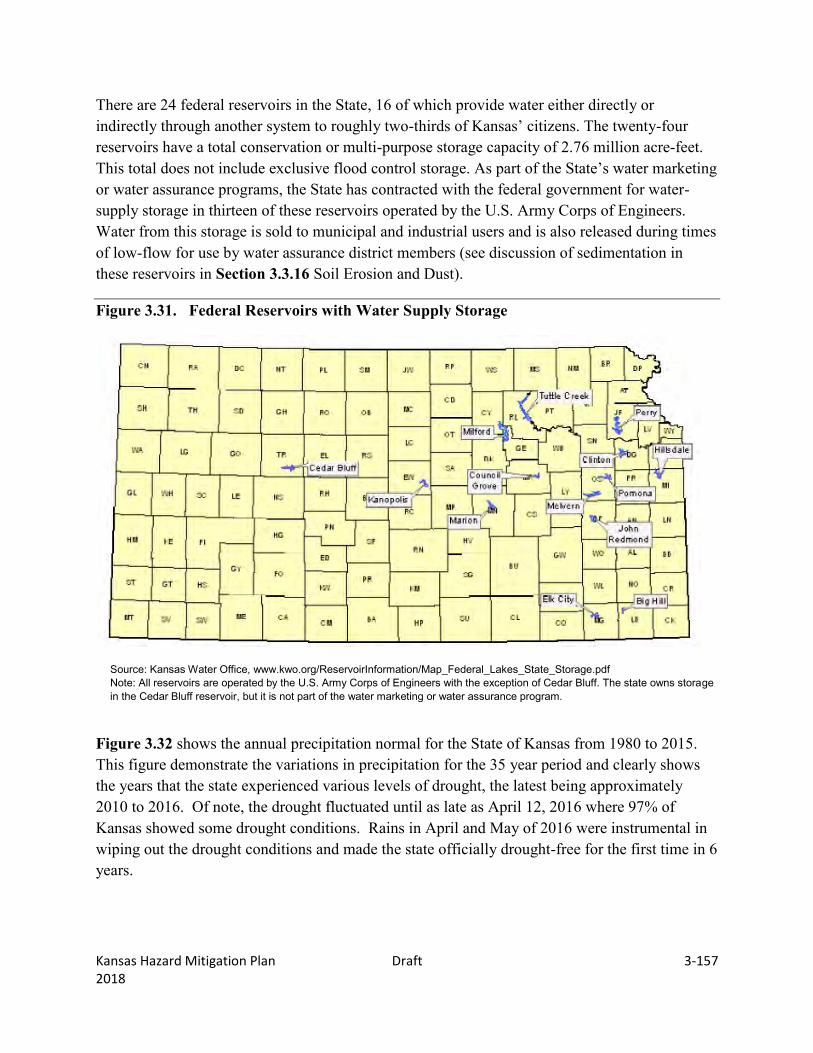
Kansas Hazard Mitigation Plan Draft 3-157 2018
There are 24 federal reservoirs in the State, 16 of which provide water either directly or indirectly through another system to roughly two-thirds of Kansas’ citizens. The twenty-four reservoirs have a total conservation or multi-purpose storage capacity of 2.76 million acre-feet. This total does not include exclusive flood control storage. As part of the State’s water marketing or water assurance programs, the State has contracted with the federal government for water-supply storage in thirteen of these reservoirs operated by the U.S. Army Corps of Engineers. Water from this storage is sold to municipal and industrial users and is also released during times of low-flow for use by water assurance district members (see discussion of sedimentation in these reservoirs in Section 3.3.16 Soil Erosion and Dust).
Figure 3.31. Federal Reservoirs with Water Supply Storage
Source: Kansas Water Office, www.kwo.org/ReservoirInformation/Map_Federal_Lakes_State_Storage.pdf Note: All reservoirs are operated by the U.S. Army Corps of Engineers with the exception of Cedar Bluff. The state owns storage in the Cedar Bluff reservoir, but it is not part of the water marketing or water assurance program.
Figure 3.32 shows the annual precipitation normal for the State of Kansas from 1980 to 2015. This figure demonstrate the variations in precipitation for the 35 year period and clearly shows the years that the state experienced various levels of drought, the latest being approximately 2010 to 2016. Of note, the drought fluctuated until as late as April 12, 2016 where 97% of Kansas showed some drought conditions. Rains in April and May of 2016 were instrumental in wiping out the drought conditions and made the state officially drought-free for the first time in 6 years.

Kansas Hazard Mitigation Plan Draft 3-158 2018
Figure 3.32. Kansas Precipitation 1980 – 2015
Source: NCEI/NOAA http://www.NCEI.noaa.gov/cag/time-series/us/14/0/pcp/ytd/12/1980-2016?base_prd=true&firstbaseyear=1980&lastbaseyear=2016
As of April 19, 2018, the U.S. Drought Monitor has the State of Kansas in varying degrees of drought. The only region not in drought conditions is the far northwest corner and the far southeast corner of the state. Figure 3.33 depicts.

Kansas Hazard Mitigation Plan Draft 3-159 2018
Figure 3.33. U.S. Drought Monitor as of April, 2018
Source: Drought Monitor http://droughtmonitor.unl.edu/CurrentMap/StateDroughtMonitor.aspx?KS
Previous Occurrences
Kansas has had recurring periods of drought throughout history, some of them lasting for very long extended periods. A recent analysis of Palmer Drought Severity Index (PDSI) identified more severe droughts in western Kansas than eastern Kansas over the past 1000 years. It also indicated that typically northern Kansas experienced more severe droughts than southern Kansas. The east-west trend can be explained by precipitation differences. The study explained the north-south trend as related to spatial patterns of the historic droughts of the 1930s and 1950s. As shown in Figure 3.29, Kansas was in severe or extreme drought between 10 and 20 percent of the last century. During this time, perhaps the most notorious drought was during the Dust Bowl years of the 1930s. During the past century, several major and numerous minor droughts affected Kansas. The Kansas Water Office has established guidelines for a phased drought response. All regions of Kansas are subject to drought of varying levels of severity and duration. Table 3.47 summarizes Kansas county drought declarations made by the Governor between 2002 and 2017. Note in 2000 declarations were made by river basin rather than counties. Note that on June 2, 2016, the Governor declared Kansas drought free. In March of 2018 the Governor issued a new drought declaration for all 105 counties in Kansas, for varying degrees of drought.

Kansas Hazard Mitigation Plan Draft 3-160 2018
.Table 3.47. Kansas Drought State Declaration Summary 2000-2016
Date Executive Order Emergency Warning Watch
Total Counties
03/13/2018 18-11 28 29 48 105 6/2/2016 16-02 0 0 0 0
6/30/2015 15-04 0 0 33 33 5/21/2014 14-04 56 26 23 105 8/26/2013 13-02 37 20 25 82 7/25/2012 12-10 105 0 0 105 7/03/2012 12-08 36 55 14 105 5/04/2012 12-07 0 16 75 91
11/21/2011 11-48 40 24 37 101 10/05/2011 11-37 30 29 27 86 9/02/2011 11-29 17 42 21 80 8/24/2011 11-27 15 26 36 77 4/07/2011 11-06 0 20 27 47 8/22/2008 08-11 0 4 7 11 6/11/2008 08-07 0 5 8 13 5/14/2007 07-13 0 0 0 0 3/06/2007 07-04 0 3 57 60 8/21/2006 06-09 0 105 0 105 3/20/2006 06-04 0 80 25 105 2/07/2006 06-03 0 6 66 69 9/08/2004 04-09 0 6 9 15 6/15/2004 04-08 31 12 14 57
10/27/2003 03-22 28 77 0 105 8/22/2003 03-19 11 0 0 11 8/22/2003 03-18 0 94 0 94 7/31/2003 03-163 0 0 52 52 7/31/2003 03-153 0 53 0 53 7/30/2002 0 83 22 105 7/03/2002 0 61 0 61 5/03/2002 0 0 41 41
7/12/2000 UREP & SO
6/09/2000 KLR & MO
Source: Kansas Water Office
The National Drought Mitigation Center developed the Drought Impact Reporter in response to the need for a national drought impact database for the United States. The Drought Impact Reporter maps the effects of drought, based on reports from media, observers and other sources. Impacts are an observable loss or change at a specific place and time due to drought. The Drought Impact Reporter is not a comprehensive set of data, but is useful in tracking drought, if

Kansas Hazard Mitigation Plan Draft 3-161 2018
submissions are adequate, to aid in better understanding and response to drought impacts. The main emphasis is for drought planning.
The Drought Impact Reporter contains information on 58 drought impacts from droughts that affected Kansas between December 2013 and February 2018. These categories of agriculture, energy, plants and wildlife, society and public health, water supply and quality, business and industry, fire, relief, response, and restrictions, and tourism and recreation are described on the National Drought Mitigation Center, Drought Impact Reporter website http://droughtreporter.unl.edu/. Of note, the 58 impacts are since the last plan update in 2013.
Figure 3.34 is a statewide map which shows the 23 drought-related impacts by county since the last plan update in 2013.
Figure 3.34. Kansas Drought Impacts Reported 2013 – 2016.
Source: National Drought Mitigation Center, Drought Impact Reporter, http://droughtreporter.unl.edu/
2018: Gov. Jeff Colyer signed Executive Order 18-11 declaring all counties within the State of Kansas as being in one of the 3 stages of drought.
2016: Gov. Sam Brownback signed Executive Order 16-02 declaring all counties within the State of Kansas Drought Free.
2014-2015 – Executive Order 14-04 declared all 105 counties into one the three stages of drought. This remained in place for over one year, through the end of June 2015. The

Kansas Hazard Mitigation Plan Draft 3-162 2018
conditions in 2015 made producers in 44 counties eligible for federal disaster programs due to drought conditions.
2012: The Kansas Water Office increased the frequency of the Drought/Climate report (found at www.kwo.org) to weekly for much of the year due to intensity of conditions. The Governor signed 3 executive orders this year for drought with all 105 counties were declared in emergency drought status with the last order. The Governor approved the June 2012 Operations Plan for the Governor‘s Drought Response Team which updated activities and responses. The Governor’s Office created a Drought Resources Website, http://governor.ks.gov/kansas-drought-resources, to provide drought information for all Kansans and to utilize drought relief assistance initiatives. Drought conditions continued from 2011, although appeared to lessen in the early months of 2012, when above normal precipitation occurred in February, March and April compared to 30 year averages. By May 3rd however, precipitation was well below normal and temperatures above. These conditions prompted the first 2012 Executive Order for drought watch and warning declarations for 91 counties. Conditions also included extremely low soil moisture for crops and vegetation. May was the second driest and third warmest on record. By June 5th, 58 percent of the State was in moderate drought (D2) according to the U.S. Drought Monitor, with drought affecting all but portions of the south east to some degree. By the end of June, severe (D2) and extreme drought (D3) impacted in the majority of the State with the worst in western areas. By July, the entire state was in severe (D2) or worse, with areas of extreme (D3) and exceptional (D4) expanding. The areas of severity of drought changed, but the entire state remained at some level of drought for the rest of 2012. Temperatures and precipitation both contributed to the severity of drought conditions. July thru August was the warmest period on record, with numerous months ranking as driest or warmest for various locations, regions or the entire state. October to September was also the warmest on record. Overall, only two small areas of the State received near normal precipitation in 2012 with the majority receiving 25-90 percent of normal precipitation (through Dec 5). As of December 1, precipitation needed to return to normal moisture levels using the Palmer Drought Severity Index ranged from 3.5 inches in the southwest to 9.31inches in east central division. USDA agricultural disaster due to drought was declared for all 105 counties in Kansas based on crop losses through a series of six designations in July and August. This makes producers eligible for certain emergency programs. The crop losses were estimated at $1.5 billion. At least 197communities and rural water districts in Kansas had voluntary or mandatory restrictions on water use as drought and high demand depleted public water supplies and challenged treatment and distribution. Mandatory restrictions were placed on water right holders junior to minimum desirable streamflow (MDS) in as many as 17 locations affecting 540 water appropriations. Livestock ponds, feed and pasture were insufficient to meet needs. Contingencies for feed and water were made available to producers through hay networks,

Kansas Hazard Mitigation Plan Draft 3-163 2018
motor carrier authorities and emergency water from state fishing lakes and federal reservoirs. Despite these efforts, livestock numbers in June marked the lowest cattle inventory since 1973. The risk of wildfires was high throughout the State with as many as 78 counties issuing burn bans over some period of 2012. At least 41,000 acres burned. Dry conditions in the fall resulted in dust storms visible by satellite.
2011: Precipitation for 2011 was -8.92 inches below normal for the year statewide, with climatic divisions varying from -3.51 to -14.36 inches below normal. The Governor signed 6 executive orders between April and November for various drought stages over the year, increasing the number of counties to 100 in the November order including 40 counties in emergency stage. The year began with extraordinarily low winter moisture and the very little precipitation continued throughout the year. Throughout the year the severity and area affected varied. Drought conditions reached their greatest extent as reflected by the Drought Monitor October 4 when exceptional drought (D4) covered 18 percent of the State while 93 percent of the State was shown as abnormally dry (D1-D4), 54 percent severe (D2-D4) and 33 percent extreme (D3-D4). Conditions improved slightly through the end of the year. USDA agricultural disaster due to drought was declared for 70 counties in Kansas based on crop losses. Kansas agricultural losses were estimated by the Kansas Department of Agriculture at over $1.77 billion due to drought. The hot dry conditions in Kansas were centered in southwest and south central Kansas, being the hottest and driest for these climatic areas since 1895. Many locations set new records for the number of days with temperatures of 100o F or more, June through August. Statewide, soil moisture was around 50 percent adequate as 2011 began but never exceeded 55 percent for topsoil moisture until November. Very little surplus existed all year for topsoil or subsoil moisture. The U.S. Army Corps of Engineer lakes and most rivers in Kansas received less than normal inflow during 2011, but the total reservoir inflows were sufficient to allow the lakes to operate near normal levels. Significant portions of southern Kansas had below normal monthly-average stream flows begin to occur in April, increasing in area and or severity each month until peaking in July. At least 38 public water suppliers in 22 counties initiated conservation measures due to drought conditions. These include municipal, rural water districts and a community college. In 2011 MDS administration occurred on at least eight river systems effecting about 279 water rights. 2011 marked the lowest January 1 cattle inventory in the U.S since 1958. Drought contributed to a three percent decrease in inventory by January 2012.
2007 – 2010: During the period of July 1, 2007 through June 1, 2010, periods of abnormal to extreme drought conditions were reported in the western two-thirds of the State. Normal to abnormally dry conditions were present throughout the Western and South Central regions by
Kansas Hazard Mitigation Plan Draft 3-164 2018
mid October. By the end of 2007, this changed to moderately dry conditions in the extreme Southwestern counties. By late April 2008, conditions in this area had changed to the severe level and reached extreme levels by May 27. On June 11, the Governor declared drought warnings and watches in 13 Kansas counties, via Executive Order 08-07. Under drought warnings were the following counties: Grant, Hamilton, Morton, Stanton and Stevens. Under a drought watch were the following counties: Finney, Greeley, Haskell, Kearney, Meade, Scott, Seward and Wichita. The Executive Order was lifted 60 days later on August 10, but was renewed on August 22 although Hamilton was taken out of the warning and placed into the watch area. Finney and Scott were taken off the watch list. On August 2, the USDA issued an order implementing approval for emergency haying and grazing on Conservation Reserve Program (CRP) lands within the counties of Grant, Greeley, Hamilton, Haskell, Sherman, Stanton, Stevens and Wallace. Other major impacts of this drought period included decreased grain yields and lower wildlife survival rates. By August 26, the drought level returned to a moderate rating and from the end of October through December 30, levels were upgraded to abnormally dry. By the end of February 2009, the Southwestern and South Central counties were downgraded to a moderate rating, but by the end of March the level was upgraded to abnormally dry. This area grew to encompass the entire western two-thirds of the State. This rating persisted until April, when the abnormally dry conditions moved into North Central and Central Kansas. These conditions remained in roughly the same areas until late September. Between this time and the end of 2009, conditions were upgraded to a normal state. From January through mid-April of 2010, the State remained in a normal condition. Between April 13 and May 26, the South Central portion of the State downgraded to abnormally dry, but has since recovered to normal. As of June 1, 2010 the entire state is under normal drought conditions. A total of 35 drought related impacts were reported in Kansas during this time period, including: 12 agricultural, 4 fire, 3 water/energy, 2 environmental and 14 other.
October 2006: Kansas also experienced drought conditions in 2006. In October 2006, the U.S. Department of Agriculture designated 57 Kansas counties primary natural disaster areas because of losses caused by the combined effects of various disasters that occurred during the past year, including a late spring freeze, drought, high winds, and extreme temperatures. Eighteen contiguous counties were also eligible for assistance. Earlier that year, in June, Cherokee and Morton Counties were designated as primary disaster areas because of losses caused by drought, high winds, wildfires, and above normal temperatures. Contiguous counties Crawford, Labette, Stanton, and Stevens were also eligible for assistance. Two declarations in 2007 for 2006 made 15 more counties eligible for assistance as primary
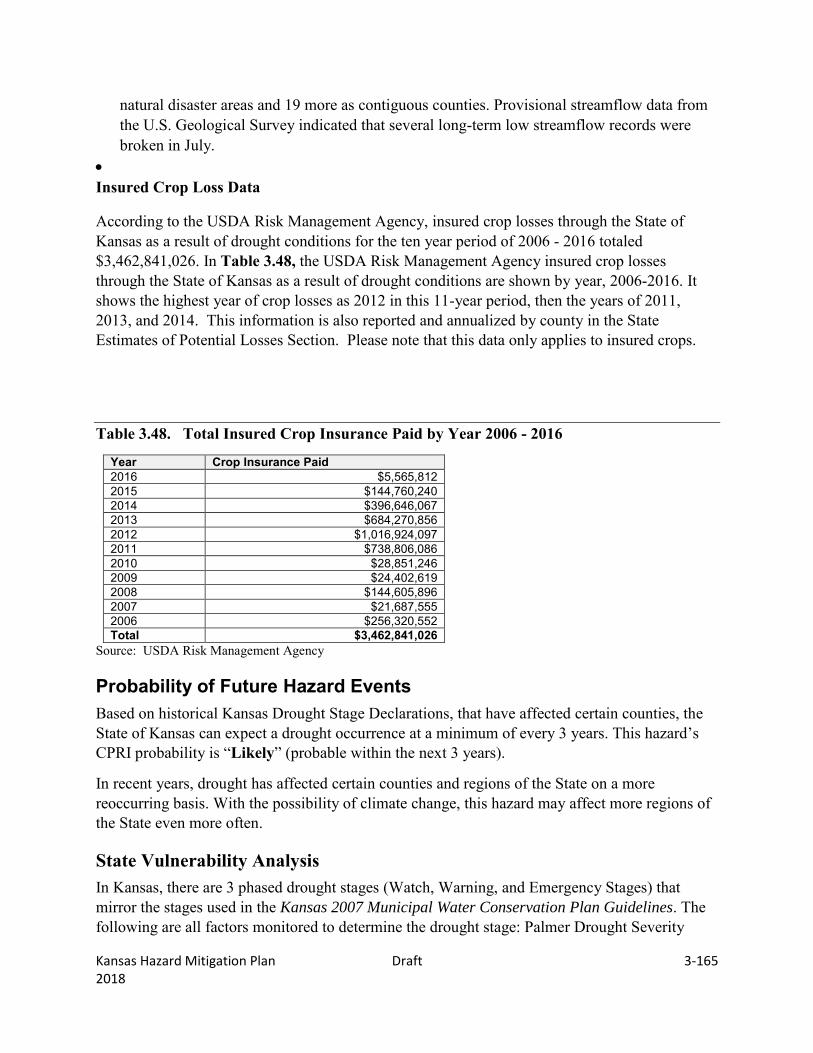
Kansas Hazard Mitigation Plan Draft 3-165 2018
natural disaster areas and 19 more as contiguous counties. Provisional streamflow data from the U.S. Geological Survey indicated that several long-term low streamflow records were broken in July.
Insured Crop Loss Data
According to the USDA Risk Management Agency, insured crop losses through the State of Kansas as a result of drought conditions for the ten year period of 2006 - 2016 totaled $3,462,841,026. In Table 3.48, the USDA Risk Management Agency insured crop losses through the State of Kansas as a result of drought conditions are shown by year, 2006-2016. It shows the highest year of crop losses as 2012 in this 11-year period, then the years of 2011, 2013, and 2014. This information is also reported and annualized by county in the State Estimates of Potential Losses Section. Please note that this data only applies to insured crops.
Table 3.48. Total Insured Crop Insurance Paid by Year 2006 - 2016
Year Crop Insurance Paid 2016 $5,565,812 2015 $144,760,240 2014 $396,646,067 2013 $684,270,856 2012 $1,016,924,097 2011 $738,806,086 2010 $28,851,246 2009 $24,402,619 2008 $144,605,896 2007 $21,687,555 2006 $256,320,552 Total $3,462,841,026
Source: USDA Risk Management Agency
Probability of Future Hazard Events Based on historical Kansas Drought Stage Declarations, that have affected certain counties, the State of Kansas can expect a drought occurrence at a minimum of every 3 years. This hazard’s CPRI probability is “Likely” (probable within the next 3 years).
In recent years, drought has affected certain counties and regions of the State on a more reoccurring basis. With the possibility of climate change, this hazard may affect more regions of the State even more often.
State Vulnerability Analysis In Kansas, there are 3 phased drought stages (Watch, Warning, and Emergency Stages) that mirror the stages used in the Kansas 2007 Municipal Water Conservation Plan Guidelines. The following are all factors monitored to determine the drought stage: Palmer Drought Severity

Kansas Hazard Mitigation Plan Draft 3-166 2018
Index, Standardized Precipitation Index, Percent of Normal Precipitation, Soil Moisture Percentile, Crop Moisture Index, Satellite Vegetative Health Index and the 7-Day Median Flow Percentile.
The stages identified consider impacts along with moisture/water resource conditions. Kansas drought response transitions from primarily local response under a Drought Watch, with increases in the State and Federal roles at the Drought Warning and Drought Emergency stages. Table 3.49 shows the drought stage descriptions and impacts as a combination of U.S. Drought Monitor and the Municipal Guidelines.
Table 3.49. Kansas Phased Drought Response Summary
Stage
U.S. Drought Monitor Description
Declared by Possible Impacts Response Summary
Drought Watch
Moderate Drought
Governor Some damage to crops and pastures; high rangeland fire danger, streams or reservoirs low, serious public water system shortage not imminent, but likelihood of shortages growing.
Governor notified by Kansas Water Office, Governor’s Drought Response Team activated, public notification, outdoor burning bans may be imposed; public water systems may implement Stage 1 Water Watch phase of municipal water conservation plan, Governor may request USDA disaster Declaration for drought.
Drought Warning
Severe Drought
Governor Crop or pasture losses likely; some stock water shortages; very high rangeland fire danger; public water system water shortages present; some streamflow targets not met.
Public water systems may implement Stage 2 Water Warning phase of municipal water conservation plan; Hay and Pasture Exchange activated; urgent surplus water contracts from state controlled storage authorized; Governor may request authorization for haying and grazing of Conservation Reserve Program acres; Governor may request USDA disaster declaration for drought.
Drought Emergency
Extreme and Exceptional Drought
Governor Crop or pasture losses likely; some stock water shortages; very high rangeland fire danger; public water system water shortages present; some streamflow targets not met. reservoir supplies low.
Governor may declare outdoor burning ban upon advice of Adjutant General; public water systems may implement Stage 3 Water Emergency phase of municipal water conservation plans; emergency surplus water contracts from state controlled storage authorized; emergency water withdrawals from USACE emergency water assistance; Governor may request Presidential disaster declaration and/or USDA disaster declaration for drought.
Source: Kansas Drought Operations Plan, Governors Drought Team, June 2012

Kansas Hazard Mitigation Plan Draft 3-167 2018
While the entire state is moderately susceptible to drought, some jurisdictions may be more at risk from drought based on such factors as the adequacy of their water supply system, dependence on agriculture, the potential adverse effects to nearby navigation and water-based recreation, and vulnerability to drought-related hazards such as expansive soils, wildfire and wind erosion. One of the most costly impacts of drought is the damage to foundations, parking lots, and other asphalt or concrete structures that are damaged as a result of the shrinking off soil that occurs along with drought, followed by the rapid swell that can occur when rains do come. Determining the direct and indirect costs associated with droughts is difficult because of the broad impacts of drought and the difficulty in establishing when droughts begin and end.
Drought can severely challenge a public water supplier through depletion of the raw water supply and greatly increased customer water demand. Even if the raw water supply remains adequate, problems due to limited treatment capacity or limited distribution system capacity may be encountered. In addition, the water for cropland and livestock can be greatly impacted. Some Regional Advisory Committees have set priorities for water supply goals in order to help combat climate change, infrastructure, and drought. Table 3.50 is broken down by these regions to show the water supply priorities that the regions in Kansas have come up with Figure 3.35 is a state-wide map of these regions. Links to the regions can be found at http://www.kwo.ks.gov/about-the/kwo/regional-advisory-committees.
Table 3.50. Kansas Regions Priority Goals
Watershed Goals Upper Republican – Regions A and B Develop & adopt a water conservation management
plan that provides maximum flexibility while reducing over actual use to extend the aquifer life and economic well-being. Phase in conservation measures to lessen economic impacts and allow user transition. Shall address all types of use while considering flexibility tools & overall actual reduction.
Upper Smoky Hill – Regions C and D By 2025, reduce irrigation use by 25% based on recent average pumping history per water right. Allow water right transfers & other flexibilities as long as a net reduction is achieved. In addition, annual water use for all irrigation users will not exceed net irrigation requirement for that county.
Upper Arkansas – Regions C and D Extend the usable life time of the Ogallala Aquifer for a t least 25 years in the planning region through the promotion of multiple Local Enhanced Management Areas (LEMAs), Water Conservation Areas (W CAs) & other incentive -based programs. Slow the depletion of the Ogallala Aquifer by 25% in 10 years in the planning region maximizing the opportunity to make use of emerging technologies. Encourage conservation through added flexibility. Find additional sources of water & a place to store water for irrigation & re-charge. Increase the opportunity to use waste water for
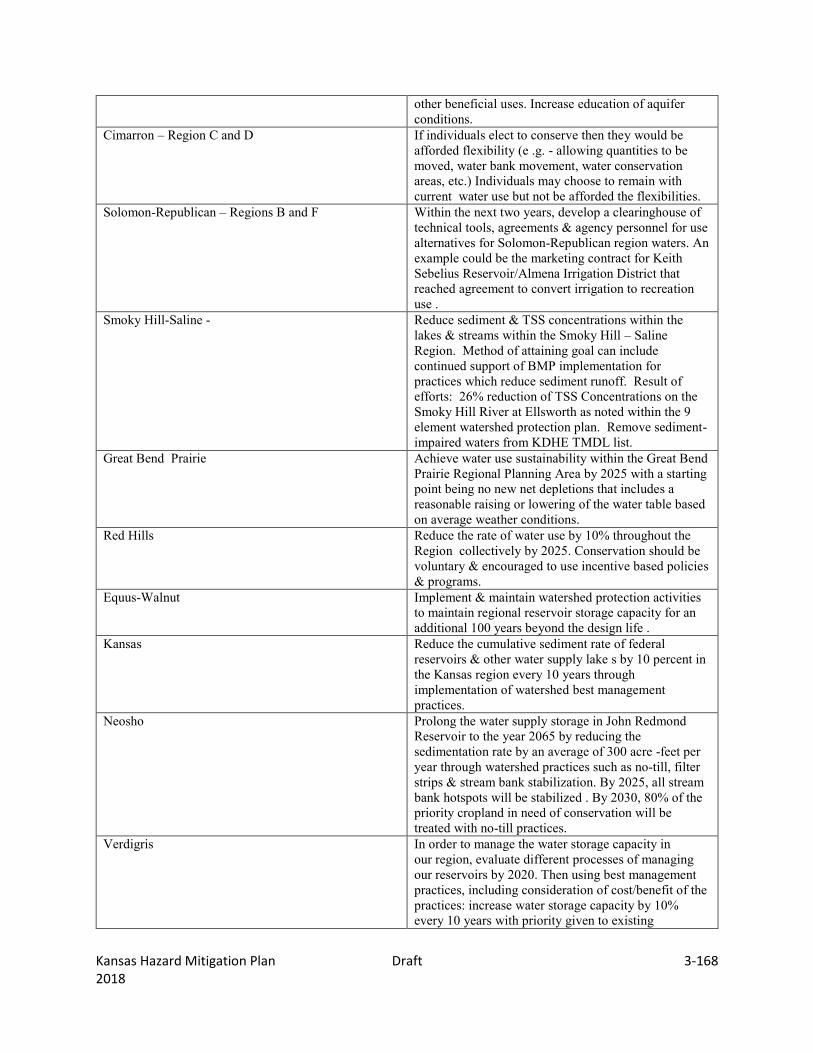
Kansas Hazard Mitigation Plan Draft 3-168 2018
other beneficial uses. Increase education of aquifer conditions.
Cimarron – Region C and D If individuals elect to conserve then they would be afforded flexibility (e .g. - allowing quantities to be moved, water bank movement, water conservation areas, etc.) Individuals may choose to remain with current water use but not be afforded the flexibilities.
Solomon-Republican – Regions B and F Within the next two years, develop a clearinghouse of technical tools, agreements & agency personnel for use alternatives for Solomon-Republican region waters. An example could be the marketing contract for Keith Sebelius Reservoir/Almena Irrigation District that reached agreement to convert irrigation to recreation use .
Smoky Hill-Saline - Reduce sediment & TSS concentrations within the lakes & streams within the Smoky Hill – Saline Region. Method of attaining goal can include continued support of BMP implementation for practices which reduce sediment runoff. Result of efforts: 26% reduction of TSS Concentrations on the Smoky Hill River at Ellsworth as noted within the 9 element watershed protection plan. Remove sediment-impaired waters from KDHE TMDL list.
Great Bend Prairie Achieve water use sustainability within the Great Bend Prairie Regional Planning Area by 2025 with a starting point being no new net depletions that includes a reasonable raising or lowering of the water table based on average weather conditions.
Red Hills Reduce the rate of water use by 10% throughout the Region collectively by 2025. Conservation should be voluntary & encouraged to use incentive based policies & programs.
Equus-Walnut Implement & maintain watershed protection activities to maintain regional reservoir storage capacity for an additional 100 years beyond the design life .
Kansas Reduce the cumulative sediment rate of federal reservoirs & other water supply lake s by 10 percent in the Kansas region every 10 years through implementation of watershed best management practices.
Neosho Prolong the water supply storage in John Redmond Reservoir to the year 2065 by reducing the sedimentation rate by an average of 300 acre -feet per year through watershed practices such as no-till, filter strips & stream bank stabilization. By 2025, all stream bank hotspots will be stabilized . By 2030, 80% of the priority cropland in need of conservation will be treated with no-till practices.
Verdigris In order to manage the water storage capacity in our region, evaluate different processes of managing our reservoirs by 2020. Then using best management practices, including consideration of cost/benefit of the practices: increase water storage capacity by 10% every 10 years with priority given to existing

Kansas Hazard Mitigation Plan Draft 3-169 2018
structures, & ensure water supply available from storage exceeds projected demand by at least 10% through the yea r 2050.
Marais Des Cygnes Reduce cumulative sediment loads entering public water supply impoundments by 10 percent in the Marais des Cygnes Rive r Ba sin every 10 years to extend the life of existing infrastructure .
Missouri Since ground water quality is not well known, compile existing & collect additional data over the next 5 years to establish a baseline . Within 3 years after the baseline is established , a plan to implement best management practice s will be developed to maintain & improve existing conditions. Monitoring & reevaluation of ground water quality conditions & should continue at 5 year intervals.
Source: Kansas Water Office
Figure 3.35. Kansas Water Regions
State Estimates of Potential Losses
Because agriculture is a major economic factor in Kansas, the following table reflects the crop losses by county for the period within its respective mitigation region. Note that the last full year of the drought that just ended was in 2015.

Kansas Hazard Mitigation Plan Draft 3-170 2018
Note: The KHMT approved the use of the 5 year period to reflect the change in the climate and more accurately depict changes in our state. This hazards ranking did not change due to this time period, but stayed the same. In the 2013 update the years 2002 – 2011 were used with a ranking result of 2.80 – medium planning significance. In 2018 the years 2011 – 2015 were used with a ranking result of 2.80 – medium planning significance.
Table 3.51 Sum of Crop Loss due to Drought for the Period 2011 – 2015
Region A County Acreage Affected for 5 Year
Period Sum of Crop Insurance Paid
for 5 Year Period Cheyenne 175,870 $22,813,931 Decatur 380,130 $60,626,388 Gove 331,695 $45,913,067 Logan 393,186 $51,885,725 Rawlins 433,868 $74,047,669 Sheridan 301,757 $44,430,801 Sherman 329,927 $59,020,693 Thomas 570,665 $97,837,488 Wallace 240,843 $33,899,764 Subtotal 3,157,941 $490,475,526
Region B Ellis 239,236 $26,622,045 Graham 284,193 $38,469,193 Ness 347,767 $33,298,991 Norton 333,859 $43,909,922 Phillips 365,583 $51,269,863 Rooks 273,449 $28,515,097 Rush 244,378 $22,705,137 Russell 165,690 $15,437,725 Trego 324,304 $42,005,368 Subtotal 2,578,459 $302,233,341
Region C Grant 273,326 $33,984,694 Greeley 574,469 $61,756,221 Hamilton 563,811 $67,409,908 Kearny 401,249 $44,383,250 Lane 377,142 $48,090,355 Morton 356,449 $38,915,638 Scott 505,210 $72,122,525 Stanton 388,381 $52,255,117 Stevens 265,845 $33,468,967 Wichita 426,866 $56,587,996
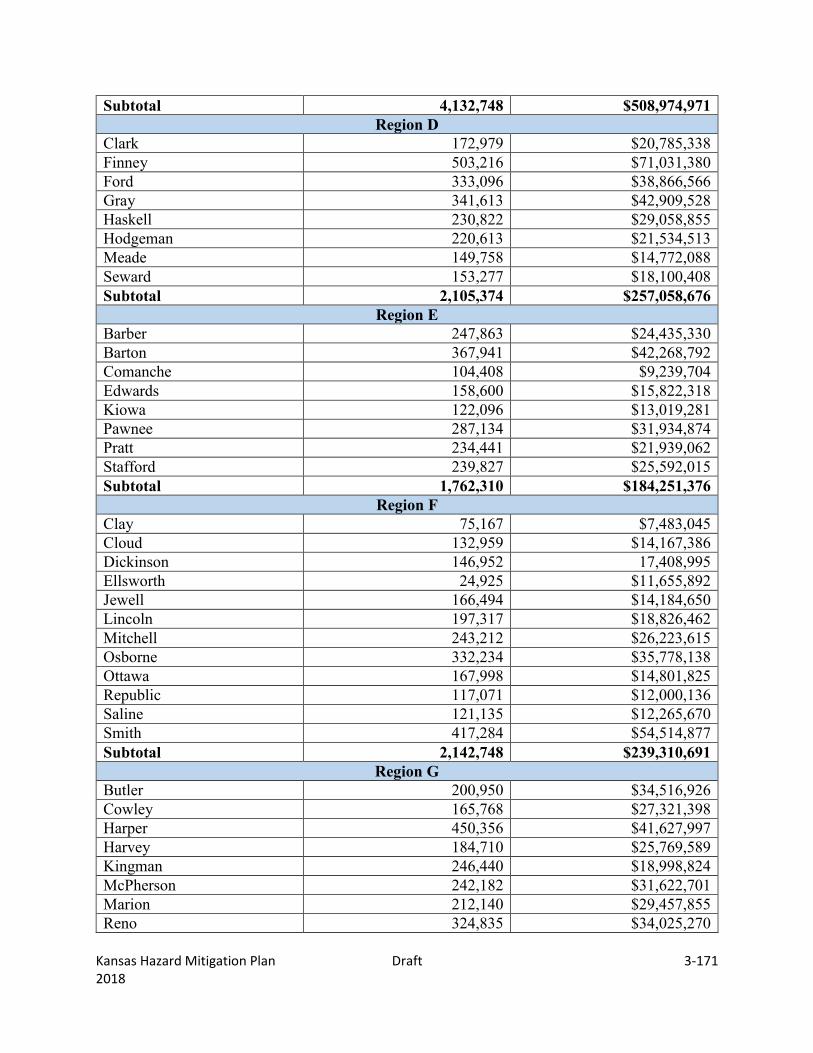
Kansas Hazard Mitigation Plan Draft 3-171 2018
Subtotal 4,132,748 $508,974,971 Region D
Clark 172,979 $20,785,338 Finney 503,216 $71,031,380 Ford 333,096 $38,866,566 Gray 341,613 $42,909,528 Haskell 230,822 $29,058,855 Hodgeman 220,613 $21,534,513 Meade 149,758 $14,772,088 Seward 153,277 $18,100,408 Subtotal 2,105,374 $257,058,676
Region E Barber 247,863 $24,435,330 Barton 367,941 $42,268,792 Comanche 104,408 $9,239,704 Edwards 158,600 $15,822,318 Kiowa 122,096 $13,019,281 Pawnee 287,134 $31,934,874 Pratt 234,441 $21,939,062 Stafford 239,827 $25,592,015 Subtotal 1,762,310 $184,251,376
Region F Clay 75,167 $7,483,045 Cloud 132,959 $14,167,386 Dickinson 146,952 17,408,995 Ellsworth 24,925 $11,655,892 Jewell 166,494 $14,184,650 Lincoln 197,317 $18,826,462 Mitchell 243,212 $26,223,615 Osborne 332,234 $35,778,138 Ottawa 167,998 $14,801,825 Republic 117,071 $12,000,136 Saline 121,135 $12,265,670 Smith 417,284 $54,514,877 Subtotal 2,142,748 $239,310,691
Region G Butler 200,950 $34,516,926 Cowley 165,768 $27,321,398 Harper 450,356 $41,627,997 Harvey 184,710 $25,769,589 Kingman 246,440 $18,998,824 McPherson 242,182 $31,622,701 Marion 212,140 $29,457,855 Reno 324,835 $34,025,270

Kansas Hazard Mitigation Plan Draft 3-172 2018
Rice 303,100 $37,757,635 Sedgwick 301,260 $36,661,577 Sumner 671,859 $77,073,119 Subtotal 3,303,600 $394,832,891
Region H Allen 135,792 $24,592,798 Bourbon 62,232 $9,157,163 Chautauqua 14,825 $2,081,064 Cherokee 227,611 $47,972,057 Crawford 164,638 $31,262,834 Elk 28,351 $4,315,721 Greenwood 55,047 $10,802,697 Labette 146,855 $26,692,794 Montgomery 113,396 $16,619,141 Neosho 108,969 $17,886,574 Wilson 138,378 $19,898,059 Woodson 84,787 $16,105,184 Subtotal 1,280,881 $227,386,086
Region I Chase 35,889 $5,507,868 Geary 21,208 $3,447,801 Lyon 115,574 $20,709,312 Morris 101,368 $16,021,176 Pottawatomie 41,483 $5,727,588 Riley 33,652 $3,199,799 Wabaunsee 63,829 $10,886,821 Subtotal 413,003 $65,500,365
Region J Anderson 170,631 $33,183,931 Coffey 123,142 $20,962,468 Franklin 109,960 $20,199,335 Linn 113,628 $17,406,582 Miami 82,867 $14,087,585 Osage 134,088 $22,783,797 Shawnee 43,579 $6,984,074 Subtotal 777,895 $135,607,772
Region K Atchison 90,489 $19,169,480 Brown 93,784 $16,656,849 Doniphan 57,986 $8,896,194 Douglas 53,228 $10,605,189 Jackson 74,450 $14,205,883 Jefferson 69,670 $15,104,649 Marshall 187,125 $20,201,384

Kansas Hazard Mitigation Plan Draft 3-173 2018
Nemaha 211,043 $34,290,736 Washington 143,160 $15,983,368 Subtotal 980,935 $155,113,732
Region L Johnson 51,464 $9,584,754 Leavenworth 23,943 $4,407,596 Wyandotte 2,425 $293,149 Subtotal 77,832 $14,285,499 Statewide Total 22,635,894 2,960,745,427
As shown above, during the last drought 2.9 billion dollars was paid out in insurance due to damages by drought. Agriculture is a major economic factor in the state of Kansas and drought can create economic distress. The above analysis only took into consideration crop loss data where insurance paid due to drought. It is difficult to determine the direct and indirect costs associated with droughts because of the broad impacts brought on by drought. However, according to the USDA Drought Report, Winter wheat conditions rated 13% very poor, 34% poor, 43% fair, 10% good, and 0% excellent, providing a narrow picture of the low levels of topsoil moisture in the State during April 2018.
The Kansas Vegetative Condition map (below) is produced by Kansas Applied Remote Sensing Program using satellite data. Areas in yellow, orange and red indicate areas of vegetative stress. Many of the areas shown as orange (warning) are wheat areas, indicating lack of growth of the wheat. Figure 3.35a shows the condition of vegetation in Kansas during April 2018.

Kansas Hazard Mitigation Plan Draft 3-174 2018
Figure 3.35a. Kansas Vegetation Condition Map, April 2, 2018
Source: http://kwo.ks.gov/docs/default-source/drought/rpt_04_endmarch2018_drought_032018_dk.pdf?sfvrsn=0
Development in Hazard Prone Areas
Areas that appear to be the most vulnerable to drought are the focus of the Governor’s Drought Response Team for planning, management and mitigation activities. While drought does not usually cause damage to buildings and critical facilities, work and living locations do affect people.
Also, as counties experience significant increases in population it will create greater demands on public water suppliers. Of the counties that were determined to be in the high vulnerability category to drought as a result of this analysis, none are in the top 10 Kansas Counties for population growth.
Consequence Analysis
Table 3.52. EMAP Consequence Analysis: Drought
Subject Ranking Impacts/Drought

Kansas Hazard Mitigation Plan Draft 3-175 2018
Health and Safety of Persons in the Area of the Incident Minimal - Moderate
Drought impact tends to be agricultural, however, because of the lack of precipitation that precipitates drought, water supply disruptions can occur which can affect people. Impact is expected to be minimal.
Responders Minimal With proper preparedness and protection, impact to the responders is expected to be minimal.
Continuity of Operations Minimal Minimal expectation for utilization of the COOP.
Property, Facilities, and Infrastructure Minimal to Severe
Impact to property, facilities, and infrastructure could be minimal to severe, depending on the length and intensity of the drought. Structural integrity of buildings, and buckling of roads could occur.
Delivery of Services Minimal
Impact on the delivery of services should be non-existent to minimal, unless transportation nodes are affected.
Environment Minimal to Severe
The impact to the environment could be severe. Drought can severely affect farming, ranching, wildlife and plants due to the lack of precipitation.
Economic Conditions Minimal to Moderate
Impacts to the economy will be dependent on how extreme the drought is and how long it lasts. Communities that depend on water recreation could be tested, as well as agricultural. Minimal to Moderate.
Public Confidence in Jurisdiction’s Governance Minimal
Confidence could be at issue during periods of extreme drought if planning is not in place to address intake needs and loss of agricultural crops.

Kansas Hazard Mitigation Plan Draft 3-176 2018
3.3.5. Earthquake Calculated Priority Risk Index Planning Significance 2.80 Moderate
Description/Location
Earthquakes are defined as shifts in the earth’s crust causing the surface to become unstable. The earth’s crust is made up of gigantic plates, commonly referred to as tectonic plates. These plates form what is known as the lithosphere, which varies in thickness from 6.5 miles (beneath oceans) to 40 miles (beneath mountain ranges), and has an average thickness of 20 miles. These plates “float over a partly melted layer of crust called the asthenosphere. The plates are in motion, and areas where one plate joins another are referred to as “plate boundaries.” Most earthquake faults occur along plate boundaries where plates push or pull the crust so much that the crust breaks.
Seismic waves are the vibrations from earthquakes that travel through the Earth; they are recorded on instruments called seismographs. Seismographs record a zig-zag trace that shows the varying amplitude of ground oscillations beneath the instrument. The Richter magnitude scale was developed in 1935 by Charles F. Richter of the California Institute of Technology as a mathematical device to compare the size of earthquakes. The magnitude of an earthquake is determined from the logarithm of the amplitude of waves recorded by seismographs. Adjustments are included for the variation in the distance between the various seismographs and the epicenter of the earthquakes. On the Richter Scale, magnitude is expressed in whole numbers and decimal fractions. For example, a magnitude 5.3 might be computed for a moderate earthquake, and a strong earthquake might be rated as magnitude 6.3. Because of the logarithmic basis of the scale, each whole number increase in magnitude represents a tenfold increase in measured amplitude; as an estimate of energy, each whole number step in the magnitude scale corresponds to the release of about 31 times more energy than the amount associated with the preceding whole number value.
Concerns about induced seismicity, or earthquake activity related to fracking, have been raised in some areas. Hydraulic fracturing or “fracking” is a method of enhancing oil and gas recovery from wells by injecting water, sand, and chemicals into rock formations under very high pressure to fracture the rock and release trapped hydrocarbons. According to the Kansas Geological Survey, researchers continue to study the increase in seismic activity that is triggered by human actions, such as the injection of saltwater-- extracted during oil and gas production—into deep wastewater disposal wells, (Kansas Geological Survey, Public Information (PIC)36.)
Earthquakes with magnitude of about 2.0 or less are usually called micro-earthquakes; they are not commonly felt by people and are generally recorded only on local seismographs. Events with magnitudes of about 4.5 or greater are strong enough to be recorded by sensitive seismographs

Kansas Hazard Mitigation Plan Draft 3-177 2018
all over the world. Great earthquakes, such as the 1964 Good Friday earthquake in Alaska, have magnitudes of 8.0 or higher.
The effect of an earthquake on the Earth's surface is called the intensity. The intensity scale consists of a series of certain key responses such as people awakening, movement of furniture, damage to chimneys, and finally - total destruction. Although numerous intensity scales have been developed over the last several hundred years to evaluate the effects of earthquakes, the one currently used in the United States is the Modified Mercalli (MM) Intensity Scale. It was developed in 1931 by the American seismologists Harry Wood and Frank Neumann. This scale, composed of 12 increasing levels of intensity that range from imperceptible shaking to catastrophic destruction, is designated by Roman numerals. It does not have a mathematical basis; instead it is an arbitrary ranking based on observed effects.
The Modified Mercalli Intensity value assigned to a specific site after an earthquake has a more meaningful measure of severity to the nonscientist than the magnitude because intensity refers to the effects actually experienced at that place.
The lower numbers of the intensity scale generally deal with the manner in which the earthquake is felt by people. The higher numbers of the scale are based on observed structural damage. Structural engineers usually contribute information for assigning intensity values of VIII or above.
The following is an abbreviated description of the 12 levels of Modified Mercalli intensity from the U.S. Geological Survey.
I. Not felt except by a very few under especially favorable conditions.
II. Felt only by a few persons at rest, especially on upper floors of buildings.
III. Felt quite noticeably by persons indoors, especially on upper floors of buildings. Many people do not recognize it as an earthquake. Standing motor cars may rock slightly. Vibrations similar to the passing of a truck. Duration estimated.
IV. Felt indoors by many, outdoors by few during the day. At night, some awakened. Dishes, windows, doors disturbed; walls make cracking sound. Sensation like heavy truck striking building. Standing motor cars rocked noticeably.
V. Felt by nearly everyone; many awakened. Some dishes, windows broken. Unstable objects overturned. Pendulum clocks may stop.
VI. Felt by all, many frightened. Some heavy furniture moved; a few instances of fallen plaster. Damage slight.

Kansas Hazard Mitigation Plan Draft 3-178 2018
VII. Damage negligible in buildings of good design and construction; slight to moderate in well-built ordinary structures; considerable damage in poorly built or badly designed structures; some chimneys broken.
VIII. Damage slight in specially designed structures; considerable damage in ordinary substantial buildings with partial collapse. Damage great in poorly built structures. Fall of chimneys, factory stacks, columns, monuments, walls. Heavy furniture overturned.
IX. Damage considerable in specially designed structures; well-designed frame structures thrown out of plumb. Damage great in substantial buildings, with partial collapse. Buildings shifted off foundations.
X. Some well-built wooden structures destroyed; most masonry and frame structures destroyed with foundations. Rails bent.
XI. Few, if any (masonry) structures remain standing. Bridges destroyed. Rails bent greatly.
XII. Damage total. Lines of sight and level are distorted. Objects thrown into the air.
In Kansas, a series of faults called the Humboldt Fault Zone runs through Riley and Pottawatomie Counties in north-central Kansas and extends to the south along the Nemaha Ridge (also known as the Nemaha Uplift) (see Figure 3.36).
Figure 3.36. Humboldt Fault Zone
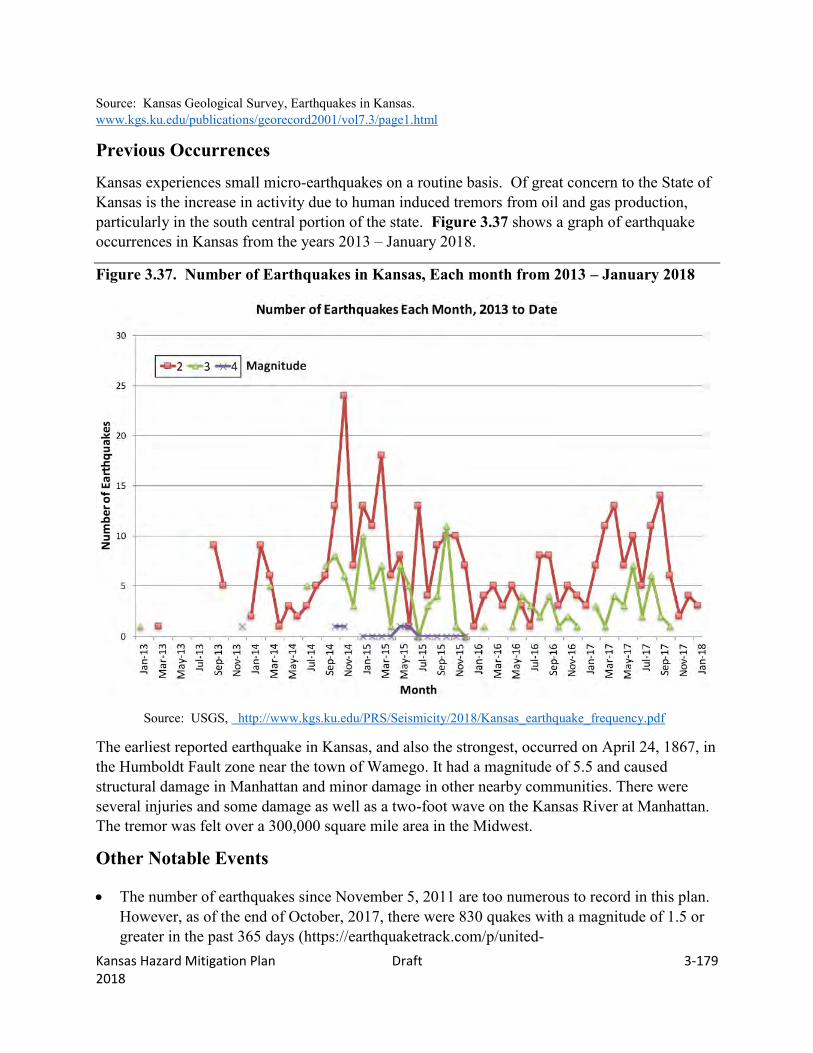
Kansas Hazard Mitigation Plan Draft 3-179 2018
Source: Kansas Geological Survey, Earthquakes in Kansas. www.kgs.ku.edu/publications/georecord2001/vol7.3/page1.html
Previous Occurrences
Kansas experiences small micro-earthquakes on a routine basis. Of great concern to the State of Kansas is the increase in activity due to human induced tremors from oil and gas production, particularly in the south central portion of the state. Figure 3.37 shows a graph of earthquake occurrences in Kansas from the years 2013 – January 2018.
Figure 3.37. Number of Earthquakes in Kansas, Each month from 2013 – January 2018
Source: USGS, http://www.kgs.ku.edu/PRS/Seismicity/2018/Kansas_earthquake_frequency.pdf
The earliest reported earthquake in Kansas, and also the strongest, occurred on April 24, 1867, in the Humboldt Fault zone near the town of Wamego. It had a magnitude of 5.5 and caused structural damage in Manhattan and minor damage in other nearby communities. There were several injuries and some damage as well as a two-foot wave on the Kansas River at Manhattan. The tremor was felt over a 300,000 square mile area in the Midwest.
Other Notable Events
The number of earthquakes since November 5, 2011 are too numerous to record in this plan. However, as of the end of October, 2017, there were 830 quakes with a magnitude of 1.5 or greater in the past 365 days (https://earthquaketrack.com/p/united-

Kansas Hazard Mitigation Plan Draft 3-180 2018
states/kansas/recent?mag_filter=2. Between January through June 2016 there were a recorded 1,858 earthquakes in 20 counties (see tan areas in Figure 3.37a) that are a total of micro earthquakes up to the highest magnitude recorded. Figure 3.37a. 1,858 Recorded Earthquakes in 20 Counties between January through June 2016
Source: https://earthquaketrack.com/p/united-states/kansas/recent Figure 3.37b shows a historic overview of Kansas Earthquakes. Figure 3.37b. Historic Overview of Kansas Earthquakes. 1867 – 2017

Kansas Hazard Mitigation Plan Draft 3-181 2018
November 5, 2011: A 5.6 magnitude earthquake, centered in Oklahoma, sent waves all the way up to KC. It was believed this quake was related to the Humboldt fault line.
January 1, 2008: A 2.7 magnitude earthquake registered with an epi-center 15 miles West of Arkansas City
March 23, 2007: A 3.1 magnitude earthquake struck 15 miles west southwest of Atchison. It was felt at Atchison and Norton.
July 24, 2001: A 3.0 magnitude earthquake in Butler County rattled computer screens at City Hall and shook several houses in Augusta. It occurred 24 miles above an area where four stems of the main Humboldt Fault line lie. It caused minor damage and injuries and was felt as far away as Dubuque, Iowa.
May 13, 1999: A 40-block section of KC was shaken by a 3.0 magnitude earthquake. About 100 people evacuated from Indian Springs Medical Building, which was damaged in the earthquake. The epicenter was in Kansas.
June 1989: A magnitude 4.0 earthquake shook Palco in Rooks County and did minor damage (this may have been human induced, e.g., mining-related).
November 9, 1968: A 5.3 magnitude earthquake centered in southern Illinois was felt in eastern Kansas.
April 13, 1961: With an epicenter in Kansas, this earthquake affected Norton County. January 6, 1956: This earthquake caused minor damage at Coats, Coldwater, Medicine
Lodge, and Wilmore. The damage was limited to loosened bricks, cracked plaster and chimneys, and objects knocked from walls and shelves. Many observers reported being shaken from their beds by the shock.
April 9, 1952: A damaging earthquake centered near El Reno, Oklahoma, affected a total area of 140,000 square miles, including the entire eastern half of Kansas. The magnitude 5.5 shock was felt in Kansas most strongly at Medicine Lodge. KC was also strongly affected.
February 20, 1933: A moderate earthquake was felt in Norton and Decatur Counties. Fall 1929: Four earthquakes with magnitudes between 3.2 and 4.2 occurred near Manhattan
between September 23 and December 7, 1929. March 18, 1927: An earthquake near White Cloud, in the extreme northeastern portion of
the State, rocked houses such that people rushed out of them. January 7, 1906: A magnitude 4.7 earthquake affected an area of about 10,000 square
miles in Kansas, Missouri, and Nebraska. Chimneys were thrown down and some cracks in walls were observed at Manhattan. Houses and buildings vibrated at Topeka, where a loud roaring sound was also heard. A series of small aftershocks were felt in Manhattan.
October 27, 1904: An earthquake shook the area around Dodge City and Meade, in western Kansas.
October 31, 1895: This earthquake near Charleston, Missouri, affected a million square miles over 23 states. The strongest effects in Kansas were reported in Topeka.
November 8, 1875: A moderate earthquake near Valley Falls north of Topeka was felt over 8,000 square miles but did little damage.

Kansas Hazard Mitigation Plan Draft 3-182 2018
Figure 3.38 shows all the earthquake locations for the years 2013 – 2017
Figure 3.38. Earthquakes in Kansas 2013 – 2017.
Source: Kansas Geological Survey, http://www.kgs.ku.edu/Geophysics/Earthquakes/map.html
Probability of Future Hazard Events
The highest recorded earthquake in Kansas was near Wamego in 1867and measured a 5.5 magnitude. During the period of 1977 and 1989 the Kansas Geological Survey measured more than 100 earthquakes, many too small to feel. Figure 3.39 shows a map of these micro-earthquakes between August1977 and August 1989. Beginning in 2013, Kansas saw an increase in seismic activity, particularly in the south-central part of the state, due to induced seismicity. . In 2017, Kansas had 830 recorded quakes in the previous 365 days. The probability of a future seismic event in Kansas is Highly Likely. While the probability is high, the magnitude of any activity in Kansas should not be any higher than what has been experienced to date. The State of Kansas has already begun the mitigation of earthquakes due to the sheer volume of them. While the probability remains highly likely, this could potentially change in coming years. Of note: The Kansas City Commission has issued two orders reducing the pressures and quantities allowed for certain areas as it pertains to underground injection/disposal of produced water (salt water). This mitigation action is also being enacted in Oklahoma. Following is the proactive approach the KCC is taking to reduce the risk:
The KCC issued an order in March 2015 that limited the volume of saltwater injections in five distinct “areas of concern” located in Harper and Sumner counties. (
Kansas Hazard Mitigation Plan Draft 3-183 2018
KCC staff monitored the effects of reduced saltwater injections on seismic activity in the area.
The Order also:
made operators verify the true vertical depths of the wells located inside the Areas of Concern,
instituted a daily injection report to be filed monthly for all large volume Arbuckle wells,
defined large volume as more than 5,000 barrels of water per day,
set a daily maximum injection level of 25,000 barrels per day for wells outside of the areas of concern within Harper and Sumner County.
After the initial 180 day period of reduced volume, the Commission extended the order for a further 180 days. Furthermore, after evidence of the mitigation effort working the KCC issued a second order:
While monitoring the effects of reduced saltwater injections after the initial Commission order, KCC staff noted a decrease in earthquakes that were 2.5 magnitude or larger in the “areas of concern”, but also noted an increase in smaller earthquakes outside of those areas.
In response, the Commission issued a second order in August 2016.
This second order extended limits beyond the five areas of concern to include parts of Harper, Sumner, Kingman, Sedgwick, and Barber counties.
However, the volume limits within the 5 original areas from the first Commission order remained in place.
The areas subject to the Second Order had a daily maximum injection limit of 16,000 barrels per day rather than the 25,000.
Results (as taken directly from the KCC website: http://kcc.ks.gov/oil-gas/induced-seismicity
In the two years since the Kansas Corporation Commission (KCC) issued its first order limiting saltwater injections in parts of the state, seismic activity has dropped from 1,967 earthquakes March 2015 through August 2015, to 668 earthquakes September 2016 through February 2017, a reduction of 66%. Kansas Corporation Staff filed these findings in a report published in March 2017. Figure 3.38a and Figure 3.38b shows the reduction in earthquakes between March 2015 and February 2017. Figure 3.39 reflects the Micro-earthquakes between 1977 – 1989, recorded by KGS.

Kansas Hazard Mitigation Plan Draft 3-184 2018
Figure 3.38a. March 2015 through August 2015
Figure 3.38b. September 2016 through February 2017

Kansas Hazard Mitigation Plan Draft 3-185 2018
Figure 3.39. Micro-earthquakes between 1977 – 1989, recorded by KGS.
Source: Kansas Geological Survey, http://www.kgs.ku.edu/Publications/pic3/pic3_1.html
Figure 3.40 below shows forecasted damage from natural and induced earthquakes according to the USGS.

Kansas Hazard Mitigation Plan Draft 3-186 2018
Figure 3.40. Forecasted Damage from Natural and Induced Earthquakes (USGS)
Source: USGS map, the Guardian article. https://www.theguardian.com/world/2016/mar/29/oklahoma-kansas-earthquake-risk-california-oil-gas-production#img-2
The map indicates that the heaviest damages to Kansas would be in the southern portion of the state, with a chance of damage at 5 – 10%.
Figure 3.41 and Figure 3.42 are probabilistic seismic hazard maps of Kansas from the U.S. Geological Survey that depict the probability that ground motion will reach a certain level during an earthquake. The data shows peak horizontal ground acceleration (the fastest measured change in speed for a particle at ground level that is moving horizontally because of an earthquake). Figure 3.41 depicts the shaking level that has a 10 percent chance of being exceeded over a period of 50 years. Figure 3.42, which is more of a worst-case scenario, depicts the shaking level that has a 2 percent chance of being exceeded over a period of 50 years. Typically, significant earthquake damage occurs when accelerations are greater than 30 percent of gravity.

Kansas Hazard Mitigation Plan Draft 3-187 2018
Figure 3.41. Kansas Seismic Hazard Map – 10% Probability of Exceedance in 50 Years
Source: USGS ftp://hazards.cr.usgs.gov/web/nshm/conterminous/2014/2014pga10pct.pdf
Figure 3.42. Kansas Seismic Hazard Map 2% Probability of Exceedance in 50 Years
Source: USGS ftp://hazards.cr.usgs.gov/web/nshm/conterminous/2014/2014pga2pct.pdf
State Vulnerability Analysis
Since 2013, Kansas has seen an increase in seismic activity, due in part to manmade activities in the oil and gas industry in the south-central portion of the state. Natural earthquakes in Kansas tend to be near the Humboldt Fault in north-central Kansas, particularly Riley and Pottawatomie Counties. A significant earthquake (maximum credible earthquake in the area is a magnitude 6.6) in this area could result in the failure of Tuttle Creek dam. Kansas is not expected to experience damaging shaking from a large New Madrid Seismic Zone event. The New Madrid Seismic Zone roughly follows the Mississippi River valley from southeastern Missouri to northwestern Mississippi. A large earthquake in this region could displace several thousand people and potentially lead to an influx into Kansas of victims fleeing the destruction.
While the overall number of quakes has increased, the magnitude of any activity remains relatively small.

Kansas Hazard Mitigation Plan Draft 3-188 2018
HAZUS 4.0 was used to analyze statewide vulnerability and estimate losses to earthquakes. HAZUS is a regional earthquake loss estimation model that was developed by FEMA and the National Institute of Building Sciences. This analysis used the default inventory data associated with the March 2017 release of HAZUS 4.0 which includes 2010 building valuations. A Probabilistic, 2,500 Year 6.7 Magnitude earthquake scenario was chosen to reveal areas of the State that are most vulnerable to this worst-case scenario event. These results are not meant to indicate annualized losses or damages as a result of a more “typical” low-magnitude event, but rather reveal vulnerabilities and losses for the worst-case scenario as well as help demonstrate which counties are most threatened by earthquakes and those most vulnerable to damage and loss.
The map in Figure 3.43 demonstrates the ground shaking potential of a worst-case scenario 2,500-year 6.7 Magnitude earthquake.

Kansas Hazard Mitigation Plan Draft 3-189 2018
Figure 3.43. Worst-Case 2500-Year, 6.7 Magnitude Earthquake Ground Shaking Potential
\

Kansas Hazard Mitigation Plan Draft 3-190 2018
Table 3.53 lists the counties by Mitigation Planning Region and indicates the shake zones that impact each county.
Table 3.53. Worst-Case 2500-Year, 6.7 Magnitude Earthquake Ground Shaking Potential for Each Kansas County by Mitigation Planning Region
County 0% to 2.0% PGA
2.1% - 4% PGA
4.0% - 6.0% PGA
Mitigation Planning Region A Cheyenne x
Decatur x x
Gove x x
Logan x
Rawlins x
Sheridan x x
Sherman x
Thomas x
Washington Subtotal 8 3 0
Mitigation Planning Region B Ellis x Graham x Ness x x Norton x Philips x x Rush x x Rooks x Russell x x Trego x x Subtotal 5 9 0
Mitigation Planning Region C Grant x x
Greeley x x
Hamilton x x
Kearney x
Lane x
Morton x
Scott x
Stanton x x
Stevens x
Wichita x Subtotal 10 4 0

Kansas Hazard Mitigation Plan Draft 3-191 2018
Mitigation Planning Region D Clark x x
Finney x
Ford x x
Gray x
Haskell x
Hodgeman x
Meade x x
Seward x x Subtotal 8 4 0
Mitigation Planning Region E Barber x x Barton x x
Comanche x
Edwards x x
Kiowa x x
Pawnee x x
Pratt x
Stafford x x Subtotal 6 7 1
Mitigation Planning Region F Clay x Cloud x Dickinson x x Ellsworth x
Jewell x
Lincoln x
Mitchell x
Osborne x x Ottawa x Republic x Saline x Smith x x Subtotal 12 3 0
Mitigation Planning Region G Butler x x Cowley x Harper x x Harvey x x Kingman x Marion x x McPherson x

Kansas Hazard Mitigation Plan Draft 3-192 2018
Reno x x Rice x
Sedgwick x Sumner x x Subtotal 6 9 2
Mitigation Planning Region H Allen x Bourbon x Chautauqua x
Cherokee x Crawford x Elk x
Greenwood x
Labette x Montgomery x Neosho x Wilson x
Woodson x Subtotal 0 12 0
Mitigation Planning Region I Chase x x Geary x
Lyon x Morris x
Pottawatomie x
Riley x x
Wabaunsee x Subtotal 2 7 0
Mitigation Planning Region J Anderson x Coffey x Franklin x Linn x Miami x Osage x Shawnee x Subtotal 0 7 0
Mitigation Planning Region K Atchison x Brown x Doniphan x Douglas x

Kansas Hazard Mitigation Plan Draft 3-193 2018
Jackson x
Jefferson x Marshall x x
Nemaha x x
Washington x Subtotal 3 8 0
Mitigation Planning Region L Johnson x Leavenworth x Wyandotte x Subtotal 0 3 0
The Mitigation Planning Regions with Counties in the highest shake zone are G and E.
State Estimates of Potential Losses
Although the areas of the State that are most vulnerable to a natural earthquake are along the Humboldt fault, losses would be greater in terms of damages in areas of the State that have more development and larger populations. Although earthquake shaking would be less severe in some populated areas, the damages may be greater due to more buildings and populations in those areas.
Table 3.54 below provides estimated building losses and displaced households for all counties in Kansas (reported by Mitigation Planning Region ) as a result of a 2,500 year probabilistic 6.7 Magnitude earthquake. Of note, just because the displaced household is less than 1 does not negate damages. For instance, .9 is less than 1 but there could be damages. Table 3.55 shows the top 10 counties in terms of building damage. Figure 3.43a That follows shows how the losses vary in terms of the jurisdictions most vulnerable to building damage. Similarly, Figure 3.43b shows estimates of displaced households across the State and Table 3.56 shows the top 10 counties in terms of displaced households. Again, it should be noted that these losses are for an absolute worst-case scenario event. Analyzing these results in terms of losses relative to one part of the State versus another may be more valuable than the actual dollar losses and number of displaced households.

Kansas Hazard Mitigation Plan Draft 3-194 2018
Table 3.54. Worst-Case 2,500 Year, 6.7 Magnitude Earthquake Total Building Loss and Displaced Households by County
County Total Earthquake Losses (1000s)
Displaced Households
Mitigation Planning Region A Cheyenne $878 <1 Decatur $1,117 <1
Gove $1,083 <1
Logan $1,058 <1
Rawlins $1,000 <1
Sheridan $1,000 <1
Sherman $2,305 1
Thomas $2,844 1 Wallace $645 <1 Subtotal $11,930 2+
Mitigation Planning Region B
Ellis $13,200 8 Graham $1,271 <1 Ness $1,567 <1 Norton $2,314 1 Phillips $2,230 <1 Rooks $4,445 <1 Rush $1,368 <1 Russell $3,017 1 Trego $1,305 <1 Subtotal $30,717 10+
Mitigation Planning Region C
Grant $3,114 1 Greeley $689 <1 Hamilton $997 <1 Kearny $1,068 <1 Lane $722 <1 Morton $1,827 <1 Scott $1,628 <1 Stanton $1,048 <1 Stevens $2,082 1 Wichita $778 <1 Subtotal $13,953 2+
Mitigation Planning Region D
Clark $1,104 <1 Finney $10,273 6 Ford $9,886 6 Gray $1,907 <1 Haskell $1,506 <1
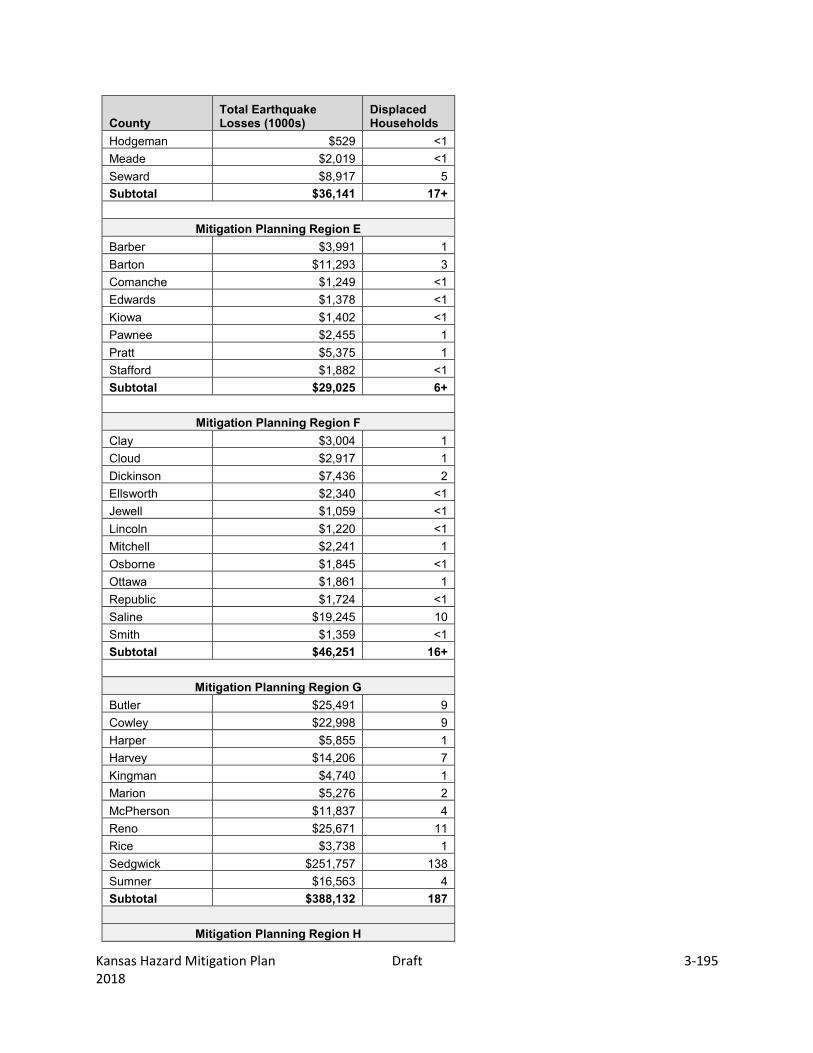
Kansas Hazard Mitigation Plan Draft 3-195 2018
County Total Earthquake Losses (1000s)
Displaced Households
Hodgeman $529 <1 Meade $2,019 <1 Seward $8,917 5 Subtotal $36,141 17+
Mitigation Planning Region E
Barber $3,991 1 Barton $11,293 3 Comanche $1,249 <1 Edwards $1,378 <1 Kiowa $1,402 <1 Pawnee $2,455 1 Pratt $5,375 1 Stafford $1,882 <1 Subtotal $29,025 6+
Mitigation Planning Region F
Clay $3,004 1 Cloud $2,917 1 Dickinson $7,436 2 Ellsworth $2,340 <1 Jewell $1,059 <1 Lincoln $1,220 <1 Mitchell $2,241 1 Osborne $1,845 <1 Ottawa $1,861 1 Republic $1,724 <1 Saline $19,245 10 Smith $1,359 <1 Subtotal $46,251 16+
Mitigation Planning Region G
Butler $25,491 9 Cowley $22,998 9 Harper $5,855 1 Harvey $14,206 7 Kingman $4,740 1 Marion $5,276 2 McPherson $11,837 4 Reno $25,671 11 Rice $3,738 1 Sedgwick $251,757 138 Sumner $16,563 4 Subtotal $388,132 187
Mitigation Planning Region H

Kansas Hazard Mitigation Plan Draft 3-196 2018
County Total Earthquake Losses (1000s)
Displaced Households
Allen $9,478 3 Bourbon $13,060 4 Chautauqua $3,120 <1 Cherokee $19,437 5 Crawford $37,916 17 Elk $1,621 1 Greenwood $3,629 1 Labette $16,384 6 Montgomery $27,324 11 Neosho $12,093 3 Wilson $6,784 2 Woodson $1,839 <1 Subtotal $152,685 53+
Mitigation Planning Region I
Chase $1,210 <1 Geary $11,442 10 Lyon $22,346 11 Morris $3,384 1 Pottawatomie $9,860 3 Riley $28,516 28 Wabaunsee $3,512 <1 Subtotal $80,270 53+
Mitigation Planning Region J
Anderson $5,252 1 Coffey $5,633 1 Franklin $15,569 6 Linn $6,952 1 Miami $20,820 8 Osage $8,331 3 Shawnee $112,570 64 Subtotal $175,127 84+
Mitigation Planning Region K
Atchison $10,463 3 Brown $4,916 2 Doniphan $4,090 1 Douglas $69,623 56 Jackson $6,530 2 Jefferson $10,176 2 Marshall $4,049 1 Nemaha $4,832 1 Washington $1,839 <1 Subtotal $116,518 68+

Kansas Hazard Mitigation Plan Draft 3-197 2018
County Total Earthquake Losses (1000s)
Displaced Households
Mitigation Planning Region L Johnson $430,715 228 Leavenworth $39,141 17 Wyandotte $110,331 56 Subtotal $580,187 301
Statewide Total $1,660,936 ~799+

Kansas Hazard Mitigation Plan Draft 3-198 2018
Figure 3.43a Worst-Case 2,500 Year, 6.7 Magnitude Earthquake Total Building Loss by County-Map ($1000s)

Kansas Hazard Mitigation Plan Draft 3-199 2018
Table 3.55. Worst-Case 2,500 Year, 6.7 Magnitude Earthquake Top 10 Counties by Total Building Loss (1000s)
Mitigation Planning Region County
Total Earthquake Losses (1000s)
L Johnson $430,715
G Sedgwick $251,757
J Shawnee $112,570
L Wyandotte $110,331
K Douglas $69,623
L Leavenworth $39,141
H Crawford $37,916
I Riley $28,516
H Montgomery $27,324
G Reno $25,671

Kansas Hazard Mitigation Plan Draft 3-200 2018
Figure 3.43b Worst-Case 2,500 Year, 6.7 Magnitude Earthquake Displaced Household

Kansas Hazard Mitigation Plan Draft 3-201 2018
Table 3.56. Worst-Case 2,500 Year, 6.7 Magnitude Earthquake Top 10 Counties by Displaced Households
Mitigation Planning Region County Displaced Households
L Johnson 228
G Sedgwick 138
J Shawnee 64
L Wyandotte 56
K Douglas 56
I Riley 28
L Leavenworth 17
H Crawford 17
H Montgomery 11
G Reno 11
Development in Hazard Prone Areas
Growing counties in northeastern Kansas indicate that potentially more property and people will be at risk to earthquake shaking. Johnson, Sedgwick, and Douglas counties are in the top 10 counties for population growth, exposing more people and structures to potential earthquake consequences.
Although the probability of a significant damaging earthquake is unlikely, the presence of the Humboldt fault and historical occurrences along this fault indicate that the potential does exist. Communities in more earthquake prone areas of the State may wish to adopt seismic design standards for new development, particularly for critical and essential facilities to minimize impact.
Hazard Consequence Analysis
The information in Table 3.57 provides the Consequence Analysis of Potential for Detrimental Impacts of Hazards done for accreditation with the Emergency Management Accreditation Program (EMAP).
Table 3.57. EMAP Consequence Analysis: Earthquake
Subject Ranking Impacts/Earthquake
Health and Safety of Persons in the Area of the Incident
Minimal Impact in the incident area expected to be minimal in the State of Kansas.
Responders Minimal With proper preparedness and protection, impact to the responders is expected to be non-existent to minimal.
Continuity of Operations Minimal COOP is not expected to be activated (minimal).
Property, Facilities, and Infrastructure
Minimal Impact to property, facilities, and infrastructure could be minimal. Facilities,

Kansas Hazard Mitigation Plan Draft 3-202 2018
Infrastructure, and personnel could be minimally affected.
Delivery of Services Minimal No expectation of impact on services (minimal).
Environment Minimal depending on whether it is a natural or induced earthquake. Induced could have moderate – severe damage.
No expectation of environmental impact (minimal). Induced earthquake due to wastewater injections could potentially pollute drinking wells, underground water sources, etc. This could be moderate to severe in consequence.
Economic Conditions Minimal No expectation of economic conditions being impacted (minimal).
Public Confidence in Jurisdiction’s Governance
Minimal No change in confidence in jurisdictions governance (minimal).

Kansas Hazard Mitigation Plan Draft 3-203 2018
3.3.6. Expansive Soils Calculated Priority Risk Index Planning Significance
2.65 Moderate
Description/Location
A relatively widespread geologic hazard for Kansas is the presence of soils that expand and shrink in relation to their water content. Expansive soils can cause physical damage to building foundations, roadways, and other components of the infrastructure when clay soils swell and shrink as a result of changes in moisture content. For Kansas, the vulnerability to this hazard most frequently is associated with soils shrinking during periods of drought.
Thirty-six states have expansive soils within their jurisdiction. Expansive soils are so extensive within parts of the United States that alteration of the highway routes to avoid expansive soils is virtually impossible. The Midwest is particularly problematic for construction because of the varied mixture of clay soils. Each year in the United States, expansive soils cause billions of dollars in damage to buildings, roads, pipelines, and other structures. This is more damage than that typically caused by floods, hurricanes, tornadoes, and earthquakes combined. It is estimated that approximately 10 percent of the homes built on expansive soils experience significant damage. Because there is limited available data on this hazard and no reported occurrences, the previous plan’s assessment remains valid and will be applicable for the 2018 update.
Location
Expansive soils are a moderate risk that is largely uniform across the State. Related hazard events are correlated with periods of drought in eastern Kansas and heavy rainfall in western Kansas. However, Developed and developing communities in Kansas in the areas of high clay content soils, which commonly experience fluctuations in the water table, are probably the most vulnerable to expansive soils. The distribution of clay soils is an indication of the extent of the vulnerability to this hazard in the State. As shown in Figure 3.44, nearly all of the State has clay containing soils with at least a slight potential for swelling and shrinking that could damage building foundations, roadways, and similar properties. The map indicates that the locations in the State with the soils having the higher swelling potential exist in the western and central counties.

Kansas Hazard Mitigation Plan Draft 3-204 2018
Figure 3.44. Area of Kansas Vulnerable to Expansive Soils
Source: U.S. Geological Survey publication, http://arcvoid.com/surevoid_web/soil_maps/ks.html
Previous Occurrences
Highways, airport runways, streets, walkways, and parking lots with layers of concrete and asphalt throughout the State are damaged every year by the effects of expansive soils. The frequency of damage from expansive soils can be associated with the cycles of drought and heavy rainfall, which reflect changes in moisture content. Building settlements associated with drought have been noted in Kansas for many years, particularly in buildings located on high ground, further from the water table.
The drought in Kansas that ended in 2016 has likely been the worst for home foundations since the late 1950s drought. Homes from the Dakotas through Louisiana fared the worst, but damage to foundations from drought has been reported in 40 of the contiguous U.S. Cost estimates for all drought damages, according to NCEI, were in the billions when taking in all the states that experienced the drought.
There are no expansive soil events on record in the State of Kansas to date. There is some data pertaining to expansive soil events around Kansas City, Missouri. That information is detailed below.
1985: Expansive Soil Event - movement in expansive shales caused damage to St. Teresa’s Academy, the 7th Church of Christ, the Kansas City Public Library Country Club Plaza Branch, and the University Center at the University of Missouri, all in Kansas City, Missouri.

Kansas Hazard Mitigation Plan Draft 3-205 2018
1950: Expansive Soil Event - Many homes and buildings in the Kansas City metropolitan area experienced minor damage as a result of the 1950s’ drought. Up to 65 percent of the homes were damaged at an estimated cost of $30-$40 million.
Probability of Future Hazard Events
Due to the widespread distribution of soils and dry/wet cycles in Kansas, this hazard’s CPRI probability (for a damaging swelling soils event) is “Highly Likely” within the next three years.
State Vulnerability Analysis
Expansive Soils is a hazard that develops gradually, and seldom presents a threat to life. Structures, especially houses and one-story commercial buildings are more susceptible to be damaged by this hazard due to the expansion of swelling clays than are multi-story buildings, which are normally heavy enough that they counter swelling pressures.
State Estimates of Potential Losses
A dollar amount for damages is difficult to ascertain to this particular hazard because very little incident record keeping is done. While some counties in Kansas are at a higher risk to expansive soils than others, damage is normally in the form of highways, parking lots, and walkways. Any damages assigned to expansive soils is normally mitigated with modern construction practices.
Development in Hazard Prone Areas
Soil engineers and engineering geologists test soils for swell potential when designing a building's foundation. Simple observation often can reveal the presence of expansive soils and can make recommendations for septic systems, grading, earth support, drainage, foundation design, concrete slab on grade construction and site remediation.
Consequence Analysis
Even though expansive soils cause enormous amounts of damage to buildings and infrastructure most people have never heard of them. This is because their damage is done slowly and cannot be attributed to a specific event. The damage done by expansive soils is then attributed to poor construction practices or a misconception that all buildings experience this type of damage as they age.
The information in Table 3.58 provides the Consequence Analysis of Potential for Detrimental Impacts of Hazards done for accreditation with the Emergency Management Accreditation Program (EMAP).
Table 3.58 EMAP Consequence Analysis: Expansive Soils
Subject Ranking Impacts/Expansive Soils Health and Safety of Persons in the Area of the Incident Minimal Minimal impact. Responders Minimal Minimal impact.

Kansas Hazard Mitigation Plan Draft 3-206 2018
Continuity of Operations Minimal
Minimal expectation for utilization of the COOP unless facility structures have extensive damage.
Property, Facilities, and Infrastructure Minimal to Moderate
Localized impact could be moderate as it relates to property, facilities, and infrastructure. Expansive soils could cause structural integrity to be lost, and roadways, railways, etc., to buckle.
Delivery of Services Minimal
Delivery of services could be impacted if roadways, railways, and all other infrastructure is impacted (minimal).
Environment Moderate
Expansive soils could cause moderate damage to the environment, particularly dams, levees, watersheds, etc.
Economic Conditions Minimal to Moderate
The impact to the economy is with the rebuilding of the property, facility, and infrastructure issues that expansive soils cause. During years of drought and extreme rain events the damage could be moderate.
Public Confidence in Jurisdiction’s Governance Minimal
Confidence will be dependent on development trends and mitigation efforts at reducing the effect of expansive soils on new construction and roadways (minimal).

Kansas Hazard Mitigation Plan Draft 3-207 2018
3.3.7. Extreme Temperatures Calculated Priority Risk Index Planning Significance
2.40 Moderate
Description/Location
Extreme temperature events, both hot and cold, can have severe impacts in Kansas on human morbidity and mortality, natural ecosystems, agriculture, and other economic sectors.
Heat
According to the Environmental Protection Agency (EPA), between 1979 and 2014, deaths as a direct result of exposure to heat, exceeded 9,000 people. In Kansas, between the years 2010 – 2015 there was an average of 8 deaths per year following exposure to natural heat. The risk factors included: advanced age, co-morbidities, low socio economic level, social isolation, and alcohol and substance abuse. Men and the elderly were more likely than others to die of heat illness. Figure 3.45 shows a graph reflecting heat related deaths by age group and sex for the years 2010 – 2014 in Kansas.
Figure 3.45. Heat-Related Deaths by Age Group and Sex, Kansas 2010-2014
Source: Kansas Department Health and Environment (KDHE), http://www.kdheks.gov/epi/download/newsletter/EpiUpdatesMarch2015.pdf
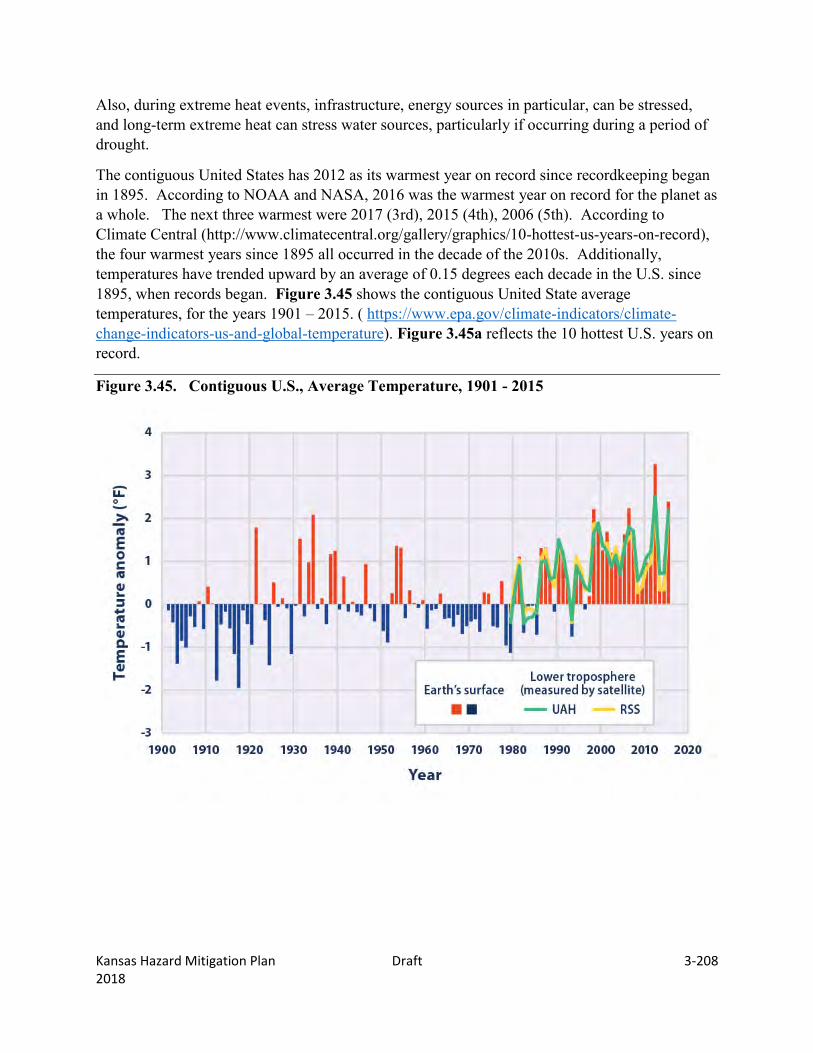
Kansas Hazard Mitigation Plan Draft 3-208 2018
Also, during extreme heat events, infrastructure, energy sources in particular, can be stressed, and long-term extreme heat can stress water sources, particularly if occurring during a period of drought.
The contiguous United States has 2012 as its warmest year on record since recordkeeping began in 1895. According to NOAA and NASA, 2016 was the warmest year on record for the planet as a whole. The next three warmest were 2017 (3rd), 2015 (4th), 2006 (5th). According to Climate Central (http://www.climatecentral.org/gallery/graphics/10-hottest-us-years-on-record), the four warmest years since 1895 all occurred in the decade of the 2010s. Additionally, temperatures have trended upward by an average of 0.15 degrees each decade in the U.S. since 1895, when records began. Figure 3.45 shows the contiguous United State average temperatures, for the years 1901 – 2015. ( https://www.epa.gov/climate-indicators/climate-change-indicators-us-and-global-temperature). Figure 3.45a reflects the 10 hottest U.S. years on record.
Figure 3.45. Contiguous U.S., Average Temperature, 1901 - 2015

Kansas Hazard Mitigation Plan Draft 3-209 2018
Figure 3.45a. 10 Hottest Years on Record in the Contiguous United States
http://www.climatecentral.org/gallery/graphics/10-hottest-us-years-on-record
According to information provided by FEMA, extreme heat is defined as temperatures that hover 10 degrees or more above the average high temperature for the region and last for several weeks. Ambient air temperature is one component of heat conditions, with relative humidity being the other. The relationship of these factors creates what is known as the apparent temperature. The Heat Index chart shown in Figure 3.46 uses both of these factors to produce a guide for the apparent temperature or relative intensity of heat conditions.
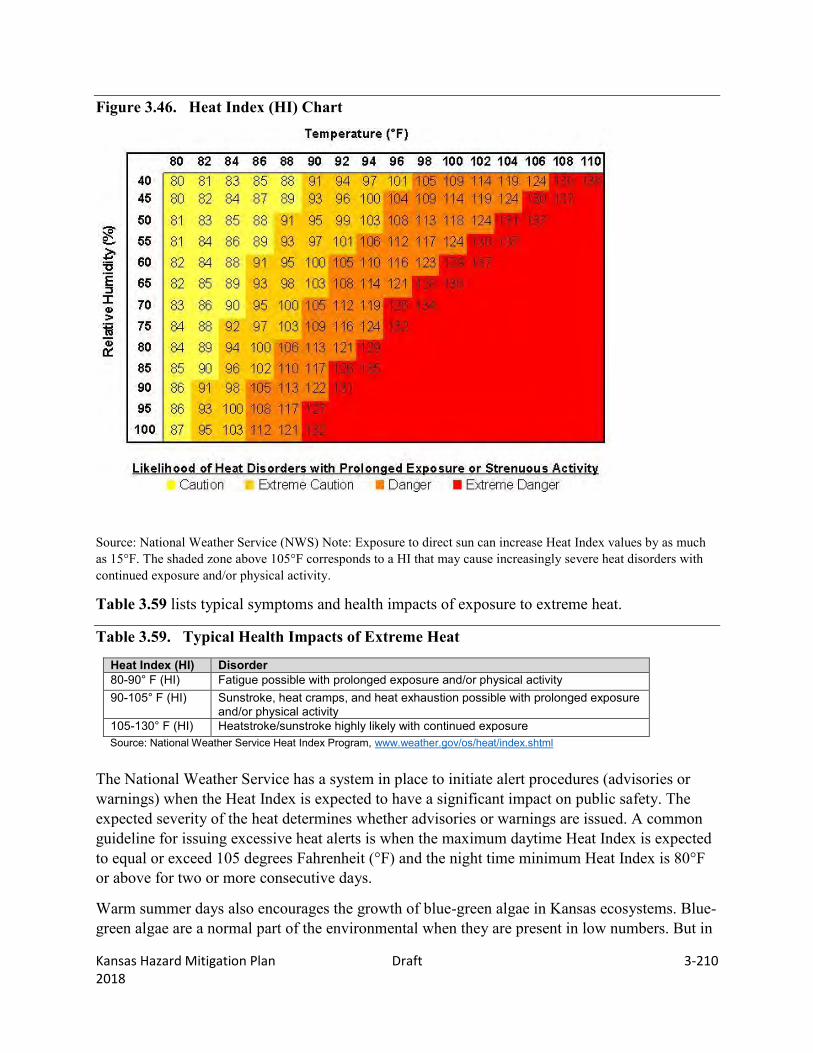
Kansas Hazard Mitigation Plan Draft 3-210 2018
Figure 3.46. Heat Index (HI) Chart
Source: National Weather Service (NWS) Note: Exposure to direct sun can increase Heat Index values by as much as 15°F. The shaded zone above 105°F corresponds to a HI that may cause increasingly severe heat disorders with continued exposure and/or physical activity.
Table 3.59 lists typical symptoms and health impacts of exposure to extreme heat.
Table 3.59. Typical Health Impacts of Extreme Heat
Heat Index (HI) Disorder 80-90° F (HI) Fatigue possible with prolonged exposure and/or physical activity 90-105° F (HI) Sunstroke, heat cramps, and heat exhaustion possible with prolonged exposure
and/or physical activity 105-130° F (HI) Heatstroke/sunstroke highly likely with continued exposure Source: National Weather Service Heat Index Program, www.weather.gov/os/heat/index.shtml
The National Weather Service has a system in place to initiate alert procedures (advisories or warnings) when the Heat Index is expected to have a significant impact on public safety. The expected severity of the heat determines whether advisories or warnings are issued. A common guideline for issuing excessive heat alerts is when the maximum daytime Heat Index is expected to equal or exceed 105 degrees Fahrenheit (°F) and the night time minimum Heat Index is 80°F or above for two or more consecutive days.
Warm summer days also encourages the growth of blue-green algae in Kansas ecosystems. Blue-green algae are a normal part of the environmental when they are present in low numbers. But in

Kansas Hazard Mitigation Plan Draft 3-211 2018
the summer heat, these blooms grow very quickly to extreme numbers and produce chemical compounds which are toxic to warm-blooded creatures (people, pets and livestock),and some are toxic to other organisms like fish; making consumption of fish hazardous. The biggest risk to health comes from coming into contact with or ingesting the toxins produced by the algae while engaging in what is called “full body contact” (during swimming, skiing or jet skiing, for example), or from inhaling spray cast up from the water’s surface by recreational activities or by the wind. Blue-green algae can also cause dermatological symptoms with prolonged skin contact with water or wet clothes. Children and pets are most at risk while engaging in recreation in the water because they are more likely to accidently or intentionally swallow lake water. Pets can become ill after being exposed to spray, or even from eating dried algae along the shore or after licking algae from their fur. No antidote exists for any known algal toxin currently. This makes prevention the best option for protecting human and animal health during a bloom (source: Kansas Department of Health & Environment, http://www.kdheks.gov/algae-illness/index.htm). KDHE has notification levels and are determined by the concentration of harmful toxin(s) or concentration of cyanobacteria cell counts, as below:
Public Health Watch–
•Notifies public that a hazardous condition may exist
•Signs may be posted at all public access locations
•Water may be unsafe for humans/animals
•Discourage water contact
Public Health Warning–
•Notifies public that conditions are unsafe
•Signs will be posted at all public access locations
•Water contact should not occur
•All conditions of Public Health Watch remain in effect
Cold Extreme cold can cause hypothermia (an extreme lowering of the body’s temperature), frostbite and death. Infants and the elderly are particularly at risk, but anyone can be affected. In the United States. According to the CDC, during 2006 – 2010, 6.660 deaths of US residents were attributed to excessive natural cold, hypothermia, or both. According to the Kansas Department of Health and Environment, between the years 2010 and 2015, 86 Kansas residents died due to hypothermia. In figure 3.47, Cold-related deaths by age are shown. Most at risk in the population are the 65 and older group with an estimated 55 deaths per millions of people, and men are more at risk than women.

Kansas Hazard Mitigation Plan Draft 3-212 2018
Figure 3.47. Crude Death Rates for Weather-Related Mortality, by age: United States, 2006-2010
Also at risk are those without shelters, who are stranded, or who live in a home that is poorly insulated or without heat. Other impacts of extreme cold include asphyxiation (unconsciousness or death from a lack of oxygen) from toxic fumes from emergency heaters; household fires, which can be caused by fireplaces and emergency heaters; and frozen/burst water pipes.
Wind can greatly amplify the impact of cold ambient air temperatures. Provided by the National Weather Service, Figure 3.48 below shows the relationship of wind speed to apparent temperature and typical time periods for the onset of frostbite. The combination of these elements affects the wind chill factor. The wind chill factor is the perceived temperature. As the speed of wind increases, the skin temperature drops as the heat is carried away from the body. As the perceived temperature increases, the risk of frostbite and hypothermia increases.

Kansas Hazard Mitigation Plan Draft 3-213 2018
3.48. Wind Chill Chart
Source: National Weather Service
All of Kansas is susceptible to extreme temperatures. The heat risk to humans is generally uniform across the State but may be slightly higher in the east because of a relatively higher heat index.
Previous Occurrences
Since 1980, there were a number of major extreme temperature events that have caused death and damage in the Central United States, including Kansas. From June to September 1980, approximately 10,000 people died from heat-related conditions. Agricultural and related industries had an estimated $44 billion in damages. During a 1988 heat wave in the central United States, between 5,000 and 10,000 lives were lost to the heat, and the toll on agriculture was $56 billion. In July 1995, more than 1,000 people died in the heat wave that hit the Midwest.
For extreme heat, the Kansas Department of Health and Environment’s Kansas Environmental Public Health Tracking Program keeps records of the fatalities of Kansas residents. Between the years 2006 and 2015, there have been at least 95 fatalities of Kansas residents due to heat. The year of 2011 had the most recorded fatalities with 37.
Recorded temperatures in Kansas have ranged from –40 degrees °F (Lebanon, February 1905) to 121 degrees °F (Alton, July 1934). Temperature extremes for each month are shown in Table 3.60. Also of concern, ff the temperature does not drop overnight, it is more important in a global sense than the record highs. People, mainly those without air conditioning and crops need the temperature to drop during the overnight so that they can sustain the heat during the next day.

Kansas Hazard Mitigation Plan Draft 3-214 2018
Table 3.60. Kansas Temperature Extremes
Month Maximum °F Year Place Minimum °F Year Place
January 88 1967 Kinsley –35 1947 Centralia February 92 1981 Aetna –40 1905 Lebanon March 100 1910 Hugoton –25 1948 Oberlin* April 107 1989 Hays –2 1935 Dresden* May 108 1939 Ellsworth* 14 1909 Wallace June 116 1911 Clay Center* 30 1917 Irene* July 121 1936 Alton* 32 1880 Unknown August 119 1936 Wellington* 33 1910 St. Francis* September 117 1947 Lincoln 15 1984 Kirwin Dam October 104 1947 St. Francis –3 1917 Wallace November 96 1909 Kingman –20 1887 Monument December 90 1955 Ashland –34 1989 Atwood
Source: Information Please Database, Pearson Education, Inc. www.infoplease.com/ipa/A0930179.html * Also on earlier dates at the same time or other places.
Figure 3.49 (reserved)
Notable Extreme Temperature Events
17 Oct 2016 – Dodge City reached 100 degrees. This is the first recorded 100 degree temperature in October since 1874.
17 Dec 2016 – The counties of Sherman, Wallace, Cheyenne, Thomas, Logan, Norton, Gove, Rawlins, Wichita, Greeley, Sheridan, Decatur, Graham and Barber reported wind chills of 26 below zero, resulting in one death and one injury in Barber County.
6 Jan 2014 – Wind Chills in excess of 31 below zero were reported in most of Northeast Kansas.
Summer 2012: A large high pressure area settled over the Central High Plains resulting in high temperature records being tied or broken in Goodland, Hill City and other Kansas towns. In Topeka, the year of 2012 was ranked as the hottest on record. The average temperature from June through August was the 9th warmest on record and just a degree cooler than 2011. High temperatures averaged to be the 3rd warmest on record, trailing the Dust Bowl years of 1936 and 1934. Topeka had 24 days where the temperature was at least 100 degrees, which ties for the 6th most of any summer. The summer of 2012 was also the 3rd hottest summer on record for the contiguous U.S. since recordkeeping began in 1895. Only behind the summers of 2011 and 1936 have higher summer temperatures (source: National Weather Service, Goodland, KS http://www.crh.noaa.gov/news/display_cmsarchive.php?wfo=gld and Topeka, KS http://www.crh.noaa.gov/news/display_cmsarchive.php?wfo=top ).
Spring 2012: After experiencing the 5th warmest winter on record, with a three month average temperature of 38.4 degrees from December 1st to February 29th, Wichita went on to witness the warmest spring in the city`s 124-year climate history. Wichita`s average temperature from March 1st to May 31st, which is considered meteorological spring, was

Kansas Hazard Mitigation Plan Draft 3-215 2018
64.4 degrees. This torched the previous record of 59.9 degrees, recorded in 2006, by 4.5 degrees. The 64.4 degree average is an amazing 8.2 degrees above the 56.2 degree normal for spring (source: National Weather Service, Wichita, KS http://www.crh.noaa.gov/ict/scripts/archives.php?reqYear=2012 ).
Summer 2011: Central, south central and southeast Kansas experienced one of the hottest summers on record. The Wichita area had an average high of 101.2. This ranks as the fifth extreme July heat wave after 1980, 1854, 1936, and 1934. On September 1, 2011, Wichita set a new record for the most 100 degree days in a year surpassing 1936 (source: National Weather Service, Wichita, KS http://www.crh.noaa.gov/ict/scripts/archives.php?reqYear=2011).
January 7, 2010: An unusually cold Arctic air mass came across the area on January 6th and stayed through January 9th. This area has not seen a cold air mass like this since December 2005, and even February 1996 before that. Besides the cold temperatures, this Arctic air mass brought in very strong winds throughout the area on the evening of January 6th and on Thursday, January 7th. The strong winds combined with the very cold temperatures creating dangerous wind chills. Wind chills through this cold outbreak created dangerous situations for people, animals, and property that were outdoors for a long period of time. Several schools across the area were cancelled or delayed, waterline mains burst and slick driving conditions were reported.
December 9, 2009: Wind chill values of -25 to -30 Fahrenheit were common on the morning of the 9th across all of northwest Kansas, southwest Nebraska and eastern Colorado. Air temperatures of -5 to -15 F combined with north winds to produce dangerously low wind chill readings.
April 2007: The U.S. Department of Agriculture designated 68 Kansas counties primary natural disaster areas because of losses caused by unseasonably warm temperatures followed by prolonged freezing weather that occurred from April 4, 2007, through April 10, 2007. Fifteen contiguous counties were also eligible for assistance.
July 16-20, 2006: From July 16-20, a deadly heat wave gripped much of central, south-central, and eastern Kansas. Temperatures soared into the 105-110 °F range. Five lives were lost across south-central and southeast Kansas: three in Wichita, one in Iola, and another in Coffeyville. The heat unofficially claimed three other lives, two in Wichita and one in Coffeyville, and dozens of people across central, south-central, and southeast Kansas were treated for heat-related illnesses. For this particular year a total of 21 heat-related deaths were reported by the Kansas Department of Health and Environment. The same heat wave also caused two train derailments, which required rerouting of train traffic. The derailments were caused by “sun kinks”: the metal tracks expanded from the heat. One train derailed north of Topeka toward Atchison, and the other derailed immediately east of Neosho Rapids. The train that derailed near Neosho Rapids had five cars that contained hazardous materials; none of them was compromised. That same year, a late freeze damaged at least 75% of the wheat crop.

Kansas Hazard Mitigation Plan Draft 3-216 2018
In Table 3.61, the USDA Risk Management Agency insured crop losses through the State of Kansas as a result of heat and hot wind conditions, freeze and frost conditions. The total paid for extreme temperatures are $1,121,786,977 as shown here by year, 2006-2016. It shows the highest year of crop losses from heat as 2012. For freeze and frost, the highest year of crop losses was 2007. This information is also reported and annualized by county in Table 3.62 in the State Estimates of Potential Losses Section. Please note that this data only applies to insured crops. According to the 2016 Kansas Crop Insurance Profile Report issued by the USDA Risk Management Agency 88 percent of Kansas’ row crops were insured in 2015.
Table 3.61. Total Insured Crop Insurance Paid by Year, 2006 - 2016
Year Crop Insurance Paid for Heat & Hot Wind
Crop Insurance Paid for Freeze and Frost
Total Crop Insurance Paid for Extreme Temperatures
2016 $742,492 928,704 $1,671,196 2015 $11,662,872 16,221,891 $27,884,763 2014 $25,647,931 20,443,931 $46,091,862 2013 $66,418,467 82,503,431 $148,921,898 2012 $261,028,376 3,973,367 $265,001,743 2011 $243,893,940 1,425,217 $245,319,157 2010 $22,471,987 964,011 $23,435,998 2009 $4,003,615 30,537,672 $34,541,287 2008 $33,247,376 4,295,596 $37,542,972 2007 $7,768,633 242,077,499 $249,846,132 2006 $18,844,699 22,685,270 $41,529,969 Total $695,730,388 426,056,589 $1,121,786,977
Source: USDA Risk Management Agency
Probability of Future Hazard Events
Based on the number of prior events from 1980 – 2016, and the inclusion of 2017 as the 3rd hottest year on record, an extreme temperature event is “Likely” within the next three years. An extreme heat event is more likely to occur in the months of June, July, August, and September, and an extreme cold event is more likely to occur in the months of November, December, January, February, and March.
According to the CDC, rare heat events will become more common. Figure 3.50 shows the number of years expected between heat events if climate change stays on its projected path. Kansas is shown to have an extreme event every 2 – 4 years.
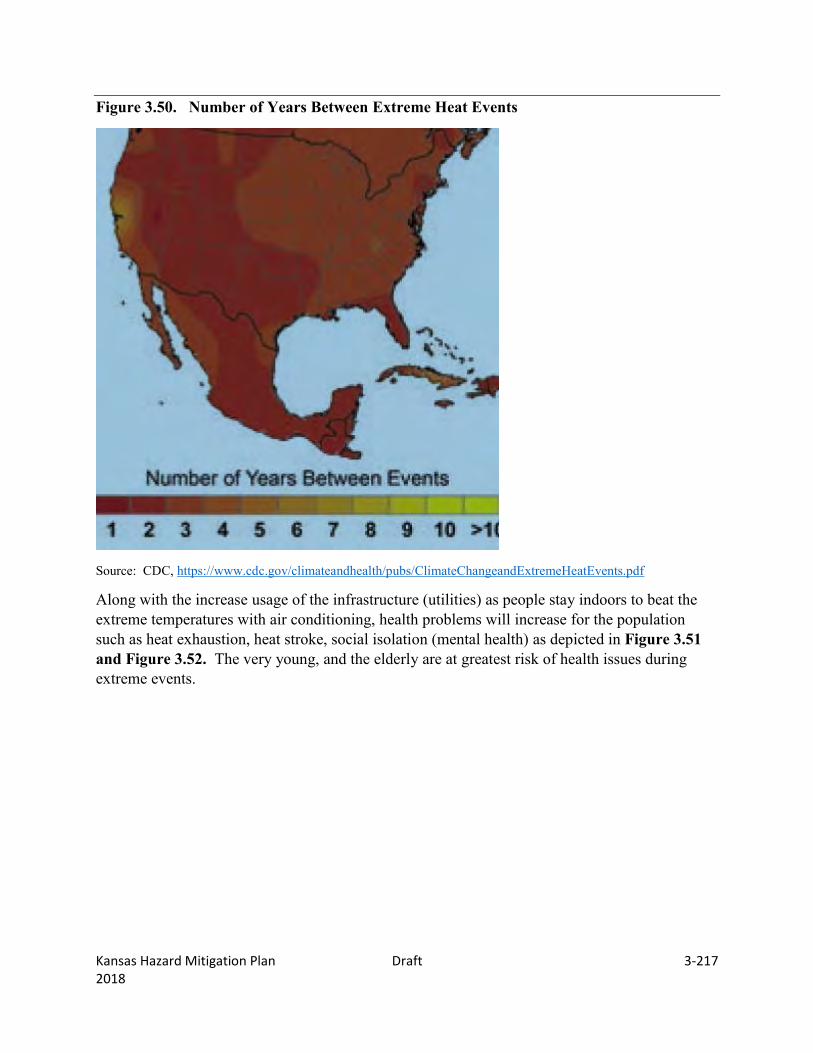
Kansas Hazard Mitigation Plan Draft 3-217 2018
Figure 3.50. Number of Years Between Extreme Heat Events
Source: CDC, https://www.cdc.gov/climateandhealth/pubs/ClimateChangeandExtremeHeatEvents.pdf
Along with the increase usage of the infrastructure (utilities) as people stay indoors to beat the extreme temperatures with air conditioning, health problems will increase for the population such as heat exhaustion, heat stroke, social isolation (mental health) as depicted in Figure 3.51 and Figure 3.52. The very young, and the elderly are at greatest risk of health issues during extreme events.
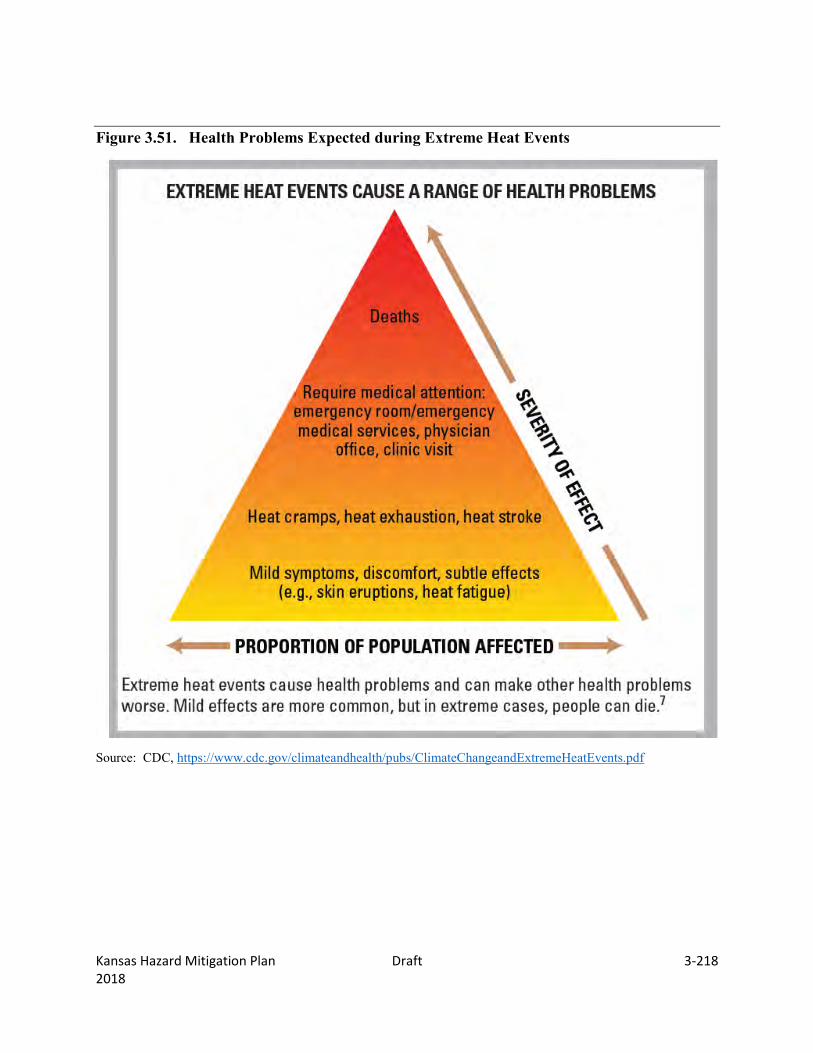
Kansas Hazard Mitigation Plan Draft 3-218 2018
Figure 3.51. Health Problems Expected during Extreme Heat Events
Source: CDC, https://www.cdc.gov/climateandhealth/pubs/ClimateChangeandExtremeHeatEvents.pdf

Kansas Hazard Mitigation Plan Draft 3-219 2018
Figure 3.52. Characteristics Increase Risk From Extreme Temperatures
Source: CDC, https://www.cdc.gov/climateandhealth/pubs/ClimateChangeandExtremeHeatEvents.pdf
When average temperatures increase, the longest extreme heat events (here, defined as the longest event occurring in a 20-year period) will become even longer than in the past (1961–1979). In the warmest scenario, most of the country would experience an increase in its longest extreme heat event of 10-20 days (CDC).
State Vulnerability Analysis
All Kansas communities are vulnerable to the impacts of extreme temperatures in rural and urban areas. Specific groups of the population such as people aged 65 and older, infants and children, people with chronic medical conditions, low income, outdoor workers and athletes are more at risk because of the heightened vulnerability of this segment of the population. Two specific

Kansas Hazard Mitigation Plan Draft 3-220 2018
segments have been looked at closely which are the people aged 65 and older and children under the age of 5 that may be more at risk. The greatest population of under age 5 resides in the counties of Johnson, Sedgwick and Wyandotte in Kansas.
There is greater elderly population risk in the urban counties of Johnson, Sedgwick and Shawnee, but overall the State of Kansas has a higher than average elderly population. Of particular concern is the overnight temperatures that are also rising in average. This makes it more difficult for the population to prepare for the extreme heat during the day.
This hazard can become more serious when combined with a utility/infrastructure failure or winter storm hazard. Sometimes this hazard contributes to the infrastructure failure, such as overloading of the power grid during hot summer months. Severe temperatures could impact the agriculture industry statewide.
State Estimates of Potential Losses
Kansas’s highest temperatures generally occur in June, July, August, and September each summer. Thus, the majority of direct and indirect exposure to excessive heat that has caused fatalities also occurs during these months.
Extreme cold often accompanies a winter storm or is left in its wake. Prolonged exposure to the cold can cause frostbite or hypothermia and become life-threatening. Infants and elderly people are most susceptible. Freezing temperatures can cause severe damage to crops and other critical vegetation. Pipes may freeze and burst in homes or businesses that are poorly insulated or without heat. Structure fires occur more frequently in the winter due to lack of proper safety precautions and present a greater danger because water supplies may freeze, and impede firefighting efforts. People die of hypothermia from prolonged exposure to the cold. Indigent and elderly people are most vulnerable to winter storms and account for the largest percentage of hypothermia victims largely due to improperly or unheated homes. The leading cause of death during winter storms is from automobile or other transportation accidents.
Kansas has experienced $123,321,866 annually in USDA Risk Management Agency’s insured crop losses as a result of heat and hot wind conditions and freeze and frost conditions during the six-year period of 2011-2016. Table 3.62 is a list of the total insured crop insurance paid and annualized insured crop insurance paid per county, showing the differences of how extreme temperature conditions affected Kansas counties. Please note that this data only applies to insured crops. According to the 2016 Kansas Crop Insurance Profile Report issued by the USDA Risk Management Agency 88 percent of Kansas’ row crops were insured in 2015.
Table 3.62. Total Insured Crop Insurance Paid per County from 2011 - 2016
County Total Insured Crop Insurance Paid for Extreme Temperature Damages
Annualized Insured Crop Insurance Paid for Extreme Temperature Damages
Mitigation Planning Region A Cheyenne $9,016,684 $1,502,780 Decatur $9,475,342 $1,579,223

Kansas Hazard Mitigation Plan Draft 3-221 2018
Gove $9,734,360 $1,622,393 Logan $3,660,578 $610,096 Rawlins $9,550,484 $1,591,747 Sheridan $24,887,073 $4,147,846 Sherman $20,818,574 $3,469,762 Thomas $17,983,895 $2,997,316 Wallace $8,282,527 $1,380,421 Subtotal $113,409,517 $18,901,586
Mitigation Planning Region B Ellis $2,300,687 $383,448 Graham $6,853,179 $1,142,197 Ness $2,732,791 $455,465 Norton $4,345,721 $724,287 Phillips $2,635,548 $439,258 Rooks $2,606,435 $434,406 Rush $3,331,851 $555,309 Russell $1,245,396 $207,566 Trego $4,545,963 $757,661 Subtotal $30,597,571 $5,099,595
Mitigation Planning Region C
Grant $26,913,675 $4,485,613 Greeley $6,482,173 $1,080,362 Hamilton $8,643,880 $1,440,647 Kearny $16,944,398 $2,824,066 Lane $5,232,686 $872,114 Morton $12,468,107 $2,078,078 Scott $16,315,435 $2,719,239 Stanton $25,872,363 $4,312,061 Stevens $30,895,209 $5,149,202 Wichita $23,860,084 $3,976,681 Subtotal $173,628,010 $28,938,002
Mitigation Planning Region D
Clark $2,699,810 $449,968 Finney $43,019,608 $7,169,935 Ford $21,583,553 $3,597,259 Gray $32,288,990 $5,381,498 Haskell $31,013,200 $5,168,867 Hodgeman $7,126,671 $1,187,779 Meade $12,116,558 $2,019,426 Seward $16,424,454 $2,737,409 Subtotal $166,272,844 $27,712,141
Mitigation Planning Region E
Barber $2,240,725 $373,454

Kansas Hazard Mitigation Plan Draft 3-222 2018
Barton $9,395,305 $1,565,884 Comanche $2,171,071 $361,845 Edwards $7,596,277 $1,266,046 Kiowa $5,020,907 $836,818 Pawnee $13,748,294 $2,291,382 Pratt $7,234,226 $1,205,704 Stafford $12,005,002 $2,000,834 Subtotal $59,411,807 $9,901,968
Mitigation Planning Region F Clay $1,517,004 $252,834 Cloud $2,258,179 $376,363 Dickinson $3,757,978 $626,330 Ellsworth $1,675,545 $279,258 Jewell $1,136,903 $189,484 Lincoln $3,642,270 $607,045 Mitchell $3,902,763 $650,461 Osborne $3,941,003 $656,834 Ottawa $2,806,592 $467,765 Republic $1,193,543 $198,924 Saline $3,607,716 $601,286 Smith $3,328,442 $554,740 Subtotal $32,767,938 $5,461,323
Mitigation Planning Region G
Butler $6,166,611 $1,027,769 Cowley $5,045,518 $840,920 Harper $3,601,880 $600,313 Harvey $8,209,240 $1,368,207 Kingman $2,902,941 $483,824 McPherson $10,100,517 $1,683,420 Marion $7,049,747 $1,174,958 Reno $9,826,562 $1,637,760 Rice $7,789,543 $1,298,257 Sedgwick $5,739,133 $956,522 Sumner $11,306,911 $1,884,485 Subtotal $77,738,603 $12,956,434
Mitigation Planning Region H
Allen $3,489,374 $581,562 Bourbon $917,216 $152,869 Chautauqua $127,387 $21,231 Cherokee $2,316,646 $386,108 Crawford $3,047,162 $507,860 Elk $492,402 $82,067 Greenwood $1,691,271 $281,879 Labette $3,603,405 $600,568

Kansas Hazard Mitigation Plan Draft 3-223 2018
Source: USDA Risk Management Agency
Montgomery $2,462,239 $410,373 Neosho $2,377,908 $396,318 Wilson $3,154,582 $525,764 Woodson $1,593,861 $265,644 Subtotal $25,273,453 $4,212,242
Mitigation Planning Region I
Chase $1,110,039 $185,007 Geary $471,258 $78,543 Lyon $7,540,656 $1,256,776 Morris $2,440,420 $406,737 Pottawatomie $797,099 $132,850 Riley $313,227 $52,205 Wabaunsee $1,326,536 $221,089 Subtotal $13,999,235 $2,333,206
Mitigation Planning Region J
Anderson $8,756,817 $1,459,470 Coffey $6,202,164 $1,033,694 Franklin $9,056,412 $1,509,402 Linn $1,443,803 $240,634 Miami $1,305,517 $217,586 Osage $4,438,645 $739,774 Shawnee $2,565,000 $427,500 Subtotal $33,768,358 $5,628,060
Mitigation Planning Region K
Atchison $429,357 $71,556 Brown $332,946 $55,491 Doniphan $76,933 $12,822 Douglas $3,522,548 $587,091 Jackson $579,610 $96,602 Jefferson $1,135,777 $189,296 Marshall $1,175,587 $195,931 Nemaha $788,953 $131,492 Washington $2,890,092 $481,682 Subtotal $10,931,803 $1,821,967
Mitigation Planning Region I
Johnson $1,420,802 $236,800 Leavenworth $630,826 $105,138 Wyandotte $80,428 $13,405 Subtotal $2,132,056 $355,343 Statewide Total $739,931,195 $123,321,866
Kansas Hazard Mitigation Plan Draft 3-224 2018
Development in Hazard Prone Areas
Extreme temperatures affect the entire state and this is expected to compound with climate change. In addition, as the population in the above 65 year old category increases, counties could experience significant issues due to this hazard. Structural development is not expected to be impacted to any great degree, but infrastructure could enhance the risk to this hazard.
Consequence Analysis
Extremes of heat and cold environmental conditions can be very detrimental to the health and comfort as human bodies attempt to maintain a state of homeothermy at a core temperature of about 98.6 degrees F. When exposed to extremes of heat and cold, human bodies have natural reactions to the extreme conditions.
Extreme heat is the number one weather-related killer in the U.S. resulting in hundreds of fatalities each year. In fact, on average, extreme heat claims more lives each year than floods, lightning, tornadoes and hurricanes combined.
The hazard of extreme heat is when the body heats too quickly to cool itself safely, or when too much fluid or salt is lost through dehydration or sweating, body temperature rises and heat-related illness may develop. Heat disorders share one common feature: the individual has been in the heat too long or exercised too much for his or her age and physical condition.
Studies indicate that, other things being equal, the severity of heat disorders tends to increase with age. Conditions that cause heat cramps in a 17-year-old may result in heat exhaustion in someone 40 years old and in heat stroke in a person over 60. The National Weather Service believes that extreme cold is a significant threat to persons living in this Midwest. Given its low frequency; humans, animals, etc., are not acclimated to extreme cold weather events. The average mortality on a winter's day is about 15 percent higher than on a summer's day. Cold weather is directly responsible for deaths through such things as hypothermia, influenza and pneumonia. It is also an indirect factor in a number of ways such as death and injury from falls, accidents, carbon monoxide poisoning and house fires all of which are partially attributable to cold. Table 3.63 shows the Consequence Analysis for Extreme Temperatures.
Table 3.63. EMAP consequence Analysis: Extreme Temperatures
Subject Ranking Impacts/Extreme Temperatures
Health and Safety of Persons in the Area of the Incident Minimal - Severe
Depending on the duration of the event, Impact in the incidence area is expected to be severe for unprepared and unprotected persons. Impact will be minimal to moderate for prepared and protected persons.
Responders Minimal to Severe
Impact could be severe if proper precautions are not taken, i.e. hydration in heat, clothing in extreme cold. With proper preparedness and protection the impact would be minimal.
Continuity of Operations Minimal Minimal expectation for utilization of the COOP. Property, Facilities, and Infrastructure Minimal to Sever
Impact to infrastructure could be minimal to severe depending on the temperature extremes.

Kansas Hazard Mitigation Plan Draft 3-225 2018
Delivery of Services Minimal Impact on the delivery of services should be non-existent to minimal.
Environment Severe
The impact to the environment could be severe. Extreme heat and extreme cold have the potential to seriously damage wildlife and plants, trees, crops, etc.
Economic Conditions Minimal to Severe
Impacts to the economy will be dependent on how extreme the temperatures get, but only in the sense of whether people will venture out to spend money. Utility bills could shoot up causing more financial hardship and could put a strain on infrastructure and crops (minimal to severe).
Public Confidence in Jurisdiction’s Governance
Minimal to Moderate
Confidence will be dependent on how well utilities hold up as they are stretched to provide heat and cool air, depending on the extreme. Planning and response could be challenged (minimal to severe).

Kansas Hazard Mitigation Plan Draft 3-226 2018
3.3.8. Flood Calculated Priority Risk Index Planning Significance
3.45 High
Description/Location
During the twentieth century, floods were the leading natural disaster in the United States, representing 40 percent of all natural disasters in terms of number of lives lost and property damaged. The U.S. Geological Survey reports that nationwide, floods kill an average of 140 people each year and cause $6 billion in property damage.
Kansas is vulnerable to both Flash Flooding and Riverine Flooding.
Flash Flooding
A flash flood is an event that occurs with little or no warning where water levels rise at an extremely fast rate. Flash flooding results from intense rainfall over a brief period, sometimes combined with rapid snowmelt, ice jam release, frozen ground, saturated soil or impermeable surfaces
Most flash flooding is caused by slow-moving thunderstorms or thunderstorms repeatedly moving over the same area. Flash flooding is an extremely dangerous form of flooding which can reach full peak in only a few minutes and allows little or no time for protective measures to be taken by those in its path. Flash flood waters move at very fast speeds and can move boulders, tear out trees, scour channels, destroy buildings, and obliterate bridges. Flash flooding often results in higher loss of life, both human and animal, than slower developing river and stream flooding.
In some cases, flooding may not be directly attributable to a river, stream, or lake overflowing its banks. Rather, it may simply be the combination of excessive rainfall or snowmelt, saturated ground, and inadequate drainage. With no place to go, the water will find the lowest elevations–areas that are often not in a floodplain. This type of flooding, often referred to as sheet flooding, is becoming increasingly prevalent as development outstrips the ability of the drainage infrastructure to properly carry and disperse the water flow.
In certain areas, aging storm sewer systems are not designed to carry the capacity currently needed to handle the increased storm runoff. Typically, the result is water backing into basements, which damages mechanical systems and can create serious public health and safety concerns. This combined with rainfall trends and rainfall extremes all demonstrate the high probability, yet generally unpredictable nature of flash flooding in the planning area.
Although flash floods are somewhat unpredictable, there are factors that can point to the likelihood of flash floods occurring. Weather surveillance radar is being used to improve monitoring capabilities of intense rainfall. This, along with knowledge of the watershed characteristics, modeling techniques, monitoring, and advanced warning systems increases the

Kansas Hazard Mitigation Plan Draft 3-227 2018
warning time for flash floods. Figure 3.52a shows the watershed basins in Kansas in conjunction with the Risk MAP projects.